me.a compass 2016 | your pocket guide to asia-pac
TRANSCRIPT

ME.A Compass 2016
Understand. Expand. Grow Asia.
fully updated
Asia-Paci�c in Your Pocket
3rd edition

© ME.APage 2
ME.A Compass 2016
Notice
This is an excerpt only from our ME.A Compass 2016.
You can order your personal electronic copy here:
www.me-a.com/compass

© ME.APage 3
ME.A Compass 2016
ForewordZurich / Kuala Lumpur, January 2016
Dear Reader
Welcome to the third edition of our ME.A Compass. We have updatedmore than 2’500 indicators for the 19 countries in Asia-Pac covered withthe latest available data for you.2015 has been a stormy year for the region. The Renminbi devaluationfollowed by the meltdown of the Shanghai stock exchange in August sentshock waves around the globe. Chinese turmoil exacerbated thedownward pressure on Asian currencies some of which plummeted morethan 20 per cent against the US dollar.Yet, despite all negative headlines the region remains a global economicpowerhouse. On average the 19 countries are expected to grow 4.9 percent 2016-2020 per year compared to 3.8 per cent projected for the worldeconomy.With our ME.A Compass 2016 we encourage you to chart this fascinatingand challenging territory. Use this comprehensive compendium, discoverAsia and make it the pocket reference of choice for your commercialendeavours in the region.Warm regardsDr. Christoph WalserFounding Director
© ME.A

© ME.APage 4
ME.A Compass 2016
The bottom line – key insights
© ME.A
Asia’s near-term growth outlook has been marked down slightly but it continues to outperform other world regions.
Growth in Asia-Pac will be spurred by regional integration (ASEAN Economic Community) and a burgeoning middle class.
Southeast Asia together with India are the engines of growth creating attractive opportunities for SMEs to tap into.
Yet, significant downside risks to a certain extent qualify the overall positive outlook. Increased volatility calls for robust risk management in place.
Asian markets are not homogeneous and each requires a differentiated entry strategy.

© ME.APage 5
ME.A Compass 2016
§ ME.A is a market expansion services firm offering client advice and support to smalland medium-sized enterprises on markets and market entries in Asia.
§ We give our customers access to Asian market insights, showing them in-roads intonew geographies and help them grow their business in Asia successfully.
§ With our offices in Switzerland and in Malaysia we speak your language and aredeeply rooted in Asia able to leverage our expertise to your best advantage.
© ME.A

© ME.APage 6
ME.A Compass 2016
Country Profiles

© ME.APage 7
ME.A Compass 2016
ME.A Compass covers 19 countries across Asia-Pacific
Note: Cut-off date for all data is 01.12.2015. No updates considered after this date.
AustraliaCambodiaChinaHong KongIndiaIndonesiaJapanLaosMacauMalaysiaMyanmarNew ZealandPhilippinesSingaporeSouth KoreaSri LankaTaiwanThailandVietnam
Afghanistan
United Arab Emirates
Australia
Bangladesh
Bahrain
Brunei
Bhutan
China
Coral Sea Is.
Fiji
Micronesia
Guam
Hong Kong
Indonesia
India
Indian Ocean Ter.
Br. Indian Ocean Ter.
Iran
Japan
Baikonur
Siachen Glacier
Kazakhstan
Kyrgyzstan
Cambodia
Korea
Laos
Sri Lanka
Macau
Maldives
Marshall Is.
Myanmar
Mongolia
N. Mariana Is.
Mauritius
Malaysia
New Caledonia
Norfolk Island
Nepal
Nauru
New Zealand
Oman
Pakistan
Spratly Is.
Philippines
Palau
Papua New Guinea
Dem. Rep. Korea
Qatar
Scarborough Reef
Singapore
Solomon Is.
Seychelles
Thailand
TajikistanTurkmenistan
Timor-LesteTuvalu
Taiw
an
Uzbekistan
Vietnam
Vanuatu
ⓒ ME.A

© ME.APage 8
ME.A Compass 2016
10.4 11.212.8
14.115.4
16.6
2009 2010 2011 2012 2013 2014
Cambodia
Population (2015): 15.7mnPop. Growth1: 1.7%
Currency: RielCurrency Code: KHR
Key cities:§ Phnom Penh (1.2mn)§ Siem Reap (0.2mn)§ Battambang (0.1mn)
Languages: Khmer, French, English
KHMGDP (USD bn)2
Real GDP CAGR 2009-2014: 7.0%Real GDP CAGR 2016-2020: 7.2%
Income
§ Per capita GDP (2014): USD 1'067
§ Per capita GDP PPP (2014)3: ID 3'267
§ Big Mac Index (2015): n.a.
Taxes & interest
§ Indirect tax (2015): 10.0%
§ Corporate tax (2015): 20.0%
§ Personal income tax (2015): 20.0%
§ Interest rate (07.2015): 1.42%
Structure of the economy(2013, % of GDP)
ExpenditureHousehol d consumption 79.0General gover nment consumption 5.9Gross capital formation 18.8Expor t of goods and services 61.2Import of goods and services 65.5Roundi ng error 0.5
OutputAgricultur e, hunting, for estry , fishi ng 33.5Industry 25.6Services 40.8
Inflation, unemployment & labour productivity
Year 2010 2011 2012 2013 2014
§ Inflation4 (%) 3.1 4.9 2.5 4.7 1.0
§ Unemployment (%) 0.4 0.2 0.2 0.3 n.a.
§ Labour productivity (2014)5: USD 3'419, AV: USD 26'416 , Max: USD 82'010 SGP,
Min: USD 3'419 KHM6
Currency performance (USD against KHR, base 01.01.2010 = 100)
90
95
100
105
110
01.10 07.10 01.11 07.11 01.12 07.12 01.13 07.13 01.14 07.14 01.15 07.15
USD/KHR (30.11.2015): 3'971.33
Labour force by sector
33%
26%
41%
Agriculture
Industry
Services
Ratings
Economic Freedom (2015)
2012
Minimumfreedom
Maximumfreedom
0 10058
Country risk (2015)7
Maximumrisk
Minimumrisk
0 10041
Corruption Perception Index (2015)
Highlycorrupt
Veryclean
0 10021
B2
Moody's (2015)
Sources: US Census Bureau, citypopulation.de, IMF World Economic Outlook, The Economist, The Conference Board, KPMG, Central Banks, Heritage Foundation, Economist Intelligence Unit, Transparency International, Moody's, Trading Economics, World Bank Databank
Notes: 1. CAGR 2009-2015; 2. GDP at current prices and current exchange rates, growth rates refer to annual percentage change of constant price GDP (source: IMF WEO 10.2015); 3. GDP per capita based on purchasing power parity (PPP). PPP GDP is gross domestic product converted to international dollars using purchasing power parity rates. An international dollar has the same purchasing power over GDP as the U.S. dollar has in the United States. 4. Based on Consumer Price Inflation (CPI); 5. GDP per person employed in 2013 USD at 2005 PPP; 6. Average across all 19 countries reported; 7. EIU country risk indicator adapted
fast
Outlook
ⓒ ME.A

© ME.APage 9
ME.A Compass 2016
§ Fixed broad band subscriptions10: 0.2%
§ Internet users: 9.0%
§ Mobile telephone subscriptions: 155.1%1.0 0.5 0.0 0.5 1.0
0-4
15-19
30-34
45-49
60-64
75-79
>90
Cambodia
Sources: IFC, World Economic Forum, US Census Bureau, Population Reference Bureau, CIA World Factbook, World Bank, World Bank Global Findex, ITU
Notes: 1. Based on global sample of 189 economies benchmarked; 2. Average rank of all countries covered in this report; 3. Quintiles based on rankings of countries covered in this report; 4. Number of infants dying out of 1'000 new borns; 5. Life expectancy at birth in years; 6. Logistics Performance Index (LPI) provides qualitative evaluations of 160 countries globally; 7. Account at a formal financial institution % age 15+; 8. Credit cards % age 15+; 9. Number of ATMs per 100k adults; 10. Fixed (wired) broad band subscriptions
Ease of doing business (2016)
Overall ranking
2016: 127
2015: 133
01234567
Institutions
Infrastructure
Macroeconomic environment
Health and primary education
Higher education and training
Goods market efficiency
Labor market efficiency
Financial market development
Technological readiness
Market size
Business sophistication
Innovation
KHM Average
Global competitiveness (2015-6)
Overall ranking
Asia-Pac position3 Asia-Pac position3
Socio-demographics
Age pyramid (2015)
Logistics
2014: 83
2012: 101
LPI ranking6
LPI score (2014)
Financial inclusion (2011)
§ Account at a formal financial institution7: 3.7%
§ Credit card8: 0.1%
§ Automated teller machines (ATMs)9: 5.1
Communication access (2014)
Topquintile
Bottomquintile
Topquintile
Bottomquintile
Millions
ⓒ ME.A
1Poor
2.7 5Excellent
Topic Rank1 Average2
1. Starting a business 180 89
2. Dealing with construction permits 181 62
3. Getting electricity 145 55
4. Registering property 121 72
5. Getting credit 15 57
6. Protecting investors 111 67
7. Paying taxes 95 87
8. Trading across borders 98 81
9. Enforcing contracts 174 78
10. Resolving insolvency 82 65
2015-6: 90
2014-5: 95
Social development
§ Urbanization (2015): 21%
§ Infant mortality4 (2015): 50.0
§ Life expectancy5 (2015): 64.1
§ Literacy rate (2014): 74%

© ME.APage 10
ME.A Compass 2016
Country ComparisonCountry Comparison

© ME.APage 11
ME.A Compass 2016
Per Capita Income
Country GDP per capita at PPP, 20141
Cambodia 3'276
Myanmar 4'752
Laos 5'006
Vietnam 5'656
India 5'808
Philippines 6'974
Sri Lanka 10'410
Indonesia 10'651
China 13'224
Thailand 15'579
Malaysia 25'145
New Zealand 35'305
South Korea 35'379
Japan 37'519
Taiwan 46'036
Australia 46'550
Hong Kong 55'097
Singapore 83'066
Macau 139'767
Significant disparities across the region with highest earnings in city states and Australia
1. Gross domestic product at purchasing power parity per capita in International Dollars (ID). Source: IMF WEO
3'276 4'752 5'006 5'656 5'808 6'97410'410 10'651 13'224 15'579
25'145
35'305 35'379 37'519
46'036 46'550
55'097
83'066
139'767
KHM MMR LAO VNM IND PHL LKA IDN CHN THA MYS NZL KOR JPN TWN AUS HKG SGP MAC
x 4.8
x 9
Average: ID 30'800Median: ID 15'579
Per capita income (ID)
ⓒ ME.A
© ME.APage 12
ME.A Compass 2016
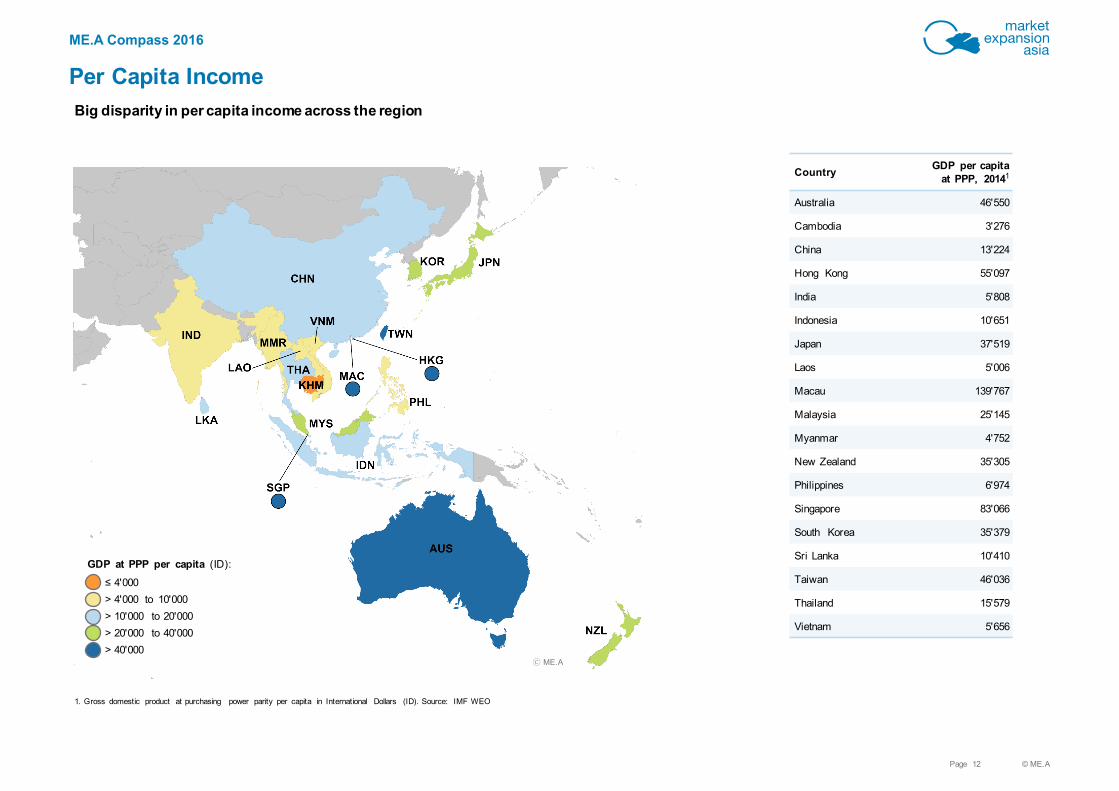
Per Capita Income
Country GDP per capita at PPP, 20141
Australia 46'550
Cambodia 3'276
China 13'224
Hong Kong 55'097
India 5'808
Indonesia 10'651
Japan 37'519
Laos 5'006
Macau 139'767
Malaysia 25'145
Myanmar 4'752
New Zealand 35'305
Philippines 6'974
Singapore 83'066
South Korea 35'379
Sri Lanka 10'410
Taiwan 46'036
Thailand 15'579
Vietnam 5'656
Big disparity in per capita income across the region
1. Gross domestic product at purchasing power parity per capita in International Dollars (ID). Source: IMF WEO
≤ 4'000> 4'000 to 10'000> 10'000 to 20'000
GDP at PPP per capita (ID):
> 20'000 to 40'000> 40'000
ⓒ ME.A
© ME.APage 13
ME.A Compass 2016
Disclaimer
This document has been prepared in good faith on the basis of information available at the date of publicationwithout any independent verification. ME.A Market Expansion Asia Ltd. (ME.A) does not guarantee or warrantthe accuracy, reliability, completeness or currency of the information in this publication nor its usefulness inachieving any purpose. Readers are responsible for assessing the relevance and accuracy of the content of thispublication. ME.A will not be liable for any loss, damage, cost or expense incurred or arising by reason of anyperson using or relying on information in this publication.

© ME.APage 14
ME.A Compass 2016
Terms of Use
This document and all information contained in it are for your personal use on an "as is, as available" basis andmay be used by you for informational purposes only. ME.A Market Expansion Asia Ltd. makes no commitment toupdate the information contained herein.
You may redistribute this document freely on a strictly non-commercial basis only, without altering or removingany trademark, copyright, or other notice from such material.
Reproducing and republishing any material contained in this document on a strictly non-commercial basis onlyyou must make due reference to ME.A Market Expansion Asia Ltd. and ME.A Compass respectively ("Source:ME.A Compass, ME.A Market Expansion Asia Ltd.").

© ME.APage 15
ME.A Compass 2016
Imprint
ME.A Market Expansion Asia Ltd. is incorporated under the laws of Switzerland with principal office in Zurich.The company is registered under CHE-389.270.749 in the Commercial Register of the Canton of Zurich.
Managing Director: Dr. Christoph Walser
ME.A Market Expansion Asia Ltd.Muehlebachstrasse 28008 ZurichSwitzerland
P +41-41-588 08 88F +41-41-588 08 89E [email protected]
The value added tax identification number of ME.A Market Expansion Asia Ltd., Zurich is CHE-389.270.749MWST.
Published by ME.A Market Expansion Asia Ltd., Zurich, Switzerland
© ME.A Market Expansion Asia Ltd., Zurich. All rights reserved.

© ME.APage 16
ME.A Compass 2016
ME.A CompassJanuary 2016Copyright © ME.A Market Expansion Asia Ltd.
Order your personal copy here: www.me-a.com/compass