article a mathematical model for simulating canal flows at
TRANSCRIPT
Article
A Mathematical Model for Simulating Canal Flows at Ubombo Sugar Sandile T. Msibi 1*, Busani Khoza 2 and Sandile C. Simelane 2
1 School of Civil Engineering & Surveying, University of Southern Queensland, Toowoomba, QLD 4350, AU 2 Ubombo Sugar Limited, L31, Big Bend, SD * Correspondence: [email protected]; Tel.: +61-487-056-126
Abstract: An empirical model is presented for estimating discharge on the Ubombo Sugar Limited (USL) main gravity canal to enhance bulk water management and water use efficiency. It uses stage readings obtained from measuring flumes A, B, C, and UPS to simulate discharge. The rationale for the development of the mathematical flow simulation model is the significance of the UPS flume as it measures readings that influence the daily operations of the farm, and the experiences with the ultrasonic flow meter installed in the flume. The model also provides a first for the simulation of accurate flow rates for flumes A, B, and C. A spreadsheet program that enables express prediction of canal flow rates was developed to influence timely implementation of these water management decisions. Calibrations demonstrated that the model is capable of predicting discharge at high accuracy (p>95%), and can be reliably used as a decision support tool for bulk water management. It can also be expanded to include other water measuring structures along Canal 1 and Canal 2, as well as the development of a stand-alone water management application for desktop and mobile computers.
Keywords: water; simulation; model; discharge; USL
1. Introduction
Flow measurement is a very important practice in irrigated agriculture. It allows for appropriate and equitable distribution of water among users to enable efficient field application to meet crop demand. Information concerning the volume of available water is also key in planning for its future use. Consequently, increasing the utilisation and value of water makes the understanding of water measurement important and necessary. The most universally accepted and fundamentally sound equation for estimating discharge in open channels such as canals is the Manning’s equation, which is based on the application of the full hydrodynamic principles of the equation of continuity. Equations governing the flow from discharge measurement structures such as weirs and flumes are also applied. However, in recent years, models which employ these fundamental principles have been developed for studying canal hydraulics to improve agricultural water management. These include models for automatic regulation of irrigation systems in real time to increase water use efficiency. For instance, a flow simulation model which provided new opportunities for understanding canal operations for manually operated irrigation systems was developed in Sri Lanka [1]. Gillies and Smith [2] also developed and validated a surface irrigation simulation model (SISCO) for predicting the impact of flow rate and infiltration variability in furrow irrigation performance. Advances in technology have also introduced the use of sophisticated and more reliable flow measurement techniques, which are also applicable to open channels. These include ultrasonic devices and auxiliary equipment mounted on the discharge measurement structures for real time flow measurement and control.
At USL, a 12, 000 ha sugarcane growing and manufacturing enterprise, water is supplied through a 39 km main gravity earth canal system which takes off from the Great Usutu River. Inflow is measured daily at UPS flume which is equipped with an ultrasonic MyCity flow meter to give a numerical representation of incoming flow on a continuous basis. The flume is self-cleansing and
Preprints (www.preprints.org) | NOT PEER-REVIEWED | Posted: 12 June 2017 doi:10.20944/preprints201706.0053.v1
© 2017 by the author(s). Distributed under a Creative Commons CC BY license.
2 of 7
rectangular in geometry, with level sensors mounted on one side of its structure to measure discharge. Flow readings are logged and transmitted via a GSM/GPRS network into an office computer. The flume is also equipped with a flow calibrated gauge for stage measurement. Information obtained from this meter is crucial in determining the volumes of water supplied to the factory, domestic potable water treatment plants, irrigation, and storage. However, unprecedented circumstances such as power outage, device pack-up, and servicing to some extent, makes it impossible to take these important readings. While manual measurement techniques are an option, it is always difficult to obtain accurate readings due to measurement errors such as single point velocity, and the time required to complete a sensible set of measurements that can estimate discharge more accurately. As a result, this affects the management of the water resource and farm operating decisions to the extent of water wastage, spillage, and/or inadequate supplies, which can have long term impacts on sugarcane yields. The aim of this work is to develop a simple mathematical model for simulating discharge using stage readings for USL main gravity canal to enable precise and timely implementation of water management decisions. This model will serve as a decision support tool for improving water use efficiency in the farm.
2. Physical Context of the USL Main Canal
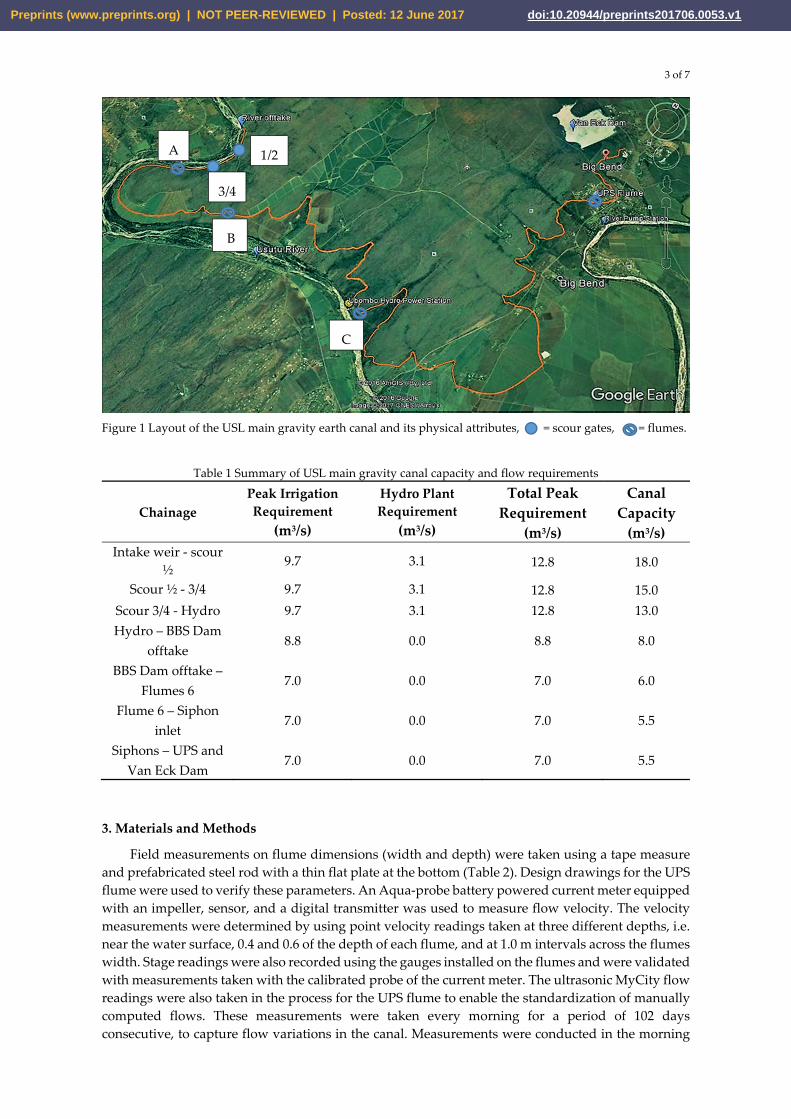
The gravity main canal is a multi-user system with its operation and management undertaken by Big Bend Canal Services, which is a consortium representing the three water users, i.e. Crookes Limited (including Bar J), Hladeni, and USL [3]. The latter is the furthest downstream and the largest user. The canal also conveys water for the USL hydro power generation plant, which produces about 1.2 Megawatts of electricity. Flow measurement is achieved by means of flume structures (Flumes A, B, C, and UPS), which are strategically and respectively positioned to regulate flows along the water users. It then branches into two primary canals (Canal 1 and Canal 2) which tactically command the different farm areas. Two major Dams, Van Eck (10.4 x 10⁶ m3) and Sivunga (6.9 x 10⁶ m3), together with a number of night storages are used to balance water supply. Table 1 summarizes discharge capacities along the different canal sections in line with demand. The river intake weir has a maximum design capacity of 18 m3/s if river flow is not limiting. This capacity is up to scour gates 1 and 2 after which the canal reduces to 15 m3/s up to scour gates 3 and 4. The difference in flow capacity between the intake weir and the scour gates is the flow meant for scouring the canal under normal operating conditions. This scouring flow goes back to the river. From scour gates 3 and 4 up to the hydro, the canal capacity declines to 13 m3/s. After the hydro, the canal reduces to a further 8 m3/s all the way to Big Bend section dam offtake, after which it then reduces to 6 m3/s up to Flume 6. From flume 6, the canal capacity reduces to 5.5 m3/s up to the main siphons just before UPS. During periods of low river flow, the abstraction rate at the intake is reduced below design capacity to maintain flow for other downstream users. In addition, a minimum environmental flow of 1.7 m3/s is always maintained downstream as measured at the river gauging station (GS16) downstream of Portzight farms. Additional flow into the canal is lifted through River Pump Station with two bulk water pumps delivering a combined discharge of 0.8 m3/s immediately downstream of the UPS flume as illustrated in figure 1.
Preprints (www.preprints.org) | NOT PEER-REVIEWED | Posted: 12 June 2017 doi:10.20944/preprints201706.0053.v1
3 of 7
Figure 1 Layout of the USL main gravity earth canal and its physical attributes, = scour gates, = flumes.
Table 1 Summary of USL main gravity canal capacity and flow requirements
Chainage Peak Irrigation Requirement
(m3/s)
Hydro Plant Requirement
(m3/s)
Total Peak Requirement
(m3/s)
Canal Capacity
(m3/s)Intake weir - scour
½ 9.7 3.1 12.8 18.0
Scour ½ - 3/4 9.7 3.1 12.8 15.0 Scour 3/4 - Hydro 9.7 3.1 12.8 13.0 Hydro – BBS Dam
offtake 8.8 0.0 8.8 8.0
BBS Dam offtake – Flumes 6
7.0 0.0 7.0 6.0
Flume 6 – Siphon inlet
7.0 0.0 7.0 5.5
Siphons – UPS and Van Eck Dam
7.0 0.0 7.0 5.5
3. Materials and Methods
Field measurements on flume dimensions (width and depth) were taken using a tape measure and prefabricated steel rod with a thin flat plate at the bottom (Table 2). Design drawings for the UPS flume were used to verify these parameters. An Aqua-probe battery powered current meter equipped with an impeller, sensor, and a digital transmitter was used to measure flow velocity. The velocity measurements were determined by using point velocity readings taken at three different depths, i.e. near the water surface, 0.4 and 0.6 of the depth of each flume, and at 1.0 m intervals across the flumes width. Stage readings were also recorded using the gauges installed on the flumes and were validated with measurements taken with the calibrated probe of the current meter. The ultrasonic MyCity flow readings were also taken in the process for the UPS flume to enable the standardization of manually computed flows. These measurements were taken every morning for a period of 102 days consecutive, to capture flow variations in the canal. Measurements were conducted in the morning
1/2
3/4
A
B
C
Preprints (www.preprints.org) | NOT PEER-REVIEWED | Posted: 12 June 2017 doi:10.20944/preprints201706.0053.v1
4 of 7
and every afternoon for the UPS flume to generate a large set of readings. This enabled taking flow readings between near zero flow and when the canal was flowing at full capacity.
Table 2 Flume dimensions along USL main gravity canal.
Measuring Flume Width (m) Maximum Depth (m)
Flume A 11.41 1.62
Flume B 10.98 1.30
Flume C 5.89 1.25
UPS 6.96 1.20
4. Results and Model Development
The daily water data, which included point velocity readings measured at the respective depths, and stage (flow depth), was analyzed by calculating average velocity, and using the continuity equation (Equation 1) for each flume cross-sectional area, since discharge is based on the concept that volumetric flow rate is a product of flow velocity and cross-sectional area [4]. It is known that flumes increase flow velocity and thereby changing the flow from subcritical to supercritical conditions, due to acceleration induced by changes in flow depth or converging side walls along the flume structure. However, the flow conditions in these flumes warranted the application of the continuity equation since the flumes had continuous rectangular geometric shapes and uniform slopes (constant depths), with no obstructions along the bed such as sharp-edged structures which could necessitate the use of weir equations. The manual computations were correlated with the ultrasonic meter readings for the UPS flume. These discharge readings were then plotted on graphs representing stage versus discharge and were fitted on a logarithmic model with a coefficient of determination (CV) greater than 97%. The logarithmic models are presented in Equations 2, 3, 4, and 5 respectively.
VAQ = (1)
where, Q = discharge (m3/s), V = average flow velocity (m/s), and A = cross-sectional area (m2).
217.0)ln(602.0 −= xYA (2)
381.0)ln(585.0 −= xYB (3)
204.0)ln(42.0 += xYC (4)
23.0)ln(519.0 += xYUPS (5)
Empirical equations were then derived by integration using the above logarithmic models for
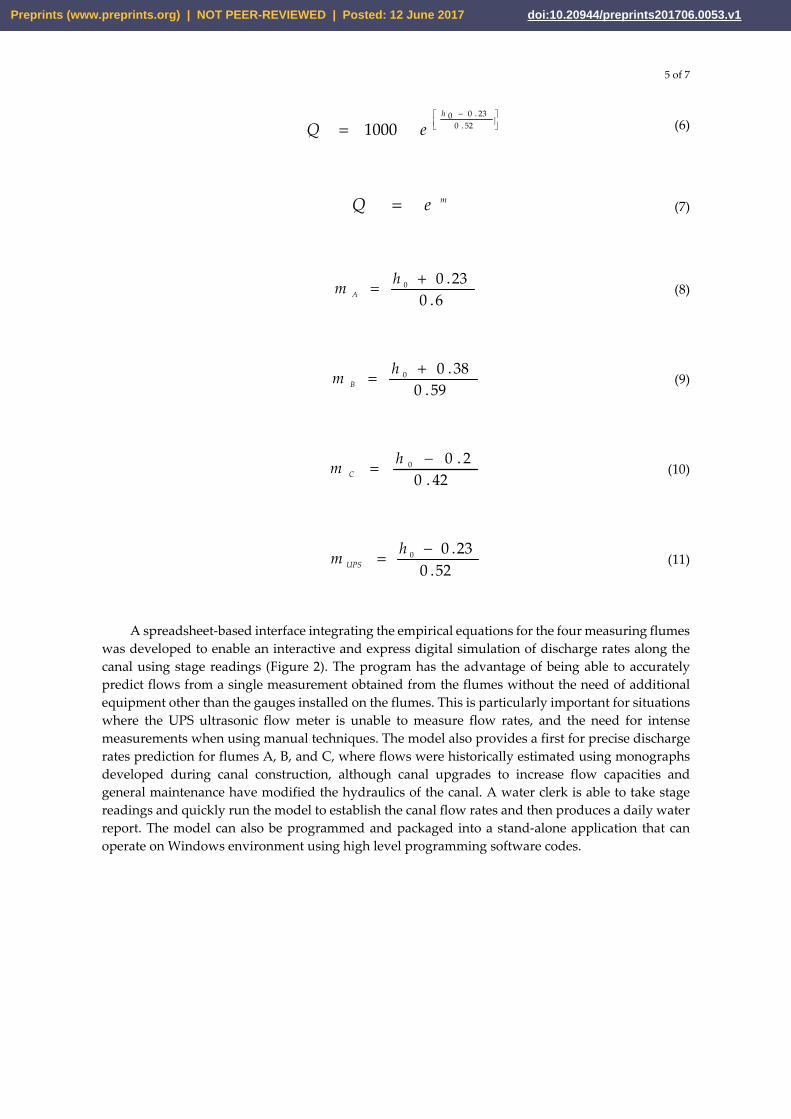
each flume. Equation 6 illustrates an empirically derived model for predicting discharge using stage at the UPS flume, where, Q = canal flow rate in litres per second (l/s), e = constant equal to 2.718281828, and h0 = stage in metres (m). For discharge rates in metric units (m3/s), equation 7 is proposed, where m represent the exponent for each measuring flume. Expressions for specific exponent values corresponding to flumes A, B, C, and UPS are derived as shown in Equations 8, 9, 10, and 11 and are denoted by mA, mB, and mC, mUPS.
Preprints (www.preprints.org) | NOT PEER-REVIEWED | Posted: 12 June 2017 doi:10.20944/preprints201706.0053.v1
5 of 7
−
= 52.023.00
1000h
eQ (6)
meQ = (7)
6.023.00 += hm A (8)
59.038.00 += hm B (9)
42.02.00 −= hm C (10)
52.023.00 −= hm UPS (11)
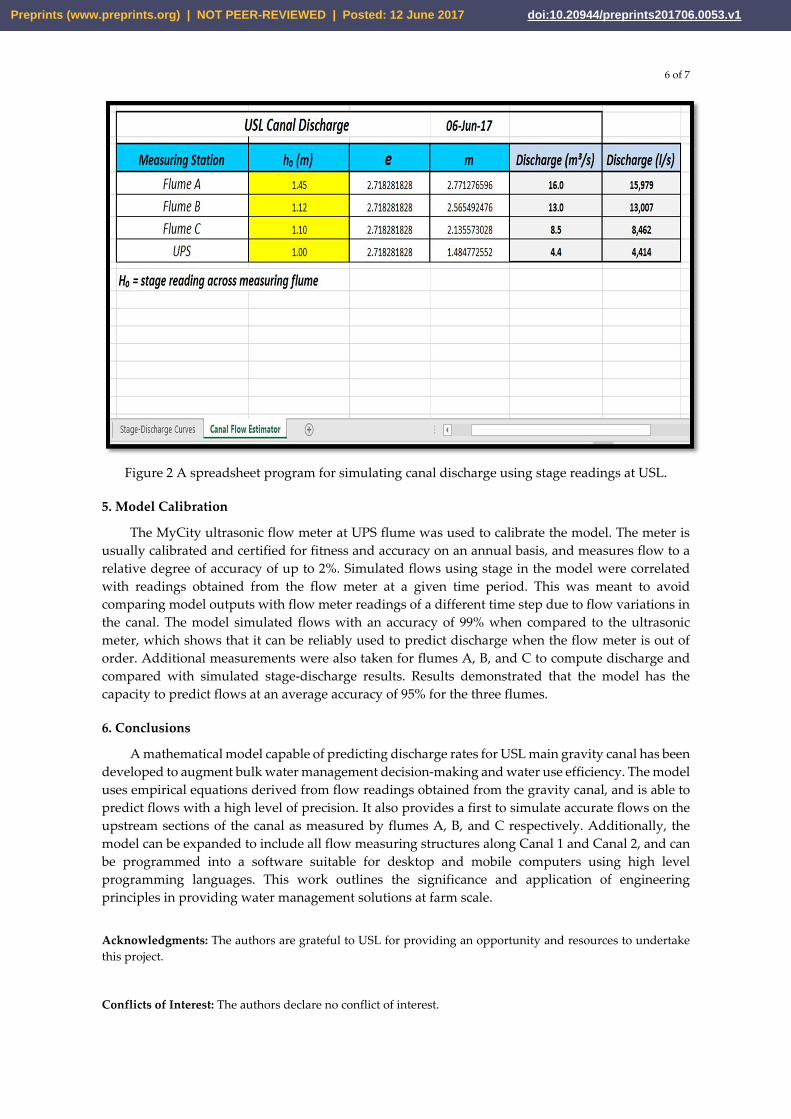
A spreadsheet-based interface integrating the empirical equations for the four measuring flumes was developed to enable an interactive and express digital simulation of discharge rates along the canal using stage readings (Figure 2). The program has the advantage of being able to accurately predict flows from a single measurement obtained from the flumes without the need of additional equipment other than the gauges installed on the flumes. This is particularly important for situations where the UPS ultrasonic flow meter is unable to measure flow rates, and the need for intense measurements when using manual techniques. The model also provides a first for precise discharge rates prediction for flumes A, B, and C, where flows were historically estimated using monographs developed during canal construction, although canal upgrades to increase flow capacities and general maintenance have modified the hydraulics of the canal. A water clerk is able to take stage readings and quickly run the model to establish the canal flow rates and then produces a daily water report. The model can also be programmed and packaged into a stand-alone application that can operate on Windows environment using high level programming software codes.
Preprints (www.preprints.org) | NOT PEER-REVIEWED | Posted: 12 June 2017 doi:10.20944/preprints201706.0053.v1
6 of 7
Figure 2 A spreadsheet program for simulating canal discharge using stage readings at USL.
5. Model Calibration
The MyCity ultrasonic flow meter at UPS flume was used to calibrate the model. The meter is usually calibrated and certified for fitness and accuracy on an annual basis, and measures flow to a relative degree of accuracy of up to 2%. Simulated flows using stage in the model were correlated with readings obtained from the flow meter at a given time period. This was meant to avoid comparing model outputs with flow meter readings of a different time step due to flow variations in the canal. The model simulated flows with an accuracy of 99% when compared to the ultrasonic meter, which shows that it can be reliably used to predict discharge when the flow meter is out of order. Additional measurements were also taken for flumes A, B, and C to compute discharge and compared with simulated stage-discharge results. Results demonstrated that the model has the capacity to predict flows at an average accuracy of 95% for the three flumes.
6. Conclusions
A mathematical model capable of predicting discharge rates for USL main gravity canal has been developed to augment bulk water management decision-making and water use efficiency. The model uses empirical equations derived from flow readings obtained from the gravity canal, and is able to predict flows with a high level of precision. It also provides a first to simulate accurate flows on the upstream sections of the canal as measured by flumes A, B, and C respectively. Additionally, the model can be expanded to include all flow measuring structures along Canal 1 and Canal 2, and can be programmed into a software suitable for desktop and mobile computers using high level programming languages. This work outlines the significance and application of engineering principles in providing water management solutions at farm scale.
Acknowledgments: The authors are grateful to USL for providing an opportunity and resources to undertake this project.
Conflicts of Interest: The authors declare no conflict of interest.
Preprints (www.preprints.org) | NOT PEER-REVIEWED | Posted: 12 June 2017 doi:10.20944/preprints201706.0053.v1

7 of 7
References
1. Sally, H.; Rey, J.; Application of mathematical models for simulation of canal operations at Kirindi Oya, Sri Lanka: preliminary results, Advancements in IIMI's Research 1989-91: A Selection of Papers Presented at Internal Program Reviews, 1992, p. 177.
2. Gillies, M.; Smith, R.; 2015, SISCO: surface irrigation simulation, calibration and optimisation, Irrigation Science, 2015, vol. 33, no. 5, pp. 339-55.
3. Msibi, S.; Kihupi, N.; Tarimo, A.; An appraisal of water and power budgeting systems for sustainable irrigation at Ubombo, Research Journal of Engineering Sciences ISSN, 2014, vol. 2278, p. 9472.
4. Waller, P.; Yitayew, M.; Irrigation and drainage engineering, Springer, 2015.
Preprints (www.preprints.org) | NOT PEER-REVIEWED | Posted: 12 June 2017 doi:10.20944/preprints201706.0053.v1