flows due to a structure failure on the canal · pdf fileflows due to a structure failure on...
TRANSCRIPT
FLOWS DUE TO A STRUCTURE FAILURE ON THE CANAL DU CENTRE
le Grelle N.1, Bertrand G.2, Soares Frazão S.1,3, Hiver J.M.2 and Zech Y.1 1 Civil and Environmental Engineering Dept., Université catholique de Louvain
Bâtiment Vinci, Place du Levant, 1, B-1348 Louvain-la-Neuve, Belgium Tel : +32 (0)10 47 21 24 / Fax : +32 (0)10 47 21 79
E-mail : [email protected] 2 Ministère wallon de l'Equipement et des Transports.
3 Fond National de la Recherche Scientifique.
Abstract: In many countries, hydraulic works become larger and larger. The volume of water in canals is also increasing and some of their reaches are built above the ground level. The breaking of a work along these reaches can endanger people living downstream. Predictions of such a flow are essential to avoid human and material damages. Such a study has been carried out for the Walloon Ministry of Equipment and Transport (Belgium) for the new reach of the canal du Centre in Belgium. Two major works were built on this reach: the new ship lift of Strepy (73.15 m high) and a 500-m long canal-bridge at Houdeng. A safety gate was also built in this reach to limit the volume of water lost in case of breaking. The first part of this paper explains the study of the flows upstream of the collapse point, including the flow at the safety gate. The second part presents the study downstream, including the elaboration of a digital terrain modelling. A GIS system is used both to build the DTM and to represent the results. Keywords: Safety, flood, breaking.
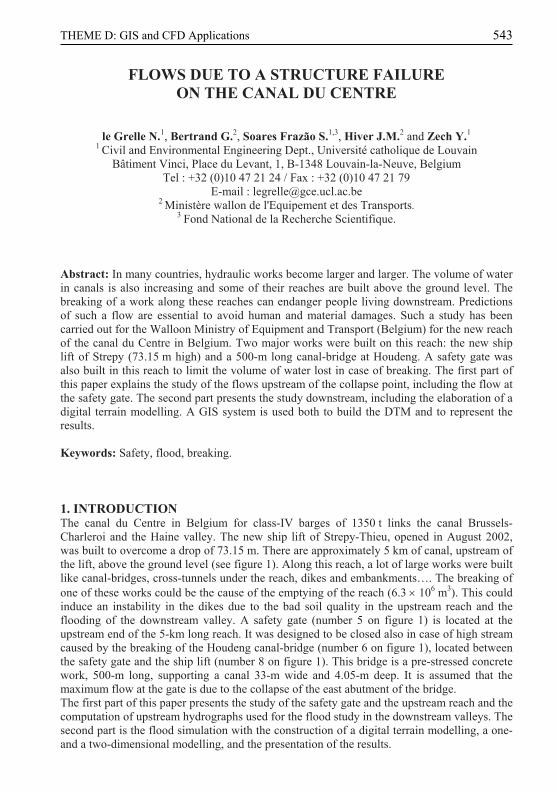
1. INTRODUCTION The canal du Centre in Belgium for class-IV barges of 1350 t links the canal Brussels-Charleroi and the Haine valley. The new ship lift of Strepy-Thieu, opened in August 2002, was built to overcome a drop of 73.15 m. There are approximately 5 km of canal, upstream of the lift, above the ground level (see figure 1). Along this reach, a lot of large works were built like canal-bridges, cross-tunnels under the reach, dikes and embankments…. The breaking of one of these works could be the cause of the emptying of the reach (6.3 × 10⁶ m3). This could induce an instability in the dikes due to the bad soil quality in the upstream reach and the flooding of the downstream valley. A safety gate (number 5 on figure 1) is located at the upstream end of the 5-km long reach. It was designed to be closed also in case of high stream caused by the breaking of the Houdeng canal-bridge (number 6 on figure 1), located between the safety gate and the ship lift (number 8 on figure 1). This bridge is a pre-stressed concrete work, 500-m long, supporting a canal 33-m wide and 4.05-m deep. It is assumed that the maximum flow at the gate is due to the collapse of the east abutment of the bridge. The first part of this paper presents the study of the safety gate and the upstream reach and the computation of upstream hydrographs used for the flood study in the downstream valleys. The second part is the flood simulation with the construction of a digital terrain modelling, a one-and a two-dimensional modelling, and the presentation of the results.
543THEME D: GIS and CFD Applications
Three locations of potential collapse were taken into consideration: two of them are related to the major works on the canal (the new ship lift of Strepy and the canal-bridge of Houdeng). The last scenario is the collapse of a high embankment close to habitations (number 7). For each scenario, both cases with the safety gate opened or closed was envisaged.
Figure 1 : Global view and localisation of the scenarios
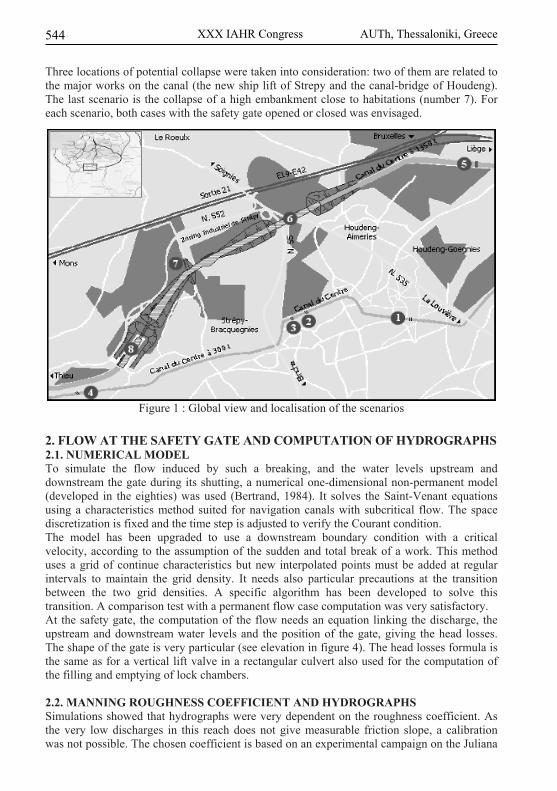
2. FLOW AT THE SAFETY GATE AND COMPUTATION OF HYDROGRAPHS 2.1. NUMERICAL MODEL To simulate the flow induced by such a breaking, and the water levels upstream and downstream the gate during its shutting, a numerical one-dimensional non-permanent model (developed in the eighties) was used (Bertrand, 1984). It solves the Saint-Venant equations using a characteristics method suited for navigation canals with subcritical flow. The space discretization is fixed and the time step is adjusted to verify the Courant condition. The model has been upgraded to use a downstream boundary condition with a critical velocity, according to the assumption of the sudden and total break of a work. This method uses a grid of continue characteristics but new interpolated points must be added at regular intervals to maintain the grid density. It needs also particular precautions at the transition between the two grid densities. A specific algorithm has been developed to solve this transition. A comparison test with a permanent flow case computation was very satisfactory. At the safety gate, the computation of the flow needs an equation linking the discharge, the upstream and downstream water levels and the position of the gate, giving the head losses. The shape of the gate is very particular (see elevation in figure 4). The head losses formula is the same as for a vertical lift valve in a rectangular culvert also used for the computation of the filling and emptying of lock chambers. 2.2. MANNING ROUGHNESS COEFFICIENT AND HYDROGRAPHS Simulations showed that hydrographs were very dependent on the roughness coefficient. As the very low discharges in this reach does not give measurable friction slope, a calibration was not possible. The chosen coefficient is based on an experimental campaign on the Juliana
544 XXX IAHR Congress AUTh, Thessaloniki, Greece

canal in the Netherlands with similar characteristics as the canal du Centre. The best correlation between measurements and numerical simulation (with the same model) was given by a value of Manning coefficient n =0.029 s.m-1/3. Figure 2 shows the hydrographs at the failure section (canal-bridge), with two different values of n (0.03 and 0.02 s.m-1/3). The lower roughness coefficient leads to higher discharges. The bump in the hydrographs is due to the reflection wave coming from the junction with a side branch of the canal.
Figure 2: Hydrographs of break with two different roughness coefficients
2.3. STABILITY OF THE SAFETY GATE Simulations with different closing times of the gate were computed to determine the most unfavourable case (see figure 3). When the reflected wave reaches the gate, the greatest difference in water level between both sides of the gate is obtained. The upstream level is then approximately 30 cm above the initial water level and the downstream level is 2 m under the initial level. These values do not depend on the gate shutting speed.
Figure 3 : Hygdrographs as a function of the gate shutting time
545THEME D: GIS and CFD Applications
Because of the gate shape (see figure. 4), some instabilities in the flow could take place. A scale model (1:10) was tested. It also permitted to check the agreement between the actual head losses and the assumed values in the numerical model. Experiments were carried out with a large range of discharges and water levels (values given by the numerical model). The observed oscillations were always small and the pressures on the plating of the gate close to the hydrostatic pressure.
Figure 4 : Shape of the gate – experimental modelling
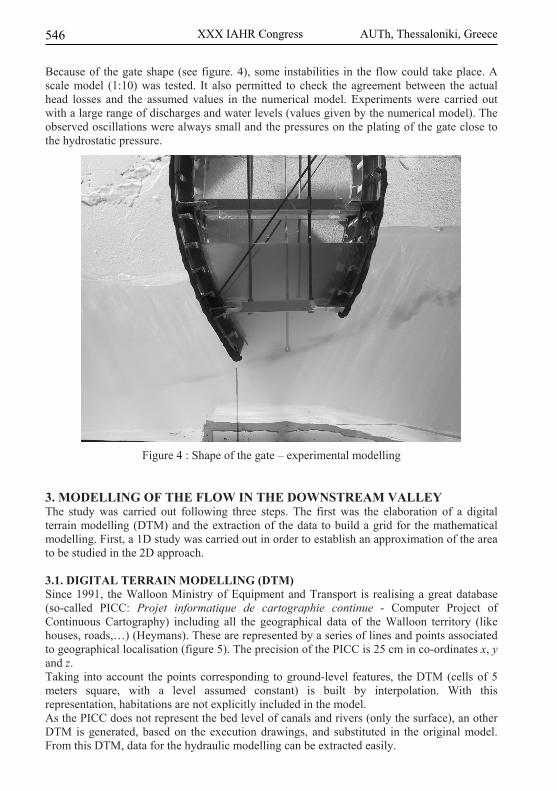
3. MODELLING OF THE FLOW IN THE DOWNSTREAM VALLEY The study was carried out following three steps. The first was the elaboration of a digital terrain modelling (DTM) and the extraction of the data to build a grid for the mathematical modelling. First, a 1D study was carried out in order to establish an approximation of the area to be studied in the 2D approach. 3.1. DIGITAL TERRAIN MODELLING (DTM) Since 1991, the Walloon Ministry of Equipment and Transport is realising a great database (so-called PICC: Projet informatique de cartographie continue - Computer Project of Continuous Cartography) including all the geographical data of the Walloon territory (like houses, roads,…) (Heymans). These are represented by a series of lines and points associated to geographical localisation (figure 5). The precision of the PICC is 25 cm in co-ordinates x, y and z. Taking into account the points corresponding to ground-level features, the DTM (cells of 5 meters square, with a level assumed constant) is built by interpolation. With this representation, habitations are not explicitly included in the model. As the PICC does not represent the bed level of canals and rivers (only the surface), an other DTM is generated, based on the execution drawings, and substituted in the original model. From this DTM, data for the hydraulic modelling can be extracted easily.
546 XXX IAHR Congress AUTh, Thessaloniki, Greece
Figure 5 : PICC representation
3.2. ONE-DIMENSIONAL STUDY The aim of the one-dimensional study is to get a first approximation of the flooded area and to limit the size of the two-dimensional modelling. The process consists of the following steps : first one is realised with the ArcView 3.2 software, second with a Matlab routine and the last with a C++ implementation : 1. Determination of the thalweg and construction of the sections perpendicularly every 50
meters. Nevertheless, at several singularities, intermediate cross-sections need to be added.
2. Those sections are adapted with a semi-manual routine to be "hydraulically compatible" with the mathematical model, it means to avoid non-convex sections, leading to multiple channels in a same section.
3. The mathematical model solves the classical Saint-Venant 1-D equations using a numerical Roe's finite-volume scheme.
3.3. TWO-DIMENSIONAL STUDY The Saint-Venant equations read, in two-dimensional conservative vector form (Soares Frazão, 2002):
( ) ( ) SUGUFU=
∂∂
+∂
∂+
∂∂
yxt (1)
547THEME D: GIS and CFD Applications
=
vhuhh
U , , , (2)
+=uvh
ghhuuh
2/²²F
+=
2/²² ghhvuvhvh
G
−−=
)()(
0
0
0
yfy
xfx
SSghSSghS
U is the vector of variables, F et G are the vectors of fluxes and S represents the topographical and frictional source terms. The velocity components are u and v, h is the water depth, S0 and Sf are the bottom and the friction slopes, respectively. Based on an integral form of those equations, a finite-volume scheme can be written, valid for every type of grids :
( ) tLnnti
nb
jjjyjjxj
i
ni
ni ∆++
Ω∆
−= ∑=
∗+ SGFUU1
,*
,1 (3)
where Ωi is the cell-base area, Lj, the length of the interface, n the outwards unit vector normal to interface, (of components nx et ny ), et nb the number of cell interfaces. Using a transformation matrix, these expressions can be reduced to a one-dimensional form. Each interface is considered as a local one-dimensional Riemann problem. The numerical flux can be computed by:
)(~2
²rF~12
rF~12
rF~1*RLRL c UUFFF −
−+
−+
+= (4)
rF~ is the average value of the Froude number at the interface between cells, and c the average celerity following Roe (1981). The level of the bed and of the water is assumed as constant in each cell.
~
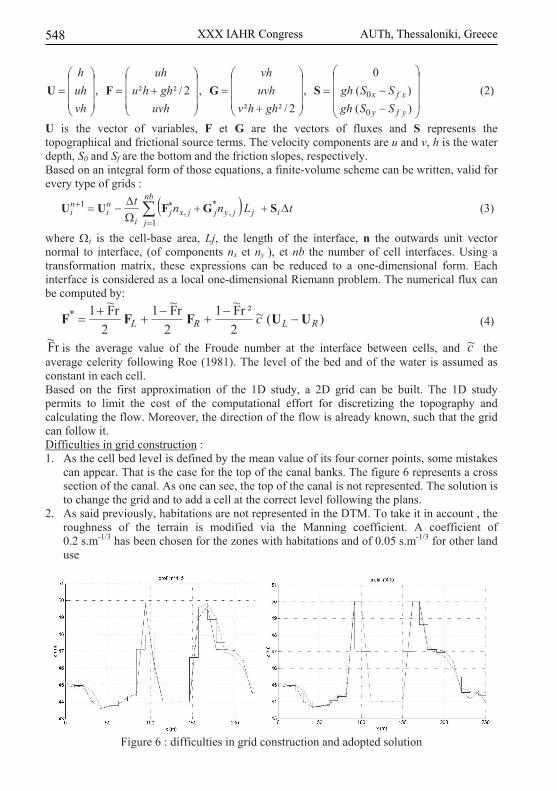
Based on the first approximation of the 1D study, a 2D grid can be built. The 1D study permits to limit the cost of the computational effort for discretizing the topography and calculating the flow. Moreover, the direction of the flow is already known, such that the grid can follow it. Difficulties in grid construction : 1. As the cell bed level is defined by the mean value of its four corner points, some mistakes
can appear. That is the case for the top of the canal banks. The figure 6 represents a cross section of the canal. As one can see, the top of the canal is not represented. The solution is to change the grid and to add a cell at the correct level following the plans.
2. As said previously, habitations are not represented in the DTM. To take it in account , the roughness of the terrain is modified via the Manning coefficient. A coefficient of 0.2 s.m-1/3 has been chosen for the zones with habitations and of 0.05 s.m-1/3 for other land use
Figure 6 : difficulties in grid construction and adopted solution
548 XXX IAHR Congress AUTh, Thessaloniki, Greece
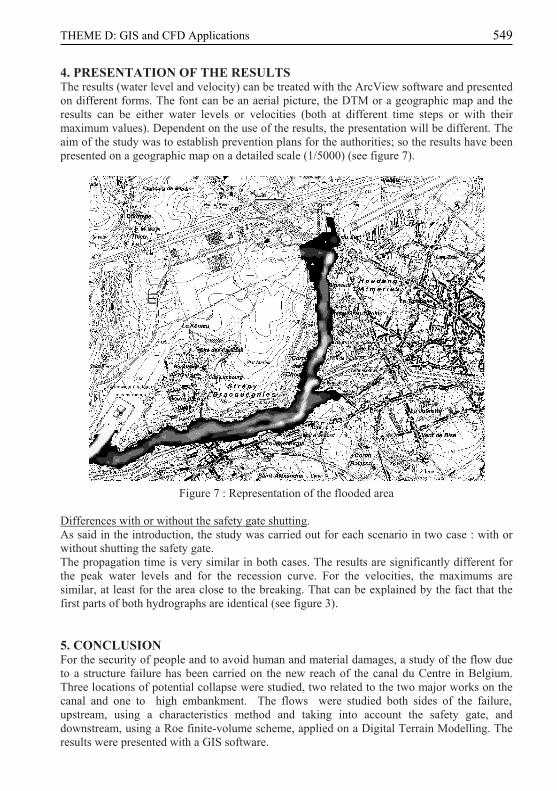
4. PRESENTATION OF THE RESULTS The results (water level and velocity) can be treated with the ArcView software and presented on different forms. The font can be an aerial picture, the DTM or a geographic map and the results can be either water levels or velocities (both at different time steps or with their maximum values). Dependent on the use of the results, the presentation will be different. The aim of the study was to establish prevention plans for the authorities; so the results have been presented on a geographic map on a detailed scale (1/5000) (see figure 7).
Figure 7 : Representation of the flooded area
Differences with or without the safety gate shutting. As said in the introduction, the study was carried out for each scenario in two case : with or without shutting the safety gate. The propagation time is very similar in both cases. The results are significantly different for the peak water levels and for the recession curve. For the velocities, the maximums are similar, at least for the area close to the breaking. That can be explained by the fact that the first parts of both hydrographs are identical (see figure 3).
5. CONCLUSION For the security of people and to avoid human and material damages, a study of the flow due to a structure failure has been carried on the new reach of the canal du Centre in Belgium. Three locations of potential collapse were studied, two related to the two major works on the
upstream, using a characteristics method and taking into account the safety gate, and downstream, using a Roe finite-volume scheme, applied on a Digital Terrain Modelling. The results were presented with a GIS software.
canal and one to high embankment. The flows were studied both sides of the failure,
549THEME D: GIS and CFD Applications
ACKNOWLEDGEMENTS Thanks to H. Brouet from the MET, D221, Direction des voies hydrauliques de Mons and to the SOFICO for their help.
REFERENCES Adriaensen, C. 2002. Modèle de prévision d'axes hydrauliques de crues sur la Meuse
Wallonne et la Haute-Sambre, Research report, UCL, Belgium (in French). Adriaensen, C., Bousmar, D. & Zech, Y., 2002. Integration of high resolution survey data for
River Meuse modelling, Proc. int. conf. River Flow 2002, vol2, pp 1261-1267. Bertrand, G., 1984. Water movements in a complex canal reach, computation by a method of
characteristics, comparison with field measurements. First International Conference on Hydraulic Design in Water Ressources Engineering. Southampton, 1984.
Bertrand, G. 2000. Porte de garde du Blanc Pain - Etude des mouvements d'eau en cas de rupture du pont-canal du Sart, Research Report, MET - D 213 - Août 2000 (In French)
Heymans, L. Le fond de plan cartographique à grande échelle de la région wallonne. http://internet.win.be/rainbow/d432.
le Grelle, N., Soares Frazão, S. 2002. Simulation des écoulements dans les vallées sous le canal du Centre à 1350 t suite à la rupture d'un ouvrage, Research report, UCL, Belgium (in French).
Roe, P.L., 1981. Approximate Riemann solvers, parameter vectors and differene scheme. Journal of Computational Physics, 43, 357-372.
Soares Frazão, S. 2002. Dam-break induced flows in complex topographies. Theoretical, numerical and experimental approaches. PhD Thesis. Louvain-la-Neuve: UCL, Belgium.
550 XXX IAHR Congress AUTh, Thessaloniki, Greece