are stocks really less volatile in the long...
TRANSCRIPT

IntroductionModel
ResultsConclusion
Are Stocks Really Less Volatile in the Long Run?
Pastor and Stambaugh, JF 2009 (forth)Presented by: Esben HedegaardNYUStern
October 5, 2009
Pastor and Stambaugh Are Stocks Really Less Volatile in the Long Run?

IntroductionModel
ResultsConclusion
Outline
1 IntroductionVariance RatiosMeasures of VarianceSome Numbers
2 ModelNumerical IllustrationEstimation
3 ResultsPredictive VariancePerfect vs. Imperfect PredictorsPredictive vs. True VarianceConditional vs. Unconditional Variance
4 Conclusion
Pastor and Stambaugh Are Stocks Really Less Volatile in the Long Run?

IntroductionModel
ResultsConclusion
Variance RatiosMeasures of VarianceSome Numbers
Common view: Stocks are less volatile in the long run
Wall Street Advice:
“Stock investors should have an investment horizon of 3 yearsor more”
“Long-run investor should have a higher equity allocation thanshort-run investors”
“Stocks are safer for long-run investors who can wait out theups and downs of the market”
Academics have always been sceptical!
Pastor and Stambaugh Are Stocks Really Less Volatile in the Long Run?

IntroductionModel
ResultsConclusion
Variance RatiosMeasures of VarianceSome Numbers
Variance Ratios
How volatile are long-horizon returns compared to one-periodreturns?
Directly from returns:
VR(k) =1
k
V (rt,t+k)
V (rt,t+1)(1)
1 Variance ratios below 1 are found for long horizons.
2 Hence, Sharpe-ratios are higher for long horizons.
3 Stocks are safer in the long run!
Pastor and Stambaugh Are Stocks Really Less Volatile in the Long Run?
IntroductionModel
ResultsConclusion
Variance RatiosMeasures of VarianceSome Numbers
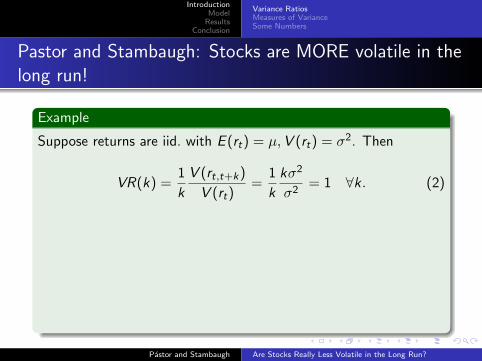
Pastor and Stambaugh: Stocks are MORE volatile in thelong run!
Example
Suppose returns are iid. with E (rt) = �,V (rt) = �2. Then
VR(k) =1
k
V (rt,t+k)
V (rt)=
1
k
k�2
�2= 1 ∀k. (2)
However, suppose � is unknown! Then
Vt(rt,t+k) = Et(Vt(rt,t+k ∣�)) + Vt(Et(rt,t+k ∣�)) (3)
= Et(k�2) + Vt(k�) = k�2 + k2Vt(�), (4)
so VR(k) = 1kk�2+k2Vt(�)�2+Vt(�)
= �2+kVt(�)�2+Vt(�)
increases in k!
Pastor and Stambaugh Are Stocks Really Less Volatile in the Long Run?

IntroductionModel
ResultsConclusion
Variance RatiosMeasures of VarianceSome Numbers
Measures of Variance
True Unconditional Variance
Conditions on true parameters.Ex: Sample variance is an estimate of true unconditional variance.
True Conditional Variance
Conditions on true parameters, past returns, conditional expectedreturn when returns are predictable.
Predictive Variance
1 Incorporates parameter uncertainty
2 Relevant for an investor
Pastor and Stambaugh Are Stocks Really Less Volatile in the Long Run?

IntroductionModel
ResultsConclusion
Variance RatiosMeasures of VarianceSome Numbers
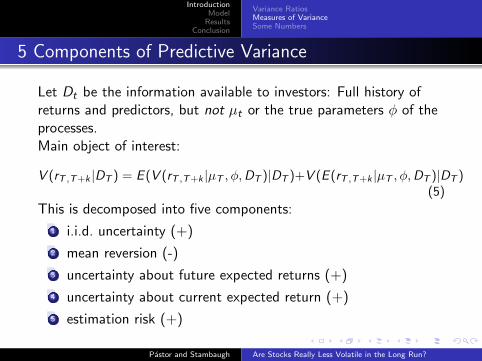
5 Components of Predictive Variance
Let Dt be the information available to investors: Full history ofreturns and predictors, but not �t or the true parameters � of theprocesses.Main object of interest:
V (rT ,T+k ∣DT ) = E (V (rT ,T+k ∣�T , �,DT )∣DT )+V (E (rT ,T+k ∣�T , �,DT )∣DT )(5)
This is decomposed into five components:
1 i.i.d. uncertainty (+)
2 mean reversion (-)
3 uncertainty about future expected returns (+)
4 uncertainty about current expected return (+)
5 estimation risk (+)
Pastor and Stambaugh Are Stocks Really Less Volatile in the Long Run?
IntroductionModel
ResultsConclusion
Variance RatiosMeasures of VarianceSome Numbers
5 Components of Predictive Variance
Let Dt be the information available to investors: Full history ofreturns and predictors, but not �t or the true parameters � of theprocesses.Main object of interest:
V (rT ,T+k ∣DT ) = E (V (rT ,T+k ∣�T , �,DT )∣DT )+V (E (rT ,T+k ∣�T , �,DT )∣DT )(5)
This is decomposed into five components:
1 i.i.d. uncertainty (+)
2 mean reversion (-)
3 uncertainty about future expected returns (+)
4 uncertainty about current expected return (+)
5 estimation risk (+)
Pastor and Stambaugh Are Stocks Really Less Volatile in the Long Run?

IntroductionModel
ResultsConclusion
Variance RatiosMeasures of VarianceSome Numbers
Main Assumption: Time-Varying Expected Returns
Assume expected returns are
1 Time-varying (critical, but not controversial)
2 Predictable
Even if stock returns are predictable, �t is not know exactly:
Definition
Let �t = Et(rt+1). The predictor xt is called perfect if
�t = � + �′xt . (6)
Otherwise the predictor is called imperfect.
Imperfect predictors increase uncertainty about current and future�t .
Pastor and Stambaugh Are Stocks Really Less Volatile in the Long Run?
IntroductionModel
ResultsConclusion
Variance RatiosMeasures of VarianceSome Numbers
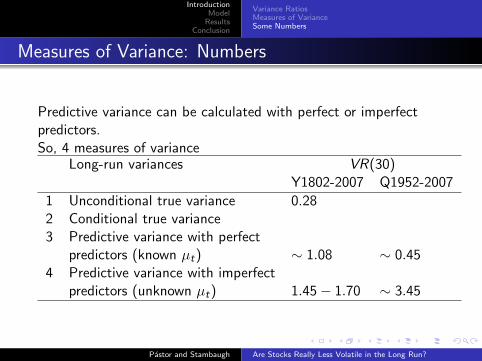
Measures of Variance: Numbers
Predictive variance can be calculated with perfect or imperfectpredictors.So, 4 measures of variance
Long-run variances VR(30)Y1802-2007 Q1952-2007
1 Unconditional true variance 0.282 Conditional true variance3 Predictive variance with perfect
predictors (known �t) ∼ 1.08 ∼ 0.454 Predictive variance with imperfect
predictors (unknown �t) 1.45− 1.70 ∼ 3.45
Pastor and Stambaugh Are Stocks Really Less Volatile in the Long Run?

IntroductionModel
ResultsConclusion
Numerical IllustrationEstimation
Outline
1 IntroductionVariance RatiosMeasures of VarianceSome Numbers
2 ModelNumerical IllustrationEstimation
3 ResultsPredictive VariancePerfect vs. Imperfect PredictorsPredictive vs. True VarianceConditional vs. Unconditional Variance
4 Conclusion
Pastor and Stambaugh Are Stocks Really Less Volatile in the Long Run?
IntroductionModel
ResultsConclusion
Numerical IllustrationEstimation
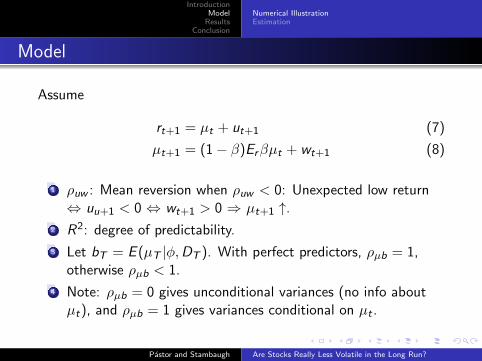
Model
Assume
rt+1 = �t + ut+1 (7)
�t+1 = (1− �)Er��t + wt+1 (8)
1 �uw : Mean reversion when �uw < 0: Unexpected low return⇔ uu+1 < 0 ⇔ wt+1 > 0 ⇒ �t+1 ↑.
2 R2: degree of predictability.
3 Let bT = E (�T ∣�,DT ). With perfect predictors, ��b = 1,otherwise ��b < 1.
4 Note: ��b = 0 gives unconditional variances (no info about�t), and ��b = 1 gives variances conditional on �t .
Pastor and Stambaugh Are Stocks Really Less Volatile in the Long Run?

IntroductionModel
ResultsConclusion
Numerical IllustrationEstimation
Distribution of Uncertain Parameters
�: Persistence of �t .
R2: degree of predictability.
Solid line: rt+1 on �T
Dashed line: rt+1 on bT
�uw < 0: Controls meanreversion.
With perfect predictors,��b = 1, otherwise ��b < 1.
Pastor and Stambaugh Are Stocks Really Less Volatile in the Long Run?

IntroductionModel
ResultsConclusion
Numerical IllustrationEstimation
Effect of Parameter Uncertainty on VR(20)
Table 1 (Based on distributions in Figure 4)
�: Persistence of �t .R2: degree of predictability.�uw < 0: Controls mean reversion.With perfect predictors, ��b = 1, otherwise ��b < 1.
1 With known params, VR(20) < 12 With unknown params, VR(20) > 1.
Pastor and Stambaugh Are Stocks Really Less Volatile in the Long Run?

IntroductionModel
ResultsConclusion
Numerical IllustrationEstimation
Estimation
Predictive system with three predictors:
1 Dividend yield
2 Bond yield (fist diff in long-term high-grade bond yields)
3 Term spread (long-term bond yield minus short-term interestrate)
Choose priors for �uw , � and R2 (see Fig 5).Use stock market data from 1802-2007 and compute posteriorsusing MCMC (see Fig 6).These characterize the parameter uncertainty faced by an investorafter updating the priors with 206 years of equity returns.
Pastor and Stambaugh Are Stocks Really Less Volatile in the Long Run?

IntroductionModel
ResultsConclusion
Numerical IllustrationEstimation
Estimation: Posteriors
Posteriors show evidence of
1 Predictability (posterior for true R2 lies to the right of prior)
2 Persistence of �t (posterior for � lies to the right of prior)
3 Mean reversion: �uw has mode at −0.9 (consistent withobserved autocorrelations of real returns)
4 Predictor imperfection (R2 in a regression of �t on xt is low).Important, as predictor imperfection drives results.
Pastor and Stambaugh Are Stocks Really Less Volatile in the Long Run?

IntroductionModel
ResultsConclusion
Predictive VariancePerfect vs. Imperfect PredictorsPredictive vs. True VarianceConditional vs. Unconditional Variance
Outline
1 IntroductionVariance RatiosMeasures of VarianceSome Numbers
2 ModelNumerical IllustrationEstimation
3 ResultsPredictive VariancePerfect vs. Imperfect PredictorsPredictive vs. True VarianceConditional vs. Unconditional Variance
4 Conclusion
Pastor and Stambaugh Are Stocks Really Less Volatile in the Long Run?

IntroductionModel
ResultsConclusion
Predictive VariancePerfect vs. Imperfect PredictorsPredictive vs. True VarianceConditional vs. Unconditional Variance
Predictive Variance
Figures show predictive varianceand its components withimperfect predictors.
1 Predictive variance increaseswith horizon.
2 Uncertainty about futureexpected returns has highesteffect.
Pastor and Stambaugh Are Stocks Really Less Volatile in the Long Run?

IntroductionModel
ResultsConclusion
Predictive VariancePerfect vs. Imperfect PredictorsPredictive vs. True VarianceConditional vs. Unconditional Variance
Perfect vs. Imperfect Predictors
Figures show predictive varianceswith perfect and imperfectpredictors.
1 Based on non-informativepriors.
2 Predictive variance withprefect predictors is almostflat across horizons.
3 Predictive variance withimperfect predictorsincreases with horizon.
Pastor and Stambaugh Are Stocks Really Less Volatile in the Long Run?

IntroductionModel
ResultsConclusion
Predictive VariancePerfect vs. Imperfect PredictorsPredictive vs. True VarianceConditional vs. Unconditional Variance
Predictive vs. True Variance
Figures show
1 Sample variance as ameasure of true uncondvariance
2 percentiles for Monte Carlounder iid. returns
The sample variance gets a p-valof 1%, supporting the hypothesisthat true 30-year variance is < 1.
Pastor and Stambaugh Are Stocks Really Less Volatile in the Long Run?

IntroductionModel
ResultsConclusion
Predictive VariancePerfect vs. Imperfect PredictorsPredictive vs. True VarianceConditional vs. Unconditional Variance
True Cond vs. True Uncond Variance
Sample variance is a measure of true unconditional variance.Appendix A4 show that
VRu(k) = (1− R2)VRc(k) +1
k
(1− �k
1− �
)2
R2 (9)
So true unconditional variance could be decreasing in k , while trueconditional variance could increase.
Pastor and Stambaugh Are Stocks Really Less Volatile in the Long Run?

IntroductionModel
ResultsConclusion
Outline
1 IntroductionVariance RatiosMeasures of VarianceSome Numbers
2 ModelNumerical IllustrationEstimation
3 ResultsPredictive VariancePerfect vs. Imperfect PredictorsPredictive vs. True VarianceConditional vs. Unconditional Variance
4 Conclusion
Pastor and Stambaugh Are Stocks Really Less Volatile in the Long Run?

IntroductionModel
ResultsConclusion
Conclusion
1 Use a predictive system and 206 years of data to formposteriors for model parameters
2 Compute long-horizon predictive variances
3 Mean-reversion reduces long-horizon variances
4 But uncertainty about current and future expected returns,and parameters, offsets this reduction
5 Uncertainty about future expected returns has the largesteffect
6 Imperfect predictors increase uncertainty about current andfuture returns, and drive results
Pastor and Stambaugh Are Stocks Really Less Volatile in the Long Run?
Variance RatiosPredictability
Target-Date Funds and Learning
Are Stocks Really Less Volatile in the Long Run?Discussion
Esben HedegaardNYUStern
October 5, 2009
Esben Hedegaard Are Stocks Really Less Volatile in the Long Run?Discussion

Variance RatiosPredictability
Target-Date Funds and Learning
Outline
1 Variance Ratios
2 Predictability
3 Target-Date Funds and Learning
Esben Hedegaard Are Stocks Really Less Volatile in the Long Run?Discussion
Variance RatiosPredictability
Target-Date Funds and Learning
Outline
1 Variance Ratios
2 Predictability
3 Target-Date Funds and Learning
Esben Hedegaard Are Stocks Really Less Volatile in the Long Run?Discussion

Variance RatiosPredictability
Target-Date Funds and Learning
Different Variance Ratios
I missed a summary of different types of variance ratios:Long-run variances VR(30)
1802-2007 Q1952-2007
True unconditional variance 0.28True conditional variancePredictive variance with perfectpredictors (known �t) ∼ 1.08 ∼ 0.45Predictive variance with imperfectpredictors (unknown �t) 1.45 − 1.70 ∼ 3.45
Esben Hedegaard Are Stocks Really Less Volatile in the Long Run?Discussion

Variance RatiosPredictability
Target-Date Funds and Learning
Outline
1 Variance Ratios
2 Predictability
3 Target-Date Funds and Learning
Esben Hedegaard Are Stocks Really Less Volatile in the Long Run?Discussion
Variance RatiosPredictability
Target-Date Funds and Learning
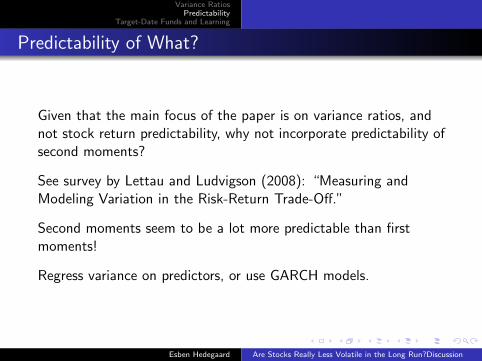
Predictability of What?
Given that the main focus of the paper is on variance ratios, andnot stock return predictability, why not incorporate predictability ofsecond moments?
See survey by Lettau and Ludvigson (2008): “Measuring andModeling Variation in the Risk-Return Trade-Off.”
Second moments seem to be a lot more predictable than firstmoments!
Regress variance on predictors, or use GARCH models.
Esben Hedegaard Are Stocks Really Less Volatile in the Long Run?Discussion

Variance RatiosPredictability
Target-Date Funds and Learning
Outline
1 Variance Ratios
2 Predictability
3 Target-Date Funds and Learning
Esben Hedegaard Are Stocks Really Less Volatile in the Long Run?Discussion

Variance RatiosPredictability
Target-Date Funds and Learning
Target-Date Funds
Application: Target-date funds.
Target-date funds gradually reduces stock allocation as the targetdate approaches.
Follows standard advice: “Long-term investor should have higherequity allocation.”
Consider an investor with power utility.
Esben Hedegaard Are Stocks Really Less Volatile in the Long Run?Discussion

Variance RatiosPredictability
Target-Date Funds and Learning
Optimal Equity Allocation
Panel A: Initial and final equityallocation without parameteruncertainty.Very similar to real-worldtarget-date funds.Panel B: Incorporate parameteruncertainty. Implies lower equityallocation. Result is driven byuncertainty about futureexpected returns.Panel C: Optimal initial equityallocation, given fixed finalallocation.
Esben Hedegaard Are Stocks Really Less Volatile in the Long Run?Discussion

Variance RatiosPredictability
Target-Date Funds and Learning
Learning
Discussing investments in target-date funds, the investor bases hisinvestments on the posterior distributions today.
He thus acts as if he will have the same knowledge over the next30 years!
What if the investor learns and can re-balance every period?
Esben Hedegaard Are Stocks Really Less Volatile in the Long Run?Discussion

Variance RatiosPredictability
Target-Date Funds and Learning
Idea: Learning and Rebalancing
Dynamic programming:
max�t
T∑t=1
Ut(ct) s.t. (1)
cT = wT (2)
wt+1 = �t(wt − ct)(1 + rt+1) + (1 − �t)(wt − ct)(1 + r ft+1) (3)
rt+1 = �t + ut+1 (4)
xt+1 = �+ Axt + �t+1 (5)
�t+1 = (1 − �)Er + ��t + wt+1 Unobserved (6)
�0 ∼ N(�0, �2�) (7)
Esben Hedegaard Are Stocks Really Less Volatile in the Long Run?Discussion

Variance RatiosPredictability
Target-Date Funds and Learning
Idea: Learning and Rebalancing
In an LQG model you could include all five components of long-runvariance:
1 iid uncertainty
2 mean reversion
3 uncertainty about future expected return
4 uncertainty about current expected return (predictive system)
5 estimation risk (robust control)
The investor learns about conditional expected return using theKalman filter. He makes his investment/consumption decisiontoday, knowing that he can rebalance in the next period, andanticipating that he has learned more about the conditionalexpected return.
Esben Hedegaard Are Stocks Really Less Volatile in the Long Run?Discussion