april 2015 upload
TRANSCRIPT

Economic Indicators:
An Update for the 7 Rivers Region


0
2
4
6
8
10
12
14
1974 1978 1982 1986 1990 1994 1998 2002 2006 2010 2014
Housing: Vacancy Rates for
Rental Units
1 unit
2 or more units
5 or more units

-
1.0
2.0
3.0
4.0
5.0
6.0
7.0
2000 2002 2004 2006 2008 2010 2012 2014
Foreclosure Rate per 1,000 Housing Units
La Crosse
Brown
Outagamie
Winnebago

$100,000
$110,000
$120,000
$130,000
$140,000
$150,000
$160,000
2007 2011 2015
Median Home Prices: Brown County
$100,000
$110,000
$120,000
$130,000
$140,000
$150,000
$160,000
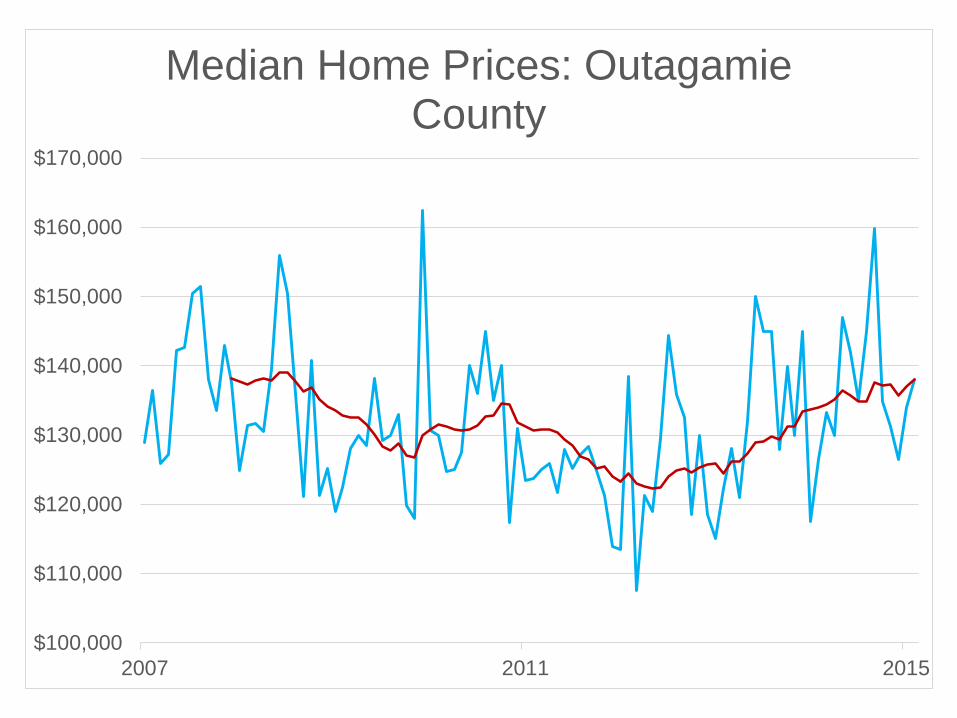
$170,000
2007 2011 2015
Median Home Prices: Outagamie County

$80,000
$90,000
$100,000
$110,000
$120,000
$130,000
$140,000
$150,000
2007 2011 2015
Median Home Prices: Winnebago County

$100,000
$110,000
$120,000
$130,000
$140,000
$150,000
$160,000
$170,000
2007 2011 2015
Median Home Prices: La Crosse County
0
2
4
6
8
10
12
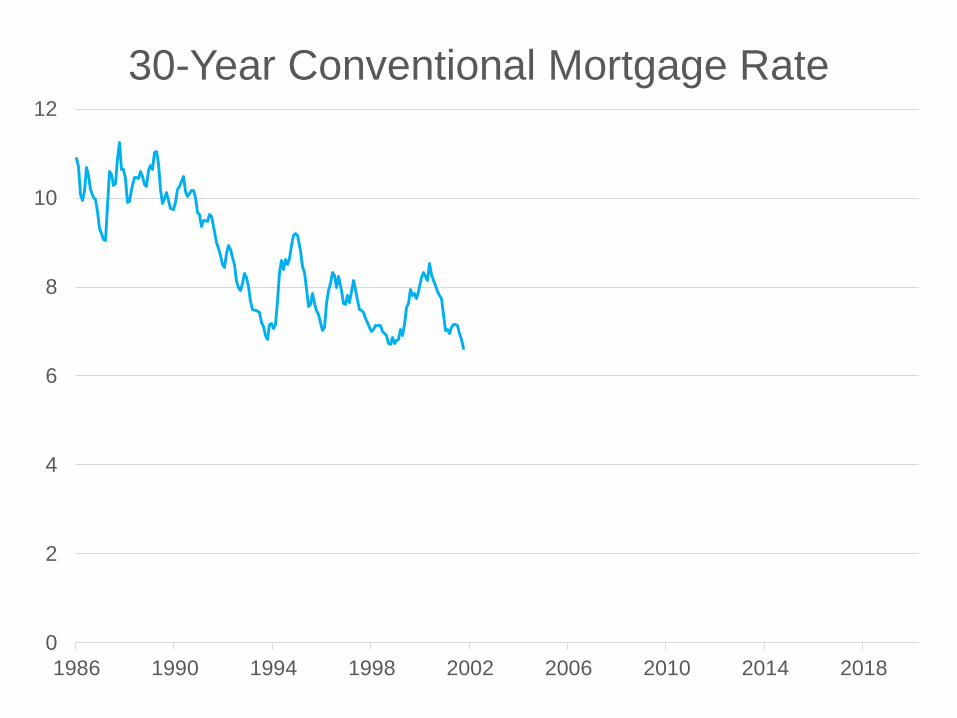
1986 1990 1994 1998 2002 2006 2010 2014 2018
30-Year Conventional Mortgage Rate

0
2
4
6
8
10
12
1986 1990 1994 1998 2002 2006 2010 2014 2018
30-Year Conventional Mortgage Rate

0
2
4
6
8
10
12
1986 1990 1994 1998 2002 2006 2010 2014 2018
30-Year Conventional Mortgage Rate

0
2
4
6
8
10
12
1986 1990 1994 1998 2002 2006 2010 2014 2018
30-Year Conventional Mortgage Rate
?


As weather officer in World War II he and his team determined long range weather forecasts were no better then pulling them out of a hat.
Ken Arrow, Nobel Laureate in Economics

“The Commanding General is well aware that the forecasts are no good. However, he needs them for planning purposes…”
Ken Arrow, Nobel Laureate in Economics


Why are interest rates so low?
Low inflation and contained expectations
Aggressive action by the Federal Reserve
(QE)
The rest of the world is struggling, leaving the
US as a safe haven for investment.

-10%
-7%
-4%
-1%
2%
5%
8%
11%
14%
17%
20%
2008Q1 2010Q1 2012Q1 2014Q1
Change in GDP since Q1 2008US
France
Germany
Spain
Italy

$0
$100,000
$200,000
$300,000
$400,000
$500,000
$600,000
$700,000
$800,000
$900,000
$1,000,000
$1,100,000
$0
$50,000
$100,000
$150,000
$200,000
$250,000
$300,000
$350,000
1993 1996 1999 2002 2005 2008 2011 2014
Construction Spending Millions of Dollars
Total Public Construction Spending
Left Axis
Total Private Construction Spending
Right Axis

0.00%
0.04%
0.08%
0.12%
0.16%
1967 1971 1975 1979 1983 1987 1991 1995 1999 2003 2007 2011
Net Government Investment Spending as Percentage of GDP

Oil Prices

$0 $20 $40 $60 $80 $100 $120 $140 $160 $180 $200
Libya
Iran
Algeria
Nigeria
Venezuela
Russia
Saudi Arabia
Iraq
UAE
Kuwait
Qatar
Oil Price Needed For Fiscal Break Even
$53


Risks to Local Economy
State Budget
Dollar Appreciation
Manufacturing Employment


Early Childhood Development
The Economic Impact of Doing Better by
our Children

0 10 20 30 40
Pre-K education
Primary Education
High School Education
College Education
Other
Which of the following actions do you believe will have the biggest impact on reducing poverty?

0 5 10 15 20
Increase All EducationSpending
Better Jobs
Parents and Family
ReduceSpending/Welfare
OTHER: Which of the following actions do you believe will have the biggest impact on reducing poverty?


Two roads diverged in a wood, and I—
I took the one less traveled by,
And that has made all the difference.
~ Robert Frost


r

“
”
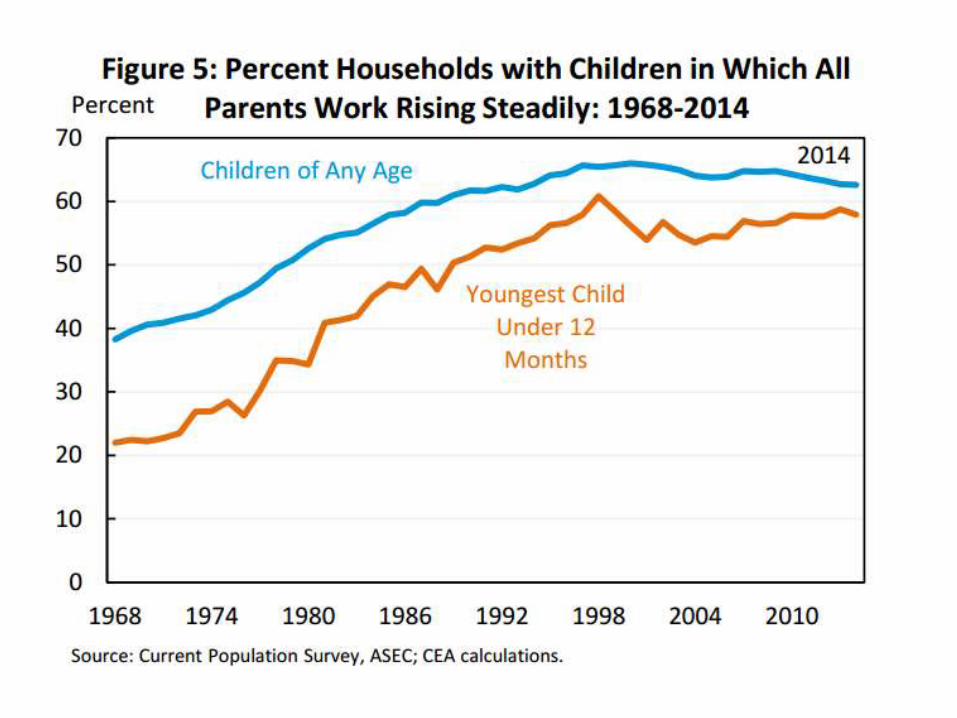
By the time they enter
kindergarten the children
of professional families
heard 19 million more
words than kids of
working class familiesOur Kids Robert Putnam


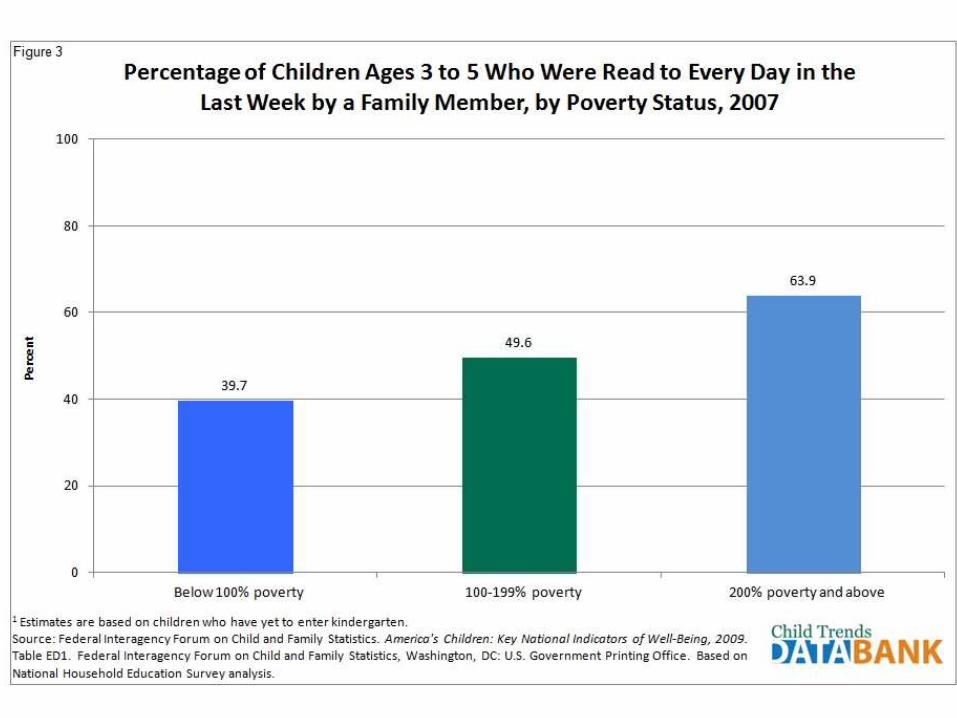


Disparities Exist Early
Cognitive
Social-Emotional
Health
School Preparedness

The Research
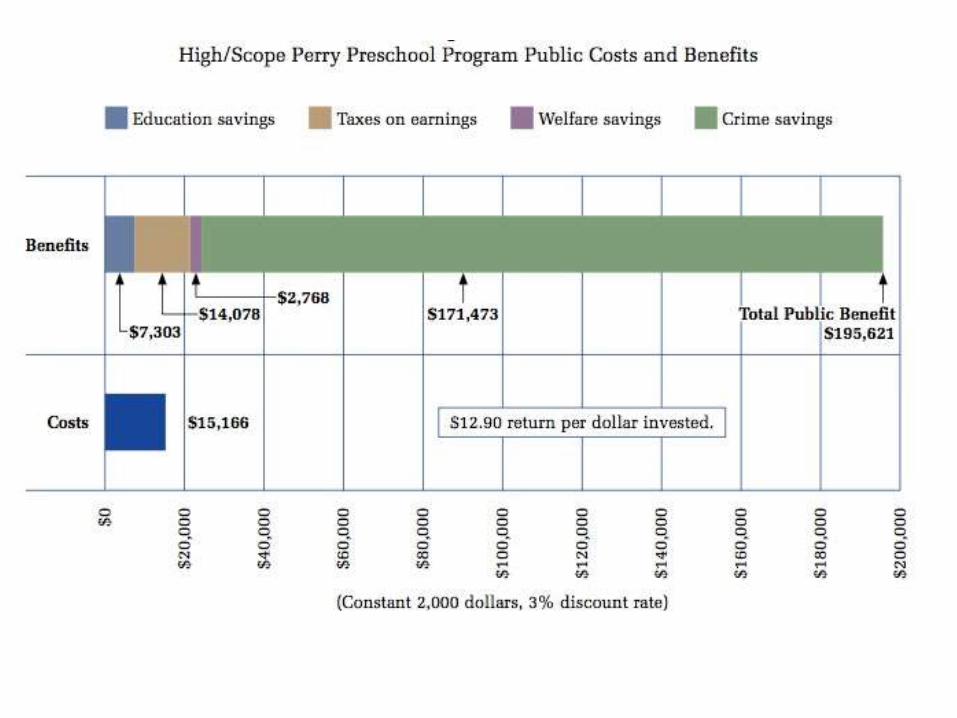
The High/Scope Perry Preschool Study
The Abecedarian Intervention Project
Chicago Child Parent Center
Head Start

The Economic Benefits to
Early Interventions
Tax Revenue Increases and Transfer Payment
Decreases Due to Higher Earnings
Remedial Education and Education System
Savings
Reduced Involvement with the Criminal Justice
System
Improvements in Health


The Areas of Early
Interventions
Health
Family Support
Learning

Health

Health
Timely and ongoing prenatal, pediatric, and oral health care
Access to affordable health insurance for children and families
Partnerships to coordinate the identification and delivery of health care services with early learning programs
Community-based programs targeting sources of toxic stress such as violence, crime, substance abuse, and mental illness, combined with supports for parents and caregivers who need them
Maximize participation of families, providers, schools and communities in federal nutrition and assistance programs

Family Support

Family Support
Voluntary, evidence-based, iii home visiting programs for new and expectant families at risk for poor child outcomes
Parent education and parent-child interaction programs that are linguistically and culturally appropriate and support development and nurturing of infants and toddlers
Access to child care assistance for eligible families with provisions for quality and continuity of care
Effective outreach and enrollment in programs that promote family economic stability and parent participation in higher education
Prevention programs and services for children at risk of abuse and neglect and their families
Family engagement policies starting with defining family engagement, establishing benchmarks of success for targeted populations, and monitoring progress
Access to health care and education programs for children cared for by grandparents and other relative caregivers.

Learning
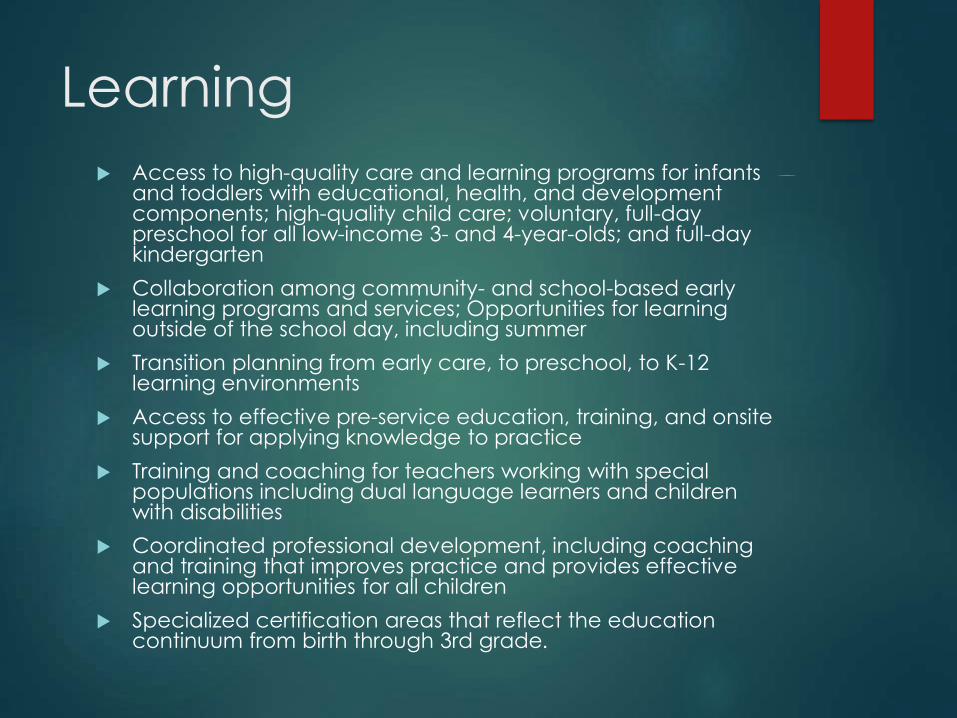
Learning
Access to high-quality care and learning programs for infants and toddlers with educational, health, and development components; high-quality child care; voluntary, full-day preschool for all low-income 3- and 4-year-olds; and full-day kindergarten
Collaboration among community- and school-based early learning programs and services; Opportunities for learning outside of the school day, including summer
Transition planning from early care, to preschool, to K-12 learning environments
Access to effective pre-service education, training, and onsite support for applying knowledge to practice
Training and coaching for teachers working with special populations including dual language learners and children with disabilities
Coordinated professional development, including coaching and training that improves practice and provides effective learning opportunities for all children
Specialized certification areas that reflect the education continuum from birth through 3rd grade.

Principal, Hintgen Elementary School
Mark J. White, NAESP President
Tim Penny, President and CEOSouthern Minnesota Initiative Foundation


What were your experiences
and challenges?
What do you wish you could
have done different?
Imagine now you were
suddenly in a lower SES. What
challenges would you face?
What could help you overcome
them?

THANKS.PLEASE FILL OUT YOUR EVALUATIONS