applications of heuristics and metaheuristics in power...
TRANSCRIPT

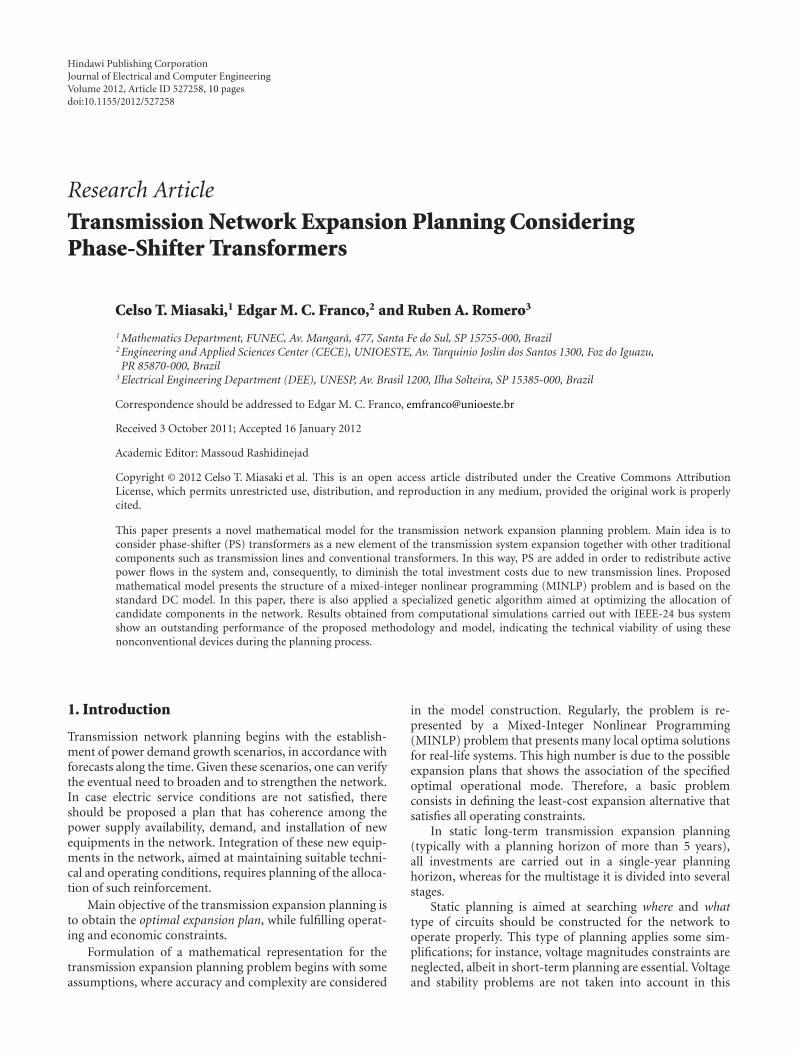
Applications of Heuristics and Metaheuristics in Power SystemsGuest Editors: Ruben Romero, Edgar M. C. Franco, and Massoud Rashidinejad
Journal of Electrical and Computer Engineering

Applications of Heuristics and Metaheuristicsin Power Systems
Journal of Electrical and Computer Engineering
Applications of Heuristics and Metaheuristicsin Power Systems
Guest Editors: Ruben Romero, Edgar M. C. Franco,and Massoud Rashidinejad

Copyright © 2012 Hindawi Publishing Corporation. All rights reserved.
This is a special issue published in “Journal of Electrical and Computer Engineering.” All articles are open access articles distributedunder the Creative Commons Attribution License, which permits unrestricted use, distribution, and reproduction in any medium, pro-vided the original work is properly cited.
Editorial BoardThe editorial board of the journal is organized into sections that correspond to
the subject areas covered by the journal.
Circuits and Systems
M. T. Abuelma’atti, Saudi ArabiaIshfaq Ahmad, USADhamin Al-Khalili, CanadaWael M. Badawy, CanadaIvo Barbi, BrazilMartin A. Brooke, USAChip Hong Chang, SingaporeY. W. Chang, TaiwanTian-Sheuan Chang, TaiwanTzi-Dar Chiueh, TaiwanHenry S. H. Chung, Hong KongM. Jamal Deen, CanadaAhmed El Wakil, UAEDenis Flandre, BelgiumP. Franzon, USAAndre Ivanov, CanadaEbroul Izquierdo, UKWen-Ben Jone, USA
Yong-Bin Kim, USAH. Kuntman, TurkeyParag K. Lala, USAShen-Iuan Liu, TaiwanBin-Da Liu, TaiwanJoao Antonio Martino, BrazilPianki Mazumder, USAMichel Nakhla, CanadaSing Kiong Nguang, New ZealandShun-ichiro Ohmi, JapanMohamed A. Osman, USAPing Feng Pai, TaiwanMarcelo Antonio Pavanello, BrazilMarco Platzner, GermanyMassimo Poncino, ItalyDhiraj K. Pradhan, UKF. Ren, USA
Gabriel Robins, USAMohamad Sawan, CanadaRaj Senani, IndiaGianluca Setti, ItalyJose Silva-Martinez, USAAhmed M. Soliman, EgyptDimitrios Soudris, GreeceCharles E. Stroud, USAEphraim Suhir, USAHannu Tenhunen, SwedenGeorge S. Tombras, GreeceSpyros Tragoudas, USAChi Kong Tse, Hong KongChi-Ying Tsui, Hong KongJan Van der Spiegel, USAChin-Long Wey, USA
Communications
Sofiene Affes, CanadaDharma Agrawal, USAH. Arslan, USAEdward Au, ChinaEnzo Baccarelli, ItalyStefano Basagni, USAJun Bi, ChinaZ. Chen, SingaporeRene Cumplido, MexicoLuca De Nardis, ItalyM.-G. Di Benedetto, ItalyJ. Fiorina, FranceLijia Ge, ChinaZabih F. Ghassemlooy, UK
K. Giridhar, IndiaAmoakoh Gyasi-Agyei, GhanaYaohui Jin, ChinaMandeep Jit Singh, MalaysiaPeter Jung, GermanyAdnan Kavak, TurkeyRajesh Khanna, IndiaKiseon Kim, Republic of KoreaD. I. Laurenson, UKTho Le-Ngoc, CanadaC. Leung, CanadaPetri Mahonen, GermanyM. Abdul Matin, BangladeshM. Najar, Spain
Mohammad S. Obaidat, USAAdam Panagos, USASamuel Pierre, CanadaJohn N. Sahalos, GreeceChristian Schlegel, CanadaVinod Sharma, IndiaIickho Song, Republic of KoreaIoannis Tomkos, GreeceChien Cheng Tseng, TaiwanGeorge Tsoulos, GreeceLaura Vanzago, ItalyRoberto Verdone, ItalyGuosen Yue, USAJian-Kang Zhang, Canada
Signal Processing
S. S. Agaian, USAP. Agathoklis, CanadaJaakko Astola, FinlandTamal Bose, USAA. G. Constantinides, UK
Paul Dan Cristea, RomaniaPetar M. Djuric, USAIgor Djurovic, MontenegroKaren Egiazarian, FinlandW. S. Gan, Singapore
Zabih F. Ghassemlooy, UKLing Guan, CanadaMartin Haardt, GermanyPeter Handel, SwedenAndreas Jakobsson, Sweden

Jiri Jan, Czech RepublicS. Jensen, DenmarkChi Chung Ko, SingaporeM. A. Lagunas, SpainJ. Lam, Hong KongD. I. Laurenson, UKRiccardo Leonardi, ItalyMark Liao, TaiwanStephen Marshall, UKAntonio Napolitano, Italy
Sven Nordholm, AustraliaS. Panchanathan, USAPeriasamy K. Rajan, USACedric Richard, FranceWilliam Sandham, UKRavi Sankar, USADan Schonfeld, USALing Shao, UKJohn J. Shynk, USAAndreas Spanias, USA
Srdjan Stankovic, MontenegroYannis Stylianou, GreeceIoan Tabus, FinlandJarmo Henrik Takala, FinlandA. H. Tewfik, USAJitendra Kumar Tugnait, USAVesa Valimaki, FinlandLuc Vandendorpe, BelgiumAri J. Visa, FinlandJar Ferr Yang, Taiwan
Contents
Applications of Heuristics and Metaheuristics in Power Systems, Ruben Romero, Edgar M. C. Franco,and Massoud RashidinejadVolume 2012, Article ID 658507, 2 pages
Transmission Network Expansion Planning Considering Phase-Shifter Transformers, Celso T. Miasaki,Edgar M. C. Franco, and Ruben A. RomeroVolume 2012, Article ID 527258, 10 pages
An Enhanced Genetic Algorithm to Solve the Static and Multistage Transmission Network ExpansionPlanning, Luis A. Gallego, Marcos J. Rider, Marina Lavorato, and Antonio Paldilha-FeltrinVolume 2012, Article ID 781041, 12 pages
Evolutionary Optimization of Electric Power Distribution Using the Dandelion Code, Jorge Sabattin,Carlos Contreras Bolton, Miguel Arias, and Vıctor ParadaVolume 2012, Article ID 738409, 5 pages
Multicriteria Reconfiguration of Distribution Network with Distributed Generation, N. I. Voropai andB. Bat-UndraalVolume 2012, Article ID 317315, 8 pages
Multiobjective Optimization Methods for Congestion Management in Deregulated Power Systems,K. VijayakumarVolume 2012, Article ID 962402, 8 pages
Reliability Evaluation of Distribution Power Systems Based on Artificial Neural Network Techniques,Mohammoud M. Hadow, Ahmed N. Abd Allah, and Sazali P. Abdul karimVolume 2012, Article ID 560541, 5 pages
Hindawi Publishing CorporationJournal of Electrical and Computer EngineeringVolume 2012, Article ID 658507, 2 pagesdoi:10.1155/2012/658507
Editorial
Applications of Heuristics and Metaheuristics in Power Systems
Ruben Romero,1 Edgar M. C. Franco,2 and Massoud Rashidinejad3
1 University of the State of Sao Paulo (UNESP), Ilha Solteira, SP, Brazil2 State University of Western Parana (UNIOESTE), Foz do Iguazu, PR, Brazil3 Shahid Bahonar University of Kerman 76169, Kerman, Iran
Correspondence should be addressed to Ruben Romero, [email protected]
Received 11 March 2012; Accepted 11 March 2012
Copyright © 2012 Ruben Romero et al. This is an open access article distributed under the Creative Commons AttributionLicense, which permits unrestricted use, distribution, and reproduction in any medium, provided the original work is properlycited.
The electricity industry has undergone profound changes inrecent years, resulting in significant changes in economicrelations in the generation, transmission, and distributionsectors. This is also leading to important changes in opera-tions management and planning processes relating to dif-ferent sectors of generation, transmission, distribution, andcommercialization of electricity.
In this context, the optimization techniques for applica-tion in electrical system operation and planning are becom-ing increasingly important, especially with the growth insize and complexity of new mathematical models related tooptimization problems of electric power systems.
In the optimization of operation and planning problemsof electric power systems, optimization techniques used arefrom the field of operations research. These techniques canbe classified into two major groups: (1) exact methods and(2) approximate methods.
Exact methods can be analytical or classical optimizationtechniques. Analytical exact methods have virtually no appli-cation in large and complex problems, and classical opti-mization techniques include the use of optimization tech-niques such as linear programming, nonlinear program-ming, mixed integer linear, and mixed integer nonlinear.
Approximate methods include heuristics and meta-heuristics. It should be noted that the larger and more com-plex the mathematical model of a problem, the more efficientthe metaheuristics when compared with other optimizationtechniques. This special issue presents various optimizationproposals related to the operation and planning of powersystems using heuristics and metaheuristics.
One paper addresses the problem of multicriteria recon-figuration of distribution network with distributed gener-ation according to the criterion of minimum power loss
under normal conditions and the criterion of power supplyreliability under postemergency conditions. In this case anspecialized ant colony algorithm is used to solve the problemfor minimum loss reconfiguration of distribution network.Additionally, some interesting results are presented with datafrom the Central Power System of Mongolia.
Another paper presents a novel mathematical model fortransmission network expansion planning. The main con-tribution is to consider phase shifter as new elements of thetransmission system expansion together with other tradi-tional components such as transmission lines and conven-tional transformers. There are few proposals of this kind inthe specialized literature. It should be noted that the resultsof this kind of expansion planning require lower investmentsince the redistribution of the power flow as a result of thephase shifter allows for better use of the transmission linescapacity.
One of the papers assesses the reliability of distributionsystems using artificial intelligence methods. The paper pre-sents an artificial neural networks (ANNs) version forevaluating the reliability of distribution power systems. Inthis case, ANN is used to predict the reliability of the powersystem using historical data, and the method is constructedaccording to the back-propagation learning rule. At thesame time, the system average interruption frequency index(SAIFI), and the system average interruption duration index(SAIDI) of the real distribution system are computed andcompared with results generated by a network method. Theresults presented are promising.
An evolutionary optimization of electric power distri-bution planning by means of the dandelion code has beenmanifested in one of the papers. In this paper, the problemis solved using a genetic algorithm that, with the help

2 Journal of Electrical and Computer Engineering
of a coding based on the dandelion code permits solvinglarger instances of the problem. Using this optimizationtechnique, the authors can solve large size problems suchas, for example, electrical networks with 4000 buses and 20substations.
One other paper describes a specialized genetic algorithmfor solving the static and multistage transmission networkexpansion planning. In this case, an initial population isgenerated using fast and efficient heuristic algorithms, abetter implementation of the local improvement phase isimplemented, and an efficient solution of linear program-ming problems is proposed. Critical comparative analysis ismade between the proposed genetic algorithm and tradi-tional genetic algorithms. Results using some known systemsshow that the proposed specialized genetic algorithm pre-sents higher efficiency in solving the static and multistagetransmission network expansion planning.
The final paper on this issue presents two multiobjec-tive optimization methods for congestion management inderegulated power systems. The paper proposes two effectivemethods for transmission congestion alleviation in deregu-lated power systems. Congestion or overload in transmissionnetworks is alleviated by rescheduling of generators and/orload shedding. The two objectives that are optimized in thispaper, transmission line overload and congestion cost, areconflicting. Multiobjective fuzzy evolutionary programmingand nondominated sorting genetic algorithm-II methods areused to solve this problem. The quality and usefulness of thealgorithm are tested on the IEEE30 bus system.
Ruben RomeroEdgar M. C. Franco
Massoud Rashidinejad
Hindawi Publishing CorporationJournal of Electrical and Computer EngineeringVolume 2012, Article ID 527258, 10 pagesdoi:10.1155/2012/527258
Research Article
Transmission Network Expansion Planning ConsideringPhase-Shifter Transformers
Celso T. Miasaki,1 Edgar M. C. Franco,2 and Ruben A. Romero3
1 Mathematics Department, FUNEC, Av. Mangara, 477, Santa Fe do Sul, SP 15755-000, Brazil2 Engineering and Applied Sciences Center (CECE), UNIOESTE, Av. Tarquinio Joslin dos Santos 1300, Foz do Iguazu,PR 85870-000, Brazil
3 Electrical Engineering Department (DEE), UNESP, Av. Brasil 1200, Ilha Solteira, SP 15385-000, Brazil
Correspondence should be addressed to Edgar M. C. Franco, [email protected]
Received 3 October 2011; Accepted 16 January 2012
Academic Editor: Massoud Rashidinejad
Copyright © 2012 Celso T. Miasaki et al. This is an open access article distributed under the Creative Commons AttributionLicense, which permits unrestricted use, distribution, and reproduction in any medium, provided the original work is properlycited.
This paper presents a novel mathematical model for the transmission network expansion planning problem. Main idea is toconsider phase-shifter (PS) transformers as a new element of the transmission system expansion together with other traditionalcomponents such as transmission lines and conventional transformers. In this way, PS are added in order to redistribute activepower flows in the system and, consequently, to diminish the total investment costs due to new transmission lines. Proposedmathematical model presents the structure of a mixed-integer nonlinear programming (MINLP) problem and is based on thestandard DC model. In this paper, there is also applied a specialized genetic algorithm aimed at optimizing the allocation ofcandidate components in the network. Results obtained from computational simulations carried out with IEEE-24 bus systemshow an outstanding performance of the proposed methodology and model, indicating the technical viability of using thesenonconventional devices during the planning process.
1. Introduction
Transmission network planning begins with the establish-ment of power demand growth scenarios, in accordance withforecasts along the time. Given these scenarios, one can verifythe eventual need to broaden and to strengthen the network.In case electric service conditions are not satisfied, thereshould be proposed a plan that has coherence among thepower supply availability, demand, and installation of newequipments in the network. Integration of these new equip-ments in the network, aimed at maintaining suitable techni-cal and operating conditions, requires planning of the alloca-tion of such reinforcement.
Main objective of the transmission expansion planning isto obtain the optimal expansion plan, while fulfilling operat-ing and economic constraints.
Formulation of a mathematical representation for thetransmission expansion planning problem begins with someassumptions, where accuracy and complexity are considered
in the model construction. Regularly, the problem is re-presented by a Mixed-Integer Nonlinear Programming(MINLP) problem that presents many local optima solutionsfor real-life systems. This high number is due to the possibleexpansion plans that shows the association of the specifiedoptimal operational mode. Therefore, a basic problemconsists in defining the least-cost expansion alternative thatsatisfies all operating constraints.
In static long-term transmission expansion planning(typically with a planning horizon of more than 5 years),all investments are carried out in a single-year planninghorizon, whereas for the multistage it is divided into severalstages.
Static planning is aimed at searching where and whattype of circuits should be constructed for the network tooperate properly. This type of planning applies some sim-plifications; for instance, voltage magnitudes constraints areneglected, albeit in short-term planning are essential. Voltageand stability problems are not taken into account in this
2 Journal of Electrical and Computer Engineering
approach either. Even though considering these simplifi-cations, the problem still remains complex with unknownoptima solutions for various real-life systems.
In the technical literature, DC and transportation modelsare static mathematical models often used to solve thetransmission expansion planning problem. These modelsconsider only the addition of transmission lines (TLs) andconventional transformers.
Here a novel transmission expansion strategy is pro-posed. An improved model considers the inclusion of a newkind of device, in this case, a flexible alternating currenttransmission system (FACTS) device.
The literature concerning the use of FACTS devices iswide. However, most papers treat only the operational im-provement by using FACTS devices [1–3]. This topic is con-sidered as the operation planning, in which FACTS devicesare used, for example, to redistribute the active power flowin order to eliminate congestion problems and/or to optimizethe power dispatch. In this way, the PS is considered a FACTSdevice with the characteristic of redistributing the activepower flow.
Feasibility of employing the PS as a candidate componentin the long-term transmission expansion planning process isanalyzed regarding a static and centralized planning model.Nevertheless, the present model can be extended to themultistage planning [4], to the competitive planning [5], orto the planning with security constraints [6].
Instead of trying to consider all functions concerning theplanning problem in a single model, this work is focusedsolely on the core of the network synthesis; for whichthe mathematical modeling and the solution technique isaddressed.
The proposed model is based on the DC model, which isthe most employed one in planning problems; consequently,only the active power flow is considered. Other aspects suchas performance analysis (reliability and stability analysis,reactive planning, AC power flow, and short-circuit calcu-lation) relevant to transmission expansion are beyond thescope of this paper. Nonetheless, in general, after obtaininga basic solution, all those analyses can be carried out.
2. Mathematical Model
This section introduces the classical mathematical model andthe proposed one.
2.1. Classical Model. The mathematical formulation of theDC model for transmission network expansion planningproblem, when considering solely the installation of trans-mission lines and/or conventional transformers, assumes thefollowing form:
Minimize v =∑
(i, j)
ci jni j (1)
subject to
S · f + g = d, (2)
fi j − γi j ·(n0i j + ni j
)·(θi − θj
)= 0, (3)
∣∣∣ fi j∣∣∣ ≤
(n0i j + ni j
)· f i j , (4)
0 ≤ gi ≤ gi, (5)
0 ≤ ni j ≤ ni j , (6)
ni j Integer, (7)
fi j Unbounded, (8)
θj Unbounded, (9)
(i, j) ∈ Ω. (10)
The objective function (1) represents the investment costdue to new transmission lines during the specified planninghorizon.
The first set of constraints (2) represents Kirchhoff ’sCurrent Law (KCL) equations (one constraint per bus),and the second one (3) represents Kirchhoff ’s Voltage Law(KVL) (one constraint per branch). In this model, thetransmission lines or regular transformers are representedwithout distinction by decision variables ni j .
Set of constraints (4) refers to the capacity of trans-mission circuits (lines and/or transformers) in terms of therequired absolute value since the power flow can flow in bothways.
Constraint (5) represents the limits for generation busesand (6) represents the limits for the added circuits at eachcandidate path i- j. Remaining constraints refer to the self-characteristics of the variables.
From the operational research standpoint, system (1)–(10) is a MINLP whose resolution is complex, especially forlarge-size electric systems. Main source of complexity in theproblem is due to variables ni j that need to be integer.
For some types of algorithms utilized for the trans-mission network planning problem, it is more suitable tocarry out alterations to the basic modeling for allowingthe application of the solution techniques. An alterationcommonly used is the insertion of new variables thatrepresent the load shedding associated with all load busesof the system. This resource can also be seen as an artificialgeneration aimed at turning the problem always viableduring computational implementations [7]. Note that thisartificial generation, from the mathematical standpoint, issolely an increase in the number of variables of the originalproblem. Additionally, all variables corresponding to theartificial generators in the final solution should be equal tozero, so both problems (original and modified) will haveequivalent solutions.
2.2. Model with Phase Shifters. When PS is considered in thetransmission network planning problem, the DC model as-sumes the following form:
Minimize v =∑
(i, j)
ci jni j +∑
di j ·(n0i j + ni j
)· δi j + α
∑rk
(11)
Journal of Electrical and Computer Engineering 3
subject to
S · f + g + r = d, (12)
fi j − γi j ·(n0i j + ni j
)·(θi − θj + ϕij · δi j
)= 0, (13)
∣∣∣ fi j∣∣∣ ≤
(n0i j + ni j
)· f i j , (14)
0 ≤ gi ≤ gi, (15)
0 ≤ ni j ≤ ni j , (16)
0 ≤ rk j ≤ dk, (17)
ni j Integer, (18)
fi j Unbounded, (19)
θj Unbounded, (20)
ϕij Unbounded, (21)
δi j Unbounded, (22)
(i, j) ∈ Ω. (23)
The objective function (11) corresponds to the invest-ment cost. First two terms refer to the costs due to theinsertion of transmission lines and PS, respectively. Lastterm refers to a penalty for the configuration under analysis,due to the presence of artificial generation. The penaltyparameter α should be properly weighted in order to turnthose configurations less attractive with artificial generation.
In constraint (12), corresponding to KCL, vectors g andr indicate existent and artificial generations, respectively.
Installation of PS in one or more lines can be representedas the combination of the buses’ angles and the anglesupplied by the equipment.
Angle between terminal voltages of a transmission linecan be modified by installing a PS. Therefore, power flowequations (KVL) are affected when these devices are inserted.Thus, the function of PS appears in the KVL, which redirectsthe active power flow.
The PS is considered a component with negligible reac-tance that can be placed in series with a transmission line ora conventional transformer.
In this work, the angular difference of the PS wasconsidered an unbounded variable; however, a limit can beset without modifying the mathematical model significantly.
Presence of variable δi j ∈ {0, 1} in (13) makes this rela-tion even more nonlinear in relation to the DC model and,
m
ykm
k
Figure 1: Transmission line.
m
ykm
k
θk θm
p
θk+ϕ1 : e jϕ
Figure 2: Transmission line and phase-shifter transformer.
Table 1: Lines data of the 3 buses system.
Line Reactance (pu) Maximum flow (MW)
1-2 0.333 35
1–3 0.500 40
2-3 0.500 40
consequently, more complex since four types of variables(ni j , θj , ϕij , and δi j) are multiplied.
Set of constraints (14), (15), (16), and (17) refers to thetransmission capacity of the circuits, limits of generationbuses, limits of circuits added in each candidate path i- j, andlimits of artificial generation buses, respectively. Remainingconstraints refer to the characteristics of variables.
Therefore, the proposed mathematical model is morecomplex than the classical one, due to the characteristics of aPS.
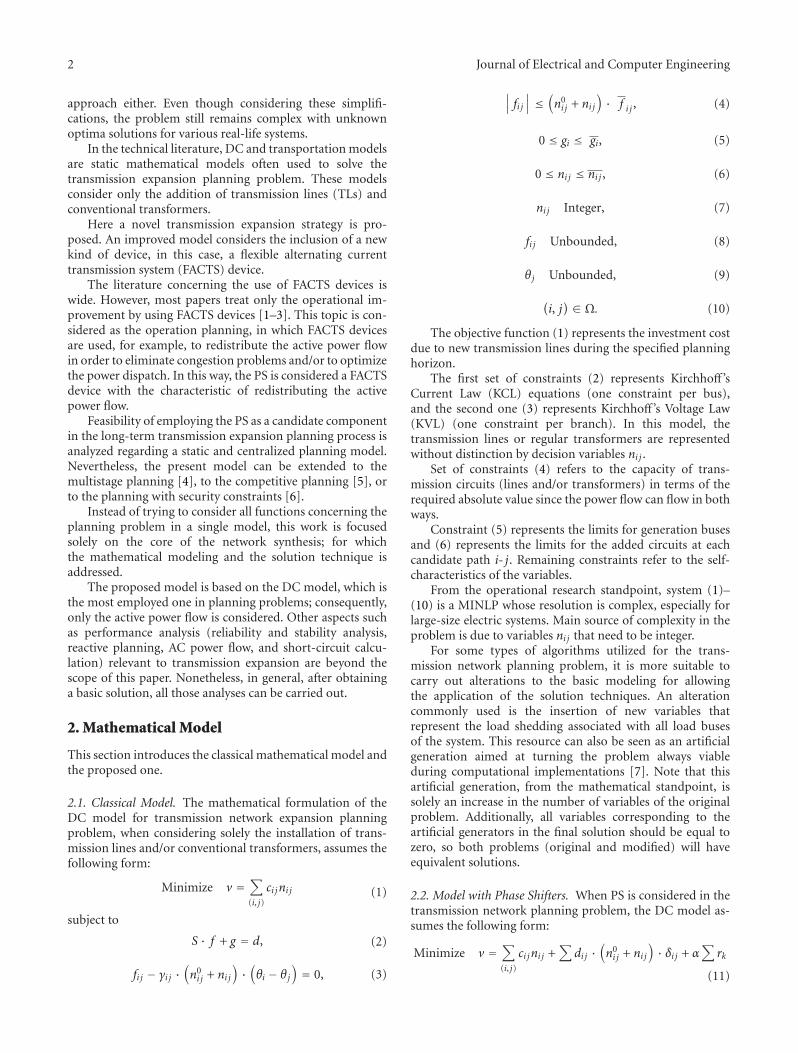
In traditional models, atransmission line or aconvention-al transformer in a path k-m can be represented in Figure 1.
The PS is considered with zero impedance connected inseries with a transmission line or a conventional transformerin path k-m as shown in Figure 2.
It is also considered that when a path k-m is selected, thePS is allocated to every transmission line present in path k-m.Therefore, the number of PS at each selected path is equalto nPSi j = (n0
i j + ni j) · δi j . The PS can be allocated inexisting transmission lines as well as in those created duringthe optimization process.
Problem (11)–(23) represents a MINLP, which is morecomplex than the model (1)–(10). However, metaheuristictechniques employed for (1)–(10) can also be applied to(11)–(23) after performing some modifications.
2.3. Illustrative Example: 3-Bus System. An example consist-ing of a network with three buses is presented in order toillustrate the application of the PS. System data is shown inTables 1 and 2.
Results obtained by performing the linearized DC powerflow are illustrated in Figure 3.

4 Journal of Electrical and Computer Engineering
Table 2: Generation and demand data of the 3-buse system.
Bus Generation (MW) Demand (MW)
1 70 0
2 0 60
3 0 10
351 2
3
66.25 MW 3.75 MW
60 MW
10 MW
θ1 = 1.05
θ3 = 0.425
θ2 = 0
γ12
21.2531.25
γ13 γ23
Figure 3: Three-bus system.
Notice that there is a load shedding of r2 = 3.75 MWat bus 2. Therefore the system is not operating adequatelyand new transmission lines are required. On the other hand,lines 1–3 and 2-3 are operating below their capacity. In thiscase, there is no possibility of increasing the transmittedpower through the lines without overloading line 1-2. Aninteresting solution for this problem is to install a PS at 1–3(see Figure 4), so the system operates without load shedding.
Thus, this example shows how a PS is able to redirectthe active power flow. This property will be employed inthe long-term transmission planning, in which basic compo-nents are transmission lines, conventional transformers, andPS.
2.4. Phase-Shifter Transformer Features. PSs have the abilityto redirect active power flows in the network. This featureprovides a dynamic operational mode since it makes increas-ing the utilization of existing circuits possible. Consequently,as it can be verified from relation (13), the PS acts directly onKVL.
Another important aspect is the use of relaxed models. Ingeneral, optimal solutions for relaxed models are not feasiblefor more accurate or constrained ones. Thus, it is probablethat the optimal solution obtained by the transportationmodel, where the KVL (13) is relaxed (dropped), presentsthe KVL constraints violated in the DC model. With theinclusion of PS in determined positions, a feasible solutionobtained with transportation model becomes also feasible forthe DC model since the KCL constraints are already satisfiedfor both models. However, an efficient inclusion should becarried out in order to satisfy the optimality conditions of theDC model, once there exist expansion proposals with lowercosts. It is worthwhile to notice that if PS costs are equal tozero, then the optimal solution for the transportation modeland the DC model presents the same added lines, that is,presents the same topology for both mathematical models.Only difference with the conventional approach is that somePS are included in order to satisfy the KVL.
35
2535
1 2
3
60 MWθ2 = 0
θ3 = 0.5
10 MW
70 MW
θ1 = 1.05 = 1.2
γ12
γ13 γ23ϕ13
Figure 4: Load flow solution with a phase shifter.
The primary objective of this work is to verify theoperation of PS and the technical feasibility of consideringsuch type of equipment in long-term transmission expansionplanning. In case a reduced-cost PS is employed, the optimalsolution will be the same of the transportation model withaddition of PS. On the other hand, higher costs will inhibitthe presence of PS in the optimal solution, tending to thesolution given by classical DC model. Finally, if the costs arecompetitive to transmission lines, an intermediary solutionwill be provided.
3. Solution Mathodology
Metaheuristic algorithms are specially suited for problemsthat present large search space with many local optima,such as the transmission expansion planning problem. Thenonlinearity of the problem concerning the KVL is higherthan the conventional model, thus degenerating even morethe performance of more accurate methods. For instance,simulated annealing, genetic algorithms, and tabu searchrepresent efficient methods for solving such problems. Thiswork employed a modified version of the genetic algorithmpresented in [4, 8] for solving the mathematical optimizationproblem. Indeed, extra modifications become necessary inorder to guarantee the acceptable performance of the geneticalgorithm.
4. Genetic Algorithm
This section presents the genetic algorithm developed for theplanning problem considering the addition of PS.
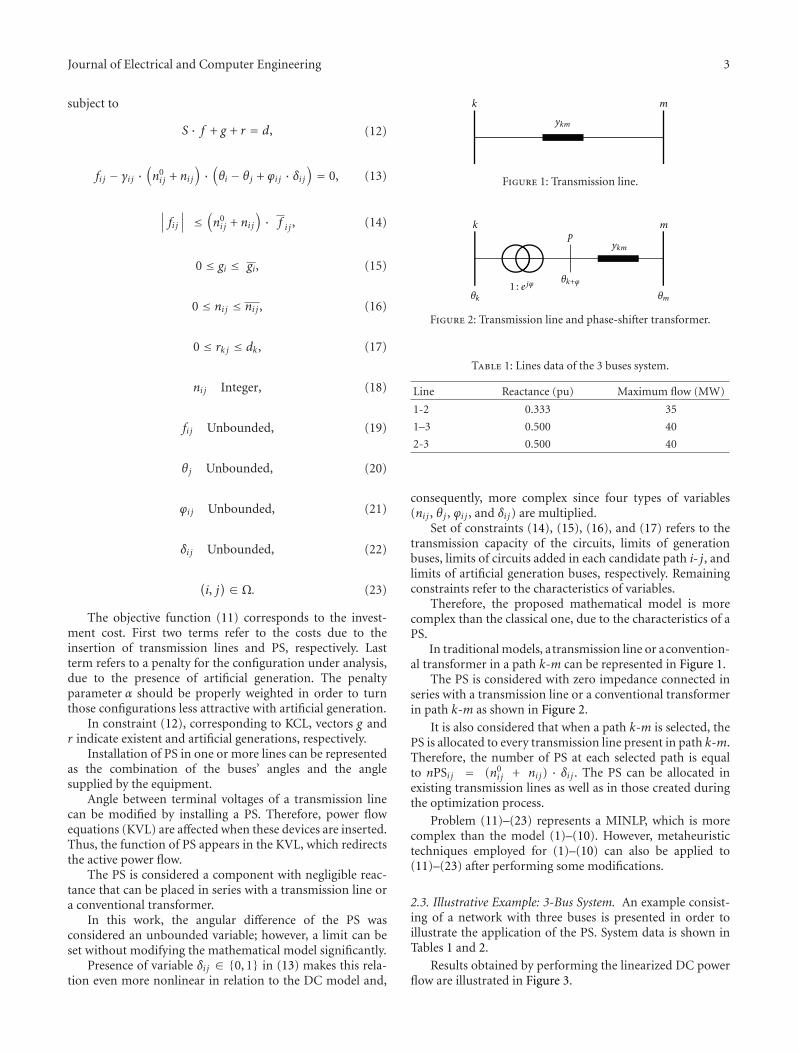
4.1. Encoding. Each individual in a population (chromo-some) is a proposed solution for the problem. In this work,an individual is encoded considering only the integer andbinary variables. Remaining variables (continuous variables)are obtained from the linear programming (LP) solution.Thus, transmission lines and transformers are representedby decimal encoding (variable ni j), whereas the PSs arerepresented by binary variables (δi j).
An example of this chromosome of length 2nl is shownin Figure 5. The first nl positions show the number oftransmission lines added for each configuration and the lastnl positions indicate whether a PS was added or not in eachpath. The existing transmission lines are not coded but they
Journal of Electrical and Computer Engineering 5
0 2 1 3 0 0 1 1 0 0
1 2 3 4 1 2 3 4
Transmission lines Phase-shifter transformers
nl nl
nlnl
· · · · · ·
Figure 5: Encoding proposal (chromosome).
are taken into account when operational variables are calcu-lated, as well as when PSs are added in series to the trans-mission lines at each path. It can be noticed that in path2, two transmission lines have been added with the corre-sponding PS. In path 3, one transmission line and thenecessary number of PSs have been added, and so on.
In [8], an excellent performance of the genetic algorithmwas obtained with the coding above, which is also inaccordance with the coding proposals suggested for geneticalgorithms presented in [4, 9, 10].
4.2. Objective Function and Infeasibility. The objective func-tion of any solution proposal is found by solving anLP problem. The LP determines the exact values of theoperational variables, which makes verifying the operationfeasibility of a determined investment proposal possible,that is, whether the system presents load shedding tothe implemented expansion proposal. Considering that aninvestment proposal s is characterized by variables nsi j andδsi j , the load shedding is obtained by solving the following LPproblem:
Minimize ws =∑
k ∈ Γ
rk (24)
subject to
S · f + g + r = d, (25)
fi j − γi j ·(n0i j + nsi j
)·(θi − θj + ϕij · δsi j
)= 0, (26)
∣∣∣ fi j∣∣∣ ≤
(n0i j + nsi j
)· f i j , (27)
0 ≤ gi ≤ gi, (28)
0 ≤ rk ≤ dk, (29)
fi j Unbounded, (30)
θj Unbounded, (31)
ϕij Unbounded, (32)
(i, j) ∈ Ω. (33)
0 2 1 3 0 0 1 1 0 0
1 2 3 4 1 2 3 4
1 0 1 0 2 1 0 0 0 0
Crossoverpoint
nl
· · ·nl
· · ·
· · · · · ·
0 2 1 0 0 0 1 1 0 0
1 0 1 3 0 1 0 1 0 0
Transmission lines Phase-shifter transformers
nl nl
· · ·· · ·
· · · · · ·
(b) After crossover
(a) Before crossover
Figure 6: Single point crossover.
For each solution proposal, the objective function iscalculated with the following expression:
vs =∑
(i, j) ∈ Ω
ci jnsi j +
∑di j ·
(n0i j + nsi j
)· δsi j + α ·ws. (34)
In the genetic algorithm, every solution proposal isconsidered, including the infeasible ones. The infeasibleconfigurations (with load shedding) are eliminated graduallyby selection process, since these configurations are penalizedby parameter α in the objective function.
4.3. Selection Process. The selection is based on tournamentwith k = 2, that is, a game where two topologies of thecurrent population participate. Recent publications showthat selection by tournament is the most efficient method aslong as parameter k is set adequately.
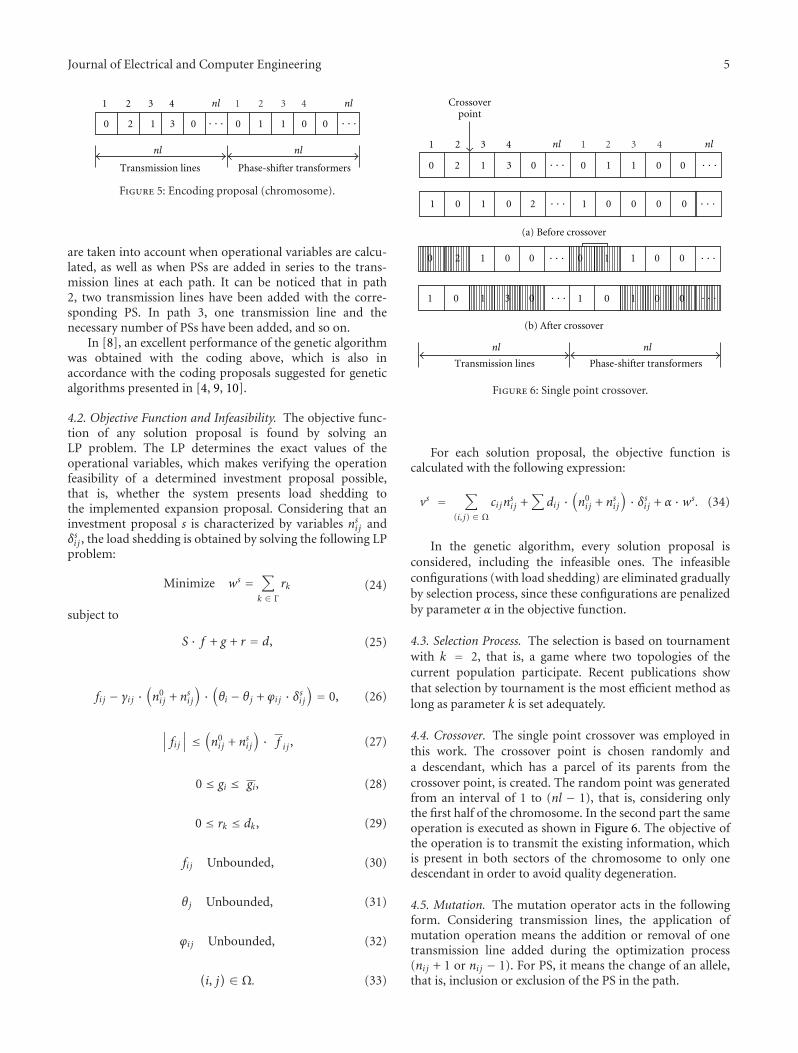
4.4. Crossover. The single point crossover was employed inthis work. The crossover point is chosen randomly anda descendant, which has a parcel of its parents from thecrossover point, is created. The random point was generatedfrom an interval of 1 to (nl − 1), that is, considering onlythe first half of the chromosome. In the second part the sameoperation is executed as shown in Figure 6. The objective ofthe operation is to transmit the existing information, whichis present in both sectors of the chromosome to only onedescendant in order to avoid quality degeneration.
4.5. Mutation. The mutation operator acts in the followingform. Considering transmission lines, the application ofmutation operation means the addition or removal of onetransmission line added during the optimization process(ni j + 1 or ni j − 1). For PS, it means the change of an allele,that is, inclusion or exclusion of the PS in the path.

6 Journal of Electrical and Computer Engineering
0 2 1 0 2 0 1 0 0 0
1 2 3 4 1 23
4
1 0 1 3 0 1 0 1 0 0
0 2 1 0 2 0 1 1 0 0
0 0 1 3 0 0 0 1 0 0
Mutation point
nl
· · ·
· · ·
· · ·
· · ·· · ·
· · ·
· · ·
· · ·nl
nl nl
Transmission lines Phase-shifter transformers
(a) Before mutation
(b) After mutation
Figure 7: Mutation.
The mutation operation should be executed respectingthe following conditions:
(1) the maximum number of transmission lines in thepath;
(2) before adding a PS in the selected path, the existenceof a transmission line must be checked; if it is anempty path, a transmission line has also to be added;
(3) when a transmission line is removed, the correspond-ing PS is removed, in case it exists.
Concluding, a PS can only be inserted to an existing trans-mission line, whereas the number of PS is equal to thenumber of transmission lines in a branch. In Figure 7, twocases of mutation are presented. The first case shows therandom addition of PS to an existing transmission line, andthe second case, mutation is applied to the transmission linethat is removed (in this case there is no transmission line inthe base topology); then the PS is removed in order to keepthe process coherent.
4.6. Proposed Genetic Algorithm. The general structure of theimplemented genetic algorithm is similar to that presentedin [8], except for some modifications. The basic structure ofthe algorithm is the following.
(1) Set the control parameters and generate the initialpopulation. Make the initial population the currentpopulation.
(2) Calculate the objective function of the current popu-lation by solving one LP for each element (topology)of the current population. Update the incumbentsolution whenever possible.
(3) If the stopping criterion is satisfied, stop the process.Otherwise go to step 4.
(4) Execute selection by tournament with k = {2; 3}.(5) Execute one point crossover.
(6) Implement specialized mutation.
(7) Form the current population and go to step 2.
Some details of the algorithm are presented in the next sec-tion.
4.7. Details and Improvement of the Genetic Algorithm.We present, briefly, details of the algorithm and someimprovements made to the genetic algorithm.
4.7.1. Generation of the Initial Population. Generation of theinitial population is made by a controlled random process.Basically, it defines the number of paths in which thetransmission lines are added and the maximum numberof PS. Regarding transmission lines are defined randomlynumber of branches where the lines are inserted, position,and number of transmission lines (subject to the limits ofadded lines). In the case of PS, the number of branches andthe position are selected randomly. In general, experience intransmission planning indicates that the number of branchesto be added should be small, whereas the number for PSshould be even smaller.
The performance coefficient (35) can be employed forranking the most interesting transmission lines. Observe thatlines with a larger capacity that is also cost-effective have thepriority in the addition:
PCi j =fi jγi jci j
. (35)
After ranked, the circuits are separated into two groupswith different size (75%, 25%), whereas the largest onepresents the most interesting transmission lines in terms ofcapacity usage. The initial population is formed by 80% upto 100% of elements belonging to the largest group. Anotheroption to the initial population generation is to employconstructive heuristic algorithms as in [11, 12].
4.7.2. Control Parameters: Crossover and Mutation Rates. Theemployed crossover rate was RC = 0.8. Two mutation rateswere employed: RM = 0.1 or RM = 0.6 (the value depends onthe current population diversification level). The mutationrate is defined differently from the classical concept andit applies for an entire solution proposal (topology). Forexample, a rate of 0.1 means that there is 10% of probabilityfor a topology to suffer mutation. The population size variedfrom 40 to 200 elements.
4.7.3. Mutation Details. Mutation is executed in the follow-ing way: the power flow of each topology is stored in fourmatrices considering the load level of each circuit. They areseparated in intervals of 25, 50, 75, and 100% of capacity. Theload level is calculated by means of the relationship (36):
FCi j =fi j(
n0i j + ni j
)· fi j
. (36)
Mutation operation is executed based on the probabilityof 70% of circuit removal and 30% of circuit addition. In case
Journal of Electrical and Computer Engineering 7
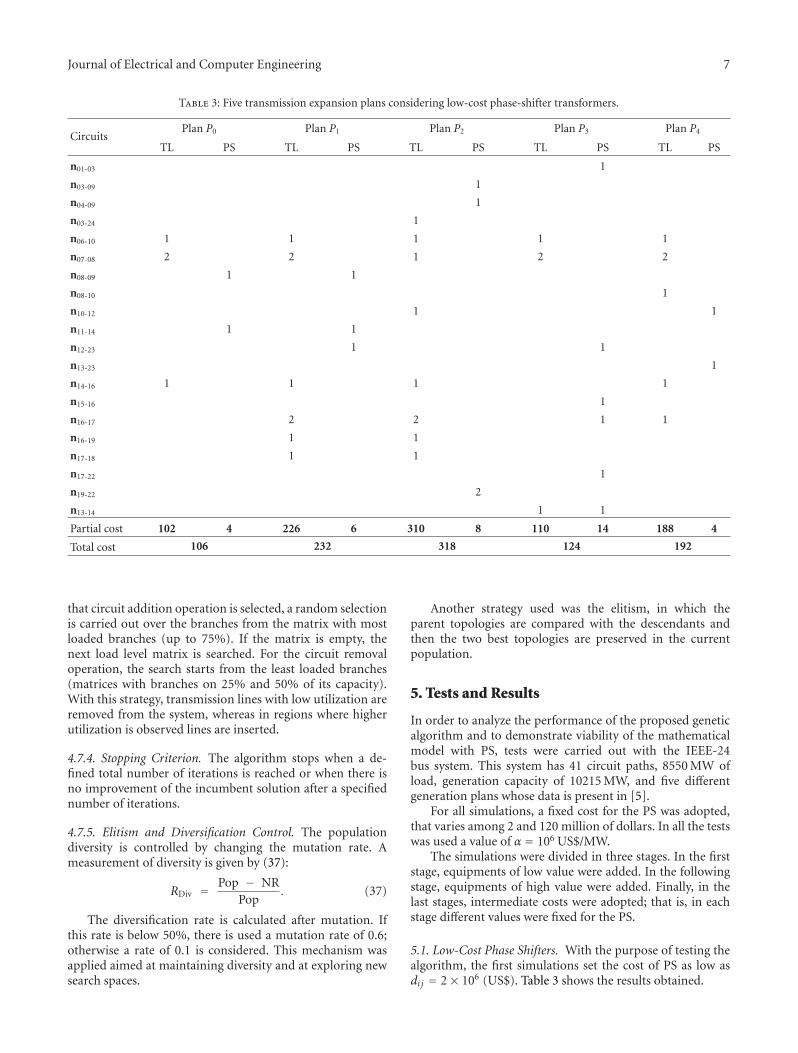
Table 3: Five transmission expansion plans considering low-cost phase-shifter transformers.
CircuitsPlan P0 Plan P1 Plan P2 Plan P3 Plan P4
TL PS TL PS TL PS TL PS TL PS
n01-03 1
n03-09 1
n04-09 1
n03-24 1
n06-10 1 1 1 1 1
n07-08 2 2 1 2 2
n08-09 1 1
n08-10 1
n10-12 1 1
n11-14 1 1
n12-23 1 1
n13-23 1
n14-16 1 1 1 1
n15-16 1
n16-17 2 2 1 1
n16-19 1 1
n17-18 1 1
n17-22 1
n19-22 2
n13-14 1 1
Partial cost 102 4 226 6 310 8 110 14 188 4
Total cost 106 232 318 124 192
that circuit addition operation is selected, a random selectionis carried out over the branches from the matrix with mostloaded branches (up to 75%). If the matrix is empty, thenext load level matrix is searched. For the circuit removaloperation, the search starts from the least loaded branches(matrices with branches on 25% and 50% of its capacity).With this strategy, transmission lines with low utilization areremoved from the system, whereas in regions where higherutilization is observed lines are inserted.
4.7.4. Stopping Criterion. The algorithm stops when a de-fined total number of iterations is reached or when there isno improvement of the incumbent solution after a specifiednumber of iterations.
4.7.5. Elitism and Diversification Control. The populationdiversity is controlled by changing the mutation rate. Ameasurement of diversity is given by (37):
RDiv = Pop − NRPop
. (37)
The diversification rate is calculated after mutation. Ifthis rate is below 50%, there is used a mutation rate of 0.6;otherwise a rate of 0.1 is considered. This mechanism wasapplied aimed at maintaining diversity and at exploring newsearch spaces.
Another strategy used was the elitism, in which theparent topologies are compared with the descendants andthen the two best topologies are preserved in the currentpopulation.
5. Tests and Results
In order to analyze the performance of the proposed geneticalgorithm and to demonstrate viability of the mathematicalmodel with PS, tests were carried out with the IEEE-24bus system. This system has 41 circuit paths, 8550 MW ofload, generation capacity of 10215 MW, and five differentgeneration plans whose data is present in [5].
For all simulations, a fixed cost for the PS was adopted,that varies among 2 and 120 million of dollars. In all the testswas used a value of α = 106 US$/MW.
The simulations were divided in three stages. In the firststage, equipments of low value were added. In the followingstage, equipments of high value were added. Finally, in thelast stages, intermediate costs were adopted; that is, in eachstage different values were fixed for the PS.
5.1. Low-Cost Phase Shifters. With the purpose of testing thealgorithm, the first simulations set the cost of PS as low asdi j = 2× 10⁶ (US$). Table 3 shows the results obtained.
8 Journal of Electrical and Computer Engineering
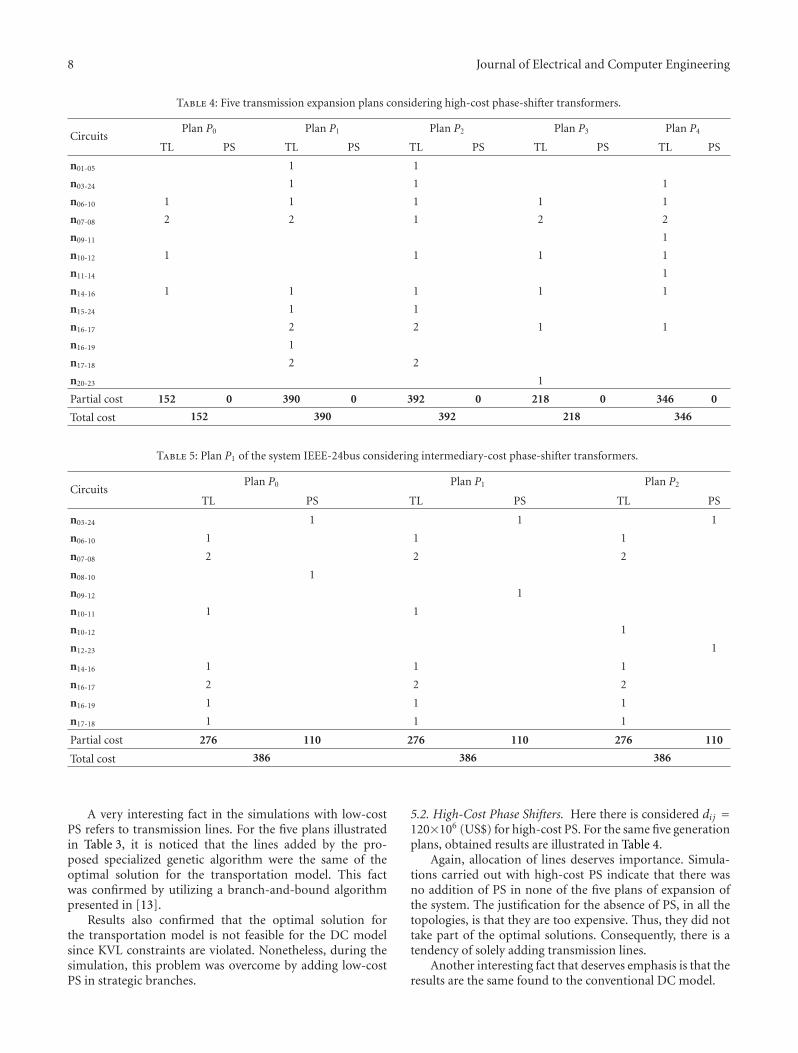
Table 4: Five transmission expansion plans considering high-cost phase-shifter transformers.
CircuitsPlan P0 Plan P1 Plan P2 Plan P3 Plan P4
TL PS TL PS TL PS TL PS TL PS
n01-05 1 1
n03-24 1 1 1
n06-10 1 1 1 1 1
n07-08 2 2 1 2 2
n09-11 1
n10-12 1 1 1 1
n11-14 1
n14-16 1 1 1 1 1
n15-24 1 1
n16-17 2 2 1 1
n16-19 1
n17-18 2 2
n20-23 1
Partial cost 152 0 390 0 392 0 218 0 346 0
Total cost 152 390 392 218 346
Table 5: Plan P1 of the system IEEE-24bus considering intermediary-cost phase-shifter transformers.
CircuitsPlan P0 Plan P1 Plan P2
TL PS TL PS TL PS
n03-24 1 1 1
n06-10 1 1 1
n07-08 2 2 2
n08-10 1
n09-12 1
n10-11 1 1
n10-12 1
n12-23 1
n14-16 1 1 1
n16-17 2 2 2
n16-19 1 1 1
n17-18 1 1 1
Partial cost 276 110 276 110 276 110
Total cost 386 386 386
A very interesting fact in the simulations with low-costPS refers to transmission lines. For the five plans illustratedin Table 3, it is noticed that the lines added by the pro-posed specialized genetic algorithm were the same of theoptimal solution for the transportation model. This factwas confirmed by utilizing a branch-and-bound algorithmpresented in [13].
Results also confirmed that the optimal solution forthe transportation model is not feasible for the DC modelsince KVL constraints are violated. Nonetheless, during thesimulation, this problem was overcome by adding low-costPS in strategic branches.
5.2. High-Cost Phase Shifters. Here there is considered di j =120×106 (US$) for high-cost PS. For the same five generationplans, obtained results are illustrated in Table 4.
Again, allocation of lines deserves importance. Simula-tions carried out with high-cost PS indicate that there wasno addition of PS in none of the five plans of expansion ofthe system. The justification for the absence of PS, in all thetopologies, is that they are too expensive. Thus, they did nottake part of the optimal solutions. Consequently, there is atendency of solely adding transmission lines.
Another interesting fact that deserves emphasis is that theresults are the same found to the conventional DC model.
Journal of Electrical and Computer Engineering 9
5.3. Intermediary-Cost Phase Shifters. PSs with arbitrary in-termediary costs were employed in order to produce expan-sion proposals with intermediary values when compared toextreme solutions obtained in previous simulations. The PSwas considered with cost of di j = 55 × 106 (US$) for everybranch in plan P1. Obtained results are shown in Table 5.
The proposed algorithm found alternative optimal solu-tions for the plan P1. Observe that circuit 10-11, which is notpresent in the previous cases (PS with low and high costs),appears now. Notice that in the three topologies found forthe plan P1 were added two phase-shifter transformers in thenetwork.
It is important to mention that all tests have been carriedout for PS with nonrealistic cost values in order to test,from the theoretical point of view, the feasibility of modelingsuch devices as expansion components for electrical systems.Additional network transmission planning bibliography canbe found in [14]. It should be observed that this novelmodel could be solved by other metaheuristics as presentedin [9, 15, 16] after small adaptations.
6. Conclusions
Nowadays, modern elements, such as FACTS devices, areplaying an important role in transmission systems. Inthis way, inclusion of such devices jointly with classicalcomponents is of importance for the transmission expansionplanning problem. Thus, this work was aimed at present-ing the technical feasibility of considering phase-shiftertransformers as components for the long-term transmissionexpansion planning, jointly with conventional transformersand transmission lines.
A novel methodology was proposed for the inclusion ofphase-shifter transformers in the mathematical model thatrepresents the transmission planning problem. The proposedmodel is more complex than the model DC. However, themathematical problem was solved adequately with geneticalgorithms.
Tests have shown the model consistency as well as thehigh performance of the algorithm.
This contribution extends the utilization of classical com-ponents during the expansion-planning problem, to modernelements, such as the FACTS devices.
Nomenclature
v: Investment costs (US$)ci j : Cost of a circuit that can be added in path i- j
(US$)ni j : Number of circuits added in path i- jS: Node-branch transposed incidence matrix of
the systemf : Active power flow composed by elements fi jg: Generation composed by elements gkd: Demand of the busesfi j : Total active power flow through path i- jγi j : Susceptance of one circuit in path i- jnoi j : Base case total number of circuits
θi: Phase angle of bus ifi j : Active power flow limit of one circuit in path
i- jgi: Generation level of bus igi: Generation capacity limit of bus ini j : Number of circuits that can be added in path
i- jΩ: Set of all pathsdi j : Fixed cost of a PS in path i- jδi j : Represents the presence (1) or not (0) of a PS in
path i- jα: Penalty factor due to load sheddingrk: Artificial generator at load bus kΓ: Set of buses with loadϕij : Angular difference of a PS in path i- jnPSi j : Number of PS added in path i- jnl: Total number of paths in the networknsi j : Number of the circuits added in path i- j,
considering an investment proposal s given bythe specialized genetic algorithm
δsi j : Represents the presence (1) or not (0) of a PS inpath i- j, considering an investment proposal sgiven by the specialized genetic algorithm
ws: Load shedding costs of a configuration (US$)PCi j : Performance coefficient of one transmission
line in path i- jRC : Crossover rateRM : Mutation rateFCi j : Flow utilization coefficient of one transmission
line in path i- jRDiv: Population diversification ratio (%)NR: Total number of repeated configurations in the
current populationPop: Total number of configurations of the
population.
Acknowledgments
This work was supported by CAPES, CNPq, and FundacaoAraucaria.
References
[1] P. Paterni, S. Vitet, M. Bena, and A. Yokoyama, “Optimallocation of phase shifters in the french network by geneticalgorithm,” IEEE Transactions on Power Systems, vol. 14, no.1, pp. 37–42, 1999.
[2] G. N. Taranto, L. M. V. G. Pinto, and M. Veiga Ferraz Pereira,“Representation of FACTS devices in power system economicdispatch,” IEEE Transactions on Power Systems, vol. 7, no. 2, pp.572–576, 1992.
[3] S. Gerbex, R. Cherkaoui, and A. J. Germond, “Optimal loca-tion of multi-type FACTS devices in a power system by meansof genetic algorithms,” IEEE Transactions on Power Systems,vol. 16, no. 3, pp. 537–544, 2001.
[4] A. H. Escobar, R. A. Gallego, and R. Romero, “Multistageand coordinated planning of the expansion of transmissionsystems,” IEEE Transactions on Power Systems, vol. 19, no. 2,pp. 735–744, 2004.
10 Journal of Electrical and Computer Engineering
[5] R. Fang and D. J. Hill, “A new strategy for transmission expan-sion in competitive electricity markets,” IEEE Transactions onPower Systems, vol. 18, no. 1, pp. 374–380, 2003.
[6] A. Seifu, S. J. Salon, and G. F. List, “Optimization of trans-mission line planning including security constraints,” IEEETransactions on Power Systems, vol. 4, no. 4, pp. 1507–1513,1989.
[7] S. Binato, M. V. F. Pereira, and S. Granville, “A new Bendersdecomposition approach to solve power transmission networkdesign problems,” IEEE Transactions on Power Systems, vol. 16,no. 2, pp. 235–240, 2001.
[8] R. A. Gallego, A. Monticelli, and R. Romero, “Transmisionsystem expansion planning by an extended genetic algorithm,”IEE Proceedings Generation, Transmission and Distribution,vol. 145, no. 3, pp. 329–335, 1998.
[9] E. L. D. Silva, H. A. Gil, and J. M. Areiza, “Transmission net-work expansion planning under an improved genetic algo-rithm,” IEEE Transactions on Power Systems, vol. 15, no. 3, pp.1168–1175, 2000.
[10] P. C. Chu and J. E. Beasley, “A genetic algorithm for thegeneralised assignment problem,” Computers and OperationsResearch, vol. 24, no. 1, pp. 17–23, 1997.
[11] R. Villasana, L. L. Garver, and S. J. Salon, “Transmission net-work planning using linear programming,” IEEE transactionson power apparatus and systems, vol. 104, no. 2, pp. 349–356,1985.
[12] GARVER LL, “Transmission network estimation using linearprogramming,” IEEE Trans Power App Syst, vol. 89, no. 7, pp.1688–1697, 1970.
[13] S. Haffner, A. Monticelli, A. Garcia, and R. Romero, “Spe-cialised branch-and-bound algorithm for transmission net-work expansion planning,” IEE Proceedings Generation, Trans-mission and Distribution, vol. 148, no. 5, pp. 482–488, 2001.
[14] G. Latorre, R. D. Cruz, J. M. Areiza, and A. Villegas, “Clas-sification of publications and models on transmission expan-sion planning,” IEEE Transactions on Power Systems, vol. 18,no. 2, pp. 938–946, 2003.
[15] E. L. da Silva, J. M. A. Ortiz, G. C. de Oliveira, and S. Binato,“Transmission network expansion planning under a TabuSearch approach,” IEEE Transactions on Power Systems, vol. 16,no. 1, pp. 62–68, 2001.
[16] H. Faria Jr, S. Binato, M. G. C. Resende, and D. M. Falcao,“Power transmission network design by greedy randomizedadaptive path relinking,” IEEE Transactions on Power Systems,vol. 20, no. 1, pp. 43–49, 2005.
Hindawi Publishing CorporationJournal of Electrical and Computer EngineeringVolume 2012, Article ID 781041, 12 pagesdoi:10.1155/2012/781041
Research Article
An Enhanced Genetic Algorithm to Solve the Static andMultistage Transmission Network Expansion Planning
Luis A. Gallego, Marcos J. Rider, Marina Lavorato, and Antonio Paldilha-Feltrin
Departamento de Engenharia Eletrica, Faculdade de Engenharia de Ilha Solteira, Universidade Estadual Paulista“Julio de Mesquita Filho” (UNESP) Avenida Brasil 56, 15385-000 Ilha Solteira, SP, Brazil
Correspondence should be addressed to Luis A. Gallego, [email protected]
Received 10 October 2011; Accepted 18 November 2011
Academic Editor: Edgar Carreno
Copyright © 2012 Luis A. Gallego et al. This is an open access article distributed under the Creative Commons Attribution License,which permits unrestricted use, distribution, and reproduction in any medium, provided the original work is properly cited.
An enhanced genetic algorithm (EGA) is applied to solve the long-term transmission expansion planning (LTTEP) problem. Thefollowing characteristics of the proposed EGA to solve the static and multistage LTTEP problem are presented, (1) generationof an initial population using fast, efficient heuristic algorithms, (2) better implementation of the local improvement phase and(3) efficient solution of linear programming problems (LPs). Critical comparative analysis is made between the proposed geneticalgorithm and traditional genetic algorithms. Results using some known systems show that the proposed EGA presented higherefficiency in solving the static and multistage LTTEP problem, solving a smaller number of linear programming problems to findthe optimal solutions and thus finding a better solution to the multistage LTTEP problem.
1. Introduction
1.1. Metaheuristics. Metaheuristics present a common basicstrategy in the search process for an optimal solution to acomplex problem. The metaheuristic search process takesplace through the use of transitions in the search space.This search process can be carried out from one single pointor from a group of points from the search space [1]. Thetransition process throughout the search space is carried outaccording to the particular strategy of each metaheuristic. Inthis context, the neighborhood concept is fundamental. Thetransition in the search space is carried out from the presentpoint (solution) to the neighbor that is considered moreinteresting by the given metaheuristic strategy. However, inthe outcome of a metaheuristic, the definition of the size andshape of the present solution is fundamental.
To solve a problem using metaheuristics, a group ofnecessary decisions must be taken in order to adequatelycharacterize a problem. The main choices are the following:(1) a codification proposal, (2) a form of evaluating thequality of the solution proposed (objective function, fitness,etc.), (3) the decision of whether to carry out transitionsthrough only feasible solutions or also through the unfeasiblesolutions, and (4) the choice of the neighborhood. In this
context, each metaheuristic adds only the search strategy thatshould be adopted and the stop criterion.
The codification is a way to unambiguously specify asolution proposal or, in other words, to identify an elementof the search space of the problem. The elements of thecodification vector are not always related to the decisionvariables of the problem, and it must also be observed thatmany problems do not have mathematical modeling. There-fore, there are many ways of coding a problem: the chosencodification can be fundamental in the outcome of themetaheuristic. Each coding solution proposal must allow theobjective function of the problem or an equivalent one to befound in a simple and clear manner.
The transitions in the search space are usually carried outonly through feasible solutions (neighborhoods with manyfeasible elements). This kind of case occurs in most of theoptimization problems in the operation of electric powersystems. On the other hand, there are problems for whichfeasible solutions can be difficult to find (all of the chosenneighborhoods involve only unfeasible solutions) and, in thiscase, the best proposal consists of carrying out transitionsthrough feasible and unfeasible solutions. This type of caseoccurs in some electric power system operation problems
2 Journal of Electrical and Computer Engineering
and in practically all power system expansion planningproblems.
1.2. The Transmission Network Expansion Planning Problem.The objective of the transmission network expansion plan-ning (TNEP) is to find the transmission network that mustbe built in order to meet the demand growth consideredin a long-term scenario, minimizing investment costs andproviding electric energy to all system consumers. Then, asolution to a planning problem specifies where, how many,and when new equipment must be installed in an electricsystem, so that it operates adequately within a specifiedplanning horizon. The TNEP problem can be approachedfrom either static or multistage point of view. In the firstcase, only the quantity and location of the new elementsof the network are determined. In the second case, besidesthe quantity and location, the timing for building the newreinforcements in the network is taken into account.
The mathematical model of the TNEP corresponds to amixed integer nonlinear programming problem. This is dueto the fact that such model includes nonlinear functions,as well as integer and real variables. Furthermore, theTNEP problem presents a high combinatorial explosion,generated by the number of alternatives that can be explored.Transmission systems are usually of great size; consequently,we are dealing with a problem of difficult solution and greatmathematical complexity. There are several methodologiesproposed in the specialized literature to solve the TNEPproblem. Initially, in [2] Garver proposes a linear power flowestimation method to efficiently determine a preliminarynetwork that can be used to determine the optimal network.In [3–5] constructive heuristic algorithms have been usedto solve the TNEP problem. Mathematical models basedon classical optimization techniques, such the Benders’decomposition [6–8] and branch and bound methods [9,10], have also been used to solve the TNEP problem.Intelligent metaheuristic algorithms such as (1) simulatedannealing, (2) tabu search, (3) genetic algorithms, and (4)harmony search algorithm have been proposed in [11–14],respectively, to solve the TNEP problem. The metaheuristicsare methodology that solves combinatorial optimizationproblems with excellent solutions and low computationalcost, especially for medium and large problems. Also, themetaheuristics are more robust in terms of processing timeand find better solutions than the other classical opti-mization methods, such as the Benders decomposition andbranch and bound methods. Thus, for example, while ana-lyzing a huge and complex problem for the relaxed modelcalled transportation, in [9], it was verified that the Ben-ders decomposition algorithm presents great difficulty inconvergence and the branch and bound algorithm findsquality solutions but does not converge due to the prohibitiveprocessing time. However, the metaheuristics present thebest solution for the dc model with acceptable processingtime [13].
Several methodologies have been developed to includeconcepts of security and reliability in the TNEP problem. In[15] a mathematical model and a methodology are presentedto solve the TNEP problem considering the (n − 1) security
criterion. In [5, 14] a probabilistic reliability criterion is usedto solve the same problem. The TNEP problem has beenincorporated in an electricity market environment in [16–18]. The AC load flow model has been used in [19, 20]to consider the active and reactive power planning at thesame time. The TNEP using AC model can be solved usinga metaheuristic as shown in [19]. In this case, to determinethe unfeasibility of the investment proposal, a nonlinearprogramming problem (instead of a linear programmingproblem one) is solved. In this way, the nonlinear pro-gramming problem (NLP) problem consumes most of theprocessing time of the metaheuristic. To solve the NLPproblem, an efficient and robust algorithm necessary.
A robust metaheuristic is presented in this paper to solvethe TEP problem. The metaheuristic proposed is a modifi-cation of the proposal presented by Chu and Beasley [21]for the generalized assignment problem, a multiconstrainedproblem that presents very similar characteristics to the TEPproblem. The Chu-Beasley algorithm can be considered amodified genetic algorithm but is significantly different fromthe traditional genetic algorithm and other modified versionsthat can be found in the specialized literature. Therefore, ourproposal is compared to the original Chu-Beasley proposaland to a traditional genetic algorithm.
1.3. Contributions. The main contributions of this paper arethreefold.
(1) An enhanced genetic algorithm to efficiently solvethe static and multistage TNEP problem. The pro-posed algorithm found, in some test systems, bettersolutions than the ones reported in the specializedliterature.
(2) A critical comparative analysis between the proposedgenetic algorithm and traditional genetic algorithms.
(3) An efficient solution of the operative problems in theTEP problem (linear programming problems).
This paper is a natural extension of the work presentedin [22]. In this case, the authors have implemented theTNEP problem using faster and more efficient software. Theproposed genetic algorithm considers an initial population,in which all individuals are feasible. Also, the search for thebest solution is performed only over feasible regions of theTEP problem, and, finally, efficient tools for solving the oper-ative problems in the TEP problem are used. The proposedmethodology finds better solutions, with lower computa-tional burden, as compared with the results reported in [22].
2. Traditional Genetic Algorithm andthe Chu-Beasley Proposal
The main characteristics of the traditional and the Chu-Beasley genetic algorithms will be analyzed with a focus onthe differences in operators and strategies.
2.1. Traditional Genetic Algorithm. The fundamental the-ory on genetic algorithms can be found in [23–27]. The
Journal of Electrical and Computer Engineering 3
traditional genetic algorithm can be summarized in thefollowing steps.
(1) Specify the control parameters (population size, re-combination rate, mutation rate, etc.).
(2) Specify genetic algorithm characteristics such as codi-fication type, form of setting up an initial population,unfeasibility manipulation, selection type, need andform of standardization, and so forth.
(3) Find an initial population which becomes the currentpopulation.
(4) Find the fitness of the current population and updatethe best solution found in the process, if possible.
(5) If the stop criteria are satisfied, stop. Otherwise, con-tinue the process.
(6) Implement selection.
(7) Implement recombination.
(8) Implement mutation, replacement of the currentpopulation and return to step 4.
The basic theory of genetic algorithms suggests randomlysetting up an initial population because the quality of thefinal solution must be independent of how the initial popula-tion was set up. However, some studies show that a randomlygenerated initial population generally takes a very long timeto find quality solutions and, in addition, these solutions areof poorer quality than those of an initial population set upusing efficient strategies that consider specific characteristicsof the problem. Therefore, a good-quality initial populationgenerated using a fast and robust heuristic algorithm isconsidered more promising.
The manipulation of unfeasibilities is another relevanttopic. Most genetic algorithms applied in the optimization ofpower systems incorporate the unfeasibilities into the fitnessthrough penalization or eliminate the unfeasible proposalaltogether [28–31]. Usually unfeasible solutions can beeliminated in the optimization of power systems operationproblems because they rarely appear. However, in electricpower systems planning, the penalization strategy is usedbecause the unfeasible proposals are numerous and usuallydominant and because proposals with “small unfeasibilities”can produce excellent feasible solutions after applying thegenetic operators. The great difficulty is to correctly adjustthe penalty parameter. In [32] there is a detailed analysis ofthis form of manipulating unfeasibilities as well as of otheralternative proposals.
The selection type and the necessity for standardizationare analyzed separately from the other genetic operators. Thebasic theory of genetic algorithms considers that a problemis standardized when there is a maximization problem andthe fitness values are all nonnegatives. The first geneticalgorithms also suggest using the so-called proportionalselection, in which a standardized problem creates a numberof offspring that is proportional to the fitness value. Due tothis, all fitness values must be nonnegative. As the numberof offspring generally is not integer, the selection process isfinished using a roulette wheel. Proportional selection thus
requires standardization of the problem and has two clearlydifferentiated parts: (1) determination of the number ofoffspring using the proportional relation creating a numberof non-integer offspring, (2) found integer values of thenumber of offspring using the roulette wheel.
Proportional selection, however, presents various prob-lems: (1) when it is a minimization problem, it must betransformed into an equivalent maximization problem; (2)when negative fitness values appear, a strategy must be usedto make all the fitness values of the current population non-negative; (3) when the so-called superconfigurations appear,that is, excellent-quality solution proposals with the highprobability of generating many offspring, there is a loss ofdiversity and a premature convergence; (4) when all elementsof the population present very close fitness values, there isalso a loss of diversity, transforming the selection into arandom process. The two last problems are solved by propor-tional selection using modifications in the selection processsuch as limiting the number of offspring and/or using linearscaling mechanism selection, which modifies the fitnessvalues by approximating them when they are far apart (in thecase of superconfiguration) or separating them when theyare too close. In this manner, scaling mechanism selection isthe same proportional selection with an additional step: themodification of the fitness values in the current population.
Selection by tournament does not present any of theproblems of proportional selection and is very simple to im-plement. In this proposal, the number of offspring isgenerated in npop games for an npop size population. Ineach step, a game is carried out that consists of choosingrandom k elements of the population, with the element ofthe population with the best-quality fitness considered awinner and given the right to generate one offspring. Afternpop games, the selection process ends. This case involvesonly the calibration and choosing of the k, the number ofelements that participate in each game, which is easily cali-brated and usually presents small values such as k = 2, 3, 4.Logically, selection by tournament does not require a roulettewheel because it generates an integer value for the numberof offspring. In this way, selection by tournament does notrequire standardization; thus if this decision is made, stan-dardization issues like maximization or minimization be-come irrelevant.
Recombination and mutation are operators that arehighly dependent on the type of codification used. When thecodification is binary, both operators are implemented in atrivial way. However, if another type of codification is used,the operators must be redefined.
The traditional genetic algorithm has a generationalsubstitution; that is, the elements of the current populationare substituted by offspring generated through geneticoperators. This strategy can eliminate the best solutions stillfound from the current population. The use of the elitismstrategy is a form of dealing with this problem. In thisproposal, the best solutions (elite solutions) are passed on tothe next generation, preserving the best solutions. Therefore,the current population inherits the best solutions from theprevious population.
4 Journal of Electrical and Computer Engineering
Finally, the most critical problem for the traditionalgenetic algorithm is the loss of diversity. Generally, a geneticalgorithm does not verify if some elements of the populationare repeated. If a control of diversity is not implemented,the best solutions become dominant in the new populations,leading to a loss of diversity. This problem is partially solvedusing two strategies: (1) using more and more elevatedmutation rates and (2) verifying and eliminating the repeatedsolutions and carrying out a recomposition of the popu-lation, which normally involves randomly generating newsolutions. This last proposal is rarely used because it iscomputationally expensive and the substitution process isnot efficient. Therefore, the loss of genetic diversity is oneof the biggest problems of traditional genetic algorithms. Aninteresting analysis on this topic can be found in [32].
2.2. Chu-Beasley Genetic Algorithm. Chu and Beasley [21]presented a genetic algorithm to solve the generalized assign-ment problem. It can be summarized in the following steps.
(1) Specify the control parameters (population size,recombination rate, mutation rate, etc.).
(2) Specify genetic characteristics of the algorithm: codi-fication type, initial population assembly, manipula-tion of unfeasibilities, selection type, and so forth.
(3) Randomly find an initial population to become thecurrent population. Find the fitness and unfitness ofthe current population.
(4) Implement a selection to choose only two generatingsolutions.
(5) Implement the recombination and preserve an off-spring.
(6) Implement the mutation of the preserved offspring.
(7) Implement a phase of local improvement.
(8) Decide if the improved offspring can enter the popu-lation, substituting an element from the population.
(9) If the stop criterion is not satisfied, return to step 4.Otherwise, end the process.
Chu and Beasley presented a modified genetic algorithmwith very special particularities. Here we present a summaryof the most relevant aspects of the Chu-Beasley geneticalgorithm with special attention to those proposals that aresignificantly different from a traditional genetic algorithm.
The Chu-Beasley genetic algorithm (CBGA) suggests therandom generation of a population just as in the basic geneticalgorithms. However, it can be observed that this proposalproduces an initial population with all the unfeasible ele-ments that is very distant from the feasibility for the case ofcomplex problems.
The CBGA presents an innovative proposal for themanipulation of unfeasibilities. This approach presents aproposal for storing the objective function (fitness vector)and the unfeasibilities (unfitness vector) in separate form andusing each for different purposes. The proposal eliminatesthe necessity of choosing the penalization parameter whenboth pieces of information are gathered into one fitness
alone. The fitness is used in the selection process, and theunfitness is used along with the fitness in the substitutionprocess to decide whether the generated offspring shouldbe incorporated into the population by substituting it foran element of the population. The CBGA uses tournamentselection, considered one of the most efficient and simple-to-implement methods for selection.
The Chu-Beasley proposal is significantly different fromthe traditional genetic algorithms in its process of substi-tution of the population elements. The traditional geneticalgorithm carries out a generational substitution, substitut-ing all (or almost all) the elements of the population, andgenerally diversity verification is not performed. The CBGAsuggests substituting only one element from the currentpopulation in each step. This facilitates two strategies that arecrucial for the development of the algorithm: (1) allowing theproduction of improved offspring using a local optimization;(2) allowing absolute control of the diversity of the elementsin the current population. These two proposals cannot beimplemented efficiently in a traditional genetic algorithmwith generational substitution.
The CBGA suggests the implementation of a localimprovement phase of the generated offspring. This localimprovement phase can be a very simple local search or asophisticated strategy that takes the specific characteristics ofthe problem into consideration. However, the local improve-ment phase has two phases for the multiconstrained prob-lems: (1) an unfeasibility improvement phase (2) a qualityimprovement phase. This way, if the generated offspring isunfeasible, there must be an attempt to make this offspringfeasible, which is not always possible. Next, the quality of theoffspring must be improved by searching its neighborhood.
The CBGA suggests substituting an element of thecurrent population for a generated offspring, preserving thecomplete diversity; that is, all population elements must bedifferent. Therefore, if the generated offspring is equal to anelement from the population, then this offspring is discarded.Otherwise, the process follows this strategy: (1) if thegenerated offspring is unfeasible, then it is verified whetherthe unfeasibility is smaller than the unfeasibility of theelement from the population with the largest unfeasibility;if this is the case, then the substitution is carried out, andif this is not the case, the generated offspring is discarded.(2) If the generated offspring is feasible, it must substitutefor the element with the largest unfeasibility. Logically, if allelements of the population are feasible, for the exchange tobe possible, it must be verified that the generated offspringpresents better quality than the lowest-quality element of thepopulation.
In summary, the generated offspring can enter thepopulation if it is different from the rest of the elements ofthe population and if it is more promising than any of theelements, verifying first the unfeasibility and next the qualityof the objective function of the feasible solution proposals.In this context, the unfitness is used to arrange the elementsof the population that are unfeasible and as an “unfeasibilitymeasurement,” and the fitness represents only the originalobjective function of the problem and is used to arrange fea-sible solution proposals, as in the selection process. This logic
Journal of Electrical and Computer Engineering 5
of initially prioritizing the search for unfeasible solutions,neglecting the quality and later preserving the feasibility ofpopulation, has been widely analyzed by researchers in recentstudies [32, 33].
The proposal for the substitution in the CBGA hasmany relevant aspects: (1) all elements of the populationare different; (2) the substitution logic increases the numberof feasible elements; (3) due to the previous observation,the process finds a current population only with feasiblesolutions, and this stage can be reached in a period thatdepends on the type of problem and the local improvementstrategy; (4) the best solutions are always preserved becausein each substitution process a solution of inferior qualityis eliminated. The last observation means that the strategyworks better than the elitism of the traditional geneticalgorithms. Nevertheless, the great advantage of the CBGA isthe absolute control of diversity. Thus, in complex problemswith great difficulty finding feasible solutions, it might beinteresting to increase the size of the population to allow thestorage of feasible solutions of diverse genetic compositions.
3. Enhanced Genetic Algorithm (EGA)
A metaheuristic that represents a modified version of theChu-Beasley proposal is presented in this section. Theproposal is directed towards its application in the opti-mization of power systems complex problems, where thereis a great application and diversity of proposals relatedto heuristic algorithms to solve these complex problems,especially constructive heuristic algorithms. The proposalsuggests modifying the Chu-Beasley algorithm in three areas:(1) the generation of the initial population, (2) the localimprovement phase of the generated offspring and (3) thecontrol of diversity can be extended.
This proposal consists of how an initial population ofgood quality can be generated and diversified using heuristicalgorithms and very simple additional strategies. Thus, inmost applications, the initial population can be made upof only feasible solution proposals, making the functionof the unfitness vector from the Chu-Beasley proposal notvery active or relevant. In the local improvement phase, fastand efficient heuristic algorithms can also be used, whichin most cases can totally eliminate the unfeasibility of thegenerated offspring, which can in turn improve the qualityof the objective function. The Chu-Beasley proposal forlocal improvement in the generalized assignment problem,in most cases, does not eliminate the unfeasibility, and theimprovement in quality is also primitive. Thus in this step,efficient heuristic algorithms from the specialized literaturefor each type of electric power systems problem can also beused.
The control of diversity can be easily extended. In theChu-Beasley proposal, control is limited to verifying that allthe elements of the population are different. Nevertheless,practice indicates that this diversity proposal is not sufficientin multimodal and complex problems. Frequently, theindividuals of a population can be different, but this canbe constrained to small differences; as a consequence, thecurrent population may represent a reduced number of
regions from the search space. A simple way to deal withthis problem consists of extending the diversity. In this way,an offspring can enter the current population if it meets thefollowing parameters: (1) it presents better quality than thelowest-quality stored solution, (2) it is different from eachof the elements of the population in a minimum number ofelements of the coded vector.
The proposed metaheuristic can be summarized in thefollowing steps.
(1) Specify the control parameters (population size, re-combination rate, mutation rate, etc.).
(2) Specify EGA characteristics: codification type, settingup the initial population, manipulation of the infea-sibilities, choice of selection by tournament, and soforth.
(3) Find an initial population with efficient, fast, androbust heuristic algorithms. The proposal is to prior-itize the use of algorithms that generate only feasiblesolutions. Set up the fitness of the initial population.
(4) Implement a selection by tournament to choose onlytwo generating solutions.
(5) Implement a recombination and preserve only oneoffspring.
(6) Implement mutation in the preserved offspring.
(7) Implement a local improvement in the preservedoffspring using efficient heuristic algorithms.
(8) Decide whether the improved offspring can enter thepopulation, substituting an element after verifyingthe substitution test.
(9) If the stop criterion is not satisfied, return to step 4.Otherwise, end the process.
4. Application in the Transmission NetworkExpansion Planning Problem
The presented metaheuristic is especially useful in complexproblems with multimodal and multiconstrained charac-teristics. Most of the complex problems in electric powersystems fall into this category. Thus, an application for thestatic and multistage planning problem in the electric powertransmission network expansion is presented.
The static transmission network expansion planningproblem is also considered a relevant and complex problemin power systems. In this case, static means that the planningis carried out in one stage. Thus, given the network con-figuration for a certain year and the peak generation/demandfor the next stage, along with other data such as networkoperation limits, costs, and investment constraints, deter-mining an expansion plan with minimum cost is desirable,to optimize where and what type of new equipment shouldbe installed. This is a special case of a more general problemcalled multistage expansion planning in which it is alsodesirable to know when to install new pieces of equipment.In this type of problem, the initial stages of the expansionplanning studies are focused on when the basic topology
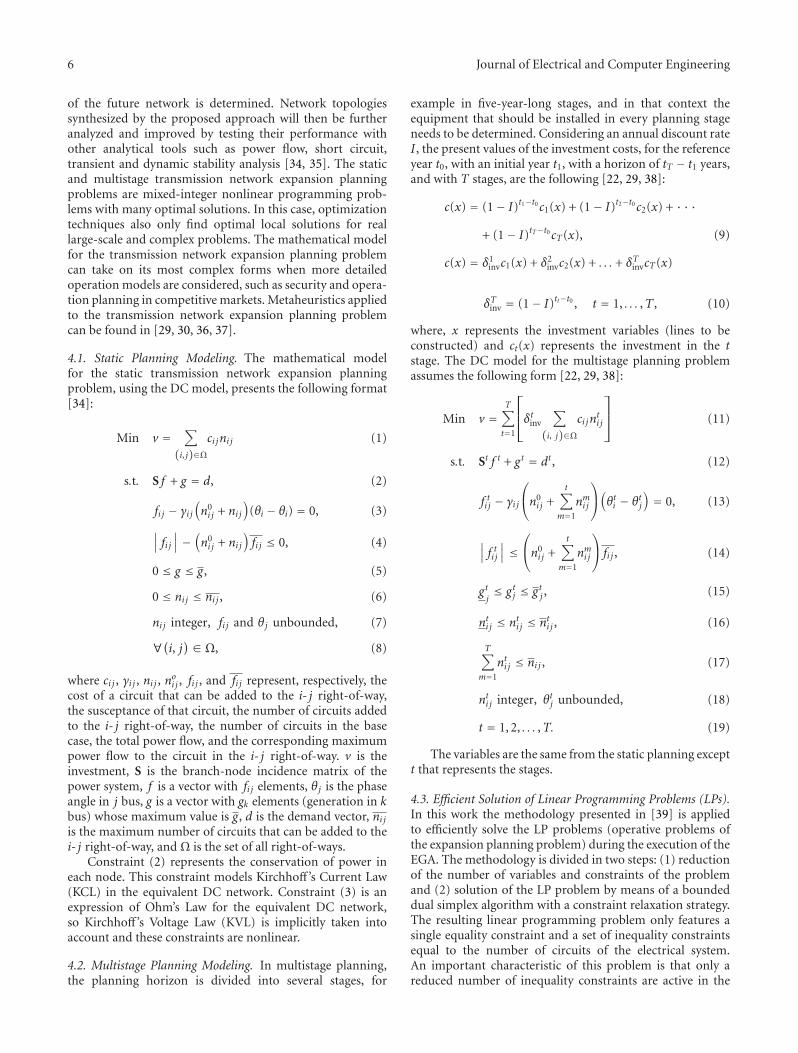
6 Journal of Electrical and Computer Engineering
of the future network is determined. Network topologiessynthesized by the proposed approach will then be furtheranalyzed and improved by testing their performance withother analytical tools such as power flow, short circuit,transient and dynamic stability analysis [34, 35]. The staticand multistage transmission network expansion planningproblems are mixed-integer nonlinear programming prob-lems with many optimal solutions. In this case, optimizationtechniques also only find optimal local solutions for reallarge-scale and complex problems. The mathematical modelfor the transmission network expansion planning problemcan take on its most complex forms when more detailedoperation models are considered, such as security and opera-tion planning in competitive markets. Metaheuristics appliedto the transmission network expansion planning problemcan be found in [29, 30, 36, 37].
4.1. Static Planning Modeling. The mathematical modelfor the static transmission network expansion planningproblem, using the DC model, presents the following format[34]:
Min v =∑
(i, j)∈Ωci jni j (1)
s.t. S f + g = d, (2)
fi j − γi j(n0i j + ni j
)(θi − θi) = 0, (3)
∣∣∣ fi j∣∣∣−
(n0i j + ni j
)fi j ≤ 0, (4)
0 ≤ g ≤ g, (5)
0 ≤ ni j ≤ ni j , (6)
ni j integer, fi j and θj unbounded, (7)
∀(i, j) ∈ Ω, (8)
where ci j , γi j , ni j , noi j , fi j , and fi j represent, respectively, thecost of a circuit that can be added to the i- j right-of-way,the susceptance of that circuit, the number of circuits addedto the i- j right-of-way, the number of circuits in the basecase, the total power flow, and the corresponding maximumpower flow to the circuit in the i- j right-of-way. v is theinvestment, S is the branch-node incidence matrix of thepower system, f is a vector with fi j elements, θj is the phaseangle in j bus, g is a vector with gk elements (generation in kbus) whose maximum value is g, d is the demand vector, ni jis the maximum number of circuits that can be added to thei- j right-of-way, and Ω is the set of all right-of-ways.
Constraint (2) represents the conservation of power ineach node. This constraint models Kirchhoff ’s Current Law(KCL) in the equivalent DC network. Constraint (3) is anexpression of Ohm’s Law for the equivalent DC network,so Kirchhoff ’s Voltage Law (KVL) is implicitly taken intoaccount and these constraints are nonlinear.
4.2. Multistage Planning Modeling. In multistage planning,the planning horizon is divided into several stages, for
example in five-year-long stages, and in that context theequipment that should be installed in every planning stageneeds to be determined. Considering an annual discount rateI , the present values of the investment costs, for the referenceyear t0, with an initial year t1, with a horizon of tT − t1 years,and with T stages, are the following [22, 29, 38]:
c(x) = (1− I)t1−t0c1(x) + (1− I)t2−t0c2(x) + · · ·
+ (1− I)tT−t0cT(x),
c(x) = δ1invc1(x) + δ2
invc2(x) + . . . + δTinvcT(x)
(9)
δTinv = (1− I)tt−t0 , t = 1, . . . ,T , (10)
where, x represents the investment variables (lines to beconstructed) and ct(x) represents the investment in the tstage. The DC model for the multistage planning problemassumes the following form [22, 29, 38]:
Min v =T∑
t=1
⎡⎢⎣δtinv
∑
(i, j)∈Ωci jn
ti j
⎤⎥⎦ (11)
s.t. St f t + gt = dt , (12)
f ti j − γi j
⎛⎝n0
i j +t∑
m=1
nmi j
⎞⎠(θti − θtj
)= 0, (13)
∣∣∣ f ti j∣∣∣ ≤
⎛⎝n0
i j +t∑
m=1
nmi j
⎞⎠ fi j , (14)
gtj≤ gtj ≤ gtj , (15)
nti j ≤ nti j ≤ nti j , (16)
T∑
m=1
nti j ≤ ni j , (17)
nti j integer, θtj unbounded, (18)
t = 1, 2, . . . ,T. (19)
The variables are the same from the static planning exceptt that represents the stages.
4.3. Efficient Solution of Linear Programming Problems (LPs).In this work the methodology presented in [39] is appliedto efficiently solve the LP problems (operative problems ofthe expansion planning problem) during the execution of theEGA. The methodology is divided in two steps: (1) reductionof the number of variables and constraints of the problemand (2) solution of the LP problem by means of a boundeddual simplex algorithm with a constraint relaxation strategy.The resulting linear programming problem only features asingle equality constraint and a set of inequality constraintsequal to the number of circuits of the electrical system.An important characteristic of this problem is that only areduced number of inequality constraints are active in the
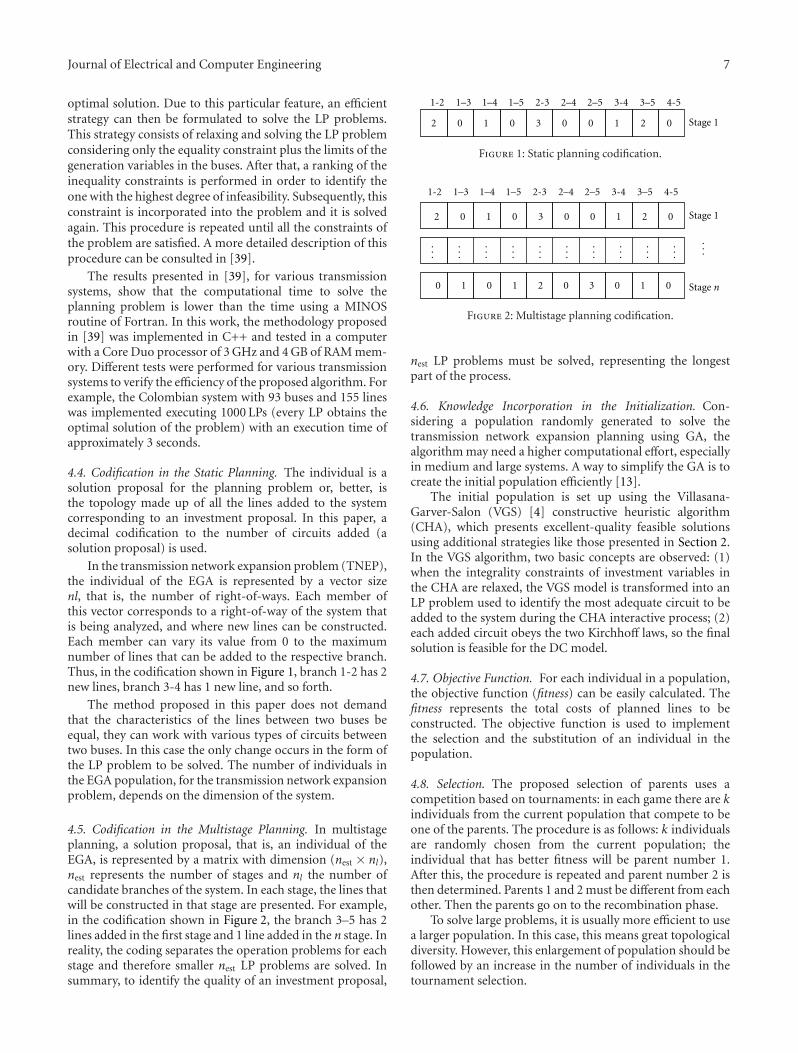
Journal of Electrical and Computer Engineering 7
optimal solution. Due to this particular feature, an efficientstrategy can then be formulated to solve the LP problems.This strategy consists of relaxing and solving the LP problemconsidering only the equality constraint plus the limits of thegeneration variables in the buses. After that, a ranking of theinequality constraints is performed in order to identify theone with the highest degree of infeasibility. Subsequently, thisconstraint is incorporated into the problem and it is solvedagain. This procedure is repeated until all the constraints ofthe problem are satisfied. A more detailed description of thisprocedure can be consulted in [39].
The results presented in [39], for various transmissionsystems, show that the computational time to solve theplanning problem is lower than the time using a MINOSroutine of Fortran. In this work, the methodology proposedin [39] was implemented in C++ and tested in a computerwith a Core Duo processor of 3 GHz and 4 GB of RAM mem-ory. Different tests were performed for various transmissionsystems to verify the efficiency of the proposed algorithm. Forexample, the Colombian system with 93 buses and 155 lineswas implemented executing 1000 LPs (every LP obtains theoptimal solution of the problem) with an execution time ofapproximately 3 seconds.
4.4. Codification in the Static Planning. The individual is asolution proposal for the planning problem or, better, isthe topology made up of all the lines added to the systemcorresponding to an investment proposal. In this paper, adecimal codification to the number of circuits added (asolution proposal) is used.
In the transmission network expansion problem (TNEP),the individual of the EGA is represented by a vector sizenl, that is, the number of right-of-ways. Each member ofthis vector corresponds to a right-of-way of the system thatis being analyzed, and where new lines can be constructed.Each member can vary its value from 0 to the maximumnumber of lines that can be added to the respective branch.Thus, in the codification shown in Figure 1, branch 1-2 has 2new lines, branch 3-4 has 1 new line, and so forth.
The method proposed in this paper does not demandthat the characteristics of the lines between two buses beequal, they can work with various types of circuits betweentwo buses. In this case the only change occurs in the form ofthe LP problem to be solved. The number of individuals inthe EGA population, for the transmission network expansionproblem, depends on the dimension of the system.
4.5. Codification in the Multistage Planning. In multistageplanning, a solution proposal, that is, an individual of theEGA, is represented by a matrix with dimension (nest × nl),nest represents the number of stages and nl the number ofcandidate branches of the system. In each stage, the lines thatwill be constructed in that stage are presented. For example,in the codification shown in Figure 2, the branch 3–5 has 2lines added in the first stage and 1 line added in the n stage. Inreality, the coding separates the operation problems for eachstage and therefore smaller nest LP problems are solved. Insummary, to identify the quality of an investment proposal,
2 0 02100301
1-2 2-3 3-4 4-5
Stage 1
1–41–3 1–5 2–4 2–5 3–5
Figure 1: Static planning codification.
2 0 02100301
0 1 01030210
1-2 2-3 3-4 4-5
Stage 1
1–3 1–4 1–5 2–5 3–52–4
Stage n
......
......
......
......
......
...
Figure 2: Multistage planning codification.
nest LP problems must be solved, representing the longestpart of the process.
4.6. Knowledge Incorporation in the Initialization. Con-sidering a population randomly generated to solve thetransmission network expansion planning using GA, thealgorithm may need a higher computational effort, especiallyin medium and large systems. A way to simplify the GA is tocreate the initial population efficiently [13].
The initial population is set up using the Villasana-Garver-Salon (VGS) [4] constructive heuristic algorithm(CHA), which presents excellent-quality feasible solutionsusing additional strategies like those presented in Section 2.In the VGS algorithm, two basic concepts are observed: (1)when the integrality constraints of investment variables inthe CHA are relaxed, the VGS model is transformed into anLP problem used to identify the most adequate circuit to beadded to the system during the CHA interactive process; (2)each added circuit obeys the two Kirchhoff laws, so the finalsolution is feasible for the DC model.
4.7. Objective Function. For each individual in a population,the objective function (fitness) can be easily calculated. Thefitness represents the total costs of planned lines to beconstructed. The objective function is used to implementthe selection and the substitution of an individual in thepopulation.
4.8. Selection. The proposed selection of parents uses acompetition based on tournaments: in each game there are kindividuals from the current population that compete to beone of the parents. The procedure is as follows: k individualsare randomly chosen from the current population; theindividual that has better fitness will be parent number 1.After this, the procedure is repeated and parent number 2 isthen determined. Parents 1 and 2 must be different from eachother. Then the parents go on to the recombination phase.
To solve large problems, it is usually more efficient to usea larger population. In this case, this means great topologicaldiversity. However, this enlargement of population should befollowed by an increase in the number of individuals in thetournament selection.
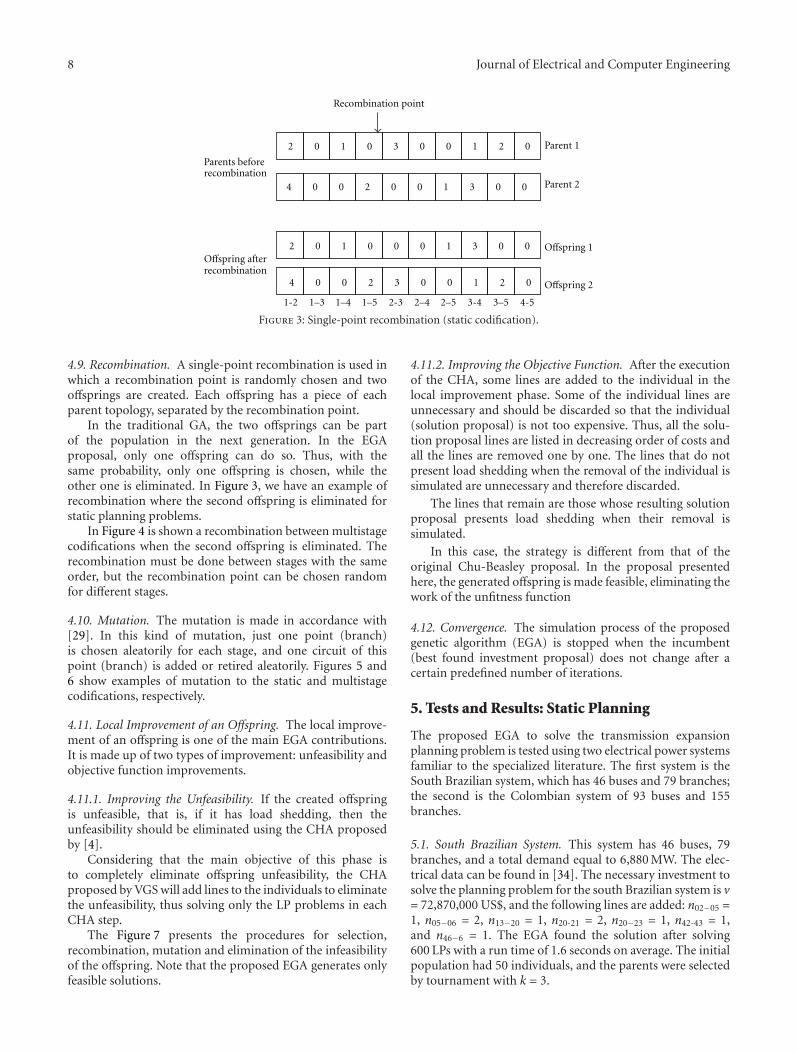
8 Journal of Electrical and Computer Engineering
Recombination point
Parents before recombination
2 0 02100301
4 0 00310020
2 0 00310001
4 0 02100320
Parent 1
Parent 2
Offspring afterrecombination
Offspring 1
Offspring 2
1-2 2-3 3-4 4-51–41–3 1–5 2–4 2–5 3–5
Figure 3: Single-point recombination (static codification).
4.9. Recombination. A single-point recombination is used inwhich a recombination point is randomly chosen and twooffsprings are created. Each offspring has a piece of eachparent topology, separated by the recombination point.
In the traditional GA, the two offsprings can be partof the population in the next generation. In the EGAproposal, only one offspring can do so. Thus, with thesame probability, only one offspring is chosen, while theother one is eliminated. In Figure 3, we have an example ofrecombination where the second offspring is eliminated forstatic planning problems.
In Figure 4 is shown a recombination between multistagecodifications when the second offspring is eliminated. Therecombination must be done between stages with the sameorder, but the recombination point can be chosen randomfor different stages.
4.10. Mutation. The mutation is made in accordance with[29]. In this kind of mutation, just one point (branch)is chosen aleatorily for each stage, and one circuit of thispoint (branch) is added or retired aleatorily. Figures 5 and6 show examples of mutation to the static and multistagecodifications, respectively.
4.11. Local Improvement of an Offspring. The local improve-ment of an offspring is one of the main EGA contributions.It is made up of two types of improvement: unfeasibility andobjective function improvements.
4.11.1. Improving the Unfeasibility. If the created offspringis unfeasible, that is, if it has load shedding, then theunfeasibility should be eliminated using the CHA proposedby [4].
Considering that the main objective of this phase isto completely eliminate offspring unfeasibility, the CHAproposed by VGS will add lines to the individuals to eliminatethe unfeasibility, thus solving only the LP problems in eachCHA step.
The Figure 7 presents the procedures for selection,recombination, mutation and elimination of the infeasibilityof the offspring. Note that the proposed EGA generates onlyfeasible solutions.
4.11.2. Improving the Objective Function. After the executionof the CHA, some lines are added to the individual in thelocal improvement phase. Some of the individual lines areunnecessary and should be discarded so that the individual(solution proposal) is not too expensive. Thus, all the solu-tion proposal lines are listed in decreasing order of costs andall the lines are removed one by one. The lines that do notpresent load shedding when the removal of the individual issimulated are unnecessary and therefore discarded.
The lines that remain are those whose resulting solutionproposal presents load shedding when their removal issimulated.
In this case, the strategy is different from that of theoriginal Chu-Beasley proposal. In the proposal presentedhere, the generated offspring is made feasible, eliminating thework of the unfitness function
4.12. Convergence. The simulation process of the proposedgenetic algorithm (EGA) is stopped when the incumbent(best found investment proposal) does not change after acertain predefined number of iterations.
5. Tests and Results: Static Planning
The proposed EGA to solve the transmission expansionplanning problem is tested using two electrical power systemsfamiliar to the specialized literature. The first system is theSouth Brazilian system, which has 46 buses and 79 branches;the second is the Colombian system of 93 buses and 155branches.
5.1. South Brazilian System. This system has 46 buses, 79branches, and a total demand equal to 6,880 MW. The elec-trical data can be found in [34]. The necessary investment tosolve the planning problem for the south Brazilian system is v= 72,870,000 US$, and the following lines are added: n02−05 =1, n05−06 = 2, n13−20 = 1, n20-21 = 2, n20−23 = 1, n42-43 = 1,and n46−6 = 1. The EGA found the solution after solving600 LPs with a run time of 1.6 seconds on average. The initialpopulation had 50 individuals, and the parents were selectedby tournament with k = 3.
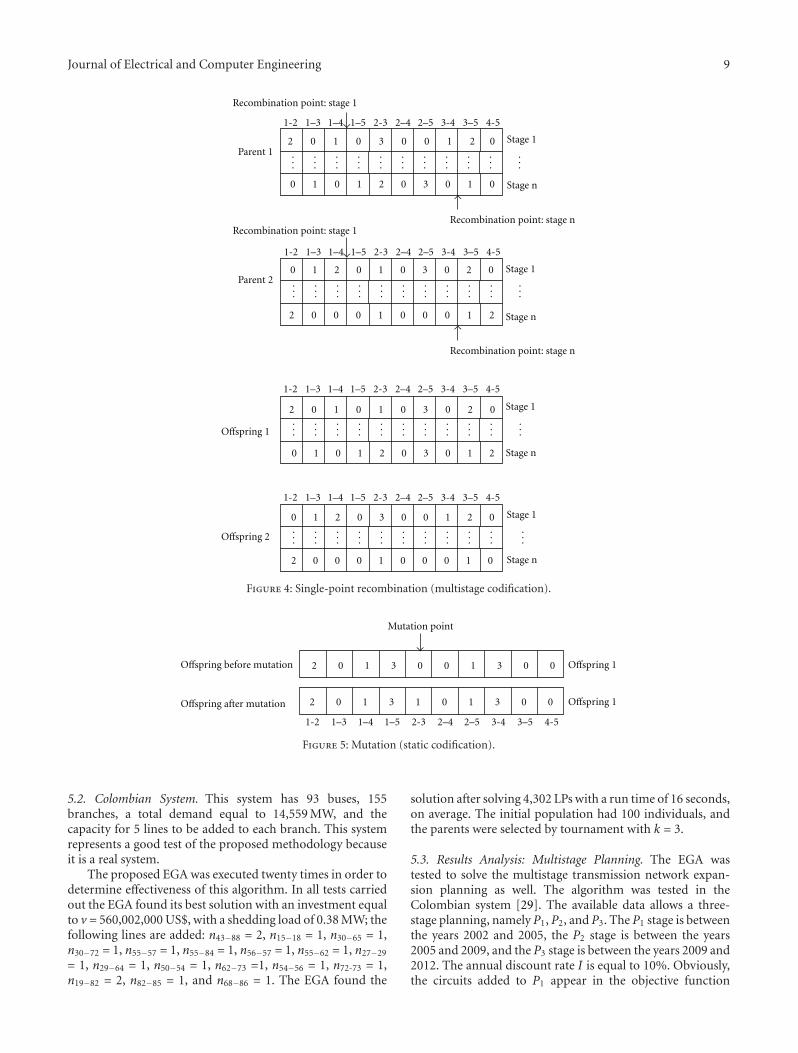
Journal of Electrical and Computer Engineering 9
Recombination point: stage 1
Recombination point: stage 1
Stage 1
Stage 1
Stage 1
Stage 1
Stage n
Stage n
Stage n
Stage n
Recombination point: stage n
Recombination point: stage n
Parent 1
Parent 20
0
0
0
0
0 0 0
00
0 0
0
0
0
00
00
0
0
0
0 0
0
0
2
2
2
2
2
2
2
2
21
1
1
1
1
1
1
1
1
1
1
1
1
1
3
3
3
0
0
02
2
2
2
3
3
3
0 0
0
0 0
0 0
1
21
1 1
0
0 0 00 0
Offspring 1
Offspring 2
1-2 2-3 3-4 4-5
1-2 2-3 3-4 4-5
1-2 2-3 3-4 4-5
......
......
......
......
......
...
......
......
......
......
......
......
......
......
......
......
......
......
......
......
......
...
...
...
1–41–3 1–5 2–4 2–5 3–5
1–41–3 1–5 2–4 2–5 3–5
1–41–3 1–5 2–4 2–5 3–5
1-2 2-3 3-4 4-51–41–3 1–5 2–4 2–5 3–5
Figure 4: Single-point recombination (multistage codification).
Offspring after mutation 2
Offspring before mutation
Mutation point
0 1 3 31 0 0 01
2 00 1 3 30 0 01 Offspring 1
Offspring 1
1-2 2-3 3-4 4-51–41–3 1–5 2–4 2–5 3–5
Figure 5: Mutation (static codification).
5.2. Colombian System. This system has 93 buses, 155branches, a total demand equal to 14,559 MW, and thecapacity for 5 lines to be added to each branch. This systemrepresents a good test of the proposed methodology becauseit is a real system.
The proposed EGA was executed twenty times in order todetermine effectiveness of this algorithm. In all tests carriedout the EGA found its best solution with an investment equalto v = 560,002,000 US$, with a shedding load of 0.38 MW; thefollowing lines are added: n43−88 = 2, n15−18 = 1, n30−65 = 1,n30−72 = 1, n55−57 = 1, n55−84 = 1, n56−57 = 1, n55−62 = 1, n27−29
= 1, n29−64 = 1, n50−54 = 1, n62−73 =1, n54−56 = 1, n72-73 = 1,n19−82 = 2, n82−85 = 1, and n68−86 = 1. The EGA found the
solution after solving 4,302 LPs with a run time of 16 seconds,on average. The initial population had 100 individuals, andthe parents were selected by tournament with k = 3.
5.3. Results Analysis: Multistage Planning. The EGA wastested to solve the multistage transmission network expan-sion planning as well. The algorithm was tested in theColombian system [29]. The available data allows a three-stage planning, namely P1, P2, and P3. The P1 stage is betweenthe years 2002 and 2005, the P2 stage is between the years2005 and 2009, and the P3 stage is between the years 2009 and2012. The annual discount rate I is equal to 10%. Obviously,the circuits added to P1 appear in the objective function
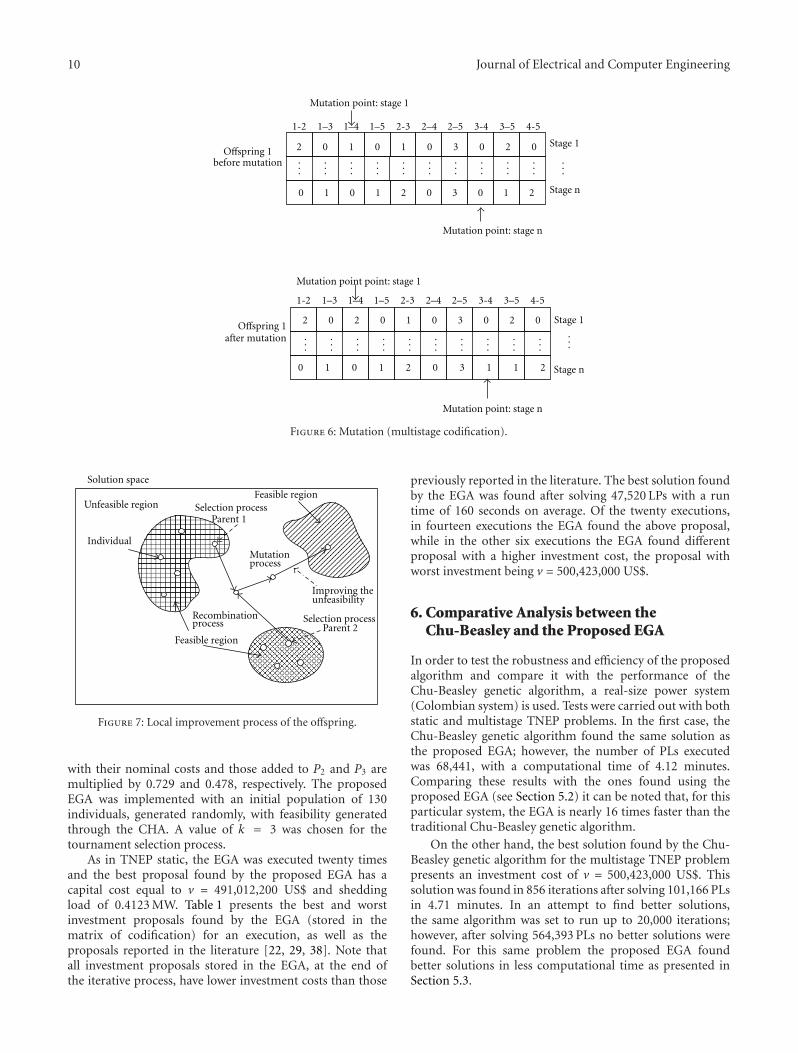
10 Journal of Electrical and Computer Engineering
0 3 0 2 02 0 1 0 1
0 3 0 1 20 1 0 1 2 Stage n
0 3 0 2 02 0 2 0 1
0 3 1 1 20 1 0 1 2 Stage n
Mutation point: stage 1
Stage 1
Mutation point: stage n
Mutation point: stage n
Offspring 1before mutation
Stage 1
Mutation point point: stage 1
Offspring 1after mutation
1-2 2-3 3-4 4-51–41–3 1–5 2–4 2–5 3–5
......
...
......
......
......
......
...
......
......
......
......
......
1-2 2-3 3-4 4-51–41–3 1–5 2–4 2–5 3–5
Figure 6: Mutation (multistage codification).
Individual
Feasible region
Feasible region
Recombinationprocess
Improving theunfeasibility
Mutationprocess
Selection processParent 1
Selection processParent 2
Unfeasible region
Solution space
Figure 7: Local improvement process of the offspring.
with their nominal costs and those added to P2 and P3 aremultiplied by 0.729 and 0.478, respectively. The proposedEGA was implemented with an initial population of 130individuals, generated randomly, with feasibility generatedthrough the CHA. A value of k = 3 was chosen for thetournament selection process.
As in TNEP static, the EGA was executed twenty timesand the best proposal found by the proposed EGA has acapital cost equal to v = 491,012,200 US$ and sheddingload of 0.4123 MW. Table 1 presents the best and worstinvestment proposals found by the EGA (stored in thematrix of codification) for an execution, as well as theproposals reported in the literature [22, 29, 38]. Note thatall investment proposals stored in the EGA, at the end ofthe iterative process, have lower investment costs than those
previously reported in the literature. The best solution foundby the EGA was found after solving 47,520 LPs with a runtime of 160 seconds on average. Of the twenty executions,in fourteen executions the EGA found the above proposal,while in the other six executions the EGA found differentproposal with a higher investment cost, the proposal withworst investment being v = 500,423,000 US$.
6. Comparative Analysis between theChu-Beasley and the Proposed EGA
In order to test the robustness and efficiency of the proposedalgorithm and compare it with the performance of theChu-Beasley genetic algorithm, a real-size power system(Colombian system) is used. Tests were carried out with bothstatic and multistage TNEP problems. In the first case, theChu-Beasley genetic algorithm found the same solution asthe proposed EGA; however, the number of PLs executedwas 68,441, with a computational time of 4.12 minutes.Comparing these results with the ones found using theproposed EGA (see Section 5.2) it can be noted that, for thisparticular system, the EGA is nearly 16 times faster than thetraditional Chu-Beasley genetic algorithm.
On the other hand, the best solution found by the Chu-Beasley genetic algorithm for the multistage TNEP problempresents an investment cost of v = 500,423,000 US$. Thissolution was found in 856 iterations after solving 101,166 PLsin 4.71 minutes. In an attempt to find better solutions,the same algorithm was set to run up to 20,000 iterations;however, after solving 564,393 PLs no better solutions werefound. For this same problem the proposed EGA foundbetter solutions in less computational time as presented inSection 5.3.
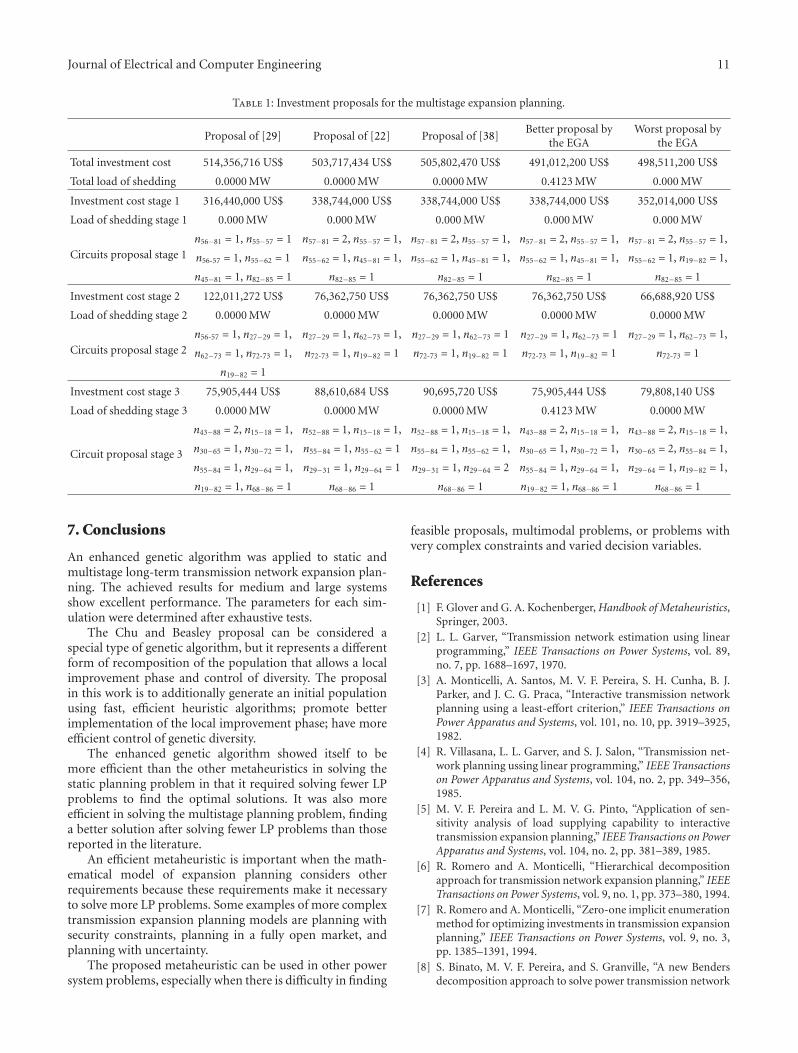
Journal of Electrical and Computer Engineering 11
Table 1: Investment proposals for the multistage expansion planning.
Proposal of [29] Proposal of [22] Proposal of [38]Better proposal by
the EGAWorst proposal by
the EGA
Total investment cost 514,356,716 US$ 503,717,434 US$ 505,802,470 US$ 491,012,200 US$ 498,511,200 US$
Total load of shedding 0.0000 MW 0.0000 MW 0.0000 MW 0.4123 MW 0.000 MW
Investment cost stage 1 316,440,000 US$ 338,744,000 US$ 338,744,000 US$ 338,744,000 US$ 352,014,000 US$
Load of shedding stage 1 0.000 MW 0.000 MW 0.000 MW 0.000 MW 0.000 MW
Circuits proposal stage 1n56−81 = 1, n55−57 = 1 n57−81 = 2, n55−57 = 1, n57−81 = 2, n55−57 = 1, n57−81 = 2, n55−57 = 1, n57−81 = 2, n55−57 = 1,
n56-57 = 1, n55−62 = 1 n55−62 = 1, n45−81 = 1, n55−62 = 1, n45−81 = 1, n55−62 = 1, n45−81 = 1, n55−62 = 1, n19−82 = 1,
n45−81 = 1, n82−85 = 1 n82−85 = 1 n82−85 = 1 n82−85 = 1 n82−85 = 1
Investment cost stage 2 122,011,272 US$ 76,362,750 US$ 76,362,750 US$ 76,362,750 US$ 66,688,920 US$
Load of shedding stage 2 0.0000 MW 0.0000 MW 0.0000 MW 0.0000 MW 0.0000 MW
Circuits proposal stage 2n56-57 = 1, n27−29 = 1, n27−29 = 1, n62−73 = 1, n27−29 = 1, n62−73 = 1 n27−29 = 1, n62−73 = 1 n27−29 = 1, n62−73 = 1,
n62−73 = 1, n72-73 = 1, n72-73 = 1, n19−82 = 1 n72-73 = 1, n19−82 = 1 n72-73 = 1, n19−82 = 1 n72-73 = 1
n19−82 = 1
Investment cost stage 3 75,905,444 US$ 88,610,684 US$ 90,695,720 US$ 75,905,444 US$ 79,808,140 US$
Load of shedding stage 3 0.0000 MW 0.0000 MW 0.0000 MW 0.4123 MW 0.0000 MW
Circuit proposal stage 3
n43−88 = 2, n15−18 = 1, n52−88 = 1, n15−18 = 1, n52−88 = 1, n15−18 = 1, n43−88 = 2, n15−18 = 1, n43−88 = 2, n15−18 = 1,
n30−65 = 1, n30−72 = 1, n55−84 = 1, n55−62 = 1 n55−84 = 1, n55−62 = 1, n30−65 = 1, n30−72 = 1, n30−65 = 2, n55−84 = 1,
n55−84 = 1, n29−64 = 1, n29−31 = 1, n29−64 = 1 n29−31 = 1, n29−64 = 2 n55−84 = 1, n29−64 = 1, n29−64 = 1, n19−82 = 1,
n19−82 = 1, n68−86 = 1 n68−86 = 1 n68−86 = 1 n19−82 = 1, n68−86 = 1 n68−86 = 1
7. Conclusions
An enhanced genetic algorithm was applied to static andmultistage long-term transmission network expansion plan-ning. The achieved results for medium and large systemsshow excellent performance. The parameters for each sim-ulation were determined after exhaustive tests.
The Chu and Beasley proposal can be considered aspecial type of genetic algorithm, but it represents a differentform of recomposition of the population that allows a localimprovement phase and control of diversity. The proposalin this work is to additionally generate an initial populationusing fast, efficient heuristic algorithms; promote betterimplementation of the local improvement phase; have moreefficient control of genetic diversity.
The enhanced genetic algorithm showed itself to bemore efficient than the other metaheuristics in solving thestatic planning problem in that it required solving fewer LPproblems to find the optimal solutions. It was also moreefficient in solving the multistage planning problem, findinga better solution after solving fewer LP problems than thosereported in the literature.
An efficient metaheuristic is important when the math-ematical model of expansion planning considers otherrequirements because these requirements make it necessaryto solve more LP problems. Some examples of more complextransmission expansion planning models are planning withsecurity constraints, planning in a fully open market, andplanning with uncertainty.
The proposed metaheuristic can be used in other powersystem problems, especially when there is difficulty in finding
feasible proposals, multimodal problems, or problems withvery complex constraints and varied decision variables.
References
[1] F. Glover and G. A. Kochenberger, Handbook of Metaheuristics,Springer, 2003.
[2] L. L. Garver, “Transmission network estimation using linearprogramming,” IEEE Transactions on Power Systems, vol. 89,no. 7, pp. 1688–1697, 1970.
[3] A. Monticelli, A. Santos, M. V. F. Pereira, S. H. Cunha, B. J.Parker, and J. C. G. Praca, “Interactive transmission networkplanning using a least-effort criterion,” IEEE Transactions onPower Apparatus and Systems, vol. 101, no. 10, pp. 3919–3925,1982.
[4] R. Villasana, L. L. Garver, and S. J. Salon, “Transmission net-work planning ussing linear programming,” IEEE Transactionson Power Apparatus and Systems, vol. 104, no. 2, pp. 349–356,1985.
[5] M. V. F. Pereira and L. M. V. G. Pinto, “Application of sen-sitivity analysis of load supplying capability to interactivetransmission expansion planning,” IEEE Transactions on PowerApparatus and Systems, vol. 104, no. 2, pp. 381–389, 1985.
[6] R. Romero and A. Monticelli, “Hierarchical decompositionapproach for transmission network expansion planning,” IEEETransactions on Power Systems, vol. 9, no. 1, pp. 373–380, 1994.
[7] R. Romero and A. Monticelli, “Zero-one implicit enumerationmethod for optimizing investments in transmission expansionplanning,” IEEE Transactions on Power Systems, vol. 9, no. 3,pp. 1385–1391, 1994.
[8] S. Binato, M. V. F. Pereira, and S. Granville, “A new Bendersdecomposition approach to solve power transmission network
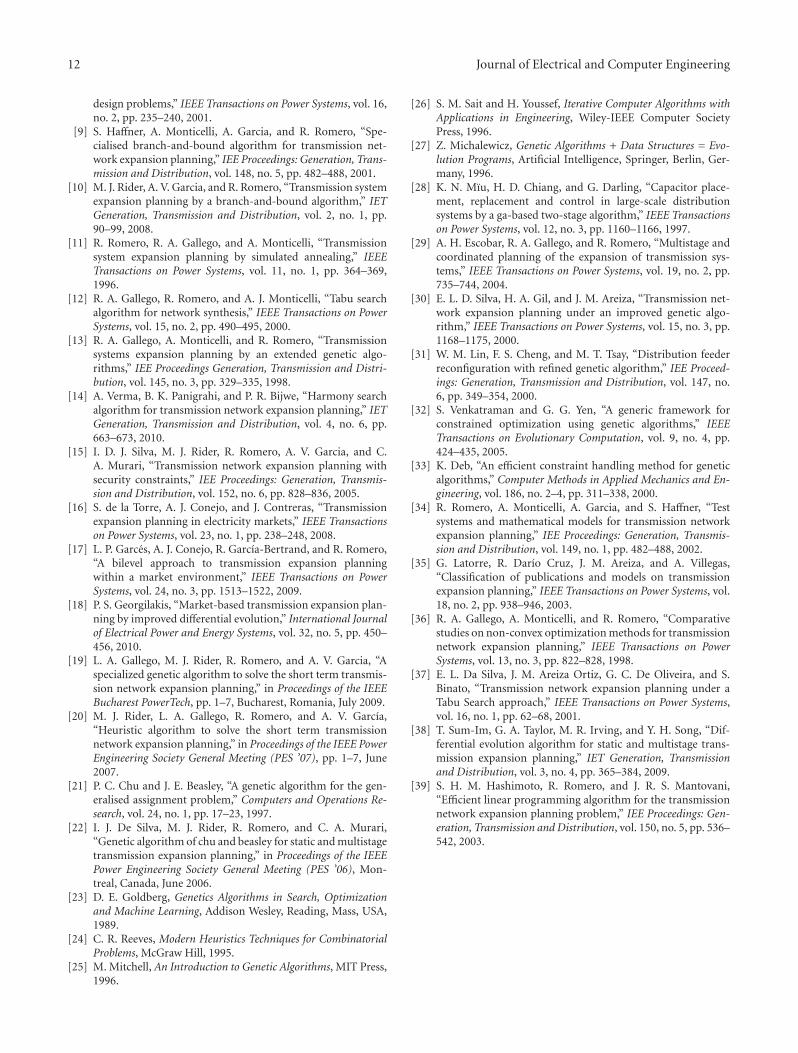
12 Journal of Electrical and Computer Engineering
design problems,” IEEE Transactions on Power Systems, vol. 16,no. 2, pp. 235–240, 2001.
[9] S. Haffner, A. Monticelli, A. Garcia, and R. Romero, “Spe-cialised branch-and-bound algorithm for transmission net-work expansion planning,” IEE Proceedings: Generation, Trans-mission and Distribution, vol. 148, no. 5, pp. 482–488, 2001.
[10] M. J. Rider, A. V. Garcia, and R. Romero, “Transmission systemexpansion planning by a branch-and-bound algorithm,” IETGeneration, Transmission and Distribution, vol. 2, no. 1, pp.90–99, 2008.
[11] R. Romero, R. A. Gallego, and A. Monticelli, “Transmissionsystem expansion planning by simulated annealing,” IEEETransactions on Power Systems, vol. 11, no. 1, pp. 364–369,1996.
[12] R. A. Gallego, R. Romero, and A. J. Monticelli, “Tabu searchalgorithm for network synthesis,” IEEE Transactions on PowerSystems, vol. 15, no. 2, pp. 490–495, 2000.
[13] R. A. Gallego, A. Monticelli, and R. Romero, “Transmissionsystems expansion planning by an extended genetic algo-rithms,” IEE Proceedings Generation, Transmission and Distri-bution, vol. 145, no. 3, pp. 329–335, 1998.
[14] A. Verma, B. K. Panigrahi, and P. R. Bijwe, “Harmony searchalgorithm for transmission network expansion planning,” IETGeneration, Transmission and Distribution, vol. 4, no. 6, pp.663–673, 2010.
[15] I. D. J. Silva, M. J. Rider, R. Romero, A. V. Garcia, and C.A. Murari, “Transmission network expansion planning withsecurity constraints,” IEE Proceedings: Generation, Transmis-sion and Distribution, vol. 152, no. 6, pp. 828–836, 2005.
[16] S. de la Torre, A. J. Conejo, and J. Contreras, “Transmissionexpansion planning in electricity markets,” IEEE Transactionson Power Systems, vol. 23, no. 1, pp. 238–248, 2008.
[17] L. P. Garces, A. J. Conejo, R. Garcıa-Bertrand, and R. Romero,“A bilevel approach to transmission expansion planningwithin a market environment,” IEEE Transactions on PowerSystems, vol. 24, no. 3, pp. 1513–1522, 2009.
[18] P. S. Georgilakis, “Market-based transmission expansion plan-ning by improved differential evolution,” International Journalof Electrical Power and Energy Systems, vol. 32, no. 5, pp. 450–456, 2010.
[19] L. A. Gallego, M. J. Rider, R. Romero, and A. V. Garcia, “Aspecialized genetic algorithm to solve the short term transmis-sion network expansion planning,” in Proceedings of the IEEEBucharest PowerTech, pp. 1–7, Bucharest, Romania, July 2009.
[20] M. J. Rider, L. A. Gallego, R. Romero, and A. V. Garcıa,“Heuristic algorithm to solve the short term transmissionnetwork expansion planning,” in Proceedings of the IEEE PowerEngineering Society General Meeting (PES ’07), pp. 1–7, June2007.
[21] P. C. Chu and J. E. Beasley, “A genetic algorithm for the gen-eralised assignment problem,” Computers and Operations Re-search, vol. 24, no. 1, pp. 17–23, 1997.
[22] I. J. De Silva, M. J. Rider, R. Romero, and C. A. Murari,“Genetic algorithm of chu and beasley for static and multistagetransmission expansion planning,” in Proceedings of the IEEEPower Engineering Society General Meeting (PES ’06), Mon-treal, Canada, June 2006.
[23] D. E. Goldberg, Genetics Algorithms in Search, Optimizationand Machine Learning, Addison Wesley, Reading, Mass, USA,1989.
[24] C. R. Reeves, Modern Heuristics Techniques for CombinatorialProblems, McGraw Hill, 1995.
[25] M. Mitchell, An Introduction to Genetic Algorithms, MIT Press,1996.
[26] S. M. Sait and H. Youssef, Iterative Computer Algorithms withApplications in Engineering, Wiley-IEEE Computer SocietyPress, 1996.
[27] Z. Michalewicz, Genetic Algorithms + Data Structures = Evo-lution Programs, Artificial Intelligence, Springer, Berlin, Ger-many, 1996.
[28] K. N. Mıu, H. D. Chiang, and G. Darling, “Capacitor place-ment, replacement and control in large-scale distributionsystems by a ga-based two-stage algorithm,” IEEE Transactionson Power Systems, vol. 12, no. 3, pp. 1160–1166, 1997.
[29] A. H. Escobar, R. A. Gallego, and R. Romero, “Multistage andcoordinated planning of the expansion of transmission sys-tems,” IEEE Transactions on Power Systems, vol. 19, no. 2, pp.735–744, 2004.
[30] E. L. D. Silva, H. A. Gil, and J. M. Areiza, “Transmission net-work expansion planning under an improved genetic algo-rithm,” IEEE Transactions on Power Systems, vol. 15, no. 3, pp.1168–1175, 2000.
[31] W. M. Lin, F. S. Cheng, and M. T. Tsay, “Distribution feederreconfiguration with refined genetic algorithm,” IEE Proceed-ings: Generation, Transmission and Distribution, vol. 147, no.6, pp. 349–354, 2000.
[32] S. Venkatraman and G. G. Yen, “A generic framework forconstrained optimization using genetic algorithms,” IEEETransactions on Evolutionary Computation, vol. 9, no. 4, pp.424–435, 2005.
[33] K. Deb, “An efficient constraint handling method for geneticalgorithms,” Computer Methods in Applied Mechanics and En-gineering, vol. 186, no. 2–4, pp. 311–338, 2000.
[34] R. Romero, A. Monticelli, A. Garcia, and S. Haffner, “Testsystems and mathematical models for transmission networkexpansion planning,” IEE Proceedings: Generation, Transmis-sion and Distribution, vol. 149, no. 1, pp. 482–488, 2002.
[35] G. Latorre, R. Darıo Cruz, J. M. Areiza, and A. Villegas,“Classification of publications and models on transmissionexpansion planning,” IEEE Transactions on Power Systems, vol.18, no. 2, pp. 938–946, 2003.
[36] R. A. Gallego, A. Monticelli, and R. Romero, “Comparativestudies on non-convex optimization methods for transmissionnetwork expansion planning,” IEEE Transactions on PowerSystems, vol. 13, no. 3, pp. 822–828, 1998.
[37] E. L. Da Silva, J. M. Areiza Ortiz, G. C. De Oliveira, and S.Binato, “Transmission network expansion planning under aTabu Search approach,” IEEE Transactions on Power Systems,vol. 16, no. 1, pp. 62–68, 2001.
[38] T. Sum-Im, G. A. Taylor, M. R. Irving, and Y. H. Song, “Dif-ferential evolution algorithm for static and multistage trans-mission expansion planning,” IET Generation, Transmissionand Distribution, vol. 3, no. 4, pp. 365–384, 2009.
[39] S. H. M. Hashimoto, R. Romero, and J. R. S. Mantovani,“Efficient linear programming algorithm for the transmissionnetwork expansion planning problem,” IEE Proceedings: Gen-eration, Transmission and Distribution, vol. 150, no. 5, pp. 536–542, 2003.
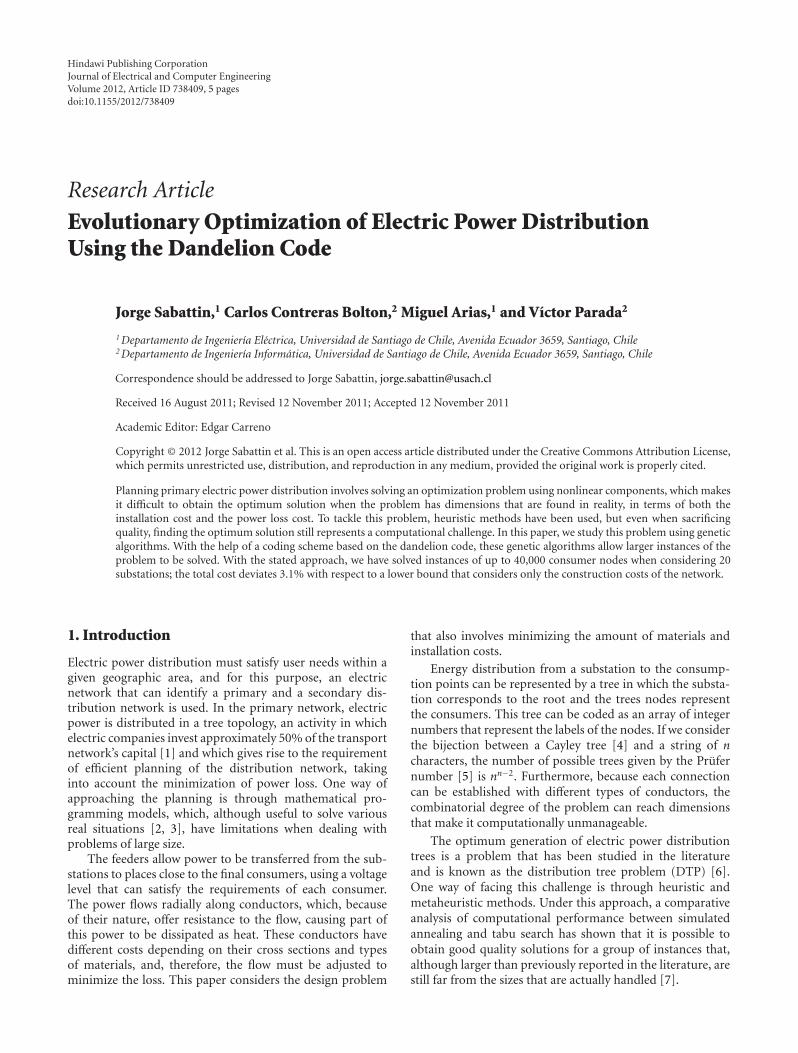
Hindawi Publishing CorporationJournal of Electrical and Computer EngineeringVolume 2012, Article ID 738409, 5 pagesdoi:10.1155/2012/738409
Research Article
Evolutionary Optimization of Electric Power DistributionUsing the Dandelion Code
Jorge Sabattin,1 Carlos Contreras Bolton,2 Miguel Arias,1 and Vıctor Parada2
1 Departamento de Ingenierıa Electrica, Universidad de Santiago de Chile, Avenida Ecuador 3659, Santiago, Chile2 Departamento de Ingenierıa Informatica, Universidad de Santiago de Chile, Avenida Ecuador 3659, Santiago, Chile
Correspondence should be addressed to Jorge Sabattin, [email protected]
Received 16 August 2011; Revised 12 November 2011; Accepted 12 November 2011
Academic Editor: Edgar Carreno
Copyright © 2012 Jorge Sabattin et al. This is an open access article distributed under the Creative Commons Attribution License,which permits unrestricted use, distribution, and reproduction in any medium, provided the original work is properly cited.
Planning primary electric power distribution involves solving an optimization problem using nonlinear components, which makesit difficult to obtain the optimum solution when the problem has dimensions that are found in reality, in terms of both theinstallation cost and the power loss cost. To tackle this problem, heuristic methods have been used, but even when sacrificingquality, finding the optimum solution still represents a computational challenge. In this paper, we study this problem using geneticalgorithms. With the help of a coding scheme based on the dandelion code, these genetic algorithms allow larger instances of theproblem to be solved. With the stated approach, we have solved instances of up to 40,000 consumer nodes when considering 20substations; the total cost deviates 3.1% with respect to a lower bound that considers only the construction costs of the network.
1. Introduction
Electric power distribution must satisfy user needs within agiven geographic area, and for this purpose, an electricnetwork that can identify a primary and a secondary dis-tribution network is used. In the primary network, electricpower is distributed in a tree topology, an activity in whichelectric companies invest approximately 50% of the transportnetwork’s capital [1] and which gives rise to the requirementof efficient planning of the distribution network, takinginto account the minimization of power loss. One way ofapproaching the planning is through mathematical pro-gramming models, which, although useful to solve variousreal situations [2, 3], have limitations when dealing withproblems of large size.
The feeders allow power to be transferred from the sub-stations to places close to the final consumers, using a voltagelevel that can satisfy the requirements of each consumer.The power flows radially along conductors, which, becauseof their nature, offer resistance to the flow, causing part ofthis power to be dissipated as heat. These conductors havedifferent costs depending on their cross sections and typesof materials, and, therefore, the flow must be adjusted tominimize the loss. This paper considers the design problem
that also involves minimizing the amount of materials andinstallation costs.
Energy distribution from a substation to the consump-tion points can be represented by a tree in which the substa-tion corresponds to the root and the trees nodes representthe consumers. This tree can be coded as an array of integernumbers that represent the labels of the nodes. If we considerthe bijection between a Cayley tree [4] and a string of ncharacters, the number of possible trees given by the Prufernumber [5] is nn−2. Furthermore, because each connectioncan be established with different types of conductors, thecombinatorial degree of the problem can reach dimensionsthat make it computationally unmanageable.
The optimum generation of electric power distributiontrees is a problem that has been studied in the literatureand is known as the distribution tree problem (DTP) [6].One way of facing this challenge is through heuristic andmetaheuristic methods. Under this approach, a comparativeanalysis of computational performance between simulatedannealing and tabu search has shown that it is possible toobtain good quality solutions for a group of instances that,although larger than previously reported in the literature, arestill far from the sizes that are actually handled [7].
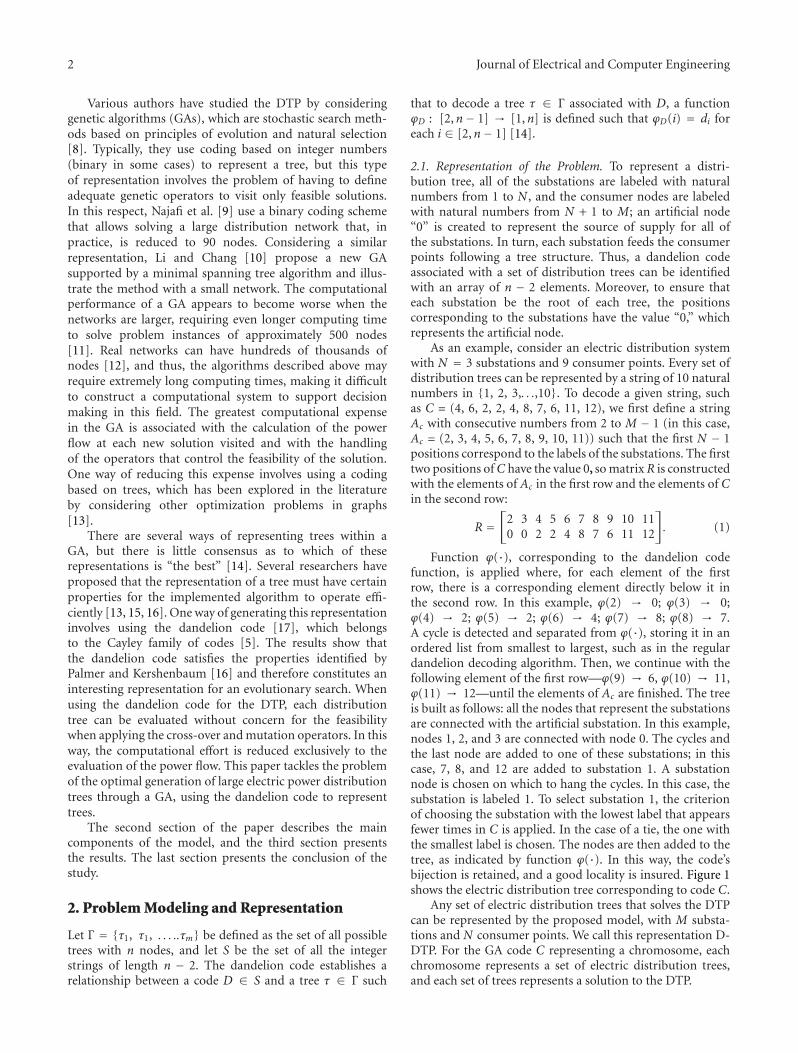
2 Journal of Electrical and Computer Engineering
Various authors have studied the DTP by consideringgenetic algorithms (GAs), which are stochastic search meth-ods based on principles of evolution and natural selection[8]. Typically, they use coding based on integer numbers(binary in some cases) to represent a tree, but this typeof representation involves the problem of having to defineadequate genetic operators to visit only feasible solutions.In this respect, Najafi et al. [9] use a binary coding schemethat allows solving a large distribution network that, inpractice, is reduced to 90 nodes. Considering a similarrepresentation, Li and Chang [10] propose a new GAsupported by a minimal spanning tree algorithm and illus-trate the method with a small network. The computationalperformance of a GA appears to become worse when thenetworks are larger, requiring even longer computing timeto solve problem instances of approximately 500 nodes[11]. Real networks can have hundreds of thousands ofnodes [12], and thus, the algorithms described above mayrequire extremely long computing times, making it difficultto construct a computational system to support decisionmaking in this field. The greatest computational expensein the GA is associated with the calculation of the powerflow at each new solution visited and with the handlingof the operators that control the feasibility of the solution.One way of reducing this expense involves using a codingbased on trees, which has been explored in the literatureby considering other optimization problems in graphs[13].
There are several ways of representing trees within aGA, but there is little consensus as to which of theserepresentations is “the best” [14]. Several researchers haveproposed that the representation of a tree must have certainproperties for the implemented algorithm to operate effi-ciently [13, 15, 16]. One way of generating this representationinvolves using the dandelion code [17], which belongsto the Cayley family of codes [5]. The results show thatthe dandelion code satisfies the properties identified byPalmer and Kershenbaum [16] and therefore constitutes aninteresting representation for an evolutionary search. Whenusing the dandelion code for the DTP, each distributiontree can be evaluated without concern for the feasibilitywhen applying the cross-over and mutation operators. In thisway, the computational effort is reduced exclusively to theevaluation of the power flow. This paper tackles the problemof the optimal generation of large electric power distributiontrees through a GA, using the dandelion code to representtrees.
The second section of the paper describes the maincomponents of the model, and the third section presentsthe results. The last section presents the conclusion of thestudy.
2. Problem Modeling and Representation
Let Γ = {τ1, τ1, . . . ..τm} be defined as the set of all possibletrees with n nodes, and let S be the set of all the integerstrings of length n − 2. The dandelion code establishes arelationship between a code D ∈ S and a tree τ ∈ Γ such
that to decode a tree τ ∈ Γ associated with D, a functionϕD : [2,n− 1] → [1,n] is defined such that ϕD(i) = di foreach i ∈ [2,n− 1] [14].
2.1. Representation of the Problem. To represent a distri-bution tree, all of the substations are labeled with naturalnumbers from 1 to N , and the consumer nodes are labeledwith natural numbers from N + 1 to M; an artificial node“0” is created to represent the source of supply for all ofthe substations. In turn, each substation feeds the consumerpoints following a tree structure. Thus, a dandelion codeassociated with a set of distribution trees can be identifiedwith an array of n − 2 elements. Moreover, to ensure thateach substation be the root of each tree, the positionscorresponding to the substations have the value “0,” whichrepresents the artificial node.
As an example, consider an electric distribution systemwith N = 3 substations and 9 consumer points. Every set ofdistribution trees can be represented by a string of 10 naturalnumbers in {1, 2, 3,. . .,10}. To decode a given string, suchas C = (4, 6, 2, 2, 4, 8, 7, 6, 11, 12), we first define a stringAc with consecutive numbers from 2 to M − 1 (in this case,Ac = (2, 3, 4, 5, 6, 7, 8, 9, 10, 11)) such that the first N − 1positions correspond to the labels of the substations. The firsttwo positions ofC have the value 0, so matrixR is constructedwith the elements of Ac in the first row and the elements of Cin the second row:
R =[
2 3 4 5 6 7 8 9 10 110 0 2 2 4 8 7 6 11 12
]. (1)
Function ϕ(·), corresponding to the dandelion codefunction, is applied where, for each element of the firstrow, there is a corresponding element directly below it inthe second row. In this example, ϕ(2) → 0; ϕ(3) → 0;ϕ(4) → 2; ϕ(5) → 2; ϕ(6) → 4; ϕ(7) → 8; ϕ(8) → 7.A cycle is detected and separated from ϕ(·), storing it in anordered list from smallest to largest, such as in the regulardandelion decoding algorithm. Then, we continue with thefollowing element of the first row—ϕ(9) → 6, ϕ(10) → 11,ϕ(11) → 12—until the elements of Ac are finished. The treeis built as follows: all the nodes that represent the substationsare connected with the artificial substation. In this example,nodes 1, 2, and 3 are connected with node 0. The cycles andthe last node are added to one of these substations; in thiscase, 7, 8, and 12 are added to substation 1. A substationnode is chosen on which to hang the cycles. In this case, thesubstation is labeled 1. To select substation 1, the criterionof choosing the substation with the lowest label that appearsfewer times in C is applied. In the case of a tie, the one withthe smallest label is chosen. The nodes are then added to thetree, as indicated by function ϕ(·). In this way, the code’sbijection is retained, and a good locality is insured. Figure 1shows the electric distribution tree corresponding to code C.
Any set of electric distribution trees that solves the DTPcan be represented by the proposed model, with M substa-tions and N consumer points. We call this representation D-DTP. For the GA code C representing a chromosome, eachchromosome represents a set of electric distribution trees,and each set of trees represents a solution to the DTP.
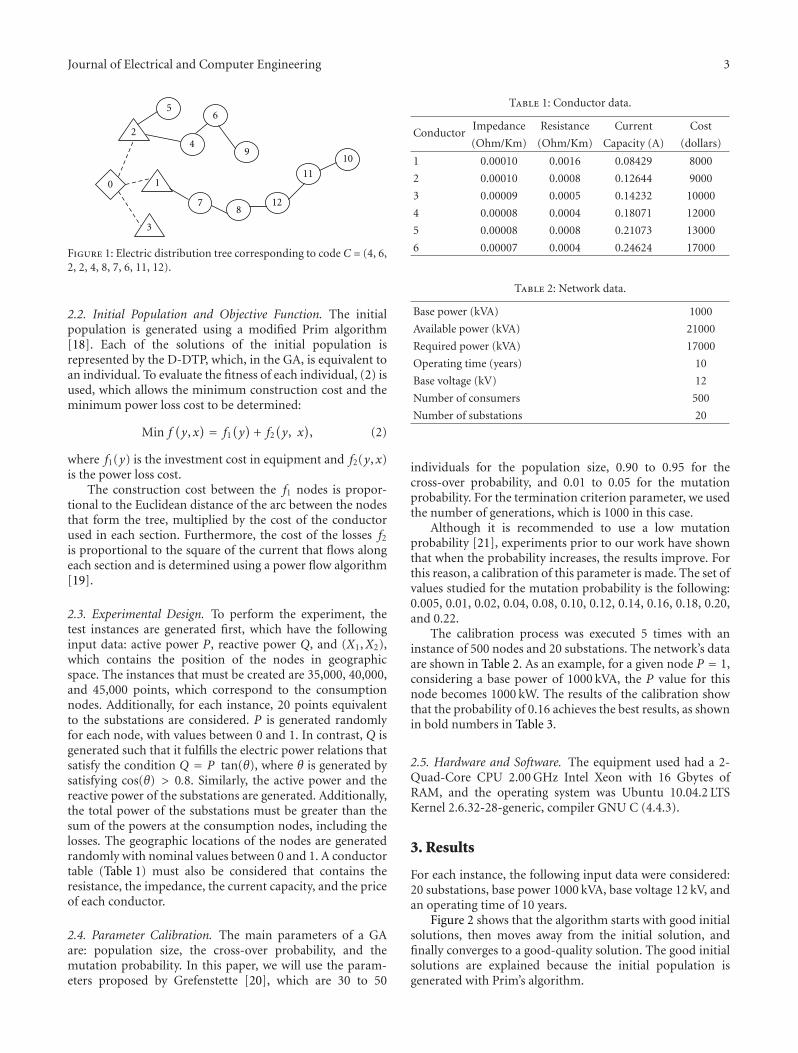
Journal of Electrical and Computer Engineering 3
0 1
2
3
4
56
78
910
11
12
Figure 1: Electric distribution tree corresponding to code C = (4, 6,2, 2, 4, 8, 7, 6, 11, 12).
2.2. Initial Population and Objective Function. The initialpopulation is generated using a modified Prim algorithm[18]. Each of the solutions of the initial population isrepresented by the D-DTP, which, in the GA, is equivalent toan individual. To evaluate the fitness of each individual, (2) isused, which allows the minimum construction cost and theminimum power loss cost to be determined:
Min f(y, x) = f1
(y)
+ f2(y, x
), (2)
where f1(y) is the investment cost in equipment and f2(y, x)is the power loss cost.
The construction cost between the f1 nodes is propor-tional to the Euclidean distance of the arc between the nodesthat form the tree, multiplied by the cost of the conductorused in each section. Furthermore, the cost of the losses f2is proportional to the square of the current that flows alongeach section and is determined using a power flow algorithm[19].
2.3. Experimental Design. To perform the experiment, thetest instances are generated first, which have the followinginput data: active power P, reactive power Q, and (X1,X2),which contains the position of the nodes in geographicspace. The instances that must be created are 35,000, 40,000,and 45,000 points, which correspond to the consumptionnodes. Additionally, for each instance, 20 points equivalentto the substations are considered. P is generated randomlyfor each node, with values between 0 and 1. In contrast, Q isgenerated such that it fulfills the electric power relations thatsatisfy the condition Q = P tan(θ), where θ is generated bysatisfying cos(θ) > 0.8. Similarly, the active power and thereactive power of the substations are generated. Additionally,the total power of the substations must be greater than thesum of the powers at the consumption nodes, including thelosses. The geographic locations of the nodes are generatedrandomly with nominal values between 0 and 1. A conductortable (Table 1) must also be considered that contains theresistance, the impedance, the current capacity, and the priceof each conductor.
2.4. Parameter Calibration. The main parameters of a GAare: population size, the cross-over probability, and themutation probability. In this paper, we will use the param-eters proposed by Grefenstette [20], which are 30 to 50
Table 1: Conductor data.
ConductorImpedance Resistance Current Cost
(Ohm/Km) (Ohm/Km) Capacity (A) (dollars)
1 0.00010 0.0016 0.08429 8000
2 0.00010 0.0008 0.12644 9000
3 0.00009 0.0005 0.14232 10000
4 0.00008 0.0004 0.18071 12000
5 0.00008 0.0008 0.21073 13000
6 0.00007 0.0004 0.24624 17000
Table 2: Network data.
Base power (kVA) 1000
Available power (kVA) 21000
Required power (kVA) 17000
Operating time (years) 10
Base voltage (kV) 12
Number of consumers 500
Number of substations 20
individuals for the population size, 0.90 to 0.95 for thecross-over probability, and 0.01 to 0.05 for the mutationprobability. For the termination criterion parameter, we usedthe number of generations, which is 1000 in this case.
Although it is recommended to use a low mutationprobability [21], experiments prior to our work have shownthat when the probability increases, the results improve. Forthis reason, a calibration of this parameter is made. The set ofvalues studied for the mutation probability is the following:0.005, 0.01, 0.02, 0.04, 0.08, 0.10, 0.12, 0.14, 0.16, 0.18, 0.20,and 0.22.
The calibration process was executed 5 times with aninstance of 500 nodes and 20 substations. The network’s dataare shown in Table 2. As an example, for a given node P = 1,considering a base power of 1000 kVA, the P value for thisnode becomes 1000 kW. The results of the calibration showthat the probability of 0.16 achieves the best results, as shownin bold numbers in Table 3.
2.5. Hardware and Software. The equipment used had a 2-Quad-Core CPU 2.00 GHz Intel Xeon with 16 Gbytes ofRAM, and the operating system was Ubuntu 10.04.2 LTSKernel 2.6.32-28-generic, compiler GNU C (4.4.3).
3. Results
For each instance, the following input data were considered:20 substations, base power 1000 kVA, base voltage 12 kV, andan operating time of 10 years.
Figure 2 shows that the algorithm starts with good initialsolutions, then moves away from the initial solution, andfinally converges to a good-quality solution. The good initialsolutions are explained because the initial population isgenerated with Prim’s algorithm.
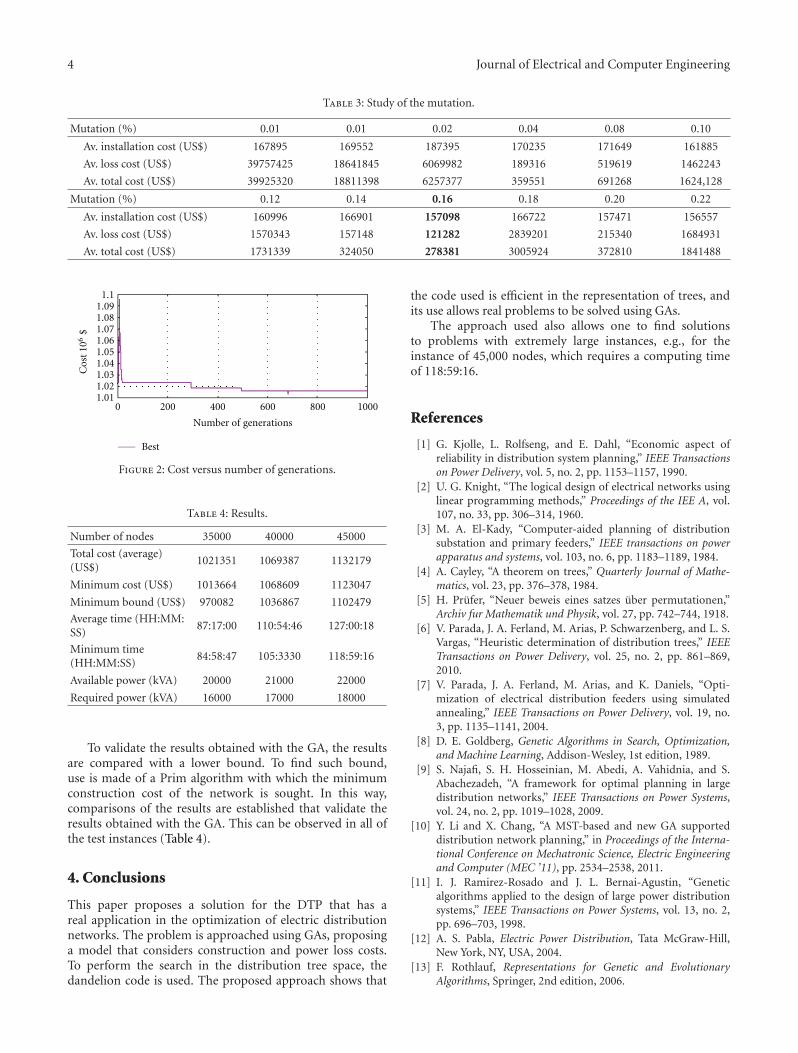
4 Journal of Electrical and Computer Engineering
Table 3: Study of the mutation.
Mutation (%) 0.01 0.01 0.02 0.04 0.08 0.10
Av. installation cost (US$) 167895 169552 187395 170235 171649 161885
Av. loss cost (US$) 39757425 18641845 6069982 189316 519619 1462243
Av. total cost (US$) 39925320 18811398 6257377 359551 691268 1624,128
Mutation (%) 0.12 0.14 0.16 0.18 0.20 0.22
Av. installation cost (US$) 160996 166901 157098 166722 157471 156557
Av. loss cost (US$) 1570343 157148 121282 2839201 215340 1684931
Av. total cost (US$) 1731339 324050 278381 3005924 372810 1841488
1.11.091.081.071.061.051.041.031.021.01
0 200 400 600 800 1000
Cos
t 10
6$
Number of generations
Best
Figure 2: Cost versus number of generations.
Table 4: Results.
Number of nodes 35000 40000 45000
Total cost (average)(US$)
1021351 1069387 1132179
Minimum cost (US$) 1013664 1068609 1123047
Minimum bound (US$) 970082 1036867 1102479
Average time (HH:MM:SS)
87:17:00 110:54:46 127:00:18
Minimum time(HH:MM:SS)
84:58:47 105:3330 118:59:16
Available power (kVA) 20000 21000 22000
Required power (kVA) 16000 17000 18000
To validate the results obtained with the GA, the resultsare compared with a lower bound. To find such bound,use is made of a Prim algorithm with which the minimumconstruction cost of the network is sought. In this way,comparisons of the results are established that validate theresults obtained with the GA. This can be observed in all ofthe test instances (Table 4).
4. Conclusions
This paper proposes a solution for the DTP that has areal application in the optimization of electric distributionnetworks. The problem is approached using GAs, proposinga model that considers construction and power loss costs.To perform the search in the distribution tree space, thedandelion code is used. The proposed approach shows that
the code used is efficient in the representation of trees, andits use allows real problems to be solved using GAs.
The approach used also allows one to find solutionsto problems with extremely large instances, e.g., for theinstance of 45,000 nodes, which requires a computing timeof 118:59:16.
References
[1] G. Kjolle, L. Rolfseng, and E. Dahl, “Economic aspect ofreliability in distribution system planning,” IEEE Transactionson Power Delivery, vol. 5, no. 2, pp. 1153–1157, 1990.
[2] U. G. Knight, “The logical design of electrical networks usinglinear programming methods,” Proceedings of the IEE A, vol.107, no. 33, pp. 306–314, 1960.
[3] M. A. El-Kady, “Computer-aided planning of distributionsubstation and primary feeders,” IEEE transactions on powerapparatus and systems, vol. 103, no. 6, pp. 1183–1189, 1984.
[4] A. Cayley, “A theorem on trees,” Quarterly Journal of Mathe-matics, vol. 23, pp. 376–378, 1984.
[5] H. Prufer, “Neuer beweis eines satzes uber permutationen,”Archiv fur Mathematik und Physik, vol. 27, pp. 742–744, 1918.
[6] V. Parada, J. A. Ferland, M. Arias, P. Schwarzenberg, and L. S.Vargas, “Heuristic determination of distribution trees,” IEEETransactions on Power Delivery, vol. 25, no. 2, pp. 861–869,2010.
[7] V. Parada, J. A. Ferland, M. Arias, and K. Daniels, “Opti-mization of electrical distribution feeders using simulatedannealing,” IEEE Transactions on Power Delivery, vol. 19, no.3, pp. 1135–1141, 2004.
[8] D. E. Goldberg, Genetic Algorithms in Search, Optimization,and Machine Learning, Addison-Wesley, 1st edition, 1989.
[9] S. Najafi, S. H. Hosseinian, M. Abedi, A. Vahidnia, and S.Abachezadeh, “A framework for optimal planning in largedistribution networks,” IEEE Transactions on Power Systems,vol. 24, no. 2, pp. 1019–1028, 2009.
[10] Y. Li and X. Chang, “A MST-based and new GA supporteddistribution network planning,” in Proceedings of the Interna-tional Conference on Mechatronic Science, Electric Engineeringand Computer (MEC ’11), pp. 2534–2538, 2011.
[11] I. J. Ramirez-Rosado and J. L. Bernai-Agustin, “Geneticalgorithms applied to the design of large power distributionsystems,” IEEE Transactions on Power Systems, vol. 13, no. 2,pp. 696–703, 1998.
[12] A. S. Pabla, Electric Power Distribution, Tata McGraw-Hill,New York, NY, USA, 2004.
[13] F. Rothlauf, Representations for Genetic and EvolutionaryAlgorithms, Springer, 2nd edition, 2006.
Journal of Electrical and Computer Engineering 5
[14] T. Paulden and D. K. Smith, “From the Dandelion Code to therainbow code: a class of bijective spanning tree representationswith linear complexity and bounded locality,” IEEE Transac-tions on Evolutionary Computation, vol. 10, no. 2, pp. 108–123,2006.
[15] F. Rothlauf, “Towards a theory of representations for geneticand evolutionary algorithms,” University of Bayreuth, Alema-nia, 2001.
[16] C. C. Palmer and A. Kershenbaum, “Representing trees ingenetic algorithms,” in Proceedings of IEEE Conference onEvolutionary Computation, vol. 1, pp. 379–384, 1994.
[17] S. Picciotto, “How to encode a tree,” Univ. California, Califor-nia, 1999.
[18] R. C. Prim, “Shortest connection networks and some general-izations,” Bell System Technical Journal, vol. 36, pp. 1389–1401,1957.
[19] M. Arias, H. Sanhueza, and V. H. Quintana, “Nuevo algoritmopara calculo de flujo de potencia en alimentadores de dis-tribucion,” in the 6th Congreso Chileno de Ingenierıa Electrica,Punta Arenas, Chile, 1995.
[20] J. J. Grefenstette, “Optimization of control parameters forgenetic algorithms,” IEEE Transactions on Systems, Man andCybernetics, vol. 16, no. 1, pp. 122–128, 1986.
[21] K. A. De Jong, “An analysis of the behavior of a class of geneticadaptive systems,” University of Michigan, USA, 1975.
Hindawi Publishing CorporationJournal of Electrical and Computer EngineeringVolume 2012, Article ID 317315, 8 pagesdoi:10.1155/2012/317315
Research Article
Multicriteria Reconfiguration of Distribution Network withDistributed Generation
N. I. Voropai1 and B. Bat-Undraal2
1 Electric Power Systems Department, Energy Systems Institute, Russian Academy of Sciences, Siberian Branch, 130 Lermontov Street,Irkutsk 664033, Russia
2 Power Engineering School, Mongolian University of Science and Technology, Baga Toiruu, VIII khoroo, Sukhbaatar,Ulaanbaatar 210646, Mongolia
Correspondence should be addressed to N. I. Voropai, [email protected]
Received 2 August 2011; Revised 3 November 2011; Accepted 7 November 2011
Academic Editor: Edgar Carreno
Copyright © 2012 N. I. Voropai and B. Bat-Undraal. This is an open access article distributed under the Creative CommonsAttribution License, which permits unrestricted use, distribution, and reproduction in any medium, provided the original work isproperly cited.
The paper addresses the problem of multicriteria reconfiguration of distribution network with distributed generation according tothe criterion of minimum power loss under normal conditions and the criterion of power supply reliability under postemergencyconditions. Efficient heuristic and multicriteria methods are used to solve the problem including advanced ant colony algorithmfor minimum loss reconfiguration of distribution network, the sorting-out algorithm of cell formation for island performing inpostemergency network, and the successive concessions method for multicriteria decision making. Demonstration studies havebeen carried out for the Central Power System of Mongolia.
1. Introduction
Distribution networks are normally operated according toradial schemes. The problem of distribution network recon-figuration aimed at determining the most rational reconfig-uration is as a rule solved by the criteria of minimum ac-tive power losses in the network, minimum undersuppliedpower, and minimum time for power supply restoration [1].A review of reconfiguration methods that include classicalmethods of mathematical programming and modern heuris-tic methods based on artificial intelligence (genetic algo-rithms, simulated annealing, tabu search, ant colony meth-ods, etc.) is given in [2]. In many cases the problem is consid-ered as a multicriteria one with reliability criterion formulat-ed through damages to consumers [3, 4] and so forth.
In the last decade much attention has been paid to disa-tributed generation connected to distribution network [5, 6]and so forth. The main factors stimulating the developmentof distributed generation are as follows:
(i) adaptation of consumers to market uncertaintyin electricity industry development and electricity
prices which fosters a decrease in risks of powershortage and increase of energy security;
(ii) enhancement of adaptability of electric power sys-tems to the uncertainty of market conditions and,hence, decrease of investment risks;
(iii) emergence of new highly efficient energy technolo-gies (gas turbines and combined-cycle units);
(iv) a growing share of gas in the fuel mix of power plants;
(v) tightening the environmental requirements to en-courage the use of renewable energy sources (hydro,wind, biomass, etc.) with government support.
Distributed generation offers the possibility of maintain-ing voltage levels at nodes of distribution network, decreas-ing active and reactive power losses in the network, providinghigher level of power supply reliability by maintaining powersupply from distributed generation to some consumers in thecase of emergency disconnection of the main supply point inthe power supply system (islanding) [5, 7, 8].
Thus the coordination problem arises in controllingnormal conditions of distribution network with distributed
2 Journal of Electrical and Computer Engineering
generation through the network reconfiguration, to provideminimum power losses and to meet the required voltageand current limits, as well as in controlling postemergencyconditions through islanding, to provide minimum powershortage due to the loss of supply substation of mainpower grid (main supply point). Such multicriteria problemscannot always be reduced to a one-criterion statement byintroducing weighted coefficients for individual criteria. Inthis paper this problem is solved by the method of successiveconcessions [9]. The method of ant colony is used fordistribution network reconfiguration. Islanding is performedby forming cells [10] and load flow is calculated by thebackward/forward sweep algorithm [7].
2. Technology of Study
2.1. General Approach. A general approach to control coordi-nation of normal and postemergency conditions of distribu-tion network including distributed generation is as follows.
Under normal conditions the control aims to reconfigurethe distribution network by opening loops. The minimum ofactive power losses in the network is given by the followingcriterion:
∑
l∈LRlkI
2lk −→ min, k ∈ K , (1)
where K is a set of considered normal conditions accordingto the load curves of consumers and loading of distributedgeneration plants; L is the number of branches in the net-work; Rlk and Ilk are active resistance and current in branchl for operation conditions k.
Under postemergency conditions, if the main supplypoint is lost, the problem of islanding arises with the islandsincluding distributed generation plants that operate for a bal-anced load. The criterion of islanding is the minimum pow-er shortage in the postemergency conditions:
⎛⎝∑
n∈NPnk −
∑
n∗∈N∗Pn∗ j
⎞⎠ −→ min, k ∈ K , j ∈ J , (2)
where J is a set of considered postemergency conditions withthe main supply point lost; Pnk is the load at node n inthe network under normal condition k; Pn∗ j is the load atnode n∗ in the postemergency condition j of the networkpart including N∗ nodes, that belong to all islands; N is thenumber of network nodes.
In control coordination of normal and postemergencyconditions of distribution network, an important problemis to check whether the constraints on voltage levels at nodesand currents in network branches are met under both normaland postemergency conditions:
Vnkmin ≤ Vnk ≤ Vnkmax, (3)
Vnj min ≤ Vnj ≤ Vnj max, (4)
Ilk ≤ Ilkmax, (5)
Il j ≤ Il j max. (6)
Instead of (5) and (6), the values of power transmittedby the network branches can be controlled using similarinequalities.
Constraints (3)–(6) in the optimization of criteria (1)and (2) are checked on the basis of radial network power flowcalculations. The calculations employ backward/forwardsweep algorithm with respect to distributed generationplants connected to the distribution network [7]. In orderto minimize the number of such calculations, the intervalimplementation of backward/forward sweep algorithm [11]is applied which allows the ranges of voltage and currentvalues to be obtained for groups of conditions.
There are two specific features of the problem related toislanding and determining postemergency conditions. Thefirst one concerns the presence of constraints (4) and (6),which means different requirements for voltage levels atnodes and maximum load of network branches in the poste-mergency conditions as compared to the normal conditions.The second one related to islanding is implementation of theprinciple of maintaining power supply, first of all, to the mostimportant consumers at the distribution network nodes.
One of the important control coordination problemsof normal and postemergency conditions of distributionnetworks is minimization of switchings while passing fromnormal to postemergency conditions. This is importantin terms of minimizing the number of switching devices,their possible failures, and personnel’s errors. Therefore, theoptimization problem (1)–(6) is a complex two-criterionproblem. Let us consider an expedient approach to itssolution.
A widely used approach is the consideration for powersupply reliability through the damages due to power under-supply which allows the multicriteria problem to be reducedto a one-criterion one [3, 4] and so forth. To this end itis necessary to have reliable estimates of specific damagesdue to power supply interruption for different consumers. Inreality these estimates cannot be obtained for all types of con-sumers; particularly it concerns the consumers with produc-tion processes where power supply interruptions may pose athreat to the life of people or to the environment. Thereforein a general case criteria (1) and (2) should be consideredas independent and irreducible to one complex criterion. Inthe paper the method of successive concessions is used as amethod for solving the two-criterion problem (1)–(6). Theminimization by criterion (1) with regard to constraints (3)and (5) is carried out by the ant colony method, islanding(subproblems (2), (4), and (6)) by the combinatorial al-gorithm through formation of cells.
2.2. Minimum Loss Reconfiguration. Ant colony algorithm isa multiagent system in which the behavior of each singleagent, called artificial ant, is inspired by the behavior ofreal ants [12]. Ant colony algorithm is one of the mostsuccessful examples of swarm intelligent systems and hasbeen applied to many combinatorial optimization problems.Ant colony algorithm has been used lately to solve minimumloss reconfiguration problem [13–17].
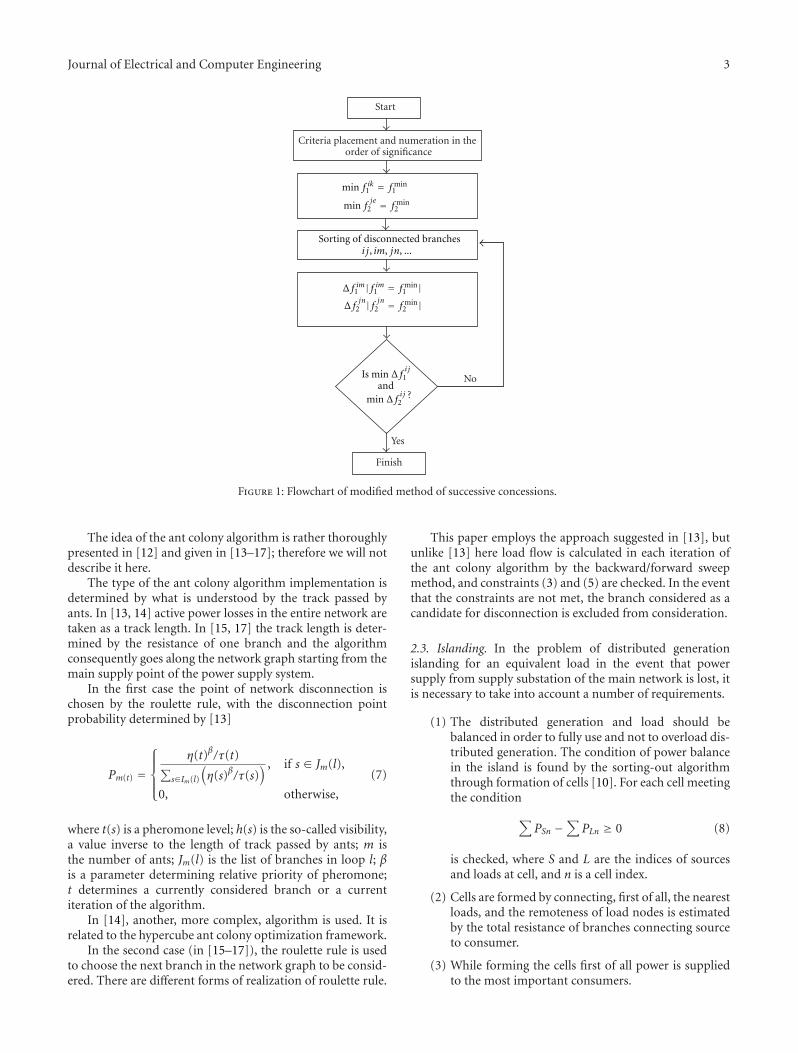
Journal of Electrical and Computer Engineering 3
Start
Criteria placement and numeration in the order of significance
No
?
Yes
Finish
Sorting of disconnected branchesi j, im, jn, ...
Is min Δ fi j
1and
min Δ fi j
2
min f ik1 = f min1
min fje
2 = f min2
Δ f im1 | f im1 = f min1 |
Δ fjn
2 | f jn2 = f min2 |
Figure 1: Flowchart of modified method of successive concessions.
The idea of the ant colony algorithm is rather thoroughlypresented in [12] and given in [13–17]; therefore we will notdescribe it here.
The type of the ant colony algorithm implementation isdetermined by what is understood by the track passed byants. In [13, 14] active power losses in the entire network aretaken as a track length. In [15, 17] the track length is deter-mined by the resistance of one branch and the algorithmconsequently goes along the network graph starting from themain supply point of the power supply system.
In the first case the point of network disconnection ischosen by the roulette rule, with the disconnection pointprobability determined by [13]
Pm(t) =
⎧⎪⎪⎨⎪⎪⎩
η(t)β/τ(t)∑
s∈Im(l)
(η(s)β/τ(s)
) , if s ∈ Jm(l),
0, otherwise,
(7)
where t(s) is a pheromone level; h(s) is the so-called visibility,a value inverse to the length of track passed by ants; m isthe number of ants; Jm(l) is the list of branches in loop l; βis a parameter determining relative priority of pheromone;t determines a currently considered branch or a currentiteration of the algorithm.
In [14], another, more complex, algorithm is used. It isrelated to the hypercube ant colony optimization framework.
In the second case (in [15–17]), the roulette rule is usedto choose the next branch in the network graph to be consid-ered. There are different forms of realization of roulette rule.
This paper employs the approach suggested in [13], butunlike [13] here load flow is calculated in each iteration ofthe ant colony algorithm by the backward/forward sweepmethod, and constraints (3) and (5) are checked. In the eventthat the constraints are not met, the branch considered as acandidate for disconnection is excluded from consideration.
2.3. Islanding. In the problem of distributed generationislanding for an equivalent load in the event that powersupply from supply substation of the main network is lost, itis necessary to take into account a number of requirements.
(1) The distributed generation and load should bebalanced in order to fully use and not to overload dis-tributed generation. The condition of power balancein the island is found by the sorting-out algorithmthrough formation of cells [10]. For each cell meetingthe condition
∑PSn −
∑PLn ≥ 0 (8)
is checked, where S and L are the indices of sourcesand loads at cell, and n is a cell index.
(2) Cells are formed by connecting, first of all, the nearestloads, and the remoteness of load nodes is estimatedby the total resistance of branches connecting sourceto consumer.
(3) While forming the cells first of all power is suppliedto the most important consumers.
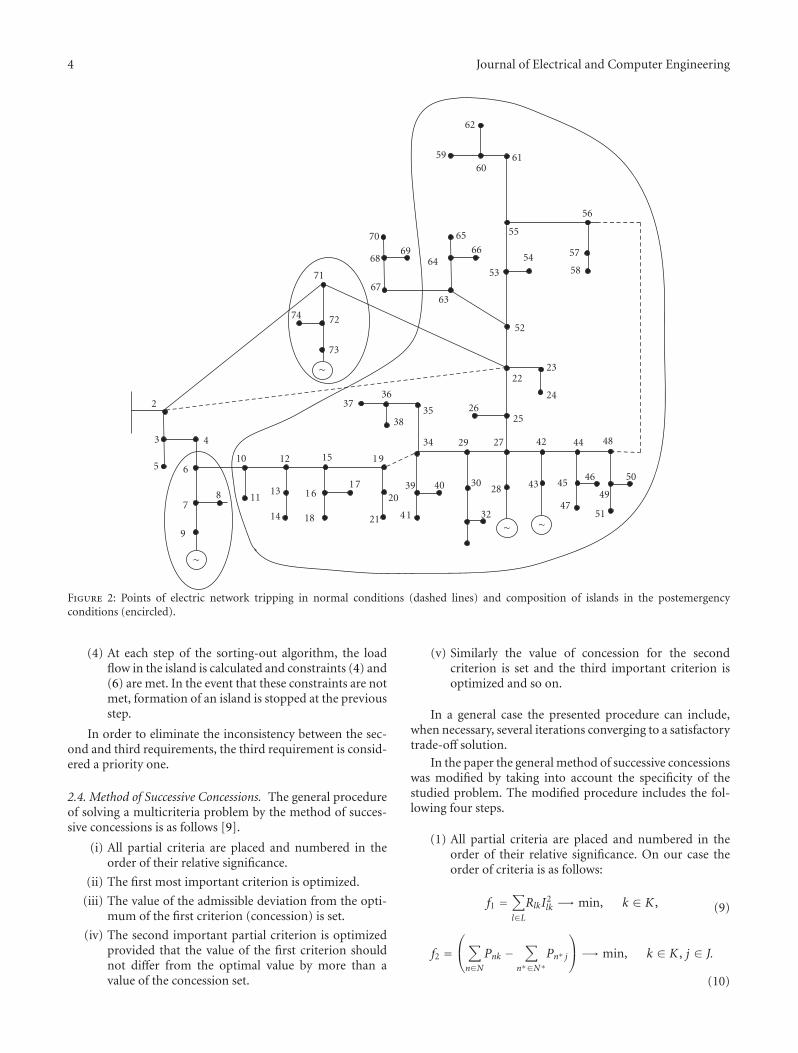
4 Journal of Electrical and Computer Engineering
10
2
3 4
5 6
78
9
12 15
1113
14
1617
18
19
20
21 41
4039 3028
32
43
27 422934
35
3637
3826
2223
24
74
71
72
73
45
47
46
49
51
50
4844
25
52
54
53
55
56
57
58
6367
68
70
6964
66
65
6160
59
62
∼
∼
∼ ∼
Figure 2: Points of electric network tripping in normal conditions (dashed lines) and composition of islands in the postemergencyconditions (encircled).
(4) At each step of the sorting-out algorithm, the loadflow in the island is calculated and constraints (4) and(6) are met. In the event that these constraints are notmet, formation of an island is stopped at the previousstep.
In order to eliminate the inconsistency between the sec-ond and third requirements, the third requirement is consid-ered a priority one.
2.4. Method of Successive Concessions. The general procedureof solving a multicriteria problem by the method of succes-sive concessions is as follows [9].
(i) All partial criteria are placed and numbered in theorder of their relative significance.
(ii) The first most important criterion is optimized.
(iii) The value of the admissible deviation from the opti-mum of the first criterion (concession) is set.
(iv) The second important partial criterion is optimizedprovided that the value of the first criterion shouldnot differ from the optimal value by more than avalue of the concession set.
(v) Similarly the value of concession for the secondcriterion is set and the third important criterion isoptimized and so on.
In a general case the presented procedure can include,when necessary, several iterations converging to a satisfactorytrade-off solution.
In the paper the general method of successive concessionswas modified by taking into account the specificity of thestudied problem. The modified procedure includes the fol-lowing four steps.
(1) All partial criteria are placed and numbered in theorder of their relative significance. On our case theorder of criteria is as follows:
f1 =∑
l∈LRlkI
2lk −→ min, k ∈ K , (9)
f2 =⎛⎝∑
n∈NPnk −
∑
n∗∈N∗Pn∗ j
⎞⎠ −→ min, k ∈ K , j ∈ J.
(10)
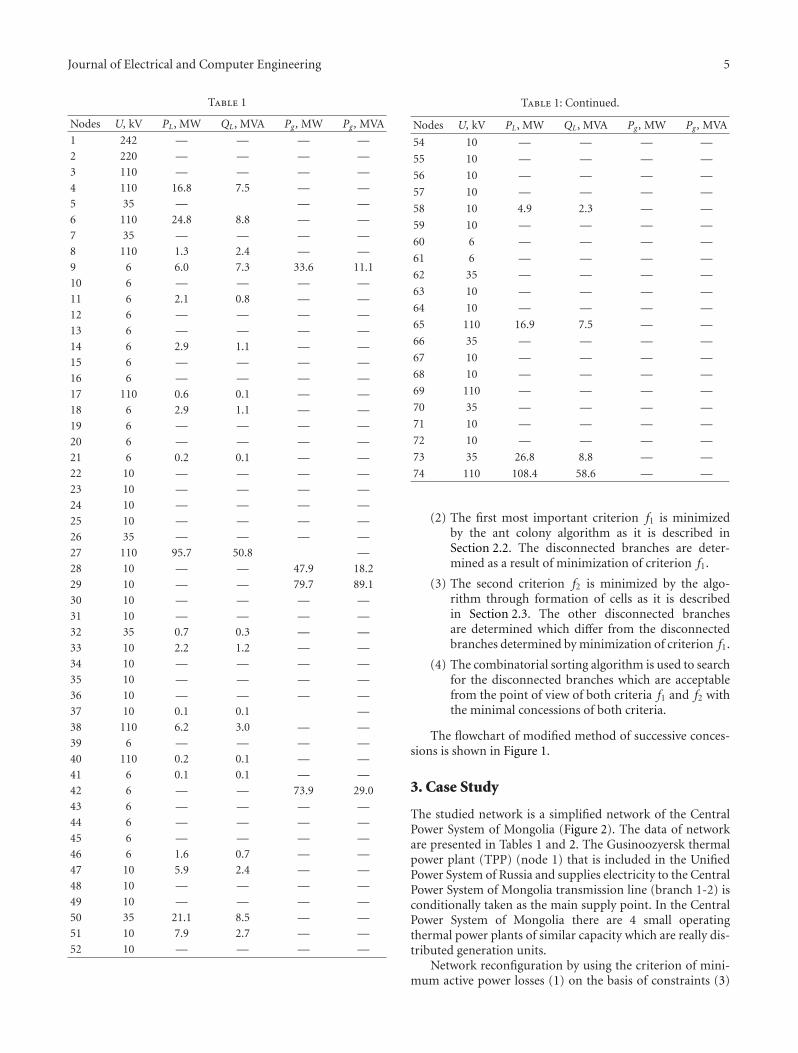
Journal of Electrical and Computer Engineering 5
Table 1
Nodes U, kV PL, MW QL, MVA Pg , MW Pg , MVA
1 242 — — — —
2 220 — — — —
3 110 — — — —
4 110 16.8 7.5 — —
5 35 — — —
6 110 24.8 8.8 — —
7 35 — — — —
8 110 1.3 2.4 — —
9 6 6.0 7.3 33.6 11.1
10 6 — — — —
11 6 2.1 0.8 — —
12 6 — — — —
13 6 — — — —
14 6 2.9 1.1 — —
15 6 — — — —
16 6 — — — —
17 110 0.6 0.1 — —
18 6 2.9 1.1 — —
19 6 — — — —
20 6 — — — —
21 6 0.2 0.1 — —
22 10 — — — —
23 10 — — — —
24 10 — — — —
25 10 — — — —
26 35 — — — —
27 110 95.7 50.8 —
28 10 — — 47.9 18.2
29 10 — — 79.7 89.1
30 10 — — — —
31 10 — — — —
32 35 0.7 0.3 — —
33 10 2.2 1.2 — —
34 10 — — — —
35 10 — — — —
36 10 — — — —
37 10 0.1 0.1 —
38 110 6.2 3.0 — —
39 6 — — — —
40 110 0.2 0.1 — —
41 6 0.1 0.1 — —
42 6 — — 73.9 29.0
43 6 — — — —
44 6 — — — —
45 6 — — — —
46 6 1.6 0.7 — —
47 10 5.9 2.4 — —
48 10 — — — —
49 10 — — — —
50 35 21.1 8.5 — —
51 10 7.9 2.7 — —
52 10 — — — —
Table 1: Continued.
Nodes U, kV PL, MW QL, MVA Pg , MW Pg , MVA
54 10 — — — —
55 10 — — — —
56 10 — — — —
57 10 — — — —
58 10 4.9 2.3 — —
59 10 — — — —
60 6 — — — —
61 6 — — — —
62 35 — — — —
63 10 — — — —
64 10 — — — —
65 110 16.9 7.5 — —
66 35 — — — —
67 10 — — — —
68 10 — — — —
69 110 — — — —
70 35 — — — —
71 10 — — — —
72 10 — — — —
73 35 26.8 8.8 — —
74 110 108.4 58.6 — —
(2) The first most important criterion f1 is minimizedby the ant colony algorithm as it is described inSection 2.2. The disconnected branches are deter-mined as a result of minimization of criterion f1.
(3) The second criterion f2 is minimized by the algo-rithm through formation of cells as it is describedin Section 2.3. The other disconnected branchesare determined which differ from the disconnectedbranches determined by minimization of criterion f1.
(4) The combinatorial sorting algorithm is used to searchfor the disconnected branches which are acceptablefrom the point of view of both criteria f1 and f2 withthe minimal concessions of both criteria.
The flowchart of modified method of successive conces-sions is shown in Figure 1.
3. Case Study
The studied network is a simplified network of the CentralPower System of Mongolia (Figure 2). The data of networkare presented in Tables 1 and 2. The Gusinoozyersk thermalpower plant (TPP) (node 1) that is included in the UnifiedPower System of Russia and supplies electricity to the CentralPower System of Mongolia transmission line (branch 1-2) isconditionally taken as the main supply point. In the CentralPower System of Mongolia there are 4 small operatingthermal power plants of similar capacity which are really dis-tributed generation units.
Network reconfiguration by using the criterion of mini-mum active power losses (1) on the basis of constraints (3)
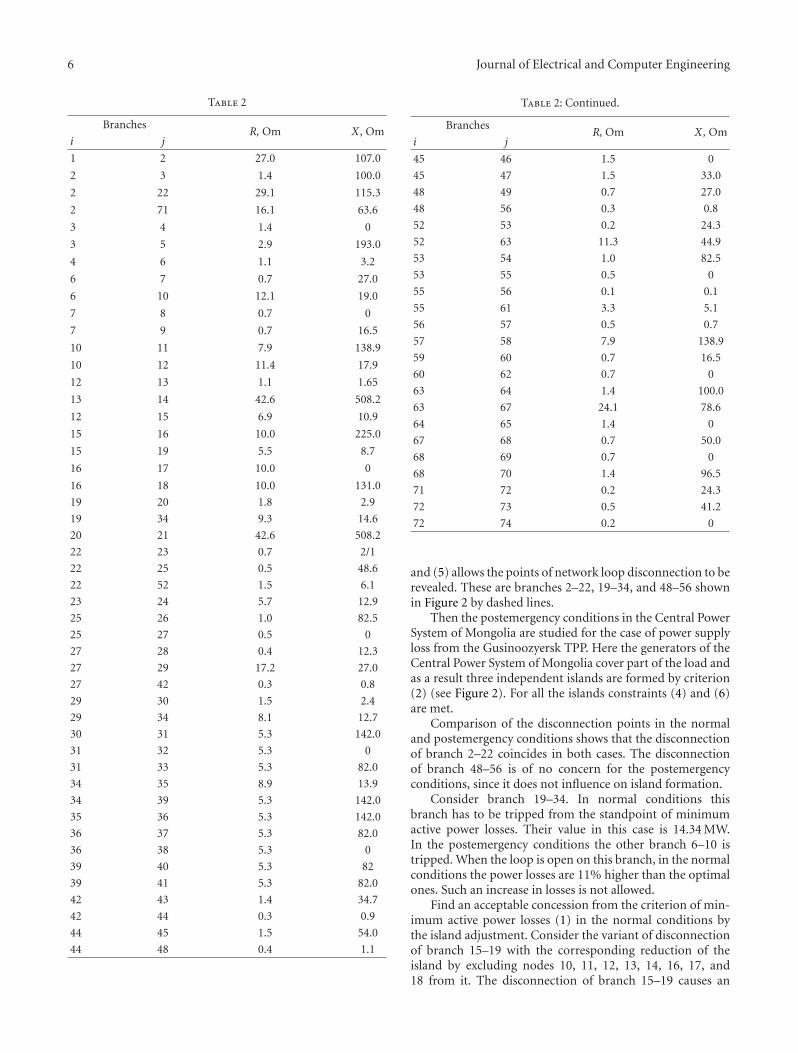
6 Journal of Electrical and Computer Engineering
Table 2
BranchesR, Om X , Om
i j
1 2 27.0 107.0
2 3 1.4 100.0
2 22 29.1 115.3
2 71 16.1 63.6
3 4 1.4 0
3 5 2.9 193.0
4 6 1.1 3.2
6 7 0.7 27.0
6 10 12.1 19.0
7 8 0.7 0
7 9 0.7 16.5
10 11 7.9 138.9
10 12 11.4 17.9
12 13 1.1 1.65
13 14 42.6 508.2
12 15 6.9 10.9
15 16 10.0 225.0
15 19 5.5 8.7
16 17 10.0 0
16 18 10.0 131.0
19 20 1.8 2.9
19 34 9.3 14.6
20 21 42.6 508.2
22 23 0.7 2/1
22 25 0.5 48.6
22 52 1.5 6.1
23 24 5.7 12.9
25 26 1.0 82.5
25 27 0.5 0
27 28 0.4 12.3
27 29 17.2 27.0
27 42 0.3 0.8
29 30 1.5 2.4
29 34 8.1 12.7
30 31 5.3 142.0
31 32 5.3 0
31 33 5.3 82.0
34 35 8.9 13.9
34 39 5.3 142.0
35 36 5.3 142.0
36 37 5.3 82.0
36 38 5.3 0
39 40 5.3 82
39 41 5.3 82.0
42 43 1.4 34.7
42 44 0.3 0.9
44 45 1.5 54.0
44 48 0.4 1.1
Table 2: Continued.
BranchesR, Om X , Om
i j
45 46 1.5 0
45 47 1.5 33.0
48 49 0.7 27.0
48 56 0.3 0.8
52 53 0.2 24.3
52 63 11.3 44.9
53 54 1.0 82.5
53 55 0.5 0
55 56 0.1 0.1
55 61 3.3 5.1
56 57 0.5 0.7
57 58 7.9 138.9
59 60 0.7 16.5
60 62 0.7 0
63 64 1.4 100.0
63 67 24.1 78.6
64 65 1.4 0
67 68 0.7 50.0
68 69 0.7 0
68 70 1.4 96.5
71 72 0.2 24.3
72 73 0.5 41.2
72 74 0.2 0
and (5) allows the points of network loop disconnection to berevealed. These are branches 2–22, 19–34, and 48–56 shownin Figure 2 by dashed lines.
Then the postemergency conditions in the Central PowerSystem of Mongolia are studied for the case of power supplyloss from the Gusinoozyersk TPP. Here the generators of theCentral Power System of Mongolia cover part of the load andas a result three independent islands are formed by criterion(2) (see Figure 2). For all the islands constraints (4) and (6)are met.
Comparison of the disconnection points in the normaland postemergency conditions shows that the disconnectionof branch 2–22 coincides in both cases. The disconnectionof branch 48–56 is of no concern for the postemergencyconditions, since it does not influence on island formation.
Consider branch 19–34. In normal conditions thisbranch has to be tripped from the standpoint of minimumactive power losses. Their value in this case is 14.34 MW.In the postemergency conditions the other branch 6–10 istripped. When the loop is open on this branch, in the normalconditions the power losses are 11% higher than the optimalones. Such an increase in losses is not allowed.
Find an acceptable concession from the criterion of min-imum active power losses (1) in the normal conditions bythe island adjustment. Consider the variant of disconnectionof branch 15–19 with the corresponding reduction of theisland by excluding nodes 10, 11, 12, 13, 14, 16, 17, and18 from it. The disconnection of branch 15–19 causes an
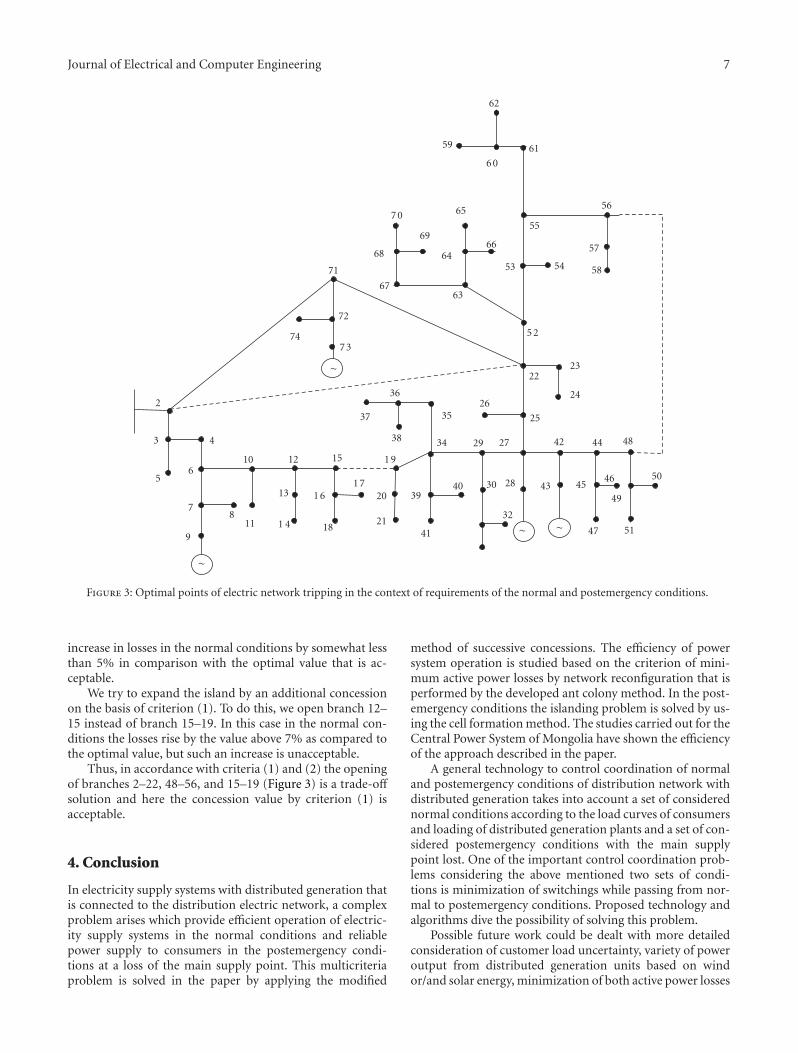
Journal of Electrical and Computer Engineering 7
10
2
3 4
56
78
9
12 15
11
13
1 4
1 61 7
18
1 9
20
2141
4039
30 28
32
43
27 422934
35
36
37
38
26
2223
24
74
71
72
7 3
45
47
46
49
51
50
4844
25
5453
55
56
57
58
6367
68
7 0
69
6466
65
6159
62
5 2
6 0
∼
∼
∼ ∼
Figure 3: Optimal points of electric network tripping in the context of requirements of the normal and postemergency conditions.
increase in losses in the normal conditions by somewhat lessthan 5% in comparison with the optimal value that is ac-ceptable.
We try to expand the island by an additional concessionon the basis of criterion (1). To do this, we open branch 12–15 instead of branch 15–19. In this case in the normal con-ditions the losses rise by the value above 7% as compared tothe optimal value, but such an increase is unacceptable.
Thus, in accordance with criteria (1) and (2) the openingof branches 2–22, 48–56, and 15–19 (Figure 3) is a trade-offsolution and here the concession value by criterion (1) isacceptable.
4. Conclusion
In electricity supply systems with distributed generation thatis connected to the distribution electric network, a complexproblem arises which provide efficient operation of electric-ity supply systems in the normal conditions and reliablepower supply to consumers in the postemergency condi-tions at a loss of the main supply point. This multicriteriaproblem is solved in the paper by applying the modified
method of successive concessions. The efficiency of powersystem operation is studied based on the criterion of mini-mum active power losses by network reconfiguration that isperformed by the developed ant colony method. In the post-emergency conditions the islanding problem is solved by us-ing the cell formation method. The studies carried out for theCentral Power System of Mongolia have shown the efficiencyof the approach described in the paper.
A general technology to control coordination of normaland postemergency conditions of distribution network withdistributed generation takes into account a set of considerednormal conditions according to the load curves of consumersand loading of distributed generation plants and a set of con-sidered postemergency conditions with the main supplypoint lost. One of the important control coordination prob-lems considering the above mentioned two sets of condi-tions is minimization of switchings while passing from nor-mal to postemergency conditions. Proposed technology andalgorithms dive the possibility of solving this problem.
Possible future work could be dealt with more detailedconsideration of customer load uncertainty, variety of poweroutput from distributed generation units based on windor/and solar energy, minimization of both active power losses
8 Journal of Electrical and Computer Engineering
and fuel usage at thermal distributed power plants, and otherrelated problems. The authors hope for the success in theseareas of research.
Acknowledgments
This paper was supported by the Grants of Leading ScientificSchool of RF no.1857.2008.8 and Russian Foundation forBasic Researches no.90-08-91330.
References
[1] A. Carcamo-Gallardo, L. Garcıa-Santander, and J. E. Pezoa,“Greedy reconfiguration algorithms for medium-voltage dis-tribution networks,” IEEE Transactions on Power Delivery, vol.24, no. 1, pp. 328–337, 2009.
[2] M. A. Tavakoli, M. R. Hanhifam, H. Lesani, S. Sanakhan,and E. Javan, “Review on reconfiguration methods of electricdistribution networks,” in Proceeding of the Technical andPhysical Problems in Power Engineering Conference, Ankara,Turkey, May 2006.
[3] Y. T. Hsiao, “Multiobjective evolution programming methodfor feeder reconfiguration,” IEEE Transactions on Power Sys-tems, vol. 19, no. 1, pp. 594–599, 2004.
[4] Y. Y. Hong and S. Y. Ho, “Determination of network configura-tion considering multiobjective in distribution systems usinggenetic algorithms,” IEEE Transactions on Power Systems, vol.20, no. 2, pp. 1062–1069, 2005.
[5] N. Jenkins, R. Allan, P. Crossley, D. Kirschen, and G. Strbac,Embedded Generation, IEE Press, London, UK, 2000.
[6] T. Ackermann, G. Andersson, and L. Soder, “Distributedgeneration: a definition,” Electric Power Systems Research, vol.57, no. 3, pp. 195–204, 2001.
[7] M. Eremia, Electric Power Systems, vol. 1, Editura AcademieiRomane, Bucuresti, Romania, 2006.
[8] T. Funabashi, K. Koyanagi, and R. Yokoyama, “A review ofislanding detection methods for distributed resources,” in Pro-ceeding of IEEE Bologna Power Tech Conference, p. 6, Bologna,Italy, June 2003.
[9] C.-L. Hwang and A. S. Masud, Multiple Objective DecisionMaking. Methods and Applications—State of the Art Survey,Springer, Berlin, Germany, 1979.
[10] Y. Lu, X. Yi, J. Wu, and X. Lin, “An intelligent islandingtechnique considering load balance for distribution systemwith DGs,” in IEEE Power Engineering Society General Meeting(PES ’06), June 2006.
[11] N. I. Voropai and B. Bat-Undral, “Load flow calculation in aradial electrical network using the interval method,” Electri-chestvo, pp. 64–66, 2008 (Russian).
[12] M. Dorigo, V. Maniezzo, and A. Colorni, “Ant system: opti-mization by a colony of cooperating agents,” IEEE Transactionson Systems, Man, and Cybernetics B, vol. 26, no. 1, pp. 29–41,1996.
[13] Y.-J. Jeon, J.-Ch. Kim, and S.-Y. Lee, “Application of antcolony algorithm for network reconfiguration in distributionsystems,” in Proceedings of IFAC Symposium on Power Plantsand Power Systems Control, Seoul, South Korea, September2003.
[14] E. Carpaneto and G. Chicco, “Distribution system minimumloss reconfiguration on the hyper-cube ant colony optimiza-tion framework,” in Proceedings of the World Energy SystemConference, pp. 167–174, Torino, Italy, July 2006.
[15] J. Olamaei, T. Niknam, G. Gharehpetian, and E. Jamshidpour,“An approach based on ant colony optimization for distri-bution feeder reconfiguration considering distributed genera-tion,” in Proceedings of the International Conference on Electric-ity Distribution (CIRED ’07), Vienna, Austria, May 2007.
[16] X. Yiqin and T. Jia, “A new search approach in ant colony sys-tem algorithm for network reconfiguration of distribution sys-tems,” in Proceedings of the International Conference on Dereg-ulation, Restructuring, and Power Technologies (DRPT ’2008),Nanjing, China, April 2008.
[17] C. F. Chang, “Reconfiguration and capacitor placement forloss reduction of distribution systems by ant colony search alg-orithm,” IEEE Transactions on Power Systems, vol. 23, no. 4, pp.1747–1755, 2008.
Hindawi Publishing CorporationJournal of Electrical and Computer EngineeringVolume 2012, Article ID 962402, 8 pagesdoi:10.1155/2012/962402
Research Article
Multiobjective Optimization Methods for CongestionManagement in Deregulated Power Systems
K. Vijayakumar
Department of Electrical and Electronics Engineering, SRM University, Chennai 608302, India
Correspondence should be addressed to K. Vijayakumar, kvijay [email protected]
Received 8 August 2011; Revised 21 September 2011; Accepted 22 September 2011
Academic Editor: Edgar Carreno
Copyright © 2012 K. Vijayakumar. This is an open access article distributed under the Creative Commons Attribution License,which permits unrestricted use, distribution, and reproduction in any medium, provided the original work is properly cited.
Congestion management is one of the important functions performed by system operator in deregulated electricity market toensure secure operation of transmission system. This paper proposes two effective methods for transmission congestion alleviationin deregulated power system. Congestion or overload in transmission networks is alleviated by rescheduling of generators and/orload shedding. The two objectives conflicting in nature (1) transmission line over load and (2) congestion cost are optimized inthis paper. The multiobjective fuzzy evolutionary programming (FEP) and nondominated sorting genetic algorithm II methodsare used to solve this problem. FEP uses the combined advantages of fuzzy and evolutionary programming (EP) techniques andgives better unique solution satisfying both objectives, whereas nondominated sorting genetic algorithm (NSGA) II gives a set ofPareto-optimal solutions. The methods propose an efficient and reliable algorithm for line overload alleviation due to critical lineoutages in a deregulated power markets. The quality and usefulness of the algorithm is tested on IEEE 30 bus system.
1. Introduction
In recent years, the power industry has undergone drasticchanges due to privatization and worldwide deregulationprocess that has significantly affected energy markets. Therestructuring of power system has led to the intensive usageof transmission grids. In deregulated electricity market,power system is operated near its rated capacity as eachplayer in the market is trying to gain as much as possibleby utilization of existing resources. Congestion in the trans-mission lines is one of the technical problems that appear inthe deregulated environment. Congestion may occur due tolack of coordination between generation and transmissionutilities or as a result of unexpected contingencies such asgeneration outages, sudden increase of load demand, orfailure of equipments.
A large number of literatures have been reported in con-gestion management. Sensitivity-based methods to relievecongestion are reported in the work [1–3]. Auction-basedmethods are carried out in the literatures [4, 5]. Pricing-based methods are done in the papers [6–10]. A number ofliterature have been reported in evolutionary-based methods[11–18]. Multiobjective optimization method using various
evolutionary methods [19, 20] are discussed. Very few papers[21] address the congestion management problem withsecurity constraints of power systems with single objectiveonly, because solving a multiobjective congestion problemwith evolutionary methods is a very difficult task. Forsolving such complex, combinatorial optimization problem,classical techniques are unsuitable and the use of globalsearch technique is needed. Further more if more than oneobjective is chosen in optimization, a suitable method mustbe developed to check the optimality of the solution. Toovercome these difficulties, fuzzy models are developed andincorporated in EP algorithm.
This paper presents an efficient method for solving con-gestion management problem with two conflicting objectivesin a pool-based electricity market. The two objectives arecongestion cost minimization and transmission line over-load alleviation. Generation rescheduling is done to relievecongestion; if it was not sufficient to alleviate overload, thenload shedding is done. Here in this proposed method line,over load is alleviated with generation rescheduling aloneand load shedding is not required.
Congestion management methods available consideronly one objective and provide only one solution which

2 Journal of Electrical and Computer Engineering
does not provide any choice to the operator. This proposedpaper provides a set of alternate solutions for congestionmanagement problem using two approaches (1) fuzzy EPapproach and (2) NSGA II approach. The first methodprovides a best solution satisfying both objectives, and thelater method provides a set of Pareto-optimal solutions tothe transmission system operators for managing congestionin transmission network.
2. Problem Formulation
In this paper, day-ahead electric energy market based ona pool is considered. Several utilities join together to forma pool, with a central broker, to coordinate the operationson an hour-to-hour basis. Within this pool, GENCOs andDISCOs submit the purchase and sell decisions in the form ofsell or buy bids to the market operator, who clears the marketusing an appropriate market-clearing procedure. Finally itresults in 24 hourly energy prices to be paid by consumersand to be charged by producers. Transmission congestionmay prevent the existence of new contracts and may lead toadditional outages.
2.1. Congestion Relieving Procedure. In this paper, controlmeasures to be taken to relieve the congestion in transmis-sion lines due to critical line outages, generator outages, orsudden load disturbances are proposed. The objective func-tion is to find the minimal shifts in generations and demandsfrom initial market clearing values so as to alleviate lineoverloads completely and also to maintain load bus voltageswithin the permissible limits for secure operation of thesystem. The line limits and voltage limits can be consideredas classical optimization problem with penalty function, butif violated it forces the solution to lie near its limits; toovercome this difficulty, these constraints are taken as theobjective functions. It is considered that any change from themarket-clearing conditions implies a payment to the agentinvolved. The total cost incurred is a sum of increment inrevenues for the participating producers for adjusting thepower productions and sum of revenues for the participatingconsumers for adjusting the power consumptions for conges-tion management purpose. This total cost is a measure of thedecrement in social welfare due to congestion management.
2.2. Severity Index. The objective of power system controlis to maintain a secure system state, that is, to prevent thepower system from contingencies. This contingencies leadto overloading of the transmission lines. The severity of acontingency to line overload may be expressed as SeverityIndex (SI)
SI =NL∑
k=1
(Pi jPmaxi j
)2m
. (1)
m is the integer exponent whose value is fixed as 1 inthis paper. In this study, contingency analysis is conductedfor base case generations and loadings (obtained by initialmarket clearing values) and the SI was computed for each
contingency. The line outage which yields highest value ofSeverity Index is identified as worst contingency. Here lineoverloads are simulated by means of outage of critical linesand sudden increase in load demands.
2.3. Mathematical Problem Formulation. The objective func-tion of the proposed method is to find an optimum valueof shift in active power generation along with networkconstraints so as to minimize the total congestion costand relieve transmission congestion simultaneously in thenetwork. The problem of proposed algorithm may be statedas follows.
Objective 1. Minimize total congestion cost
CC =NG∑
j=1
CuGj · ΔPu
Gj + CdGj · ΔPd
Gj . (2)
Objective 2. Minimize the transmission congestion
TC =⎧⎨⎩
0, if Pmaxi j ≤ Pmax
i j ,
α · (Pi j − Pmaxi j )2, if Pi j ≥ Pmax
i j .(3)
Objective 3. Minimize the voltage deviation index
VD =
⎧⎪⎪⎪⎪⎨⎪⎪⎪⎪⎩
0, if Vminn ≤ Vn ≤ Vmax
n ,
β · (Vminn −Vn)
2, if Vn ≤ Vmin
n ,
β · (Vn −Vmaxn )2, if Vn ≥ Vmax
n .
(4)
α and β are the penalty factors for line flow violation andbus voltage limit violation. Precise setting of penalty factorsare not needed, provided that it could be introduced topenalize the solutions with significant constraint violations.The values of α and β are taken as 10000.
Subjected to various constraints
PGi − PDi =NB∑
j=1
|Vi|∣∣∣Vj
∣∣∣∣∣∣Yij
∣∣∣ cos(δi − δj − θi j
), (5)
QGi −QDi =NB∑
j=1
|Vi|∣∣∣Vj
∣∣∣∣∣∣Yij
∣∣∣ sin(δi − δj − θi j
), (6)
where
PGj = PcGj + ΔPu
Gj + ΔPdGj , j = 1, 2 . . . , NG, (7)
PDj = PcD j + ΔPd
D j , j = 1, 2 . . . , ND, (8)
QDj = PDj · tan(φDj
), j = 1, 2 . . . , ND, (9)
PminGj ≤ PGj ≤ Pmax
Gj , j = 1, 2 . . . , NG, (10)
QminGj ≤ QGj ≤ Qmax
Gj , j = 1, 2 . . . , NG, (11)
Vminn ≤ Vn ≤ Vmax
n , j = 1, 2 . . . , ND, (12)
Pi j ≤ Pmaxi j . (13)
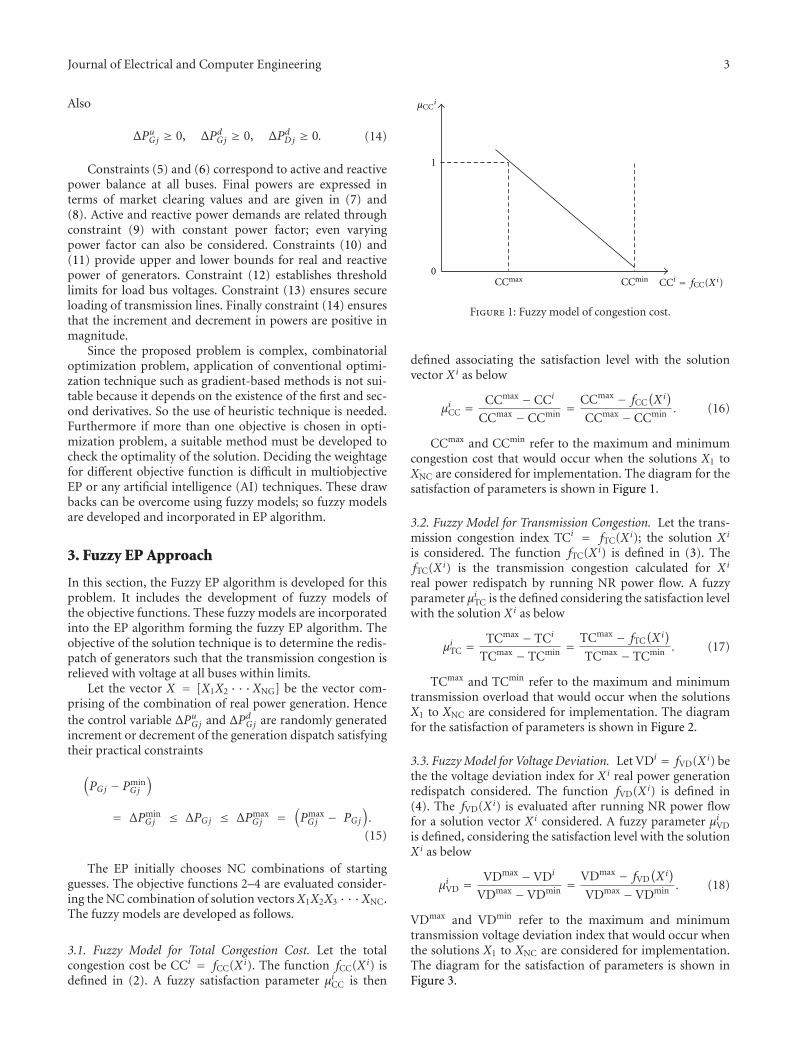
Journal of Electrical and Computer Engineering 3
Also
ΔPuGj ≥ 0, ΔPd
Gj ≥ 0, ΔPdD j ≥ 0. (14)
Constraints (5) and (6) correspond to active and reactivepower balance at all buses. Final powers are expressed interms of market clearing values and are given in (7) and(8). Active and reactive power demands are related throughconstraint (9) with constant power factor; even varyingpower factor can also be considered. Constraints (10) and(11) provide upper and lower bounds for real and reactivepower of generators. Constraint (12) establishes thresholdlimits for load bus voltages. Constraint (13) ensures secureloading of transmission lines. Finally constraint (14) ensuresthat the increment and decrement in powers are positive inmagnitude.
Since the proposed problem is complex, combinatorialoptimization problem, application of conventional optimi-zation technique such as gradient-based methods is not sui-table because it depends on the existence of the first and sec-ond derivatives. So the use of heuristic technique is needed.Furthermore if more than one objective is chosen in opti-mization problem, a suitable method must be developed tocheck the optimality of the solution. Deciding the weightagefor different objective function is difficult in multiobjectiveEP or any artificial intelligence (AI) techniques. These drawbacks can be overcome using fuzzy models; so fuzzy modelsare developed and incorporated in EP algorithm.
3. Fuzzy EP Approach
In this section, the Fuzzy EP algorithm is developed for thisproblem. It includes the development of fuzzy models ofthe objective functions. These fuzzy models are incorporatedinto the EP algorithm forming the fuzzy EP algorithm. Theobjective of the solution technique is to determine the redis-patch of generators such that the transmission congestion isrelieved with voltage at all buses within limits.
Let the vector X = [X1X2 · · ·XNG] be the vector com-prising of the combination of real power generation. Hencethe control variable ΔPu
Gj and ΔPdGj are randomly generated
increment or decrement of the generation dispatch satisfyingtheir practical constraints
(PGj − Pmin
Gj
)
= ΔPminGj ≤ ΔPGj ≤ ΔPmax
Gj =(PmaxGj − PGj
).
(15)
The EP initially chooses NC combinations of startingguesses. The objective functions 2–4 are evaluated consider-ing the NC combination of solution vectors X1X2X3 · · ·XNC.The fuzzy models are developed as follows.
3.1. Fuzzy Model for Total Congestion Cost. Let the totalcongestion cost be CCi = fCC(Xi). The function fCC(Xi) isdefined in (2). A fuzzy satisfaction parameter μiCC is then
0
1
CCmax CCmin CCi = fCC(Xi)
µCCi
Figure 1: Fuzzy model of congestion cost.
defined associating the satisfaction level with the solutionvector Xi as below
μiCC =CCmax − CCi
CCmax − CCmin =CCmax − fCC
(Xi)
CCmax − CCmin . (16)
CCmax and CCmin refer to the maximum and minimumcongestion cost that would occur when the solutions X1 toXNC are considered for implementation. The diagram for thesatisfaction of parameters is shown in Figure 1.
3.2. Fuzzy Model for Transmission Congestion. Let the trans-mission congestion index TCi = fTC(Xi); the solution Xi
is considered. The function fTC(Xi) is defined in (3). ThefTC(Xi) is the transmission congestion calculated for Xi
real power redispatch by running NR power flow. A fuzzyparameter μiTC is the defined considering the satisfaction levelwith the solution Xi as below
μiTC =TCmax − TCi
TCmax − TCmin =TCmax − fTC
(Xi)
TCmax − TCmin . (17)
TCmax and TCmin refer to the maximum and minimumtransmission overload that would occur when the solutionsX1 to XNC are considered for implementation. The diagramfor the satisfaction of parameters is shown in Figure 2.
3.3. Fuzzy Model for Voltage Deviation. Let VDi = fVD(Xi) bethe the voltage deviation index for Xi real power generationredispatch considered. The function fVD(Xi) is defined in(4). The fVD(Xi) is evaluated after running NR power flowfor a solution vector Xi considered. A fuzzy parameter μiVDis defined, considering the satisfaction level with the solutionXi as below
μiVD =VDmax −VDi
VDmax −VDmin =VDmax − fVD
(Xi)
VDmax −VDmin . (18)
VDmax and VDmin refer to the maximum and minimumtransmission voltage deviation index that would occur whenthe solutions X1 to XNC are considered for implementation.The diagram for the satisfaction of parameters is shown inFigure 3.
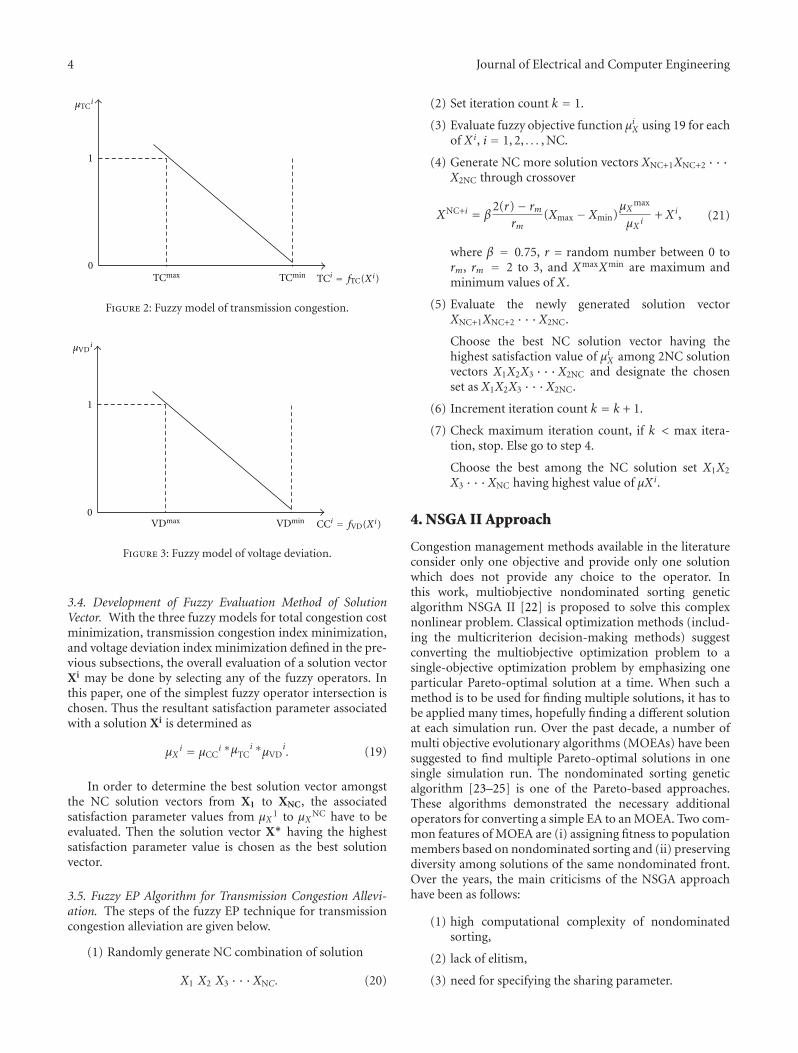
4 Journal of Electrical and Computer Engineering
0
1
TCmax TCmin TCi = fTC(Xi)
µTCi
Figure 2: Fuzzy model of transmission congestion.
0
1
VDmax VDmin CCi = fVD(Xi)
µVDi
Figure 3: Fuzzy model of voltage deviation.
3.4. Development of Fuzzy Evaluation Method of SolutionVector. With the three fuzzy models for total congestion costminimization, transmission congestion index minimization,and voltage deviation index minimization defined in the pre-vious subsections, the overall evaluation of a solution vectorXi may be done by selecting any of the fuzzy operators. Inthis paper, one of the simplest fuzzy operator intersection ischosen. Thus the resultant satisfaction parameter associatedwith a solution Xi is determined as
μXi = μCC
i ∗μTCi ∗μVD
i. (19)
In order to determine the best solution vector amongstthe NC solution vectors from X1 to XNC, the associatedsatisfaction parameter values from μX 1 to μXNC have to beevaluated. Then the solution vector X∗ having the highestsatisfaction parameter value is chosen as the best solutionvector.
3.5. Fuzzy EP Algorithm for Transmission Congestion Allevi-ation. The steps of the fuzzy EP technique for transmissioncongestion alleviation are given below.
(1) Randomly generate NC combination of solution
X1 X2 X3 · · ·XNC. (20)
(2) Set iteration count k = 1.
(3) Evaluate fuzzy objective function μiX using 19 for eachof Xi, i = 1, 2, . . . , NC.
(4) Generate NC more solution vectors XNC+1XNC+2 · · ·X2NC through crossover
XNC+i = β2(r)− rm
rm(Xmax − Xmin)
μXmax
μX i+ Xi, (21)
where β = 0.75, r = random number between 0 torm, rm = 2 to 3, and XmaxXmin are maximum andminimum values of X .
(5) Evaluate the newly generated solution vectorXNC+1XNC+2 · · ·X2NC.
Choose the best NC solution vector having thehighest satisfaction value of μiX among 2NC solutionvectors X1X2X3 · · ·X2NC and designate the chosenset as X1X2X3 · · ·X2NC.
(6) Increment iteration count k = k + 1.
(7) Check maximum iteration count, if k < max itera-tion, stop. Else go to step 4.
Choose the best among the NC solution set X1X2
X3 · · ·XNC having highest value of μXi.
4. NSGA II Approach
Congestion management methods available in the literatureconsider only one objective and provide only one solutionwhich does not provide any choice to the operator. Inthis work, multiobjective nondominated sorting geneticalgorithm NSGA II [22] is proposed to solve this complexnonlinear problem. Classical optimization methods (includ-ing the multicriterion decision-making methods) suggestconverting the multiobjective optimization problem to asingle-objective optimization problem by emphasizing oneparticular Pareto-optimal solution at a time. When such amethod is to be used for finding multiple solutions, it has tobe applied many times, hopefully finding a different solutionat each simulation run. Over the past decade, a number ofmulti objective evolutionary algorithms (MOEAs) have beensuggested to find multiple Pareto-optimal solutions in onesingle simulation run. The nondominated sorting geneticalgorithm [23–25] is one of the Pareto-based approaches.These algorithms demonstrated the necessary additionaloperators for converting a simple EA to an MOEA. Two com-mon features of MOEA are (i) assigning fitness to populationmembers based on nondominated sorting and (ii) preservingdiversity among solutions of the same nondominated front.Over the years, the main criticisms of the NSGA approachhave been as follows:
(1) high computational complexity of nondominatedsorting,
(2) lack of elitism,
(3) need for specifying the sharing parameter.
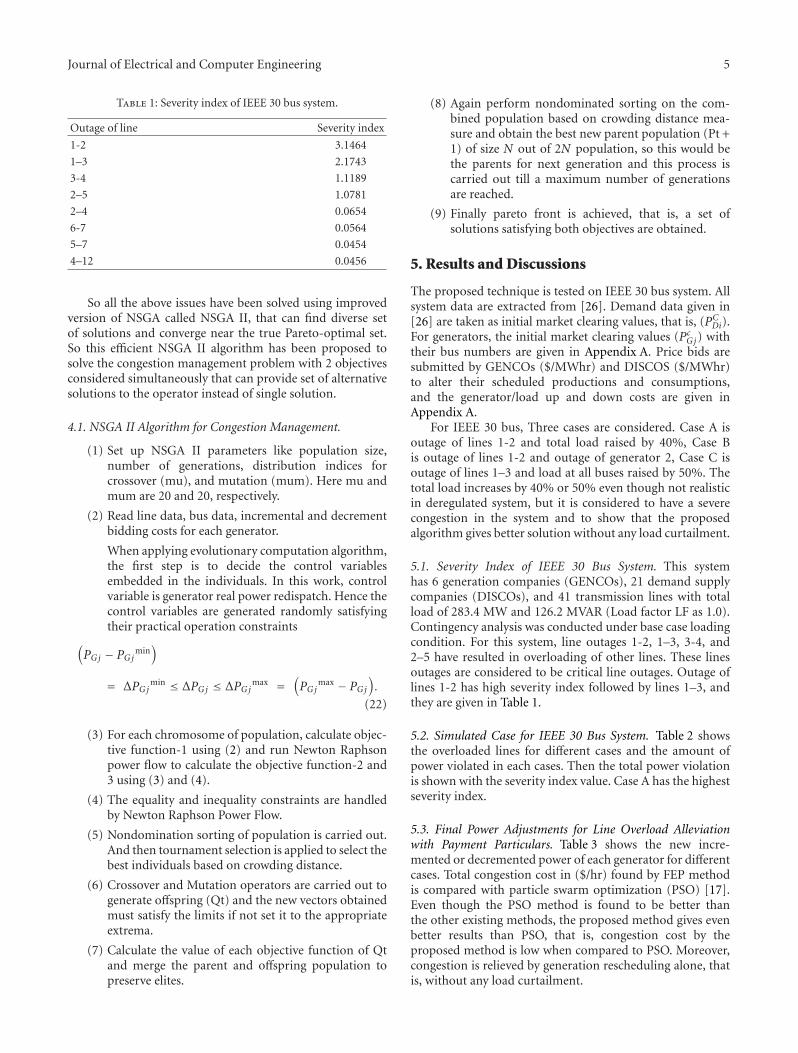
Journal of Electrical and Computer Engineering 5
Table 1: Severity index of IEEE 30 bus system.
Outage of line Severity index
1-2 3.1464
1–3 2.1743
3-4 1.1189
2–5 1.0781
2–4 0.0654
6-7 0.0564
5–7 0.0454
4–12 0.0456
So all the above issues have been solved using improvedversion of NSGA called NSGA II, that can find diverse setof solutions and converge near the true Pareto-optimal set.So this efficient NSGA II algorithm has been proposed tosolve the congestion management problem with 2 objectivesconsidered simultaneously that can provide set of alternativesolutions to the operator instead of single solution.
4.1. NSGA II Algorithm for Congestion Management.
(1) Set up NSGA II parameters like population size,number of generations, distribution indices forcrossover (mu), and mutation (mum). Here mu andmum are 20 and 20, respectively.
(2) Read line data, bus data, incremental and decrementbidding costs for each generator.
When applying evolutionary computation algorithm,the first step is to decide the control variablesembedded in the individuals. In this work, controlvariable is generator real power redispatch. Hence thecontrol variables are generated randomly satisfyingtheir practical operation constraints
(PGj − PGj
min)
= ΔPGjmin ≤ ΔPGj ≤ ΔPGj
max =(PGj
max − PGj
).
(22)
(3) For each chromosome of population, calculate objec-tive function-1 using (2) and run Newton Raphsonpower flow to calculate the objective function-2 and3 using (3) and (4).
(4) The equality and inequality constraints are handledby Newton Raphson Power Flow.
(5) Nondomination sorting of population is carried out.And then tournament selection is applied to select thebest individuals based on crowding distance.
(6) Crossover and Mutation operators are carried out togenerate offspring (Qt) and the new vectors obtainedmust satisfy the limits if not set it to the appropriateextrema.
(7) Calculate the value of each objective function of Qtand merge the parent and offspring population topreserve elites.
(8) Again perform nondominated sorting on the com-bined population based on crowding distance mea-sure and obtain the best new parent population (Pt +1) of size N out of 2N population, so this would bethe parents for next generation and this process iscarried out till a maximum number of generationsare reached.
(9) Finally pareto front is achieved, that is, a set ofsolutions satisfying both objectives are obtained.
5. Results and Discussions
The proposed technique is tested on IEEE 30 bus system. Allsystem data are extracted from [26]. Demand data given in[26] are taken as initial market clearing values, that is, (PC
Di).For generators, the initial market clearing values (Pc
Gj) withtheir bus numbers are given in Appendix A. Price bids aresubmitted by GENCOs ($/MWhr) and DISCOS ($/MWhr)to alter their scheduled productions and consumptions,and the generator/load up and down costs are given inAppendix A.
For IEEE 30 bus, Three cases are considered. Case A isoutage of lines 1-2 and total load raised by 40%, Case Bis outage of lines 1-2 and outage of generator 2, Case C isoutage of lines 1–3 and load at all buses raised by 50%. Thetotal load increases by 40% or 50% even though not realisticin deregulated system, but it is considered to have a severecongestion in the system and to show that the proposedalgorithm gives better solution without any load curtailment.
5.1. Severity Index of IEEE 30 Bus System. This systemhas 6 generation companies (GENCOs), 21 demand supplycompanies (DISCOs), and 41 transmission lines with totalload of 283.4 MW and 126.2 MVAR (Load factor LF as 1.0).Contingency analysis was conducted under base case loadingcondition. For this system, line outages 1-2, 1–3, 3-4, and2–5 have resulted in overloading of other lines. These linesoutages are considered to be critical line outages. Outage oflines 1-2 has high severity index followed by lines 1–3, andthey are given in Table 1.
5.2. Simulated Case for IEEE 30 Bus System. Table 2 showsthe overloaded lines for different cases and the amount ofpower violated in each cases. Then the total power violationis shown with the severity index value. Case A has the highestseverity index.
5.3. Final Power Adjustments for Line Overload Alleviationwith Payment Particulars. Table 3 shows the new incre-mented or decremented power of each generator for differentcases. Total congestion cost in ($/hr) found by FEP methodis compared with particle swarm optimization (PSO) [17].Even though the PSO method is found to be better thanthe other existing methods, the proposed method gives evenbetter results than PSO, that is, congestion cost by theproposed method is low when compared to PSO. Moreover,congestion is relieved by generation rescheduling alone, thatis, without any load curtailment.
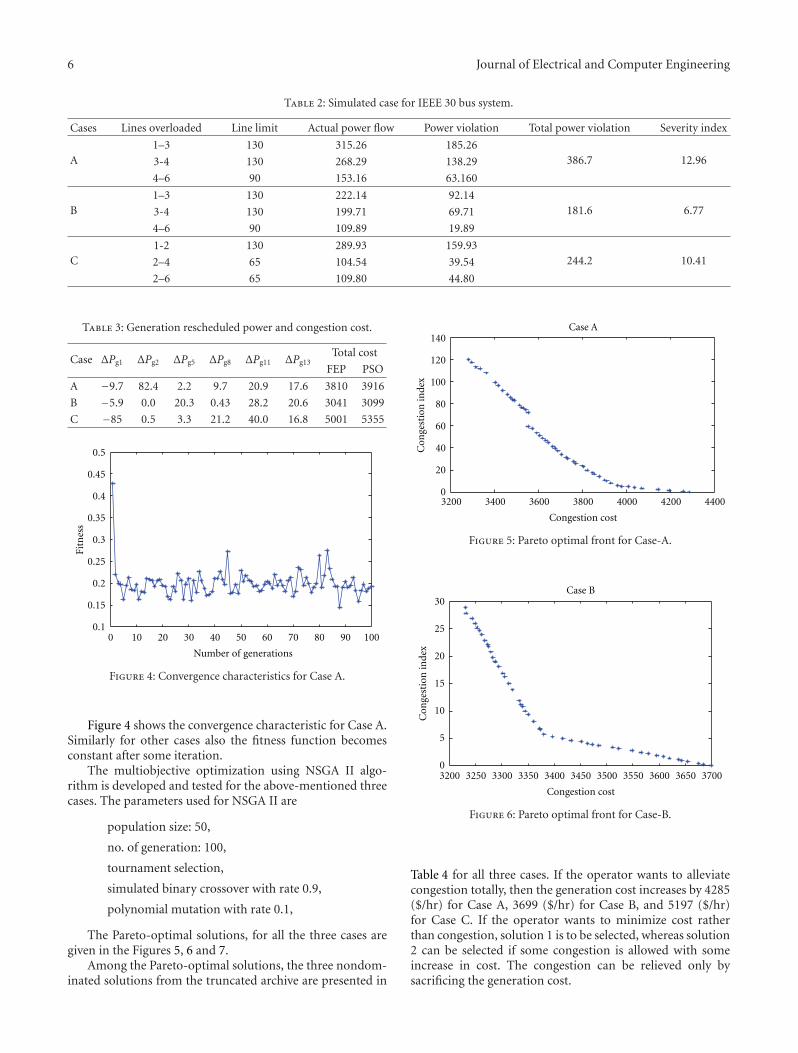
6 Journal of Electrical and Computer Engineering
Table 2: Simulated case for IEEE 30 bus system.
Cases Lines overloaded Line limit Actual power flow Power violation Total power violation Severity index
A1–3 130 315.26 185.26
386.7 12.963-4 130 268.29 138.29
4–6 90 153.16 63.160
B1–3 130 222.14 92.14
181.6 6.773-4 130 199.71 69.71
4–6 90 109.89 19.89
C1-2 130 289.93 159.93
244.2 10.412–4 65 104.54 39.54
2–6 65 109.80 44.80
Table 3: Generation rescheduled power and congestion cost.
Case ΔPg1 ΔPg2 ΔPg5 ΔPg8 ΔPg11 ΔPg13Total cost
FEP PSO
A −9.7 82.4 2.2 9.7 20.9 17.6 3810 3916
B −5.9 0.0 20.3 0.43 28.2 20.6 3041 3099
C −85 0.5 3.3 21.2 40.0 16.8 5001 5355
0.1
0.15
0.2
0.25
0.3
0.35
0.4
0.45
0.5
0 10 20 30 40 50 60 70 80 90 100
Fitn
ess
Number of generations
Figure 4: Convergence characteristics for Case A.
Figure 4 shows the convergence characteristic for Case A.Similarly for other cases also the fitness function becomesconstant after some iteration.
The multiobjective optimization using NSGA II algo-rithm is developed and tested for the above-mentioned threecases. The parameters used for NSGA II are
population size: 50,
no. of generation: 100,
tournament selection,
simulated binary crossover with rate 0.9,
polynomial mutation with rate 0.1,
The Pareto-optimal solutions, for all the three cases aregiven in the Figures 5, 6 and 7.
Among the Pareto-optimal solutions, the three nondom-inated solutions from the truncated archive are presented in
0
20
40
60
80
100
120
140
3200 3400 3600 3800 4000 4200 4400
Con
gest
ion
inde
x
Congestion cost
Case A
Figure 5: Pareto optimal front for Case-A.
0
5
10
15
20
25
30
3200 3250 3300 3350 3400 3450 3500 3550 3600 3650 3700
Con
gest
ion
inde
x
Congestion cost
Case B
Figure 6: Pareto optimal front for Case-B.
Table 4 for all three cases. If the operator wants to alleviatecongestion totally, then the generation cost increases by 4285($/hr) for Case A, 3699 ($/hr) for Case B, and 5197 ($/hr)for Case C. If the operator wants to minimize cost ratherthan congestion, solution 1 is to be selected, whereas solution2 can be selected if some congestion is allowed with someincrease in cost. The congestion can be relieved only bysacrificing the generation cost.
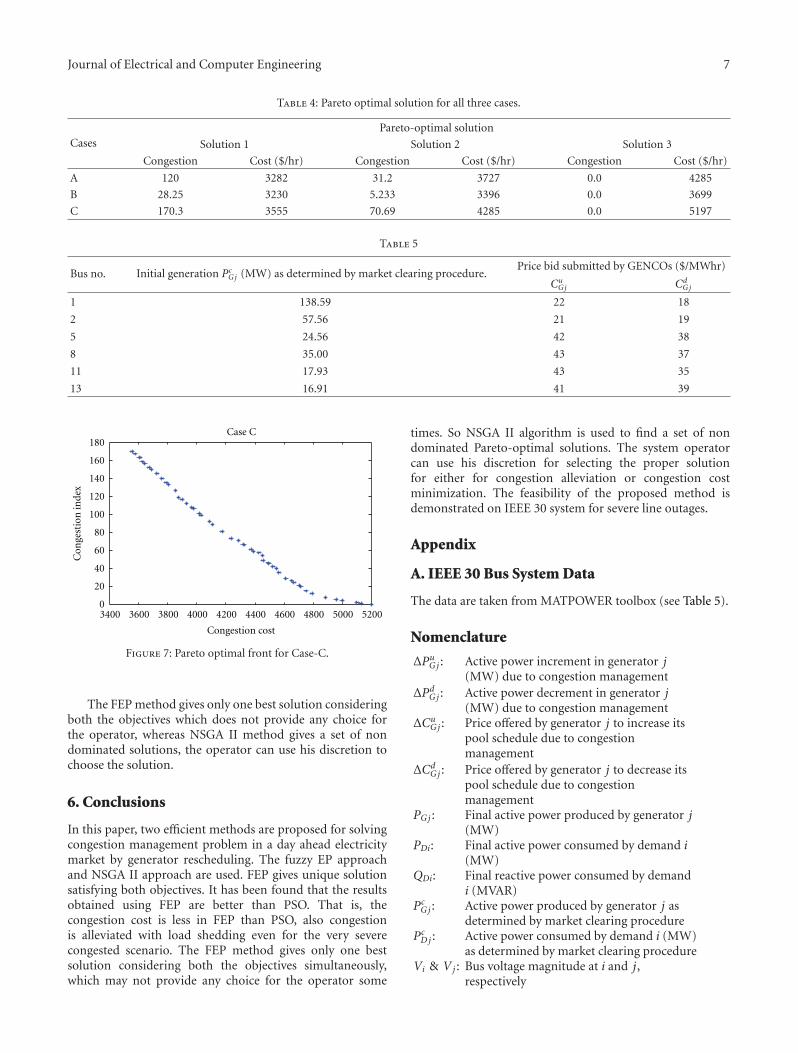
Journal of Electrical and Computer Engineering 7
Table 4: Pareto optimal solution for all three cases.
CasesPareto-optimal solution
Solution 1 Solution 2 Solution 3
Congestion Cost ($/hr) Congestion Cost ($/hr) Congestion Cost ($/hr)
A 120 3282 31.2 3727 0.0 4285
B 28.25 3230 5.233 3396 0.0 3699
C 170.3 3555 70.69 4285 0.0 5197
Table 5
Bus no. Initial generation PcGj (MW) as determined by market clearing procedure.
Price bid submitted by GENCOs ($/MWhr)
CuGj Cd
Gj
1 138.59 22 18
2 57.56 21 19
5 24.56 42 38
8 35.00 43 37
11 17.93 43 35
13 16.91 41 39
3400 3600 3800 4000 4200 4400 4600 4800 5000 52000
20
40
60
80
100
120
140
160
180
Con
gest
ion
inde
x
Congestion cost
Case C
Figure 7: Pareto optimal front for Case-C.
The FEP method gives only one best solution consideringboth the objectives which does not provide any choice forthe operator, whereas NSGA II method gives a set of nondominated solutions, the operator can use his discretion tochoose the solution.
6. Conclusions
In this paper, two efficient methods are proposed for solvingcongestion management problem in a day ahead electricitymarket by generator rescheduling. The fuzzy EP approachand NSGA II approach are used. FEP gives unique solutionsatisfying both objectives. It has been found that the resultsobtained using FEP are better than PSO. That is, thecongestion cost is less in FEP than PSO, also congestionis alleviated with load shedding even for the very severecongested scenario. The FEP method gives only one bestsolution considering both the objectives simultaneously,which may not provide any choice for the operator some
times. So NSGA II algorithm is used to find a set of nondominated Pareto-optimal solutions. The system operatorcan use his discretion for selecting the proper solutionfor either for congestion alleviation or congestion costminimization. The feasibility of the proposed method isdemonstrated on IEEE 30 system for severe line outages.
Appendix
A. IEEE 30 Bus System Data
The data are taken from MATPOWER toolbox (see Table 5).
Nomenclature
ΔPuGj : Active power increment in generator j
(MW) due to congestion managementΔPd
Gj : Active power decrement in generator j(MW) due to congestion management
ΔCuGj : Price offered by generator j to increase its
pool schedule due to congestionmanagement
ΔCdGj : Price offered by generator j to decrease its
pool schedule due to congestionmanagement
PGj : Final active power produced by generator j(MW)
PDi: Final active power consumed by demand i(MW)
QDi: Final reactive power consumed by demandi (MVAR)
PcGj : Active power produced by generator j as
determined by market clearing procedurePcD j : Active power consumed by demand i (MW)
as determined by market clearing procedureVi & Vj : Bus voltage magnitude at i and j,
respectively

8 Journal of Electrical and Computer Engineering
δi & δj : Bus voltage angle at i and j, respectivelyYij : Mutual admittance between node i and jYii: Self admittance of node iPminGj : Minimum real power output of generator j
PmaxGj : Maximum real power output of generator j
QminGj : Minimum reactive power output of
generator jQmax
Gj : Maximum reactive power output ofgenerator j
Pi j : Actual power flow in line i- j (MW)Pmaxi j : Loading limit of line i- j (MW)
Vmaxn & Vmin
n : Maximum and Minimum limit of voltageat bus—n
NB: Number of busesNL: Number of linesNd: No. of participating demandLO: Set of overloaded lines.
References
[1] K. Y. Lee, M. Choi, and M. Shin, “Network congestion assess-ment for short-term transmission planning under deregulatedenvironment,” in Proceedings of the IEEE Power EngineeringSociety Winter Meeting, pp. 1266–1271, February 2001.
[2] M. Liu and G. Gross, “Role of distribution factors incongestion revenue rights applications,” IEEE Transactions onPower Systems, vol. 19, no. 2, pp. 802–810, 2004.
[3] A. Kumar, S. C. Srivastava, and S. N. Singh, “A zonal conges-tion management approach using ac transmission congestiondistribution factors,” Electric Power Systems Research, vol. 72,no. 1, pp. 85–93, 2004.
[4] L. A. Tuan, K. Bhattacharya, and J. Daalder, “Transmissioncongestion management in bilateral markets: an interruptibleload auction solution,” Electric Power Systems Research, vol. 74,no. 3, pp. 379–389, 2005.
[5] M. I. Alomoush and S. M. Shahidehpour, “Generalized modelfor fixed transmission rights auction,” Electric Power SystemsResearch, vol. 54, no. 3, pp. 207–220, 2000.
[6] R. S. Fang and A. K. David, “Optimal dispatch undertransmission contracts,” IEEE Transactions on Power Systems,vol. 14, no. 2, pp. 732–737, 1999.
[7] S. S. Oren, P. T. Spiller, P. Varaiya, and F. Wu, “Nodal pricesand transmission rights: a critical appraisal,” The ElectricityJournal, vol. 8, no. 3, pp. 24–35, 1995.
[8] J. D. Finney, H. A. Othman, and W. L. Rutz, “Evaluatingtransmission congestion constraints in system planning,” IEEETransactions on Power Systems, vol. 12, no. 3, pp. 1143–1150,1997.
[9] L. S. Hyman, “Transmission, congestion, pricing, and incen-tives,” IEEE Power Engineering Review, vol. 19, no. 8, pp. 4–10,1999.
[10] F. C. Schweppe, M. C. Caramanis, R. D. Tabors, and R. E.Bohn, Spot Pricing of Electricity, Kluwer Academic Publishers,Boston, Mass, USA, 1988.
[11] S. Dutta and S. P. Singh, “Optimal rescheduling of generatorsfor congestion management based on particle swarm opti-mization,” IEEE Transactions on Power Systems, vol. 23, no. 4,pp. 1560–1569, 2008.
[12] K. P. Wong and Z. Dong, “Differential evolution, an alternativeapproach to evolutionary algorithm,” in Proceedings of the 13thInternational Conference on Intelligent Systems Application toPower Systems (ISAP ’05), pp. 73–83, November 2005.
[13] S. Rahnamayan, H. R. Tizhoosh, and M. M. A. Salama,“Quasi-oppositional differential evolution,” in Proceedings ofthe IEEE Congress on Evolutionary Computation, CEC 2007, pp.2229–2236, September 2007.
[14] L. dos Santos Coelho and V. C. Mariani, “Combining ofchaotic differential evolution and quadratic programming foreconomic dispatch optimization with valve-point effect,” IEEETransactions on Power Systems, vol. 21, no. 2, pp. 989–996,2006.
[15] P. Somasundaram and K. Kuppusamy, “Application of evo-lutionary programming to security constrained economicdispatch,” International Journal of Electrical Power and EnergySystems, vol. 27, no. 5-6, pp. 343–351, 2005.
[16] J. S .R. Jang, C. T. Sun, and E. Mizutani, Neuro-Fuzzy andSoft Computing: A Computational Approach to Learning andMachine Intelligence, Pearson Education, London, UK, 1997.
[17] M. Saravanan, S. M. R. Slochanal, P. Venkatesh, and P.S. Abraham, “Application of Particle Swarm Optimizationtechnique for optimal location of FACTS devices consideringcost of installation and system load ability,” Electrical PowerSystem Research, vol. 77, no. 3-4, pp. 276–283, 2007.
[18] A. J. Conejo, F. Milano, and R. Garcıa-Bertrand, “Congestionmanagement ensuring voltage stability,” IEEE Transactions onPower Systems, vol. 21, no. 1, pp. 357–364, 2006.
[19] M. M. Raghuwanshi and O. G. Kakde, “Survey on multiobjec-tive evolutionary andreal coded genetic algorithms,” ComplexInternational, vol. 11, p. 150, 2008.
[20] J. Hazra and A. K. Sinha, “Congestion management usingmultiobjective particle swarm optimization,” IEEE Transac-tions on Power Systems, vol. 22, no. 4, pp. 1726–1734, 2007.
[21] S. N. Singh and K. David, “Congestion management indynamic security constrained open power markets,” Comput-ers and Electrical Engineering, vol. 29, no. 5, pp. 575–588, 2003.
[22] K. Deb, A. Pratap, S. Agarwal, and T. Meyarivan, “A fastand elitist multi-objective genetic algorithm: NSGA-II,” inProceedings of the 6th International Conference on ParallelProblem Solving from Nature, 2000.
[23] N. Srinivas and K. Deb, “Multiobjective Optimization usingnon-dominated Sorting in genetic algorithms,” EvolutionaryComputation, vol. 2, no. 2, pp. 221–248, 1994.
[24] K. Deb, Multi-Objective Optimization using Evolutionary Algo-rithms, Wiley-Interscience Series in Systems and Optimiza-tion, John Wiley & Sons, New York, NY, USA, 2001.
[25] P. K. Shukla and K. Deb, “On finding multiple Pareto-optimal solutions using classical and evolutionary generatingmethods,” European Journal of Operational Research, vol. 181,no. 3, pp. 1630–1652, 2007.
[26] R. D. Zimmerman and D. Gan, “MATPOWER: A MatlabPower System , Package,” Ver.3.2, Power System EngineeringResearch Center, Cornell University, 1997, http://www.pserc.cornell.edu//Matpower/.
Hindawi Publishing CorporationJournal of Electrical and Computer EngineeringVolume 2012, Article ID 560541, 5 pagesdoi:10.1155/2012/560541
Research Article
Reliability Evaluation of Distribution Power SystemsBased on Artificial Neural Network Techniques
Mohammoud M. Hadow,1 Ahmed N. Abd Allah,1 and Sazali P. Abdul karim2
1 Faculty of Electrical and Electronics Engineering, University of Malaysia, Pahang, Lebuhraya Tun Razak,Kuantan Pahang, 26300 Gambang, Malaysia
2 National Company, Engineering, Transmission Division TNB, Kuala Lumpur, Malaysia
Correspondence should be addressed to Mohammoud M. Hadow, [email protected]
Received 5 May 2011; Revised 21 July 2011; Accepted 25 August 2011
Academic Editor: Edgar Carreno
Copyright © 2012 Mohammoud M. Hadow et al. This is an open access article distributed under the Creative CommonsAttribution License, which permits unrestricted use, distribution, and reproduction in any medium, provided the original work isproperly cited.
In order to assess the reliability of distribution systems, more and more researchers are directing their attention to the artificialintelligent method, and several reliability indices have been proposed, such as basic load point indices and system performanceindices. Artificial neural network is recently established as a useful and much promising too, applied to variety of power systemsengineering. This paper presents ANN version for evaluating the reliability of distribution power systems (DPSs), in the proposedalgorithm, the ANN used to predicted (RPS) using historical data method constructed according to the backpropagation learningrule. At the same time, System indices such as SAIFI and SAIDI of real distribution system are computed and compared withresults generated by network method. The result obtained by proposed method gives acceptable reliability indices and can alsofound that the deviation of computed values by the proposed method is less than 1% and needs running time on ASUN networkenvironment of less than 2 s. The ANN approach demonstrates advantage over the network method.
1. Introduction
Broadly speaking, electrical power distribution systems in-clude all parts of electrical utility systems between bulk powersources and the consumers’ service-entrance equipment. Themain function of distribution network is to supply electricalpower generated from large sources to consumers at desiredvoltage level and with a degree of appropriate reliability [1].Reliability and efficient maintenance are crucial for the con-tinuity of electrical energy. It is customary for moderate dis-tribution networks to have a large number of nodes, to servea vast geographical area and to ensure a safe operation at se-vere ambient conditions [2]. Distribution networks operat-ing at several voltage levels including the networks of localor municipal unities are the primary parts of view; therefore,distribution system reliability evaluation is major preoccupa-tion of the power company, in particular, in face of emer-gency and necessary reconfiguration.
The techniques used in power system reliability evalua-tion can be divided into the two basic categories of analyti-cal and simulation methods. The analytical techniques are
highly developed and have been used in practical applica-tions for several decades [3]. Several methods [1–5] havebeen presented in literature for evaluating distribution sys-tem reliability; They have been divided in two abroad groups,firstly based on solution of logic networks and secondlyon the solution of state-space models. Between them, thesemethods can accommodate most practical systems. In addi-tion, the network methods for determining system reliabilityare comparatively simple and direct.
In this paper, it is proposed to solve the problem ofdistribution system reliability evaluation by ANN which canlearn from patterns encountered previously. Many types ofnetwork exist [1–8], but this study described here focuseson three layer feed forward network with backpropagationlearning rule [4]; the developed ANN was utilized to evaluatethe distribution system reliability. Three different cases arestudied on a real distribution system in (north Taiwan); theoutput of the result from the developed ANN is satisfactorycompared with that computed by network method with suf-ficient learning, the ANN generates result very fast and incursonly tiny deviation. The ANN also has an advantage over
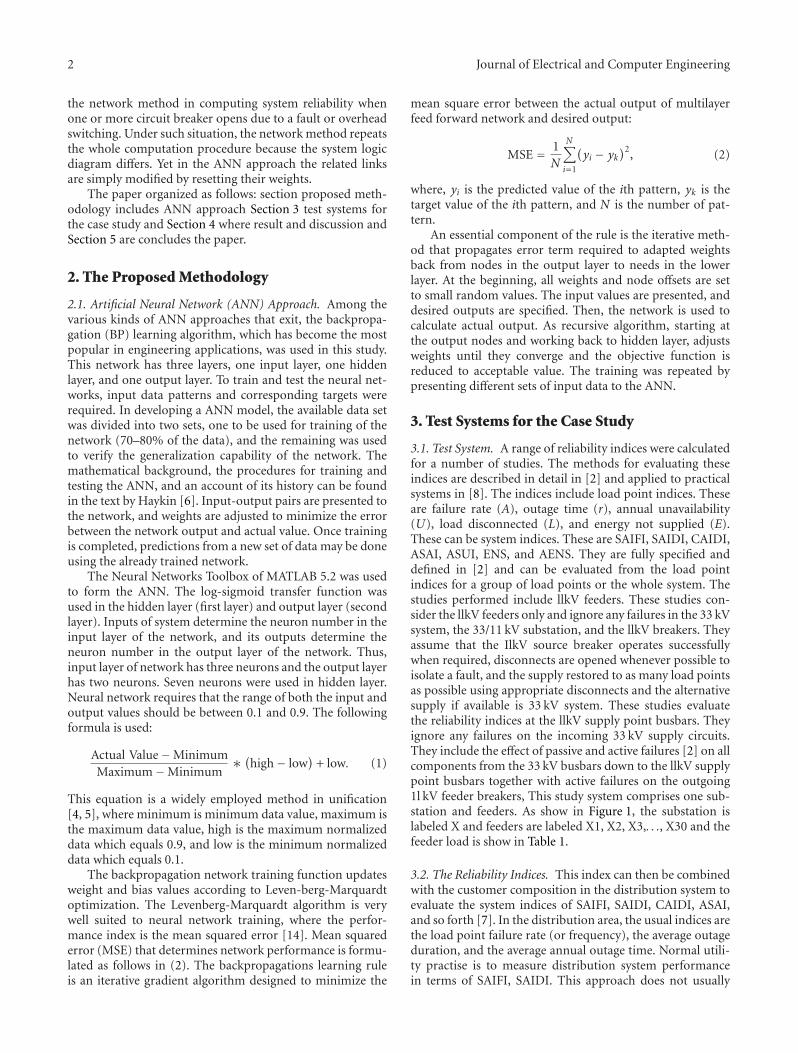
2 Journal of Electrical and Computer Engineering
the network method in computing system reliability whenone or more circuit breaker opens due to a fault or overheadswitching. Under such situation, the network method repeatsthe whole computation procedure because the system logicdiagram differs. Yet in the ANN approach the related linksare simply modified by resetting their weights.
The paper organized as follows: section proposed meth-odology includes ANN approach Section 3 test systems forthe case study and Section 4 where result and discussion andSection 5 are concludes the paper.
2. The Proposed Methodology
2.1. Artificial Neural Network (ANN) Approach. Among thevarious kinds of ANN approaches that exit, the backpropa-gation (BP) learning algorithm, which has become the mostpopular in engineering applications, was used in this study.This network has three layers, one input layer, one hiddenlayer, and one output layer. To train and test the neural net-works, input data patterns and corresponding targets wererequired. In developing a ANN model, the available data setwas divided into two sets, one to be used for training of thenetwork (70–80% of the data), and the remaining was usedto verify the generalization capability of the network. Themathematical background, the procedures for training andtesting the ANN, and an account of its history can be foundin the text by Haykin [6]. Input-output pairs are presented tothe network, and weights are adjusted to minimize the errorbetween the network output and actual value. Once trainingis completed, predictions from a new set of data may be doneusing the already trained network.
The Neural Networks Toolbox of MATLAB 5.2 was usedto form the ANN. The log-sigmoid transfer function wasused in the hidden layer (first layer) and output layer (secondlayer). Inputs of system determine the neuron number in theinput layer of the network, and its outputs determine theneuron number in the output layer of the network. Thus,input layer of network has three neurons and the output layerhas two neurons. Seven neurons were used in hidden layer.Neural network requires that the range of both the input andoutput values should be between 0.1 and 0.9. The followingformula is used:
Actual Value−MinimumMaximum−Minimum
∗ (high− low)
+ low. (1)
This equation is a widely employed method in unification[4, 5], where minimum is minimum data value, maximum isthe maximum data value, high is the maximum normalizeddata which equals 0.9, and low is the minimum normalizeddata which equals 0.1.
The backpropagation network training function updatesweight and bias values according to Leven-berg-Marquardtoptimization. The Levenberg-Marquardt algorithm is verywell suited to neural network training, where the perfor-mance index is the mean squared error [14]. Mean squarederror (MSE) that determines network performance is formu-lated as follows in (2). The backpropagations learning ruleis an iterative gradient algorithm designed to minimize the
mean square error between the actual output of multilayerfeed forward network and desired output:
MSE = 1N
N∑
i=1
(yi − yk
)2, (2)
where, yi is the predicted value of the ith pattern, yk is thetarget value of the ith pattern, and N is the number of pat-tern.
An essential component of the rule is the iterative meth-od that propagates error term required to adapted weightsback from nodes in the output layer to needs in the lowerlayer. At the beginning, all weights and node offsets are setto small random values. The input values are presented, anddesired outputs are specified. Then, the network is used tocalculate actual output. As recursive algorithm, starting atthe output nodes and working back to hidden layer, adjustsweights until they converge and the objective function isreduced to acceptable value. The training was repeated bypresenting different sets of input data to the ANN.
3. Test Systems for the Case Study
3.1. Test System. A range of reliability indices were calculatedfor a number of studies. The methods for evaluating theseindices are described in detail in [2] and applied to practicalsystems in [8]. The indices include load point indices. Theseare failure rate (A), outage time (r), annual unavailability(U), load disconnected (L), and energy not supplied (E).These can be system indices. These are SAIFI, SAIDI, CAIDI,ASAI, ASUI, ENS, and AENS. They are fully specified anddefined in [2] and can be evaluated from the load pointindices for a group of load points or the whole system. Thestudies performed include llkV feeders. These studies con-sider the llkV feeders only and ignore any failures in the 33 kVsystem, the 33/11 kV substation, and the llkV breakers. Theyassume that the IlkV source breaker operates successfullywhen required, disconnects are opened whenever possible toisolate a fault, and the supply restored to as many load pointsas possible using appropriate disconnects and the alternativesupply if available is 33 kV system. These studies evaluatethe reliability indices at the llkV supply point busbars. Theyignore any failures on the incoming 33 kV supply circuits.They include the effect of passive and active failures [2] on allcomponents from the 33 kV busbars down to the llkV supplypoint busbars together with active failures on the outgoing1l kV feeder breakers, This study system comprises one sub-station and feeders. As show in Figure 1, the substation islabeled X and feeders are labeled X1, X2, X3,. . ., X30 and thefeeder load is show in Table 1.
3.2. The Reliability Indices. This index can then be combinedwith the customer composition in the distribution system toevaluate the system indices of SAIFI, SAIDI, CAIDI, ASAI,and so forth [7]. In the distribution area, the usual indices arethe load point failure rate (or frequency), the average outageduration, and the average annual outage time. Normal utili-ty practise is to measure distribution system performancein terms of SAIFI, SAIDI. This approach does not usually
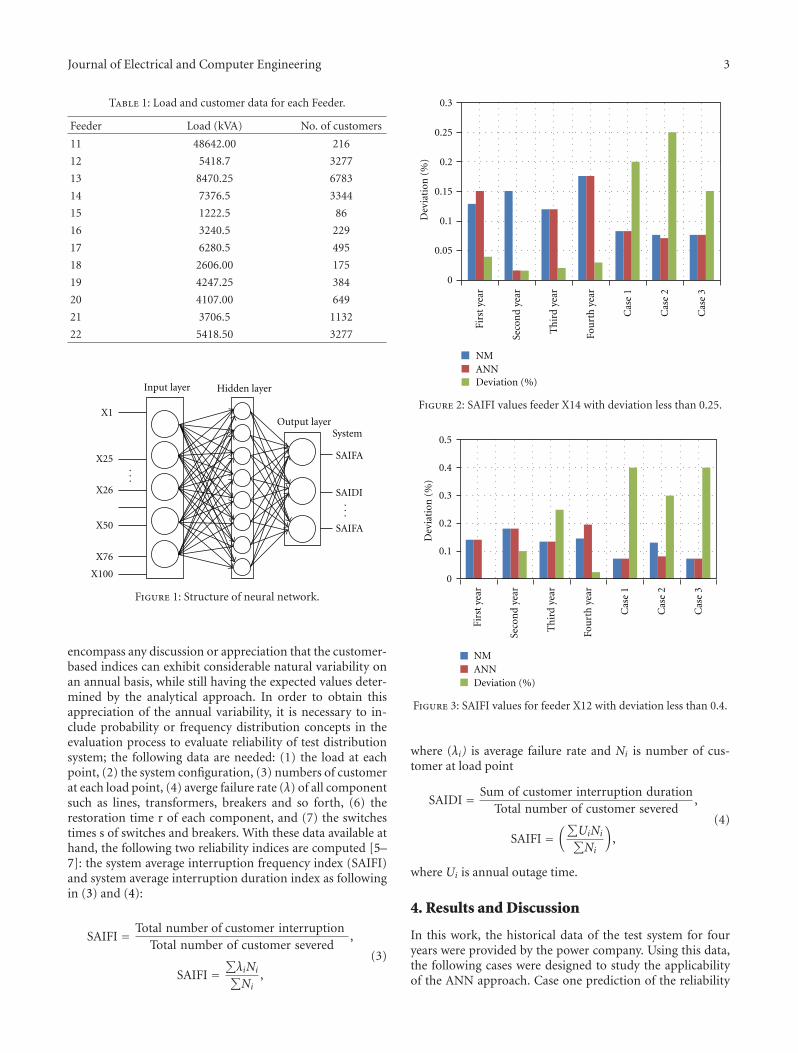
Journal of Electrical and Computer Engineering 3
Table 1: Load and customer data for each Feeder.
Feeder Load (kVA) No. of customers
11 48642.00 216
12 5418.7 3277
13 8470.25 6783
14 7376.5 3344
15 1222.5 86
16 3240.5 229
17 6280.5 495
18 2606.00 175
19 4247.25 384
20 4107.00 649
21 3706.5 1132
22 5418.50 3277
X1
X25
X26
X50
X76
X100
Input layer Hidden layer
Output layerSystem
...
...
SAIDI
SAIFA
SAIFA
Figure 1: Structure of neural network.
encompass any discussion or appreciation that the customer-based indices can exhibit considerable natural variability onan annual basis, while still having the expected values deter-mined by the analytical approach. In order to obtain thisappreciation of the annual variability, it is necessary to in-clude probability or frequency distribution concepts in theevaluation process to evaluate reliability of test distributionsystem; the following data are needed: (1) the load at eachpoint, (2) the system configuration, (3) numbers of customerat each load point, (4) averge failure rate (λ) of all componentsuch as lines, transformers, breakers and so forth, (6) therestoration time r of each component, and (7) the switchestimes s of switches and breakers. With these data available athand, the following two reliability indices are computed [5–7]: the system average interruption frequency index (SAIFI)and system average interruption duration index as followingin (3) and (4):
SAIFI = Total number of customer interruptionTotal number of customer severed
,
SAIFI =∑λiNi∑Ni
,
(3)
Firs
tye
ar
Seco
nd
year
Th
ird
year
Fou
rth
year
Cas
e1
Cas
e2
Cas
e3
0.3
0.25
0.2
0.15
0.1
0.05
0
NMANNDeviation (%)
Dev
iati
on(%
)
Figure 2: SAIFI values feeder X14 with deviation less than 0.25.
0.5
0.4
0.3
0.2
0.1
0
Firs
tye
ar
Seco
nd
year
Th
ird
year
Fou
rth
year
Cas
e1
Cas
e2
Cas
e3
NMANNDeviation (%)
Dev
iati
on(%
)
Figure 3: SAIFI values for feeder X12 with deviation less than 0.4.
where (λi) is average failure rate and Ni is number of cus-tomer at load point
SAIDI = Sum of customer interruption durationTotal number of customer severed
,
SAIFI =(∑
UiNi∑Ni
),
(4)
where Ui is annual outage time.
4. Results and Discussion
In this work, the historical data of the test system for fouryears were provided by the power company. Using this data,the following cases were designed to study the applicabilityof the ANN approach. Case one prediction of the reliability

4 Journal of Electrical and Computer Engineering
Table 2: System average interruption frequency index values (SAIFI).
Feeder14 Feeder12 System
(NM) (ANN) Deviation (%) NM ANN Deviations (%) NM ANN Deviation (%)
Fist year 0.1292 0.1493 0.04 0.14425 0.14295 0.0.25 0.3934 0.39345 0.005
Second year 0.14935 0.01493 0.015 0.18255 0.18125 0.10 0.45255 0.4526 0
Third year 0.11915 0.1191 0.02 0.137 0.1363 0.25 0.37085 0.32085 0
Fourth year 0.17565 0.17575 0.03 0.1478 0.1977 0.025 0.52075 0.52075 0
Case 1 0.0827 0.08235 0.2 0.0733 0.0736 0.40 0.2524 0.2542 0
Case 2 0.0758 0.07045 0.25 0.1324 0.0829 0.30 0.2524 0.2541 0.02
Case 3 0.0763 0.07605 0.15 0.0733 0.0739 0.40 0.25405 0.2542 0.53
Table 3: System average interruption duration index values (SAIDI).
X14 X12 System
(NM) (ANN) Deviation (%) NM ANN Deviations (%) NM ANN Deviation (%)
First year 0.1292 0.1293 0.04 0.1423 0.01429 0.30 0.3924 0.3935 0.03
Second year 0.14935 0.1493 0.02 0.1822 0.1818 0.15 0.4526 0.4526 0.00
Third year 0.1193 0.1191 0.02 0.1320 0.1363 0.25 0.3708 0.3708 0.00
Fourth year 0.1757 0.1758 0.03 0.1973 0.1977 0.03 0.1.0208 0.5206 0.00
Case 1 0.0827 0.0824 0.20 0.0733 0.0736 0.40 0.2524 0.2542 0.00
Case 2 0.0758 0.0754 0.25 0.0824 0.0826 0.30 0.2524 0.2541 0.02
Case 3 0.0713 0.0711 0.15 0.0733 0.0739 0.40 0.2542 0.2542 0.54
Firs
tye
ar
Seco
nd
year
Th
ird
year
Fou
rth
year
Cas
e1
Cas
e2
Cas
e3
NMANN
0.6
0.5
0.4
0.3
0.2
0.1
0
Deviation (%)
Dev
iati
on(%
)
Figure 4: SAIFI values for feeder whole system with deviation lessthan 0.55.
indices of 1996 by feeding the ANN with system data from1996 to 1995. Case 2. Evaluation of reliability indices whenthe feeder X14 is overload and part of its load is switched toX12. Case 3. Evaluation of the reliability indices when a faultoccurs in feeder X14. The fault location is indicated by thearrow in Figure 1.
The developed ANN is shown in Figure 1. The data offeeder X11, X12,. . ., X22 enter the network from the inputlayer. The output layer result value of SAIFI, SAIDI of thewhole system and each feeder. Corresponding to the number
Firs
tye
ar
Seco
nd
year
Th
ird
year
Fou
rth
year
Cas
e1
Cas
e2
Cas
e3
NMANN
0
0.3
0.25
0.2
0.15
0.1
0.05
Deviation (%)
Dev
iati
on(%
)
Figure 5: SAIDI values for feeder X14 with deviation less than 0.25.
of lines, buses, circuit breaker, and transformer of each feed-er, this network contains 1809 nodes in the input layer, 18nodes in output layer, and 100 nodes in the hidden layer.
The SAIFI, SAIDI values of X14, X12, and the whole sys-tem are given in Tables 2 and 3, respectively, the values com-puted by ANN are compared with results from the networkmethod. The deviations are found in the Tables 2 and 3;also the deviation is illustrated in Figures 2–7. it has foundthat the deviations of the values computed by the proposedapproach from those network methods are less than 0.005.
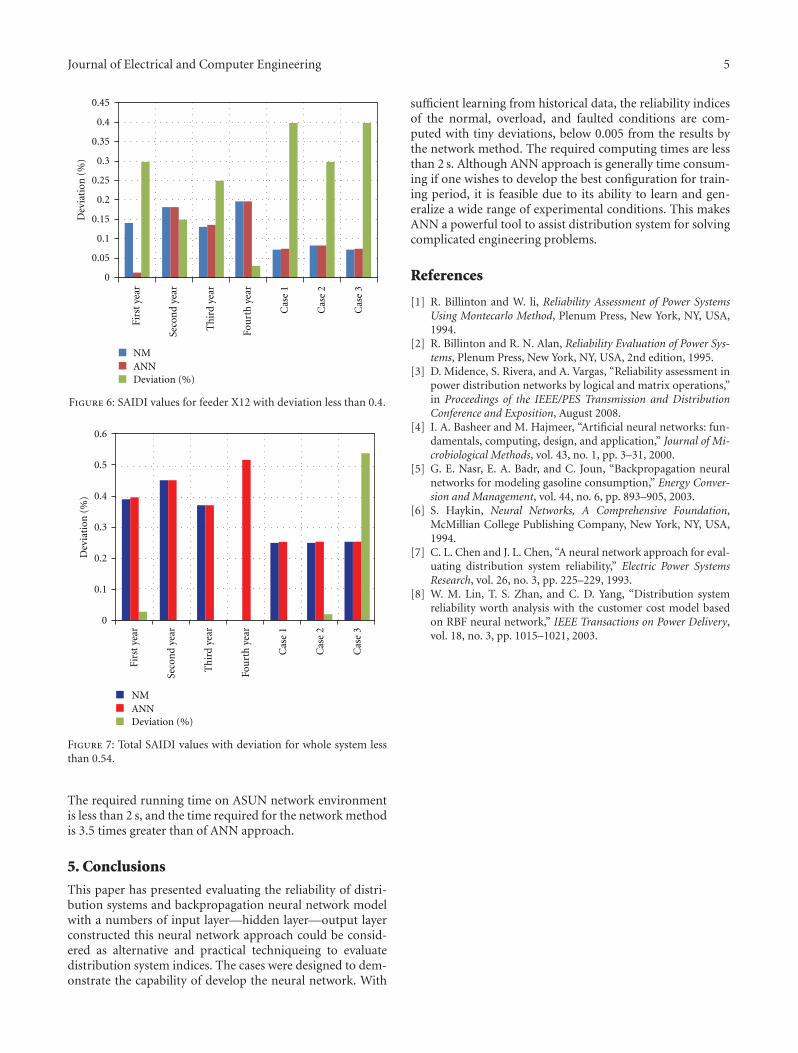
Journal of Electrical and Computer Engineering 5
Firs
tye
ar
Seco
nd
year
Th
ird
year
Fou
rth
year
Cas
e1
Cas
e2
Cas
e3
NMANN
0
0.45
0.4
0.35
0.3
0.25
0.2
0.15
0.1
0.05
Deviation (%)
Dev
iati
on(%
)
Figure 6: SAIDI values for feeder X12 with deviation less than 0.4.
Firs
tye
ar
Seco
nd
year
Th
ird
year
Fou
rth
year
Cas
e1
Cas
e2
Cas
e3
NMANN
0
0.6
0.5
0.4
0.3
0.2
0.1
Deviation (%)
Dev
iati
on(%
)
Figure 7: Total SAIDI values with deviation for whole system lessthan 0.54.
The required running time on ASUN network environmentis less than 2 s, and the time required for the network methodis 3.5 times greater than of ANN approach.
5. Conclusions
This paper has presented evaluating the reliability of distri-bution systems and backpropagation neural network modelwith a numbers of input layer—hidden layer—output layerconstructed this neural network approach could be consid-ered as alternative and practical techniqueing to evaluatedistribution system indices. The cases were designed to dem-onstrate the capability of develop the neural network. With
sufficient learning from historical data, the reliability indicesof the normal, overload, and faulted conditions are com-puted with tiny deviations, below 0.005 from the results bythe network method. The required computing times are lessthan 2 s. Although ANN approach is generally time consum-ing if one wishes to develop the best configuration for train-ing period, it is feasible due to its ability to learn and gen-eralize a wide range of experimental conditions. This makesANN a powerful tool to assist distribution system for solvingcomplicated engineering problems.
References
[1] R. Billinton and W. li, Reliability Assessment of Power SystemsUsing Montecarlo Method, Plenum Press, New York, NY, USA,1994.
[2] R. Billinton and R. N. Alan, Reliability Evaluation of Power Sys-tems, Plenum Press, New York, NY, USA, 2nd edition, 1995.
[3] D. Midence, S. Rivera, and A. Vargas, “Reliability assessment inpower distribution networks by logical and matrix operations,”in Proceedings of the IEEE/PES Transmission and DistributionConference and Exposition, August 2008.
[4] I. A. Basheer and M. Hajmeer, “Artificial neural networks: fun-damentals, computing, design, and application,” Journal of Mi-crobiological Methods, vol. 43, no. 1, pp. 3–31, 2000.
[5] G. E. Nasr, E. A. Badr, and C. Joun, “Backpropagation neuralnetworks for modeling gasoline consumption,” Energy Conver-sion and Management, vol. 44, no. 6, pp. 893–905, 2003.
[6] S. Haykin, Neural Networks, A Comprehensive Foundation,McMillian College Publishing Company, New York, NY, USA,1994.
[7] C. L. Chen and J. L. Chen, “A neural network approach for eval-uating distribution system reliability,” Electric Power SystemsResearch, vol. 26, no. 3, pp. 225–229, 1993.
[8] W. M. Lin, T. S. Zhan, and C. D. Yang, “Distribution systemreliability worth analysis with the customer cost model basedon RBF neural network,” IEEE Transactions on Power Delivery,vol. 18, no. 3, pp. 1015–1021, 2003.