application of swat in developing countries using readily
TRANSCRIPT

Application of SWAT in
Developing Countries using
Readily Available Data
J.H. Jacobs & R. Srinivasan

Poor Land Management
Poor Downstream Water Supply
�Disruption of wildlife habitat�Increased soil erosion�Disruption of hydrological cycles�Lack of forest products�Destabilization of local and global
climate patterns
Inadequate water for domestic use and irrigation� Nairobi Water supply� Horticulture and irrigation schemes
Siltation and water levels in the Masinga Dam� Storage water reservoir effects� Effect on power generation� High fluctuation of shorelines
The Tana River Basin

Study Objective
Explore the hydrologic impacts on the Masinga reservoir in response to land use interventions in the Upper Tana River catchment with a focus on varying levels of reforestation.


Study Area

Average Annual Rainfall

Elevation
3-D elevation graphic derived from 100-m DEM for the upper Tana River Basin.

Climate Data Sources and Locations
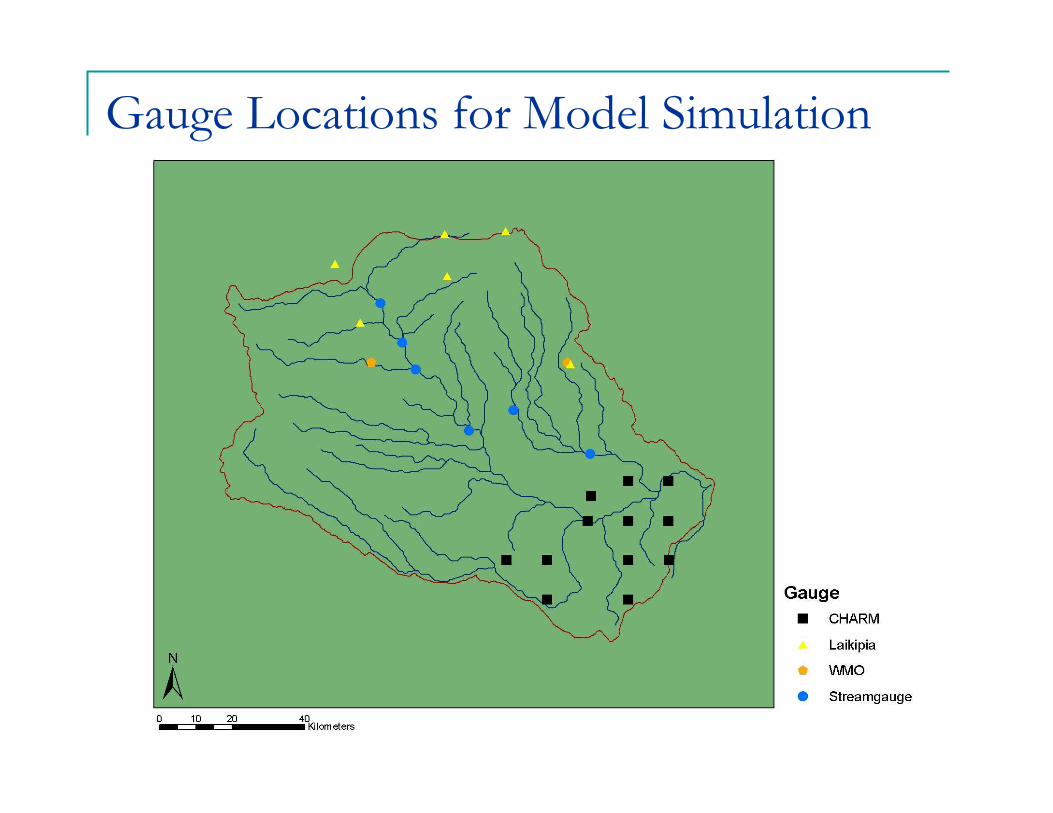
Gauge Locations for Model Simulation
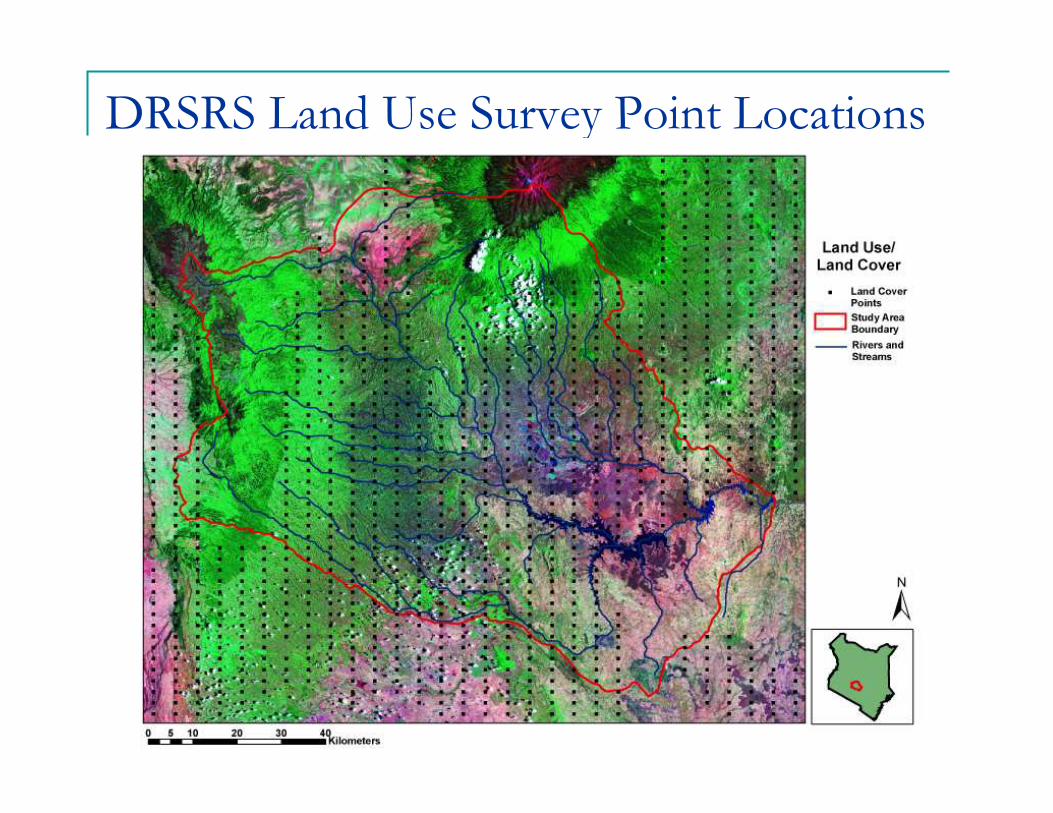
DRSRS Land Use Survey Point Locations

Land Use Model Input
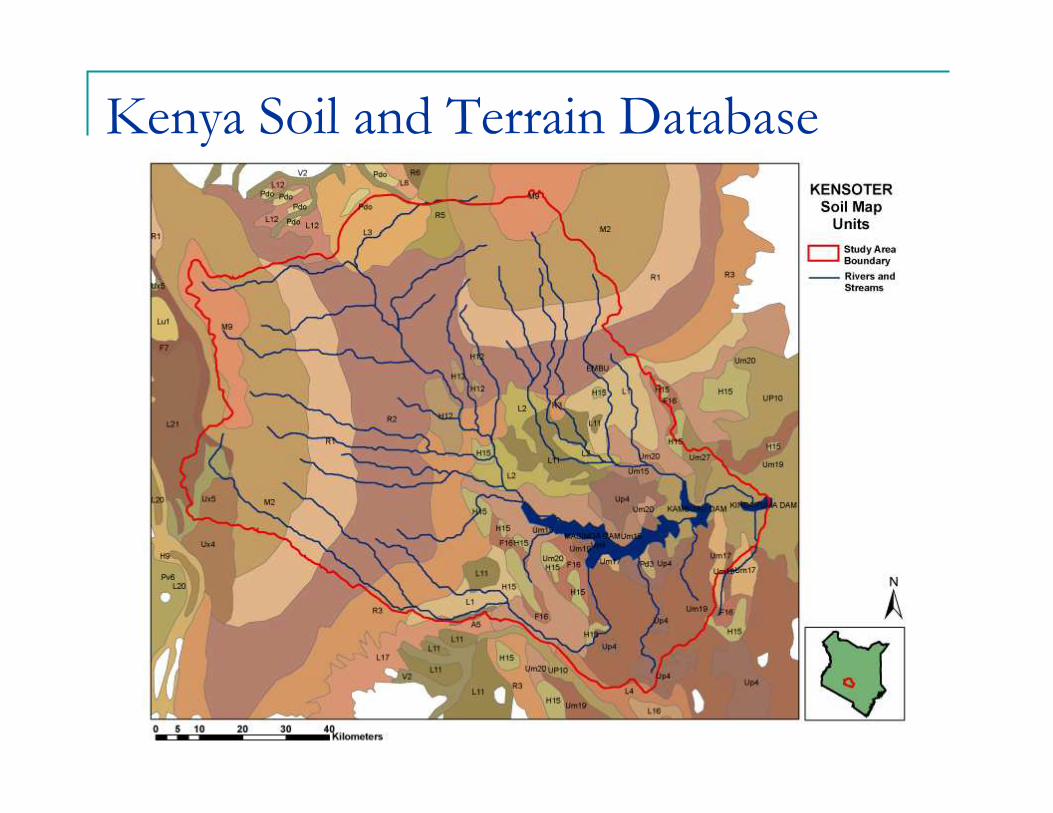
Kenya Soil and Terrain Database

SWAT Subbasin Delineation
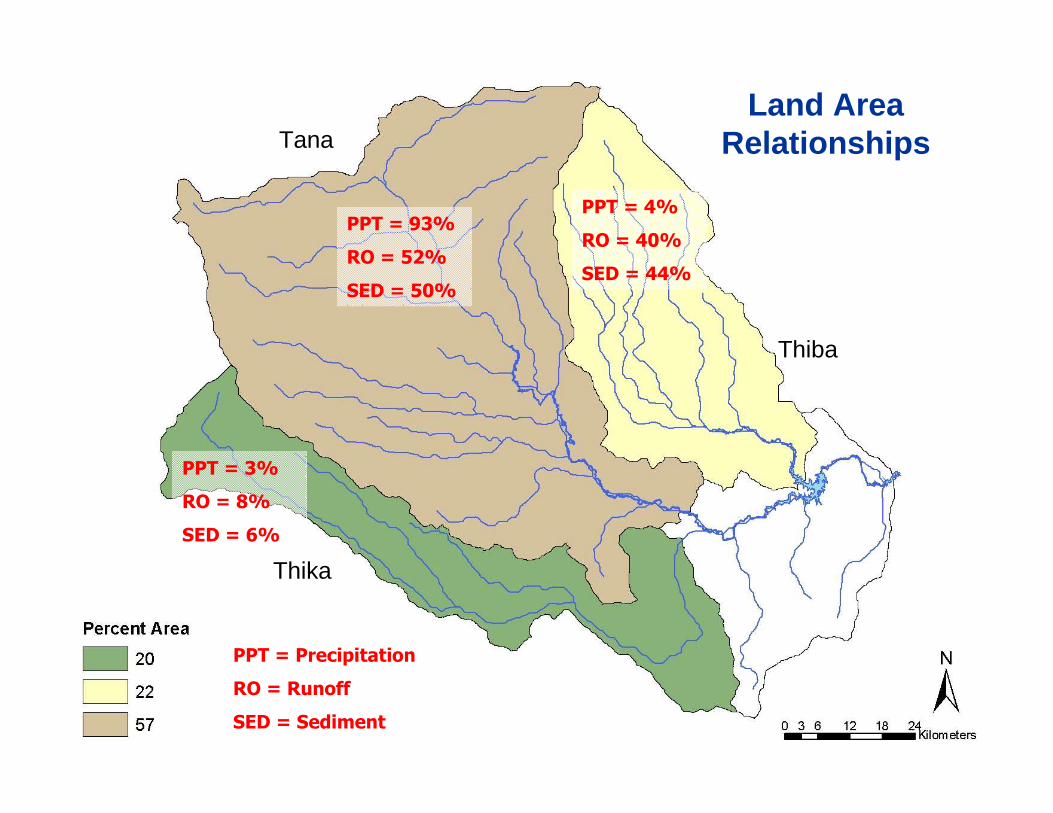
Land Area Relationships
Thika
Tana
Thiba
PPT = 4%
RO = 40%
SED = 44%
PPT = 93%
RO = 52%
SED = 50%
PPT = 3%
RO = 8%
SED = 6%
PPT = Precipitation
RO = Runoff
SED = Sediment

� Reforestation scenarios were implemented as full replacement of land by forest above a certain elevation.
� The GIS was used to build a conditional replacement model using the land use grid and the DEM. This allowed spatial representation of the scenarios
� For the base scenario, the areas designated as forest were left intact as were all other land uses.
Reforestation Scenarios
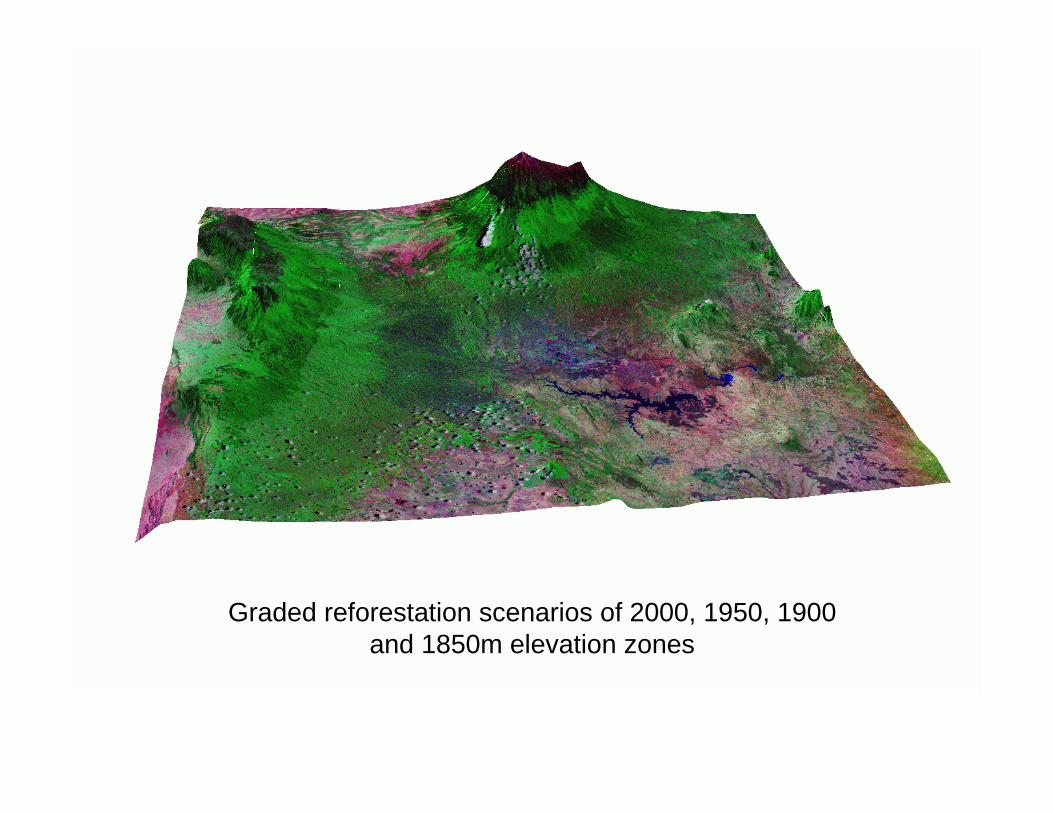
Graded reforestation scenarios of 2000, 1950, 1900 and 1850m elevation zones

Reforestation Results:
Average Annual Sediment Yield for Entire Basin
3.43
3.31 3.33
3.24
3.18
3.05
3.1
3.15
3.2
3.25
3.3
3.35
3.4
3.45
Baseline 2000 1950 1900 1850
Zonal Model Run
Mil
lio
n T
on
s o
f S
edim
ent

www-ssl.tamu.edu