critical review of the application of swat in the upper ... 9, 3761–3788, 2012 critical review of...
TRANSCRIPT
HESSD9, 3761–3788, 2012
Critical review of theapplication of SWAT
in the upper NileBasin countries
A. van Griensven et al.
Title Page
Abstract Introduction
Conclusions References
Tables Figures
J I
J I
Back Close
Full Screen / Esc
Printer-friendly Version
Interactive Discussion
Discussion
Paper
|D
iscussionP
aper|
Discussion
Paper
|D
iscussionP
aper|
Hydrol. Earth Syst. Sci. Discuss., 9, 3761–3788, 2012www.hydrol-earth-syst-sci-discuss.net/9/3761/2012/doi:10.5194/hessd-9-3761-2012© Author(s) 2012. CC Attribution 3.0 License.
Hydrology andEarth System
SciencesDiscussions
This discussion paper is/has been under review for the journal Hydrology and Earth SystemSciences (HESS). Please refer to the corresponding final paper in HESS if available.
Critical review of the application of SWATin the upper Nile Basin countriesA. van Griensven1,2, P. Ndomba3, S. Yalew1, and F. Kilonzo1,2,4
1UNESCO-IHE Institute of Water Education, P.O. Box 3015, Delft, The Netherlands2Vrije Universiteit Brussel, Pleinlaan 2, 1050 Brussels, Belgium3University of Dar es Salaam, P.O. BOX 35131, Dar es Salaam, Tanzania4Kenyatta University, P.O. BOX 43844, Nairobi, Kenya
Received: 15 February 2012 – Accepted: 19 February 2012 – Published: 20 March 2012
Correspondence to: A. van Griensven ([email protected])
Published by Copernicus Publications on behalf of the European Geosciences Union.
3761

HESSD9, 3761–3788, 2012
Critical review of theapplication of SWAT
in the upper NileBasin countries
A. van Griensven et al.
Title Page
Abstract Introduction
Conclusions References
Tables Figures
J I
J I
Back Close
Full Screen / Esc
Printer-friendly Version
Interactive Discussion
Discussion
Paper
|D
iscussionP
aper|
Discussion
Paper
|D
iscussionP
aper|
Abstract
The Soil and Water Assessment Tool (SWAT) is a hydrological simulation tool that iswidely applied within the Nile basin. Up to date, more than 20 peer reviewed papers de-scribe the use of SWAT for a variety of problems in the upper Nile basin countries, suchas erosion modeling, land use modeling, climate change impact modeling and water5
resources management. The majority of the studies are clustered in the tropical high-lands in Ethiopia and around Lake Victoria. The popularity of SWAT is attributed to thefact that the tool is freely available and that it is readily applicable through the develop-ment of Geographic Information System (GIS) based interfaces and its easy linkage tosensitivity, calibration and uncertainty analysis tools. The online and free availability of10
basic GIS data that are required for SWAT made its applicability more straight forwardeven in data scarce areas. However, the easy use of SWAT may not always lead toknowledgeable models. In this paper, we aim at critically reviewing the use of SWAT inthe context of the modeling purpose and problem descriptions in the tropical highlandsof the Nile Basin countries. A number of criteria are used to evaluate the model set-up,15
model performances, physical representation of the model parameters, and the cor-rectness of the hydrological model balance. On the basis of performance indicators,the majority of the SWAT models were classified as giving satisfactory to very goodresults. Nevertheless, the hydrological mass balances as reported in several paperscontained losses that might not be justified. Several papers also reported unrealistic20
parameter values. More worrying is that many papers lack this information. For thisreason, it is difficult to give an overall positive evaluation to most of the reported SWATmodels. An important gap is the lack of attention that is given to the vegetation andcrop processes. None of the papers reported any adaptation to the crop parameters,or any crop related output such as leaf area index, biomass or crop yields. A proper25
simulation of the land cover is important for obtaining correct runoff generation, evap-otranspiration and erosion computations. It is also found that a comparison of SWATapplications on the same or similar case study but by different research teams and/or
3762

HESSD9, 3761–3788, 2012
Critical review of theapplication of SWAT
in the upper NileBasin countries
A. van Griensven et al.
Title Page
Abstract Introduction
Conclusions References
Tables Figures
J I
J I
Back Close
Full Screen / Esc
Printer-friendly Version
Interactive Discussion
Discussion
Paper
|D
iscussionP
aper|
Discussion
Paper
|D
iscussionP
aper|
model versions resulted in very different results. It is therefore recommended to tryto find better methods to evaluate the representativeness of the distributed processesand parameters, especially when land use studies are envisaged or predictions of thefuture through environmental changes. The main recommendation is that more detailson the model set-up, the parameters and outputs should be provided in the journal5
papers or supplementary materials in order to allow for a more stringent evaluation ofthese models.
1 Introduction
The Soil and Water Assessment Tool (SWAT) is a physically based, spatially dis-tributed, continuous time hydrological model (Arnold et al., 1998). Major modules10
in the model include hydrology, erosion/sedimentation, plant growth, nutrients, pes-ticides, land management, stream routing, and pond/reservoir routing. The SWATmodeling tool simulates, among others, climate changes, hydrologic processes, landuse changes, water use management, water quality and water quantity assessments.SWAT requires a number of basin specific input data encompassing different compo-15
nents such as weather, hydrology, erosion/sedimentation, plant growth, nutrients, pesti-cides, agricultural management, channel routing, and pond/reservoir routing. Weatherinputs (i.e. precipitation, maximum and minimum temperature, relative humidity, windspeed, solar radiation) are required on a daily temporal resolution, although recent ver-sions of the model allow hourly input files. SWAT is imbedded in several GIS interfaces20
(e.g. ArcGIS, OpenMap, Grass, etc.) that allow to discretise a basin into sub-basins.Each subbasin contains river reaches and one set of weather inputs. The sub-basin isfurther subdivided into Hydrological Response Units that are identified on the basis ofsimilar land use, soil type and slope classes.
Over 600 peer-reviewed journal papers related to the SWAT model have been re-25
ported (Gassman et al., 2010). Besides its obvious advantage as a hydrological mod-elling tool that includes modularity, computational efficiency, ability to predict long term
3763
HESSD9, 3761–3788, 2012
Critical review of theapplication of SWAT
in the upper NileBasin countries
A. van Griensven et al.
Title Page
Abstract Introduction
Conclusions References
Tables Figures
J I
J I
Back Close
Full Screen / Esc
Printer-friendly Version
Interactive Discussion
Discussion
Paper
|D
iscussionP
aper|
Discussion
Paper
|D
iscussionP
aper|
impacts as a continuous model, and ability to use readily available global datasets,availability of a reliable user and developer support has contributed to its acceptance asone of the most widely adopted and applied hydrological models worldwide (Gassmanet al., 2010). The Nile countries are no exceptions in adopting SWAT as a hydrologicalmodeling tool. As much as authors advocate the use of SWAT as a modeling tool, they5
have concerns on whether the reported methods and approaches in fact, help achievetheir reported goals. The purpose of this review, therefore, is to evaluate various mod-els that have been reported in peer-reviewed journal papers in the upper Nile countriesby looking at their used approaches and methods with respect to what they state toachieve. In order to do so, the authors follow several fit-for-purpose (how usefull is10
the model for its purpose), fit-to-observation (how well do the model outputs fit to fieldobservations), and fit-to-reality (how well do the models represent the physical pro-cesses) evaluation criteria designed for measuring strength/weakness of the variousSWAT models the journals were based on.
2 Case study and model descriptions15
The Nile river drains an area of 2.9 million km2 that covers 10 % of the African continentwith its spread over 11 “Nile countries”: Egypt, Sudan, South-Sudan, Ethiopia, Eritrea,Uganda, Tanzania, Kenya, Burundi, Rwanda and DR Congo. With a course of 6695 kmit is the longest river in the world. The two major tributaries are the Blue Nile, stemmingfrom Lake Tana in Ethiopia and flowing to Sudan, and the White Nile, from Lake Victoria20
in the East African Community. Lake Victoria is fed by several tributaries: Kagera, Yala,Sondu, Nyando, Mara, Mbalageti, Simiyu and Konga rivers.
The Victoria Nile leaves Lake Victoria at the site of the now-submerged Owen Fallin Uganda and rushes for 483 km over rapids and cataracts until it enters Lake Albert.The river leaves Lake Albert as the Albert Nile through northern Uganda and at the25
South-Sudanese border it becomes the Bahr al Abyad or the White Nile.
3764

HESSD9, 3761–3788, 2012
Critical review of theapplication of SWAT
in the upper NileBasin countries
A. van Griensven et al.
Title Page
Abstract Introduction
Conclusions References
Tables Figures
J I
J I
Back Close
Full Screen / Esc
Printer-friendly Version
Interactive Discussion
Discussion
Paper
|D
iscussionP
aper|
Discussion
Paper
|D
iscussionP
aper|
The Blue Nile is locally called Abbay river when it leaves Lake Tana and flows throughthe Ethiopian plateau in an immense curve and pours itself out of the mountains in thehot plain of South Sudan where it is called the Bahr al Azraq. The Blue Nile andthe White Nile join each other in Khartoum to form the Nile river that flows Northeast.After 322 km the Nile river is joined by the Atbara river and continues its course up5
to Egypt where it enters Lake Nasser and flows further downstream to enter the NileDelta before reaching the Mediterranean sea.
This paper reviews the applications of SWAT within the tropical highlands of theNile countries (i.e. Tanzania, Uganda, Kenya, Rwanda and Ethiopia) and includes riverbasins that are not located within the upper Nile watershed. For that purpose, peer10
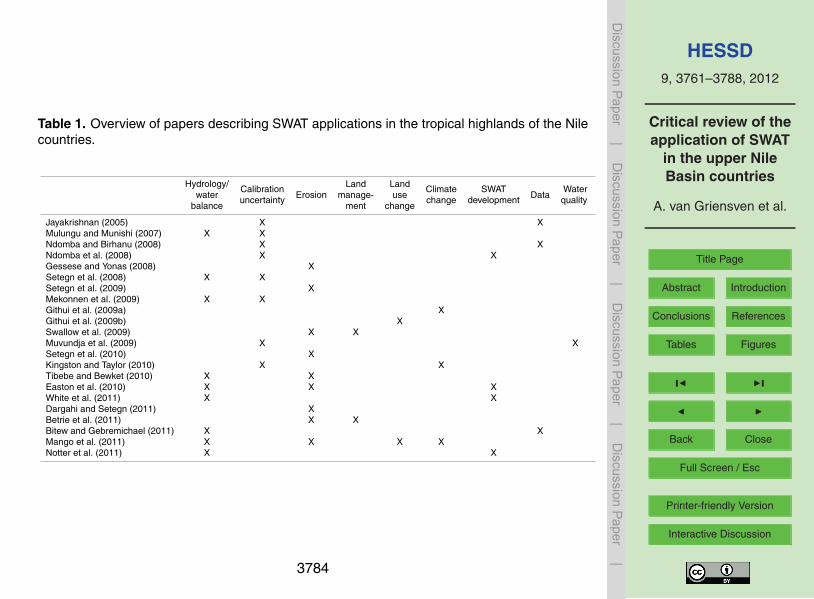
reviewed papers have been reviewed in the previously mentioned countries, up to theyear 2011. More than 20 peer-reviewed papers were identified out of which more thanhalf are located in Ethiopia which are listed in Table 1 according to their topic. Themain results of these papers are summarized below per topic.
2.1 Model calibration, parameterization and validation15
Jayakrishnan et al. (2005) modeled the hydrology of the 3050 km2 Sondu river basin inKenya using land use, soil and elevation data with limited spatial resolution (1–10 km2).The objective was to assess impacts of land use changes as a result of changes tointensive dairy farming. The simulation Nash-Sutcliffe efficiency coefficient (NSE) of<0.1 was attributed to inadequate rainfall and other model input data. The use of one20
rain gauge station situated at the upper end of the catchment was not representativeof the basin.
Mulungu and Munishi (2007) calibrated the SWAT model for the 11 000 km2 Simiyucatchment in Tanzania using improved spatial inputs for land use and soil. The studyused land use map developed from Landsat thematic mapper images to coincide with25
the period of available flow data. Local soil and geological maps were used to augmentthe SOTER 1:2 000 000 global database. The sensitivity analysis was performed for16 parameters with the Latin hypercube one at a time (LH-OAT), and autocalibration
3765
HESSD9, 3761–3788, 2012
Critical review of theapplication of SWAT
in the upper NileBasin countries
A. van Griensven et al.
Title Page
Abstract Introduction
Conclusions References
Tables Figures
J I
J I
Back Close
Full Screen / Esc
Printer-friendly Version
Interactive Discussion
Discussion
Paper
|D
iscussionP
aper|
Discussion
Paper
|D
iscussionP
aper|
with the shuffled complex evolution (SCE) algorithm. Although resulting total wateryield and surface runoff fractions of the water balance were within ±1 % of the observedflow, the base flow fraction was off target by 50 %. Improving the spatial resolution ofthe soil and land use inputs did not improve the model performance, which resulted inan NSE of 0.4. Although no particular factors were attributed to this poor performance,5
the authors recommended the use of improved spatial distribution of rainfall.In modeling the hydrology of the Mitano river basin in Uganda, Kingston and Tay-
lor (2010) used the gridded 0.5◦ CRUTS3.0 database as the climatic input. Althoughthere was a good agreement between observed and simulated monthly means andflow duration curves, the model performance after calibration was poor, resulting in an10
NSE of −0.09. According to the author, the poor performance in the hydrological mod-eling was attributed to “model-observation divergences with the calibration period thatare simply too large to be resolved by an auto-calibration routine”.
Setegn et al. (2008) used SWAT to model the hydrological water balance of the LakeTana Basin in Ethiopia with the objective of testing the performance of the SWAT model15
for stream flow prediction. These authors calibrated and validated on four tributaries ofLake Tana using SUFI-2, GLUE and ParaSol algorithms. This paper reported that theSWAT model was more sensitive to HRU definition thresholds than to sub-basin dis-cretization. Further, the paper reported that uncertainties were captured by bracketingmore than 60 % of the observed river discharge.20
Mekonnen et al. (2009) with the intention of developing a generic rainfall-runoff modelthat would be better suited to Ethiopian catchments, used a spectrum analysis methodto extract evidence regarding the relationships between different temporal scales ofavailable daily rainfall and runoff series which reflect the temporal and spatial scales ofdischarge in two watersheds in Ethiopia. The paper reported that frequencies in rainfall25
and stream discharge longer than 50 days had a sufficient coherence to warrant modelcalibration.
Tibebe and Bewket (2010) assessed surface runoff generation and soil erosion ratesfor a small watershed in the Awash River basin of Ethiopia using the SWAT model.
3766
HESSD9, 3761–3788, 2012
Critical review of theapplication of SWAT
in the upper NileBasin countries
A. van Griensven et al.
Title Page
Abstract Introduction
Conclusions References
Tables Figures
J I
J I
Back Close
Full Screen / Esc
Printer-friendly Version
Interactive Discussion
Discussion
Paper
|D
iscussionP
aper|
Discussion
Paper
|D
iscussionP
aper|
Comparing monthly predicted runoff against the measured values, the study demon-strates that distribution of observed and simulated runoff was quite uniform throughoutthe simulation period, with a high correlation value (r =0.831). It further reports aNSE of 0.789 to show that the model was able to generate monthly runoff close to theobserved.5
Notter et al. (2011) applied the SUFI2 algorithm within SWAT-CUP to perform thecalibration and validation in 8 and 6 stations respectively. NSE values were higherthan 0.5 for 7 out of the 8 gauges during calibration and 4 out of the 6 gauges duringvalidation.
2.2 Land use change10
In analyzing the impacts of land cover change on runoff for the Nzoia basin in Kenya,Githui et al. (2009) used plausible “worst” (scenario 1) and “best” (scenario 2) casescenarios. The emphasis was on “reforestation and sustainable agriculture” for thebest-case scenario, and “deforestation and expansion of unsustainable agriculture” forthe worst-case scenario. Using the CLUE-S model (Verburg and Veldkamp, 2004) land15
cover scenarios were generated by using a baseline map as the dependent variableand location factors such as population, elevation, slope, distances to rivers and towns,and lithology in logistic regression (see Fig. 1).
Mango et al. (2011) used three hypothetical scenarios; partial deforestation, com-plete deforestation to grassland, complete deforestation to agriculture to analyse the20
sensitivity of model outputs to land use change for a small subbasin (700 km2) on theNyangores tributary of the Mara river basin, Kenya. Simulations under all land usechange scenarios where forest is converted to agricultural land indicated an increasedsurface flow and a decreased subsurface flow and average flow over the period ofsimulation, while evapotranspiration shows a small positive increase. These results25
are contrary to the results obtained by Githui et al. (2009), where a reduction in forestcover led to a decrease in evapotranspiration, an increase in both surface and baseflow and a large increase in water yield.
3767
HESSD9, 3761–3788, 2012
Critical review of theapplication of SWAT
in the upper NileBasin countries
A. van Griensven et al.
Title Page
Abstract Introduction
Conclusions References
Tables Figures
J I
J I
Back Close
Full Screen / Esc
Printer-friendly Version
Interactive Discussion
Discussion
Paper
|D
iscussionP
aper|
Discussion
Paper
|D
iscussionP
aper|
2.3 Climate change uncertainty and impacts analyses
Kingston and Taylor (2010) explored the impacts of projected climate change on waterresources of the Upper Nile basin and the uncertainty associated with such projectionsof the hydrological change on the 2098 km2 Matano River basin in Uganda. The as-sessment included the evaluation of the range of uncertainty due to climate sensitivity,5
choice of Global Circulation Models (GCMs), and hydrological model parameterization.The authors found an overwhelming dependence upon the GCMs used for climate pro-jections and showed that single GCM evaluations of climate change impacts are likelyto be wholly inadequate and potentially misleading as a basis for the analysis of climatechange impacts on freshwater resources. On the hydrology, the study found that the10
proportion of precipitation that contributes to the Mitano river discharge via groundwa-ter will decrease as a result of increasing temperature. The increasing evapotranspira-tion due to increasing global temperatures (rather than reduced precipitation) limits theamount of water penetrating the soil profile and replenishing the shallow groundwaterstore during the wet season.15
Githui et al. (2009) used the monthly change fields of rainfall and temperature insteadof mean annual perturbations to the historical time series or hypothetical scenarios forthe 12 709 km2 Nzoia basin in Kenya, since the region has distinct wet and dry seasons.They used the MAGICC and Scenario Generator (SCENGEN) from the Climatic Re-search Unit (CRU) of the University of East Anglia to construct climate change scenario20
based on IPCC A2 and B2 scenarios, for two selected 30-yr periods: 2010–2039 cen-tred on 2020 and 2040–2069 centred on 2050. Five GCMs (CCSR, CSIRO, ECHAM4,GFDL, and HADCM3) selected based on a correlation of greater than 0.7 between theobserved and the simulated rainfall and temperature and a small root mean square er-ror were used in this study. Scenarios of future climate were obtained by adjusting the25
baseline observations by the difference for temperature or percentage change for rain-fall between period-averaged results for the GCM experiments (30-yr period) and thesimulated baseline period (1981–2000). All the scenarios indicated that temperature
3768

HESSD9, 3761–3788, 2012
Critical review of theapplication of SWAT
in the upper NileBasin countries
A. van Griensven et al.
Title Page
Abstract Introduction
Conclusions References
Tables Figures
J I
J I
Back Close
Full Screen / Esc
Printer-friendly Version
Interactive Discussion
Discussion
Paper
|D
iscussionP
aper|
Discussion
Paper
|D
iscussionP
aper|
would increase in this region, with the 2050s experiencing much higher increases thanthe 2020s. While the models were consistent with respect to changes in both runoffand base flow, average stream flow seen to increase with rainfall increase, relativelyhigher amounts were observed in the 2050s than in 2020s. All scenarios indicatedhigher probabilities to exceed the bankfull discharge than the observed time series.5
Mango et al. (2011) developed the regional averages of temperature and precipita-tion projections from a set of 21 global models in the MMD (multi-model dataset) for theA1B scenario for East Africa. Based on the reported changes in temperature and pre-cipitation, the hydrological model was run for minimum, median and maximum changescenarios. The mean for all projections is a 7 % increase in annual precipitation by10
2099, with projections ranging from −3 % to 25 %. Notable is the disproportionatelynonlinear response of a large stream flow change occurred by a small change in pre-cipitation. A combined decrease in precipitation and an increase in temperature led toincreased evapotranspiration and reduced runoff.
Whereas Githui et al. (2009) argues that stream flow response was not sensitive to15
changes in temperature, Kingston and Taylor (2010), and Mango et al. (2011) postu-lated that increases in temperature lead to an increase in evaporation and hence achange in the water balance reducing the stream flow. Interestingly, both Kingstonand Taylor (2010), and Mango et al. (2011) used satellite derived climatic data fortheir input into the hydrological model and baseline, while Githui et al. (2009) built20
their model on observed climatic data. Another difference between the two sides isthe size of the catchments under consideration. On the one hand, the small size ofthe Mitano and Nyangores catchments at 2098 km2 and 700 km2, respectively meansthat all the components of the hydrological cycle may not be fully reflected, especiallythe loss of groundwater to shallow and deep aquifer and transfer to downstream sub25
basins. On the other hand, Githui et al. (2009) simulated a large and complex catch-ment (>12 000 km2) which compounds the interactions in the processes and reducesthe transfers to other basins.
3769

HESSD9, 3761–3788, 2012
Critical review of theapplication of SWAT
in the upper NileBasin countries
A. van Griensven et al.
Title Page
Abstract Introduction
Conclusions References
Tables Figures
J I
J I
Back Close
Full Screen / Esc
Printer-friendly Version
Interactive Discussion
Discussion
Paper
|D
iscussionP
aper|
Discussion
Paper
|D
iscussionP
aper|
2.4 Erosion modeling
Swallow et al. (2009) used the SWAT model to estimate sediment yields and changesin sediment yield for the Yara and Nyando basins draining into the Lake Victoria fromthe Mau region in Kenya. A spatial analysis of tradeoffs and synergies between sed-iment yield and agricultural production for the year 2005 was generated through a5
spatial overlay of results on sediment yields and value of agricultural production at thesub-basin level. The Yala and Nyando basins measuring 4000 km2 and 3000 km2 re-spectively have a mix of land tenure types. The authors noted the inability of the SWATmodel to consider gully in the Modified Unified Soil Loss Equation, as a potential causeof underestimation of sediment yield especially for soil prone to gully erosion.10
Setegn et al. (2010) used SWAT to simulate the sediment yield simulations for theAnjeni, a small watershed (1.35 km2) in the northern highlands of Ethiopia, using differ-ent slope classifications. The annual sediment yields were around 27.8 and 29.5 t ha−1.The paper showed that the results are highly sensitive to the size of the sub-basins.The obtained erosion parameters were used to model sediment transport in the Lake15
Tana basin in Ethiopia and gave annual sediment yields that varied spatially between0 and 65 t ha−1. Betrie et al. (2011) used SWAT to evaluate effects of several Best Man-agement Scenarios (filter strips, stone bunds, and reforestation) for the Upper Blue NileBasin in Ethiopia. The results showed a very high spatial variability for the obtainedannual sediment yields, ranging from 0 to more than 150 t ha−1. Easton et al. (2010)20
simulated the hydrologic balance and sediment loss for the Blue Nile watershed thatlies mainly in Ethiopia using SWAT-WB, a modified SWAT model that captures vari-able source area hydrologic phenomena. Predicted runoff losses (averaged across theentire subbasin) varied from as low as 13 mm yr−1 for the entire Blue Nile Basins to44 mm yr−1 in Anjeni. Very large spatial variations in the computed erosion rates where25
reported (10 % of the area contributes to 75 % of the total sediment yield).
3770

HESSD9, 3761–3788, 2012
Critical review of theapplication of SWAT
in the upper NileBasin countries
A. van Griensven et al.
Title Page
Abstract Introduction
Conclusions References
Tables Figures
J I
J I
Back Close
Full Screen / Esc
Printer-friendly Version
Interactive Discussion
Discussion
Paper
|D
iscussionP
aper|
Discussion
Paper
|D
iscussionP
aper|
Tibebe and Bewket (2010) used SWAT for hydrologic and soil erosion predictionsfor the Keleta watershed in central Ethiopia after calibrating the model against surfacerunoff that was obtained from flow separation techniques. The annual sediment yieldvaried between 1.57 and 7.57 t ha−1 yr−1 with a long term average of 4.26 t ha−1 yr−1.
Muvundja et al. (2009) used an un-calibrated SWAT model to estimate flows and pol-5
lutant loads for the 127 streams draining to Lake Kivu; SWAT was used in a supportingrole to other techniques that were used for the primary analysis; problems regardingthe un-calibrated SWAT results are discussed.
3 Evaluation criteria
The appropriateness of the models is evaluated based on three criteria. The evalu-10
ation is done on so called performance indicators (fit-to-observations) as well as onevaluation of to what extent the hydrological and agricultural processes are realisticallyrepresented by means of parameter and mass balance evaluations (fit-to-reality) andto what extent the models are able to tackle the problem (fit-to-purpose).
3.1 Fit-to-observations15
A fit-to-observations criteria computes the error between the model outputs and obser-vations for the same variable and is the most typical evaluation criteria to evaluate theperformance of hydrological modeling. Moriasi et al. (2007) proposed model evalua-tion guidelines by assessing the accuracy of simulations compared to measurements.Quantitative statistics Nash-Sutcliffe efficiency (NSE), percent bias (PBIAS), and ratio20
of the root mean square error to the standard deviation of measured data (RSR) wererecommended for model evaluation in addition to graphical assessment through hydro-graphs and percent excedence probability curves. The guidelines proposed that modelresults can be judged as satisfactory if NSE>0.5 and RSR≤0.7, and if PBIAS±25 %for stream flow, PBIAS±55 % for sediment for a monthly time step. For hydrological25
modeling, the NSE is the most frequently used indicator in the assessment of modelperformance.
3771
HESSD9, 3761–3788, 2012
Critical review of theapplication of SWAT
in the upper NileBasin countries
A. van Griensven et al.
Title Page
Abstract Introduction
Conclusions References
Tables Figures
J I
J I
Back Close
Full Screen / Esc
Printer-friendly Version
Interactive Discussion
Discussion
Paper
|D
iscussionP
aper|
Discussion
Paper
|D
iscussionP
aper|
3.2 Fit-to-reality
The aim of a conceptual model is to represent the physical processes whereby theobserved processes should be well described in the coded model equations while theassessed or calibrated parameters should maintain their physical meaning. The ob-tained mass balances should be in equilibrium (e.g. inputs minus outputs should be5
explained by the change in the state variables) and the hydrological mass balanceshould be in line with the knowledge from the field.
3.2.1 Process representation
The popularity of the SWAT model is largely due to the multi-disciplinary coverageof processes representing the hydrology, soil science, erosion/sediment transport,10
crop growth, in-stream water quality and the agricultural management. Even thoughSWAT contains many processes, certain processes may still not be well represented.E.g. Ndomba and van Griensven (2011) indicated in their paper that certain landscapeelements, such as wetlands, are not well represented in the SWAT model while theymay have a huge impact on the hydrological and nutrient cycle. One may also won-15
der whether the concepts behind the way the processes are represented in the SWATmodel are generally applicable all over the globe. Several of these processes have anempirical background whereby the equations were derived from large data sets in theUS. The used Curve Number approach and the USLE soil loss equations are goodexamples.20
As the SWAT model is open-sources, it allowed some users to redefine these pro-cesses for specific regional needs. One of these developments that has been appliedwithin the Nile basin is the SWAT-WB model that represents a hydrology that is drivenby saturation excess processes as an alternative to the curve number of the SWATmodel that represents infiltration-excess processes (Easton et al., 2010).25
3772
HESSD9, 3761–3788, 2012
Critical review of theapplication of SWAT
in the upper NileBasin countries
A. van Griensven et al.
Title Page
Abstract Introduction
Conclusions References
Tables Figures
J I
J I
Back Close
Full Screen / Esc
Printer-friendly Version
Interactive Discussion
Discussion
Paper
|D
iscussionP
aper|
Discussion
Paper
|D
iscussionP
aper|
3.2.2 Parameter value evaluations
After a calibration process, the parameters should maintain their physical meaningwhen looking at the absolute values as well as how they relate to each other in a rel-ative way (for the distributed parameters). With regard to the parameter values, it isimportant to see to what extent the default parameters that have been identified for the5
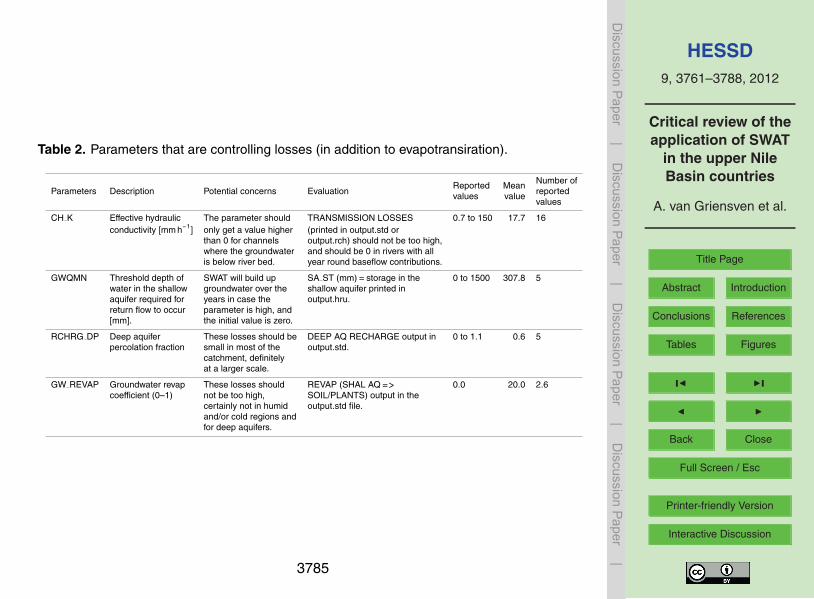
USA were adjusted towards the African conditions during the calibration process. Spe-cial attention should be given to the parameters listed in Table 2 where wrong param-eter values may lead to unrealistic simulations. These parameters govern processesthat result in a loss of water from the system. Modelers should hence take care thatthey do not use these parameters to match the water balance for the wrong reasons.10
“CH K” describes infiltration in the river bed which occurs in “hanging” rivers wherethe river bed is higher than the groundwater level. Normally, this water is not lost butshould reach (partially) the aquifer below the river. “RCHRG DP” simulates the waterthat is going to deep water storage that will not discharge towards the river. Such deepgroundwater losses might be significant in small catchments but should not dominate in15
large river basins. “GW REVAP” describes the process of capillary rise but the equa-tion rather describes evapotranspiration from the shallow aquifer which is controlledby the potential evapotranspiration. The “revap” water volume is not moving to the soilprofile, but is lost from the system and should not become too large. “GWQMN” definesa threshold in the shallow aquifer, and recharge will only occur when the aquifer level20
goes beyond GWQMN. Since a SWAT model will start with an empty shallow aquifer,it may take several years before the GWQMN level is reached. In that case, the modelwill build up water in the shallow aquifer whereby the input (rainfall) might not equal tothe output (flow+ losses).
3.2.3 Mass balance evaluations25
Models are always simplifications of reality and the degree that a model is representingthe physical processes within a catchment cannot be accurately quantified. However,
3773

HESSD9, 3761–3788, 2012
Critical review of theapplication of SWAT
in the upper NileBasin countries
A. van Griensven et al.
Title Page
Abstract Introduction
Conclusions References
Tables Figures
J I
J I
Back Close
Full Screen / Esc
Printer-friendly Version
Interactive Discussion
Discussion
Paper
|D
iscussionP
aper|
Discussion
Paper
|D
iscussionP
aper|
there are a couple of checks that can be done with regard to the mass balance. Toclose the hydrological mass balance, it is expected that the flows and the losses equalthe rainfall (P ) on the long term, as there should not be a trend in the storage. Thismay not be true in case that the model is building up storage in the shallow aquifer(∆GW Storage) or the soil profile (∆SW Storage), all expressed in mm yr−1.5
P = ET + Water Yield + ∆SW Storage + ∆GW Storage + Losses. (1)
The water yield (mm yr−1) is computed as the sum of surface flow (SurfQ), the laterfalflow (LatQ) and the shallow groundwater flow (GW Q) diminished by the pond abstrac-tions.
Water Yield = Surf Q + Lat QQW 2Q − T Loss − Pond Abstractions. (2)10
In addition, certain losses should not be over-estimated in order to compensate for anunderestimation of the evapotranspiration. Within the SWAT model, there are a coupleof “black holes” where the water might be trapped. An example is the losses to thedeep aquifer. Such losses should not be too high for large basins. Also the capillaryraise (GW REVAP) is a loss component that should not be too high. Since this water15
is not going to the stream flow, it is simply disappearing from the system. Anotherloss component is the river bed infiltration (controlled by the parameter CH K), whichshould not happen in streams where the shallow aquifer is higher than the river bed,and hence producing a groundwater flow. Table 2 summarizes parameters that controlthe previously mentioned losses.20
3.3 Fit-to-purpose
Certain characteristics should be taken into account for certain model applications. Fora good land use analysis, it is important, first of all, that all the land uses are includedin the model. This means that during a model set-up, one should not use the option inthe SWAT interface to exclude some marginal land uses whose percentage within the25
sub-basin is below a certain threshold. It is difficult to judge whether the models used3774
HESSD9, 3761–3788, 2012
Critical review of theapplication of SWAT
in the upper NileBasin countries
A. van Griensven et al.
Title Page
Abstract Introduction
Conclusions References
Tables Figures
J I
J I
Back Close
Full Screen / Esc
Printer-friendly Version
Interactive Discussion
Discussion
Paper
|D
iscussionP
aper|
Discussion
Paper
|D
iscussionP
aper|
in the papers properly represent the land covers as no information has been given onhow the default land management and crop parameters have been adjusted to localland use practices. A land use modeling study requires more stringent evaluationsof the model than a good NSE value. It is important that the hydrological processes(i.e. surface runoff, infiltration, groundwater discharge, evapotranspiration) are properly5
simulated for the different land uses. It may also be important to properly validate thespatial variability by means of internal observations or other spatial observations suchas remote sensing.
4 Review results and discussion
4.1 Fit-to-observations10
Table 3 gives an overview of the evaluations including NSE values, comments on re-ported parameter values and baseflow factors (subsurface flow divided by total runoff)are provided based on what has been reported for the different case studies. In sev-eral cases, the performance indexes of the model are not reported. Besides, the casesreviewed have a wide range of spatial representation with the catchment size varying15
from 1.1 to 184 560 km2. Some authors calibrated against monthly data whereas othersagainst daily data. Sometimes several calibrations where done with different sourcesof input data. There are differences in climate zones, where in Ethiopia there is a verydistinct rainy season and a very high variability in the stream flows which tends to favorthe obtained values of performance indexes. So, a complete fair comparison is not20
possible. Our evaluation is based on the NSE. When several values were reported, theoverall evaluation was based on the highest value (Table 3). Using the classification asproposed by Moriasi et al. (2007) 15 catchment models were classified as very good,2 as good, 6 as satisfactory 3 as poor and 5 studies did not report any NSE value at all.
3775
HESSD9, 3761–3788, 2012
Critical review of theapplication of SWAT
in the upper NileBasin countries
A. van Griensven et al.
Title Page
Abstract Introduction
Conclusions References
Tables Figures
J I
J I
Back Close
Full Screen / Esc
Printer-friendly Version
Interactive Discussion
Discussion
Paper
|D
iscussionP
aper|
Discussion
Paper
|D
iscussionP
aper|
4.2 Fit-to-reality evaluations
Under the fit-to-reality evaluation criteria, we assessed hydrological mass balances, theway processes are formulated in different model versions and the parameter values inthe case study applications both in the Blue Nile and the Lake Victorian countries.
4.2.1 Mass balance evaluation5
Two different SWAT-based modeling concepts are used in the modeling of the Blue Nilebasin: the original SWAT model that uses the curve number (SWAT-CN) and a modifiedversion that contains a newly developed water balance concept (SWAT-WB) that usesthe topographic index to define the generation processes of the surface runoff (Eastonet al., 2010; White et al., 2011).10
Both concepts seem to give extremely different results, not only in their spatiallydistributed outputs, for instance, when looking at the major contributing areas towardsthe surface runoff (see Fig. 2), but also in the estimation of the base flow factor (%base flow of the total discharge) (Table 3). The reason for the differences are the basichydrological concepts. The original SWAT-CN model uses the Curve Number concept15
that is built on the assumption that runoff is generated by means of infiltration excessprocesses. SWAT-WB simulates the effects of saturated excess phenomenon. Sincethe regions close to river get saturated with shallow groundwater table or more oftensaturated than the upland areas, the low regions are generating more runoff comparedto the upper regions.20
The original model gives a base flow factor between 0.5–0.65 (Setegn et al., 2008)while the modified SWAT-WB computes a base flow factor between 0.9 and 0.95 (Eas-ton et al., 2010). The base flow factors that are obtained after using base flow filterprograms on observed flow time series range between 0.49 and 0.6 and are more inline with the results of the original SWAT model (see Fig. 2).25
3776

HESSD9, 3761–3788, 2012
Critical review of theapplication of SWAT
in the upper NileBasin countries
A. van Griensven et al.
Title Page
Abstract Introduction
Conclusions References
Tables Figures
J I
J I
Back Close
Full Screen / Esc
Printer-friendly Version
Interactive Discussion
Discussion
Paper
|D
iscussionP
aper|
Discussion
Paper
|D
iscussionP
aper|
Few papers describe the hydrological mass balance of the simulated results. Mangoet al. (2011) provide the different hydrological components that are computed by SWAT.Out of the mass balance components, it could be derived that the groundwater flow(GQ Q) should be 480 mm yr−1 instead of the reported 48 mm yr−1. Taken this into ac-count, it appears that the model has unexplained losses of 110 mm yr−1 for Nyangores-5
RG while 32 mm yr−1 for the Nyangores-RFE gauge. These gaps are likely introducedby errors in rainfall and cause that in the model there is an increase of storage of thesame amounts. This is most likely happening in the shallow aquifer, since the parame-ter “gwqmn” has been reported as being incorporated into the calibration process whatmay result in simulations where the shallow aquifer volume might be much larger at10
the end of the simulation compared to the beginning of the simulation (up to 1500 mm).Mulungu and Munishi (2007) reported a very low water yield of 74 mm for the Simiyucatchment. The low water yield and the very low groundwater contributions are proba-bly obtained after simulating very large losses to the deep aquifer through the param-eter “RCHRG DEEP=0.9”, which means that 90 % of the water that is recharging to15
the groundwater is lost to the deep aquifer.
4.2.2 Parameter values
In total, values for 29 parameters have been reported, of which 19 affecting the hydro-logical processes while the remaining are related to the sediment transport processes.Curve numbers have been reported covering their full range from 34.5 to 98, with an20
average value of 61.8. We give more focus on the parameters that are reported inTable 1 as these parameters may lead to errors in the mass balance. The very highvalues of the “RCHR DP” parameter in the Tanzanian case studies (Ndomba et al.,2008; Mulungu et al., 2007), as well as in the Blue Nile basin (Betrie et al., 2011) seemto be unrealistic as losses of water to the deeper groundwater layers are not expected25
to be significant in large basins. However, Ndomba et al. (2008) attributed it to the pres-ence of a huge groundwater reservoir in the basin. Also Notter et al. (2010) obtained ahigh “RCHR DEEP” parameter value of 0.75 during the calibration of the Pangani river
3777

HESSD9, 3761–3788, 2012
Critical review of theapplication of SWAT
in the upper NileBasin countries
A. van Griensven et al.
Title Page
Abstract Introduction
Conclusions References
Tables Figures
J I
J I
Back Close
Full Screen / Esc
Printer-friendly Version
Interactive Discussion
Discussion
Paper
|D
iscussionP
aper|
Discussion
Paper
|D
iscussionP
aper|
basin. Setegn et al. (2010) reported an out of range “GW REVAP” value which is likelyto be a typing error as the value is out of the physical range.
4.3 Fit-to-purpose
Many models have been reported for different purposes. Several models have beenused to run scenarios such as climate change and land use change. Even though5
all these cases used are tributaries of Lake Victoria that have similar climate zonesand vegetation, the models seem to give different results. Here, we are focusing on themodels that are used for land use change studies, since such studies would need a verygood representation of the spatial variability with special attention to the land use/landcover related inputs and processes. There are currently only 2 papers that used SWAT10
for land use change analysis, namely on the upper Mara (Mango et al., 2011) andthe Nzoia (Githui et al., 2008). None of the studies used internal flow gauges. Thepapers did not describe neither crop input parameters, nor provided any outputs onthe computed vegetation/crop variables. One may wonder the correctness of the for-est simulations in the model that predicts only marginal effect of deforestation on the15
evapotranspiration component (Mango et al., 2011). The study in the Nzoia shows astronger difference in evapotranspiration between scenarios of a continuation of defor-estation versus where degraded forest would be replanted. Still, forest land seems tohave less evapotranspiration compared to grassland and shrubland. So far, none ofthe reviewed papers discussed details on the simulations of crops and/or evergreen20
forests.
5 Conclusions and recommendations
Data availability is a general problem within the Nile countries and the lack of data isoften mentioned as a problem. Nevertheless, most of the models seem to performquite well in representing the temporal dynamics within the catchment. On the basis25
3778
HESSD9, 3761–3788, 2012
Critical review of theapplication of SWAT
in the upper NileBasin countries
A. van Griensven et al.
Title Page
Abstract Introduction
Conclusions References
Tables Figures
J I
J I
Back Close
Full Screen / Esc
Printer-friendly Version
Interactive Discussion
Discussion
Paper
|D
iscussionP
aper|
Discussion
Paper
|D
iscussionP
aper|
of performance indicators, the SWAT models were in general produced satisfying orgood results. However, little confidence can be given to the degree that the modelsare able to represent the processes in a spatially distributed way and hence to properlyrepresent the spatial heterogeneity. The models tend to lack a method of validation fora spatially distributed representation of the processes. Very few of the studies included5
some internal calibration points or other distributed data (e.g. remote sensing data,tracer data, groundwater data etc.) to check the distributed predictions, even thoughthey might exist. None of the studies reported the used crop parameters or how theland covers in the basin are represented in the SWAT model. Neither did any of thepapers report the crop related outputs such as leaf area index, biomass or crop yields.10
A proper simulation of the land cover is important for obtaining correct evapotranspira-tion, runoff generation and erosion computations. It is therefore recommended to tryto evaluate the representativeness of the distributed processes and parameters, espe-cially when land use studies are envisaged. A validation of the crop processes could beachieved through comparison with remote sensing data. For that reason, the models15
may not always be adequate for land use analysis studies.When different studies in the same or similar catchments are compared, the differ-
ences in the results are often striking. There are different responses to climate changeand land use change in the Lake Victoria basins whereas one would expect that theyrespond similarly. SWAT-CN and SWAT-WB versions give very different results when20
the hydrological responses are plotted spatially and they also show very different baseflow factors.
In several papers, the reported hydrological mass balances encompassed severallosses that might not be justified or some papers reported parameter values that mightnot be realistic. More worrying, however, is the fact that many papers lack this type of25
information. For that reason, it is difficult to give an overall positive evaluation to mostof the reported SWAT models.
The following recommendations could lead to better model practices in the Nile basinand beyond:
3779

HESSD9, 3761–3788, 2012
Critical review of theapplication of SWAT
in the upper NileBasin countries
A. van Griensven et al.
Title Page
Abstract Introduction
Conclusions References
Tables Figures
J I
J I
Back Close
Full Screen / Esc
Printer-friendly Version
Interactive Discussion
Discussion
Paper
|D
iscussionP
aper|
Discussion
Paper
|D
iscussionP
aper|
1. Improving the spatial variability computations by the inclusion of internal calibra-tion points.
2. Crop and vegetation database for Africa should be built and shared among theAfrican SWAT user community.
3. Crop outputs should be evaluated, especially when land use/land cover studies5
are aimed for. The information obtained from remote sensing should be used inthis context.
4. The hydrological water balance, as well as parameter values should be checkedand compared with knowledge from the field and with field observations.
5. Special attention should be given to the computed hydrological losses in the10
catchment. They should not be used to make the model fit and to account forincorrect input variables.
6. More attention should be given to the dominating hydrological processes and theirrepresentativeness in the SWAT model. A catchment might not have infiltrationexcess or saturation excess exclusively, but these may happen at the same place15
at different moments in time, or, at the same time both processes might happeningdepending on the position of a place within the landscape. It is also important tobetter represent spatial dynamics of the subsurface storage (often depending onthe position in the hill slope) and the routing of the sub-surface flow from onelandscape element to the other or from one sub-basin to the other.20
7. An overall recommendation is that the journal papers should be more completein reporting model performances, computed mass balances and the calibratedparameter values in order to allow for a better evaluation as well to allow for areproduction of the studies by others.
3780
HESSD9, 3761–3788, 2012
Critical review of theapplication of SWAT
in the upper NileBasin countries
A. van Griensven et al.
Title Page
Abstract Introduction
Conclusions References
Tables Figures
J I
J I
Back Close
Full Screen / Esc
Printer-friendly Version
Interactive Discussion
Discussion
Paper
|D
iscussionP
aper|
Discussion
Paper
|D
iscussionP
aper|
Acknowledgements. We are very thankful to the UPARF ACCION project support, the UN-ESCO/FRIEND Nile project and the EU FP7 AFROMAISON project that financially sup-ported the review of SWAT modeling in the Nile basin. Also thanks to Stefan Uhlenbrook,Pieter van der Zaag and Getnet Dubale Betrie for their comments and feedbacks on themanuscript.5
References
Betrie, G. D., Mohamed, Y. A., van Griensven, A., and Srinivasan, R.: Sediment managementmodelling in the Blue Nile Basin using SWAT model, Hydrol. Earth Syst. Sci., 15, 807–818,doi:10.5194/hess-15-807-2011, 2011.
Dargahi, B. and Setegn, S. G.: Combined 3D hydrodynamic and watershed modeling of Lake10
Tana, Ethiopia, J. Hydrol., 398, 44–64, 2011.Easton, Z. M., Fuka, D. R., White, E. D., Collick, A. S., Biruk Ashagre, B., McCartney, M.,
Awulachew, S. B., Ahmed, A. A., and Steenhuis, T. S.: A multi basin SWAT model analysis ofrunoff and sedimentation in the Blue Nile, Ethiopia, Hydrol. Earth Syst. Sci., 14, 1827–1841,doi:10.5194/hess-14-1827-2010, 2010.15
Gassman, P. W., Reyes, M. R., Green, C. H., and Arnold, J. G.: The Soil and Water AssessmentTool: historical development, applications, and future research directions, T. ASABE, 50,1211–1250, 2007.
Gassman, P. W., Arnold, J. G., Srinivasan, R., and Reyes, M.: The worldwide use of the SWATModel: Technological drivers, networking impacts, and simulation trends, in: Proceedings20
of the Watershed Technology Conference, 21–24 February, American Society of Agriculturaland Biological Engineers, Earth University, Costa Rica, St. Jospeh, MI, ASABE, 2010.
Gessese, A. and Yonas, M.: Prediction of Sediment Inflow to Legedadi Reservoir Using SWATWatershed and CCHEID Sediment Transport Models, Nile Basin Water Engr. Sci. Magazine,1, 65–74, 2008.25
Githui, F., Gitan, W., Mutua, F., and Bauwens, W.: Climate change impact on SWAT simulatedstreamflow in western Kenya, Int. J. Climatol., 29, 1823–1834, doi:10.1002/joc.1828, 2009a.
Githui, F., Mutua, F., and Bauwens, W.: Estimating the impacts of land-cover change on runoffusing the soil and water assessment tool (SWAT): Case study of Nzoia catchment, Kenya,Hydrolog. Sci. J., 54, 899–908, 2009b.30
3781
HESSD9, 3761–3788, 2012
Critical review of theapplication of SWAT
in the upper NileBasin countries
A. van Griensven et al.
Title Page
Abstract Introduction
Conclusions References
Tables Figures
J I
J I
Back Close
Full Screen / Esc
Printer-friendly Version
Interactive Discussion
Discussion
Paper
|D
iscussionP
aper|
Discussion
Paper
|D
iscussionP
aper|
Jayakrishnan, R., Srinivasan, R., Santhi, C., and Arnold, J. G.: Advances in the application ofthe SWAT model for water resources management, Hydrol. Process., 19, 749–762, 2005.
Kingston, D. G. and Taylor, R. G.: Sources of uncertainty in climate change impacts on riverdischarge and groundwater in a headwater catchment of the Upper Nile Basin, Uganda,Hydrol. Earth Syst. Sci., 14, 1297–1308, doi:10.5194/hess-14-1297-2010, 2010.5
Mekonnen, M. A., Worman, A., Dargahi, B., and Gebeyehu, A.: Hydrological mod-elling of Ethiopian catchments using limited data, Hydrol. Process., 23, 3401–3408,doi:10.1002/hyp.7470, 2009.
Moriasi, D. N., Arnold, J. G., Van Liew, M. W., Bingner, R. L., Harmel, R. D., and Veith, T. L.:Model evaluation guidelines for systematic quantification of accuracy in watershed simula-10
tions, T. ASABE, 50, 885–900, 2007.Mulungu, D. M. M. and Munishi, S. E.: Simiyu river catchment parameterization using SWAT
model, J. Phys. Chem. Earth A/B/C, 32, 1032–1039, 2007.Muvundja, F. A., Pasche, N., Bugenyi, F. W. B., Isumbisho, M., Muller, B., Namugize, J., Rinta,
P., Schmid, M., Stierli, R., and Wuest, A.: Balancing nutrient inputs to Lake Kivu, J. Great15
Lake. Res., 35, 406–418, 2009.Ndomba, P. M. and Birhanu, B. Z.: Problems and Prospects of SWAT Model Applications in
NILOTIC Catchments: A Review, Nile Basin Water Engr. Sci. Magazine, 1, 41–52, 2008.Ndomba, P. M. and van Griensven, A.: Suitability of SWAT model in sediment yields modeling
in the Eastern Africa, in: Chapter 13: Advances in Data, Methods, Models and Their Applica-20
tions in Geosciences, edited by: Chen, D., ISBN 978-953-307-737-6, INTECH open accesspublisher, available at: www.intechweb.org, 2011.
Ndomba, P., Mtalo, F., and Killingtveit, A.: SWAT model application in a datascarce tropical complex catchment in Tanzania, Phys. Chem. Earth, 33, 1–19,doi:10.1016/j.pce.2008.06.013, 2008.25
Setegn, S. G., Srinivasan, R., and Dargahi, B.: Hydrological Modelling in the Lake Tana Basin,Ethiopia Using SWAT Model, Open Hydrol. J., 2, 49–62, 2009a.
Setegn, S. G., Srinivasan, R., Dargahi, B., and Melesse, A. M.: Spatial delineation of soilerosion vulnerability in the Lake Tana Basin, Ethiopia, Hydrol. Process., 23, 3738–3750,doi:10.1002/hyp.7476, 2009b.30
Setegn, S. G., Darfahi, B., Srinivasan, R., and Melesse, A. M.: Modeling of sediment yield fromAnjeni-gauged watershed, Ethiopia using SWAT model, J. Am. Water Resour. Assoc., 46,514–526, doi:10.1111/j.1752-1688.2010.00431.x, 2010.
3782

HESSD9, 3761–3788, 2012
Critical review of theapplication of SWAT
in the upper NileBasin countries
A. van Griensven et al.
Title Page
Abstract Introduction
Conclusions References
Tables Figures
J I
J I
Back Close
Full Screen / Esc
Printer-friendly Version
Interactive Discussion
Discussion
Paper
|D
iscussionP
aper|
Discussion
Paper
|D
iscussionP
aper|
Swallow, B. M., Sang, J. K., Nyabenge, M., Bundotich, D. K., Duraiappah, A. K., and Yatich, T.B.: Tradeoffs, synergies and traps among ecosystem services in the Lake Victoria basin ofEast Africa, Environ. Sci. Poll., 12, 504–519, doi:10.1016/j.envsci.2008.11.003, 2009.
Tibebe, D. and Bewket, W., Surface runoff and soil erosion estimation using the SWAT model inthe Keleta watershed, Ethiopia, Land Degrad. Develop., 22, online first: doi:10.1002/ldr.1034,5
2010.White, E. D., Easton, Z. M., Fuka, D. R., Collick, A. S., Adgo, E., McCartney, M., Awulachew,
S. B., Selassie, Y. G., and Steenhuis, T. S.: Development and application of a physi-cally based landscape water balance in the SWAT model, Hydrol. Process., 25, 915–925,doi:10.1002/hyp.7876, 2010.10
3783
HESSD9, 3761–3788, 2012
Critical review of theapplication of SWAT
in the upper NileBasin countries
A. van Griensven et al.
Title Page
Abstract Introduction
Conclusions References
Tables Figures
J I
J I
Back Close
Full Screen / Esc
Printer-friendly Version
Interactive Discussion
Discussion
Paper
|D
iscussionP
aper|
Discussion
Paper
|D
iscussionP
aper|
Table 1. Overview of papers describing SWAT applications in the tropical highlands of the Nilecountries.
Hydrology/ Calibration Land Land Climate SWAT Waterwater uncertainty Erosion manage- use change development Data quality
balance ment change
Jayakrishnan (2005) X XMulungu and Munishi (2007) X XNdomba and Birhanu (2008) X XNdomba et al. (2008) X XGessese and Yonas (2008) XSetegn et al. (2008) X XSetegn et al. (2009) XMekonnen et al. (2009) X XGithui et al. (2009a) XGithui et al. (2009b) XSwallow et al. (2009) X XMuvundja et al. (2009) X XSetegn et al. (2010) XKingston and Taylor (2010) X XTibebe and Bewket (2010) X XEaston et al. (2010) X X XWhite et al. (2011) X XDargahi and Setegn (2011) XBetrie et al. (2011) X XBitew and Gebremichael (2011) X XMango et al. (2011) X X X XNotter et al. (2011) X X
3784
HESSD9, 3761–3788, 2012
Critical review of theapplication of SWAT
in the upper NileBasin countries
A. van Griensven et al.
Title Page
Abstract Introduction
Conclusions References
Tables Figures
J I
J I
Back Close
Full Screen / Esc
Printer-friendly Version
Interactive Discussion
Discussion
Paper
|D
iscussionP
aper|
Discussion
Paper
|D
iscussionP
aper|
Table 2. Parameters that are controlling losses (in addition to evapotransiration).
Reported Mean Number ofParameters Description Potential concerns Evaluation values value reported
values
CH K Effective hydraulic The parameter should TRANSMISSION LOSSES 0.7 to 150 17.7 16conductivity [mm h−1] only get a value higher (printed in output.std or
than 0 for channels output.rch) should not be too high,where the groundwater and should be 0 in rivers with allis below river bed. year round baseflow contributions.
GWQMN Threshold depth of SWAT will build up SA ST (mm)= storage in the 0 to 1500 307.8 5water in the shallow groundwater over the shallow aquifer printed inaquifer required for years in case the output.hru.return flow to occur parameter is high, and[mm]. the initial value is zero.
RCHRG DP Deep aquifer These losses should be DEEP AQ RECHARGE output in 0 to 1.1 0.6 5percolation fraction small in most of the output.std.
catchment, definitelyat a larger scale.
GW REVAP Groundwater revap These losses should REVAP (SHAL AQ=> 0.0 20.0 2.6coefficient (0–1) not be too high, SOIL/PLANTS) output in the
certainly not in humid output.std file.and/or cold regions andfor deep aquifers.
3785

HESSD9, 3761–3788, 2012
Critical review of theapplication of SWAT
in the upper NileBasin countries
A. van Griensven et al.
Title Page
Abstract Introduction
Conclusions References
Tables Figures
J I
J I
Back Close
Full Screen / Esc
Printer-friendly Version
Interactive Discussion
Discussion
Paper
|D
iscussionP
aper|
Discussion
Paper
|D
iscussionP
aper|
Table 3. Overview of evaluations for parameters and performance index (NSE). Black refersto “missing data”, grey to “incomplete data”, green to “OK”, yellow “slightly worrying”, red “wor-rying”. The underscored papers are using SWAT-WB version. “D” refers to daily performance,“M” to Monthly performance, “r2D” to the daily correlation factor.
Ethiopian cases River Area (km2) Performance Baseflow Evaluation offor flow factor parameter values
Easton et al. (2010) Anjeni 1.134 0.84 (D) 0.91 incompleteSetegn et al. (2010) Anjeni 2.134 0.89 (M)Easton et al. (2010) Gumera 1286 0.81 (D) 0.93 incompleteSetegn et al. (2008) Gumera 1286 0.61 (D) 0.64White et al. (2011) Gumera 1296 0.77 (D)White et al. (2011) Gumera 1296 0.64 (D)Mekonnen et al. (2009) Gumera 1286 0.84 (r2D) ReasonableEaston et al. (2010) Ribb 1295 0.77 (D) 0.92 incomplete reportingSetegn et al. (2008) Ribb 1295 0.55 (D)Easton et al. (2010) North Marawi 1658 0.75 (D) 0.94 incomplete reportingEaston et al. (2010) Jemma 5429 0.92 (M) 0.90 incomplete reportingEaston et al. (2010) Angar 4674 0.79 (M) 0.91 incomplete reportingEaston et al. (2010) Blue Nile@Kessie 65 385 0.53 (M) 0.93 incomplete reportingEaston et al. (2010) Abay Ethiopian@El Diem 174 000 0.87 (D) 0.95 incomplete reportingBetrie et al. (2011) Abay Ethiopian@El Diem 184 560 0.68(D), 0.82(M) high RCHR DPEaston et al. (2010) Megesh 0.60 incomplete reportingSetegn et al. (2009) Lake Tana 15 096 0.50 rather high gwqmnSetegn et al. (2008) Gilgel Abay 0.73 (D) 0.54 high GW REVAP valueMekonnen et al. (2009) Gilgel Abay 0.84 (r2D) high CNBitew and Gebremichael (2011) Gilgel Abay 299 High CH K and high gwqmnBitew and Gebremichael (2011) Koga 1656Tibede et al. (2010) Keleta 1060 0.789 (M)Lake Victoria regionGithui et al. (2009) Nzoia 12 709 0.71 (D) 0.76 (M) 0.77Mango et al. (2011) Mara-Nyaragores RG 700 −0.53 (M) 0.82 incomplete reportingMango et al. (2011) Mara-Nyaragores RFE 700 0.43 (M) 0.90 incomplete reportingMulungu and Munishi (2007) Simiyu-Ndagalu 5320 0.1373 (M) 0.15 worryingJayakrishnan et al. (2004) Sondu 3050 −0.72 (D)Kingston and Taylor (2010) Mitano 2098 0.06 (M), −0.09 (D) 0.99Swallow et al. (2009) Nyando 4000
Yala 3000Ndomba et al. (2008) Pangani 7280 0.54 (D), −0.65 (M) high RCHR DP, high gwq mn, high ch kNotter et al. (2010) Pangani 43 000 high RCHR DP
3786

HESSD9, 3761–3788, 2012
Critical review of theapplication of SWAT
in the upper NileBasin countries
A. van Griensven et al.
Title Page
Abstract Introduction
Conclusions References
Tables Figures
J I
J I
Back Close
Full Screen / Esc
Printer-friendly Version
Interactive Discussion
Discussion
Paper
|D
iscussionP
aper|
Discussion
Paper
|D
iscussionP
aper|
Figure 1. Land cover scenarios (Githui et al 2009)
1
2
3
4
Fig. 1. Land cover scenarios (Githui et al., 2009).
3787

HESSD9, 3761–3788, 2012
Critical review of theapplication of SWAT
in the upper NileBasin countries
A. van Griensven et al.
Title Page
Abstract Introduction
Conclusions References
Tables Figures
J I
J I
Back Close
Full Screen / Esc
Printer-friendly Version
Interactive Discussion
Discussion
Paper
|D
iscussionP
aper|
Discussion
Paper
|D
iscussionP
aper|
Figure 2. Spatial distribution of surface runoff in Gumera modeled with (A) SWAT-CN and (B)
SWAT-WB (White et al. 2010)
1
2
3
4
5
6
Fig. 2. Spatial distribution of surface runoff in Gumera modeled with (a) SWAT-CN and(b) SWAT-WB (White et al., 2010).
3788