application the swat model for - swat | soil and water assessment tool
TRANSCRIPT
Hyung Kyung Joh / Researcher / Weather Information Service Engine Division
Sun Jung / Researcher / Weather Information Service Engine Division
Jong-Sook Park / Senior Scientist / Weather Information Service Engine Division
Application the SWAT model for
Extreme Urban Flash Floods in Seoul
18 July 2013 International SWAT Conference, Toulouse, France
URL : wise2020.org

Contents
• Background & Aim
• Modeling Strategy
• Study Area
• Model Evaluation (Daily Time Step)
• Model Evaluation (Hourly Time Step)
• Summary & Conclusion
• Forward
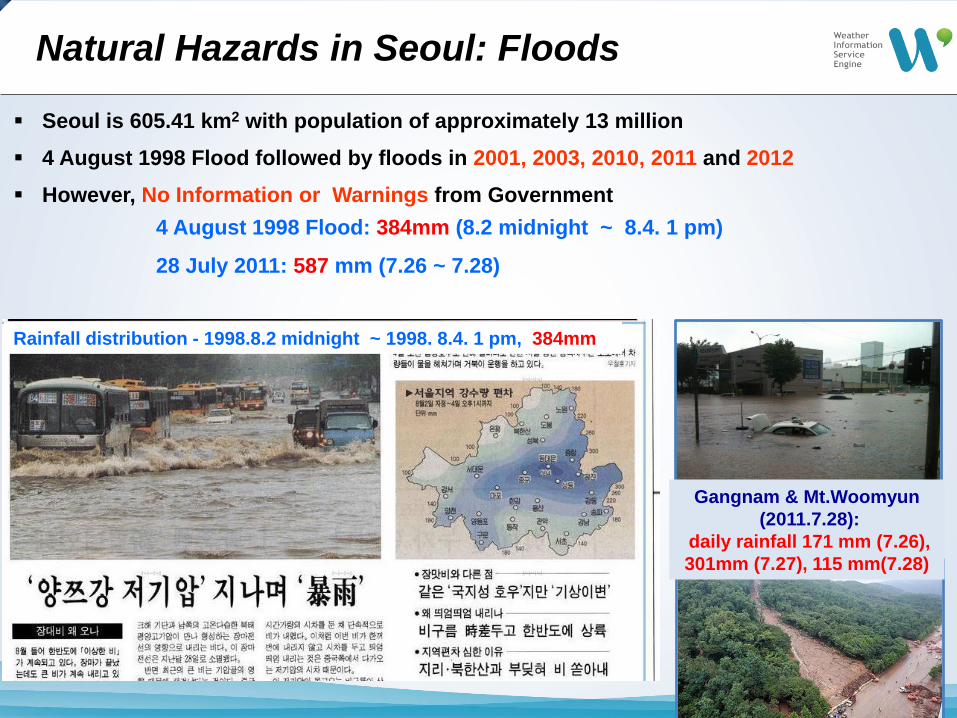
Natural Hazards in Seoul: Floods
Seoul is 605.41 km2 with population of approximately 13 million
4 August 1998 Flood followed by floods in 2001, 2003, 2010, 2011 and 2012
However, No Information or Warnings from Government
Rainfall distribution - 1998.8.2 midnight ~ 1998. 8.4. 1 pm, 384mm
Gangnam & Mt.Woomyun
(2011.7.28):
daily rainfall 171 mm (7.26),
301mm (7.27), 115 mm(7.28)
4 August 1998 Flood: 384mm (8.2 midnight ~ 8.4. 1 pm)
28 July 2011: 587 mm (7.26 ~ 7.28)
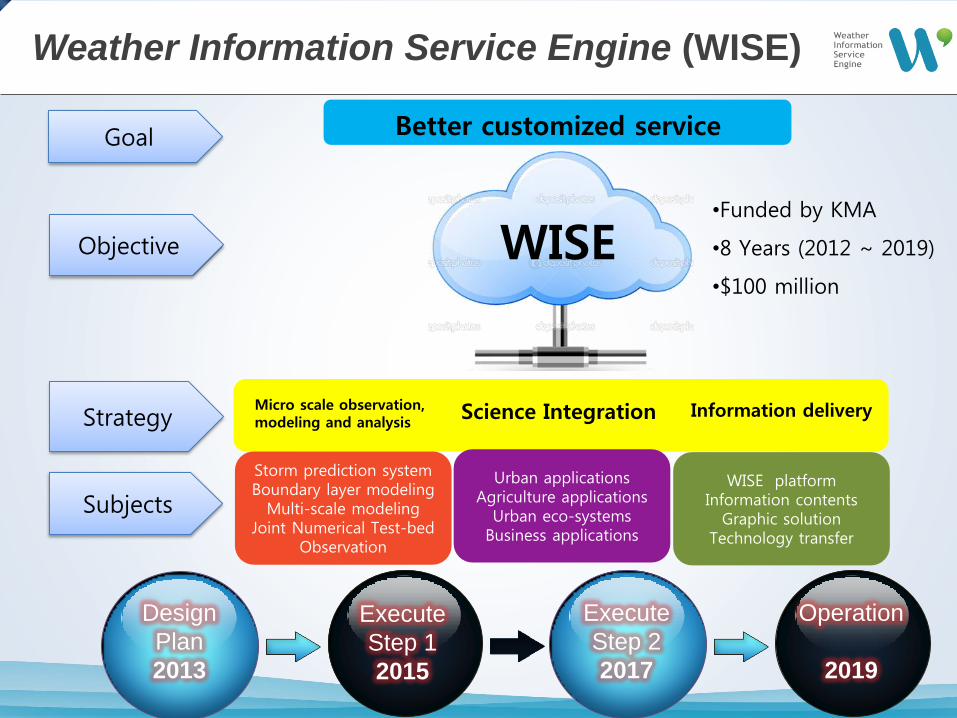
Weather Information Service Engine (WISE)
Better customized service Goal
Objective
Strategy
Subjects
WISE
Micro scale observation, modeling and analysis
Science Integration Information delivery
Storm prediction system Boundary layer modeling
Multi-scale modeling Joint Numerical Test-bed
Observation
Urban applications Agriculture applications
Urban eco-systems Business applications
WISE platform Information contents
Graphic solution Technology transfer
Design
Plan
2013
Execute
Step 1
2015
Execute
Step 2
2017
Operation
2019
•Funded by KMA
•8 Years (2012 ~ 2019)
•$100 million
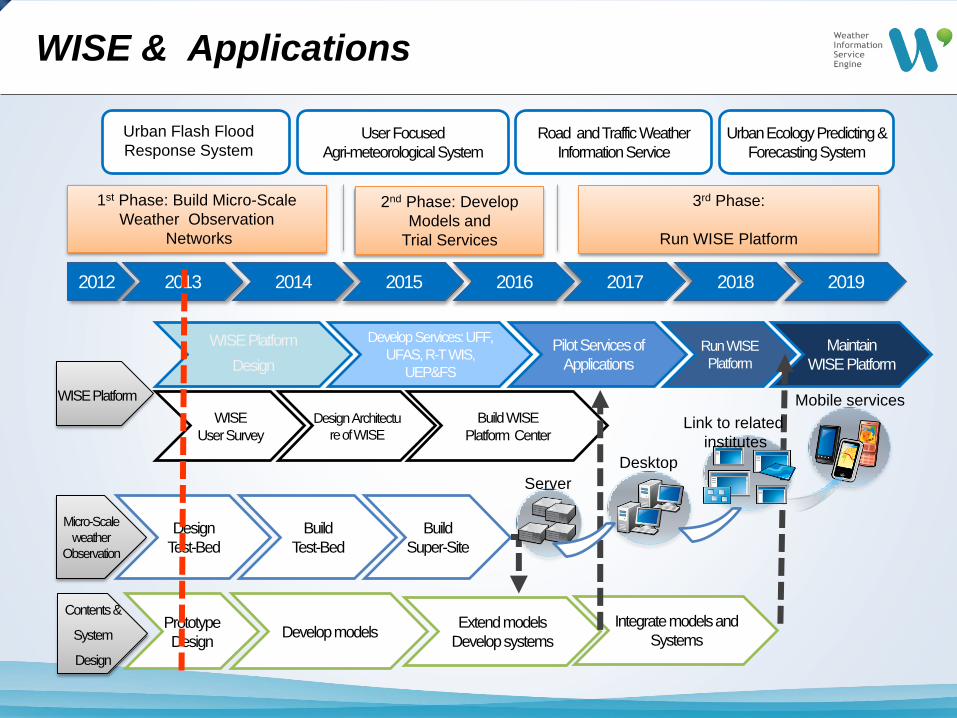
2012 2013 2017 2018 2019 2014 2016 2015
Contents &
System
Design
Micro-Scale
weather
Observation
Design
Test-Bed
Prototype
Design
Build
Test-Bed
Develop models
WISE Platform
Develop Services: UFF,
UFAS, R-T WIS,
UEP&FS
Pilot Services of
Applications
WISE Platform
Design
Maintain
WISE Platform
WISE
User Survey
Design Architectu
re of WISE
Extend models
Develop systems
Build WISE
Platform Center
Build
Super-Site
Integrate models and
Systems
Run WISE
Platform
Mobile services
Link to related
institutes
Desktop
Server
Road and Traffic Weather
Information Service
User Focused
Agri-meteorological System
Urban Ecology Predicting &
Forecasting System
Urban Flash Flood
Response System
1st Phase: Build Micro-Scale
Weather Observation
Networks
2nd Phase: Develop
Models and
Trial Services
3rd Phase:
Run WISE Platform
WISE & Applications
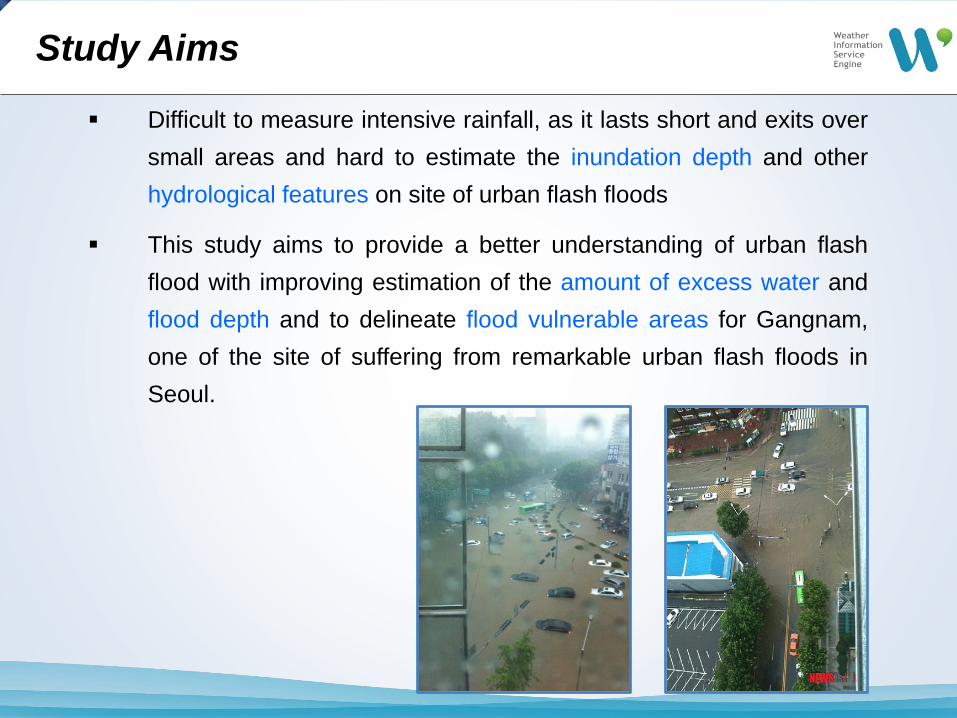
Difficult to measure intensive rainfall, as it lasts short and exits over
small areas and hard to estimate the inundation depth and other
hydrological features on site of urban flash floods
This study aims to provide a better understanding of urban flash
flood with improving estimation of the amount of excess water and
flood depth and to delineate flood vulnerable areas for Gangnam,
one of the site of suffering from remarkable urban flash floods in
Seoul.
Study Aims
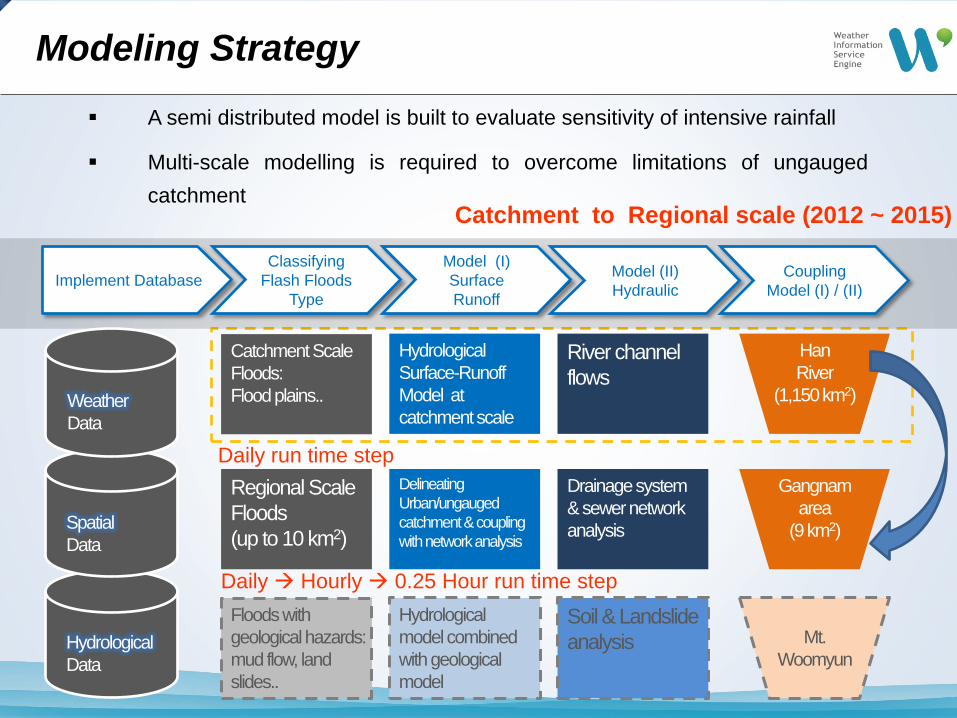
A semi distributed model is built to evaluate sensitivity of intensive rainfall
Multi-scale modelling is required to overcome limitations of ungauged
catchment
Implement Database
Classifying
Flash Floods
Type
Model (I)
Surface
Runoff
Model (II)
Hydraulic
Coupling
Model (I) / (II)
Catchment Scale
Floods:
Flood plains..
Hydrological
Surface-Runoff
Model at
catchment scale
River channel
flows
Regional Scale
Floods
(up to 10 km2)
Floods with
geological hazards:
mud flow, land
slides..
Delineating
Urban/ungauged
catchment & coupling
with network analysis
Hydrological
model combined
with geological
model
Drainage system
& sewer network
analysis
Soil & Landslide
analysis Hydrological
Data
Han
River
(1,150 km2)
Gangnam
area
(9 km2)
Mt.
Woomyun
Spatial
Data
Weather
Data
Daily run time step
Catchment to Regional scale (2012 ~ 2015)
Daily Hourly 0.25 Hour run time step
Modeling Strategy
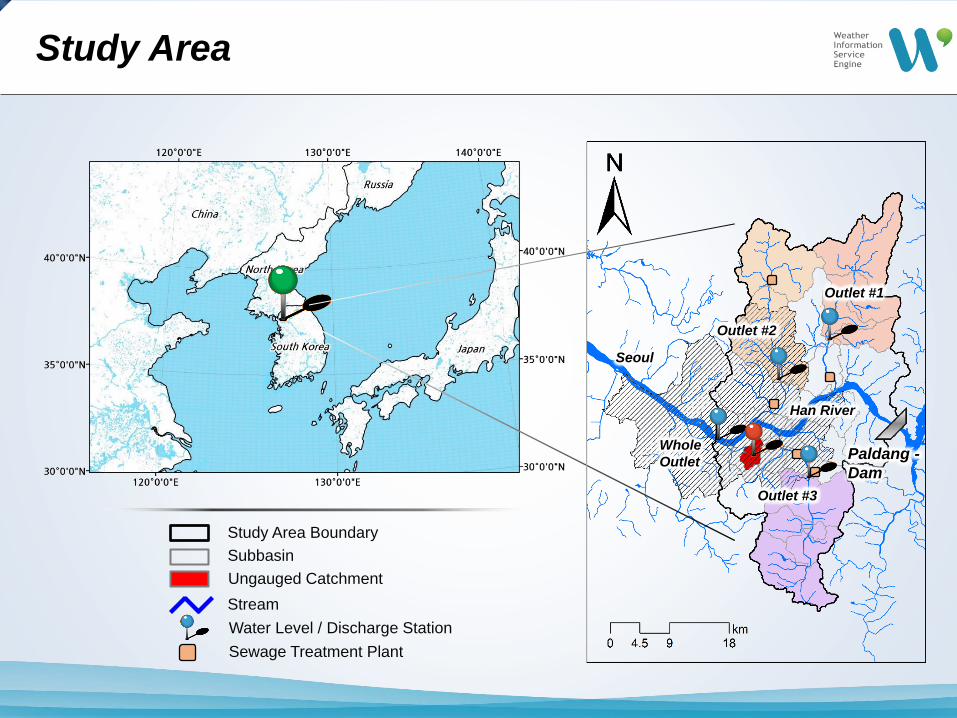
Study Area
Study Area Boundary
Subbasin
Stream
Water Level / Discharge Station
Ungauged Catchment
Sewage Treatment Plant
Paldang -
Dam
Outlet #1
Outlet #2
Outlet #3
Whole
Outlet
Han River
Seoul
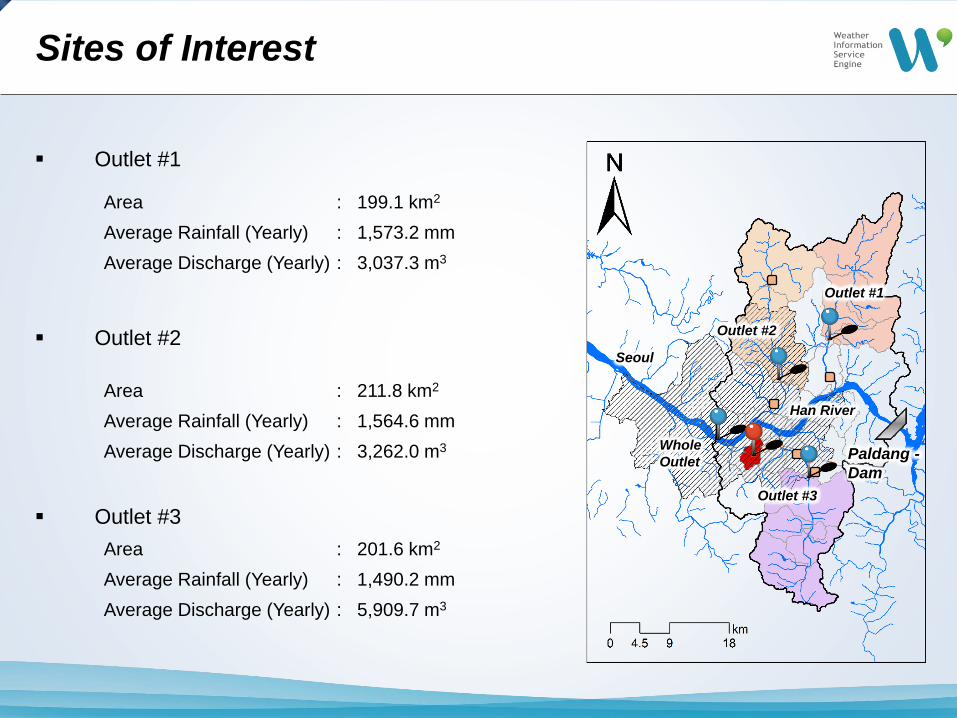
Sites of Interest
Outlet #1
Outlet #2
Outlet #3
Area
Average Rainfall (Yearly)
Average Discharge (Yearly)
: 199.1 km2
: 1,573.2 mm
: 3,037.3 m3
Area
Average Rainfall (Yearly)
Average Discharge (Yearly)
: 211.8 km2
: 1,564.6 mm
: 3,262.0 m3
Area
Average Rainfall (Yearly)
Average Discharge (Yearly)
: 201.6 km2
: 1,490.2 mm
: 5,909.7 m3
Paldang -
Dam
Outlet #1
Outlet #2
Outlet #3
Whole
Outlet
Han River
Seoul
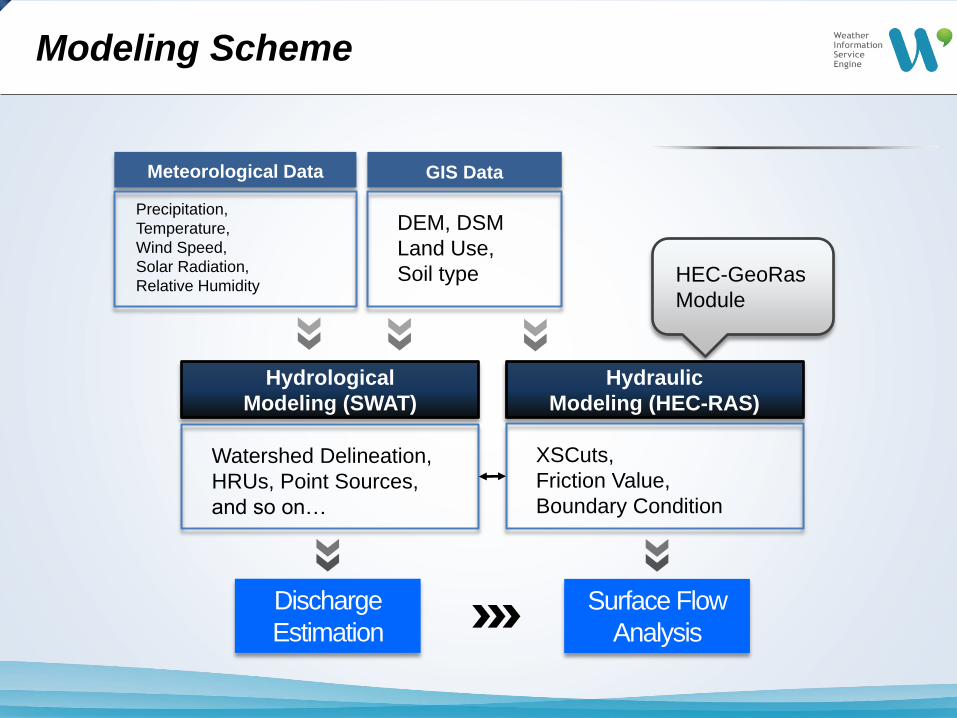
Modeling Scheme
Meteorological Data GIS Data
Precipitation,
Temperature,
Wind Speed,
Solar Radiation,
Relative Humidity
DEM, DSM
Land Use,
Soil type
Hydrological
Modeling (SWAT)
Hydraulic
Modeling (HEC-RAS)
XSCuts,
Friction Value,
Boundary Condition
Watershed Delineation,
HRUs, Point Sources,
and so on…
Discharge
Estimation
Surface Flow
Analysis
HEC-GeoRas
Module
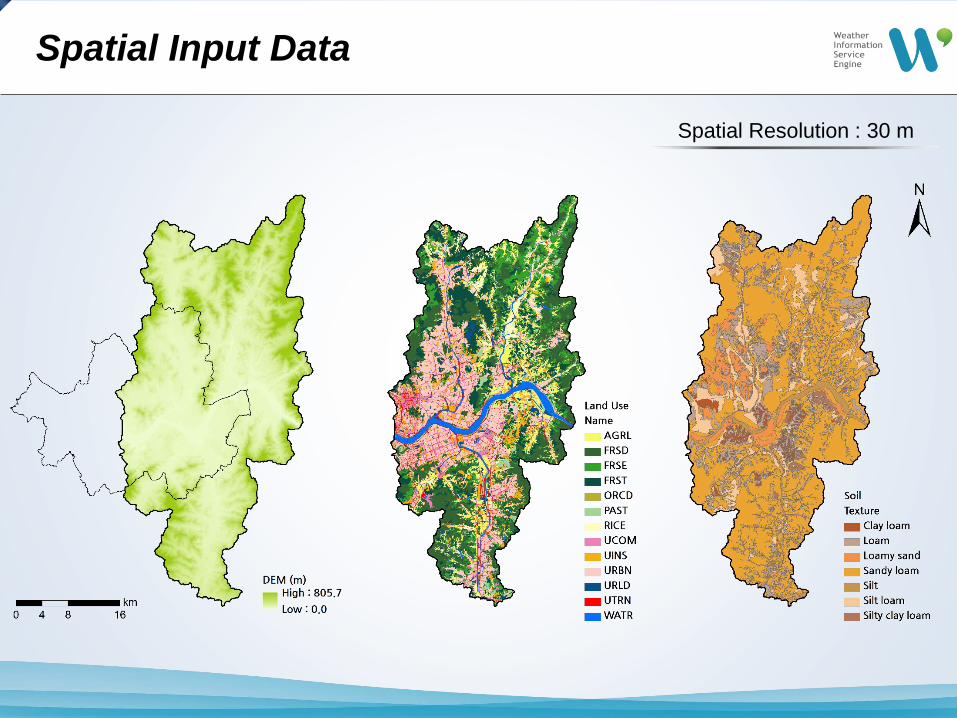
Spatial Input Data
Spatial Resolution : 30 m
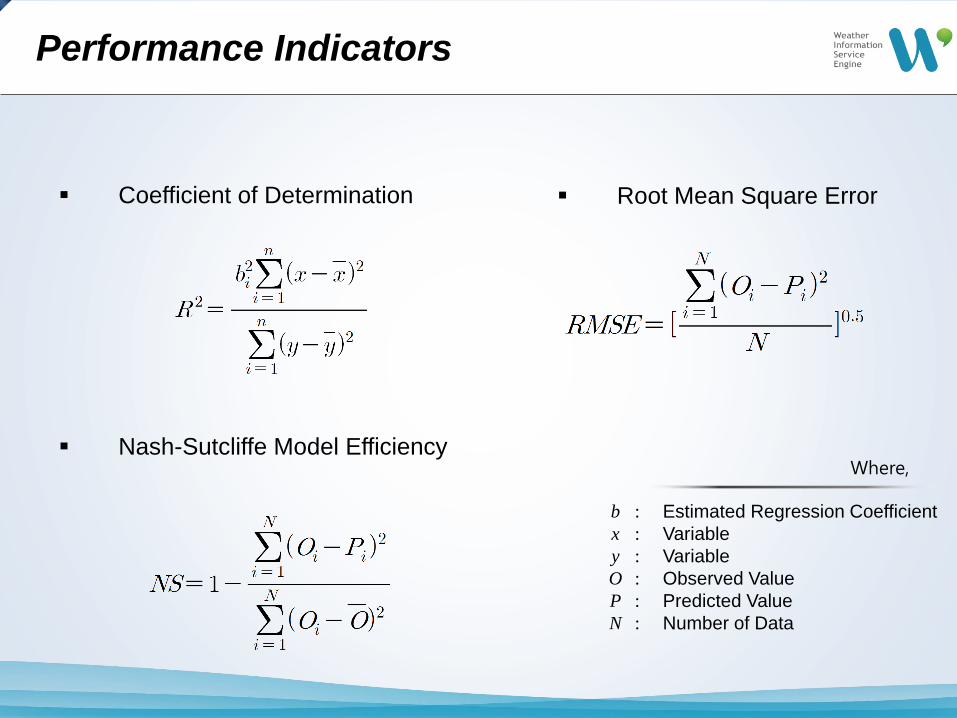
Performance Indicators
Coefficient of Determination
Nash-Sutcliffe Model Efficiency
Root Mean Square Error
Where,
b
x
y
O
P
N
:
:
:
:
:
:
Estimated Regression Coefficient
Variable
Variable
Observed Value
Predicted Value
Number of Data
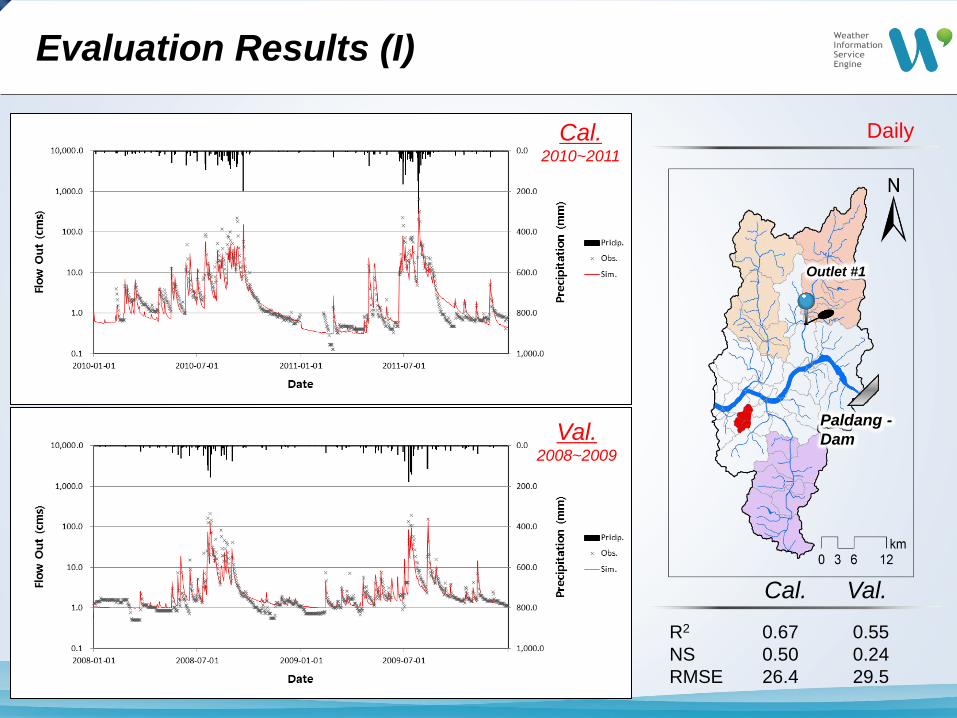
Daily
Evaluation Results (I)
R2
NS
RMSE
0.67
0.50
26.4
0.55
0.24
29.5
Cal. Val.
Val. 2008~2009
Outlet #1
Cal. 2010~2011
Paldang -
Dam
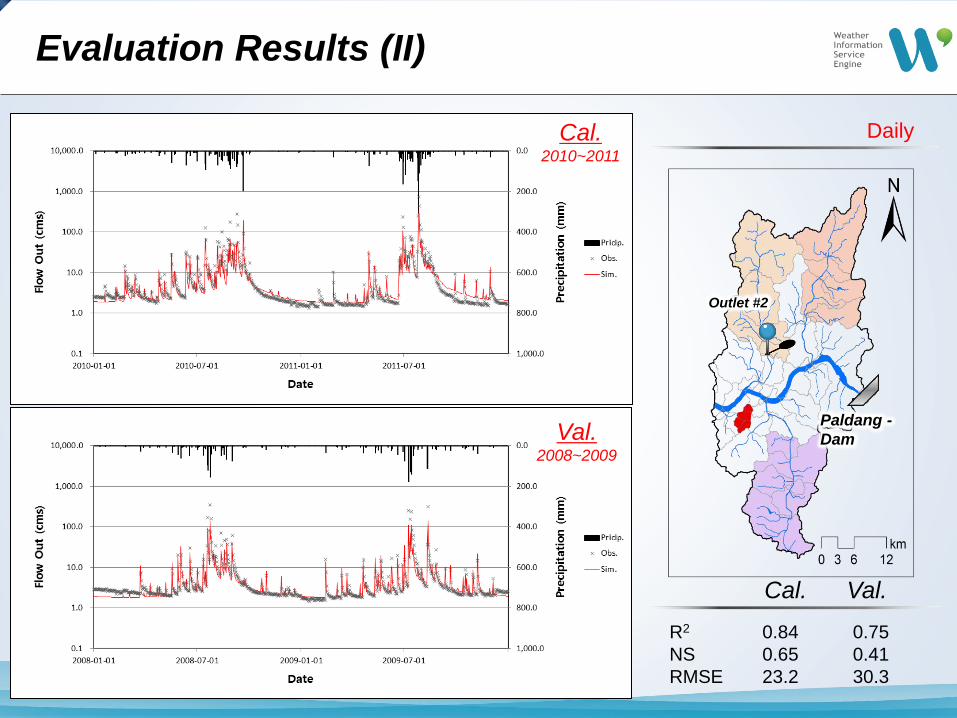
Daily
Evaluation Results (II)
R2
NS
RMSE
Cal. Val.
0.84
0.65
23.2
0.75
0.41
30.3
Cal. 2010~2011
Val. 2008~2009
Outlet #2
Paldang -
Dam
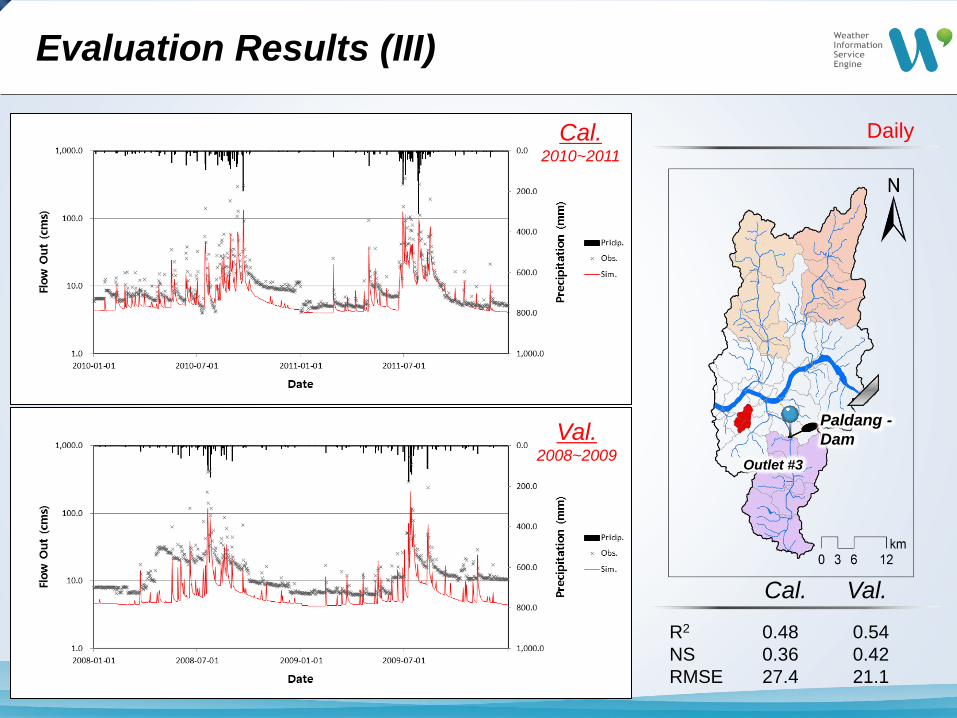
Daily
Evaluation Results (III)
R2
NS
RMSE
0.48
0.36
27.4
0.54
0.42
21.1
Cal. Val.
Cal. 2010~2011
Val. 2008~2009
Outlet #3
Paldang -
Dam
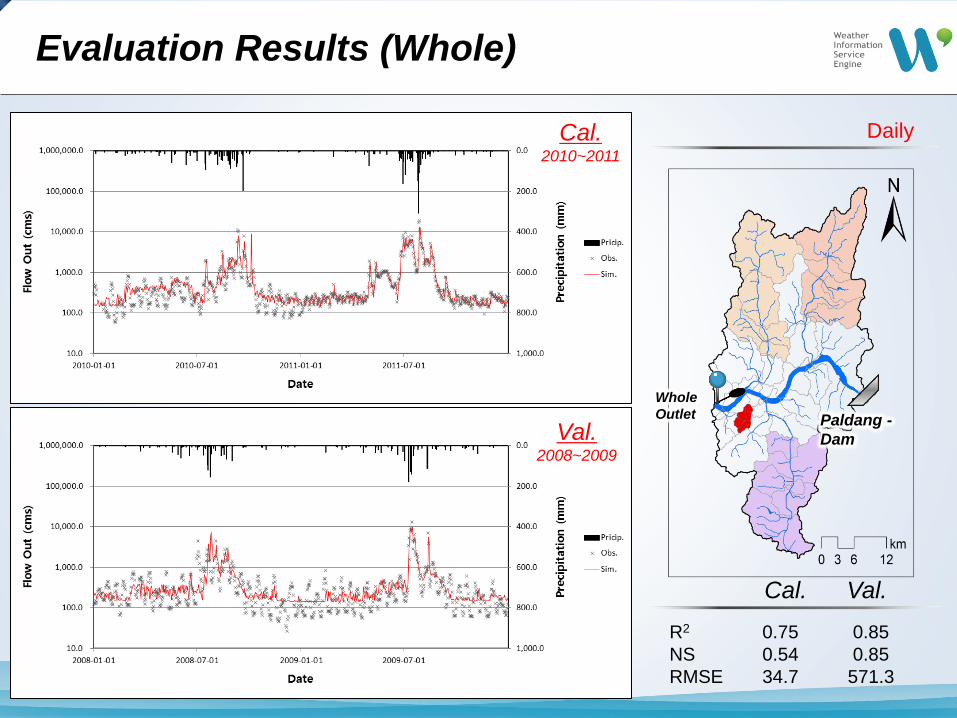
Daily
Evaluation Results (Whole)
R2
NS
RMSE
0.75
0.54
34.7
0.85
0.85
571.3
Cal. Val.
Cal. 2010~2011
Val. 2008~2009
Whole
Outlet Paldang -
Dam
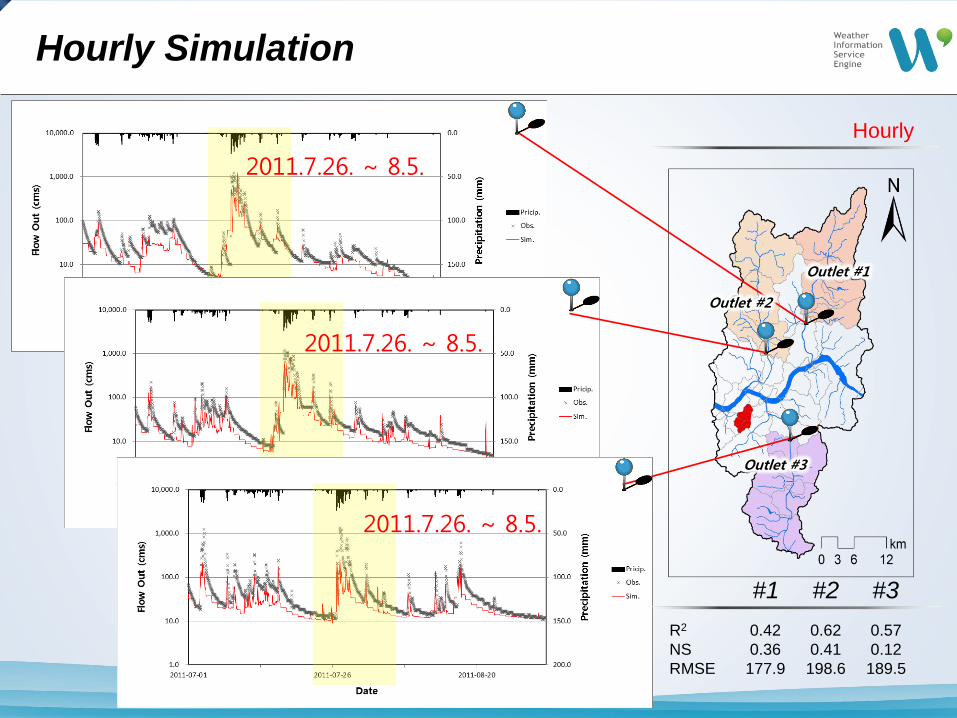
Hourly
Hourly Simulation
Outlet #3
Outlet #2
Outlet #1
R2
NS
RMSE
0.42
0.36
177.9
0.62
0.41
198.6
#1 #2 #3
0.57
0.12
189.5
2011.7.26. ~ 8.5.
2011.7.26. ~ 8.5.
2011.7.26. ~ 8.5.
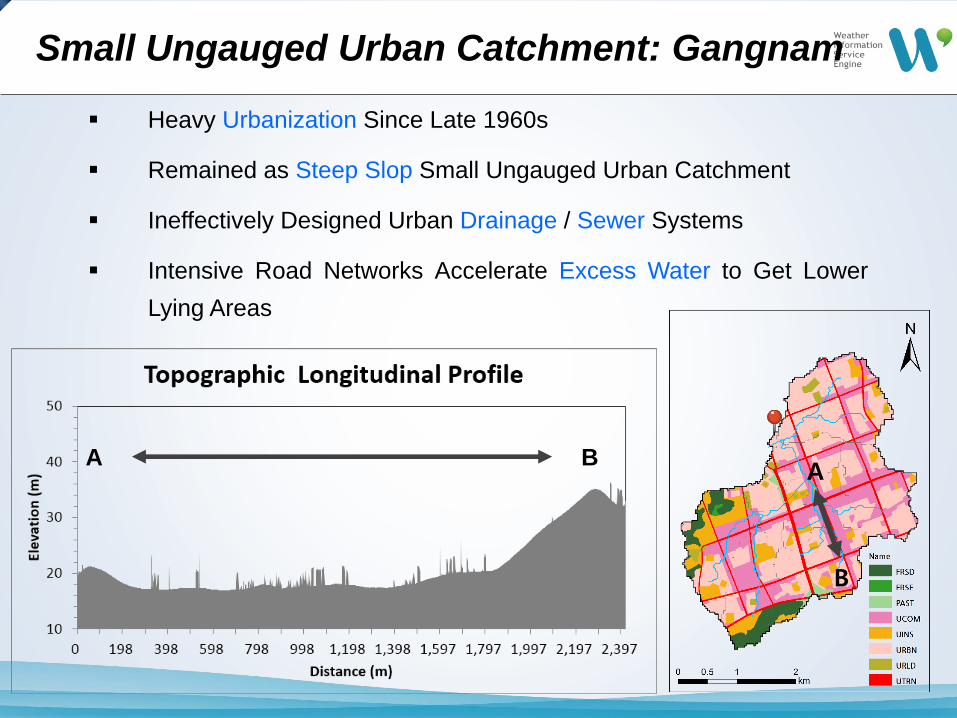
Small Ungauged Urban Catchment: Gangnam
A
B
Heavy Urbanization Since Late 1960s
Remained as Steep Slop Small Ungauged Urban Catchment
Ineffectively Designed Urban Drainage / Sewer Systems
Intensive Road Networks Accelerate Excess Water to Get Lower
Lying Areas
A B
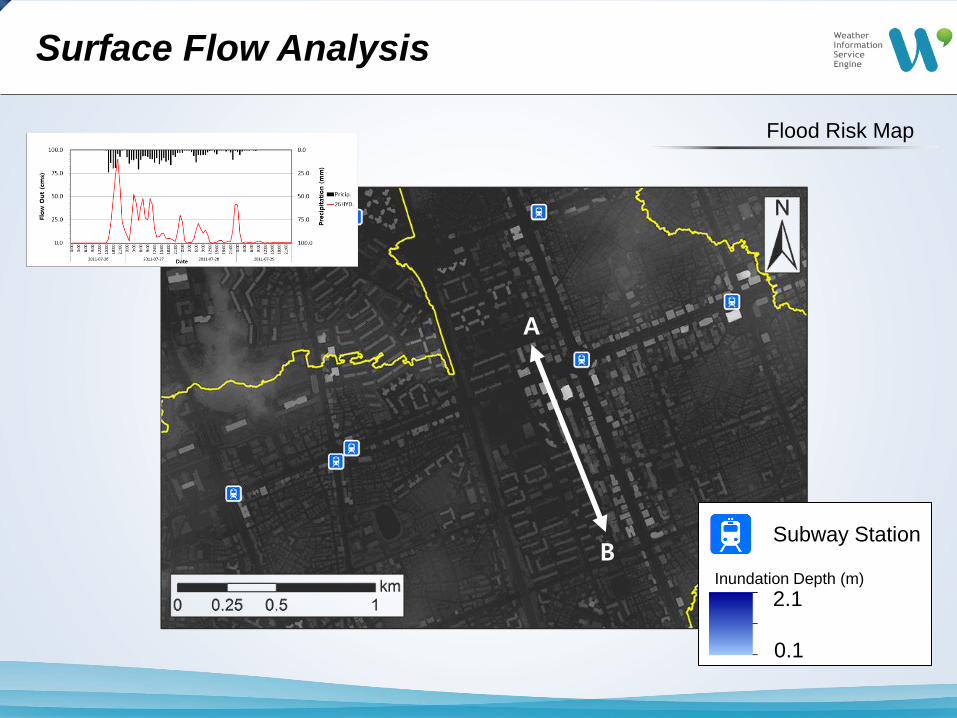
Surface Flow Analysis
2.1
0.1
Subway Station
Inundation Depth (m)
Flood Risk Map
A
B

This preliminary study is an on-going work as a part of the WISE
(Weather Information Service Engine) project and purposes to
forecast and prevent weather disaster, especially is focused on
urban flash flood.
The practice target of urban flash flood was occurred on July 26th
2011.
This urban flash flood and flooding inundation at rainy season were
simulated with coupling hydrologic (SWAT) and hydraulic (HEC-
RAS) models.
Undoubtedly, the simulated flooding inundation results were over /
under estimated because of the lack of sewer network system
analysis.
Summary & Conclusions
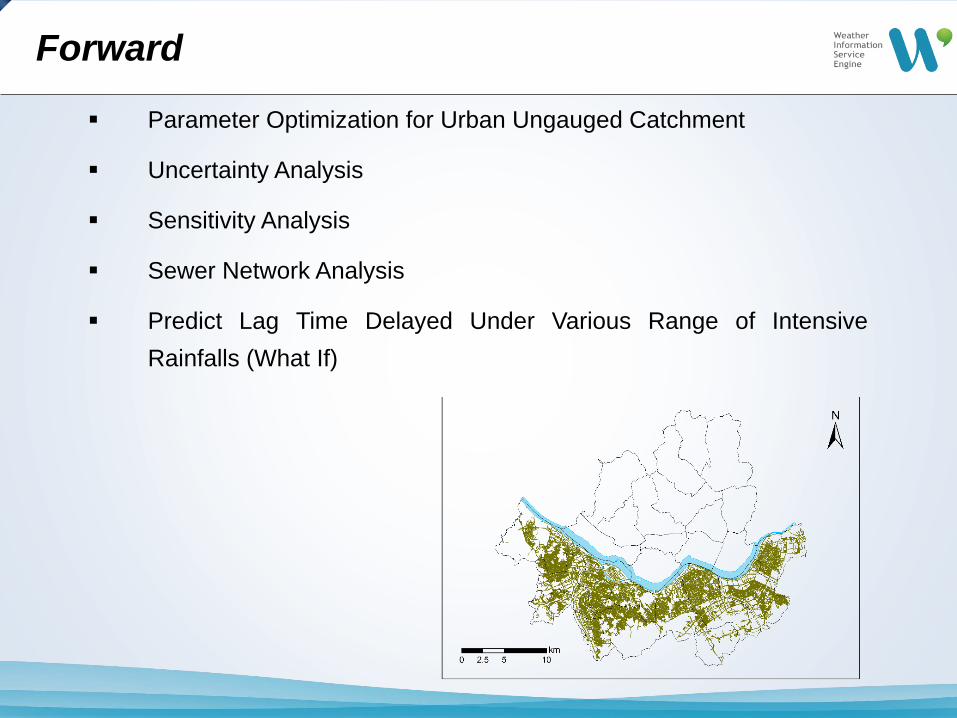
Forward
Parameter Optimization for Urban Ungauged Catchment
Uncertainty Analysis
Sensitivity Analysis
Sewer Network Analysis
Predict Lag Time Delayed Under Various Range of Intensive
Rainfalls (What If)
Thank You for Listening
Weather Information Service Engine Division, CATER
18 July 2013
Hyung Kyung Joh
Sun Jung
Jong-Sook Park
/
/
/