application of high resolution images gis/rsnews
TRANSCRIPT

South Pacific GIS/RS NEWS November, 2000 1
Highlights
· Launch of New remote Sensing Satellites
· Country News Vanuatu & Marshall Islands
· Software Development
Highlights
· GIS Application: Backdrop, Projection
· Remote Sensing Technique
· Application of High Resolution Images
More Interest in Remote Sensingand GIS than ever before ......
SOPAC�s 29th annual session was held in Tarawa,Kiribati from 26th September to 04th October. All mem-ber countries expressed highest interest in all parts ofGIS and Remote Sensing development and will en-hance their application. Small Island States such asFSM, Nauru and Marshall Islands will start to establishtheir GIS system, which is partly reflected already bythis newsletter. The Pacific Island Countries supportedthe enhanced co-operation between USP and SOPACin the fields of GIS and Remote Sensing. After recenttalks, this will also include the University of New Cal-edonia. In addition, the countries expressed the needfor high-resolution satellite image backdrop to replaceoutdated maps. The Pacific Island Countries welcomedthe European Union Project, which will - after the projectapproval - install and enhance GIS/RS units in all Pa-cific ACP countries.After announcing the upcoming launch of QuickBirdduring SOPAC�s annual session, the launch was adisaster forEarthWatchthe com-pany, which developed and owned this satellite. Thisis the second satellite the company has lost, however,since the launch was covered obviously well by insur-ance EarthWatch will be able to launch QuickBird 2 ,soon. OrbImage the company responsible forOrbView-3, which is another satellite carrying a high-
resolution imagesensor, did not re-lease news about itslaunch, but a pressrelease is expected
very soon. IKONOS will record the first high-resolu-tion image data for a South Pacific Island country withSOPAC having ordered images for Tongatapu, Tonga.During the process of the data order, the companySpace Imagine did review its policy. The minimum datapurchase increased from USD 2000 to USD 6000 due
ISSN 1562-4250
Download your digital version from SOPAC�s web site ..!
IKONOS OrbView-3
GIS/RS newsPacific Island The Newsletter of the
GIS/Remote SensingUsers in the Pacific
Issue 00/03
to the fact that there will be very limited multiple sellingof the image data when switching on the sensor im-ages before and after because the requested cover-age will onlyshow water,not of interestto other cus-tomers. Nev-ertheless, thedata purchase is on its way and SOPAC in image ac-quisition experience will benefit all Pacific Island Coun-tries.This newsletter reports several GIS and RS tech-niques, which will be of interest for many GIS opera-tors in the pacific. The use of different projections,spheroids and datums is a problem in many PacificIsland Countries. One article explains in detail how tohandle this when using MapInfo. The use of GIS back-drop increased steadily after starting such applicationfor the power utility in Tonga. One technical articlesummarises the production and application of GISbackdrop. Another technical contribution describes theutilisation of historical aerial photographs for changedetection, which will become of interest when inex-pensive high-resolution satellite image data is avail-able. Integration of different software is explained bythe example of TEPB GIS. Finally, the ongoing openGIS/RS software development is reflected by thisnewsletter. SOPAC is part of FMaps, which will fill thegap of application software running under Linux. Thiswill provide free GIS and RS software for all PacificIsland Countries.This newsletter provides country overviews forMarshall Islands and Vanuatu. Contributions from CookIslands, PNG, Samoa and other did not reach SOPACin time. These articles we can look forward to in thenext issue of this newsletter.

2 South Pacific GIS/RS NEWS November, 2000
Contents
EO-1 in Space ........................................................................................................................ 3QuickBird did not make it ! ..................................................................................................... 3GIS and Remote Sensing Activities in Tonga .......................................................................... 4Inexpensive Land Cover Change Detection for Pacific Island Countries ................................... 5GIS Establishment and Training in Marshall Islands ............................................................... 8Remote Sensing for Mangrove Mapping in Fiji ......................................................................... 8F-Maps ................................................................................................................................... 9GIS Backdrop ....................................................................................................................... 10MDO, MapX and TongaEPB GIS ........................................................................................... 13GIS in Vanuatu ..................................................................................................................... 15Kiribati local Mapping Data and their Definition in MapInfo .................................................... 17
PCGIAP ??? ......................................................................................................................... 20
Suva Subset of Landsat TM Scene purchased by USP & SOPAC
Articles please send to:
Wolf Forstreuter (SOPAC)fax: +679-370 040e-mail: [email protected]
James Britton (USP)fax:: +679-301 487e-mail: [email protected]
To save mailing costs, the newsletter is sent viaair mail for further distribution to the followingpersons:
Cook Islands Keu MataroaHawaii Rhett ReboldMarshall Islands Ellia de Brum SablanNiue Coral PasisiPNG Joe BulekaSamoa Sagato TuiafisoSolomon Islands Bryan PitakiaTonga Edwin Liava�aTuvalu Opetaia SimatiVanuatu Christopher Ioan

South Pacific GIS/RS NEWS November, 2000 3
EO-1 in Space ! QuickBird did not make it !
EO-1 in Space !First released from the rocket launched on 21 November wasNASA�s Earth Observing-1, a technology demonstration craft.The mission seeks toprove the utility of ad-vanced Earth-imaginginstruments that couldbe employed by thenext generation ofLandsatype remotesensing craft. EO-1carries a suite of twoimaging instrumentsalong with a devicethat will remove the dis-torting effects of the at-mosphere. The pur-pose of the missionsis to test the capabilities of risky new technologies in orbit toensure they work before incorporating them into real sci-ence satellites. To check EO-1�s imaging eyes, the craft willrendezvous with the Landsat 7 satellite currently orbiting theEarth in about three weeks. EO-1 will fly one minute behindLandsat 7, snapping pictures of the same swaths of the plan-et�s surface so scientists can directly compare the images.The craft�s sophisticated camera system uses one-fourththe power and has one-fourth the mass and weight of thecounterpart imager on Landsat 7. It is also 40 percent cheaper
and should beable to resolvefiner details in itspictures that arecurrently justnoise in Landsatdata. A smallerinstrument re-quires smallerspacecraft andthey in turn re-quire a smallerlaunch vehicleand the smaller
mission can be built on asmaller schedule. In additionto the imagers and atmos-pheric corrector, there are fiveother advanced technologiesaboard and enhanced forma-tion flying software that will al-low the craft to control itself inorder to keep within threekilometers of Landsat 7.
An illustration of the EO-1spacecraft observing Earth.Photo: NASA-GSFC
EO-1 and Landsat flying in for-mation. Photo: NASA-GSFC
For more details see: http://www.sopac.org.fj/Projects/GISRS/RSNews/index.html
A commericial U.S. eye-in-the-sky satellite launched by aRussian Cosmos rocket on Monday 20.11.00 failed to reachorbit according to news reports from Moscow and U.S. track-ing data. TheQuickBird 1craft lifted offat about 2300GMT on Mon-day aboard aRussian Cos-m o s - 3 Mrocket fromP l e s e t s kCosmodrome,but signalsfrom the satel-lite were notpicked up asplanned byground sta-tions. The $60million satel-lite was to beoperated byColordao-based EarthWatch Inc. U.S. tracking data reportedthe satellite�s initial orbit as approximately 78x610 kilome-tres and lists the orbit as now �decayed�. The Interfax newsagency has quoted a Russian Aerospace Agency spokes-man as saying that QuickBird 1 was �effectively lost.� Re-ports said the second stage of the Cosmos-3M shutdowntoo early. The failure of the QuickBird 1 launch is a majorblow to EarthWatch, which lost its first satellite EarlyBird 1four days after its December 24, 1997 launch due to a prob-lem with its power system. EarthWatch is developing a net-work of satellites to image regions of the Earth for a varietyof commercial applications, including environmental moni-toring, land management, mapping, agriscience studies, anddisaster monitoring. QuickBird 1 was planned to orbit in acircular perch 590 kilometres high, inclinated 66 degrees toeither side of the equator. This inclination allows uniqueimaging times. From orbit, QuickBird 1 was to collect bothone-meter resolution digital black-and-white imagery and four-meter resolution digital colour images. These high-resolu-tion images were to be taken by the QuickBird instrument, ahigh-resolution camera, during orbital daytime. Digital im-ages taken from orbit will rival aerial photography in terms ofboth cost and possible economic and scientific applications.The spacecraft was manufactured by Ball Aerospace andTechnologies, Corp., of Boulder, Colorado. Ball provideslaunch integration and on-orbit commissioning of QuickBird1 from the time QuickBird 1 arrived at Plesetsk at the end ofOctober.
QuickBird did not Make it!Copied from Stephen Clark,
SPACEFLIGHT NOW
Artist�s concept of QuickBird 1. Photo:EarthWatch
4 South Pacific GIS/RS NEWS November, 2000
GIS and Remote Sensing Activities in Tonga
The National Oceanic and Atmospheric Administration(NOAA) uses IKONOS satellite imagery to map, measureand, potentially, monitor U.S. shallow-water coral reef eco-systems in the Caribbean and the Pacific Rim. The IKONOSremote sensing satellite was launched in September 1999and provides NOAA with a new technology to understandthe coral reef habitat. Dr. Steve Rohmann, a physical scien-
tist for NOAA, and col-leagues have nearlycompleted coral reefmapping activities inthe U.S. Caribbean andare initiating similar ac-tivities in Hawaii, espe-cially the north-westHawaiian Islands.Rohmann�s project in-cludes the use ofIKONOS one-meterresolution panchro-matic and four-meterr e s o l u t i o nmultispectral imageryto evaluate and map
GIS and Remote Sensing Activities in TongaRobert Smith
SOPAC
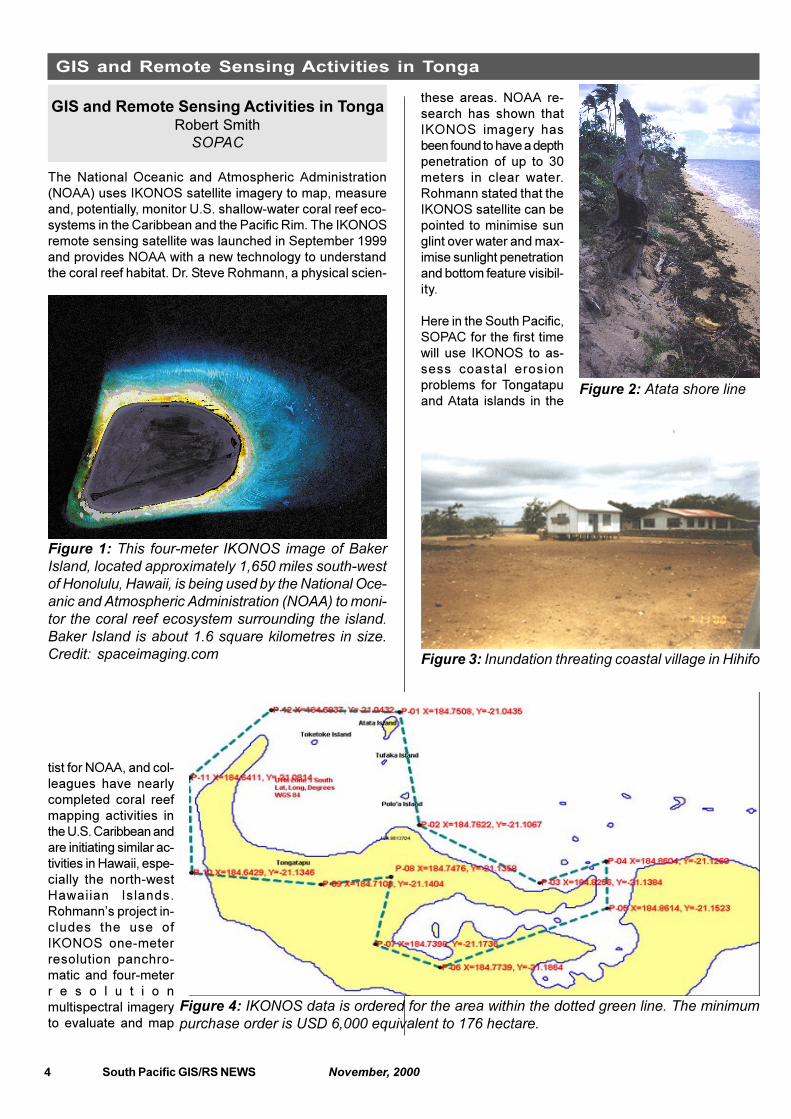
Figure 1: This four-meter IKONOS image of BakerIsland, located approximately 1,650 miles south-westof Honolulu, Hawaii, is being used by the National Oce-anic and Atmospheric Administration (NOAA) to moni-tor the coral reef ecosystem surrounding the island.Baker Island is about 1.6 square kilometres in size.Credit: spaceimaging.com
these areas. NOAA re-search has shown thatIKONOS imagery hasbeen found to have a depthpenetration of up to 30meters in clear water.Rohmann stated that theIKONOS satellite can bepointed to minimise sunglint over water and max-imise sunlight penetrationand bottom feature visibil-ity.
Here in the South Pacific,SOPAC for the first timewill use IKONOS to as-sess coastal erosionproblems for Tongatapuand Atata islands in the
Figure 2: Atata shore line
Figure 3: Inundation threating coastal village in Hihifo
Figure 4: IKONOS data is ordered for the area within the dotted green line. The minimumpurchase order is USD 6,000 equivalent to 176 hectare.

South Pacific GIS/RS NEWS November, 2000 5
Inexpensive Land Cover Change Detection for PIC
Tongan group of islands. Inundation loss of coastal vegeta-tion, and mangroves are apparent in recent site photos takenfor Hihifo (see Figure 3) and Atata (see Figure 2) shorelinesuggesting there are a number of factors contributing to theproblem. Existing aerial photography for the areas in ques-tion is only available up to 1990, 10 years on there is anurgent requirement for updated imagery to assess the prob-lem. Examination of photography taken in 1980 ( b&w) and1990 (colour) show both areas of concern to have been verystable during this period. With no imagery taken during the90�s and the acquisition of updated photography for imageanalysis for what could be considered as two small remoteareas to mobilise an aerial survey was not seen as an optionin terms of logistics and cost. Both sites also incorporate anextensive fringing reef platform and lagoon. With IKONOS,however, SOPAC saw an opportunity to use new technologyto assess the problem from onshore through the coastal zoneand into the reef-lagoon system. In the context of small is-land management the ability to be able to monitor island andsurrounding coral reef ecosystems through the use of highresolution multispectral imagery is seen as an affordablemapping and monitoring tool that will be of great benefit tothe remote Pacific Islands.
Inexpensive Land Cover Change De-tection for Pacific Island Countries
Wolf ForstreuterSOPAC
IntroductionIn many Pacific Islands Countries change in land cover isreadily apparent but seldom quantified due to lack of histori-cal satellite data and/or high cost of analysis of aerial pho-tography. However, new image analysis software allows con-verting historical aerial photographs to geometrically correctedspatial data layers that can then be compared over time. Aquantitative analysis of change that has taken place betweensets of aerial photographs recorded at different times be-comes feasible. The change detection images in this reportwere prepared while assisting a USP student undertaking ageography project.
Data Correction and Data InputSOPAC�s A3 scanner was used at 600 dpi to retain optimalresolution for aerial photo sets from Suva peninsula from1973, 1986 and 1994. More than 20 ground control pointswere used for each aerial photograph to rubbersheet the cen-tral projection to Fiji Map Grid. Then, the images were stitchedtogether to create a one layer each for the three differentyears.
The Change Detection ImageERDAS software was used to compare different layers andseveral options are available:
1. different displayed layers can be geolinked that movesthe cursor correspondingly in both windows and allowseasy visual interpretation
2. different layers can be combined to a synthetic imageas shown in Figure 1 that highlights changes in differenttime periods in different colours.
The second approach will be explained in further detail asthis method could be applied to other areas that highlightcoastal erosion or vegetation cover loss especially in PacificIsland Countries where low cost historical aerial photographsare available.
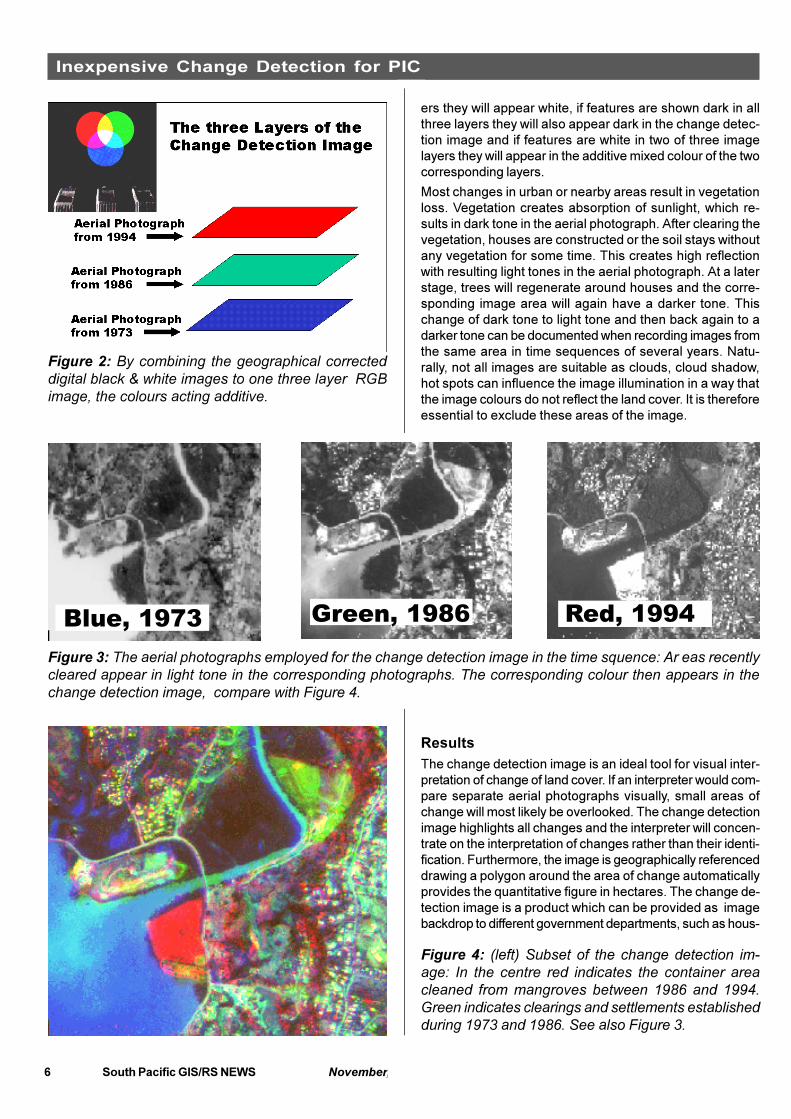
Normally, a colour image consists of three black & whitelayers linked to the video monitor three colours of red, greenand blue (RGB). However, normally all three layers are re-corded at the same time (for example a SPOT image). Here,images recorded at different times are each geometricallyreferenced and mosaiced and then imported into one threelayer image as shown in Figure 2. All parts reflected white inthe 1994 image will be shown red if the corresponding imageparts are dark in the 1986 and 1973 images. Parts only shownwhite in the 1986 image will be shown green and parts onlywhite in the 1973 image layer will appear blue in the changedetection image. If features are white in all three image lay-
Figure 1: The change detection image of Suva penin-sula: Aerial photographs recorded in 1973, 1986 and1994 have been scanned, geometrically corrected andcombined to one colour image as described in the textand by Figure 2.
6 South Pacific GIS/RS NEWS November, 2000
Inexpensive Change Detection for PIC
.
Figure 2: By combining the geographical correcteddigital black & white images to one three layer RGBimage, the colours acting additive.
Blue, 1973 Green, 1986 Red, 1994
Figure 3: The aerial photographs employed for the change detection image in the time squence: Ar eas recentlycleared appear in light tone in the corresponding photographs. The corresponding colour then appears in thechange detection image, compare with Figure 4.
ers they will appear white, if features are shown dark in allthree layers they will also appear dark in the change detec-tion image and if features are white in two of three imagelayers they will appear in the additive mixed colour of the twocorresponding layers.
Most changes in urban or nearby areas result in vegetationloss. Vegetation creates absorption of sunlight, which re-sults in dark tone in the aerial photograph. After clearing thevegetation, houses are constructed or the soil stays withoutany vegetation for some time. This creates high reflectionwith resulting light tones in the aerial photograph. At a laterstage, trees will regenerate around houses and the corre-sponding image area will again have a darker tone. Thischange of dark tone to light tone and then back again to adarker tone can be documented when recording images fromthe same area in time sequences of several years. Natu-rally, not all images are suitable as clouds, cloud shadow,hot spots can influence the image illumination in a way thatthe image colours do not reflect the land cover. It is thereforeessential to exclude these areas of the image.
ResultsThe change detection image is an ideal tool for visual inter-pretation of change of land cover. If an interpreter would com-pare separate aerial photographs visually, small areas ofchange will most likely be overlooked. The change detectionimage highlights all changes and the interpreter will concen-trate on the interpretation of changes rather than their identi-fication. Furthermore, the image is geographically referenceddrawing a polygon around the area of change automaticallyprovides the quantitative figure in hectares. The change de-tection image is a product which can be provided as imagebackdrop to different government departments, such as hous-
Figure 4: (left) Subset of the change detection im-age: In the centre red indicates the container areacleaned from mangroves between 1986 and 1994.Green indicates clearings and settlements establishedduring 1973 and 1986. See also Figure 3.

South Pacific GIS/RS NEWS November, 2000 7
PCGIAP
ing and development, environment planning, forestry, agri-culture, etc.
Visual interpretation is still recommended, because watercan have different illumination due to different sun angle ordifferent flight direction as shown in the tone of the river inFigure 3. However, if aerial photographs are available withsimilar illumination, semi automatic image analysis proce-dures can provide quantitative change data if such changedetection images are employed.
Conclusion and RecommendationsUsing scanner and image analysis software the describedmethod allows an accurate, easy and inexpensive way ofchange detection. Once the change detection layer is pre-pared as image backdrop it can be easily analysed by inter-preters of socio economic, environmental or forestry back-ground by using simple GIS tools.
The application of change detection images is important todocument and analyse urban changes. Many historical aerial
Figure 5: Another subset of the change detection image cov-ering the Suva area: The developments within the two differenttime periods are clearly visible. The big claim of area happedbetween 1986 and 1994 most parts of the industrial area wasestablished between 1973 and 1986 and partly contiued duringthe period 1986 and 1994.
photographs are available for Pacific Island Countriesand it is recommended to use these photographs.
Even more important would be the application of thedescribed technique to document and analyse coastalchange. It would allow documenting the link betweencoastal erosion and human influence such as destruc-tion of mangroves, construction of flood gates, seawalls or river-course change.
To highlight recent changes new aerial photographscould be recorded, however, this is extremely expen-sive in Pacific Island Countries. IKONOS data fromspace would provide a more economic solution withan even better resolution (1m in panchromatic mode,the scanned aerial photographs have a resolution of3m) and the scanning and stitching process wouldbe avoided in addition.
For further information regarding the technical ques-tions contact [email protected]. For further questionregarding changes in the Suva area contact: JessicaStabile [email protected]
GIS-PacNetIf you want to receive e-mails keeping you inthe picture about:
· latest development of satellite image dataavailable for Pacific Island Countries,
· latest news of software for GIS, RemoteSensing and GPS,
· jobs available in GIS, RS and GPS relatedfields,
get regular e-mail from GIS-PacNet. This is free!
This list is also helpful if you have a questionrelated to hardware, software, data analysis inGIS, RS and GPS related subjects. You ask andsomeone will have the answer, because healready came across this problem.
Just e-mail to:
or
We put you on the list!

8 South Pacific GIS/RS NEWS November, 2000
GIS Establishment and Training in Marshall Islands
GIS Establishment and Training in MarshallIslands
Ellia de Brum Sablan
Remote Sensing for mangrove mapping in FijiSamuela Lagataki, Forestry Department, Fiji
For some years now, the Marshall Islands Government hasbeen keen on educating and training its people andestablishing GIS/RS in the country. Slowly the Government�swish is becoming a reality.
Since early this year, the RMI Government, RMI/USPExtension Centre and AusAID have been working andcollaborating together to firstly, develop a user group mainlyfrom the key sectors that would benefit the most from theestablishment and training of GIS/RS. The group will beawarded with five scholarships to commence GIS studies.
In February 2000, a total of six students, two from the Land& Survey Division, one from the Marshall Islands Water &Sewer Company, one from the Marshall Islands ElectricCompany, and two college students were given scholarshipsto do a certificate in GIS studies at the RMI/USP ExtensionCentre. The group is completed their first two courses. (seeFigure 1). By January next year 2001, the Government andRMI/USP Extension Center expects an additional of four newstudents making a total of 10 students in the GIS Certificateprogram
The second phase of the planning will be to conduct an in-country on-the-job training in GIS/RS and then eventuallyset up GIS/RS systems in key government agencies. TheMarshall Islands has solicited technical assistance fromSOPAC to help in the establishment of the GIS hardwareand software and also to conduct the training. In addition tothe students, other government employees will take part inthe training. The government agencies expected to benefitfrom the program are Coastal Management Division inEnvironmental Protection Authority (EPA), Lands and Survey,Public Works, Planning and Statistics, Historical PreservationOffice, Disaster Office, Marshall Islands Marine Resources
Authority and the utility companies.
The expected output of this GIS program is firstly, theMarshall Islands will have people educated in GIS. Theeducation component will help the country develop a broadbase of needs and also enables it to deal with realities of thefuture; Secondly, practical training component will help thecountry meet its immediate and specific needs and itsdemand now; and Lastly, government agencies will receiveequipment, both hardware and software that is essential incarrying out the country�s work.
We would like to take this opportunity to thank the RMI/USP Extension Centre, Dr. Irene Taafaki, the Governmentof Australia, Mrs. Dana Russo, and SOPAC for their helpand support for GIS program in the Marshall Islands.
Figure 1: Top left to right: Melba White, Tommy Keju,Ermina BingBottom from left to right: Labb Capelle, JasenLangidrik, Bill Labaja
In many tropical coastal countries, mangrove ecosystem isamongst the most important natural resource, especially inmany of the Pacific Islands. But, the usual lack of informa-tion about this resource is the main reason for the lack ofrealization of its importance. Mangrove ecosystems protectsour shorelines from excessive coastal erosion, provides foodfor coastal and small island communities, habitats and breed-ing grounds for certain terrestrial and marine organisms, andbirds, building materials for houses, fuel-wood, and the listgoes on and on. Yet, they are a threatened ecosystem inmost parts of the world and Fiji is no exception.
The total area of Fiji�s mangrove forests had been variouslyreported by different authors. Richmond and Ackerman re-ported a total area of 49,777 ha in 1975, Saenger et al (1983)reported a total area of 19,700 ha, Watling (1985) reported atotal area of 38,543 ha, and 42,464 ha by the Forestry De-partment during the 1991 Fiji National Forest Inventory (NFI).
Figure 1: Landsat TM image of mangroves in theRewa Delta, east of Suva, bands 1, 2, 3.

South Pacific GIS/RS NEWS November, 2000 9
Creating an OpenSource GIS/RS for GNU/Linux onGnome
GNU/Linux is an OpenSource operating system that couldbenefit Pacific Island Countries (PICs). It is robust and free.It is developped in a collaborative manner over the Internetby many people and companies. Each one contributes freelyto the development of such operating system. It is a good
RS for Mangrove Mapping in Fiji, F-Maps
This is a clear indication that Fiji needs another survey of itsmangrove resource to re-define it and to re-confirm its truearea, extent of coverage and distribution.
More than 90 % of all mangroves occurring in Fiji are withinthe coastal areas of Viti Levu and Vanua Levu. Studies car-ried out by Watling (1985) shows that there is a real threatfor the Fijian mangrove communities within these two islands.The threats are due to the following human activities.based on digital data, manipulation, re-classification, andre-calculations could be done very quickly if certainparameters such as infrastructure, development sites, etc.changes.
Applied analysis of remotely sensed data and GIS is nowdone by local staff at the following institutions in Fiji, MSD-Forestry, SOPAC, MRD and ALTA. With the existence ofthe GIS user forum for Fiji and the South Pacific, raster andvector GIS now taught at the University of the South Pacificand the recent cooperation between institutions in Fiji to co-purchase satellite scenes, the future of raster and vectorGIS for Fiji is gathering momentum and certainly is gettingbrighter.
Given the importance of our mangrove ecosystem, the threatit currently faces, and the pressing need for more land forthe purpose of agriculture, urban and rural development.Resource managers must set a balance betweendevelopment and conservation. Technology such as remotesensing and GIS is ideal for such purpose. Due to theavailability of technology and local expertise, the potential ofGIS and remotely sensing for mangrove management in Fijiand the Pacific could be enormous. We have the potentialand the ability, the GIS user community had come so far,this will be another challenge and a step forward towards theuse of GIS and remote sensing for the management andplanning of mangrove resources within Pacific islandcountries.
FMapsFranck Marin, SOPAC
news for PICs as they are not obliged to invest in softwarewhen you know that software represents more than 70% ofthe cost of computing. It is moreover true when copyrightlaws are fully applied.
GNU/Linux however lacks a user friendly GIS/RS software.There are some software providing such tasks like GMT,GRASS,... But they are not really user friendly, like MapInfoor Arcview. The purpose of FMaps is to create a user friendlyOpenSource GIS.
The benefit, will be that all can participate to the development,empowering Pacific Islanders and ensuring that neededfunctions are implemented. The system is based on a trueclient/server database which allows out of the box truemultiuser support over the network. It contains a metadatacatalogue which is ISO compliant. All operations and objectsare fully 3 dimensional objects which allows neededrepresentation possibility for mining, ocean profiling, townplanning,...
The benefit for Pacific Islands is tremendous. It will allowreplacing costly Microsoft based software with a freealternative. In the domain of computer software that SOPACand its member countries are using, everything can bereplaced by GNU/Linux except in GIS where SOPAC is usingMapInfo which has no GNU/Linux equivalent so far. If IslandNationals are stimulated then they can participate in thedevelopment of this software, bringing them needed skills athome. It serves 2 purposes: reduce the software budget ofPacific Island Nations, capacity building by empoweringPacific Island Nationals.
What is available right now? If you go on the project sitehttp://fmaps.sourceforge.net/ you can read more about theproject, see some screen captures and download the sourcecode. At the moment FMaps is in its alpha stage, not veryuseful, but it allows to build upon it. I expect to have a betaversion, something useful but bugged by beginning of nextyear. In SOPAC we are planning to put more resources onthe project by march next year through a french studentsponsored by the French Embassy.
How can you participate? See above to download the sourcecode or to join the developper mailing list. Any contributionis welcomed such as code contribution or documentationcontribution, or simply suggesting ideas...
Figure 1: FMaps at http://fmaps.sourceforge.netFigure 2: Display of developed parts in Linuxenvironment

10 South Pacific GIS/RS NEWS November, 2000
GIS Backdrop
IntroductionDuring the establishment of GIS environment for the Electri-cal Tonga Power Board the need for image data in GIS envi-ronment was identified. The demand was to have additionalinformation to that already provided by a cadastral map. Otherutilities demanded image backdrop as well and today thepreparation of GIS backdrop is an important service providedby SOPAC. This article describes the types of image back-drop, their preparation and potential of application.
Types of Image BackdropThere are different types of image backdrop, but they are allraster images, where every picture element is geographi-cally addressable. The backdrop is geographically referencedto the same projection as the overlaid vector information.The raster images of the image backdrop can be aerial pho-tographs, satellite images or maps in raster data format.
Satellite Images or Aerial PhotographsSatellite images are the classical image backdrop. They arealready in raster data format and only need geometric recti-fication to be imported to GIS. Aerial photographs are used iflarger scale than 1:50,000 is required or in cases where nosatellite images are available. Since modern software is ableto convert the central perspective of aerial photographs intothe required map projection, aerial photographs are morefrequently used. They also provide historical information fromtimes where no satellite images were recorded. An applica-tion will to be investigated by SOPAC: for areas where aerialphotographs cannot be corrected due to missing ground con-trol points (GCPs), georeferenced satellite data will be taken
as reference during the correction. This will provide anothersource of high-resolution image backdrop.
Maps
Image backdrop is not limited to aerial photographs and sat-ellite images a physical map can be converted to a rasterimage and treated as backdrop. For Fiji Islands all availabletopographic maps of the new 1:50,000 Lands Departmentseries are converted to backdrop files and can be copiedfrom SOPAC, see Figure 3 for an example of a topographicmap as image backdrop. Recently a project based at SOPACconverted available nautical charts for most Pacific Islandharbours into GIS backdrop. They can be displayed in theships for navigation or in central GIS for disaster mitigationhighlighting areas of risk. Several thematic information suchas the forest type / forest function map for Fijiis available asGIS backdrop (see Figures 3 and 4). Others, such as ero-sion risk map, could be produced easily.
Results of Special Image Enhancement
Ratio images highlighting areas of drought-affected vegeta-tion (available for West of Viti Levu in Fiji), change-detectionimages (see corresponding article) or image-classificationresults are available as image backdrop. These backdropswill be used for documentation and planning.
Creating Image BackdropTo create image backdrop, scanner and image analysis soft-ware is required. Satellite images are already in digital for-mat. Maps and aerial photographs have to be scanned. Thenthe resulting image files have to be geometrically corrected,and the images stitched to one layer and finally they can beimported to the GIS.
Scanning or Data Purchase
Aerial photographs require a scanning process with mini-mum resolution of 600 DPI otherwise the information con-tent of the photographs is highly reduced. Furthermore, it isimportant to scan aerial photographs in one go, because itis very time consuming to rectify different parts of an aerialphotograph and mosaic them later. Therefore, the scannershould be A3 in size. The scanning of maps only require 200DPI and again an A3 scanner is important for saving time.The scanning process converts aerial photographs or mapsto raster data image files. These have to be georeferencedlater.
Geometric Correction
The process of geometric correction links to each pictureelement (pixel) the x and y co-ordinates of the required mapprojection. Image analysis software calculates such a trans-formation formula using GCPs identified in the image and inthe corresponding map. A linear transformation is sufficientwhen correcting images of scanned maps, digital satelliteimages require a polynomial transformation of second de-
GIS BackdropWolf Forstreuter, SOPAC
Figure 1: Image backdrop for Tonga Electrical PowerBoard in Nuku�alofa. The image is overlaid with thecadastral map and with a layer showing the power polesand low voltage lines. Employing this GIS backdropthe service teams see where vegetation touches powerlines and from which side the customers can be con-nected best. Such information is not provided by acadastral map.

South Pacific GIS/RS NEWS November, 2000 11
GIS Backdrop
gree; and to transform aerial photographs, a rubbersheetcorrection is preferable.
Image Stitching
Once all aerial photographs, parts of topographic maps orsatellite scenes are geographically referenced, they have tobe combined to homogenous layers. This requires two ac-tivities from image analysis software: a) to cut the overlap-ping part b) to smoothen the transition between different im-ages. This requires image analysis software it is impossibleto perform these steps with photo editing software such asPhotoshop, Photopaint, Photoeditor, etc.
Import to GIS
Modern image analysis software provides output in GeoTIFFand modern GIS software can import such files directly. Thecurrent version of MapInfo cannot read such files yet and theimport has to be performed by the operator. There are twoways to do this: a) during the import, the image files have tobe georeferenced again by using the MapInfo tools for rasterimage reference, b) the operator creates own *.TAB files re-ferring to the image file. Solution b) is faster and more accu-rate.
Pyramid Layers
Image backdrop can slow down GIS display on small com-puters. However, there is a way to overcome such a disad-vantage by producing pyramid layers for such backdrop files.MapInfo has the capability to display files in relation to adefined zoom range of the files. Overviews backdrop do notrequire high resolution and if zooming in where high resolu-tion is necessary the display only needs files covering smallparts of the complete area.
To create pyramid layers as shown in figure 2 the resolutionis reduced from the original image file to create layer 2 andthen further reduced to create layer 1. Smaller resolution
reduces the file size, which speeds the display and roomingof the layer. Layer 2 is than cut into four files and layer 3 into16 files. Depending on the zoom factor, layer 1, 2 or 3 isdisplayed. The display in higher resolution displays only thefiles required for the area to be viewed.
To create pyramid layers the subsets of the original imagefile are created by a batch run. Furthermore, a program de-veloped in SOPAC creates all necessary MapInfo TAB fileswhich automates the import to MapInfo GIS.
Application Potential of Image BackdropThis chapter highlights some applications of GIS backdrop.There are far more applications possible and the providedexamples are far away from showing the complete picture,but they allows us to see the potential of GIS backdrop as atool.
Map Replacement
As said in the introduction, the GIS backdrop productionstarted, because TEPB in Tonga requested additional infor-mation to the cadastral map. The display in figure X showspower pools and customers in natural environment. TEPBimmediately sees where lines are going through tree branchesand which is the best side of a house to connect a cus-tomer.
Maps to navigate in shallow water mostly do not exist inPacific Island Countries. Having the GIS backdrop on themonitor in the boat the current position of the boat can bedisplayed on top of the backdrop, which makes navigationeasy and safe.
Area Analysis
FEA asked SOPAC to estimate the flooded area if a damsecuring water for power turbines is extended for 20 andrespectively 40 m. Having the topographic map as GIS back-
Figure 3: The topographic map as GIS Backdrop.Digitising the contour lines show the extent of floodingif increasing the dam 10m (blue) or 20m (light blue).The area calculation is then an automatic procedureof MapInfo.
Figure 2: Pyramid layers of GIS backdrop files allowa fast display. Such a backdrop shows a file of lowresolution if an overview is required and selected back-drop files of high resolution if the operator zooms in.

12 South Pacific GIS/RS NEWS November, 2000
GIS Backdrop
drop, it was easy to follow the corresponding contour linesto create polygons indicating the landscape flooded and theparts of landmass looking out of the flooded area. Withinone hour it was possible to send back the area figure of theflooded landscape and a digital map which can be printed onany common printer.
Similar application is nearly a daily occurrence in Fiji�s For-estry Department, when area calculation has to be carriedout. Instead of using planimeters image backdrop can bedisplayed and a polygon can be drawn, which is more accu-rate, faster and a map can also be printed out.
Sample Plot Determination
Whenever inventories are carried out it isnecessary to calculate the area con-cerned. In addition, it is essential to dis-play possible plot centres, which are linkedto the local Fiji Map Grid (FMG). Ifmapbackdrop is involved, which always isgeoreferenced as described above, MapInfoprovides an easy tool to display a grid overthe defined area. The grid sections showthe locations of possible plots and out ofthese possible plot locations randomly anumber of plots will be selected and thanestablished and measured in the field. Therelevant part of the backdrop can be printedand taken as map into the field.
Image correction
Image backdrop of topographic maps alsospeeds up geometric image correction, ifbackdrop is used as reference instead ofa physical map. After three ground controlpoints (GCPs) have been identified, the
operator only clicks the GCPs on the image (right side infigure 4) and the system already locates the possible posi-tion of the corresponding GCP on the backdrop. The opera-tor only has to adjust the position, which saves a lot of time.In addition, GIS backdrop does not have the distortionscaused by change of temperature or change of moisture,which always affect the accuracy when digitising GCPs froma map.
Investigation for Potential areas
If an area is proposed for development, which can be farm-ing, logging, urban development, etc., it is now possible todisplay different spatial information for this area. For exam-
Figure 5: An example of GIS backdrop application in Forestry. The area outline e.g. a proposal for forest management underFSC regulations is first digitised using the topographic map backdrop. Then, the polygon is displayed over the satellite GISbackdrop to see if the area is still stocked by forest. Finally, the Forest Type / Forest Function GIS backdrop shows, that themain part is protection forest, which limits the forest management.
Figure 4: Using GIS backdrop instead of a map, which is placed on a digitisingtable, allows the software to indicate the approximate position of the next GCP.This increases the productivity immense.

South Pacific GIS/RS NEWS November, 2000 13
ple an area is proposed for heavy logging, the following stepsallow an immediate answer �YES� or �NO� to the issue of alogging license:
1) digitising the area on the screen using a topographicmap backdrop,
2) display satellite backdrop to see the forest condition,
3) display the forest type / forest function map and realisethat the forest is protected.
Conclusion and RecommendationsThe production of image backdrop is fast and the potentialfor different applications is huge.
Secondly, Landsat 7 TM images are delivered without copy-right restrictions. If maps are scanned and converted to GISbackdrop there is also no copyright restriction within the re-gion of Pacific Island Countries.
It is recommended that GIS backdrops to be produced forPacific Island Countries financed by international donors andthat these backdrops be delivered free to the different usersin the countries. This would not only develop GIS applicationin general, but it would also allow the different agencies tohave a unique spatial database. Conflicts of interest couldbe solved and planning would be improved.
For further information contact: [email protected]
IntroductionOur NCS Billing Counterparts from Napier Computer Sys-tems introduced MDO and MapX to TongaEPB GIS. This waspart of the strive towards implementing the GIS on the Intranet.So far a Demo program in VisualBasic 6.0 has been devel-oped to justify that the concept works. But it would be mosteffective when we have finally established all geographicalobjects on the GIS platform. These will then be used as thebase for Geoset (.GST) layers using Map-X, which will beused in the VisualBasic Project.
What is MDO?Magiq Data Objects.
Why MDO?Queries and extraction of data from our NCS UNIX Box aretailored using Hyper Magiq Scripts.
Installing MDOTo use MDO either MDO must be an installed DLL (via asetup program) or a member of the project group (*.vbg), thelater being best for debugging.
Using MDOA reference to MDO is required in the client program, madethrough project/references on the menu.
MDO, MapX and TongaEPB GIS
Edwin Liava�a, TEPB
A MDO connection variable is declared, usually globally.
Private conMDO As New mDO2.mdoConnection
A connection is then opened.
conMDO.OpenCn�server=central;uid=t1adm;program=NCPM00.O;menuid=.0988�
[This has to be one command line, which is difficult toprint in the format of the newsletter. The second linerepresents the Unix host name, the next line the logonname, the following line the Program to run and finally theMenu location of MDO server]
Using the openschema method can retrieve a recordset ofavailable commands.
Set DataGrid1.DataSource =conMDO.OpenSchema(mdSchemaProcedures)
[This has to be one command line]
The example above fills a grid with available commands.
MDO, Map X and TongaEPB GIS

14 South Pacific GIS/RS NEWS November, 2000
MDO commands
MDO commands are references to host-side procedures/reports. To use, a variable is declared as type mdo Com-mand.
Dim MyCmd As mdoCommandDim rst As ADODB.Recordset
Set MyCmd = MDO![PropRecords byValn]MyCmd!Key = �0988040000�Set rst = MyCmd.Execute
�Set MyCmd = conMDO![PropRecords by Valn]� isshort-hand for:
Set MyCmd = conMDO.Commands(�PropRecords byValn�)MyCmd is the command called �PropRecords by Valn�, from theconnections collection of commands
If a command has one or more parameters these are setusing the �bang� symbol.
MyCmd!Key = �123�MyCmd!Date = �11052001
Once these are set, the command can be executed toreturn a recordset result.
Set rst = MyCmd.Execute
Updating fieldsMDO supports the standard recordset update method.
If the user changes values and updates, MDO will auto-matically package up the new values and send them back.
Set cmd = MDO![PropRecords by Valn] cmd!Key = �0988040000� Set rst = cmd.Execute With rst ![Property Key] = �12345� ![Cert of Title] = �AB/CD� .Update End With
Host-side commandsWhen MDO connects it sends a _commands to the host,which replies with a list of commands.
_fieldsName:1:20:ACommand:21:15:AParameters:36:150:A
_end_listTitle Search _search keyRefine Search _refine keyUndo Search _undoInquiry _inquiry linenoAuthor Browse _asearch keySubject Browse _ssearch keySeries Browse _usearch keyPublisher Browse _psearch keyOpen Borrower _openborrower id:pinBorrower Reserve _reserve id:pinBorrower Reserved _reservedStake start _ststartItem category list _listcatsLocations list _listlocs_end_?_
A command is sent to the Host in the format:
1 2123456789012345678901234567890_openborrower 0001;1234
hostname of command
semi-colon delimited list of parameters
MapXMapInfo MapX is a mapping ActiveX (OCX) control that letsyou easily add powerful mapping capabilities to yourapplications. It is based on the same mapping technologyused in other MapInfo products, such as MapInfo Professionaland Microsoft Map. If you have created or purchased MapInfomap data (tables) for use with MapInfo Professional orMicrosoft Map, you can use those same files with MapX.
MapX is a tool for application developers. It offers the easiest,most cost-effective way to embed mapping functionality intonew and existing applications. MapX is an OCX componentthat can be quickly integrated into client side applicationsusing Visual Basic, PowerBuilder, Delphi, Visual C++ or otherobject-oriented languages and in Lotus Notes (v4.5) usingLotus Script. Developers can work in the environments they�refamiliar with, and end users can access mapping throughtheir familiar business applications.
MDO, MapX and TongaEPB GIS

South Pacific GIS/RS NEWS November, 2000 15
Adding Map Control on the VisualBasic Toolbox
Creating a Simple Map in a VisualBasic Project
Select Map With MapX, it�s easy to add a map to your appli-cation. In fact, you can add a working map to a Visual Basicform without writing a single line of code.
1. Select the Map control from the Visual Basic toolbox.(If the Map control does not appear on the toolbox,see Adding the Map Control in this chapter.
2. Draw a box on your form, representing the area whereyou want the map to appear. MapX displays a previewof your map.
3. Right-click on the Map control, and chooseProperties from the shortcut menu. The MapInfoMapX Properties dialog box appears.
4. Locate the Current Tool option, which is near thebottom of the General tab. Set the Current Tool to�1003 - Zoom In� and click OK.
Run your program to view the map. Notice that whenever the cursor is over the map, it changes toa magnifying glass with a plus sign.
For further information contact: [email protected]
IntroductionGIS is alive and well in Vanuatu with over 30 different officesusing the Vanuatu Resource Information System (VANRIS)and other GIS projects starting up in Municipal and Telecomareas. Most GIS activity is centered on VANRIS, a MapInfo/MSAccess-based GIS system originally set up to map naturalresources across the country. From its original beginnings,
GIS in VanuatuJames Britton, USP
VANRIS has adapted with changes in computer technologyand increasing demands from its users.
VANRIS: Basic ConceptsThe premise of VANRIS is simple. It starts with a base mapdata layer made up of essentially homogeneous areas ofland referred to as Resource Mapping Units (RMUs). Over5000 RMUs have been mapped out based on similarities ingeology, landform, climate, soils, and vegetation. While nota perfect model in that these features are not exactly thesame across the space within each RMU, the simplifiedmethod of storing geographical information does allow for aworkable national level GIS.
Added to this map database is an attribute database givingthe data describing each RMU. Data for each RMU includesthe above attributes as well as land use, population data, aswell as other special characteristics like conservation activityand community resource development projects.
The third component, and perhaps the most important whenthe popularity of VANRIS is considered, is an easy to useinterface that leads the user through the process of spatialquery and mapping. Rather than have the user interact withMapInfo at the system level in an ad hoc or random manner,VANRIS has a set of user interface screen that present allthe possible selections from the data in the attribute database.By working through various menu screens, the user is ableto define the map they wish to see. Selections are madefrom either check boxes or drop-down selection boxes. Whenthe map is finished, pre-made MapInfo tools allow simplecustomising of the final map through the addition of scalebars, north arrows and modification of legends.
The end result is a system that is easy for a wide range ofusers. This makes the system more attractive to use andhas been a key element in its success. Users with basic orlittle GIS skill can use the limited option menus to get results.Skilled users can access the VANRIS data through MapInfowithout having to use the menu screens. As a result VANRISis used in many offices including Forestry, Geology, Fisheries,Agriculture, Tourism, Education, Health, Statistics, andCommerce. There is also a range of users in the variousprovincial and local offices.
Vanris DataBut a simple to use system does not necessarily meansuccess. To be useful, it must contain good data and theright kind of data that different users need. Users must feelthe meets their needs, not the other way around. To makesure this happens, VANRIS functions almost as a communityof users with a central coordinating core. That core is currentlythe Land Use Planning Office (LUPO) within the Departmentof Lands. Williams Ganileo, Database Manager for VANRIScoordinates a user group made up of all the departmentswho use VANRIS. Through regular meetings, this group isable to make adjustments to the system and make sure theneeds of all users are met.
GIS in Vanuatu
16 South Pacific GIS/RS NEWS November, 2000
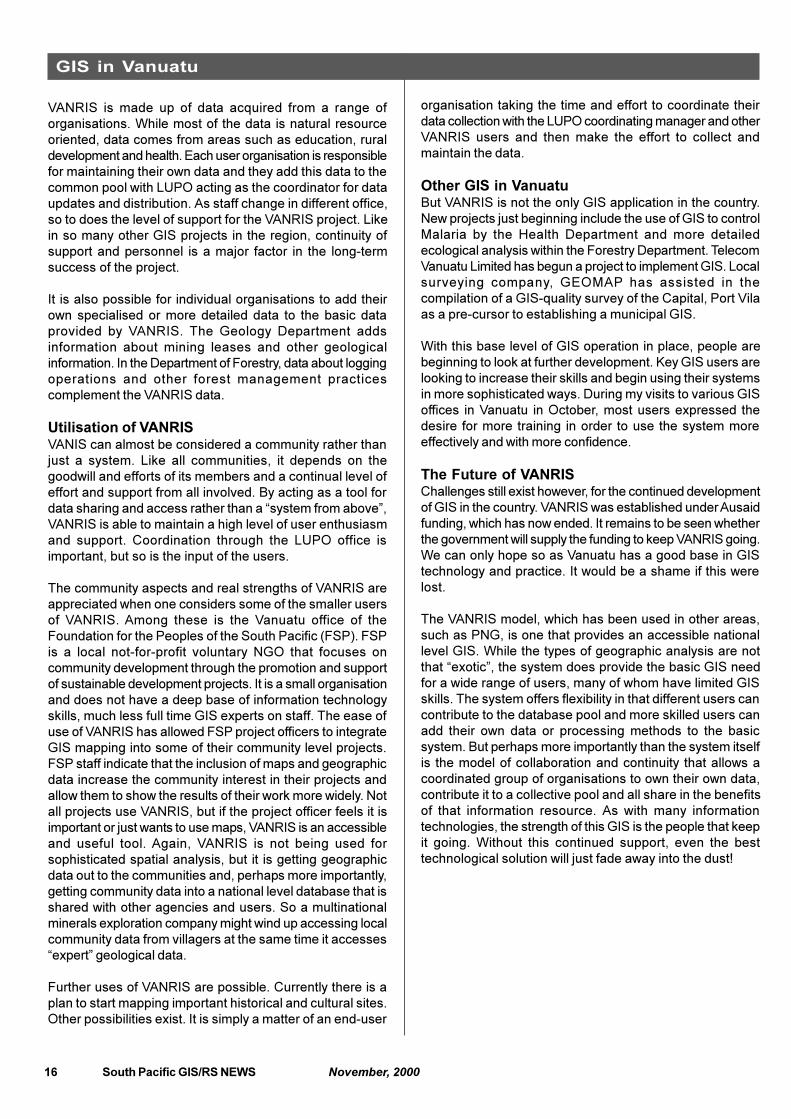
VANRIS is made up of data acquired from a range oforganisations. While most of the data is natural resourceoriented, data comes from areas such as education, ruraldevelopment and health. Each user organisation is responsiblefor maintaining their own data and they add this data to thecommon pool with LUPO acting as the coordinator for dataupdates and distribution. As staff change in different office,so to does the level of support for the VANRIS project. Likein so many other GIS projects in the region, continuity ofsupport and personnel is a major factor in the long-termsuccess of the project.
It is also possible for individual organisations to add theirown specialised or more detailed data to the basic dataprovided by VANRIS. The Geology Department addsinformation about mining leases and other geologicalinformation. In the Department of Forestry, data about loggingoperations and other forest management practicescomplement the VANRIS data.
Utilisation of VANRISVANIS can almost be considered a community rather thanjust a system. Like all communities, it depends on thegoodwill and efforts of its members and a continual level ofeffort and support from all involved. By acting as a tool fordata sharing and access rather than a �system from above�,VANRIS is able to maintain a high level of user enthusiasmand support. Coordination through the LUPO office isimportant, but so is the input of the users.
The community aspects and real strengths of VANRIS areappreciated when one considers some of the smaller usersof VANRIS. Among these is the Vanuatu office of theFoundation for the Peoples of the South Pacific (FSP). FSPis a local not-for-profit voluntary NGO that focuses oncommunity development through the promotion and supportof sustainable development projects. It is a small organisationand does not have a deep base of information technologyskills, much less full time GIS experts on staff. The ease ofuse of VANRIS has allowed FSP project officers to integrateGIS mapping into some of their community level projects.FSP staff indicate that the inclusion of maps and geographicdata increase the community interest in their projects andallow them to show the results of their work more widely. Notall projects use VANRIS, but if the project officer feels it isimportant or just wants to use maps, VANRIS is an accessibleand useful tool. Again, VANRIS is not being used forsophisticated spatial analysis, but it is getting geographicdata out to the communities and, perhaps more importantly,getting community data into a national level database that isshared with other agencies and users. So a multinationalminerals exploration company might wind up accessing localcommunity data from villagers at the same time it accesses�expert� geological data.
Further uses of VANRIS are possible. Currently there is aplan to start mapping important historical and cultural sites.Other possibilities exist. It is simply a matter of an end-user
organisation taking the time and effort to coordinate theirdata collection with the LUPO coordinating manager and otherVANRIS users and then make the effort to collect andmaintain the data.
Other GIS in VanuatuBut VANRIS is not the only GIS application in the country.New projects just beginning include the use of GIS to controlMalaria by the Health Department and more detailedecological analysis within the Forestry Department. TelecomVanuatu Limited has begun a project to implement GIS. Localsurveying company, GEOMAP has assisted in thecompilation of a GIS-quality survey of the Capital, Port Vilaas a pre-cursor to establishing a municipal GIS.
With this base level of GIS operation in place, people arebeginning to look at further development. Key GIS users arelooking to increase their skills and begin using their systemsin more sophisticated ways. During my visits to various GISoffices in Vanuatu in October, most users expressed thedesire for more training in order to use the system moreeffectively and with more confidence.
The Future of VANRISChallenges still exist however, for the continued developmentof GIS in the country. VANRIS was established under Ausaidfunding, which has now ended. It remains to be seen whetherthe government will supply the funding to keep VANRIS going.We can only hope so as Vanuatu has a good base in GIStechnology and practice. It would be a shame if this werelost.
The VANRIS model, which has been used in other areas,such as PNG, is one that provides an accessible nationallevel GIS. While the types of geographic analysis are notthat �exotic�, the system does provide the basic GIS needfor a wide range of users, many of whom have limited GISskills. The system offers flexibility in that different users cancontribute to the database pool and more skilled users canadd their own data or processing methods to the basicsystem. But perhaps more importantly than the system itselfis the model of collaboration and continuity that allows acoordinated group of organisations to own their own data,contribute it to a collective pool and all share in the benefitsof that information resource. As with many informationtechnologies, the strength of this GIS is the people that keepit going. Without this continued support, even the besttechnological solution will just fade away into the dust!
GIS in Vanuatu

South Pacific GIS/RS NEWS November, 2000 17
Kiribati Local Mapping Data and their Definintion in MapInfo
BackgroundDuring the 60�s and 70�s the Directorate of Overseas Surveyarm of the Ordnance Survey Organisation of Britain (DOS)produced an attractive set of Photomaps of the islands ofKiribati, mostly at a scale of 1:25,000. Even today thesemaps are still the best and most widely used maps of theouter islands of Kiribati. In order to establish the geographicposition (latitudes and longitudes) of the mapping, a local�Datum� was established on each island.
These local �Data� (�data� being the plural of �datum�) wouldoriginally have consisted of an �origin� point and another point(a mire) observable from the origin on a known azimuth fromtrue north. Given a known point and a reference point on aknown azimuth you can establish more points. The positionof the origin point and the mire would have been establishedat that time by �Astronomical� observations.
As well as establishing these local data, a �coordinate system�was determined for each island. A coordinate system consistsof a datum, a projection, and values for the requiredparameters of the chosen projection. The projection chosenfor all the coordinate systems and subsequent mapping ofKiribati islands was the �Transverse Mercator� projection.The parameters that are required for the �TM� projection are;
· datum,· units (metric or imperial),· longitude of origin or central meridian,· latitude of origin,· scale factor at the central meridian,· false easting,· false northing.
If you look at the base information on the OS photomaps ofeach island you will see the names of the local data as wellas the TM projection parameters for each coordinate system.The coordinates of survey control points (eastings andnorthings in meters), established by OS on each island arebased on these coordinate systems, and with the exceptionof Tarawa, are still in use.
Some more recent mapping done by the DOS of the Lineand Phoenix groups and Banaba is based on the WGS72datum. The WGS72 datum and its sucessor the WGS84datum are global �geocentric� data; ie their centres coincidewith the centre of gravity of the earth and they are applicableworld wide.
In 1980 the Australian army, as part of �Operation ANON�,re-observed some of the original data points established bythe DOS on the islands of Kiribati. These new observationswere made using �Doppler satellite� techniques. The datum
used at that time for Doppler satellite observations was�WGS72�. This provided a set of �common points� whosegeographic (or geodetic) position was known both in termsof the respective local data and the WGS72 datum. Whenyou have a point whose position is known in both the localdatum and the WGS72 datum then you can calculate a setof �shift parameters� that relate the two data. You can alsorelate the local data to the �WGS84� datum (the successorof WGS72), since there is a standard relationship betweenWGS72 and WGS84. The standard shift parameters basedon one common point are a shift in X, Y, and Z. These �shift�parameters are basically derived by calculating the �Cartesiancoordinates� of the point based on each datum and thenfinding the difference between the two sets of cartesiancoordinates.
The shift parameters can be calculated using standardgeodetic formulae. There are also programs available freeover the net that can calculate these shifts. One is called�Molodensky� available from Mentor Software. AUSLIG�s(Australian Survey and Land Information Group) site also hasan excel spreadsheet available for download that performsthe same calculation.
These 3 parameter data definitions are only as good as theoriginal observations on which they are based, and at best inabsolute terms only accurate to around 10 to 20 meters.The fortunate thing for Kiribati, being a nation of small islands,is that small changes in the relative positions of islands don�tmatter that much; they have no effect on the relative accuracyof surveys carried out within individual islands and the oceancan �absorb� any anomalies that in a large land masses canoccur when �one datum meets another�.
Figure 1: Cartesian Coordinates
Kiribati Local Mapping Data and their Definitionin MapInfo
David Llewellyn

18 South Pacific GIS/RS NEWS November, 2000
Defining the Kiribati Custom Mapping Data inMapInfoSince the local data used in the Kiribati mapping are notwidely used or known and are not inlcuded in the pre-defineddata that are included in Mapinfo, it is necessary to definethem as �custom data� and include the custom data defintionsas part of coordinate system definitions in the Mapinfoprojection file (Mapinfow.prj).
An example of a custom coordinate system definition in-cluding a custom datum definition for of one of the Kiribatiislands is shown below:
�Beru local grid�, 2008, 999, 4, 211, -588, -6, 7,175.9833333, 0, 1.0, 10000, 300000, 0, 140000, 20000,170000
The elements of this definition are:
�Beru local Grid�: A descritive name of the coordinatesystem
2008 : The number of the Transverse Mercator projection inMapInfo is �8�. If you want to define the �bounds� of yourcoordinate system then you add 2000 to the number of theprojection; thus 2008 is a coordinate system using TMprojection and we also will define the bounds of this coordinatesystem.
999 : This number is used to indicate to MapInfo that thefollowing 4 numbers in the coordinate system definitionrepresent a custom datum definition.
4 : The number 4 represents the ellipsoid used in the datumdefinition. In our case 4 is used as this is the number of the�International 1924� ellipsoid originally used.
211, -588, -6 : These are the X, Y and Z shift parameterscalculated as described above. All custom datum definitionsin MapInfo must be defined in relation to WGS84, so theshift parameters are always between the local datum andWGS84.
7 : This is the number of the units to be used. In our case weuse 7 as this is the number for meters.
175.9833333 : This is the central meridian in decimaldegrees. If you look on the OS photomap of Beru you willsee that the central meridian (or longitude of origin) is 175º59� 00�.
0 : This is the latitude of origin. In this case the equator orzero degrees.
1.0 : This is the scale factor at the central meridian. Scalechanges with distance from the central meridian on aTransverse Mercator projection. In the Universal Transverse
Mercator system this scale factor is 0.9996. This minimizesthe change of scale over the entire �zone� of mapping. In ourcase the islands mapped are of a relatively small east-westextent so it is acceptable to leave this scale factor at 1.
10000, 300000 : These are the false easting and false northingin meters respectively. These are used so that coordinatesin meters for the area mapped are always positive.
0, 140000, 20000, 170000 : These are the coordinate systembounds. 0, is the minimum easting; 140000 is the minimumnorthing; 20000 is the maximum easting and 170000 is themaximum northing. If you look again at the OS photomap ofBeru and inspect the coordinate values in meters along themargins of the map you will find that the maximum andminimum values for easting and northing are within thesefigures. Bounds are used to increase the available precisionof the map tables in MapInfo. Using bounds such as thosedefined for the Kiribati coordinate systems allows positionsof map data to be stored to the millimeter level. This isimportant to preserve Survey accuracy of points stored inthe MapInfo tables.
Tarawa Mapping Data and Coordinate SytemsOn Tarawa the situation is a little different. This is the cus-tom coordinate system definition for �Tarawa Local Grid (SecorAstro 1966)�:
�Tarawa local grid (Secor Astro 1966)�, 2008, 9999, 4, 259.418,-31.724, -3.795, -1.381387, -9.105050, -10.820718, 1.626,0, 7, 173.0333333, 0, 1.0, 20000, 0, 0, 130000, 70000, 200000
The custom datum definition included in this coordinate sys-tem definition is made up of the following:
9999, 4, 259.418, -31.724, -3.795, -1.381387, -9.105050, -10.820718, 1.626, 0
9999 : This number indicates to MapInfo that the followingcustom datum definition is a �7 parameter� (Bursa-Wolfe or3-dimensional similarity) definition.
As in the Beru definition the 4 is the international ellipsoidnumber and the next three numbers are the X,Y and Z shifts.The three numbers after that are rotations around the X,Yand Z axes. The number 1.626 is a scale factor in parts permillion and the zero is a longitude difference.
This definition of the �Tarawa Secor Astro 1966� datum wascalculated by Queensland survey firm Schlencker mappingas part of the aerial mapping project of Tarawa in 1998. All ofthe surveys of Tarawa up to that time were based on thatdatum and this custom definition relates that datum toWGS84.
The calculation of this datum (or rather, the relationship be-tween the �Secor Astro 1966� datum and the WGS84 da-tum), was made possible by the fact that a number of con-
Kiribati Local Mapping Data and their Definintion in MapInfo

South Pacific GIS/RS NEWS November, 2000 19
trol points that already existed on Tarawa and were definedon the Secor Astro datum were surveyed using control sur-vey GPS techniques and their coordinates using the WGS84datum established.
This 7 parameter datum definition provides a more accuraterelationship (about 1 meter) between the local datum andWGS84 than a 3 parameter datum definition does. Whenaccurate GPS control surveys are done on other islands ofKiribati it will be possible to develop more accurate 7 parameterdatum definitions replacing the 3 parameter definitions thathave already been calculated.
Changing over to WGS84 Datum for Tarawa Map-pingSince we have an accurate measure of the relationshipbetween the Secor Astro 1966 Datum and the WGS84 datumit is reasonable to transform older mapping and surveys tothe WGS84 datum, as well as using WGS84 for all newmapping of Tarawa. Some of the advantages of using theWGS84 datum are that the mapping conforms to a worldwidereference, users of GPS can directly relate their work to themapping, and the position of air navigation aids are useableby aircraft using GPS.
Changing the Map Datum of an existing MapInfoTable and Transforming between different dataMapInfo tables can be exported to �.MIF� text files. The fol-lowing is an example showing the first few lines of a MapInfotable of Aranuka that has been exported to a MIF file:
Version 300Charset �WindowsLatin1�Delimiter �,�Index 1CoordSys Earth Projection 8, 9999, 4, -137, -3168, 136, 0,0, 0, 0, 0, �m�, 173.5, 0, 1, 30000, 100000 Bounds (11000,110000) (45000, 132000)Columns 5 Ptnum Char(10) Easting Decimal(12, 3) Northing Decimal(12, 3) SRref Char(10) Court_minute Char(15)Data
Point 42159.75829 119181.0403 Symbol (40,0,9)
The custom datum and coordinate system take up the fifthline. (Within MIF files 3 parameter and 7 parameter datumdefinitions are shown the same way, but for 3 parameterdefinitions zeroes are placed in the position of the rotation,scale factor and longitude difference parameters). After thecoordinate system comes the description of all the columnsthat are in the table and following that comes the data in thetable. The geographical position of data in the table (only thefirst point record is shown) is shown in meters based on the
TM projection parameters.
If this map datum is found to be changed, (perhaps the da-tum parameters have been relcalulated after a new GPSsurvey), we wish only to change the datum, the coordinatevalues within the MIF file are correct and should remain un-changed. So what we need to do is to edit the datum param-eters in this MIF file to the new ones and then �Import� theMIF file back into MapInfo. So if a datum definition is changed,we need to follow a three stage process:
1. Export the existing MapInfo table to MIF format.2. Edit the datum definition in the MIF file to that required.3. Import the edited MIF file back into a MapInfo table.
This process will leave unchanged the coordinate values ofpositions of objects in the MapInfo table. However, if youimport a MIF file with a changed datum definition into MapInfoand then display the resulting table together with the originaltable, you will see a separation between them.
As we go into the future and more and more GPS controlsurveys are done, these old map data will no longer be used.However, for the moment, surveys on outer islands of Kiribatiare still being carried out based on the old data and it will benecessary even after the old data are replaced, to transformsome old surveys. So the definitions of these old data areneeded, and for many of the outer islands of Kiribati theyhelp us to better describe their �place in the world�.
Kiribati Local Mapping Data and their Definintion in MapInfo
Island Spheroid DatumMakin International Makin Astro 1965Butaritari International Makin Astro 1965Marakei International HMS Cook Astro �H� 1962Abaiang International HMS Cook Astro �H� 1962Tarawa International Secor Astro 1966Tarawa WGS84 WGS84Maiana International Maiana Astro 1965Abemama International HMS Cook Astro 1959Kuria International HMS Cook Astro, Kuria 1962Aranuka International HMS Cook Astro, Kuria 1962Nonouti International Nonouti Astro 1965Tabiteuea International TBZ1 Astro 1965Beru International BRZ1 Astro 1970Nikunau International Nikunau Astro 1965Onotoa International ONZ 7 Astro 1970Tamana International HMS Cook Astro 1962Arorae International Arorae Astro 1965Kiritimati International Christmas 1967 Astro
Table 1: Local Data used for Mapping in Kiribati

20 South Pacific GIS/RS NEWS November, 2000
PCGIAP ?
IntroductionThe Permanent Committee on GIS Infrastructure forAsia and the Pacific (PCGIAP) helps develop thecooperation between the organisations applying GISand Remote Sensing in the Asia and Pacific region.The first GIS&RS newsletter this year published anarticle by Bob Irwin, former Australian representativeto PCGIAP. PCGIAP is a regional body established bythe United Nations Regional Cartographic Conferencefor Asia and the Pacific. PCGIAP was formed in 1995and membership comprises all 55 nations of the Asiaand the Pacific region. Its main areas of responsibilityare:
· development of a regional spatial data infrastructureand contribution to the global model;
· support for member countries with their nationalspatial data infrastructures (NSDIs).
The Organisation of PCGIAPIn March 1999, Pacific island representatives formeda PCGIAP Pacific Group to address their unique GISand related needs and it was proposed that SOPACmanage the Pacific Group secretariat.
Every Pacific Island Country has a nationalrepresentative and there is a representative speakingfor all Pacific Island Countries on internationalconferences and meetings.
PCGIAP currently carries out its activities through threeworking groups: Geodesy; Fundamental Data; andDevelopment Needs. The Committee established theTaskforce in 1998 to identify relevant assistance inNSDI activities. The Taskforce is running workshopsand gathering information from PCGIAP membercountries from which appropriate development
Am
eric
an S
amoa
Mr
Mek
o l.
Aiu
mu
pat@
sam
oate
lco.
com
Coo
k Is
land
sM
r Keu
Mat
aroa
k.m
atar
oa@
mow
.gov
.ck
Fiji
Mr T
imot
e R
upen
itr
upen
i@la
nds.
gov.
fjF
renc
h P
olyn
esia
Mr M
oana
Bod
inm
bodi
n@fr
ance
mel
.com
Gua
mM
r Car
l J.C
. Agu
ondl
mdi
r@ns
.gov
.gu
Kiri
bati
Mr E
rene
Nik
ora
PJo
nes@
tskl
.net
.ki
Mic
rone
sia
surv
ey@
mai
l.fm
Mar
shal
l Isl
ands
Mr R
ober
t Mul
ler
Fax
: +69
2 62
5 30
05N
auru
Mr P
orth
os B
oppo
rthb
op@
cenp
ac.n
et.n
rN
ew C
aled
onia
M. Y
ves
Lafo
yla
foy@
noum
ea.o
rsto
m.N
CN
iue
Mr T
ogia
L. S
ione
holo
ajm
.fale
peau
@m
ail.g
ov.n
uN
orth
ern
Mar
iana
Isla
nds
Ms
Ber
tha
C. L
eon
Gue
rrer
oF
ax: +
670
288
3755
Pal
auM
r. F
ritz
Kos
hiba
bls@
pala
unet
.com
Pap
ua N
ew G
uine
aM
r O
man
i B R
eina
tmap
@da
tec.
com
.pg
Sam
oaM
r Seu
man
utaf
a A
ua�u
Tia
volo
seud
irdls
e@sa
moa
.net
Sol
omon
Isla
nds
Mr
Jack
son
Via
kota
Fax
: +67
7 26
134
Tong
aD
r Sav
ae L
atu
min
land
s@ca
ndw
.toT
uval
uF
anoa
noag
a P
ator
ofp
ator
o@tu
valu
.tvV
anua
tuM
r Mic
hael
Bak
eoliu
land
surv
ey@
vanu
atu.
com
.vu
projects can be identified in support of these activities.Cadastre is also seen an issue of regional significanceby PCGIAP and it is giving serious attention to theformation of a PCGIAP cadastral working group.
And.....SOPAC in its capacity as Secretariat is concerned asthe apparent lack of focus of the Pacific Group andwonders whether this group will just become anotherUnited Nations all talk and no action organisation.
We have included what we understand are the list ofPacific national representatives. Is this list correct?What are they doing? What is the communication withGIS users? What decisions for the South Pacific weremade during the international meetings?
Please help us help you to develop GIS within the regionby communicating with us. Thank you.
PCGIAP ?