high-resolution gaming 1 high-resolution gaming
TRANSCRIPT
High-Resolution Gaming 1
High-Resolution Gaming: Interfaces, Notifications, and the User Experience
Andrew Sabri, Robert Ball, Saurabh Bhatia, Alain Fabian, and Chris North
Center for Human-Computer Interaction, Department of Computer Science, Virginia Polytechnic Institute and State University, Blacksburg, Virginia 24061, USA
Submitted to Special Issue of Interacting with Computers on “HCI Issues in Computer
Games” on April 10, 2006
High-Resolution Gaming 2
High-Resolution Gaming: Interfaces, Notifications, and the User Experience
Abstract
Advances in technology and display hardware have allowed the resolution of
monitors—and video games—to incrementally improve over the past three decades.
However, little research has been done in preparation for the resolutions that will be
available in the future if this trend continues. We developed a number of display
prototypes to explore the different aspects of gaming on large, high-resolution displays.
By running a series of experiments, we were not only able to evaluate the benefits
of these displays for gaming, but also identify potential user interface and hardware
issues that can arise. Building on these results, various interface designs were developed
to better notify the user of passive and critical game information as well as to overcome
difficulties with mouse-based interaction on these displays. Different display form factors
and user input devices are also explored in order to determine how they can further
enhance the gaming experience. In many cases, the new techniques can be applied to
single-monitor games and solve the same problems in real-world, high-resolution
applications.
Keywords: games; large displays; notifications; resolution; user interfaces; multi-monitor
Introduction
With the rapid development of technology, the game industry has progressed from
small one or two person development teams to studios that dedicate over 100 employees
to a single game. As a result, the quality and detail of video game graphics have steadily
High-Resolution Gaming 3
improved with each new generation of hardware. The resolution1 of personal computer
monitors also continues to improve and even televisions are receiving more pixels with
High-Definition sets. With these increases in rendering power and display resolution,
graphics have become more realistic and have defined the success of many games.
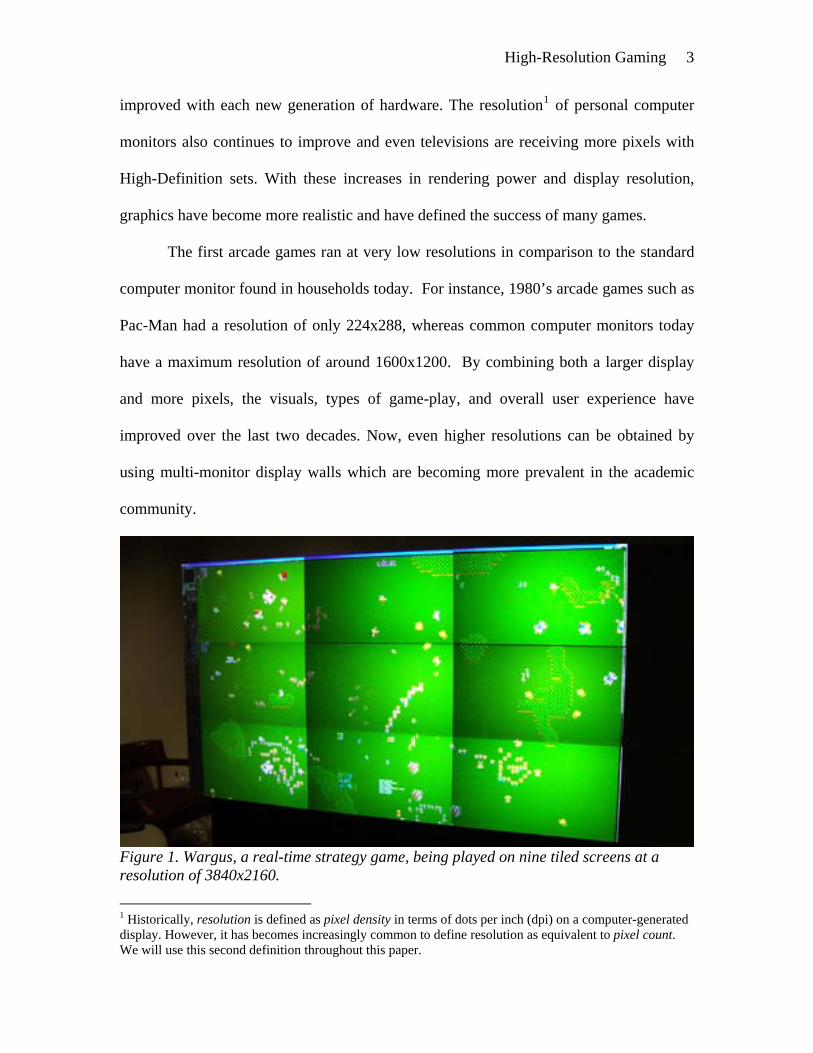
The first arcade games ran at very low resolutions in comparison to the standard
computer monitor found in households today. For instance, 1980’s arcade games such as
Pac-Man had a resolution of only 224x288, whereas common computer monitors today
have a maximum resolution of around 1600x1200. By combining both a larger display
and more pixels, the visuals, types of game-play, and overall user experience have
improved over the last two decades. Now, even higher resolutions can be obtained by
using multi-monitor display walls which are becoming more prevalent in the academic
community.
Figure 1. Wargus, a real-time strategy game, being played on nine tiled screens at a resolution of 3840x2160.
1 Historically, resolution is defined as pixel density in terms of dots per inch (dpi) on a computer-generated display. However, it has becomes increasingly common to define resolution as equivalent to pixel count. We will use this second definition throughout this paper.
High-Resolution Gaming 4
Based on these observations, the multi-monitor display wall is a cost-effective
prototype that demonstrates the potential for even higher resolution gaming. Just as with
previous improvements of display-size and resolution, these setups have numerous
benefits over their predecessors. For instance, the higher pixel-count enables more sprites
and 3D models to be displayed simultaneously with increased detail.
This study presents the results from two controlled experiments, usability
evaluations, and user feedback. In both experiments, the participants played Wargus, a
real-time strategy game based on WarCraft® II (see Figure 1). The first experiment
examined gamers in a series of competitive tournaments with different display sizes and
resolutions. This study revealed the advantages of higher resolutions as well as a number
of human-computer interaction factors, such as user interface issues. The second
experiment evaluated four new notification and interruption techniques developed for
high-resolution gaming as a result of the previous study. The paper then discusses a
number of solutions we have developed to improve the usability of these new displays.
Specifically, our research questions are:
• Do larger displays improve gamer performance? If so, how much improvement is
gained by incremental increases in display size?
• What user interface, notification, and other usability issues arise on larger display
configurations? How can these be solved?
• How can we achieve even higher resolutions? What other form factors and input
devices can we use with these displays?
High-Resolution Gaming 5
Our study shows that large, high-resolution displays greatly enhance the gaming
experience. The majority of gamers preferred the dramatic increase in resolution and
detail in comparison to the lower resolution version of the same games. We found that
there are measurable benefits in that users score higher, require less virtual navigation,
and have a greater awareness of the environment. By employing traditional usability
experiments, user interface issues were both identified and resolved with new techniques
developed to accommodate the larger display. As a result, gamers can enjoy the benefits
of multi-monitor gaming without the user interface hindering the game-play.
Surprisingly, these are some of the same issues that also hinder real-world, high-
resolution applications. We also explore different display scalability issues, form factors,
and input devices that could further enhance the user’s experience with these displays.
Related Work
There aren’t many studies on gaming usability on high-resolution systems.
However, as multiple monitor usage has increased, several studies have been performed
to evaluate different aspects of larger and/or multiple displays for other applications. In
general, these studies have focused on task performance for two to three monitors
compared to one monitor or large projector-sized displays compared to one monitor.
For larger displays, such as projector-based displays, there have been several
studies that have shown better performance on a larger display than a similar smaller
counterpart. Such studies had tasks dealing with static data and have been shown an
increase in memory (Lin, et al. 2002, Tan, et al. 2001), spatial performance (Tan, et al.
2003b), 3D virtual navigation (Tan, et al. 2004), and multi-tasking (Simmons 2001). A
High-Resolution Gaming 6
few different interaction techniques have also been developed to use on large screens
such as done by Mynatt, et al. (1999) and Pedersen, et al. (1993).
There have also been several studies showing improvements in user performance
on multiple monitors. Such studies include an increase in performance in multi-tasking
(Ball and North 2005a, Czerwinski, et al. 2003a), basic navigation (Ball and North
2005b), and offset gender bias in performance (Czerwinski, et al. 2003b, Tan, et al.
2003a). There is also research studying how bezels, the discontinuities in a display
surface caused by placing monitors side-by-side, effect how users interact with tiled
displays. These studies focus on bezel management (Mackinlay and Heer 2004, Tan and
Czerwinski 2003) and window management (Hutchings and Stasko 2004).
Results from Ball, et al. (2005) show that users were significantly better at
navigating static geographical maps and making informed decisions in geospatial
environments. However, their study did not evaluate any form of dynamic data. Other
studies have also looked at the displays themselves, such as the effects of a curved versus
flat display (Shupp, et al. 2006) and different display densities (Ni, et al. 2006).
We explored the ideas of pen-, mouse- and touch-based approaches as described
in (Guimbretire et al. 2001), (Baudisch et al. 2003), and (Tse 2006) to develop new
interaction techniques that would be better suited for high-resolution games. We also
examined notification paradigms that are currently used in non-gaming applications that
may be adaptable in notifying the user in games (McFarlane 2002). Additionally,
research done on animation and distance of notifications in the periphery (Bartram 2003)
is also closely related to gaming on large, high-resolution displays.
High-Resolution Gaming 7
Experiment I
The goal of the first experiment was to investigate the impact of large, high-
resolution displays on gamer performance and behavior. Multi-monitor desktops have
been proven to improve performance in office productivity (Czerwinski 2003), however,
little research has been conducted on their benefits specific to games. In addition to
determining the benefits, we hypothesized that usability issues that result in scaling
interfaces to higher resolutions could be identified with user evaluations and feedback.
Experiment Design
We chose to use a real-time strategy game because of the similarity between such
games and real-life scenarios of control room situations. Additionally, the point-and-click
user interface commonly used in strategy games is similar to those in many desktop
applications. We hope to show that large, high-resolution displays not only improve
various aspects of gaming, but can be beneficial to other applications as well.
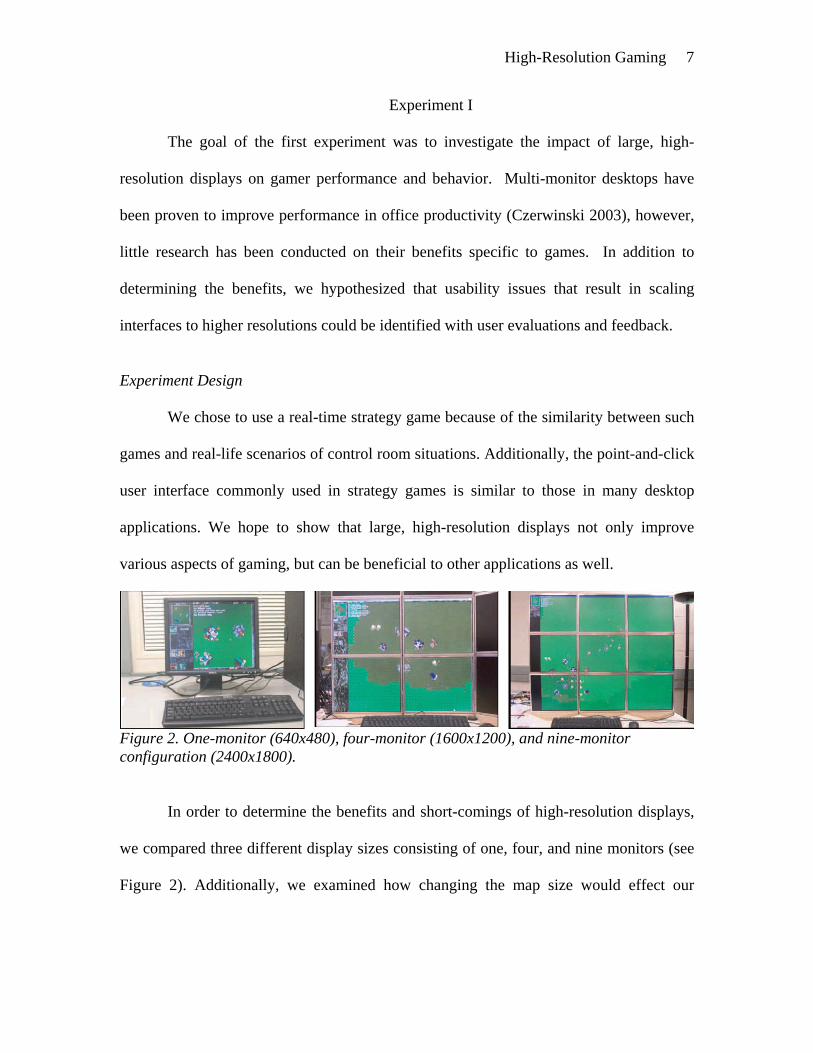
Figure 2. One-monitor (640x480), four-monitor (1600x1200), and nine-monitor configuration (2400x1800).
In order to determine the benefits and short-comings of high-resolution displays,
we compared three different display sizes consisting of one, four, and nine monitors (see
Figure 2). Additionally, we examined how changing the map size would effect our
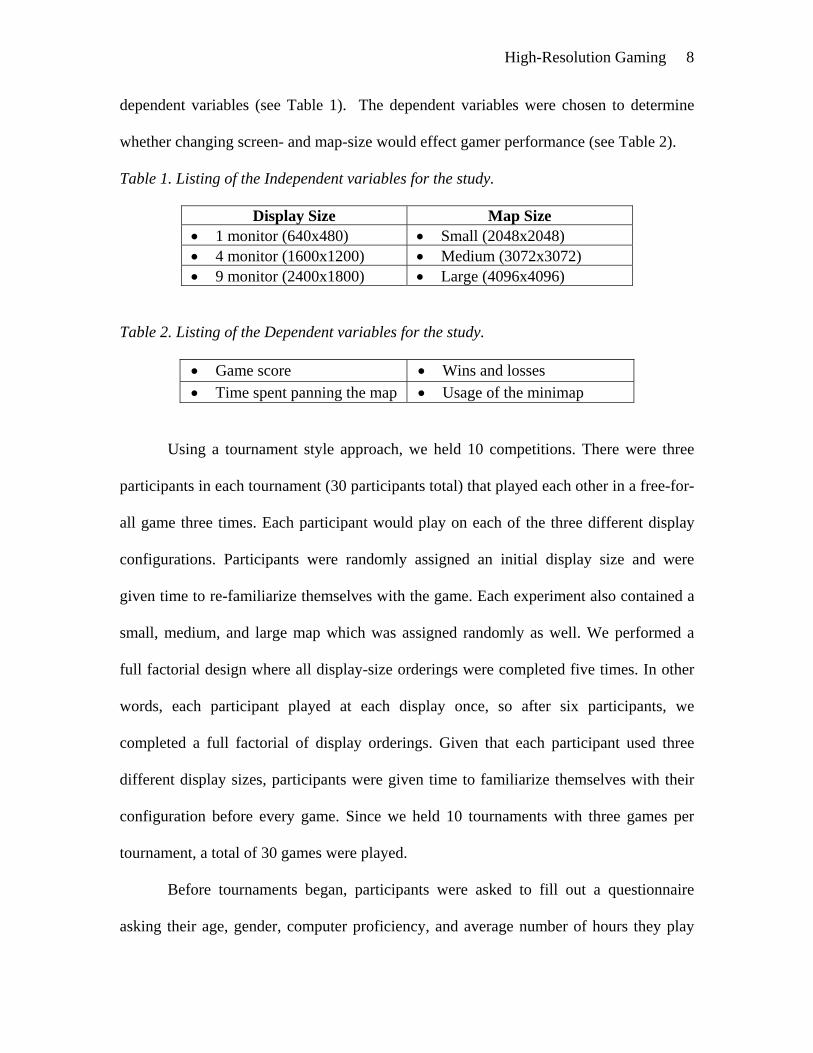
High-Resolution Gaming 8
dependent variables (see Table 1). The dependent variables were chosen to determine
whether changing screen- and map-size would effect gamer performance (see Table 2).
Table 1. Listing of the Independent variables for the study.
Display Size Map Size • 1 monitor (640x480) • Small (2048x2048) • 4 monitor (1600x1200) • Medium (3072x3072) • 9 monitor (2400x1800) • Large (4096x4096)
Table 2. Listing of the Dependent variables for the study.
• Game score • Wins and losses • Time spent panning the map • Usage of the minimap
Using a tournament style approach, we held 10 competitions. There were three
participants in each tournament (30 participants total) that played each other in a free-for-
all game three times. Each participant would play on each of the three different display
configurations. Participants were randomly assigned an initial display size and were
given time to re-familiarize themselves with the game. Each experiment also contained a
small, medium, and large map which was assigned randomly as well. We performed a
full factorial design where all display-size orderings were completed five times. In other
words, each participant played at each display once, so after six participants, we
completed a full factorial of display orderings. Given that each participant used three
different display sizes, participants were given time to familiarize themselves with their
configuration before every game. Since we held 10 tournaments with three games per
tournament, a total of 30 games were played.
Before tournaments began, participants were asked to fill out a questionnaire
asking their age, gender, computer proficiency, and average number of hours they play
High-Resolution Gaming 9
video games a week. After each game, participants were asked to estimate approximately
what percent of their time they thought they spent simply navigating the map. After all
three games were completed, participants were asked which display size they preferred,
and if the larger configurations helped and how.
Participants
For the study there were 30 participants that each had played at least 100 hours in
WarCraft II® or a similar real-time, strategy game prior to participation. Thus they were
considered experts. All participants were between the ages of 18 and 23 with the average
of 20. There were 35 male participants and one female participant. The average time
playing games per week was nine hours-per-week ranging from 5 to 20+ average hours
playing various games.
Game Specifics
We used Wargus, an open-source project that uses WarCraft II® data and runs on
the open-source game engine, Stratagus. Warcraft II® is a real-time, strategy game
developed by Blizzard Entertainment.
Like most real-time, strategy games, Wargus is based on gathering resources,
building up forces, attacking and destroying enemy armies. Players develop strategies to
accomplish these tasks by evaluating the status of the units on the game map and the
notifications presented on the screen. Users also must interact with and manipulate their
units in various ways. For instance, users are able to select their army by clicking on
individual units or by using a selection box to select multiple units. Each type of unit has
different attributes and is controlled by buttons on the left side of the screen. Status
High-Resolution Gaming 10
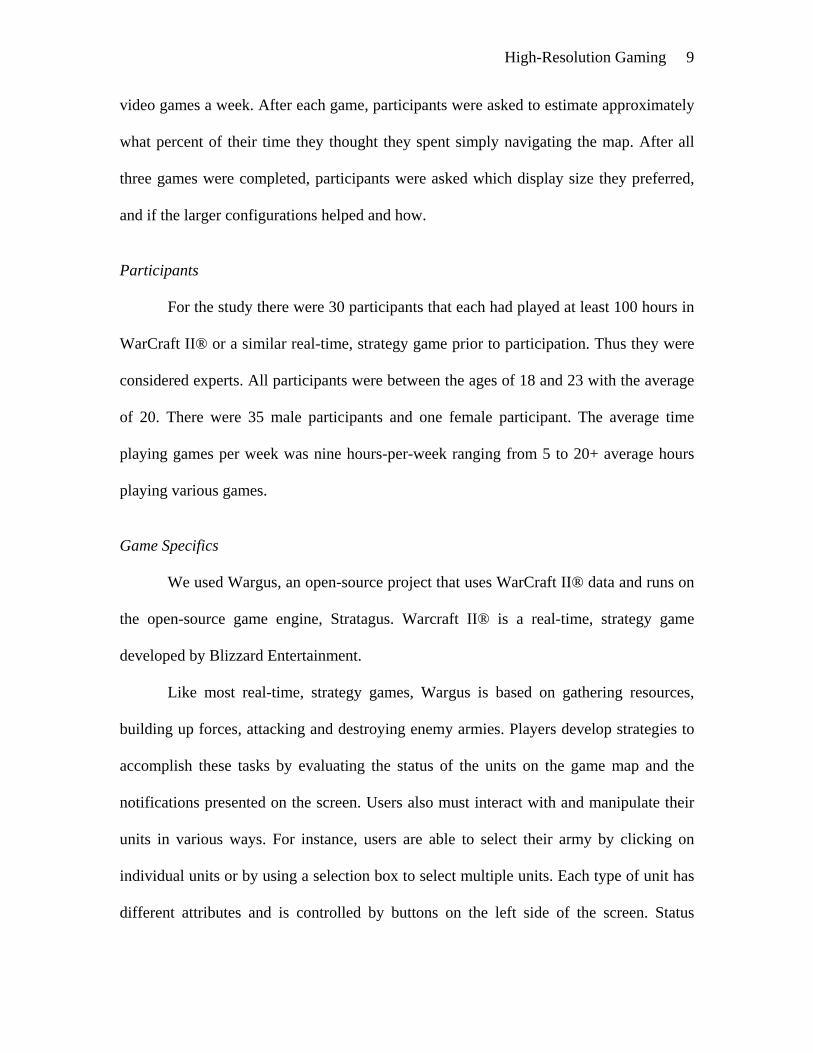
information and notifications are located at the top and bottom of the display. Wargus
uses the overview+detail navigation technique (see Figure 3). In the minimap (overview),
users can move the outlined rectangle that represents the position of the viewport by
dragging it or by clicking on any area of the overview. Panning can be accomplished by
using the arrow keys or mouse.
Figure 3. A diagram showing the locations of the minimap, user interface, and viewport.
We altered the source code to track the dependent variables and made some
changes to isolate the visual components of the game. As such, some features of the game
such as sound notifications and fog of war were removed.
Hardware
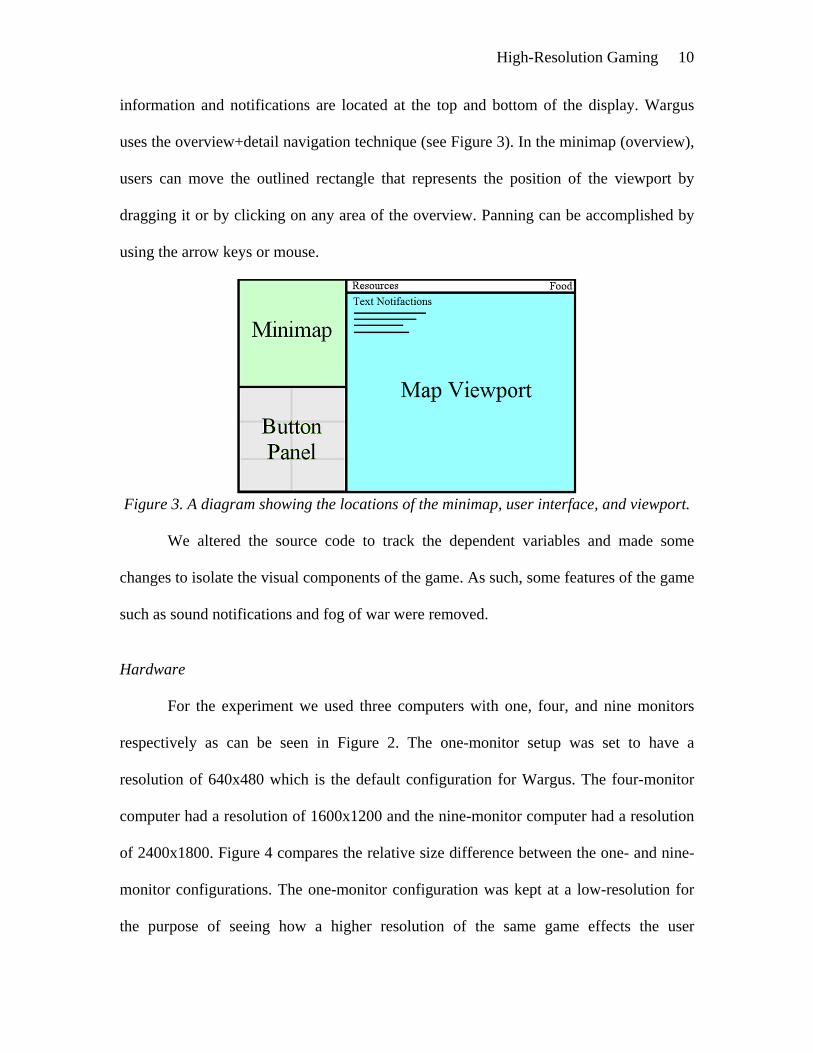
For the experiment we used three computers with one, four, and nine monitors
respectively as can be seen in Figure 2. The one-monitor setup was set to have a
resolution of 640x480 which is the default configuration for Wargus. The four-monitor
computer had a resolution of 1600x1200 and the nine-monitor computer had a resolution
of 2400x1800. Figure 4 compares the relative size difference between the one- and nine-
monitor configurations. The one-monitor configuration was kept at a low-resolution for
the purpose of seeing how a higher resolution of the same game effects the user
High-Resolution Gaming 11
performance, navigation, and interface design of the original, unaltered game. On the
nine-monitor configuration, 2400x1800 was the highest resolution we could obtain at the
time while keeping the game at optimal speeds.
Figure 4. Shows the difference in size between the one-monitor configuration (640x480) and the nine-monitor configuration (2400x1800).
Quantitative Results
This section explains the major results from our study. First, how performance
(score and wins) is effected by screen resolution, second, how navigation is effected by
screen resolution, and lastly, how navigation effects performance. All statistical analyses
were performed in SAS's JMP using standard ANOVA and Chi Squared techniques.
Score and Resolution Size
Participants using the larger displays scored higher than the participants using the
smaller configurations with a statistical significance of p < 0.01. The average score on the
single monitor was 2207, approximately 20% less than the four and nine monitor
configurations. The score for the four- and nine-monitor configurations were
approximately equal, 2659 and 2790 respectively. There were no interaction effects
between screen-size and map-size (p = 0.76).
High-Resolution Gaming 12
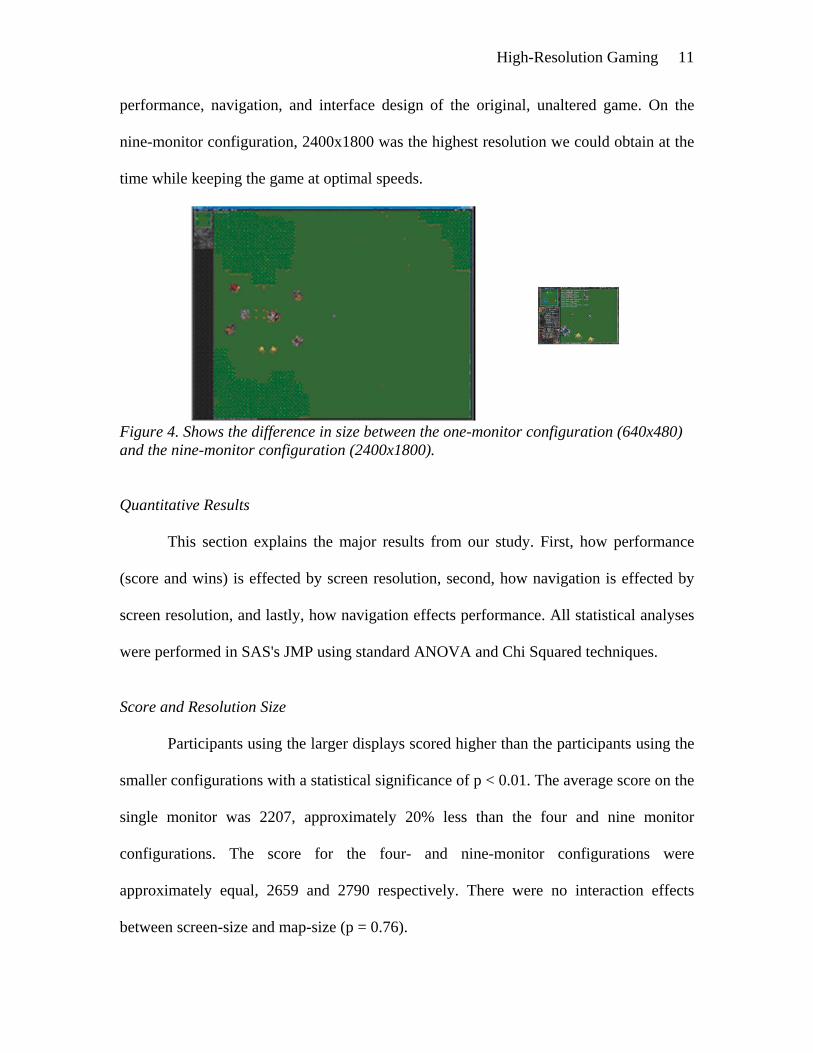
Wins and Resolution Size
In addition to scoring higher, the participants also won more frequently on the
larger, higher resolution displays. A player was considered the winner when both
opponents were out of units and resources. As can be seen in Figure 5, five of the 30
games (16.7%) played on the single-monitor setup resulted in a win, 12 of the 30 games
(40.0%) played on the four-monitor setup resulted in wins and 13 out of the 30 games
(43.3%) played on the nine-monitor setup resulted in wins. There were no ties.
Performing a Chi Squared analysis, shows statistical significance of p = 0.032.
Figure 5. The percentage of games that were won on the one-, four- and nine-monitor configurations. Larger sized screens won 2.5 times more often than the small screen. Navigation Results
As explained earlier, we modified the open-source Stratagus graphics engine to
track user input. Performing a two-way ANOVA of percent navigation revealed a main
effect for display size (p< 0.01), a main effect for map size (p = 0.02), and no interaction
effect between map-size and screen-size (p = 0.36). Percent navigation was calculated by
dividing the amount of time spent navigating by the total length of the game.
High-Resolution Gaming 13
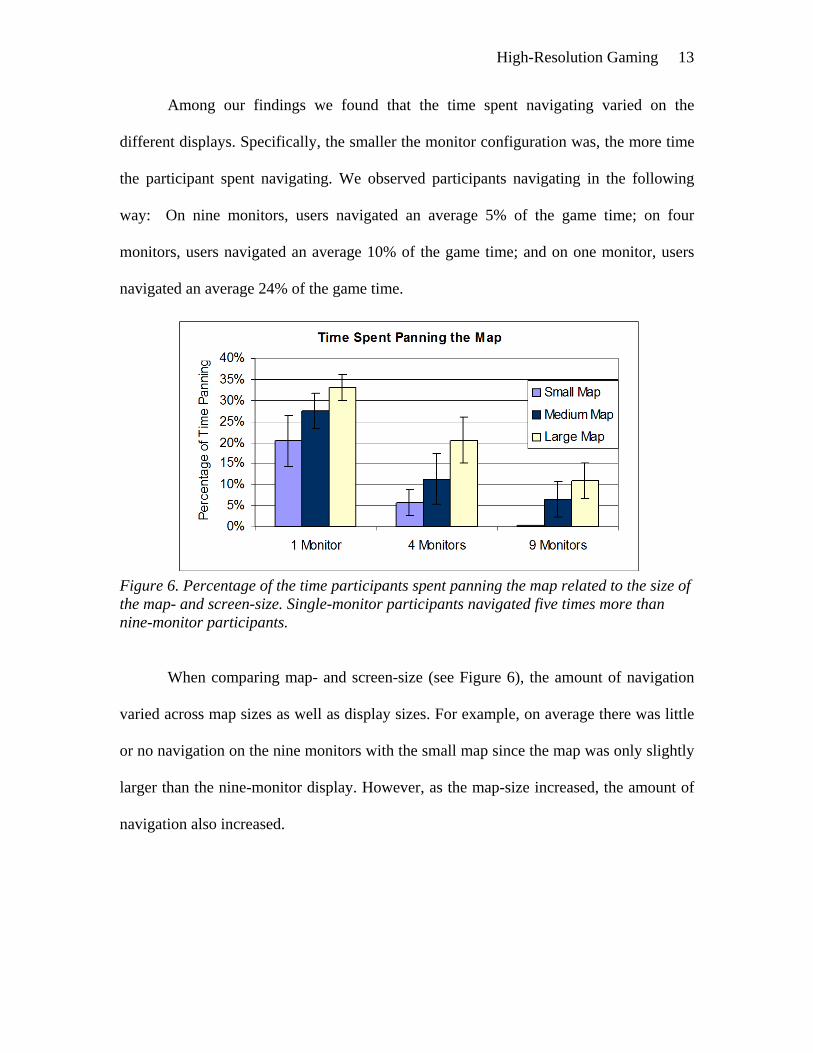
Among our findings we found that the time spent navigating varied on the
different displays. Specifically, the smaller the monitor configuration was, the more time
the participant spent navigating. We observed participants navigating in the following
way: On nine monitors, users navigated an average 5% of the game time; on four
monitors, users navigated an average 10% of the game time; and on one monitor, users
navigated an average 24% of the game time.
Figure 6. Percentage of the time participants spent panning the map related to the size of the map- and screen-size. Single-monitor participants navigated five times more than nine-monitor participants.
When comparing map- and screen-size (see Figure 6), the amount of navigation
varied across map sizes as well as display sizes. For example, on average there was little
or no navigation on the nine monitors with the small map since the map was only slightly
larger than the nine-monitor display. However, as the map-size increased, the amount of
navigation also increased.
High-Resolution Gaming 14
Navigation Time and Performance
According to our results, time spent navigating effected score with a statistical
significance of p = 0.017. Specifically, the less a participant navigated, the higher their
score. Navigation also effected the frequency in which users won with a statistical
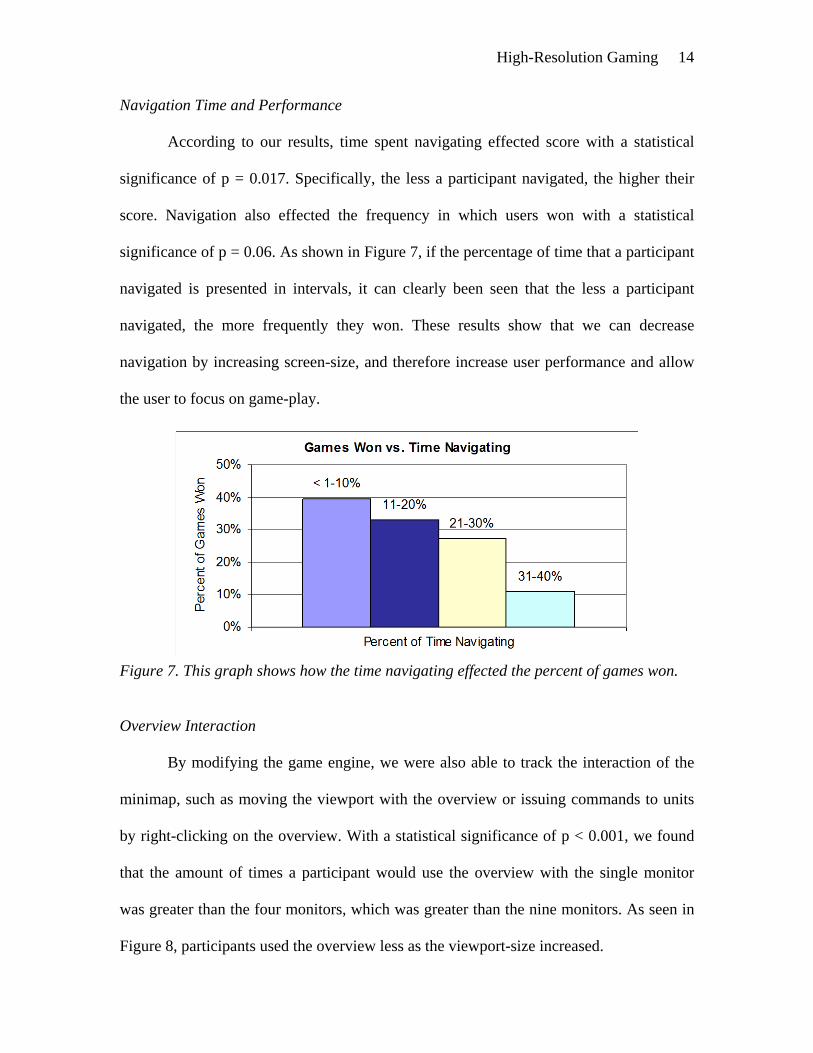
significance of p = 0.06. As shown in Figure 7, if the percentage of time that a participant
navigated is presented in intervals, it can clearly been seen that the less a participant
navigated, the more frequently they won. These results show that we can decrease
navigation by increasing screen-size, and therefore increase user performance and allow
the user to focus on game-play.
Figure 7. This graph shows how the time navigating effected the percent of games won.
Overview Interaction
By modifying the game engine, we were also able to track the interaction of the
minimap, such as moving the viewport with the overview or issuing commands to units
by right-clicking on the overview. With a statistical significance of p < 0.001, we found
that the amount of times a participant would use the overview with the single monitor
was greater than the four monitors, which was greater than the nine monitors. As seen in
Figure 8, participants used the overview less as the viewport-size increased.
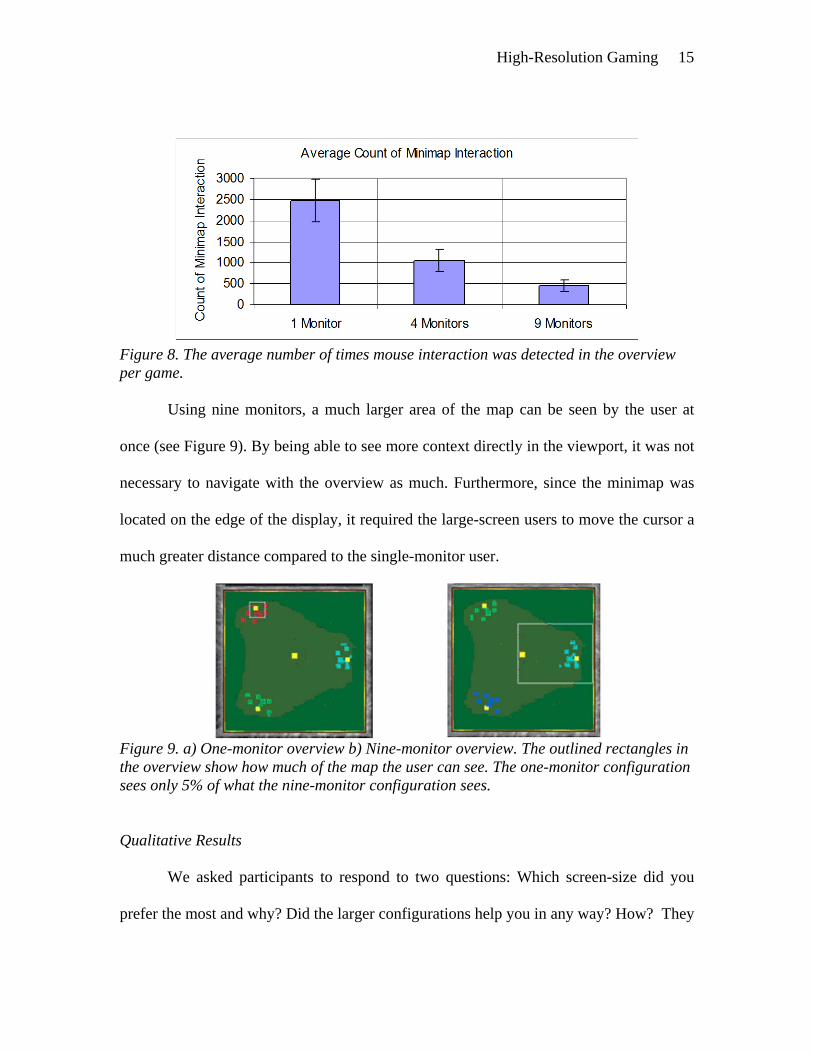
High-Resolution Gaming 15
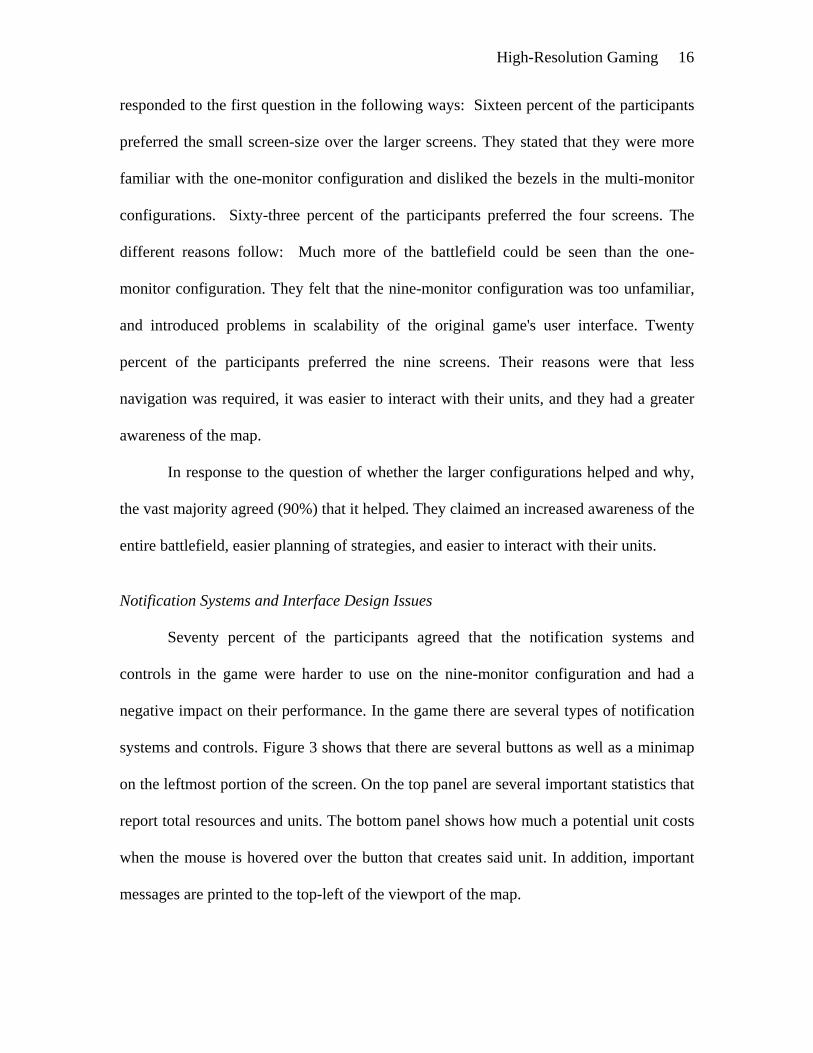
Figure 8. The average number of times mouse interaction was detected in the overview per game. Using nine monitors, a much larger area of the map can be seen by the user at
once (see Figure 9). By being able to see more context directly in the viewport, it was not
necessary to navigate with the overview as much. Furthermore, since the minimap was
located on the edge of the display, it required the large-screen users to move the cursor a
much greater distance compared to the single-monitor user.
Figure 9. a) One-monitor overview b) Nine-monitor overview. The outlined rectangles in the overview show how much of the map the user can see. The one-monitor configuration sees only 5% of what the nine-monitor configuration sees.
Qualitative Results
We asked participants to respond to two questions: Which screen-size did you
prefer the most and why? Did the larger configurations help you in any way? How? They
High-Resolution Gaming 16
responded to the first question in the following ways: Sixteen percent of the participants
preferred the small screen-size over the larger screens. They stated that they were more
familiar with the one-monitor configuration and disliked the bezels in the multi-monitor
configurations. Sixty-three percent of the participants preferred the four screens. The
different reasons follow: Much more of the battlefield could be seen than the one-
monitor configuration. They felt that the nine-monitor configuration was too unfamiliar,
and introduced problems in scalability of the original game's user interface. Twenty
percent of the participants preferred the nine screens. Their reasons were that less
navigation was required, it was easier to interact with their units, and they had a greater
awareness of the map.
In response to the question of whether the larger configurations helped and why,
the vast majority agreed (90%) that it helped. They claimed an increased awareness of the
entire battlefield, easier planning of strategies, and easier to interact with their units.
Notification Systems and Interface Design Issues
Seventy percent of the participants agreed that the notification systems and
controls in the game were harder to use on the nine-monitor configuration and had a
negative impact on their performance. In the game there are several types of notification
systems and controls. Figure 3 shows that there are several buttons as well as a minimap
on the leftmost portion of the screen. On the top panel are several important statistics that
report total resources and units. The bottom panel shows how much a potential unit costs
when the mouse is hovered over the button that creates said unit. In addition, important
messages are printed to the top-left of the viewport of the map.
High-Resolution Gaming 17
All of these controls and notification systems are easy to use when they are close
together. However, when using the nine-monitor display it was difficult for participants
to move their cursor over to the control panel. Following Fitts’ law (Card 1983), it is
more difficult to move the cursor to a target three screens away than it is to move a cursor
to a target on a single screen. Thus, by increasing the distance to the control buttons and
overview, it took participants much longer to accomplish basic game tasks on the nine-
monitor display.
As mentioned above, the notification systems were positioned at the top of the
whole display. Since the notifications were positioned above the participant’s line of
sight on the nine-monitor configuration, they claimed they didn't notice many—if any—
of the alerts in the game. Since participants were not aware of vital events, such as
needing more resources, we speculate that the poor positioning of the interface had an
adverse effect on user satisfaction for the largest configuration.
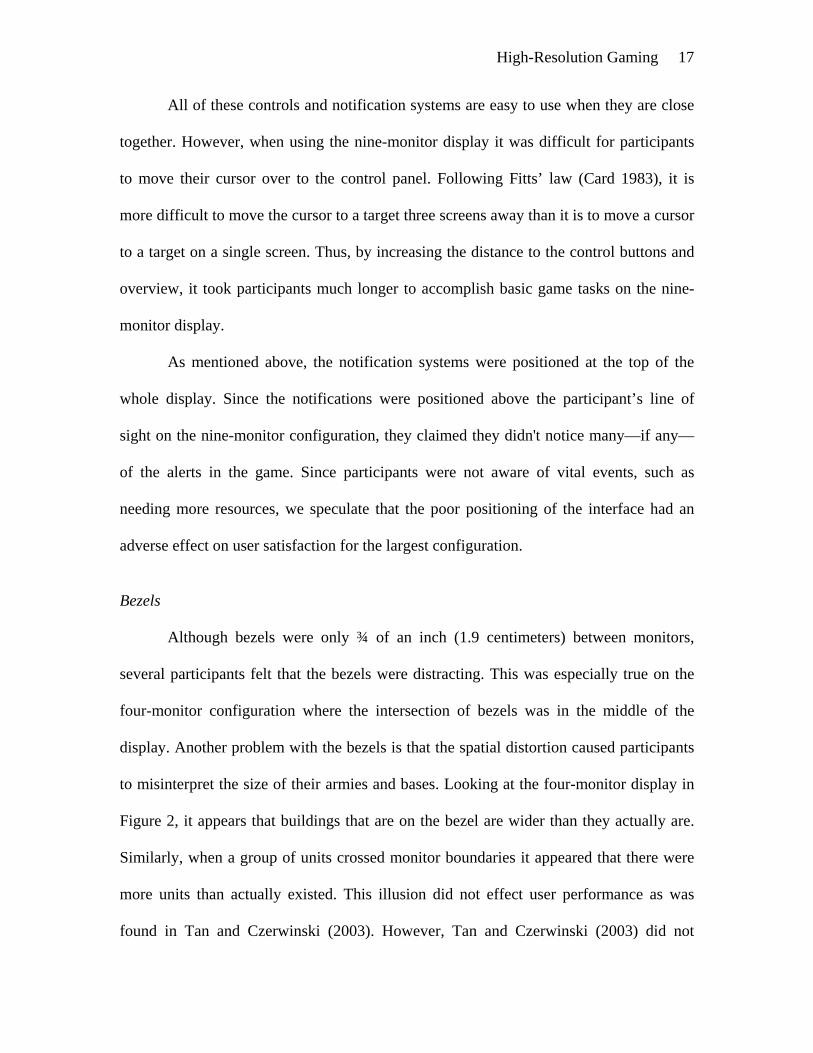
Bezels
Although bezels were only ¾ of an inch (1.9 centimeters) between monitors,
several participants felt that the bezels were distracting. This was especially true on the
four-monitor configuration where the intersection of bezels was in the middle of the
display. Another problem with the bezels is that the spatial distortion caused participants
to misinterpret the size of their armies and bases. Looking at the four-monitor display in
Figure 2, it appears that buildings that are on the bezel are wider than they actually are.
Similarly, when a group of units crossed monitor boundaries it appeared that there were
more units than actually existed. This illusion did not effect user performance as was
found in Tan and Czerwinski (2003). However, Tan and Czerwinski (2003) did not
High-Resolution Gaming 18
identify the distraction reported by our participants. We speculate that the dynamic
changes in the geospatial location of the data were the main causes for this reaction.
Experiment II
The previous experiment demonstrated that large, high-resolution displays
introduce new challenges to the design of interactive systems. As these displays allow
users to have an unprecedented amount of detailed information in their field-of-view,
awareness of peripheral information becomes difficult. The dynamic and fast-paced
environment of most games requires the user to focus attention to multiple areas of the
display in addition to the user interface and notifications. In this experiment we
investigate how we can reduce the problem of maintaining awareness of peripheral
information without inhibiting the advantages of the additional pixels. To solve the
problem of peripheral awareness, we propose bringing the notifications to the cursor
during the game. Previous notification research shows that the ability to detect
notifications in the periphery is significantly reduced the further away it is from the
primary task (Bartram 2003). Since most of the interaction with the game is done via the
mouse, we assumed that this is the user’s area of primary focus. (McFarlane 2002)
introduced four methods for coordinating interruptions which we believe offer four
interesting design solutions for this technique.
Coordination of Interruptions
McFarlane identified four methods to interrupt a user from a primary task:
immediate, negotiated, mediated, and scheduled. We decided to apply this model of
interruption to design notifications for Wargus by developing four different designs for
High-Resolution Gaming 19
bringing information into the user’s focus. Our goal was to discover which design works
best for informing users of important peripheral information on large, high-resolution
displays.
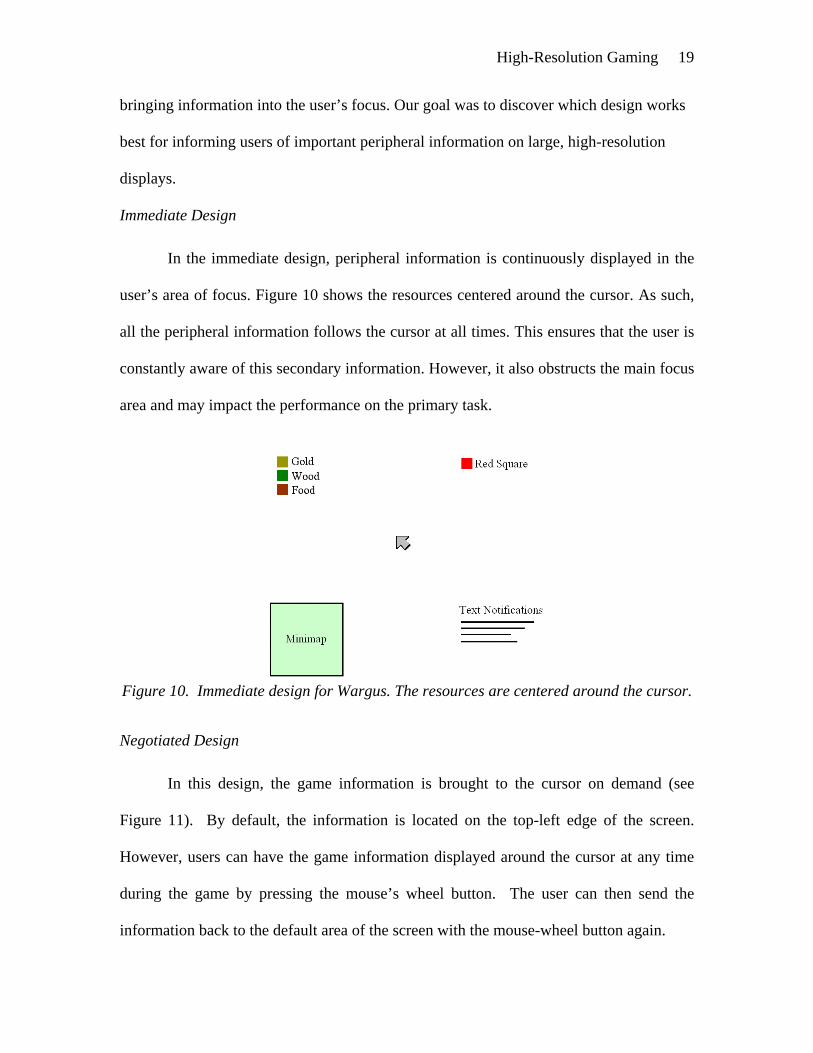
Immediate Design
In the immediate design, peripheral information is continuously displayed in the
user’s area of focus. Figure 10 shows the resources centered around the cursor. As such,
all the peripheral information follows the cursor at all times. This ensures that the user is
constantly aware of this secondary information. However, it also obstructs the main focus
area and may impact the performance on the primary task.
Figure 10. Immediate design for Wargus. The resources are centered around the cursor.
Negotiated Design
In this design, the game information is brought to the cursor on demand (see
Figure 11). By default, the information is located on the top-left edge of the screen.
However, users can have the game information displayed around the cursor at any time
during the game by pressing the mouse’s wheel button. The user can then send the
information back to the default area of the screen with the mouse-wheel button again.
High-Resolution Gaming 20
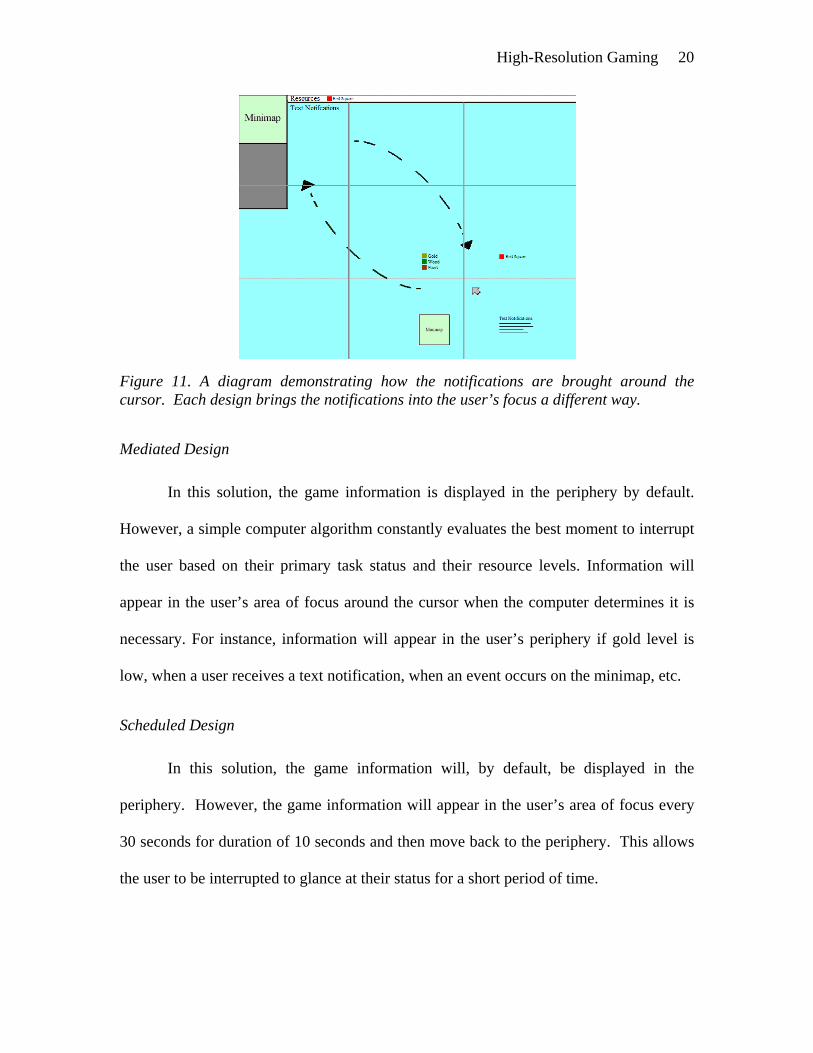
Figure 11. A diagram demonstrating how the notifications are brought around the cursor. Each design brings the notifications into the user’s focus a different way.
Mediated Design
In this solution, the game information is displayed in the periphery by default.
However, a simple computer algorithm constantly evaluates the best moment to interrupt
the user based on their primary task status and their resource levels. Information will
appear in the user’s area of focus around the cursor when the computer determines it is
necessary. For instance, information will appear in the user’s periphery if gold level is
low, when a user receives a text notification, when an event occurs on the minimap, etc.
Scheduled Design
In this solution, the game information will, by default, be displayed in the
periphery. However, the game information will appear in the user’s area of focus every
30 seconds for duration of 10 seconds and then move back to the periphery. This allows
the user to be interrupted to glance at their status for a short period of time.
High-Resolution Gaming 21
Experiment Setup
This second experiment required users to play one-on-one versus a computer
opponent on a single, high-resolution display using the same game discussed in the first
experiment. Each participant played a total of five games using a different notification
design for each game. Participants were given a 30 minute practice round where they
could learn all five designs and re-familiarize themselves with the game. Each participant
played all five designs in differing orders using a Latin square design. A total of 125
games were played.
To more accurately measure user awareness of peripheral information, we added
an additional white square next to the game resources. Users were asked to press the
space bar each time they saw the square’s color change to red. The colored square
followed the same behaviors as other resources in all conditions and was just described as
an additional resource in the game. In the mediated solution, the square would appear
next to the game cursor each time it turned red and was to be interpreted as critical. The
red square appeared at random intervals a total of ten times each game.
For each design condition the following in-game data was tracked and stored for
analysis and will serve as our dependent variables (see Table 3):
Table 3. Lists the dependent variables for the study.
• Game performance (score, game time, number of units killed) • Resource monitoring performance (resource level maintenance) • Red square monitoring performance (square detection)
Each game lasted between 10 and 20 minutes with the total time of the
experiment lasting approximately two hours for each participant. Users were provided a
High-Resolution Gaming 22
sheet of paper showing common hot-keys and keyboard shortcuts used to build units,
give commands, etc. At the end of the experiment, participants were asked to respond to a
questionnaire. The questionnaire consisted of open-ended questions and used a seven-
point Likert scale that enabled them to rate each design several ways.
Participants
We recruited 25 participants that had over 100 hours of experience playing
Warcraft® 2 or a similar real-time strategy game—we considered them to be experts.
There were 24 male participants and one female participant, all with ages between 20 and
23. The user’s had little familiarity with multi-monitor desktops, as they had an average
value of 2.32 on a seven-point Likert scale (with 1 being the least familiar). A small
number of users that participated in Experiment I also participated in this experiment.
However, since the users were required to be experienced players and had only played a
single game on the nine-monitor display, it is unlikely this had an effect on our results.
Hardware
The five different versions of Wargus ran on a display which used a 3x3 matrix of
high-definition, rear projectors. The display provides a virtually seamless screen at a
resolution of 3840x2160 and runs on a high-performance Dell server configured with five
dual-head graphics cards (Figure 12).
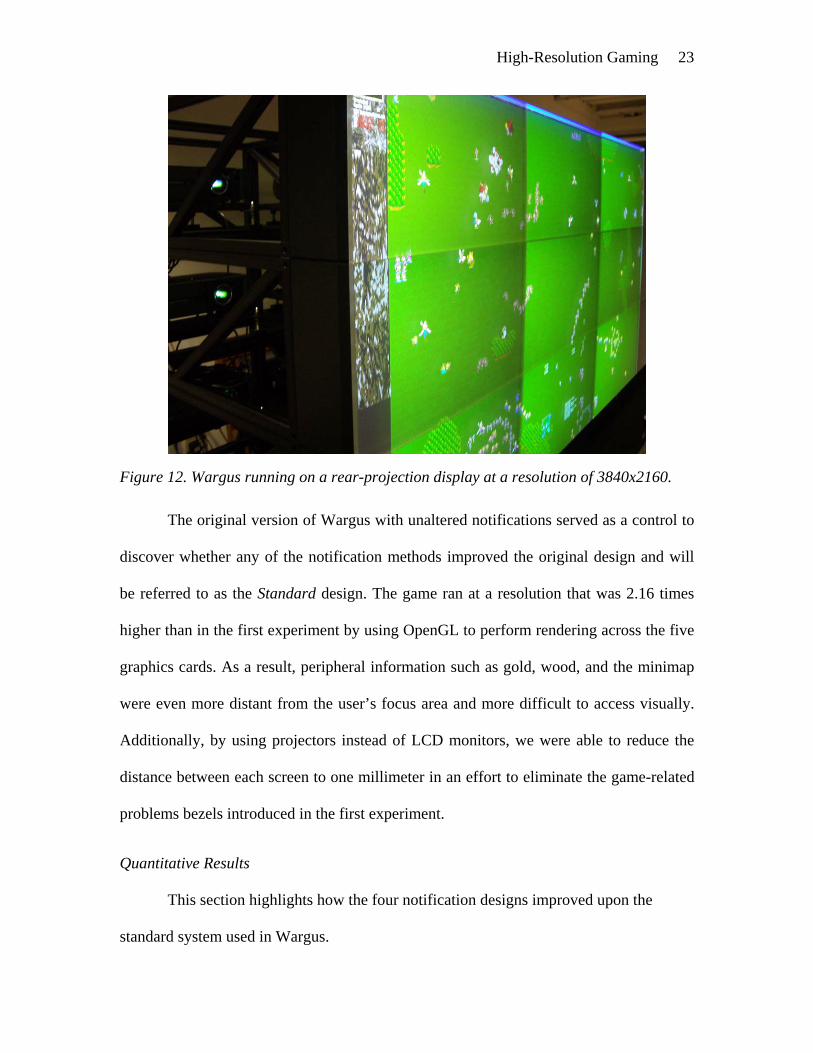
High-Resolution Gaming 23
Figure 12. Wargus running on a rear-projection display at a resolution of 3840x2160. The original version of Wargus with unaltered notifications served as a control to
discover whether any of the notification methods improved the original design and will
be referred to as the Standard design. The game ran at a resolution that was 2.16 times
higher than in the first experiment by using OpenGL to perform rendering across the five
graphics cards. As a result, peripheral information such as gold, wood, and the minimap
were even more distant from the user’s focus area and more difficult to access visually.
Additionally, by using projectors instead of LCD monitors, we were able to reduce the
distance between each screen to one millimeter in an effort to eliminate the game-related
problems bezels introduced in the first experiment.
Quantitative Results
This section highlights how the four notification designs improved upon the
standard system used in Wargus.
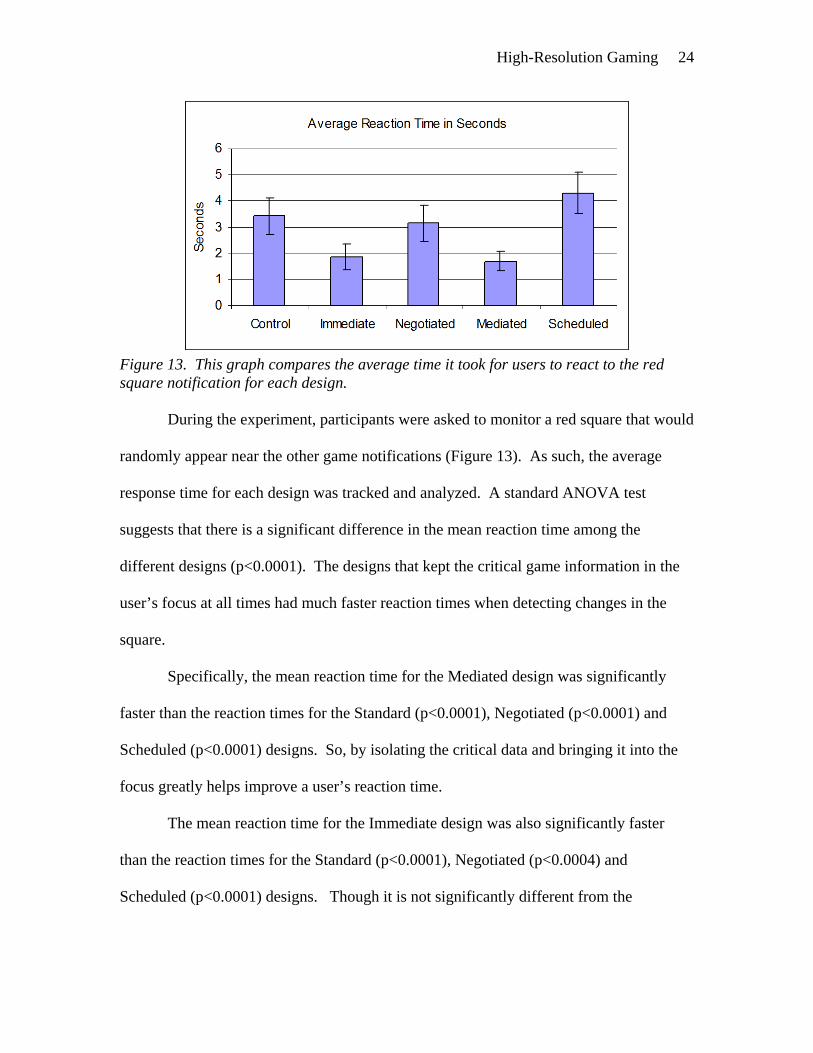
High-Resolution Gaming 24
Figure 13. This graph compares the average time it took for users to react to the red square notification for each design. During the experiment, participants were asked to monitor a red square that would
randomly appear near the other game notifications (Figure 13). As such, the average
response time for each design was tracked and analyzed. A standard ANOVA test
suggests that there is a significant difference in the mean reaction time among the
different designs (p<0.0001). The designs that kept the critical game information in the
user’s focus at all times had much faster reaction times when detecting changes in the
square.
Specifically, the mean reaction time for the Mediated design was significantly
faster than the reaction times for the Standard (p<0.0001), Negotiated (p<0.0001) and
Scheduled (p<0.0001) designs. So, by isolating the critical data and bringing it into the
focus greatly helps improve a user’s reaction time.
The mean reaction time for the Immediate design was also significantly faster
than the reaction times for the Standard (p<0.0001), Negotiated (p<0.0004) and
Scheduled (p<0.0001) designs. Though it is not significantly different from the
High-Resolution Gaming 25
Mediated design, it shares the same benefits in reaction time, even while presenting non-
critical in the focus simultaneously.
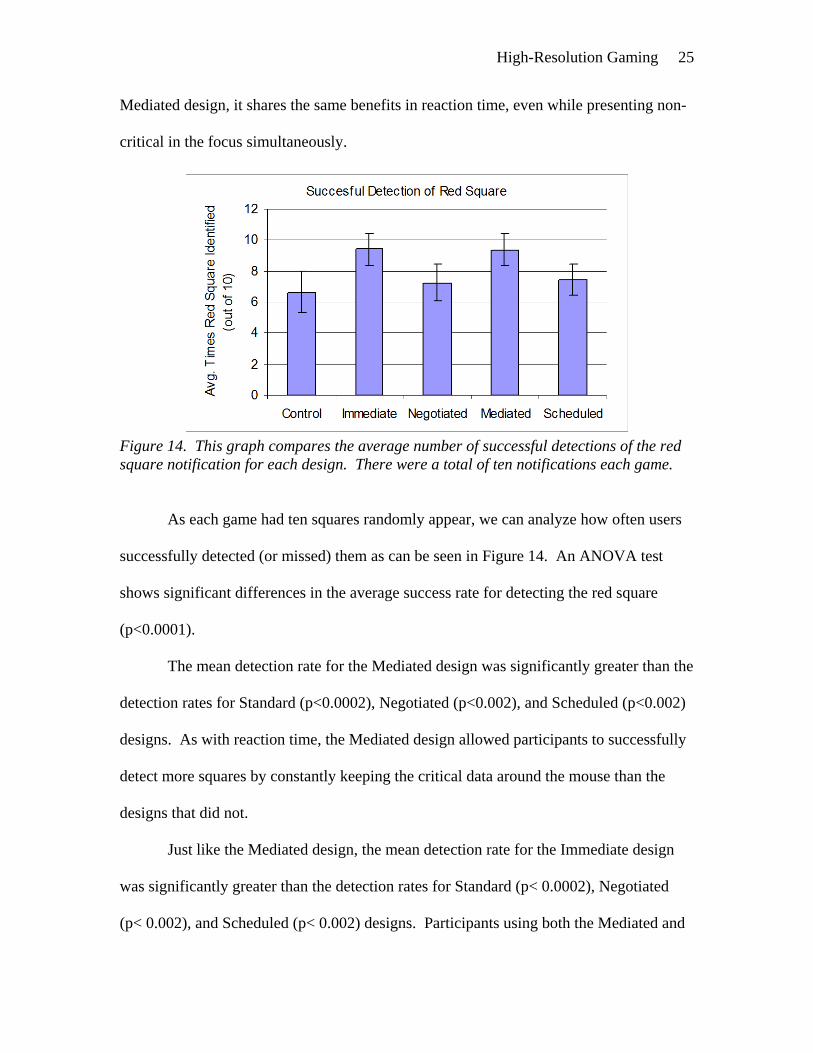
Figure 14. This graph compares the average number of successful detections of the red square notification for each design. There were a total of ten notifications each game.
As each game had ten squares randomly appear, we can analyze how often users
successfully detected (or missed) them as can be seen in Figure 14. An ANOVA test
shows significant differences in the average success rate for detecting the red square
(p<0.0001).
The mean detection rate for the Mediated design was significantly greater than the
detection rates for Standard (p<0.0002), Negotiated (p<0.002), and Scheduled (p<0.002)
designs. As with reaction time, the Mediated design allowed participants to successfully
detect more squares by constantly keeping the critical data around the mouse than the
designs that did not.
Just like the Mediated design, the mean detection rate for the Immediate design
was significantly greater than the detection rates for Standard (p< 0.0002), Negotiated
(p< 0.002), and Scheduled (p< 0.002) designs. Participants using both the Mediated and
High-Resolution Gaming 26
Immediate designs missed less than one red square on average. Just as with the reaction
times, this shows that critical information can be shown along with passive game
information without degradation of awareness.
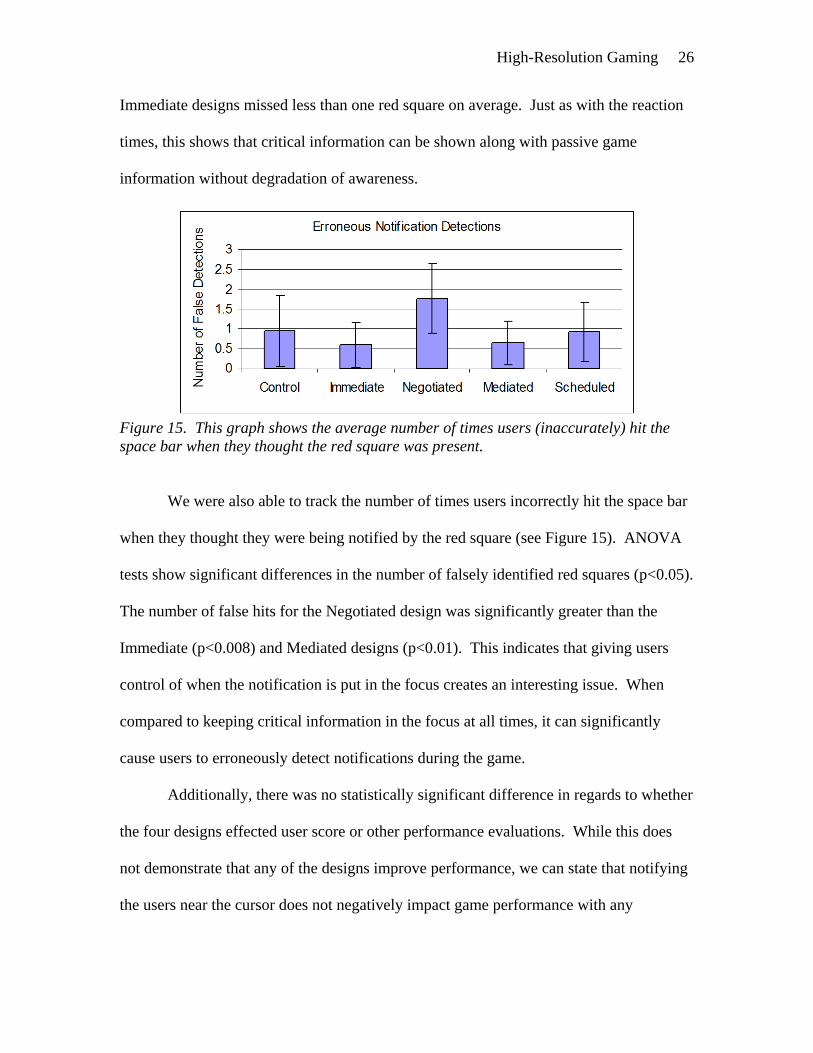
Figure 15. This graph shows the average number of times users (inaccurately) hit the space bar when they thought the red square was present.
We were also able to track the number of times users incorrectly hit the space bar
when they thought they were being notified by the red square (see Figure 15). ANOVA
tests show significant differences in the number of falsely identified red squares (p<0.05).
The number of false hits for the Negotiated design was significantly greater than the
Immediate (p<0.008) and Mediated designs (p<0.01). This indicates that giving users
control of when the notification is put in the focus creates an interesting issue. When
compared to keeping critical information in the focus at all times, it can significantly
cause users to erroneously detect notifications during the game.
Additionally, there was no statistically significant difference in regards to whether
the four designs effected user score or other performance evaluations. While this does
not demonstrate that any of the designs improve performance, we can state that notifying
the users near the cursor does not negatively impact game performance with any
High-Resolution Gaming 27
significance. However, we can show that two of these methods do enhance the user
experience on large, high-resolution displays qualitatively.
Qualitative Results
This section highlights the participants’ reactions to the four methods of
maintaining awareness of peripheral information in comparison to the original game and
each other.
Immediate Design Responses
All of the participants in the study liked how the information was always readily
available without requiring them to divide their attention between different areas of the
screen. They claimed that the design was consistent and reliable, so they always knew
where to access the information they needed. The participants also claimed that the
constant movement with the cursor was initially distracting to game-play, but this
technique helped more than harmed. Users responded to this design in the following
way: 93% felt it improved performance compared to standard design, 20% thought it
was the best for detecting the square, and 24% preferred this design over the others.
Negotiated Design Responses
For this design, participants liked how they could have the information readily
available on demand. Since the game information wasn’t always around the cursor, it
wasn’t as distracting as the Immediate design. However, since the game data was not
always in the user’s focus, they commented that they often missed vital information.
Users responded to this design in the following way: 72% felt it improved performance
High-Resolution Gaming 28
compared to standard design, 8% thought it was the best for detecting the square, and
20% preferred this design over the others.
Mediated Design Responses
By only showing pertinent information, users claimed it was easy to discern the
information that was critical. The design also kept the information around the mouse
uncluttered and it was much less distracting. Most also liked that the information would
go away without any form of interaction. However, users claimed that not being able to
access the data at all times made it very difficult to make higher-level decisions, plan
future actions, and made the design inconsistent. Users responded to this design in the
following way: 76% felt it improved performance compared to standard design, 72%
thought it was the best for detecting the square, and 56% preferred this design over the
others.
Scheduled Design Responses
We found that some users were able to learn when to expect the data to come into
their field of view, but most found it to be unpredictable since they were focused on
playing the game. The design divided their attention, and was highly interruptive at
inappropriate points during the game. The design also caused them to miss critical
information for the periods when it was not mapped to the cursor. Users responded to
this design in the following way: 20% felt it improved performance compared to
standard design, 0% thought it was the best for detecting the square, and 0% preferred
this design over the others.
High-Resolution Gaming 29
General Feedback
With the written feedback received from our questionnaire, we were able to
successfully evaluate how much each notification design effected the user’s experience
playing the game using a seven-point Likert scale. We found that there were no
significant differences in how much the user perceived themselves to be interrupted with
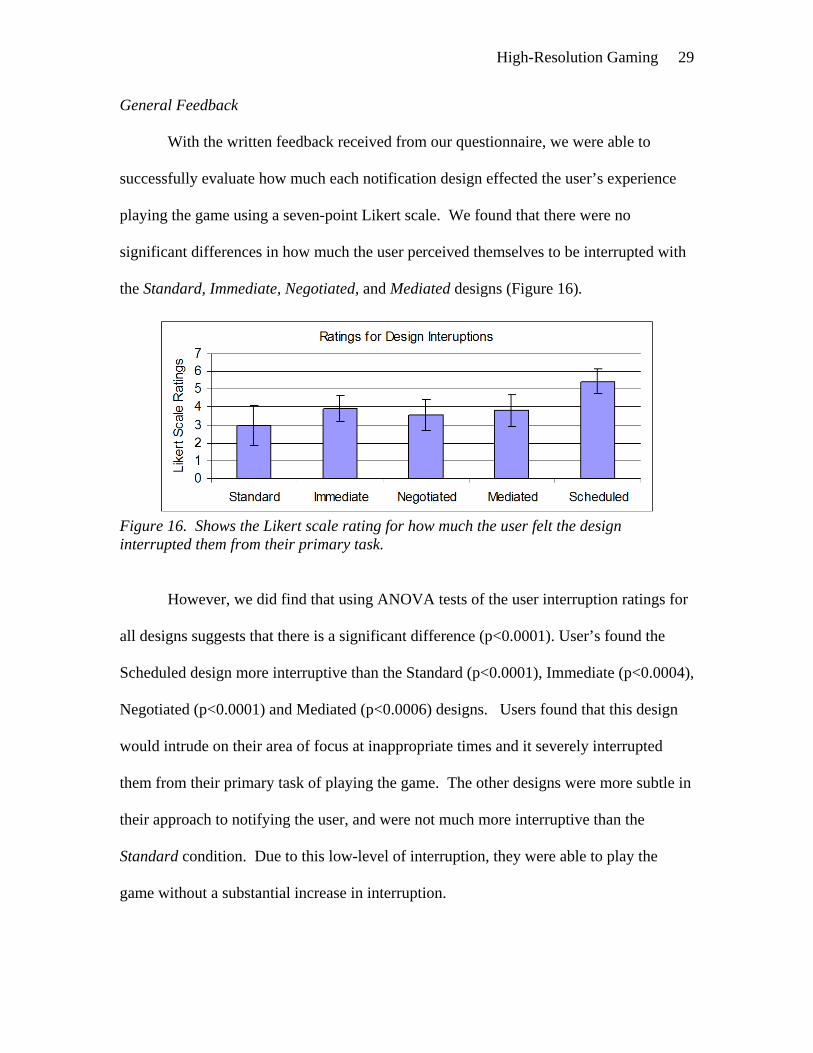
the Standard, Immediate, Negotiated, and Mediated designs (Figure 16).
Figure 16. Shows the Likert scale rating for how much the user felt the design interrupted them from their primary task.
However, we did find that using ANOVA tests of the user interruption ratings for
all designs suggests that there is a significant difference (p<0.0001). User’s found the
Scheduled design more interruptive than the Standard (p<0.0001), Immediate (p<0.0004),
Negotiated (p<0.0001) and Mediated (p<0.0006) designs. Users found that this design
would intrude on their area of focus at inappropriate times and it severely interrupted
them from their primary task of playing the game. The other designs were more subtle in
their approach to notifying the user, and were not much more interruptive than the
Standard condition. Due to this low-level of interruption, they were able to play the
game without a substantial increase in interruption.
High-Resolution Gaming 30
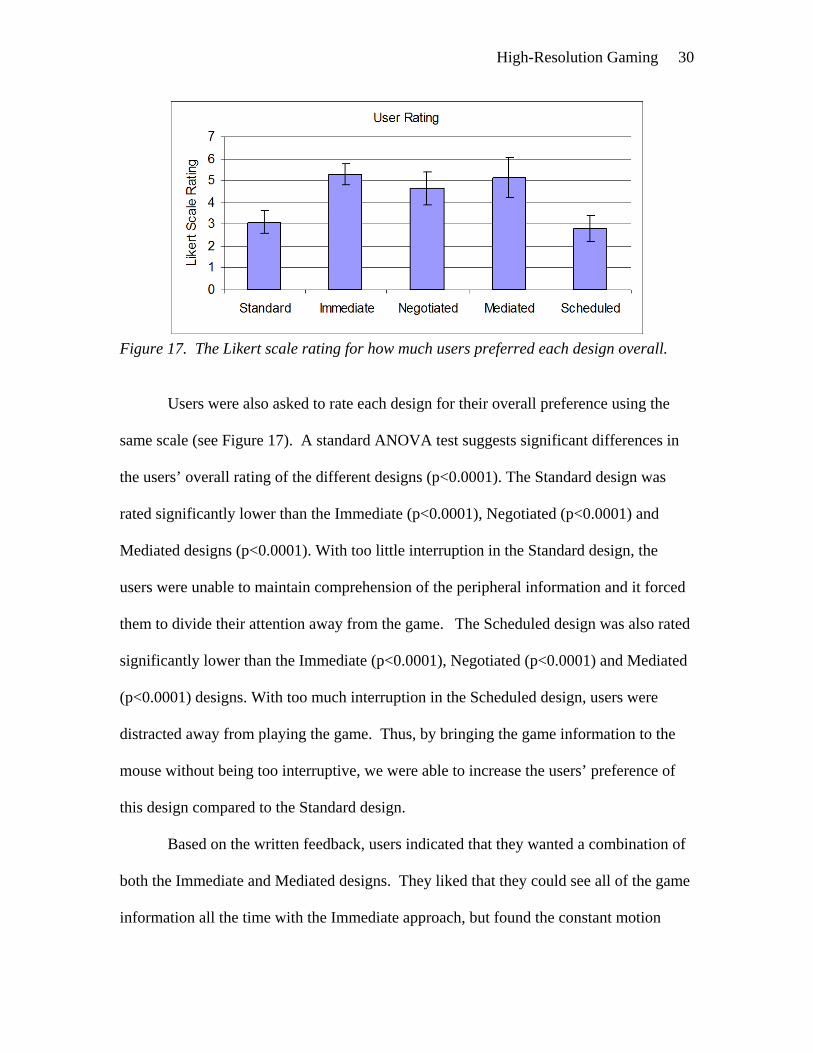
Figure 17. The Likert scale rating for how much users preferred each design overall.
Users were also asked to rate each design for their overall preference using the
same scale (see Figure 17). A standard ANOVA test suggests significant differences in
the users’ overall rating of the different designs (p<0.0001). The Standard design was
rated significantly lower than the Immediate (p<0.0001), Negotiated (p<0.0001) and
Mediated designs (p<0.0001). With too little interruption in the Standard design, the
users were unable to maintain comprehension of the peripheral information and it forced
them to divide their attention away from the game. The Scheduled design was also rated
significantly lower than the Immediate (p<0.0001), Negotiated (p<0.0001) and Mediated
(p<0.0001) designs. With too much interruption in the Scheduled design, users were
distracted away from playing the game. Thus, by bringing the game information to the
mouse without being too interruptive, we were able to increase the users’ preference of
this design compared to the Standard design.
Based on the written feedback, users indicated that they wanted a combination of
both the Immediate and Mediated designs. They liked that they could see all of the game
information all the time with the Immediate approach, but found the constant motion
High-Resolution Gaming 31
distracting. They also liked how the Mediated approach isolated what was interrupting
the user and reduced the amount of information moving around the cursor, but wanted to
be able to see all of the game information in the focus. The Negotiated approach caused
users to miss important data and gave false clues to notifications. Finally, the Scheduled
and Standard designs were respectively too interruptive or not interruptive enough. This
user feedback gave us the data needed to design a notification system specifically for
large, high-resolution gaming displays.
Proposed Interface Design
Based on the results from the two experiments, a new model for designing user
interfaces for large, high-resolution games that use a mouse cursor for interface
interaction can be developed. This section describes our final implementation and
feedback for notifications and the user interface for gaming on these displays.
Visual Notifications
The results from Experiment II show that displaying game information in the
user’s visual focus (near the mouse) does indeed increase their awareness of the game
information. Though users preferred the Mediated design, their awareness was not
significantly different than the Immediate design. Additionally, users claimed that not
being able to see all the information (e.g. gold, wood, minimap, etc.) in their focus
hindered them from planning strategies for the future. Furthermore, mapping information
to the mouse cursor’s constant movements was sometimes very distracting to the user.
Past research also supports this claim in that “motion can contribute strongly to
distraction and irritation” and “traveling motions are more distracting” (Bartram 2003).
High-Resolution Gaming 32
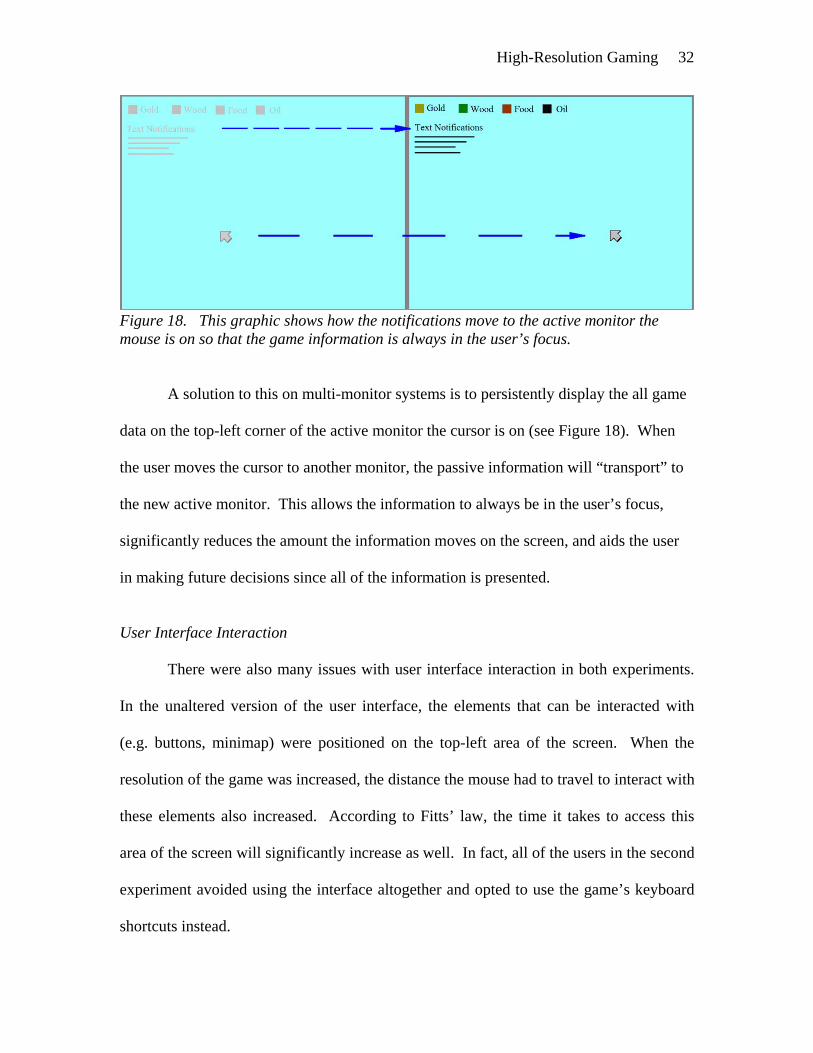
Figure 18. This graphic shows how the notifications move to the active monitor the mouse is on so that the game information is always in the user’s focus.
A solution to this on multi-monitor systems is to persistently display the all game
data on the top-left corner of the active monitor the cursor is on (see Figure 18). When
the user moves the cursor to another monitor, the passive information will “transport” to
the new active monitor. This allows the information to always be in the user’s focus,
significantly reduces the amount the information moves on the screen, and aids the user
in making future decisions since all of the information is presented.
User Interface Interaction
There were also many issues with user interface interaction in both experiments.
In the unaltered version of the user interface, the elements that can be interacted with
(e.g. buttons, minimap) were positioned on the top-left area of the screen. When the
resolution of the game was increased, the distance the mouse had to travel to interact with
these elements also increased. According to Fitts’ law, the time it takes to access this
area of the screen will significantly increase as well. In fact, all of the users in the second
experiment avoided using the interface altogether and opted to use the game’s keyboard
shortcuts instead.
High-Resolution Gaming 33
The Standard interface design required users to move the cursor up to three
screens vertically and horizontally to interact with the game controls and only becomes
worse as more monitors are added. For this reason, we designed two new interaction
techniques to be used in mouse-based games to decrease the distance the user must move
the mouse to access the user interface.
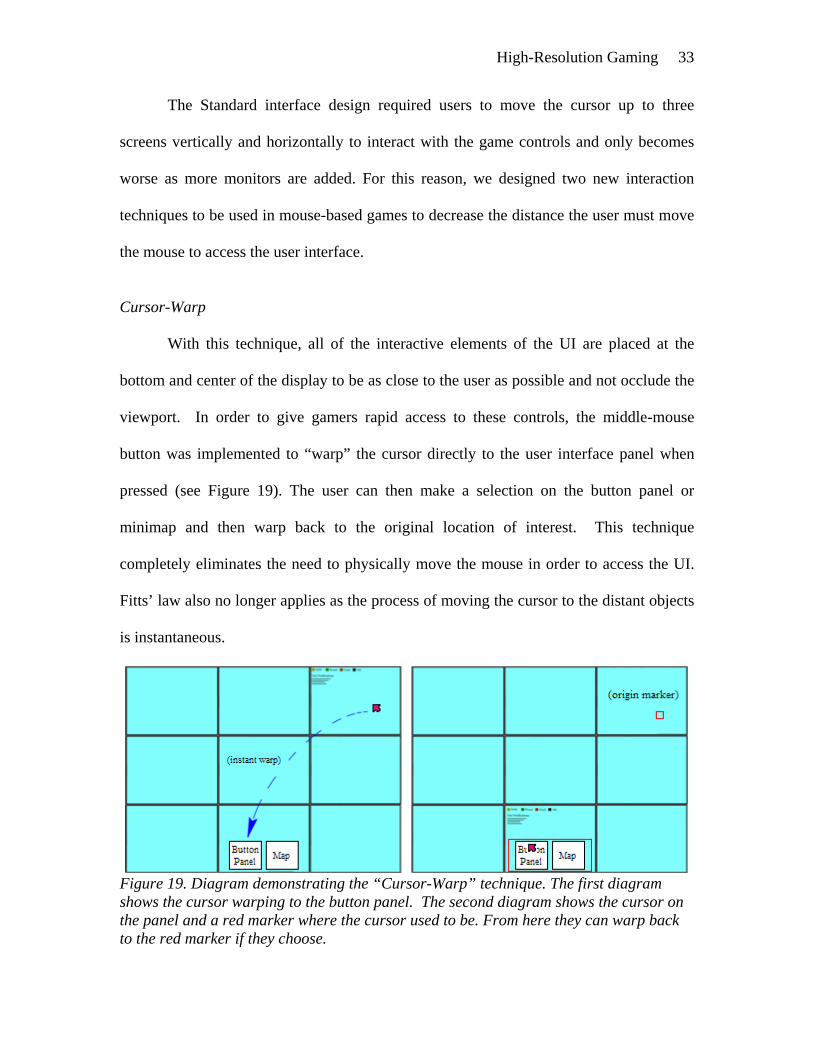
Cursor-Warp
With this technique, all of the interactive elements of the UI are placed at the
bottom and center of the display to be as close to the user as possible and not occlude the
viewport. In order to give gamers rapid access to these controls, the middle-mouse
button was implemented to “warp” the cursor directly to the user interface panel when
pressed (see Figure 19). The user can then make a selection on the button panel or
minimap and then warp back to the original location of interest. This technique
completely eliminates the need to physically move the mouse in order to access the UI.
Fitts’ law also no longer applies as the process of moving the cursor to the distant objects
is instantaneous.
Figure 19. Diagram demonstrating the “Cursor-Warp” technique. The first diagram shows the cursor warping to the button panel. The second diagram shows the cursor on the panel and a red marker where the cursor used to be. From here they can warp back to the red marker if they choose.
High-Resolution Gaming 34
A few additional features needed to be implemented to make the design more
intuitive. First, immediately after a user warps the cursor to the interface, a red animated
square is placed at the original location of the cursor. This indicates to the user where the
cursor will appear when they warp back. By using animation in the periphery, the user
can more effectively maintain awareness (Bartram 2003) of their original position.
Additionally, a box was drawn around the area of the user interface that can be warped to.
When the user moved the cursor outside of this box, both the box and the red blinking
marker disappear. This feature was implemented when we discovered that users did not
always want to warp the cursor back after interacting with the UI. This is to make it clear
to the user that when they manually leave the interface without warping, and then attempt
to warp, the cursor will be placed back on the UI.
There also were interesting side-effects that were observed in user testing of this
design. For instance, users would often use the cursor warp when they wanted to move
from one side of the display to the next as it essentially divided the distance they had to
move the mouse in half. Additionally, many users claimed that this design would also
benefit interaction with game interfaces of the computer games they currently play.
UI -Warp
We also designed another technique to give the user rapid access to the button
panel and minimap. This design takes a similar approach to the Drag-and-Pop and Drag-
and-Pick techniques for styluses and touch panels (Baudisch 2003). However, the UI-
Warp design focuses on button-panel and overview interaction in applications with a
standard mouse. By clicking the middle-mouse button, the interface will warp from the
bottom-center monitor to the same relative location on the monitor the cursor is on. A
High-Resolution Gaming 35
second click of the middle-mouse button will warp the UI back to its original location at
the bottom of the screen. Using this method, the user is still required to move the cursor
to the interface after each warp as they would on a single-monitor display—but the
distance traveled is greatly reduced.
While access is not instantaneous as with the Cursor-Warp, this design has two
main advantages. First, by bringing the interface to current area of focus, there user’s
attention is not divided and they can concentrate on their primary task. Second, it gives a
simple and intuitive mechanism to place the user interface on the screen they prefer. For
instance, if a user is building a base on the top-right screen and is interacting with the
button panel frequently, they can warp the panel to that screen until the task is completed.
Gaming Display Systems and Scalability
There are various ways to construct displays with higher resolutions. One such
approach is IBM’s “Big Bertha” monitor which has a resolution of 3840x2400 and looks
similar to a traditional LCD display. While displays constructed in this fashion will come
down in price in the near future, they cost several orders of magnitude more than current
monitors. Our approach expands on the concept of the multi-monitor desktop and—with
some minor tradeoffs—is a comparatively inexpensive approach to increasing resolution.
The two experiments conducted each used a 3x3 matrix of nine monitors
connected to a single personal computer. The computer had five dual-head graphics
cards used to render the OpenGL graphics. The first experiment used conventional 17-
inch (43.2 centimeter) Dell monitors with bezels ¾ inches (1.9 centimeters) wide. The
second experiment used configurable rear projectors instead of LCD screens. While this
approach costs more, the bezel size was reduced to one millimeter in width and
High-Resolution Gaming 36
dramatically reduced the bezel issues encountered in the first experiment. However, most
personal computers are limited to five or six PCI slots, so even with dual-head graphics
cards, the hardware can only support up to twelve monitors. Additionally, there is a
software limitation as Microsoft Windows® can only support up to ten monitors by
default. Even if more monitors could be added, current upper-end desktop computers do
not have sufficient processing power to drive them.
In order to circumvent these limitations, we constructed a twelve-node Linux
cluster. Each node was a standard Dell desktop computer with a dual-head graphics card
to create a twenty-four monitor display (see Figure 20). The cluster uses the open-source
Chromium software package to distribute the OpenGL graphics across a gigabit internal
network to each of the nodes (Chromium). Using this approach, fast-paced 3D games
such as Quake 3 and flight simulators can be played fluidly and in real-time at resolutions
of 10240x3072. Although most consumers and gamers cannot afford the nine- or twenty-
four monitor display systems we’ve constructed, our results and related work (e.g.
[productivity – Czerwinski]) show that even having two monitors can be a huge gain in
both performance and user satisfaction. The main benefit of these multi-monitor systems
is their scalability. Gamers generally can afford one or two additional monitors and can
continue to add more screens to their system as desired.
Form Factors and Input Devices
As was mentioned in previous the section, we were able to play Quake 3 Arena at
a resolution of 10240x3072 on a configurable, multi-monitor display. Unlike games that
use a mouse-based user interface, first-person shooters and flight simulators do not suffer
from the same interface issues at high resolutions. In the case of Quake 3, only the
High-Resolution Gaming 37
values for ammo, health, and armor need to be displayed. By scaling them with the
resolution and display size they can be observed quickly and accurately. Without user
interface drawbacks, we were able to investigate other methods of enhancing the user
experience for gaming on these displays.
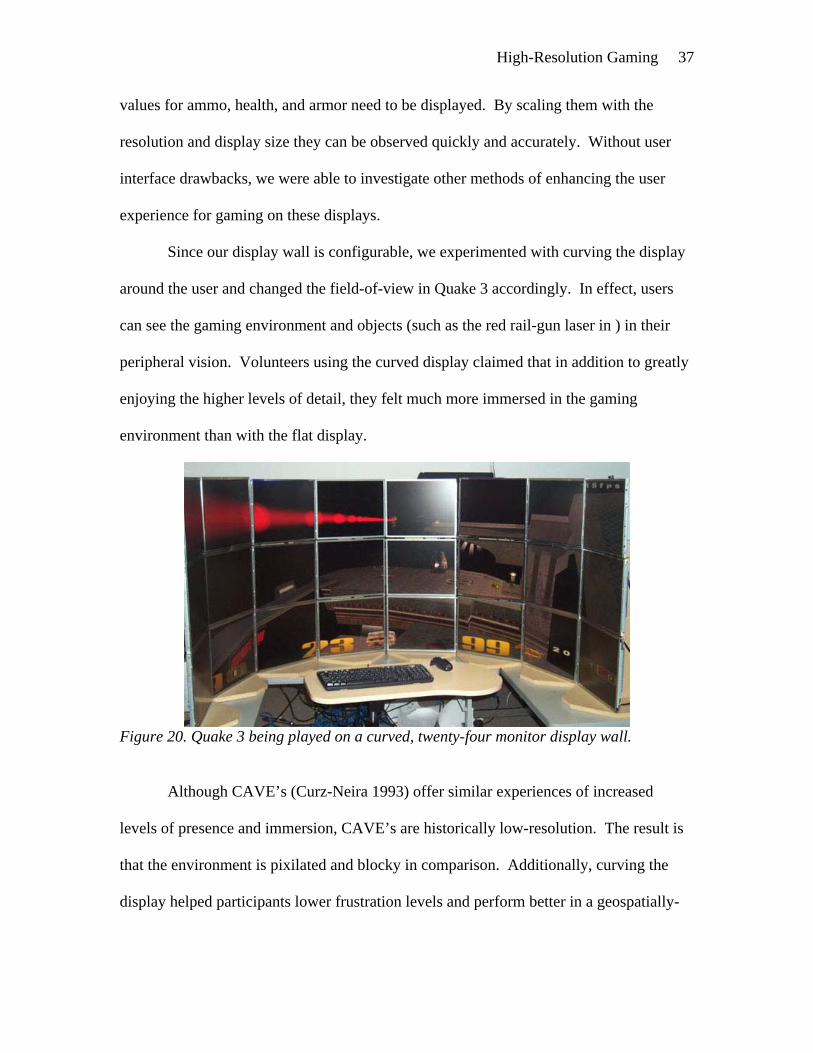
Since our display wall is configurable, we experimented with curving the display
around the user and changed the field-of-view in Quake 3 accordingly. In effect, users
can see the gaming environment and objects (such as the red rail-gun laser in ) in their
peripheral vision. Volunteers using the curved display claimed that in addition to greatly
enjoying the higher levels of detail, they felt much more immersed in the gaming
environment than with the flat display.
Figure 20. Quake 3 being played on a curved, twenty-four monitor display wall. Although CAVE’s (Curz-Neira 1993) offer similar experiences of increased
levels of presence and immersion, CAVE’s are historically low-resolution. The result is
that the environment is pixilated and blocky in comparison. Additionally, curving the
display helped participants lower frustration levels and perform better in a geospatially-
High-Resolution Gaming 38
oriented experiment regardless of the viewport size (Shupp 2006). Intuitively, by curving
a large display the pixels are brought closer to the user and less detail is lost.
There are many benefits to playing first-person shooters on large, high-resolution
displays, but there are also some issues that need to be resolved. First, while none of the
volunteers initially complained about the bezels between the monitors, when asked about
them most said they would prefer the gaps to be smaller. Also, the increased tempo of
most first-person shooters on twenty-four monitors created too much rapidly changing
detail for players to take in for extended periods of time. As a result, users—even
experienced Quake 3 Arena players—got slightly dizzy after about an hour of gaming,
especially when they were standing too close to the screen. However, this did not appear
to be a problem with slower-paced games with similar detail levels.
In addition to curving the display, we found that certain interactive devices were
more appropriate for use with multi-monitor walls compared to single-monitor desktop
displays. One option for interacting with the displays in a gaming environment is via a
touch-screen interface combined with voice-commands (Tse 2006). However, this
method does not translate well to simulations, first-person shooters, and other game
genres. Instead, we had volunteers use and compare both a gyration mouse and an
optical mouse. A gyration mouse is a wireless mouse that can be used without the need
of a flat table surface (see Figure 21). When holding the device, it tracks the user’s hand
movement in 3D-space with a gyroscope—resulting in an experience similar to wielding
a pistol when used with a first-person shooter. We hypothesized that the gyration mouse
would be a very natural fit for our display since it would allow gamers to exploit the full

High-Resolution Gaming 39
range of motion of their hand/arm and they wouldn’t be restricted by the smaller size of a
single monitor.
Figure 21: Quake 3 being played on a flat 24-monitor display wall with a gyro mouse. Users were asked to play several rounds of Quake 3 on the display wall with each
mouse. All of the volunteers noted that they used an optical mouse daily and none had
ever used a gyration mouse. As a result, when they used gyro mouse there was a steep
initial learning curve in comparison to the optical mouse. However, after playing with
both devices, all of the users preferred using the gyration mouse even though their
performance decreased substantially in comparison to the optical mouse. Surprisingly,
users did not experience hand and arm fatigue, even after about an hour of play-time,
with the gyro mouse as we expected—though this is still likely to occur after extended
periods of play.
Real-World Applications
In addition to gaming, large displays have potential to improve in other areas of
computing as well. The higher resolutions will allow flight and training simulators to be
much more realistic and effective. Moreover, many control rooms are being outfitted
High-Resolution Gaming 40
with tiled, high-resolution display walls and workspaces as the cost of hardware
continues to decrease. Some of these control room scenarios include: military command
and control, satellite image analysis, emergency response coordination, power grid and
infrastructure management, traffic analysis, and global weather monitoring.
By using video games on these displays, we were also able to successfully
identify potential user interface and notification system issues for mouse-based computer
games. As the majority of applications use a very similar control-button interface, the
same issues would also occur when these applications are scaled to much higher
resolutions. These issues include accessing distant interface objects and visually
notifying the user without hindering their primary task. By using traditional usability
studies to evaluate new game interface ideas, we were able to design solutions to not only
solve these problems in gaming, but can be translated to real-world applications as well.
Conclusion
By performing a controlled usability experiment, we were able to determine that
users perform better and prefer high-resolution, multi-monitor displays while playing a
real-time, strategy game. Participants scored an average of 20% higher and won over
twice as many games when using the larger displays. The improved participant
performance is evidence of greater engagement, immersion, and focus, with less
distraction by tedious interface controls such as navigating.
We were also able to identify the user interface issues that arose on the larger
display configurations. With 70% of participants complaining about these issues, the
problem was worse than expected. Participants using the nine-monitor configuration
could not effectively use the overview, see vital notifications, or interact with control
High-Resolution Gaming 41
buttons since they were placed on the far top-left edges of the screen. This required users
to constantly observe the very top of the display for notifications and move their cursor
across multiple monitors to accomplish simple tasks.
By conducting another experiment, we were able to compare four different
approaches for solving the problem of visual notifications being too far in the periphery
by bringing them to the mouse. We analyzed these approaches and found that users
preferred to always have the game information in the area of the mouse cursor in a
manner that was not significantly more interruptive than the standard game interface. It
was also found that this method increased awareness by improving reaction times and
successful detections of game notifications. It’s also interesting to note that by giving the
user control of when notifications should be in the focus caused more misinterpretations
of the information than the other techniques.
Using the results from these two experiments, we were able to design a new
notification system and greatly reduce overhead when interacting with button panels on
high-resolution displays. The notifications now “transfer” to the active monitor that the
cursor is moved to, keeping all the information in focus without being too distracting.
The Cursor-Warp interaction technique allows uses to instantaneously interact with the
button panel and minimap by warping the mouse to these locations on demand. The UI-
Warp technique accomplishes these same goals without dividing the attention of the user,
but requires slightly more mouse movement than the Cursor-Warp.
We also discussed the hardware issues and scalability of multi-monitor gaming
systems, as well as identified different form-factors and input devices that can improve
the user experience on these displays. By having volunteers play Quake 3 on a curved,
High-Resolution Gaming 42
multi-monitor display with a gyration mouse, we found that—even though they
performed notably worse with the new mouse—they had a much more enjoyable
experience playing on the setup compared to a traditional mouse and a single-monitor
desktop.
We found that while users welcomed the dramatic increase in detail, using the
displays also had distinct measurable benefits such as higher scores, less virtual
navigation, and greater awareness. With the introduction of new interaction techniques
and input devices inspired by these displays, gamers could further enjoy the benefits of
multi-monitor gaming. Overall, we found that large, high-resolution displays greatly
enhanced the gaming experience and we hope that this research will inspire new, high-
resolution display systems, higher quality graphics—and more importantly—innovative
new game-play.
References
Ball, R., North, C., 2005. An analysis of user behavior on high-resolution tiled displays.
In: Interact 2005 Tenth IFIP TC13 International Conference on Human-Computer
Interaction. pp. 350-363.
Ball, R., North, C., 2005. Effects of tiled high-resolution display on basic visualization
and navigation tasks. In: Extended abstracts of CHI '05. pp. 1196-1199.
Ball, R., Varghese, M., Carstensen, B., Cox, E. D., Fierer, C., Peterson, M., North, C.,
2005. Evaluating the benefits of tiled displays for navigating maps. In:
Proceedings of IASTED-HCI 2005.
Bartram L., Ware, C., Calvert, T., 2003. Moticons: detection, distraction, and task. In:
International Journal of Human-Computer Studies.
High-Resolution Gaming 43
Baudisch, P., Cutrell, E., Robertson, G., 2003. High-density cursor: A visualization
technique that helps users keep track of fast-moving mouse cursors. In:
Proceedings of Interact 2003. Zurich, Switzerland, pp. 236-243.
Baudisch P, et al. Drag-and-Pop and Drag-and-Pick: Techniques for Accessing Remote
Screen Content on Touch-and Pen-operated Systems. INTERACT 2003; 57-64.
Benko, H., Feiner, S., April 2005. Multi-monitor mouse. In: Extended Abstracts of CHI
'05. Portland, Oregon, pp. 1208-1211.
Card, S., Moran, T., Newell, A., 1983. The Psychology of Human-Computer Interaction.
Lawrence Erlbaum Associates, ISBN: 0898598591.
Chromium. http://chromium.sourceforge.net/
Cruz-Neira, C., Sandin, D., and DeFanti, T. 1993. Surround-screen projection-based
virtual reality:The design and implementation of the cave. ACM SIGGRAPH ‘93.
Czerwinski, M., Smith, G., Regan, T., Meyers, B., Robertson, G., Starkweather, G.,
2003. Toward characterizing the productivity benefits of very large displays. In:
Proceedings of Interact 2003.
Czerwinski, M., Tan, D., Robertson, G., 2003. Women take a wider view. In:
Proceedings of CHI '02. pp. 195-201.
Guimbretire, F., Stone, M., Winograd, T., 2001. Fluid interaction with high-resolution
wall-size displays. In: Proceedings of UIST 2001. ACM, pp. 21-30.
Hutchings, D. R., Stasko, J., 2004. Revisiting display space management: Understanding
current practice to inform next-generation design. In: Graphics Interface 2004.
Canadian Human-Computer Communications Society, pp. 127-134.
High-Resolution Gaming 44
Lin, J. J.-W., Duh, H. B., Parker, D. E., Abi-Rached, H., Furness, T. A., 2002. Effects of
view on presence enjoyment, memory, and simulator sickness in a virtual
environment. In: Proceedings of IEEE Virtual Reality.
Mackinlay, J. D., Heer, J., 2004. Wideband displays: Mitigating multiple monitor seams.
In: Proceedings of CHI '04. Vienna, Austria, pp. 1521-1524.
McFarlane, Daniel C. 2002. Comparison of Four Primary Methods
for Coordinating the Interruption of People in Human-Computer Interaction.
Human-Computer Interaction 17:1, 63-139.
Mynatt, E. D., Igarashi, T., Edwards, W. K., LaMarca, A., 1999. Flatland: New
dimensions in office whiteboards. In: Proceedings of CHI '99. pp. 346-353.
Ni, T., Bowman, D., and Chen, J. 2006. Increased Display Size and Resolution Improve
Task Performance in Information-Rich Virtual Environments. Graphics Interface
(GI) 2006, pp. 139-146.
Pedersen, E. R., et al. 1993. Tivoli: An electronic whiteboard for informal workgroup
meetings. In: Proceedings of CHI '93. pp. 391-398.
Simmons, T., Fall 2001. What's the optimum computer display size? Ergonomics in
Design, 19-25.
Shupp, L., et al. 2006. Evaluation of Viewport Size and Curvature of Large, High-
Resolution Displays. Graphics Interface (GI) 2006, pp. 123-130.
Tan, D., Czerwinski, M., Robertson, G., 2003a. Women go with the (optical) flow. In:
Proceedings of CHI '03. pp. 209-215.
Tan, D., et al. April 2003b. With similar visual angles, larger display improve spatial
performance. In: Proceedings of CHI '03. pp. 217-224.
High-Resolution Gaming 45
Tan, D., Gergle, D., Scupelli, P. G., Pausch, R., April 2004. Physically large displays
improve path integration in 3d virtual navigation tasks. In: Proceedings of CHI
'04. pp. 439-446.
Tan, D., Stefanucci, J. K., Proffitt, D., Pausch, R., 2001. The infocockpit: providing
location and place to aid human memory. In: Proceedings of PUI '01. pp. 1-4.
Tan, D. S., Czerwinski, M., November 2003. Effects of visual separation and physical
discontinuities when distributing information across multiple displays. In:
Proceedings of OZCHI03 (Australian Computer Human Interaction Conference).
Brisbane, Australia, pp. 184-191.
Tse, E., Greenberg, S., Shen, C. & Forlines, C., 2006. Multimodal Multiplayer Tabletop
Gaming. Proceedings Third International Workshop on Pervasive Gaming
Applications (PerGames'06).