application of geoinformation technology for …
TRANSCRIPT

APPLICATION OF GEOINFORMATION TECHNOLOGY FOR EVALUATION
OF CASSAVA PLANTATIONS: A CASE STUDY OF BANTEAY
MEANCHEY PROVINCE, CAMBODIA
SOPHEAK PEN
A THESIS SUBMITTED IN PARTIAL FULFILLMENT OF
THE REQUIREMENTS FOR THE MASTER DEGREE OF
GEOINFORMATICS
FACULTY OF GEOINFORMATICS
BURAPHA UNIVERSITY
APRIL 2016
COPYRIGHT OF BURAPHA UNIVERSITY

The thesis of Sopheak Pen has been approved by the examining committee
to be partial fulfillment of the requirement for the Master Degree of Science Program
in Geoinformatics of Burapha University
Advisorv Committee
(Dr. Supan Karnchanasutham)
1as socr/af66ofdrro, Dr. Kaew Nualchawee)
Co-advisor
This thesis has been approved by the Faculty of Geoinformatics to be partial
fulfillment of the requirements for the Master Degree of Science Program in
Geoinformatics of Burapha University
(Dr. Supan Karnchanasutham)
APRIL.2016
ean of the Facultv of Geoinformatics

This study
I would like to express my sincere gratitude and deepest appreciation to Her Royal
Highness Princess Mahachakri Sirindhorn, who provided the scholarship for me to
study at Burapha University, 2549.

ACKNOWLEDGEMENTS
First of all, I would like to express my sincere gratitude and deepest
appreciation to Her Royal Highness Princess Mahachakri Sirindhorn, who provide the
scholarship for me to study at Burapha University.
I would like to express my special gratitude and deep appreciation to
Dr. Supan Karnchanasutham, Assoc. Prof. Dr. Kaew Nualchawee, Dr. Narong
Pleerux, who always kindly helped me to minimize difficulties, for their guidance and
valuable advice throughout this study.
I would like to thank Mr. Preecha Boonkhaw and Mr. Narathip Phengphit
who helped and facilitated in the process of data collection for their valuable advice
and assistance on technique.
I am very grateful to all the professors and members of the Faculty of
Geoinformatics who helped and supported me while I was studying here.
Finally, I would like to express my deepest gratitude to my beloved mother,
Nget Eng, and father, Pen Chhoern, who always give me the warmest and greatest
love and support. Unforgettablely, I offer special thanks to all my relatives and
friends for their help and encouragement.
Sopheak Pen

56910038: MAJOR: GEOINFORMATICS; M.Sc. (GEOINFORMATICS)
KEYWORDS: GEOINFORMATION TECHNOLOGY/ CLASSIFICATION/
CASSAVA
SOPHEAK PEN: APPLICATION OF GEOINFORMATION
TECHNOLOGY FOR EVALUATION OF CASSAVA PLANTATIONS: A CASE
STUDY OF BANTEAY MEANCHEY PROVINCE, CAMBODIA. ADVISORY
COMMITTEE: SUPAN KARNCHANASUTHAM, D.Tech.Sc., KAEW
NUALCHAWEE, Ph.D., NARONG PLEERUX, Ph.D. 70 P. 2015.
Cassava is currently the most important upland crop of Cambodia. It is an
agricultural product that can be processed into various other products such as ethanol,
animal feed and cassava starch or flour for human consumption. The objectives of this
research were to: (1) classify the cassava plantation areas in Banteay Meanchey
Province, Cambodia using LANDSAT 8 (OLI) and SMMS (HJ-A1) images, and: (2)
compare the cassava plantation areas between LANDSAT 8 (OLI) and SMMS (HJ-
A1). The Maximum likelihood classification technique was applied to this research.
Land use types were evaluated into seven classes: cassava, field crop, forest, water,
perennial tree/fruit tree, rice and urban.
The results revealed that the cassava areas from LANDSAT 8 (OLI) were
83,757.37 hectares or 13.54 % of the study area. Meanwhile, the cassava areas from
SMMS (HJ-A1) were 97,215.33 hectares or 15.72 % of the study area. The overall
accuracy of LANDSAT 8 (OLI) and SMMS (HJ-A1) was 81.48 % and 75.56 %
respectively. Therefore LANDSAT 8 (OLI) can be used to classify land use/land
cover with higher accuracy than SMMS (HJ-A1).
.
ABBREVIATIONS
GPS Global Positioning System
GIS Geographic Information Systems
RS Remote Sensing
FAO Food and Agriculture organization
HJ-1A Huan Jing 1A
MAFF Cambodian Ministry of Agriculture Fish.
SMMS Small Multi-Mission Satellite
USGS United States Geological Survey
UTM Universal Transverse Mercator

CONTENTS
Page
ACKNOWLEDGMENT iv
ABSTRACT v
CONTENTS vi
LIST OF TABLES viii
LIST OF FIGURES ix
CHAPTER
1. INTRODUCTION 1
Introduction 1
Statement and Significant of the problem 3
Objectives of the Study 4
Scope of Study 4
The Study Area 4
Benefits of the Study 5
2. LITERATURE REVIEW 7
Cassava 7
Cassava production in Cambodia 8
Cultivation Practices 9
Geographic Information System 10
Remote sensing 15
Huanjing-1A (HJ-1A) 17
Orbit Characteristics of HJ-1A 19
LANDSAT 8 (OLI) 20
Global Positioning System (GPS) 22
Literature Review 24
3 RESEARCH METHODOLOGY 28
Geocorrection of LANDSAT imagery 30
Data exploration and preprocessing 31
Collecting training samples 32
Evaluating training samples 33

vii
Creating the signature file 34
Examining the signature file 34
Editing the signature file 34
Applying classification 34
Post-classification processing 35
Equipment of Analysis 36
4 RESULTS 38
Land use from SMMS (HJ-A1) 38
Land use from LANDSAT 8 (OLI) 41
Land use comparison of SMMS (HJ-A1) and LANDSAT 8 (OLI) 45
Values accuracy of model 46
5 DISCUSSION, CONCLUSION AND RECOMMENDATION 49
Discussion 49
Conclusion 50
Recommendation 51
REFERENCES 52
APPENDIX 57
ABBREVIATIONS 60
BIOGRAPHY 61

LIST OF TABLES
Tables Page
2-1 Payload Parameters 19
2-2 Orbit parameters 19
2-3 LANDSAT 8 spectral band/wavelengths 21
2-4 Composition Band 22
3-1 Used software 37
4-1 Land use of Banteay Meanchey province from SMMS (HJ-A1) 2015 39
4-2 Land use of Banteay Meanchey province from LANDSAT 8 (OLI) 42
4-3 Comparison of land use in Banteay Meanchey province by LANDSAT 8
(OLI) and SMMS (HJ-A1) satellite images 45
4-4 Dislocation evaluation the accuracy of the classification of land use by
SMMS (HJ-A1) satellite 47
4-5 Dislocation evaluation of the accuracy of the classification of land use in
LANDSAT 8 (OLI) satellite image 48

LIST OF FIGURES
Figures Page
1-1 Map of Banteay Meanchey Province 5
2-1 Components of GIS 11
2-2 GIS Application 15
3-1 Classification of Workflow 28
3-2 SMMS (HJ-A1) 29
3-3 Enhanced LANDSAT 8 imagery in 2015 30
3-4 Collecting training samples 32
3-5 Evaluation training sample editing classes 33
3-6 Editing classes 33
3-7 Creating the signature file 34
4-1 Percentage of land use Banteay Meanchey SMMS (HJ-A1) 39
4-2 Area of land use Banteay Meanchey SMMS (HJ-A1) 40
4-3 SMMS (HJ-A1) Map of Banteay Meanchey showing location of cassava
plantation fields of studies 40
4-4 SMMS (HJ-A1) Map classification of Banteay Meanchey showing
location fields of studies 41
4-5 Percentage of land use in Banteay Meanchey from LANDSAT 8 (OLI) 43
4-6 Area of land use in Banteay Meanchey from LANDSAT 8 (OLI) 43
4-7 The LANDSAT 8 (OLI) satellite map of Banteay Meanchey showing
location of cassava plantation fields of study 44
4-8 The LANDSAT8 (OLI) satellite image map of Banteay Meanchey
province showing location fields of study 44
4-9 Comparison of land use in Banteay Meanchey province by LANDSAT 8
(OLI) and SMMS (HJ-A1) satellite images 46
4-10 Map showing sample locations to determine accuracy 47

CHAPTER 1
INTRODUCTION
Introduction
Cambodia is a country in Southeastern Asia, bordering the Gulf of Thailand,
between Thailand, Vietnam, and Laos. It has twenty four provinces and a capital city.
Cambodia occupies 181,035 square kilometers in the southwestern part of the
Indochina peninsula, and is located between 10° and 15° latitude north and 102° and
108° longitude east. The country shares 803 kilometers of border with Thailand on the
north and west, 541 kilometers of border with Laos on the northeast, 1,228 kilometers
of border with Vietnam on the east and southeast, for a total of 2,572 kilometers of
land borders; coastline along the Gulf of Thailand about 443 square kilometers. The
population of Cambodia is 15,184,116 million (Cambodia T. , 2014). Cambodia has a
tropical climate with two distinct monsoon seasons the rainy season starts in mid-
April and continues to October. Average annual rainfall is 1,250-1,750 millimeters
(Cambodia Ministry of Agriculture Fish, 2014). Sihanouk Ville has the highest
average annual rainfall of 2,996 millimeters and the average rainfall in Banteay
Meanchey Province is 1,000 millimeters, with peak rainfall occurring in September/
October and the lowest rainfall in February. As for the temperature, it is lowest in
December/January with average minimum temperature of 21 degrees celsius and the
highest in April with average minimum of 36 degrees celsius (Yem, 2010). Cambodia
is located in the trops so is suitable for several kinds of economic plants such as
soybeans, green bean, rice, cassava, corn (maize) and sugarcane. Agriculture has been
the first priority of the government’s development strategies since1993. Agriculture is
a fundamental sector of the Cambodian economy and small farmers dominate the
agricultural sector of the country.
The territory of Banteay Meanchey is a Cambodian province in the
northwest of the country. In 1988 the province of Banteay Meanchey was split off
from Battambang, and its capital is named Sisophon, approximately 359 kilometers
from Phnom Penh by National Road Number 5. The district is subdivided into 7 and 2
cities, communes 64 and 649 villages (National Institute of Statistics). One of the

2
most known places in that province is Poi Pet, a town on the Thailand/Cambodia
border. It is the key crossing point between the two countries. The total population is
745,618 or (5.242%) of the total population of 14,363,519 in Cambodia (provincial
government data, 2011) with a growth rate of 5.93 %, which consists of 402,201
males (49.11%), and 414,181 females (50.89%). The above number also consists of
654, 033 (93%) farmers, 8,228 (1.17%), fishermen, 35,162 (5%), traders, and 5,814
(0.83%), government officers (Tourism of Cambodia , 2015).
Cassava is currently the most important upland crop of Cambodia. It is an
agricultural product that can be processed into various other products such as ethanol,
animal feed or cassava starch or flour for human consumption. Cassava (Manihot
esculenta Crantz), a native to South America (Allem, 2002), is an important storage
root crop worldwide (Ceballos et al., 2004; El-Sharkawy, 2012). It is a key
component of the diet of over 800 million people across several continents (El
Sharkawy, 2012). The crop is a high starch producer with levels of up to 90% of its
total storage root dry mass (Jansson et al., 2009). Cassava is the third most important
source of calories in the tropics after rice and maize. Cassava is one of the most
important upland crops of Cambodia that a farmer plants after rice. More than 85 % of
the cultivated area is planted to rice, maize, soybean, sesame, peanut and cassava.
Agriculture is also the most important sector for employment, employing more than
half of the country’s total labor force. Agriculture is more important for the rural poor
as it provides their most important source of income (World Bank, 2009).
Land cover is the physical material at the surface of the earth. Land covers
include grass, asphalt, trees, bare ground, water, etc. This study uses Remote Sensing
data from Landsat imagery covering the study area. Remote sensing (RS) and
Geographic Information Systems (GIS) provide secure and established foundations
for measurement, mapping and analysis of natural resources in the world. There are
various ways to classify land cover based on remote sensing and GIS such as
supervised classification, unsupervised classification or combination of supervised
and unsupervised procedures with other sources like economic, social and historical
information as hybrid classification methods which are well known and established
today (Nguyen, 2015).

3
This research thesis is concerned with the application of recent technology
in Remote Sensing and the Geographical Information Systems in the evaluation of
cassava plantation areas in Banteay Meanchey Province in Cambodia. The capability
of Remote Sensing to capture up-to-date information for large areas and the ability of
GIS to store and manage data from various sources means the technology is an
important tool in the field of agricultural and another fields.
Statement and Significance of the Problem
Cambodia’s agriculture sector is growing, but suffers from constraints such
as low labor productivity, low yields, variable water resources, inefficient land titling,
inactive technology transfer, limited access to credit and inadequate rural
infrastructure (CDC, 2010), which make it very difficult to identify cassava plantation
areas.
There are many questions that could be asked which may lead to some
solutions to the above problems. The purpose of this thesis is to identify the land
surface use and approach to economic cassava plantation in Banteay Meanchey
province of Cambodia. The basic hypothesis of this research that Banteay Meanchey
province (the northern high. land of Cambodia), with its tropical climate, is import
(the seed) and export cassava products gateway which is very important in sharing
economic benefits together with Thailand. It is proposed that effective measurement
of land area dedicated to cassava, what areas are used specifically for cassava will
lead to economic benefits for farmers in this province. The analysis is divided into
two main parts. The first section of this report introduces the reasons for choosing this
area as the objective of the thesis. It will explain land use using Geographic
Information Systems and Remote Sensing satellite imagery. The second section is a
case evaluation of cassava plantation area for farmers – increasing the land plated and
increasing their income. The effects, implementation strategies, and specific strengths
and weaknesses associated with each approach are described, including a comparison
from the previous work. This study entails an examination of the land use developed
in an increasing total area of cassava plantation. In general the associated findings of
the research is located within this final section.

4
Objectives of the Study
The main objective of this study is the classification of cassava planted area
in Banteay Meanchey Province using Maximum Likelihood Supervisor classification
gathered using LANDSAT 8 (OLI) and SMMS (HJ-1A) images in 2015.
1. Classification of cassava planted areas from LANDSAT 8 (OLI) SMMS
(HJ-1A) in 2015.
2. Comparison of cassava planted areas from LANDSAT 8 (OLI) and
SMMS (HJ-1A) in 2015
Scope of Study
This study classifies the cassava plantation areas in Banteay Meanchey
Province, Cambodia, using LANDSAT 8 and SMMS (HJ-1A) data, by Maximum
Likelihood Classification of Supervised method and comparison of the cassava
plantation area obtained and classified with LANDSAT 8 and SMMS (HJ-1A).
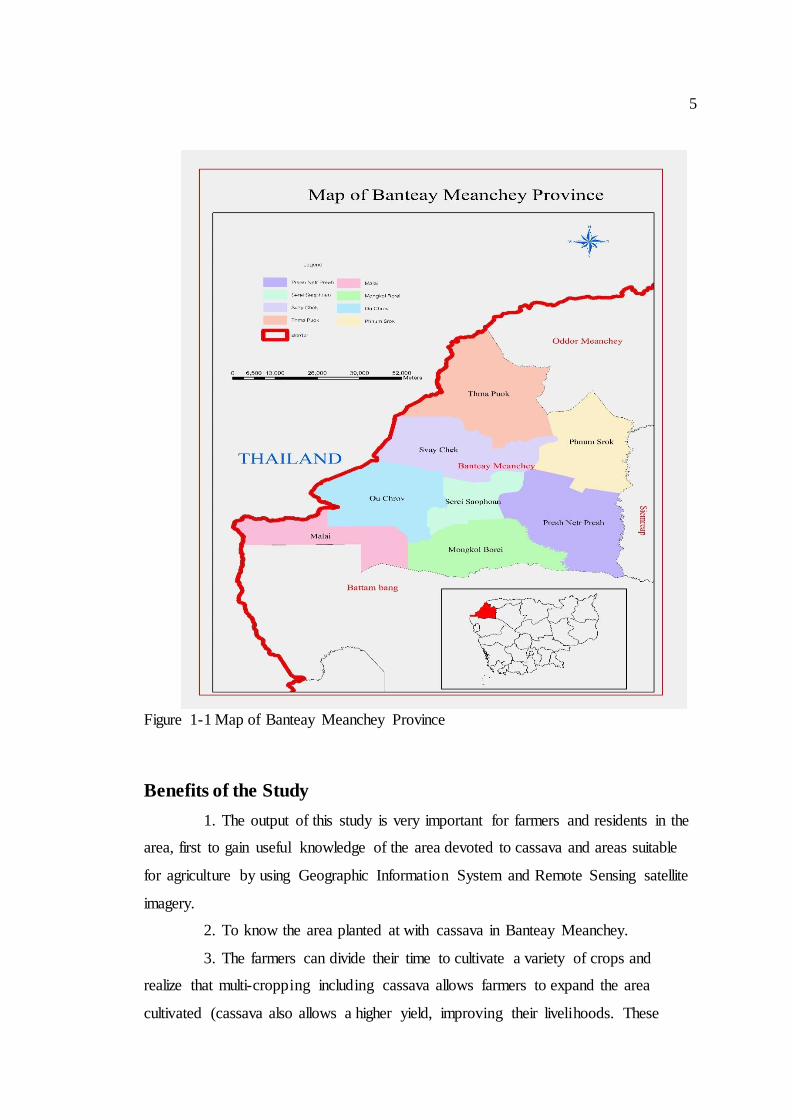
The Study Area
This study was carried out in Banteay Meanchey Province, with an area of
6185.84 square kilometers, located between 13°45′- 13°75′ N latitude and 101°06-
105°21′E longitude. This province was chosen because it has the largest cassava
planted area in Cambodia after Kampong Cham and Battambang provinces.which
have approximately 62,151 hectares of cassava planted in 2014 and share a border
with Sa Kaeo Province of Thailand to the west and North, Oddar Meancheay to the
North, Siem Reap to the East, and Battambang to the South. The town of Sisophorn is
about 359 kilometers from Phnom Penh via national road number 5. The climate of
the area can be characterized as warm tropical, wet and dry climate with extreme low
and high temperatures of 23 degrees celsius to 36 degrees celsius and rainfall in this
province is 885.30 millimeters per year (Tourism, 2015).
5
Figure 1-1 Map of Banteay Meanchey Province
Benefits of the Study
1. The output of this study is very important for farmers and residents in the
area, first to gain useful knowledge of the area devoted to cassava and areas suitable
for agriculture by using Geographic Information System and Remote Sensing satellite
imagery.
2. To know the area planted at with cassava in Banteay Meanchey.
3. The farmers can divide their time to cultivate a variety of crops and
realize that multi-cropping including cassava allows farmers to expand the area
cultivated (cassava also allows a higher yield, improving their livelihoods. These

6
maps could serve as input or guides to the planning and formulation of sustainable
management strategies.
4. To obtain a Comparison of the area planted with cassava between
LANSAT 8 (OLI) and SMMS (HJ-1A) in 2015.
5. To create a map of cassava planted areas after classification at Banteay
Meanchey, Cambodia.

CHAPTER 2
LITURATURE REVIEW
Agriculture is a fundamental sector of Cambodia economy. Small farmers
dominate the agriculture sector of the country and most farmers in Banteay Meanchey
province plant cassava rather than rice. Cassava is a source of good income for people
there because yields and production are high especially near the border with Thailand.
Cassava production management and farmland division can be improved using
Remote Sensing and Geographical Information System technology in the of
evaluation cassava plantation. Remote Sensing and GIS are effective tools to
generate, analyze, and display these multi-disciplined spatially correlated data. In the
last several decades, methodologies have been developed and studies have been
conducted for effective analysis using Remote Sensing and GIS in classification of the
cassava plantation.
Cassava
“Cassava (Manihot esculenta Crantz) was introduced from Brazil, its
country of origin, to the tropical areas of Africa, the Far East and the Caribbean
Islands by the Portuguese during the 16th and 17th centuries. In the Gold Coast (now
Ghana), the Portuguese grew the crop around their trading ports, forts and castles and
it was a principal food eaten by both Portuguese and slaves. By the second half of the
18th century, cassava had become the most widely grown and used crop of the people
of the coastal plains. The Akan name for cassava 'Bankye' could most probably be a
contraction of 'Aban Kye' - Gift from the Castle” (Korang-Amoakoh et al., 1987).
Cassava is called “yuca” in Spanish, “mandioca” in Portuguese, “cassava” in
Haitian Creole, and “Manioc” in French. It is consumed in a variety of ways, but only
after some form of processing. Cultivars are classified into two groups based on the
amounts of hydrogen cyanide present. Sweet types contain less than 50 mg kg-1HCN
(fresh weight) and are generally sold as fresh roots, whereas bitter types have higher
amounts of HCN along with higher yields and starch content (Conceição, 1981).

8
Cassava is the fourth most important source of food energy in the tropics.
More than two-thirds of the total production of this crop is used as food for humans,
with lesser amounts being used for animal feed and industrial purposes. The ingestion
of high levels of cassava has been associated with chronic cyanide toxicity in parts of
Africa, but this appears to be related to inadequate processing of the root and poor
overall nutrition. Although cassava is not a complete food it is important as a cheap
source of calories. (Cock, 1982)
Cassava is an important cash crop and food crop of resource-limited farmers
in Africa, Asia, and Latin America and the Caribbean. The storage roots are utilized
either fresh, as in the case of sweet cultivars low in cyanogen glycosides, or after
processing into dry products such as flour, starch, and animal feed in the case of bitter
cultivars high in cyanogen glycosides (Emmanuel Okogbenin, Tim L. Setter, Morag
Ferguson, Rose Mutegi, Hernan Ceballos, Bunmi Olasanmi, and Martin Fregene,
2013).
Cassava production in Cambodia
Cambodian cassava is mainly grown in the central and southeastern part of
the country. Especially in Kampong Cham and Kampong Thom province, while some
is also grown along the Mekong River and Siem Reap, Kampong Speu, Kampong
Thom, Battambang, and Banteay Meanchey. There are two main local varieties in
Cambodia, one is sweet, the other is bitter. Mong Reththy Tapioca (MRT) plantation,
located in Sihanouk ville, in southwest Cambodia, introduced RAYONG 60 and
KASETSART 50 in 2000. In areas near the border, the farmers introduced some
Vietnamese varieties (bitter) in Kampong Cham province, and a Thai company
introduced some Thai varieties (bitter) in Battambang and Banteay Meanchey
Provinces. Because of a lack of extension, and farmers in many provinces have
difficulty finding cassava markets for animal feed and industrial raw material so, they
generally don‟t like planting the new bitter varieties; they just want to sell sweet roots
for human consumption in the local market fresh. The new varieties are not widely
grown yet (Cambodia Ministry of Agriculture and Fishing, 2010).

9
Cultivation Practices
Cassava is adaptable to diverse climates and can be grown in soil with low
fertility. It is planted either as a single crop or intercropped with maize, legumes,
vegetables, rubber or other plants. Cassava is normally planted during February–April
and harvested in eight to 12 months depending on market price and the availability of
labor for harvesting.
Cultivation practices in western and eastern Cambodia are similar, with a
few notable differences due to different soil and climate conditions. In Banteay
Meanchey province, with about 62151 hectares (Department of Agriculture Banteay
Meanchey 2014) of cassava, The yield and production were especially high the near
Thailand border. There are some Thai cassava varieties in Cambodia such as Rayong
60 and Karsetsart 50 or other varieties from Thai buyers‟. The farmers in Banteay
Meanchey near Thailand border have introduced high yielding varieties, so cassava is
mono-cropped and usually planted in December, with the earliest planting in the
middle of November and the last in February. The first ploughing starts in early
December before the forecast rain, followed by a second ploughing and row making
in the middle of January. Most farmers hire a local tractor owner to plough and hire
laborers to make rows for planting. Most have their land ploughed twice, which
results in a greater yield, while about 5 percent do it only once due to lack of financial
resources. Planting seeds usually takes place in March. The majority of farmers use
their own cassava seeds from the previous harvest (Hing vutha, Thun Vathana, 2009).
Herbicide is necessary in Malai and needs to be applied at least twice because weeds
grow high and thick. The first application is made in the middle of May and the
second a month and a half later. A third application of herbicide might be made,
depending on weed condition and farmers financial resources. Finally, some branches
are normally cut a month or so before harvesting to admit enough sunlight for the root
to grow bigger. Cassava is mostly planted with other crops, especially rubber etc.
Farmers mostly use more a tractor instead of labor for land preparation in order not to
disturb the other crops in western and north western areas.

10
Geographic Information System
Geographic Information System (GIS) is a powerful tool for collecting,
storing, retrieving, transforming and displaying spatial data from the real world
(Burrough., 1986). Many people offer definitions of GIS. In the range of definitions
presented below, different emphases are placed on various aspects of GIS. Some miss
the true power of GIS, its ability to integrate information and to help in making
decisions, but all include the essential features of spatial references and data analysis.
Geographic Information System (GIS) integrates hardware, software and data for
capturing, managing, analyzing, and displaying all forms of geographically referenced
data. GIS allows the viewing, understanding, questioning, interpreting, and
visualizing data in many ways that reveals relationships, patterns, and trends in the
form of maps, globes, reports, and charts. It answers questions and solves problems
by looking at data in a way that is quickly understood and easily shared. GIS
technology can be integrated into any enterprise information system framework. GIS
can be used to map the changes in an area to anticipate future conditions, decide on a
course of action, or to evaluate the results of an action or policy. By mapping where
and how things move over a period of time, one can gain insight into how they
behave. Dana Tomlin's definition, from the Geographic Information Systems and
Cartographic Modeling (Englewood Cliffs, NJ: Prentice-Hall, 1990) is a broad
definition. A considerably narrower definition, however, is more often employed. In
common parlance, a geographic information system, or GIS, is a configuration of
computer hardware and software specifically designed for the acquisition,
maintenance, and use of cartographic data. (From Jeffrey Star and John Estes, in
Geographic Information Systems. Englewood Cliffs, NJ: Prentice-Hall, 1990). A
geographic information system (GIS) is an information system that is designed to
work with data referenced by spatial or geographic coordinates. In other words, a GIS
is both a database system with specific capabilities for spatially-referenced data, as
well as a set of operations for working with data. In a sense, a GIS may be thought of
as a higher-order map (Understanding GIS: The ARC/INFO Method, 1990). A GIS is
an organized collection of computer hardware, software, geographic data, and
personnel designed to efficiently capture, store, update, manipulate, analyze, and
display all forms of geographically referenced information.

11
Components of Geographic Information System
A working Geographic Information System seamlessly integrates five key
components: hardware, software, data, people, and methods. (Ebook, 2014)
User
Procedure
Data
Software Hardware
Figure 2-1 Components of GIS (Mapsofindia, 2012)
1. Hardware
Hardware includes the computer on which a GIS operates the monitor on
which results are displayed, and a printer for making hard copies of the results.
Today, GIS software runs on a wide range of hardware types, from centralized
computer servers to desktops. Computers are used in stand-alone or networked
configurations. The data files used in GIS are relatively large, so the computer must
have a fast processing speed and a large hard drive capable of saving many files.
Because a GIS outputs visual results, a large, high resolution monitor and a high-
quality printer are recommended.
2. Software
GIS software provides the functions and tools needed to store, analyze, and
display geographic information. Key software components include tools for the input
and manipulation of geographic information, a database management system
(DBMS), tools that support geographic query, analysis, and visualization, and a
graphical user interface (GUI) for easy access to tools. The industry leader is
ARC/INFO, produced by Environmental Systems Research, Inc. The same company
GIS

12
produces a more accessible product, ArcView that is similar to ARCINFO in many
ways.
3. Data
Possibly the most important component of a GIS is the data. A GIS will
integrate spatial data with other data resources and can even use a database
management system, used by most organizations to organize and maintain their data,
and to manage spatial data. There are three ways to obtain the data to be used in a
GIS. Geographic data and related tabular data can be collected in-house or produced
by digitizing images from photographs or published maps. Data can also be purchased
from a commercial data provider. Finally, data can be obtained from the national
government at no cost.
4. People
GIS users range from technical specialists who design and maintain the
system to those who use it to help them perform their everyday work. The basic
techniques of GIS are simple enough to master that even students in elementary
schools are learning to use GIS. Because the technology is used in so many ways,
experienced GIS users have a tremendous advantage in today‟s job market.
5. Methods
A successful GIS operates according to a well-designed plan and business
rules, which are the models and operating practices unique to each organization.
Spatial data
It should be noted that spatial data is at the heart of every GIS application.
Spatial data stores the geographic location of particular features, along with
information describing what these features represent. The location is usually specified
according to some geographic referencing system (e.g., latitude, longitude) or simply
by an address. Spatial data may define some physical characteristics, such as location
or position, or it may also define a property such as the area of a forest and
agricultures (which results from defining the various positions of its boundaries).
(Davis, 1996) In GIS, spatial data is classified as three main types: point, line, and
polygon.

13
1. A point is a convenient visual symbol (an X, dot or other graphic), but
it does not reflect the real dimensions of the feature. Points may indicate specific
locations (such as a given address, or the occurrence of an event) or which are
usually too small to depict properly at the chosen scale features (such as a building).
2. A line is a one-dimensional feature with a starting and an ending point.
Lines represent linear features, either real (e.g., roads or streams) or imaginary (eg.
borders).
3. A polygon is an enclosed area, a two-dimensional feature with at least
three sides (and therefore with an area). For example, it may represent a parcel of
land, agricultural fields, or a political district
Attribute data
Since the data collected and stored in the database determine the kind of
questions that can be asked of the data, it is necessary to understand the scales of
measurement in which data are recorded. The measurement scales normally used are
nominal, ordinal, interval and ratio.
Nominal Scale – The nominal scale is the lowest level of measurement
which is used to distinguish among features. Nominal data could be a name or a
description of features. For instance, a lake could be differentiated from a sand dune.
In a tropical area, there could be regions identified with sugar cane fields or rice
paddy fields. Basically, each name or description is distinct.
Ordinal Scale – Ordinal scales allows for data to be ranked in either an
ascending or descending order. A hierarchy of rank could be established depending
on the features under consideration. For example, a country could have cities ranked
as small, medium and large. In addition, the country may have parks that are ranked
as being minor, intermediate and major. Although the ordinal scale permits
differentiation on the basis of rank, it does not show or specify the magnitude of
difference.
Interval Scale – With the interval scale of measurement the distance
between the ranks is known. To employ an interval scale an arbitrary starting point is
used. The widely used example of the Celsius temperature scale explains the interval

14
scale. For example, it cannot be said that 38 degrees Celsius is twice as hot as 19
degrees Celsius, because 0 degrees Celsius is arbitrary.
Ratio Scale – A ratio scale is more advanced than the interval scale because there can
be an absolute starting point. For example, 78 miles is twice as far as 39 miles
(Lakhan, 1996).
Electronic maps and images
An essential component of any GIS is some kind of map or image of an area.
This can be a digital map, satellite image or aerial photograph. Many GIS will use a
full range of map data and images as a base to link information against. The maps are
produced either as raster or vector data.
Raster maps
These are images made by a series of colored dots on a screen (pixels), just
like high quality digital photographs. Raster maps can be thought of as „unintelligent‟
as you can only obtain information that is visually represented on them. Raster maps
take up a lot of computer storage space but can be very useful as background maps to
other information.
Vector maps
Each vector map feature is recorded using XY coordinates. These may be a
single point (like a trig point), lines (such as roads) or polygons (such as buildings or
woods). The referenced features of vector maps make it possible for a GIS to link
information from spreadsheets and databases to the maps. Vector data is stored in
themed layers such as roads, water, or settlement.
Working GIS
A GIS stores information about the world as a collection of thematic layers
that can be linked together by geography. This simple but extremely powerful and
versatile concept has proven invaluable for solving many real-world problems from
modeling global atmospheric circulation, to predicting rural land use, and monitoring
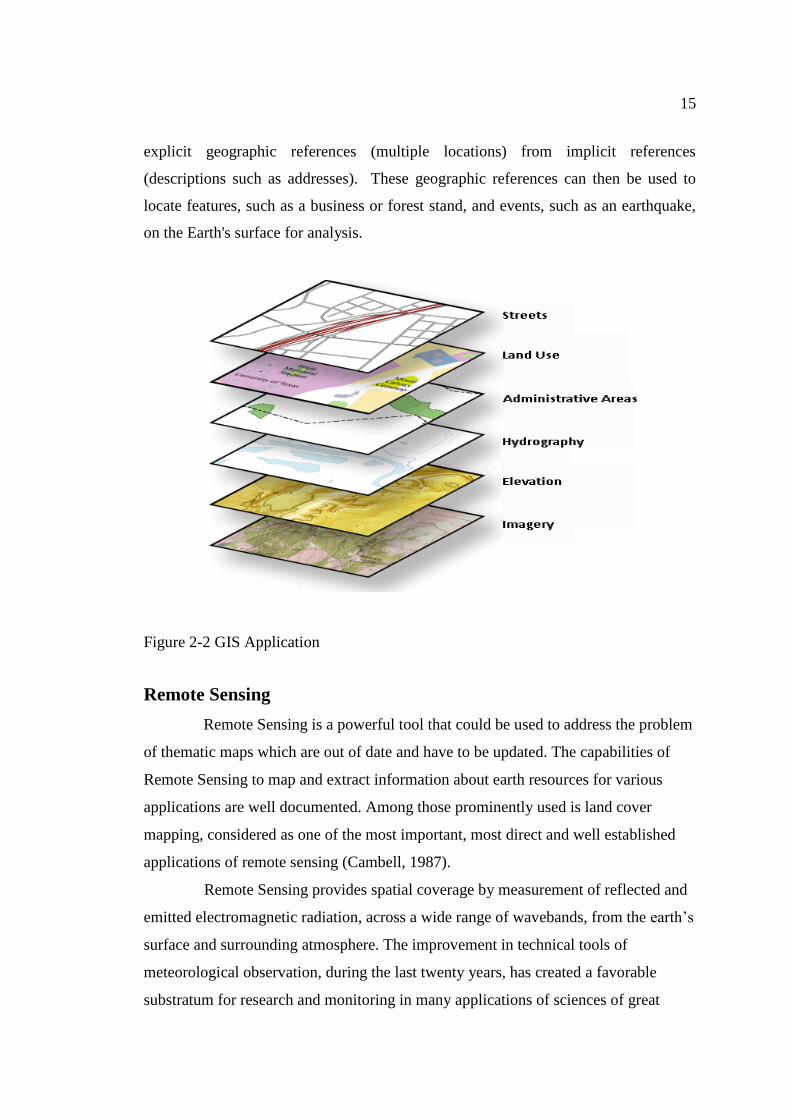
changes in rainforest ecosystems. Geographic information contains either an explicit
geographic reference such as a latitude and longitude or national grid coordinate, or
an implicit reference such as an address, postal code, census tract name, forest stand
identifier, or road name. An automated process called geocoding is used to create
15
explicit geographic references (multiple locations) from implicit references
(descriptions such as addresses). These geographic references can then be used to
locate features, such as a business or forest stand, and events, such as an earthquake,
on the Earth's surface for analysis.
Figure 2-2 GIS Application
Remote Sensing
Remote Sensing is a powerful tool that could be used to address the problem
of thematic maps which are out of date and have to be updated. The capabilities of
Remote Sensing to map and extract information about earth resources for various
applications are well documented. Among those prominently used is land cover
mapping, considered as one of the most important, most direct and well established
applications of remote sensing (Cambell, 1987).
Remote Sensing provides spatial coverage by measurement of reflected and
emitted electromagnetic radiation, across a wide range of wavebands, from the earth‟s
surface and surrounding atmosphere. The improvement in technical tools of
meteorological observation, during the last twenty years, has created a favorable
substratum for research and monitoring in many applications of sciences of great

16
economic relevance, such as agriculture and forestry. Each waveband provides
different information about the atmosphere and land surface: surface temperature,
clouds, solar radiation, processes of photosynthesis and evaporation, which can affect
the reflected and emitted radiation, detected by satellites (Saha, 2003). The challenge
for research therefore is to develop new systems extracting this information from
remotely sensed data, giving to the final users, near-real-time information. Over the
last two decades, the development of space technology has led to a substantial
increase in satellite earth observation systems. Simultaneously, the Information and
Communication Technology (ICT) revolution has rendered increasingly effective the
processing of data for specific uses and their instantaneous distribution on the World
Wide Web (WWW). The meteorological community and associated environmental
disciplines such as climatology including global change, hydrology and oceanography
all over the world are now able to take advantage of a wealth of observational data,
products and services flowing from specially equipped and highly sophisticated
environmental observation satellites. An environmental observation satellite is an
artificial Earth satellite providing data on the Earth system and a Meteorological
satellite is a type of environmental satellite providing meteorological observations.
Several factors make environmental satellite data unique compared with data from
other sources, and it is worthy to note a few of the most important:
1. Because of its high vantage point and broad field of view, an
environmental satellite can provide a regular supply of data from those areas of the
globe yielding very few conventional observations.
2. The atmosphere is broadly scanned from satellite altitude and enables
large scale environmental features to be seen in a single view.
3. The ability of certain satellites to view a major portion of the atmosphere
continually from space makes them particularly well suited for the monitoring and
warning of short-lived meteorological phenomena, and;
4. The advanced communication systems developed as an integral part of
the satellite technology permit the rapid transmission of data from the satellite, or
their relay from automatic stations on earth and in the atmosphere, to operational
users. These factors are incorporated in the design of meteorological satellites to
provide data, products and services through three major functions.

17
5. Remote sensing of spectral radiation which can be converted into
meteorological measurements such as cloud cover, cloud motion vectors, surface
temperature, vertical profiles of atmospheric temperature, humidity and atmospheric
constituents such as ozone, snow and ice cover, ozone and various radiation
measurements.
6. Collection of data from in situ sensors on remote fixed or mobile
platforms located on the earth‟s surface or in the atmosphere, and;
7. Direct broadcast to provide cloud-cover images and other meteorological
information to users through a user-operated direct readout station.
The first views of earth from space were not obtained from satellites but
from converted military rockets in the early 1950s. It was not until 1 April 1960 that
the first operational meteorological satellite, TIROS-I, was launched by the USA and
began to transmit basic, but very useful, cloud imagery. This satellite was such an
effective proof of concept that by 1966 the USA had launched a long line of
operational polar satellites and its first geostationary meteorological satellite. In 1969
the USSR launched the first of a series of polar satellites.
Huanjing-1A (HJ-1A)
HJ-1A (Huan Jing = Environment) satellites are small Chinese Earth
observation satellites. The main application fields for China are environmental
monitoring and prediction, solid waste monitoring, disaster monitoring and prediction
(flood, drought, typhoon and wind damage, sand storm, earthquake, land creep, frost
and grassland fires, coal fires, crop pest monitoring, ocean disaster monitoring)
(eoPortail Directory, 2010). The first two satellites, HJ-1A and HJ-1B, was
successfully launched in China on September 6, 2008. Both were manufactured by the
China Spaces at Company, and use the China Aerospace Science and Industry
Corporation (CAST) 968 satellite bus with a designed service life of three years. The
HJ-1A was equipped with an electro-optical imager with a 30-meter resolution and a
700-km swath, and a hyper spectral imager with a 100-meter resolution and a 50-km
swath (Kevin Pollpeter, 2014). HJ-1A was the first micro-satellite constellation for
Environment and Disaster Monitoring of China. The same multispectral imagers
named HJ-1/CCD with four bands (R, G, B, NIR) and large swath are installed on
18
both HJ-1A and HJ-1B. The HJ-1/CCD is the main sensor of the constellation. The
satellite constellation is composed of a number of small satellites, the ground system,
and the application system. It provides all-weather (3 to 100 meter) imagery. The
Huan Jing constellation consists of two small optical satellites, the HJ-1A and the HJ-
1B.
HJ-1A is also the Small Multi-Mission Satellite (SMMS) of the Asia Pacific
Space Cooperation Organization (APSCO) and it will be an important data resource
of APSCO space application. SMMS is a joint venture payload between China, Iran,
South Korea, Mongolia, Pakistan, Thailand and Bangladesh under the Asian-Pacific
organization (Global Master Change Directory, 2012). China is establishing its
disaster and environment monitoring capability mainly depending on ordinary
technologies, and meanwhile, China will also launch the small satellites to monitor
the earth environment, and apply the satellite remote sensing technology to conduct
all weather, around-the-clock and high time-resolution disaster and environmental
monitoring. The small satellite constellation for disaster and environment monitor is
composed of 4 optical small satellites and 4 small satellites with synthetic aperture
radar. During the period of the Tenth Five-Year Plan, China will launch 2 optical
satellites and 1 radar satellite. The resolutions of the CCD camera, the infrared camera
and the synthetic aperture radar are 30m, 150m, and 20m, respectively.
The average re-visit time is 32 hours. China, Thailand and Iran are working
on a joint Small Multi Mission Spacecraft (SMMS) devoted to civilian remote-
sensing and communications experiments. The SMMS satellite will carry a low-
resolution charge-coupled device (CCD) camera and an experimental
telecommunications system. The SMMS will give Iran and Pakistan a semi-
autonomous space-imaging capability. The 470-kg (1,034-lb) spacecraft is set for
launch on a Chinese booster by 2004-05 into a 650-km. (400-mi.) Sun-synchronous
polar orbit (Zulu, 2011).

19
Table 2-1 Payload parameters (Rahman, 2012)
Satellite Payload Band
no.
Spectral
range (µm)
Spatial
resolution
(m)
Swath
width
(km)
Side-
lookin
g
ability
Repetition
cycle
(days)
Data
transmis
sion rate
(Mbps)
HJ-1A
CCD
Camera
1 0.43~0.52 30
700
83,757 4
120
2 0.52~0.60 30
3 0.63~0.69 30
4 0.76~0.9 30
Hyperspect
ral Imager -
0.45~0.95
(110-128
bands)
100 50 ±30 4
Orbit characteristic of HJ-1A
Sun-synchronous circular orbit, altitude = 649 km, inclination = 97.95º,
LTDN (Local Time of Descending Node) equator crossing at 10:45 hours. HJ-1A are
in a coplanar orbit with a phasing of 180º. In the final stage of the constellation, 4
satellites will be distributed in the same orbital plane at phase angles of 90.Table 2
below describes some orbital characteristics of HJ-1A.
Table 2-2 Orbit parameters (Rahman, 2012)
Satellite HJ-1A
Orbit Sun synchronous recurrent frozen orbit
Altitude 650 km
Inclination 97.95
Repetition cycle 31 days
Descending node (Local time) 10:30 AM
On-board capacity 16 Gbits

20
LANDSAT 8 (OLI)
LANDSAT 8 consist of two major segments the observatory and the ground
system. The observatory consists of the spacecraft bus and its payload of two earth
observing sensors, the operational land imager (OLI) and the thermal infrared sensor
(TIRS). OLI and TIRS collect LANDSAT 8 science data. The two sensors will
coincidently collect multispectral digital images of the global land surface including
coastal regions, polar ice, islands, and the continental areas. The spacecraft bus stores
the OLI and TIRS data on an onboard solid-state recorder and then transmits the data
to ground receiving stations, these two sensors provide seasonal coverage of the
global landmass at a spatial resolution of 30 meters (visible, NIR, SWIR), 100 meters
(thermal), and 15 meters (panchromatic). LANDSAT 8 (OLI) is a joint initiative of
NASA and the U.S. Geological Survey to maintain a robust archive of Landsat data
and imagery, which provides an uninterrupted multispectral record of the earth‟s land
surface and it lets us analyze everything from terrain types to crop growth to natural
disasters all around the world. Table 2-3 below, describes some of the spectral bands
and wavelengths within the satellite image.
OLI and TIRS sensors are mounted on the LANDSAT Data Continuity
Mission spacecraft (LDCM). The Operational Land Imager (OLI) and Thermal
Infrared Sensor (TIRS) images consist of nine spectral bands with a spatial resolution
of 30 meters for Bands 1 to 7 and 9. New band 1 (ultra-blue) is useful for coastal and
aerosol studies. New band 9 is useful for cirrus cloud detection. The resolution for
Band 8 (panchromatic) is 15 meters. Thermal bands 10 and 11 are useful in providing
more accurate surface temperatures and are collected at 100 meters. Approximate
scene size is 170 km north-south by 183 km east west (106 miles by 114 miles).

21
Table 2-3 LANDSAT 8 spectral band/wavelengths (Source: Credit U.S. Geological
Survey Department of the Interior USGS)
Landsat Data
Continuity
Mission(LDCM)
Lunch
February 11,2013
Bands Wavelength
(µm)
Resolution
(m)
Band 1 – Coastal aerosol 0.43 - 0.45 30
Band 2 – Blue 0.45 – 0.51 30
Band 3 – Green 0.53 - 0.59 30
Band 4 – Red 0.64 - 0.67 30
Band 5 - Near Infrared (NIR) 0.85 - 0.88 30
Band 6 – SWIR 1 1.57 - 1.65 30
Band 7 – SWIR 2 2.11 – 2. 29 30
Band 8 - Panchromatic 0.50 - 0.68 15
Band 9 – Cirrus 1.36 - 1.38 30
Band 10 – Thermal Infrared (TIRS)1 10.60 – 11.19 100
Band 11 - Thermal Infrared (TIRS) 2 11.50 -12.51 100
Band Combinations for LANDSAT 8 (OLI)
LANDSAT 8 (OLI) image look incredible now, while of the bands from
previous Landsat mission are still incorporated, there are a couple of new ones, such
as the coastal blue band water penetration/aerosol detection and the cirrus cloud band
for cloud masking and other application. Below is a rundown of some common band
combination applied to LANDSAT 8 (OLI), displayed as a red, green, blue (RGB).

22
Table 2-4 Composition Band (Source: Credit U.S. Geological Survey Department of
the Interior USGS)
Natural Color 4 3 2
False Color (Urban) 7 6 4
Color Infrared (Vegetation) 5 4 3
Agriculture 6 5 2
Atmospheric Penetration 7 6 5
Healthy Vegetation 5 6 2
Land and Water 5 6 4
Natural with Atmospheric Removal 7 5 3
Shortwave Infrared 7 5 4
Vegetation Analysis 6 5 4
Global Positioning System (GPS)
The working of Global Positioning System (GPS) is a satellite navigation
system providing worldwide coverage. A group of 24 satellites, circling twice-daily
20,000 km above the earth's surface, transmit coded signals that are picked up by GPS
receivers. The constellation of navigation satellites around the earth enables position
to be determined anywhere at any time, and in any weather condition for free. By
recognizing the codes for each satellite, the receiver can determine the time taken for
the signal to be transmitted. The GPS uses this information to then calculate the
distance to each satellite. Once four or more satellites are located, the GPS
"triangulates" the distances to provide a location on the earth's surface, i.e. longitude,
latitude, and elevation. However, the signal is still prone to a number of errors that
can reduce the positional accuracy. These include atmospheric errors, multi-path
errors, satellite and receiver errors, and intentional errors.
Atmospheric errors are introduced as the signal passes through the
atmospheric layers. Charged particles and moisture droplets delay the signal, leading
to timing inaccuracies. Atmospheric errors may range from 3 to 50 m, depending on
the time of day and the arrangement of satellites in the sky. A "dual-frequency" GPS

23
minimizes these errors through computer modeling or by comparing the relative
speeds of two different signals - but these receivers are costly. Multi-path errors occur
when the signal bounces off obstructions, such as buildings or sheds, before reaching
the receiver. Such errors may exceed 100 m in certain situations. Complex signal
rejection procedures - or simply using the GPS in wide-open spaces - should
minimize these errors. Satellite (or "ephemeris") errors result when the broadcast
orbit differs from the actual orbit. The US Department of Defense uses radar to
determine these errors, and any updated positional information can be added to the
satellite code to reduce this error. Receiver errors result largely from noise or the use
of inaccurate clocks inside the GPS unit - but can be minimized with more expensive
clocks (Amod Ashok Salgaonkar, Trivesh Suresh Mayekar, Avinash Rambhau Rasal,
Kiran Rasal, Balkrishna Hotekar, Rakesh Jadhav, Amar Gaikwad). GPS is not a single
unit. It is a system and has the following three major components:
1. Satellites: There are 24 satellites & 3 spare satellites. The exact location
of each of the satellites at any given moment is known. Very accurate clocks are
installed onboard these satellites. The satellites send radio signals continuously
towards earth. These signals contain several pieces of information such as satellite ID
number, time stamp, exact position of satellite etc.
2. Ground Control Stations: These are five control stations to monitor the
satellites. These stations enable the information on earth to be transmitted to the
satellites. Control stations track satellites & update the position of each satellite
continuously. These stations ensure the accuracy of the system.
3. GPS receivers: GPS units are referred to as receivers. These units receive
radio signals from satellites, which contain important information such as time stamp,
satellite ID number, satellite position etc. The receiver knows exactly when the signal
leaves the satellite (time stamp) and when the signal arrives at the receiver. Hence, it
is possible to calculate the distance from satellites as distance → time × velocity of
light. The receiver also knows the exact position of satellite via the signal. The
receiver is therefore able to determine its exact distance from satellite.

24
Literature Review
Land suitability and crop substitution modeling for cassava (Tamkuan,
2013).in Thailand shows that it is importing highly expensive energy sources such as
petroleum products. However, cassava and sugarcane can be used as both a food and
an alternative energy source. Therefore, this study suggests the use of biofuel crops to
be utilized as a source of energy. Kampaeng-phet province was selected as the
research area in this research because it had potential for many industries to support
growing these crops and extent the plantation. This study has three objectives. The
first objective was land evaluation for cassava considering 10 factors including soil
texture, soil depth, soil drainage, soil fertility, soil pH, surface water, irrigation,
rainfall, temperature and slope. Then, the weights of factors were investigated by
analytic hierarchy process (AHP) and Fuzzy AHP. It was found that Fuzzy AHP had
more accuracy than AHP to evaluate the land suitability for cassava plantation. The
second objective was to classify agricultural areas using HJ-1A satellite images. the
two methods of classification in this study were pixel base classification (maximum
likelihood), and object based classification. For this objective, it was found that object
based classification had an overall accuracy of 76.27% which was more than pixel-
based classification (64.55%). The last objective was to make crop substitution model
for extending cassava plantations with regard to land suitability, and economics
(revenue and profit). The different scenarios showed many different options for
planting biofuel crops. Crop substitution modeling with regard to land suitability
suggested an area suitable to growing cassava of 278.68 sq.km. The model regarding
profit suggested an area suitable for substitution to cassava of 1196.76 sq.km.
Some implications on agricultural land use as affected by land quality in
Sakon Basin, Northeast Thailand were also examined (Mongkolsawat, 2011). Crop
requirements are normally confined to certain land qualities which in turn reflect land
use pattern in these areas. Exploring land quality under a given land use was
conducted with the objective of identifying the land quality limitations and its
consequences on land use patterns. The study area, Amphoe Wanon Niwat, is located
in Sakon Nakhon basin and significantly differs in land use pattern when compared to
the extensive areas in the Northeast. The study used 1995 Landsat TM and 2002
orthophotography to identify the changes in land use patterns of the areas. Evaluation

25
of land suitability for cassava was conducted based on integrated land qualities
concerned using GIS. With the established GIS database, the overall insight into each
land quality affecting the crops could be determined. The spatial land qualities and
their associated attributes were used to analyze the causes and their consequences on
land use patterns. The work demonstrates that an analysis of satellite data and aerial
orthophotos can provide detailed, spatially explicit identification of land qualities
causing the consequent agricultural land use pattern in the Sakon Nakhon Basin. The
shallow lateritic soils, improper land use and mis-management of land have
significantly caused the current land use patterns with relatively low agricultural
productivity.
There was also a study on estimation of cassava producing areas using
Remote Sensing and Geographic Information Systems in the northeast region of
Thailand (Rajendra, 1999). The study on cassava plantation area and production was
conducted in the northeast region of Thailand using integrated Satellite Remote
Sensing (SRS) and Geographic Information Systems (GIS). Although SRS and GIS
are considered to be efficient tools for resource inventorying and monitoring, little
work has been done in Thailand with regards to large-area crop monitoring and
production estimation. The objective of the study was to explore the use of NOAA
AVHRR data for mapping cassava plantation areas. GIS was employed to create
geographical database, such as soils, topography, and land use and also for improving
the results of image classification. The study, conducted over the two crop seasons of
1995 and 1996 indicated that NOAA-AVHRR data can be used to map the cassava
plantation areas at the regional scale in Thailand. The results of the study were
compared with existing cassava statistics produced from the Thai Tapioca
Development Institute (TTDI) and the Office of Agricultural Economics (OAE),
Thailand. The estimated cassava plantation areas from the study were underestimated
by - 9.7 and - 16.4 percent to that of TTDI and OAE, respectively, for 1995 and
overestimated by 4.0 percent but underestimated by - 14.4 percent, respectively, for
the year 1996.
Land suitability for cassava and assessing cassava cropping area with
satellite data and Geographic Information Systems (Mongkolsawat W. P., 2008) was
also studied. Cassava is a major annual crop in Northeast Thailand requires minimal

26
cultural attention and cash input, it is tolerant to drought, and is an efficient extractor
of nutrients in infertile soil. Over 50% of the cassava production in Thailand
originates from the Northeast. Land suitable for cassava should be identified to
support the increase of its yield through effective land utilization. The study was made
with the aims of analyzing the integration of land qualities to evaluate land based on
FAO guidelines, with respect to cultivation practices and minimal soil loss as well as
economic viability. The study area, Northeast Thailand, covers an estimated 170,000
km2
with over 1 million ha of cassava cropped area and is characterized by gently
undulating topography. The overall evaluation of land for cassava in the Northeast
was based on the integrated requirements of crop, management, conservation and
economic viability.
Evaluation of cassava planting potential with Remote Sensing and
Geographic Information System (GIS) (Zhang Chao, 2010) was also studied. Along
with the development of the starch and grain alcohol industries, biomass energy
production has recently become important. Cassava is an important biomass energy
plant. In this paper, Geographic Information System (GIS) and remote sensing (RS)
are used, along with knowledge of the growing environment needed for cassava and
the farmland and ecology protection policy of China, to evaluate the cassava-growing
potential of Winning County. The processing of spatial data is done first. Then, the
evaluation principles are defined according to the spatial data and the required growth
conditions. The evaluation data are obtained by spatial data analysis according to the
evaluation principles. Lastly, the cassava planting potential results are verified by
referencing these to cassava planting statistical data for 2005 provided by Nanning
City Government of Guangxi province.
Another study referred to is conformity of agricultural land use and physical
stability in Khon Kaen, Northeast Thailand. This study established a database of land
suitability for cassava (S.Sukchan, 2003). The evaluation of land in terms of its
suitability for cassava is based on the procedure as described in FAO guidelines for
land evaluation for agriculture. The study area, Khon Kaen Province, covers an area
of about 1,088,599 ha. The cassava requirements include a number of land qualities
which affect the plant growth and yield. The land qualities, on which the suitability
are based, consist of rainfall, irrigated area, soil texture and drainage, soil depth, base

27
saturation, cation exchange capacity, available phosphorus, landform, slope and
salinity of soil. Each of land quality in terms of spatial data were digitally encoded in
Geographic Information System databases to create thematic layers. With the
selection criteria, the overlay of those land qualities was digitally performed to
produce resultant, polygonal layer, each of which is a land unit. The land suitability
model applied to the resultant layer provides the suitability class. The result indicated
that the most extensive areas are marginally suitable and cover areas of about 37% of
the province

CHAPTER 3
RESEARCH METHODOLOGY
This chapter gives an overview of data collection, data requirements and the
method applied for processing as well as the modeling approach, geographical dataset
creation and analysis techniques adopted. The findings of this research can be adapted
to form the basis for driving statics in the classification of cassava plantation in
Banteay Meanchey Province and, subsequently, over broader areas.
The methodology workflow to achieve the objectives are shown below
Figure 3-1 Classification of workflow

29
This chapter will discuss data acquisition and the processing of data
collected in preparation for its inclusion in analysis for classification of cassava
plantation. The discussion begins with a brief overview of the satellite image.
Figure 3-2 SMMS (HJ-1A)
The figure above is a Satellite image from Chines Huan Jing-1A (HJ-1A),
derived on the 02 March, 2015 by code LT51280512011018BKT00 path 07 and row
105. The reference datum of this image was WGS 1984 and the map projection was
UTM zone 47N.

30
Figure 3-3 Enhanced LANDSAT 8 Imagery in 2015
The satellite image from LANDSAT 8 shown above was derived in four
parts on the 03rd ,07th February, 2015 and 02,nd 18th March, 2015 by LANDSAT 8
code LC81270502015054LGN00, LC81270512015038LGN00 path 127 and row
50,51 and LC81280502015077LGN00, LC81280512015061LGN00 path 128 and row
50, 51 using the OLI and TIRS. The reference datum of this image was WGS 1984
and pat the map projection was UTM zone 47N.
Geocorrection of LANDSAT Imagery
Geometric correction of satellite images involves modeling the relationship
between the image and ground coordinate systems. There are both systematic and
non-systematic geometric errors present in satellite imagery (Jenson, 1996). The

31
systematic errors in Landsat imagery are well documented, and are primarily
functions of scan skew, mirror scan velocity, panoramic distortion, platform velocity,
perspective and earth rotation (Mather, 1999; Jenson, 1996). Data on sensor
characteristics and ephemeris information are modeled and applied to the raw imagery
as part of the systematic correction performed by the Landsat receiving stations
(Masek et al., 2001). Assuming an accurate ephemeris based correction software
model is implemented, systematic errors are corrected in commercially available
Landsat imagery. Non-systematic errors are mainly caused by variation through time
in the position and attitude angles of the satellite platform (Janson, 1996).
The stage in Geo-correcting an image is to select an appropriate map
reference system for the area of interest. Correction of all data sources to a single map
projection will allow accurate and easy integration, so choosing the correct system is
critical to success. To Geo Correct your scanned field slip you will input four control
points with known x and y coordinates into the corners of the images. The coordinate
values used will be junctions of North -South and East-West oriented divisions of the
British National grid, which can be assumed to have a precise position and value.
Geocorrection rectification is assigning coordinates to known locations
Ground Control Point and GCPs. The Data pixels must be related to ground locations
such as in UTM coordinates using two main methods: Image to Image correction
involves matching the coordinate systems of one digital image to another image
acting as a map reference
Data exploration and preprocessing
Data exploration
The classification analysis is based on the assumption that the band data and
the training sample data follow normal distribution. To check the distribution of the
data in a band, use the interactive Histogram tool on the Spatial Analyst toolbar. To
check the distribution of individual training samples, use the Histograms tool on the
Training Sample Manager (ArcGIS Resource, 2013).
32
Stretching of band data
The classification process is sensitive to the range of values in each band. To
have the attributes of each band considered equally, the value range for each band
should be similar. If the value range of one band is too small (or too large) relative to
the other bands, it can use the mathematical tools in the Spatial Analyst toolbox to
stretch it. For example, we can use the Times math tool to multiply the band with a
constant value to stretch its value range.
Creating a multiband image
The Image Classification toolbar works with a multiband image layer. To
load individual bands to a new multiband image, use the Composite Bands tool.
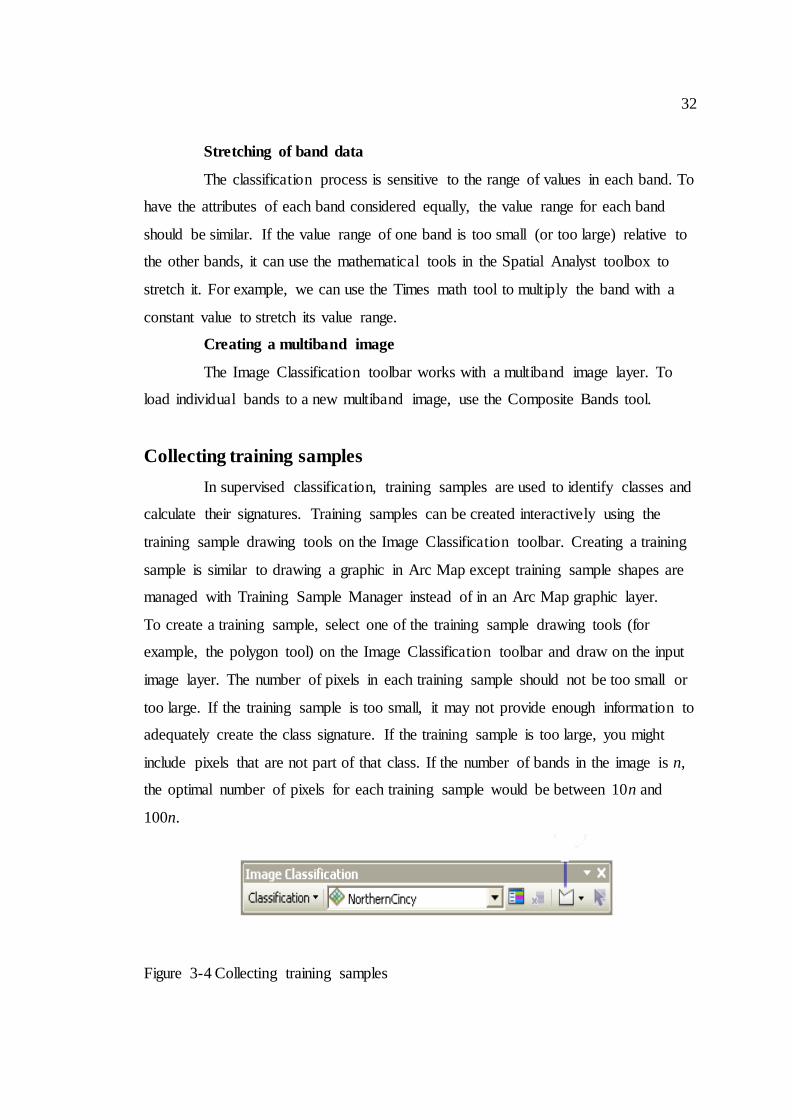
Collecting training samples
In supervised classification, training samples are used to identify classes and
calculate their signatures. Training samples can be created interactively using the
training sample drawing tools on the Image Classification toolbar. Creating a training
sample is similar to drawing a graphic in Arc Map except training sample shapes are
managed with Training Sample Manager instead of in an Arc Map graphic layer.
To create a training sample, select one of the training sample drawing tools (for
example, the polygon tool) on the Image Classification toolbar and draw on the input
image layer. The number of pixels in each training sample should not be too small or
too large. If the training sample is too small, it may not provide enough information to
adequately create the class signature. If the training sample is too large, you might
include pixels that are not part of that class. If the number of bands in the image is n,
the optimal number of pixels for each training sample would be between 10n and
100n.
Figure 3-4 Collecting training samples

33
Evaluating training samples
When training samples are drawn in the display, new classes are
automatically created in the Training Sample Manager. The manager provides it with
three tools to evaluate the training samples the Histograms tool, the Scatterplots tool,
and the Statistics tool. You can use these tools to explore the spectral characteristics
of different areas. You can also use these tools to evaluate training samples to see if
there is enough separation between the classes
Figure 3-5 Evaluation training sample editing classes
Depending on the outcome of the training sample evaluation, it may be
necesssary to merge the classes that are overlapping each other into one class. This
can be done using the Merge tool in the manager window. In addition, it can rename
or renumber a class, change the display color, split a class, delete classes, save and
load training samples, and so forth. The following image shows how to merge two
classes
Figure 3-6 Editing class
34
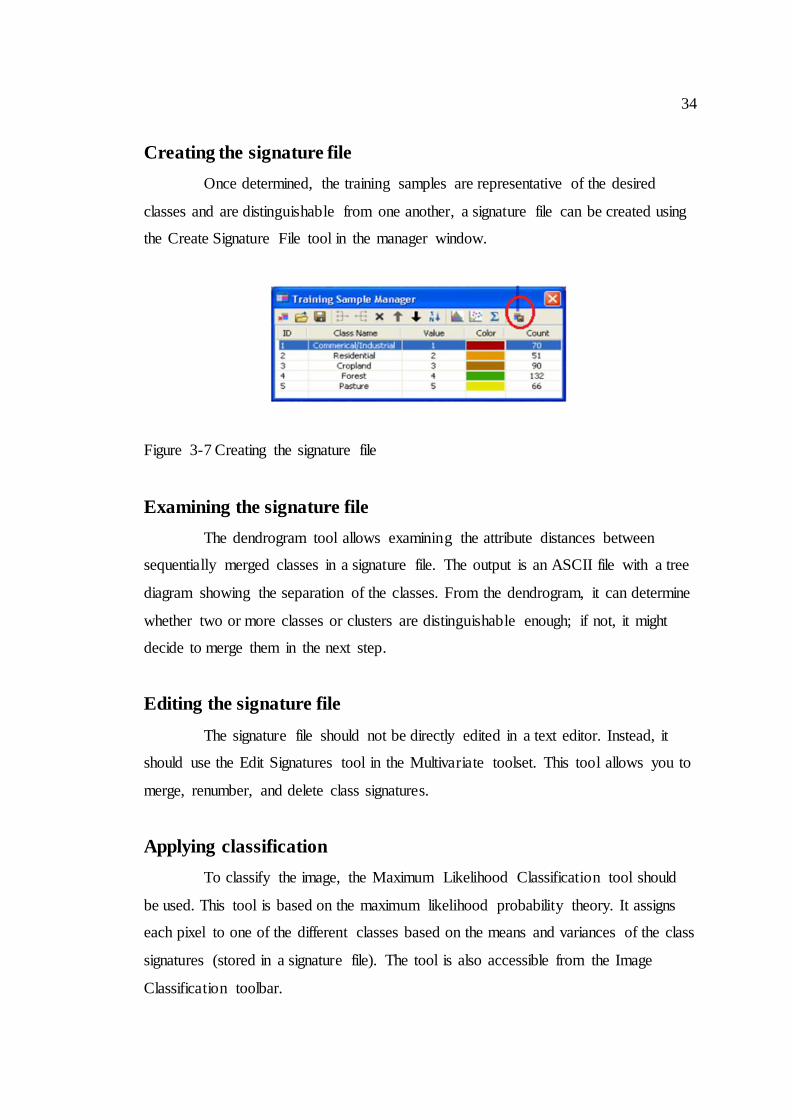
Creating the signature file
Once determined, the training samples are representative of the desired
classes and are distinguishable from one another, a signature file can be created using
the Create Signature File tool in the manager window.
Figure 3-7 Creating the signature file
Examining the signature file
The dendrogram tool allows examining the attribute distances between
sequentially merged classes in a signature file. The output is an ASCII file with a tree
diagram showing the separation of the classes. From the dendrogram, it can determine
whether two or more classes or clusters are distinguishable enough; if not, it might
decide to merge them in the next step.
Editing the signature file
The signature file should not be directly edited in a text editor. Instead, it
should use the Edit Signatures tool in the Multivariate toolset. This tool allows you to
merge, renumber, and delete class signatures.
Applying classification
To classify the image, the Maximum Likelihood Classification tool should
be used. This tool is based on the maximum likelihood probability theory. It assigns
each pixel to one of the different classes based on the means and variances of the class
signatures (stored in a signature file). The tool is also accessible from the Image
Classification toolbar.

35
The Interactive Supervised Classification tool is another way to classify
images. This tool accelerates the maximum likelihood classification process. It allows
one to quickly previewing the classification result without running the Maximum
Likelihood Classification tool.
Post-classification processing
The classified image created by the Maximum Likelihood Classification tool
may misclassify certain cells and create small invalid regions. To improve
classification, it may want to reclassify these misclassified cells to a class or cluster
that is immediately surrounding them. The most commonly used techniques to clean
up the classified image include filtering, smoothing class boundaries, and removing
small isolated regions. A more visually appealing map results from the data cleanup
tools.
Filtering the classified output
This process will remove single isolated pixels from the classified image. It
can be accomplished by either the Majority Filter tool or the Focal Statistics tool with
Majority as the statistics type. The difference of the two tools is that the Majority
Filter tool assumes a 3 x 3 square neighborhood during the processing, while the
Focal Statistics tool supports more neighborhood types.
Smoothing class boundaries
The Boundary Clean tool clumps the classes and smooth the ragged edges of
the classes. The tool works by expanding and then shrinking the classes. It will
increase the spatial coherency of the classified image. Adjacent regions may become
connected.
Generalizing output by removing small isolated regions
After the filtering and smoothing process, the classified image should be
much cleaner than before. However, there may still be some isolated small regions on
the classified image. The generalizing process further cleans up the image by
removing such small regions from the image. This is a multi-step process which
involves several Spatial Analyst tools.
1. Run the Region Group tool with the classified image to assign unique
values to run each region on the image.

36
2. Open the attribute table of the new raster layer created by the Region
Group tool. Use the pixel counts to identify the threshold of small regions that you
want to remove.
3. Create a mask raster for the regions you want to remove. This can be
done by running the Set Null tool to set the regions with small numbers of pixels to a
null value.
4. Run the Nibble tool on the classified image. Use the mask raster created
from the Set Null tool from the previous step as the Input mask raster. This will
dissolve the small regions on the output image.
Equipment of Analysis
In this section, some key equipment in participatory research and analysis is
given. Computer tools to assist in the research, collection of data, and the writing of
this thesis and analysis with other programs of overall use include:
Hardware
Central Processing Unit (CPU) cor i5 2.6GHZ
Read and Memory (RAM) 4GHZ
Printer: for printing thesis
Camera: IPad Air
Global Position System (GPS)
Software Application
The ArcGIS was used to present the resulting map and image from the
analyses carried out on the research, and used Microsoft office for facilitates sit thesis.
The table below outlines the software
37
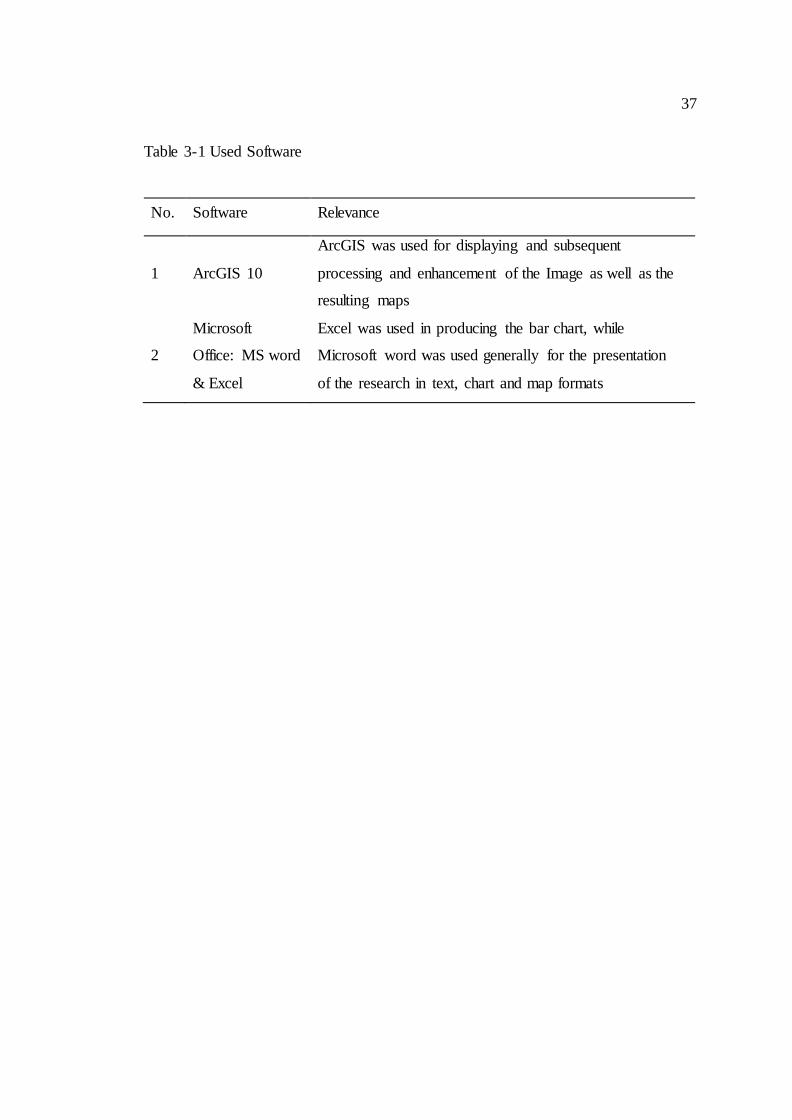
Table 3-1 Used Software
No. Software Relevance
1 ArcGIS 10
ArcGIS was used for displaying and subsequent
processing and enhancement of the Image as well as the
resulting maps
2
Microsoft
Office: MS word
& Excel
Excel was used in producing the bar chart, while
Microsoft word was used generally for the presentation
of the research in text, chart and map formats

CHAPTER 4
RESULTS
The object of this study form the basis for analysis present in this chapter.
The results are presented using map, charts and statistical tables and examines the
application of geospatial technology compared with LANDSAT 8 (OLI) and SMMS
(HJ-A1) 2015 image satellites. land use was classified in nine classes in Banteay
Meanchey province. Seven categories of land use which were identified these are:
cassava, field crops, forest, water, perennial trees/fruit trees, rice and urban using
maximum likelihood.
Land use from SMMS (HJ-A1)
Land use in Banteay Meanchey province for 2015, as measured by land use
classification of SMMS (HJ-A1) satellite images covers a total of about 6,185.64
square kilometers or about 618,564.44 hectares, by generation results as follows:
Cassava covers approximately 972.15 square kilometers or 97,215.33
hectares an about 15.72 percent of the total area.
Field crops cover approximately 742.74 square kilometers or 74,273.76
hectares or 12.01 percent of the total area.
Forest cover approximately 221.46 square kilometers or approximately
22,146.02 hectares or 3.58 percent of the total area.
Water covers approximately 283.40 square kilometers or 28,340.40 hectares
or 4.58 percent of the total area.
Perennial tree/Fruit tree with an area of approximately 1,075.64 square
kilometers or 107,564.40 hectares or 17.39 percent of the total area.
Rice covers approximately 2,531.59 square kilometers or 253,158.56
hectares or 40.93 percent of the total area.
Urban areas cover approximately 358.66 square kilometers or 35,865.98
hectares or 5.80 percent of the total area.

39
Table 4-1 Land use of Banteay Meanchey province from SMMS (HJ-A1) 2015
Land use Hectares Square
kilometers Percentage
Cassava 97,215.33
972.15 15.72
Filed crop 74,273.76
742.74 12.01
Forest 22,146.02
221.46 3.58
Water 28,340.40
283.40 4.58
Perennial trees/
Fruit trees 107,564.40
1,075.64 17.39
Rice 253,158.56
2,531.59 40.93
Urban 35,865.98
358.66 5.80
Total 618,564.44
6,185.64 100.00
Figure 4-1 Percentage of land use in Banteay Meanchey SMMS (HJ-A1)
Cassava
15.72%
Field crop
12.01%
Forest
3.58%
Water
4.58%
Perennial
Trees/Fruit Trees
17.39%
Rice
40.93%
Urban
5.80%

40
Figure 4-2 Area of land use in Banteay Meanchey SMMS (HJ-A1)
Figure 4-3 SMMS (HJ-A1) map of Banteay Meanchey showing location of cassava
plantation fields of studies
-
500.00
1,000.00
1,500.00
2,000.00
2,500.00
3,000.00
Cassava
Filed crop
Forest
Water
Perennial Trees/Fruit Trees
Rice
Urban
Field crop

41
Figure 4-4 Map SMMS (HJ-A1) classification of Banteay Meanchey showing
location of fields of study
Land use from LANDSAT 8 (OLI)
The tables below show Land use by satellite image of LANDSAT 8 (OLI)
in the 2015 using land use classification of LANDSAT satellite images covering a
total of 6,185.64 square kilometers or about 618,564.44 hectares and generates result
as follows:
Cassava covers approximately 837.57 square kilometers or 83,757.37
hectares or about 13.54 percent of the total area.
Field crops cover approximately 653.87 square kilometers or 65,386.54
hectares or 10.57 percent of the total area.
Forest covers approximately 268.25 square kilometers or 26,825.14 hectares
or 4.34 percent of the total area.

42
Water covers of approximately 421.43 square kilometers or 42,143.43
hectares or 6.81 percent of the total area.
Perennial trees/Fruit trees cover approximately 1,170.80 square kilometers
or 117,079.71 hectares or 18.93 percent of the total area.
Rice covers approximately 2,508.45 square kilometers or 250,845.26
hectares or 40.55 percent of the total area.
Urban areas cover approximately 325.27 square kilometers or 32,527.00
hectares or 5.26 percent of the total area.
Table 4-2 Land use of Banteay Meanchey province from LANDSAT 8 (OLI)
Land use Hectares
Square
kilometers Percentage
Cassava 83,757.37 837.57 13.54
Field crops 65,386.54 653.87 10.57
Forest 26,825.14 268.25 4.34
Water 42,143.43 421.43 6.81
Perennial trees/
Fruit trees 117,079.71 1,170.80 18.93
Rice 250,845.26 2,508.45 40.55
Urban 32,527.00 325.27 5.26
Total 618,564.44 6,185.64 100.00

43
Figure 4-5 Percentage of land use in Banteay Meanchey from LANDSAT 8 (OLI)
Figure 4-6 Area of land use in Banteay Meanchey from LANDSAT 8 (OLI)
Cassava
13.54% Field crop
10.57%
Forest
4.34%
Water
6.81%
Perennial
Trees/Fruit Trees
18.93%
Rice
40.55%
Urban
5.26%
-
500.00
1,000.00
1,500.00
2,000.00
2,500.00
3,000.00
Cassava
Filed crop
Forest
Water
Perennial Trees/Fruit Trees
Rice
Urban
Field crop

44
Figure 4-7 The LANDSAT 8 (OLI) satellite map of Banteay Meanchey showing
location of cassava plantation fields of study
Figure 4-8 The LANDSAT 8 (OLI)satellite image map of Banteay Meanchey
province showing location of fields of study

45
Land use comparison of SMMS (HJ-A1) and LANDSAT 8 (OLI)
Compare in land use Small Multi-Mission Satellite identified and analyze
that the Cassava area has increased by13,457.96 hectares or 2.18 percent, field crop
area has increased by 8,887.22 hectares or 1.44 percent, forest area has decreased
markedly by 4,679.12 hectares or 0.76 percent, water area has decreased markedly by
13,803.03 or 2.23 percent, Perennial Trees/Fruit trees have decreased markedly by
9,515.31 hectares or 1.54 percent, Rice area has increased 2,313.30 hectares or 0.37
percent, urban areas have increased markedly by 3,338.98 hectares or 0.54 percent.
Table 4-3 Comparison of land use in Banteay Meanchey province by LANDSAT 8
(OLI) and SMMS (HJ-A1) satellite images
SMMS (HJ-A1) LANDSAT 8 (OLI) Difference
Land use Hectares Square
kilometers Hectares
Square
kilometers Hectares
Square
kilometers
Cassava 97,215.33 15.72 83,757.37 13.54 13,457.96
2.18
Field crops 74,273.76 12.01 65,386.54 10.57 8,887.22 1.44
Forest 22,146.02 3.58 26,825.14 4.34 -4,679.12 -0.76
Water 28,340.40 4.58 42,143.43 6.81 -13,803.03 -2.23
Perennial
trees/Fruit
trees
107,564.40 17.39 117,079.71 18.93 -9,515.31 -1.54
Rice 253,158.56 40.93 250,845.26 40.55 2,313.30 0.37
Urban 35,865.98 5.80 32,527.00 5.26 3,338.98 0.54
Total 618,564.44 100.00 618,564.44 100.00

46
Figure 4-9 Comparison of land use in Banteay Meanchey province by LANDSAT 8
(OLI) and SMMS (HJ-A1) satellite images
Values accuracy of model
By adopting the land use map from the 2015 model, the models show that
the accuracy of the 2015 land-use maps can be obtained from the classification of
satellite data. The implementation of random sampling point out that the review result
of the 2015 land use model is accurate and found that the model generated an overall
accuracy of 75.56 percent from the land use classify SMMS (HJ-A1) satellite and the
model show an the overall accuracy of 81.48 percent land use from the LANDSAT 8
(OLI) satellite.
-
50,000.00
100,000.00
150,000.00
200,000.00
250,000.00
300,000.00
SMMS
LANDSAT
(HJ-A1)
8 (OLI)

47
Figure 4-10 Map showing sample locations to determine accuracy
Table 4-4 Dislocation evaluation the accuracy of the classification of land use by
SMMS (HJ-A1) satellite
Classifieds
Data
Reference data
Cassava Field
crop Forest Water
Perennial
trees/
Fruit trees
Rice Urban Total
Cassava 26 3 0 0 2 3 1 35
Field crop 4 13 1 1 1 2 0 22
Forest 0 0 5 1 0 0 0 6
Water 0 0 0 6 0 1 1 8
Perennial
trees/Fruit
trees
1 1 2 1 52 3 2 62
Rice 4 8 4 6 2 90 4 118
Urban 2 1 1 2 0 1 12 19
Total 37 26 13 17 57 100 20 270
Overall Accuracy for SMMS (HJ-A1) 204/270*100=75.56 %
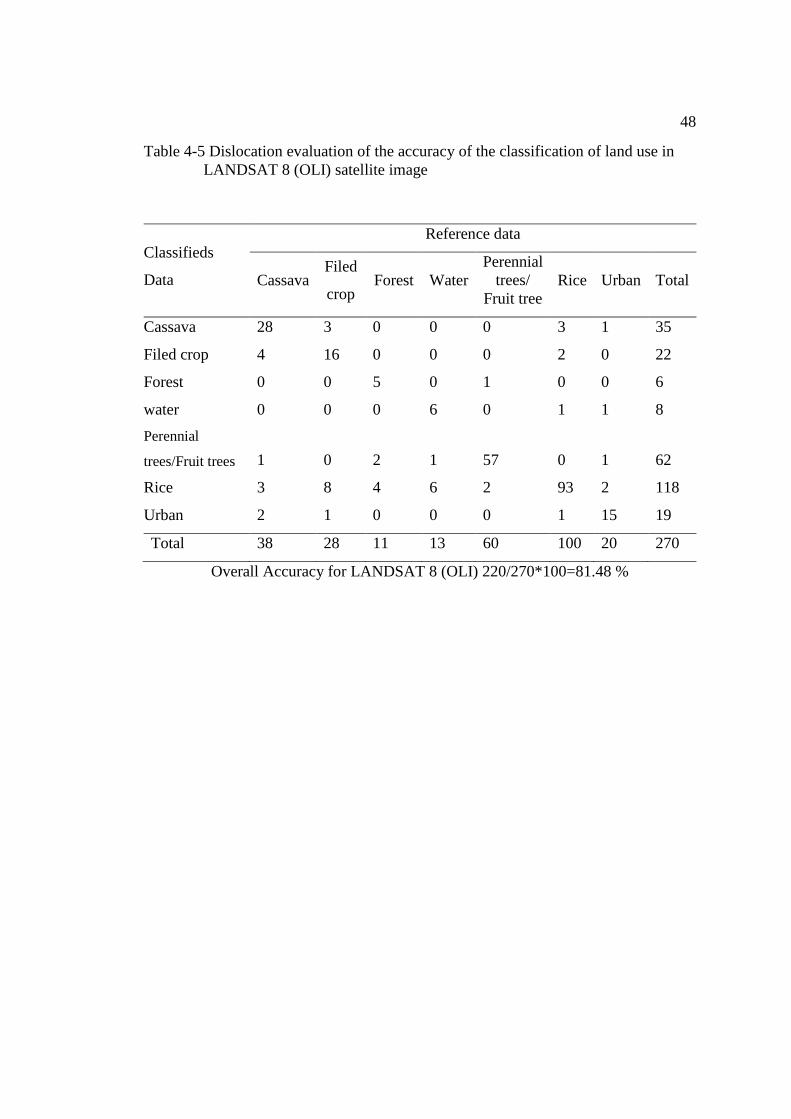
48
Table 4-5 Dislocation evaluation of the accuracy of the classification of land use in
LANDSAT 8 (OLI) satellite image
Classifieds
Data
Reference data
Cassava Filed
crop Forest Water
Perennial
trees/
Fruit tree
Rice Urban Total
Cassava 28 3 0 0 0 3 1 35
Filed crop 4 16 0 0 0 2 0 22
Forest 0 0 5 0 1 0 0 6
water 0 0 0 6 0 1 1 8
Perennial
trees/Fruit trees 1 0 2 1 57 0 1 62
Rice 3 8 4 6 2 93 2 118
Urban 2 1 0 0 0 1 15 19
Total 38 28 11 13 60 100 20 270
Overall Accuracy for LANDSAT 8 (OLI) 220/270*100=81.48 %

CHAPTER 5
DISCUSSION, CONCLUSION AND RECOMMENDATION
The main purpose this chapter is to synthesize the result from chapter four
and provide answers to the objective of which aims to classify the area planted to
cassava in Banteay Meanchey province using Maximum Likelihood Supervised
Classification explore comparison of the cassava plantation area obtained between
LANDSAT 8 (OLI) and SMMS (HJ-1A). This chapter discusses the findings of
analysis and their significant, conclusions and recommendations for further study.
Discussion
This chapter discusses the classification of cassava planed area in Banteay
Meanchey. The results form land use analysis compares land use classified form
LANDSAT8 (OLI) and SMMS (HJ-A1) satellite imagery. Land use is divided into
seven categories, namely: cassava, field crops, forest, water, perennial trees/fruit trees,
rich and urban. The classification using SMMS (HJ-A1) satellites in 2015 revealed
the area of these seven types were 97,215.33, 74,273.76, 22,146.02, 28,340.40,
107,564.40, 253,158.56 and 35,865.98 hectares respectively.
Rice area was the dominate land use accounting for 40.93 percent of the
total area, followed by cassava, field crops, forest, water, perennial trees/fruit trees,
rice and urban accounting for 40.93 percent, 15.72, 12.01, 3.58, 4.58, 17.39, 40.93
and 5.80.percent, respectively.
The result of classification by LANDSAT 8 satellite imagery in the year
2015, show the area of seven types as 83,757.37, 65,386.54, 26,825.14, 42,143.43,
117,079.71, 250,845.26 and 32,527.00 hectares respectively. Rice accounted for 40.55
percent of the total area, but compared to the SMMS (HJ-A1) satellite, it was found
that the area decreased by 2,313.30 hectares representing 0.37 percent of the total
area, followed by field crops, urban and cassava and aquaculture accounting for 1.44,
0.54 and 2.18 percent. And another area has increased such as forests, water and
perennial trees/ fruit trees and aquaculture accounting for 4,679.12, 13,803.03 and
9,515.31 hectare respectively, which is 0.76, 2.23 and 1.54 percent respectively.

50
When compared SMMS (HJ-A1) with LANDSAT 8 images, it was found
that cassava, field crops, rice and urban areas had increased and area decreasing such
as forest, water and perennial trees/fruit trees. The accuracy of land use models
generates an overall accuracy of 75.56 percent from the land use classified SMMS
(HJ-A1) and the model covers an overall accuracy of 81.48 percent of land use from
LANDSAT 8 (OLI), which shows that the accuracy is at medium and high levels
between the data obtained from monitoring changes and data for location details of
the trial and evaluation of the accuracy of each point in the survey.
Conclusion
Classification of cassava plantations using LANDSAT 8 (OLI) satellite
imagery, a case study Banteay Meanchey Province, Cambodia, used controlled
(Supervised Classification) providing the highest probability (Maximum Likelihood
Classification) and suitabity for Banteay Meanchey Province where cassava
plantation cover approximately 837.57 square kilometers or 83,757 hectares
accounting for 15.72 percent of the total study area. Comparing the results of the
classification using SMMS (HJ-A1) satellite imagery reveals a different in percentage
of 2.18 found in the area under cultivation of cassava from SMMS (HJ-A1) which
showed approximately 975.15 square kilometers or 97,215.33 hectares representing
15.72 percent of the total area. The result of the inspection is accurate with, the
classification of LANDSAT 8 (OLI) and SMMS (HJ-A1) satellite images having
approximately 75.56 and 81.48 percent respectively. The accuracy levels are
considered moderate and high. This accuracy of this study is similar to the findings of
Yamamoto and Suckchan when studying the appropriate classification of land (Land
suitability) for rice, sugarcane and cassava using factors include area classification.
Results from monitoring the overall accuracy of the classification (Overall accuracy
assessment) found that the overall accuracy of the classification was 81.48% by
reason of LANDSAT 8 (OLI) was higher than SMMS (HJ-A1), since LANDSAT 8
(OLI) has wavelength available upon request. In addition the numerical values, which
amounted to 16 bits or 65,536, more detailed satellite images than SMMS (HJ-A1)
with the numerical value of 8-bit or 256.

51
This study revealed the area of cassava plantations which will provide useful
information to forecast the trends in cassava production. The results obtained from
this study serve as a good example of the application of remote sensing data and
geoinformation systems for agriculture. This application can be seen as a regional
pilot project to be adopted by many other provinces in Cambodia for various kinds of
agricultural cultivation such as rice, sugarcane, miaze, etc.
Recommendation
1. This study used satellite data from Landsat 8 and SMMS recorded from
different satellites at different times, so the results of the data analysis area deviated
from reality. Therefore, data should be taken form images of the same time and
analyzed to provide information with increased accuracy.
2. The classification of data using satellite images of cassava plantations
required the ability and experience of a translator. Although it did not affect the
accuracy of the maps of land uses, the accuracy of land use should be checked to
obtain current information and increased accuracy.
3. The distribution of numerical value Digital Number: DN of cassava, rice
and maize are similar for accuracy but must use high resolution satellite Landsat
images. Exploration of other factors related to crop planted, such as drainage of the
soil, depth of soil character of land index value NDVI
4. Continuing the trend of land use in the future can be must also use
appropriate resolution used as a guide in developing spatial databases and the
information may be used to plan development, including the preliminary management
of natural resources, area agriculture and environment.
5. The technology of remote sensing and GIS should be employed in major
studies, concerning nation issues such as agriculture and the environment etc.

52

52
REFERENCES
ArcGIS Resource. (2013). Retrieved December 12, 2012, from
http://resources.arcgis.com/en/help/main/10.2/index.html#//00nv00000003000000
Allem, A.C. (2002). The origins and taxonomy of cassava. In: R.J. Hillocks, et al.
(eds.), Cassava: Biology, production and utilization. CABI, Wallingfford,
UK. p.1-16
Berberoglu, S., & A. Akin (2009). Assessing different remote sensing techniques to
detect land use/cover changes in the Eastern Mediterranean. International
Journal of Applied Earth Observation and Geoinformation, 11(1), 46-53.
Burrough. (1986). Principle of Geographical Information System for Land Resoruces
Assesment. Oxford: Clearendon Prees.
CAMBELL, J.B. (1987). Introduction to remote sensing. The Guilford Press: New
York, p.287.
Cambodia Ministry of Agriculture Fish. (2010). Cassava production in Cambodia.
Retrieved December 12, 2012, from http://www.maff.gov.kh/.
______. (2014). General information in Cambodia. Retrieved December 12, 2012,
from http://www.maff.gov.kh/.
Cambodia, T. (2014). STUDY, LABOR ESTIMATING LABOR SITUATION IN THE
CAMBODIAN AGRICULTURE SECTOR 2014-2019. phnom Penh.
Collaborative study of cassava in Africa (COSCA) Ugandda. (1996). Production
prospects for cassava in Uganda. COSCA working paper No. 17.
Cock, J. H. (1982). Cassava: a basic energy source in the tropics. Science, vol. 218,
no. 4574, pp. 755-762,.
Council for the Development of Cambodia (CDC). (2010). Interaction Between
Foreign and Domestic Investment in Agriculture in Cambodia. Retrieved
December 12, 2012, from
http://www.uncatad.org/sections/wcmu/docs/ciimem3_2nd_sok_en.pdf)
Conceição, d. (1981). A Mandioca. Livraria Nobel. Sao Paulo, Brazil.
Davis, B. (1996). GIS: A Visual Approach . Onward Press, Thomsom Learning,
Canada
Dewan, A. M., & Y. Yamaguchi (2009). Land use and land cover change in greater

53
Dhaka, Bangladesh: Using remote sensing to promote sustainable
urbanization. Applied Geography, 29(3):390-401
Dong, L., W. Wang, M. Ma, J. Kong & F. Veroustraete (2009).The change of land
cover and land use and its impact factors in upriver key regions of the
Yellow River. International Journal of Remote Sensing, 30(5):1251-1265
Ebook, W. C. (2014). http://pdf-manualbook.rhcloud.com/load1/westminster-college/.
Retrieved December 12, 2012, from
http://www.westminster.edu/staff/athrock/GIS/GIS.pdf.
El-Sharkawy, M.A. (2012). Stress-tolerant cassava: the role integrative ecophysiology
breeding research in crop improvement. Open journal of Soil Science 2:162-
186.
Emmanuel Okogbenin1, T. L. (2013). Phenotypic approaches to drought in cassava:
review. Retrieved December 12, 2012, from
http://journal.frontiersin.org/Journal/10.3389/fphys.2013.00093/full
Englewood Cliffs, NJ: Prentice-Hall. (1990). In A geographic information system is a
facility for preparing, presenting, and interpreting facts that pertain to the
surface of the earth (p. page xi).
______. (1990). A geographic information system (GIS) is an information system
that is designed to work with data referenced by spatial or geographic
coordinates.
EoPortail Directory. (2010). Retrieved December 12, 2012, from
https://directory.eoportal.org/web/eoportal/satellite-missions/h/hj-1
Global Master Change Directory. (2012). Retrieved December 12, 2012, from
http://gcmd.gsfc.nasa.gov/KeywordSearch/Metadata.do?Portal=GCMD&Me
tadataType=0&MetadataView=Full&KeywordPath=&EntryId=[GCMD]AO
E_HJ1A_CCD1
Goetzke, R., M. Braun, H. Thamm and G. Menz (2008). Monitoring and modeling
urban land-use change with multitemporal satellite data.. (2008)
International Geoscience and Remote Sensing Symposium (IGARSS), 4 (1),
art.no. 4779770
HING Vutha, THUN Vathana. (2009). The Case of Cassava and Rubber in
Cambodia. Phnom Penh: CDRI.

54
Jansson, C., A. Westerbergh, J. Zhang, X. Hu, and C.Sun. (2009). Cassava, a potential
biofuel crop in (the) People's Republic of china. Applied Energy 86: 95-99
Jansson, J.R. (1996). Introductory Digital Image Processing: A Remoste Sensing
Perspective, 2nd
Editiion, Prentice Hall, New Jersey
Kevin Pollpeter, Eric Anderson Jordan, Wilson, Fan Yang. (2014). A report prepared
for the U.S.-China Economice and Security Review Cmention. IGCC.
Korang-Amokoh, s., Cudjoe, R.A. & Adams, E. (1987). Biological control of cassava
pest in Ghana. Prospects for the integartion of other strategies.
Lakhan, V. Chris. (1996). Introductory Geographical Information Systems. p. 54.
Leisz, S. J., N.T.T. Ha, N.T.B. Yen, N.T. Lamand T.D. Vien (2005). Developing a
methodology for identifying, mapping and potentially monitoring the
distribution of general farming system types in Vietnam's Northern
Mountain Region. Agricultural Systems, 85(3) Spec. Issue):340-363.
Lillesand, T.M., Kiefer, R.W. and Chipman, J.W.,. (2008). Remote sensing and image
and image interpretation . John Wiley & Sons, Inc., New York.: Sixth
edition.
Mapsofindia. (2012). Retrieved September 28, 2012, from
http://www.mapsofindia.com/gis/gis-components.html.
Masek, J.G., Honzak, M., Goward, S.N., Liu, P., and Pak, E. (2001). Landsat-7
ETM+ asan observatory for land cover: initial radiometric and geometric
comparisons with Landsat-5 Thematic Mapper. Remote Sensing of
Environment, 78: 118-130.
Mongkolsawat, P. a. (2008). Land suitability for cassava and assessing cassava
cropping area with satellite data and Geographic Information System.
_____. (2011). Geo-informatics Center for development of Northeast Thailand
Faculty of Science, Khon Kaen University. 40002.
Meanchey, D. o. (2014). Nations, Food and Agriculture Organization of the United.
Nguyen, T. (2015). Forest and land cover mapping in a tropical highland region.
Photogrametric Engineering and Remote Sensing73. Retrieved September
13, 2009, from https://www.uni-hohenheim.
Rahman, H. (2012). Strengthening of Satellite Based Crop Monitoring & Estimation
System for Food Security Application in Bangladesh. Retrieved September

55
20, 2012, from http://www.apsco.int/apsco-
ad/imapic/201331111295384388.pdf
Rajendra. (1999). Estimation of cassava area and production using Remote Sensing
and Geographic Information System in the northeast region of thailand.
Rubatsky, V.E and M. Yamaguchi. (1997). World Vegetables: Principles,
Production,and Nutritive Values, 2nd ed. New York, NY: Chapman & Hall.
Saha, M.V.K. Sivakumar P.S. Roy K. Harmsen S.K. (2003). In Satellite Remote
Sensing and GIS Applications in Agricultural Meteorology. Dehra Dun,
India: World Meteorological Organisation 7bis, Avenue de la Paix 1211
Geneva 2, Switzerland.
Tamkuan, M.N. (2013). Land suitability and crop Substitution Modeling for
Sugarcane and Cassava.
The Cambodian Ministry of Agriculture, F. a. (n.d.).
Tourism, C. o. (2015). webmaster at tourismcambodia. Retrieved December 15, 2012,
from http://www.tourismcambodia.com/travelguides/provinces/banteay-
meanchey.htm
USGS. (2009). Retrieved November 12, 2009, from Landsat Thematic Mapper Data
(TM): http://eros.usgs.gov/#/Guides/landsat_tm
_____. (2010). Thematic Mapper.. Retrieved December 12, 2010, from
http://eros.usgs.gov/#/Find_Data/Products_and_Data_Available/TM:
http://eros.usgs.gov
_____. (2010). Thematic Mapper. Retrieved November 12, 2010, from
http://eros.usgs.gov/#/Find_Data/Products_and_Data_Available/TM:
http://eros.usgs.gov/
_____. (2010). Using Landsat data. Retrieved November 12, 2010, from
http://landsat.usgs.gov/Using_Landsat_Data.php
_____. (2010). Using Landsat data. Retrieved December 6, 2010, from
http://landsat.usgs.gov/Using_Landsat_Data.php
Understanding GIS: The ARC/INFO Method. (1990). Redlands, CA: Environmental
System Research Institute.
World Bank. (2009). World Development Indicator. Washington, D.C.: World bank.
Yem, D. (2010). Key factors affecting the expanding irrigation in Cambodia.

56
Zhang Chao, Z. X. (2010). Evaluation of cassava planing potential with Remote
Sensing and GIS. (Z.X. Zhang Chao, Ed.) New Zealand Jornal of Agricuture
Resaerch Impact Factor & Informations, 50(5), 1135-1140
Zulu. (2011). globalsecurity.org. Retrieved July 21, 2011, from
http://www.globalsecurity.org/space/world/china/smms.htm

57

APPENDIX
CASSAVA PLANTATION IN BANTEAY MEANCHEY PROVINCE

58
Comparison of cassava plantations between LANDSAT 8 (OLI) Band
5-4-3 and SMMS (HJ-A1) Band 4-3-2
No Field survey SMMS (HJ-A1) 4-3-2 LANDSAT 8 (OLI)
5-4-3
1 Svay Check District,
TaBean Commune
X: 13°45'25" Y:102°58'38"
2 Svay Check District,
TaBean Commune
X: 13°46'51" Y:102°58'5"
3 Malai District, Ou Sralau
Commune
X: 13°33'48" Y:102°30'4"

59
Compares of cassava plantations between LANDSAT 8 (OLI) Band 5-
4-3 and SMMS (HJ-A1) Band 4-3-2
4 Malai District, Ou Sralau
Commune
X: 13°31'2" Y: 102°30'15"
5 Serei Saophoan District,
Kompong Svay Commune
X: 13°38'10" Y:102°56'44"
6 Malai District, Ou Sampor
Commune
X: 13°32'48" Y: 102°30'4"

BIOGRAPHY
Name Mr. Sopheak Pen
Date of Birth May 30, 1982
Place of Birth Commune #4 , Khan Toul Kork
Phnome Penh Municipality, Cambodia
Present Address Borey Chamkar Dong , # 38D, Chamkar Dong
Phnom Penh Municipality, Cambodia
Position held
2010-present Lecture in the Faculty of Science, Mean Chey
University of Computer Science, National Road
No 5, Banoy Village, Sangkat Teuk Thlar,
Serey Sophorn City, Banteay Meanchey
Province, Cambodia
Education
2001-2005 Bachelor of Computer Science, Royal
University of Phnom Penh
2009-2010 Pedagogy of National Institute Education,
Phnom Penh Municipality, Cambodia
2013-2015 Master of Science (M.Sc.geoinfomatics)
Faculty of Geoinformatics, Burapha University
Chon Buri, Thailand
Email address [email protected]
Format Checked by…………………………………
(Mrs. Waranya Chanasongkram)
..……/…….../……...