appendix i: jamaica plan deis wpcp and cso impact … plan deis wpcp and cso impact analysis ......
TRANSCRIPT

TECHNICAL MEMORANDUM
JAMAICA PLAN DEIS WPCP AND CSO IMPACT ANALYSIS
Prepared for
NEW YORK CITY DEPARTMENT OF CITY PLANNING
NEW YORK CITY ECONOMIC DEVELOPMENT CORPORATION
NEW YORK CITY DEPARTMENT OF ENVIRONMENTAL
PROTECTION
Prepared by HYDROQUAL, INC.
January 2007
Jamaica Plan DEIS WPCP and CSO Impact Analysis January 2007
Page 1 of 26
Jamaica Plan DEIS WPCP and CSO Impact Analysis
January 2007 I. Introduction This document has been prepared in support of the Jamaica Plan Draft Generic Environmental Impact Statement (DGEIS) and in accordance with the City Environmental Quality Review (CEQR) Technical Manual. It presents calculations regarding the annual loads to Jamaica Bay for total nitrogen (TN), fecal coliform, and Biochemical Oxygen Demand (BOD-5) for the existing conditions, future conditions without the project (future no build), and future conditions with the project (future build). The estimates of these pollutant loads, as provided in the results table in Section IV, are intended for comparative use in the DGEIS Chapter 13 - Infrastructure, Sections B, C, and D, titled Existing Conditions, Future Without the Proposed Actions (No Build), and Future With the Proposed Actions (Build), respectively. The loads for the parameters of concern have been developed for the three CEQR conditions by summing the calculated loads from the three major sources in each of the water pollution control plant (WPCP) drainage areas tributary to Jamaica Bay. The WPCP drainage areas include those of the 26th Ward, Coney Island, Jamaica, and Rockaway WPCPs. The major loading sources to the Bay for each drainage area include WPCP effluent, combined sewer overflow (CSO), and non-CSO stormwater. The loading calculations are based on applying concentrations of TN and BOD-5 and fecal coliform counts per unit volume to flows for each of the three major loading sources. In each case, concentrations were based on calendar year 2005 information provided by the New York City Department of Environmental Protection (NYCDEP) in its annual Process Engineering Reports. Likewise, WPCP effluent flows for the existing conditions were determined based on NYCDEP calendar year 2005 information. Future build and no build condition WPCP flows were based on NYCDEP projections, and, in the case of the Jamaica WPCP, the future build and no build condition flows were based on the information provided in the August 2, 2006 AKRF draft of the DGEIS infrastructure chapter. For the CSO and stormwater loads, these base WPCP flows have been used along with the concentrations, tidal, and precipitation data as inputs into the computer models of the City sewer system (i.e., InfoWorks and RAINMAN) for the purposes of calculating flows and loads. More detailed descriptions of the basis of analysis and calculation methods are described below. The results of the analysis show that the future no build and future build conditions tend to be from 2 to 6 percent greater than the existing conditions with respect to TN and BOD-5 loading to Jamaica Bay. Fecal coliform loadings are estimated to be on the order of 12 percent less than existing conditions due to the completion of the Paerdegat CSO Retention Facility prior to 2015. However, the increases in loadings of the future build condition relative to the future no build condition tend to be less than one percent.

Jamaica Plan DEIS WPCP and CSO Impact Analysis January 2007
Page 2 of 26
Relative to the Jamaica WPCP drainage area and loading sources, the future no build and build conditions tend to be from 7 to 12 percent greater than the existing conditions with respect to TN, BOD-5, and fecal coliform loads. However, the increases in loadings of the future build relative to the future no build conditions tend to be 2 percent or less. Based on the analysis results as described herein, it is concluded that the proposed action would not result in significant adverse impacts on the water quality of Jamaica Bay. More comprehensive results are provided in Section IV. II. Basis of Analysis
A. Time Frames Existing conditions were based on data from calendar year 2005. Future build and no build conditions were based on projections for 2015. These time frames were selected to maintain consistency with the August 2, 2006 AKRF draft of the DGEIS Chapter 13 – Infrastructure.
B. Assumptions All of the Jamaica Plan area is in the drainage area of the Jamaica Bay WPCP and therefore the proposed action is assumed to impact only the Jamaica WPCP drainage area from a landside perspective. However, in order to accurately reflect future conditions in Jamaica Bay, which is affected by all four WPCP drainage areas tributary to the Bay, all four were included in the analysis. It has been assumed for this analysis that pollutant concentrations for future build and no build conditions will remain at current levels. This represents a conservative approach as NYCDEP will be upgrading facilities and adopting new best management practices that are expected to reduce pollutant concentrations. However, adequate information to predict the concentration reductions is not available. Therefore, existing concentrations have been used for future conditions. It has also been assumed that except for the Jamaica WPCP drainage area, 2015 stormwater inputs to WPCP daily flow averages will remain at calendar year 2005 levels (i.e., the difference between 2015 daily dry weather flow averages and 2015 daily flow averages will reflect those same differences in the 2005 data). The net changes in impervious land cover were assumed to be negligible between the existing, no-build and build conditions per the AKRF draft DGEIS infrastructure chapter. The proposed action consists largely of redeveloping existing developed areas with little change in open space, streets, and pervious cover. A significant change between the existing condition and the future conditions that has been included in the analysis is the Paerdegat CSO Retention Facility, currently under construction and due to be operational prior to 2015. This is most obviously manifested in the reduction of estimated CSO pollutant loadings in the Coney Island WPCP drainage area in 2015 relative to 2005.

Jamaica Plan DEIS WPCP and CSO Impact Analysis January 2007
Page 3 of 26
Precipitation recorded at John F. Kennedy airport in 1988 is used to perform the annual model simulations. Use of this rainfall record is consistent with other projection studies being performed in the NYC area, such as the New York City CSO Long Term Control Program (LTCP) being conducted in accordance with federal Clean Water Act and New York State Pollutant Discharge Elimination System (SPDES) permit requirements. Tidal patterns from the same time period are also input into the model to accurately simulate the hydraulics at the outfalls. Rainfall and tidal data was obtained from National Oceanic and Atmospheric Administration (NOAA).
C. Conservative Factors
The analysis performed for this technical memorandum has an inherent conservative bias due the exclusion of several important considerations that will likely reduce the 2015 pollutant loading impacts from the study area to Jamaica Bay relative to 2005 conditions. The following considerations were excluded because ongoing planning and design processes and comprehensive pollutant load reduction analyses are not yet complete.
• Green Building Practices/Requirements – Although not quantified herein, the construction that results from the proposed action will likely include onsite stormwater detention, enhanced water conservation practices, and possibly other sustainable water supply and wastewater and stormwater management techniques that will reduce flows relative to the future conditions used in this analysis. Some practices like onsite stormwater detention would be imposed by the NYCDEP when applicants apply for sewer connection permits. Others may originate from changes in regulations relative to Best Management Practices (BMPs) and Low Impact Development (LIDs) practices (i.e., “green building” techniques) that could be the result of the ongoing Jamaica Bay Watershed Protection Plan mandated by the City Council. These potential “green building” practices have not been included in this analysis, adding a measure of conservatism to the analytical approach.
• Jamaica Bay Comprehensive Plan – NYCDEP has been required by the Nitrogen
Consent Order to submit a comprehensive plan to the NYSDEC in October 2006 that will address the impacts of excess nitrogen on compliance with dissolved oxygen water quality standards in Jamaica Bay. This plan will likely result in infrastructure that will reduce WPCP effluent BOD and nitrogen concentrations. The most likely alternative will involve ongoing nitrogen load improvements (known as the Contract 12 upgrades) to the 26th Ward WPCP and implementation of level 2 BNR at the Jamaica WPCP. Rough estimates of TN load reductions for these two projects are provided in Table 1 below (but are not included in Section IV – Results).

Jamaica Plan DEIS WPCP and CSO Impact Analysis January 2007
Page 4 of 26
Table 1 – Jamaica Bay Comprehensive Plan Improvements
Infrastructure Improvements Existing TN
Concentration (mg/L)
Potential TN Concentration (mg/L)
Reduction in TN Load (lbs/yr)
26th Ward Continued Nitrogen Load Reduction (Contract 12 Upgrades)
13.82 10.52 593,000
Jamaica Level 2 BNR 20.85 13.27 1,986,000 Total na na 2,579,000
26th Ward 24%
Jamaica 36% Percent Reduction (Relative
to Existing Conditions in Jamaica & 26th Ward WPCP
Drainage Areas) Total 32%
Notes: Pollutant load reductions are relative to 2005 Existing Conditions in the Jamaica and 26th Ward WPCP drainage areas. Pollutant load reductions are approximate and are based on applying potential Jamaica Bay Comprehensive Plan TN concentrations to 2005 Existing Conditions flows. These estimates have not been included in Section IV – Results.
• CSO Facility Plans and Long Term CSO Control Plans – NYC DEP has submitted
CSO Water Quality Facility Plans to the NYSDEC that will result in construction of infrastructure that will reduce CSO pathogens, BOD and nitrogen. Examples include the expansion of the wet weather treatment capacity of the 26th Ward WPCP by 50 MGD and the construction of high level storm sewers in the Laurelton section of Queens. Gross estimates of pollutant load reductions for these two projects are provided in Table 2 below (but are not included in Section IV – Results).
Table 2 – CSO Facility Plan & CSO LTCP Estimated Pollutant Load Reductions
Infrastructure Improvements
Reduction in CSO Flow (MG/yr)
Reduction in TN Load (lbs/yr)
Reduction in BOD Load
(lbs/yr)
Reduction in Fecal Coliform Load
(billion count/yr) 26th Ward 50 MGD
Expansion 144 3,000 20,000 2,882,000
Laurelton High Level Storm Sewer Separation 829 6,000 28,000 3,631,000
Total 973 9,000 48,000 6,513,000 Percent Reduction
(Relative to Existing Conditions in Jamaica & 26th Ward WPCP
Drainage Areas)
15% 5% 6% 13%
Notes: Flow and pollutant load reductions are relative to 2005 Existing Conditions in the Jamaica and 26th Ward WPCP drainage areas. Pollutant load reductions are approximate and account for CSO flow reductions and stormwater flow increases. These estimates have not been included in Section IV – Results. The above described NYCDEP sewer system infrastructure projects will be initiated in the study area and many may be completed prior to the build year of 2015, representing significant changes in the pollutant loadings over time. These changes will reduce the difference between existing conditions and future conditions. The exclusion of these anticipated benefits from this analysis represents a conservative bias in the analysis, and the pollutant loads estimated in this report as presented in Section IV may be arguably viewed as an upper limit of pollutant loading from CSOs, stormwater, and WPCPs (i.e., the actual

Jamaica Plan DEIS WPCP and CSO Impact Analysis January 2007
Page 5 of 26
pollutant loads in the future build and future no build conditions will be lower than estimated herein).
D. Reference sources for base flows, concentrations, and model inputs The base data from which flows and concentrations were developed were obtained from the sources listed in the reference matrix below (Table 3). Check marks associate the loading sources and conditions with the base data from which it was developed.
Table 3: Reference Matrix Loading Source Condition
Variable Data Source WPCP CSO
Storm- water
Existing Future
No Build
Future Build
WPCP daily dry weather flow average per month and year
NYCDEP Process
Engineering Report
WPCP daily flow average per month and year (dry weather plus wet weather)
NYCDEP Process
Engineering Report
WPCP Average TN concentration per month (effluent)
NYCDEP Process
Engineering Report
WPCP Average BOD-5 concentration per month (effluent)
NYCDEP Process
Engineering Report
WPCP Average fecal coliform count per month (effluent)
NYCDEP Process
Engineering Report
CSO TN concentration [WPCP Average TN concentration per month (influent) ]
NYCDEP Process
Engineering Report
CSO BOD-5 concentration
NYCDEP Process
Engineering Report
CSO fecal coliform count per month
NYC CSO LTCP
STORMWATER TN concentration
NYC CSO LTCP
STORMWATER BOD-5 concentration
NYC CSO LTCP
STORMWATER fecal coliform count per month
NYC CSO LTCP
Projected Future No Build WPCP daily dry
NYC CSO LTCP

Jamaica Plan DEIS WPCP and CSO Impact Analysis January 2007
Page 6 of 26
Loading Source Condition
Variable Data Source WPCP CSO
Storm- water
Existing Future
No Build
Future Build
weather flow average per year (26th Ward, Coney Island, and Rockaway WPCPs) Projected Future Build WPCP daily dry weather flow average per year(26th Ward, Coney Island, and Rockaway WPCPs)
NYC CSO LTCP
Projected Future No Build WPCP daily dry weather flow average per year (Jamaica WPCP)
AKRF DGEIS
Projected Future Build WPCP daily dry weather flow average per year (Jamaica WPCP)
AKRF DGEIS
Rainfall Conditions NOAA
Sewer System Characteristics
NYC CSO LTCP
Data Source Key NYCDEP Process Engineering Report
New York City Department of Environmental Protection, Bureau of Wastewater Treatment, Process Engineering Section Operating Data Fiscal Year 2005, November 2005, and Fiscal Year 2006, November 2006.1
NOAA National Oceanic and Atmospheric Administration., http://www.noaa.gov/ NYC CSO LTCP Sewer system characteristics are based on comprehensive information compiled as part of the New
York City Department of Environmental Protection Combined Sewer Overflow Long Term Control Plan (NYCDEP CSO LTCP). Base information includes NYC sewer system Inflow and Infiltration maps, engineering drawings and as-builts, facility plans, and field work inspection reports. Projected future build and no build flow averages for the WPCPs are based on the projection analyses and calculations performed as part of the NYCDEP CSO LTCP.
AKRF DGEIS AKRF, Jamaica Plan Draft DGEIS Chapter 13 – Infrastructure, Section C – The Future Without the Proposed Actions (No Build) and Section D – The Future With the Proposed Actions (Build)
E. Sewer System Computer Modeling
A computer model – InfoWorks – was used to simulate the amount of combined sewage that overflows into Jamaica Bay from three of the four combined sewer (CS) tributary areas, namely Jamaica, 26th Ward, and Rockaway. The model simulated the amount of dry weather 1 Fiscal Year 2006 process engineering preliminary draft data was provided to HydroQual ahead of official publication. Final checks of data were performed upon receipt of fiscal year 2006 final process engineering report. Inconsequential differences existed, mainly due to rounding, therefore changes were not made to this analysis.

Jamaica Plan DEIS WPCP and CSO Impact Analysis January 2007
Page 7 of 26
sewage and the pollutant (i.e., TN, BOD-5, and fecal coliform) concentrations of that sewage for each sub-area of the study area tributary to Jamaica Bay. The model also simulated the amount of runoff and the pollutant concentrations of that runoff for each of the sub-areas. The model mixed the dry weather sewage and the wet weather runoff during rainfall events and included the CS regulator control decision-making rules that divert some of the wet weather flow to the WPCPs with the remainder being diverted to Jamaica Bay. Wet weather combined sewage not captured and diverted into the WPCP was calculated in the model as combined sewer overflow. Stormwater that runs off directly into Jamaica Bay was also simulated with the model. InfoWorks comes from a suite of models that are commercially available from Wallingford Software. The model is one of among a variety of high-end computer models developed for uses on desktop PC computers by European research/consulting organizations. For the Coney Island CS drainage area, the RAINMAN sewer system computer model was utilized. The RAINMAN model has been chosen to simulate conditions in the Coney Island drainage area in both the NYC Long Term Control Plan and Use and Standards Attainability studies. RAINMAN was developed by HydroQual, Inc. and is a FORTRAN program that uses the rationale formula to compute impervious surface runoff, and the model simulates the performance of regulators and interceptors to perform a flow balance around a given WPCP drainage area. Individual outfall overflows are calculated hourly as is the flow to the WPCP. Inputs to the model are similar to those in the InfoWorks framework including daily dry weather flow volumes and diurnal patterns, rainfall, and pollutant concentrations. As noted above, the RAINMAN model also includes regulator capacities to determine flows that are diverted as an overflow when the WPCP is beyond capacity. A number of factors are required as inputs for the sewer system models for the computation of the pollutant loadings for each of the sewer districts. Some of these model inputs represent features of the sewer system that have been developed over the past several decades and are independent of the simulation period. These are fixed features such as the number of and location of combined sewer regulators, the number of and location of CSO points, the drainage areas connected to the regulators, the regulator capacities, the sewer piping configuration, etc. Each of these physical features remains relatively constant from year to year and has been established over time through the construction, calibration, and refinement of the sewer system models. As such, they do not need to be modified each year before using the models to develop the pollutant loadings from CSOs and stormwater in Jamaica Bay. Elements that are required in the model to develop the loads accurately that could possibly change from year to year or month to month are listed below. • Rainfall • WPCP wastewater flows • Dry weather sewage pollutant concentrations • Runoff/stormwater pollutant concentrations

Jamaica Plan DEIS WPCP and CSO Impact Analysis January 2007
Page 8 of 26
General procedures for computing the monthly pollutant loadings are summarized as follows. 1. Develop model inputs for rainfall, dry weather and wet weather WPCP wastewater
flows, dry weather sewage pollutant concentrations, and runoff/stormwater pollutant concentrations.
2. Set-up the hydraulic model for each of the 26th Ward, Coney Island, Jamaica, and Rockaway drainage areas with the hourly rainfall data, dry weather sewage pollutant concentrations and stormwater pollutant concentrations.
3. Adjust model parameters to obtain agreement between the summed total dry weather sewage flow from each regulator drainage area and the daily average dry weather flow received at the individual WPCPs for the time period of interest.
4. Set the WPCP hydraulic capacity based on the annual average capacity provided by NYCDEP.
5. Execute the models to calculate the hourly CSO and stormwater overflow volumes for each hour of the year for each outfall within the WPCP drainage area.
6. For CSOs, calculate the portion of sanitary flow and runoff comprising combined sewage for each hour during the overflow events. Multiply the appropriate pollutant concentration to the sanitary and stormwater volumes. For stormwater overflows, multiply the total volume by the appropriate stormwater pollutant concentration.
7. Sum the individual hourly pollutant mass loadings at each outfall in the study area for a specified time period (e.g., month, day, year) depending upon need.
8. Sum the mass pollutant loading for all outfalls in the study area for the given time period of concern.
III. Calculation methods for loads
A. WPCP Effluent Loads WPCP effluent loads were calculated by multiplying pollutant concentrations (see Table 4 below) by the average flows for each WPCP for each of the three conditions. Daily averages were converted to yearly flows and loads by multiplying by 365 days per year. 2005 calendar year WPCP average daily flow data provided by the NYCDEP was used to represent the existing conditions. Projected dry weather flows for the 26th Ward, Coney Island, and Rockaway WPCPs were also provided by NYCDEP and were used for the future build and no build conditions. 2015 projected daily average flows for future build and no build conditions were developed by adding the difference between 2005 average daily dry weather flows and 2005 average daily flows to the 2015 projected daily dry weather flow averages for each WPCP. For the Jamaica WPCP, future build and no build condition flows were based on projected dry weather flows from the AKRF DGEIS documentation. Daily average flows were created

Jamaica Plan DEIS WPCP and CSO Impact Analysis January 2007
Page 9 of 26
by adding the difference between 2005 average daily dry weather flows and 2005 average daily flows to the 2015 projected daily dry weather flow averages for each WPCP.
Table 4: WPCP Effluent Load Base Data: Pollutant Concentrations
WPCP TN (mg/L, WPCP effluent)
BOD-5 (mg/L, WPCP effluent)
Fecal Coliform (count/100ml,
WPCP effluent) 26th Ward 13.8 7.1 43
Coney Island 18.1 7.8 23 Jamaica 20.9 8.9 28
Rockaway 13.4 4.7 4.
B. CSO Loads The models produce the percentages of sanitary flows and stormwater flows that comprise the CSO event at each outfall in each WPCP drainage area on an hourly basis. These flows are summed over the year to obtain the annual volumes of sanitary and stormwater flows discharging from each outfall. The CSO loads are then calculated by multiplying the annual sanitary and stormwater volumes by the appropriate sanitary and stormwater pollutant concentrations (see Table 5). The pollutant loads can then be summed based on WPCP drainage area. The sanitary TN and BOD concentrations were obtained from the NYCDEP Process Engineering reports. The concentration of TN and BOD within stormwater volumes were consistent with concentrations utilized in the Long Term Control Plan projects. The fecal coliform sanitary and stormwater concentrations were also obtained from the Long Term Control Plan projects. Table 5: CSO Load Base Data: Sanitary and Stormwater Pollutant Concentrations
WPCP Drainage Area
TN (mg/L, WPCP
influent)
BOD (mg/L, WPCP
influent)
FC (#/100mL,
WPCP influent) 26 Ward 21.2 126. 4,000,000 Sanitary Coney Island 32.0 124. 4,000,000 Jamaica 29.3 148. 4,000,000
Rockaway 19.3 82. 4,000,000 Location TN (mg/L) BOD (mg/L) FC (#/100mL)
26 Ward 2.1 9.4 120,000 Stormwater Coney Island 2.1 9.4 120,000 Jamaica 2.1 9.4 35,000
Rockaway 2.1 9.4 35,000

Jamaica Plan DEIS WPCP and CSO Impact Analysis January 2007
Page 10 of 26
C. Stormwater Loads Stormwater loads were calculated by multiplying the stormwater overflow volume by the appropriate pollutant stormwater concentration (see Table 5 above) at each outfall for each WPCP drainage area.
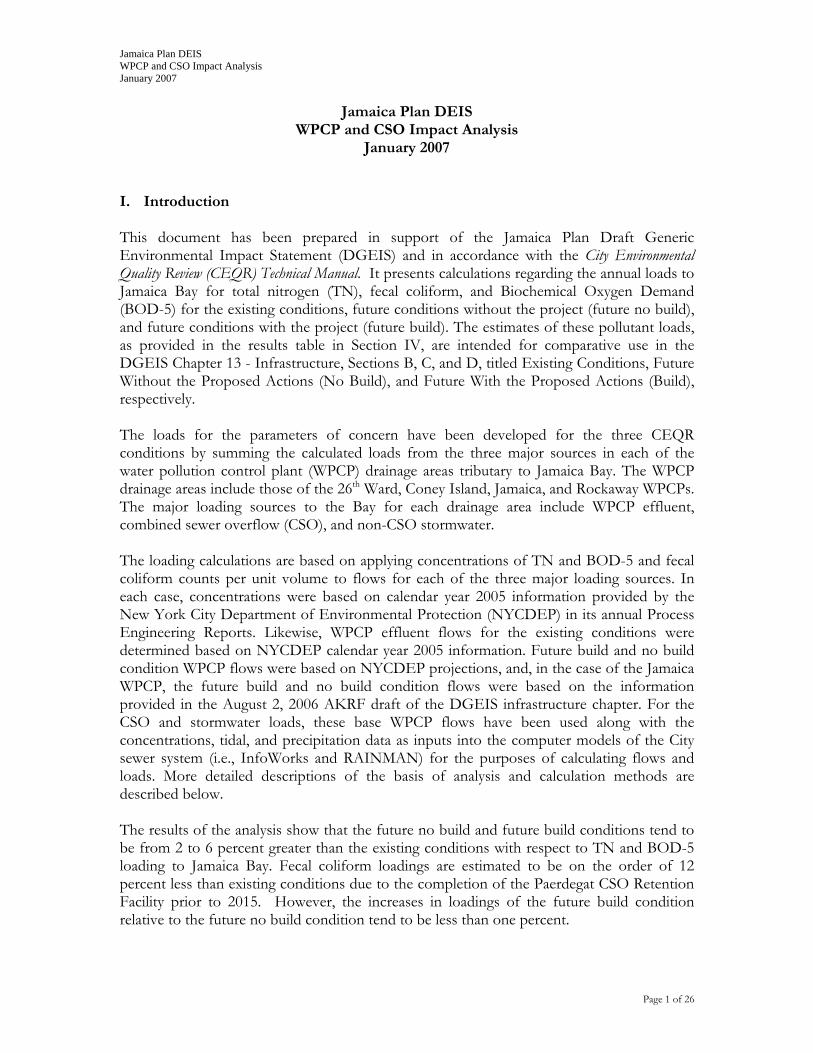
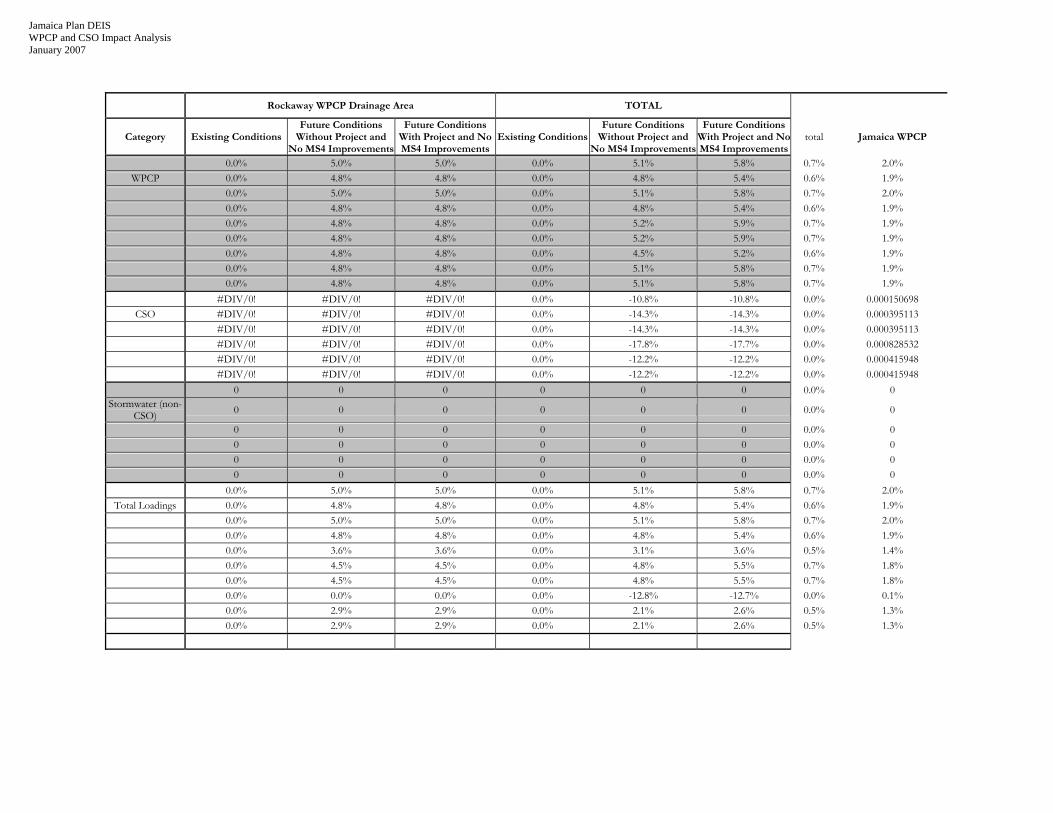
D. Total Loads Total loads were developed by adding the loads from all sources in each WPCP drainage area for each condition. IV. Results2 Table 6 shows the results of the load calculations for all three conditions (existing, future no build, and future build). The loads have been categorized per all four WPCPs tributary to Jamaica Bay (26th Ward, Coney Island, Jamaica, and Rockaway) and per pollutant (TN, BOD-5, and fecal coliform). Background calculations and relevant data have been provided in tabular form in Appendix 1.
A. WPCP Pollutant Loadings As shown in Table 6, TN, BOD, and fecal coliform future condition loadings increase relative to the existing conditions for the WPCPs. Loadings from the 26th Ward, Coney Island, and Rockaway WPCPs do not differ between future build and future no build conditions. However, the project-related changes are apparent in the future build and future no build condition loadings from the Jamaica WPCP. Overall, the cumulative WPCP average daily flows increase from roughly 241 MGD (existing conditions) to 253 MGD (future no build conditions, 5% increase) to 255 MGD (future build conditions, 6% increase over the existing conditions). These increased flows translate to increased TN loads of roughly 38,100, 40,100 (5%), and 40,400 (6%) pounds per day respectively for each successive condition (approximate percentage increases relative to existing conditions are contained in parentheses). However, the TN loading increases between future build and future no build conditions are less than one percent. For BOD, the increased flows relate to loadings of roughly 16,700, 17,600 (5%), and 17,700 (6%) pounds per day. This BOD loading increase between future build and future no build conditions is also less than one percent. Fecal coliform loadings also increase for the WPCPs, from approximately 9.85E+13 counts per year to 1.03E+14 (4.5%) to 1.04E+14 (5.2%) counts per year for each successive condition. Fecal coliform loading differences between the future no build and future build conditions are also less than one percent. Table 6 also shows the differences between each condition for the Jamaica WPCP. In this case, average daily flows increase from the existing conditions (86 MGD) to the future no build conditions (94 MGD, an approximate 10% increase relative to existing conditions) to the future build conditions (96 MGD, an approximate 12% increase relative to existing
2 Results descriptions in the text express approximate, round numbers. Table 6 expresses results to two decimal places. Differences between the text and the table are due to rounding.

Jamaica Plan DEIS WPCP and CSO Impact Analysis January 2007
Page 11 of 26
conditions). These flows to the Jamaica WPCP translate to increased TN loads to Jamaica Bay of roughly 15,000, 16,400 (10%), and 16,700 (12%) pounds per day respectively for each successive condition (approximate percentage increases relative to existing conditions are contained in parentheses). The TN loading increase between future build and future no build conditions is just under two percent. For BOD, the flows for each condition relate to loadings of roughly 6,400, 7,000 (10%), and 7,100 (12%) pounds per day. For BOD also, loading increases between future build and future no build conditions are just under two percent. Fecal coliform loadings also increase for the Jamaica WPCP, from approximately 3.28E+13 counts per year to 3.60E+13 (10%) to 3.66E+13 (12%) counts per year for each successive condition. For fecal coliform also, the loading differences between the future no build and future build conditions are also just under two percent.
B. CSO Pollutant Loadings CSO pollutant loadings show different patterns than the WPCP pollutant loadings across the WPCPs and between existing and future conditions. This is largely due to the effect of the Paerdegat Basin CSO Retention Facility, which is expected to commence operations by 2015 and reduce total annual CSO discharges to Jamaica Bay by approximately 11% (roughly 45% within the Coney Island WPCP drainage area). The patterns tend to show significant decreases (from 12 to 18%) in pollutants from the existing conditions to both future conditions, with negligible increases in CSO related pollutant loads between the future no build and future build conditions. Again, for the 26th Ward and Coney Island WPCPs, the CSO pollutant loadings do not differ between the future no build and future build conditions. The Rockaway WPCP has no CSO loadings due to its separate sewer system characteristics. Overall, the CSO annual flows decrease from roughly 8,600 MG (existing conditions) to approximately 7,700 MG for both future no build and future conditions, representing an 11% decrease. The increase in CSO flows from future no build to future build due to sanitary flow increases is less than 1 MG, or less than 0.1%. These decreased flows translate to a 14% decrease in TN loads between the existing and both future conditions, roughly 680 vs. 580 pounds per day, respectively. The TN loading increase between future build and future no build conditions is less than 0.1%. BOD and fecal coliform loadings mirror the TN loadings, as follows. Existing BOD loads are roughly 3,100 pounds per day, and the future conditions are expected to be approximately 2,700 pounds per day, with less than 1 pound per day difference between future no build and future build conditions. Existing fecal coliform loadings are roughly 8.56E+16 counts per year, with future no build and future build conditions fecal coliform counts per year of 7.04E+16 and 7.05E+16, respectively, a 12% decrease relative to existing conditions and a negligible 0.04% increase between the successive future conditions. Within the Jamaica WPCP drainage area, CSO annual flows increase among the successive conditions, with 5,760 MG for the existing conditions and roughly 5,810 MG (a 0.8% increase) for both future conditions. The flow increase between future conditions is less than 1 MG and is attributable for an increase in sanitary flows. Pollutant loadings are as follows. TN increases from 380 pounds per day under existing conditions to roughly 400 pounds per day under both future conditions (an increase of approximately 5%). The difference

Jamaica Plan DEIS WPCP and CSO Impact Analysis January 2007
Page 12 of 26
between future conditions is negligible, less than one pound per day. BOD roughly increases from 1,770 to 1,860 pounds per day (approximately 5%) between existing and future conditions. Fecal coliform increases approximately 12% from existing to future conditions (3.29E+16 to 3.67E+16 counts per year). The difference between future no build and future build conditions for all pollutant loadings is negligible, less than 0.1%.
C. Stormwater Pollutant Loadings Stormwater flows and pollutant loadings remain the same across all conditions (i.e., no change between existing conditions and future conditions) as a result of using 1988 rainfall conditions, a typical rainfall year consistent with NYSDEC-approved modeling parameters, as model inputs for both 2005 and 2015. In addition, due to the project characteristics whereby existing developed areas would be redeveloped with negligible changes in pervious cover and resultant stormwater volumes, no stormwater pollutant loading changes between future no build and future build conditions are evident in this analysis. Total stormwater pollutant loadings are as follows for each of the conditions. Overall, TN loads are approximately 620 pounds per day, BOD loads are 2,800 pounds per day, and fecal coliform counts are 3.34E+16 counts per year. For the Jamaica WPCP drainage area, TN loads are approximately 260 pounds per day, BOD loads are roughly 1,190 pounds per day, and fecal coliform counts are approximately 7.30E+15 counts per year.
D. Total Pollutant Loadings Total pollutant loadings, as presented in Table 6, represent the sums of pollutant loadings for each of the three pollutant loading categories and each of the WPCP drainage areas. Overall, total flows, including WPCP, CSO, and stormwater discharges increase from roughly 116, 000 MG per year under existing conditions to 119,700 MG (3.1%) per year for future no build conditions, and 120,300 MG (3.6%) per year for future build conditions. The difference between future no build and future build conditions is less that one percent. Pollutant loadings are presented below. Of note is the Paerdegat CSO Retention Facility related reduction of fecal coliform counts by roughly 13 percent between existing and future conditions. TN loadings are calculated to be roughly 39,000 pounds per day for existing conditions, 41,300 pounds per day (5% increase) for future no build conditions, and 41,600 pounds per day (6% increase) for future build conditions. BOD loadings are calculated to be roughly 22,600 pounds per day for existing conditions, 23,100 pounds per day (2%) for future no build conditions, and 23,200 pounds per day (3%) for future build conditions. The difference between future no build and future build conditions is less that one percent for both TN and BOD. Overall fecal coliform counts decrease roughly 13% from existing conditions (1.19E+17 counts per year) to future conditions (1.04E+17 counts per year). The difference between future no build and future build conditions is less that 0.1%.

Jamaica Plan DEIS WPCP and CSO Impact Analysis January 2007
Page 13 of 26
For the Jamaica WPCP drainage area, total annual flows increase from 42,700 MG under existing conditions to 45,800 MG (7% increase) and 46,400 MG (9% increase) for future no build and future build conditions, respectively. The difference in total flows between future build and no build conditions is less than two percent. TN loads are calculated to be roughly 15,600 pounds per day, 17,100 pounds per day (10% increase), and 17,400 pounds per day for each successive condition. The difference in total flows between future build and no build conditions is less than two percent. For BOD, the calculated pollutant loadings are as follows: 9,400 pounds per day for existing conditions, 10,100 pounds per day for future no build conditions, and 10,200 pounds per day for future build conditions. The difference between future no build and build conditions is less than two percent. Fecal coliform counts increase between the existing conditions (4.02E+16 counts per year) to the future conditions (4.40E+16 counts per year, 9% increase). However, the difference between future no build and build conditions is roughly 0.1 percent.
E. Summary Based on the calculated pollutant loads for each category of loading source and each WPCP drainage area tributary to Jamaica Bay as presented in Table 6, the majority of pollutant loading increases are due to projected demographic changes between existing 2005 conditions and future 2015 conditions. The increases in total pollutant loadings between future no build and future build conditions tend to be small, generally less than one percent over all WPCP drainage areas and less than two percent within the Jamaica WPCP drainage area. In the case of fecal coliform, the loading to Jamaica Bay declines in the future conditions relative to the existing condition with the full implementation of the Paerdegat CSO Retention Facility. Based on the above calculations and assumptions, it is therefore concluded that the proposed actions would not result in any significant adverse impacts on the water quality of Jamaica Bay. Also of note, the results displayed in Table 6 are also of a conservative nature, as several infrastructure improvement projects anticipated as part of the LTCP and Jamaica Bay Comprehensive Plan are not included in this analysis.

Jamaica Plan DEIS WPCP and CSO Impact Analysis January 2007
Page 14 of 26
Table 6. Existing Conditions, Future Build, and Future No Build Pollutant Loadings
Category Parameter 26th Ward WPCP Drainage Area Coney Island WPCP Drainage Area Jamaica WPCP Drainage Area Rockaway WPCP Drainage Area TOTAL
Existing
Conditions
Future Conditions
Without Project
Future Conditions
With Project
Existing Conditions
Future Conditions
Without Project
Future Conditions
With Project
Existing Conditions
Future Conditions
Without Project
Future Conditions
With Project
Existing Conditions
Future Conditions
Without Project
Future Conditions
With Project
Existing Conditions
Future Conditions
Without Project
Future Conditions
With Project and No MS4
ImprovementsDaily Dry Weather Flow
(MGD) 52.00 53.00 53.00 87.00 89.00 89.00 82.00 90.38 92.00 20.00 21.00 21.00 241.00 253.38 255.00
Average Daily Flow (MGD) 59.00 60.00 60.00 93.00 95.00 95.00 86.00 94.38 96.00 21.00 22.00 22.00 259.00 271.38 273.00
Annual Dry Weather Flow (MG) 18,980.00 19,345.00 19,345.00 31,755.00 32,485.00 32,485.00 29,930.00 32,988.70 33,580.00 7,300.00 7,665.00 7,665.00 87,965.00 92,483.70 93,075.00
Annual Total Flow (MG) 21,535.00 21,900.00 21,900.00 33,945.00 34,675.00 34,675.00 31,390.00 34,448.70 35,040.00 7,665.00 8,030.00 8,030.00 94,535.00 99,053.70 99,645.00 Total Nitrogen (pounds
per day) 6,804.67 6,920.00 6,920.00 14,009.00 14,310.27 14,310.27 14,964.13 16,422.26 16,704.14 2,350.15 2,462.06 2,462.06 38,127.94 40,114.58 40,396.47
Total Nitrogen (pounds per year) 2,483,703.74 2,525,800.42 2,525,800.42 5,113,283.73 5,223,246.82 5,223,246.82 5,461,906.33 5,994,124.64 6,097,011.72 857,803.49 898,651.28 898,651.28 13,916,697.29 14,641,823.16 14,744,710.23
Fecal Coliform (count per year, billion) 34,833.00 35,423.39 35,423.39 29,656.83 30,294.61 30,294.61 32,771.68 35,965.01 36,582.34 1,233.15 1,291.87 1,291.87 98,494.66 102,974.88 103,592.21
BOD-5 (pounds per day) 3,476.19 3,535.11 3,535.11 6,014.94 6,144.30 6,144.30 6,401.92 7,025.73 7,146.33 818.43 857.41 857.41 16,711.49 17,562.55 17,683.14
WPCP
BOD-5 (pounds per year) 1,268,809.58 1,290,314.83 1,290,314.83 2,195,454.23 2,242,668.30 2,242,668.30 2,336,700.45 2,564,392.89 2,608,409.81 298,727.99 312,953.13 312,953.13 6,099,692.26 6,410,329.15 6,454,346.07
Annual Total Flow (MG) 638.49 645.86 645.86 2178.23 1199.13 1199.13 5759.86 5806.88 5807.75 0.00 0.00 0.00 8576.58 7651.87 7652.74 Total Nitrogen (pounds
per day) 73.18 75.10 75.10 228.45 111.63 111.63 378.38 396.10 396.25 0.00 0.00 0.00 680.00 582.82 582.97
Total Nitrogen (pounds per year) 26,710.57 27,411.42 27,411.42 83,383.01 40,744.27 40,744.27 138,107.60 144,575.27 144,629.83 0.00 0.00 0.00 248,201.18 212,730.96 212,785.53
Fecal Coliform (count per year, billion) 16,098,593.73 16,615,728.02 16,615,728.02 36,683,297.28 17,163,573.83 17,163,573.83 32,861,683.83 36,653,881.51 36,681,108.47 0.00 0.00 0.00 85,643,574.84 70,433,183.35 70,460,410.31
BOD-5 (pounds per day) 398.60 409.75 409.75 947.09 467.31 467.31 1772.99 1861.86 1862.60 0.00 0.00 0.00 3118.67 2738.93 2739.66
CSO
BOD-5 (pounds per year) 145,487.45 149,558.75 149,558.75 345,687.52 170,569.25 170,569.25 647,141.21 679,580.30 679,849.48 0.00 0.00 0.00 1,138,316.19 999,708.30 999,977.48
Annual Total Flow (MG) 278.58 278.58 278.58 4760.19 4760.19 4760.19 5518.56 5518.56 5518.56 2459.52 2459.52 2459.52 13016.84 13016.84 13016.84 Total Nitrogen (pounds
per day) 13.23 13.23 13.23 226.10 226.10 226.10 262.12 262.12 262.12 116.82 116.82 116.82 618.27 618.27 618.27
Total Nitrogen (pounds per year) 4,829.59 4,829.59 4,829.59 82,525.47 82,525.47 82,525.47 95,672.94 95,672.94 95,672.94 42,639.69 42,639.69 42,639.69 225,667.70 225,667.70 225,667.70
Fecal Coliform (count per year, billion) 1,263,629.81 1,263,629.81 1,263,629.81 21,592,221.84 21,592,221.84 21,592,221.84 7,301,048.27 7,301,048.27 7,301,048.27 3,253,944.96 3,253,944.96 3,253,944.96 33,410,844.87 33,410,844.87 33,410,844.87
BOD-5 (pounds per day) 59.98 59.98 59.98 1024.85 1024.85 1024.85 1188.12 1188.12 1188.12 529.52 529.52 529.52 2802.46 2802.46 2802.46
Stormwater (non-CSO)
BOD-5 (pounds per year) 21,891.43 21,891.43 21,891.43 374,068.93 374,068.93 374,068.93 433,663.35 433,663.35 433,663.35 193,275.90 193,275.90 193,275.90 1,022,899.61 1,022,899.61 1,022,899.61 WPCP Daily Dry
Weather Flow (MGD) 52.00 53.00 53.00 87.00 89.00 89.00 82.00 90.38 92.00 20.00 21.00 21.00 241.00 253.38 255.00
WPCP Average Daily Flow (MGD) 59.00 60.00 60.00 93.00 95.00 95.00 86.00 94.38 96.00 21.00 22.00 22.00 259.00 271.38 273.00
WPCP Annual Dry Weather Flow (MG) 18,980.00 19,345.00 19,345.00 31,755.00 32,485.00 32,485.00 29,930.00 32,988.70 33,580.00 7,300.00 7,665.00 7,665.00 87,965.00 92,483.70 93,075.00
WPCP Annual Total Flow (MG) 21,535.00 21,900.00 21,900.00 33,945.00 34,675.00 34,675.00 31,390.00 34,448.70 35,040.00 7,665.00 8,030.00 8,030.00 94,535.00 99,053.70 99,645.00
WPCP + CSO + Stormwater Annual Total
Flow (MG) 22,452.06 22,824.44 22,824.44 40,883.42 40,634.32 40,634.32 42,668.42 45,774.14 46,366.31 10,124.52 10,489.52 10,489.52 116,128.42 119,722.41 120,314.58
Total Nitrogen (pounds per day) 6,891.08 7,008.33 7,008.33 14,463.54 14,647.99 14,647.99 15,604.62 17,080.47 17,362.51 2,466.97 2,578.88 2,578.88 39,426.21 41,315.68 41,597.71
Total Nitrogen (pounds per year) 2,515,243.90 2,558,041.43 2,558,041.43 5,279,192.22 5,346,516.56 5,346,516.56 5,695,686.86 6,234,372.85 6,337,314.49 900,443.19 941,290.97 941,290.97 14,390,566.17 15,080,221.82 15,183,163.45
Fecal Coliform (count per year, billion) 17,397,056.54 17,914,781.22 17,914,781.22 58,305,175.95 38,786.090.28 38,786,090.28 40,195,503.77 43,990,894.79 44,018,739.08 3,255,178.11 3,255,236.83 3,255,236.83 119,152,914.37 103,947,003.11 103,974,847.40
BOD-5 (pounds per day) 3,934.76 4,004.84 4,004.84 7,986.88 7,636.46 7,636.46 9,363.03 10,075.72 10,197.05 1,347.96 1,386.93 1,386.93 22,632.62 23,103.94 23,225.27
Total Loadings
BOD-5 (pounds per year) 1,436,188.47 1,461,765.01 1,461,765.01 2,915,210.68 2,787,306.48 2,787,306.48 3,417,505.02 3,677,636.55 3,721,922.64 492,003.89 506,229.03 506,229.03 8,260,908.05 8,432,937.07 8,477,223.16

Jamaica Plan DEIS WPCP and CSO Impact Analysis January 2007
Page 15 of 26
Appendix 1
Background Data and Calculations

Jamaica Plan DEIS WPCP and CSO Impact Analysis January 2007
Category Parameter 26th Ward WPCP Drainage Area Coney Island WPCP Drainage Area Jamaica WPCP Drainage Area
Existing
Conditions
Future Conditions
Without Project and No MS4
Improvements
Future Conditions
With Project and No MS4
Improvements
Existing Conditions
Future Conditions
Without Project and No MS4
Improvements
Future Conditions
With Project and No MS4
Improvements
Existing Conditions
Future Conditions
Without Project and No MS4
Improvements
Future Conditions
With Project and No MS4
Improvements
Daily Dry Weather Flow (MGD) 0.0% 1.9% 1.9% 0.0% 2.3% 2.3% 0.0% 10.2% 12.2% Average Daily Flow (MGD) 0.0% 1.7% 1.7% 0.0% 2.2% 2.2% 0.0% 9.7% 11.6%
Annual Dry Weather Flow (MG) 0.0% 1.9% 1.9% 0.0% 2.3% 2.3% 0.0% 10.2% 12.2% Annual Total Flow (MG) 0.0% 1.7% 1.7% 0.0% 2.2% 2.2% 0.0% 9.7% 11.6%
Total Nitrogen (pounds per day) 0.0% 1.7% 1.7% 0.0% 2.2% 2.2% 0.0% 9.7% 11.6% Total Nitrogen (pounds per year) 0.0% 1.7% 1.7% 0.0% 2.2% 2.2% 0.0% 9.7% 11.6% Fecal Coliform (count per year,
billion) 0.0% 1.7% 1.7% 0.0% 2.2% 2.2% 0.0% 9.7% 11.6%
BOD-5 (pounds per day) 0.0% 1.7% 1.7% 0.0% 2.2% 2.2% 0.0% 9.7% 11.6%
WPCP
BOD-5 (pounds per year) 0.0% 1.7% 1.7% 0.0% 2.2% 2.2% 0.0% 9.7% 11.6% Annual Total Flow (MG) 0.0% 1.2% 1.2% 0.0% -44.9% -44.9% 0.0% 0.8% 0.8%
Total Nitrogen (pounds per day) 0.0% 2.6% 2.6% 0.0% -51.1% -51.1% 0.0% 4.7% 4.7% Total Nitrogen (pounds per year) 0.0% 2.6% 2.6% 0.0% -51.1% -51.1% 0.0% 4.7% 4.7% Fecal Coliform (count per year,
billion) 0.0% 3.2% 3.2% 0.0% -53.2% -53.2% 0.0% 11.5% 11.6%
BOD-5 (pounds per day) 0.0% 2.8% 2.8% 0.0% -50.7% -50.7% 0.0% 5.0% 5.1%
CSO
BOD-5 (pounds per year) 0.0% 2.8% 2.8% 0.0% -50.7% -50.7% 0.0% 5.0% 5.1% Annual Total Flow (MG) 0 0 0 0 0 0 0 0 0
Total Nitrogen (pounds per day) 0 0 0 0 0 0 0 0 0 Total Nitrogen (pounds per year) 0 0 0 0 0 0 0 0 0 Fecal Coliform (count per year,
billion) 0 0 0 0 0 0 0 0 0
BOD-5 (pounds per day) 0 0 0 0 0 0 0 0 0
Stormwater (non-CSO)
BOD-5 (pounds per year) 0 0 0 0 0 0 0 0 0 WPCP Daily Dry Weather Flow
(MGD) 0.0% 1.9% 1.9% 0.0% 2.3% 2.3% 0.0% 10.2% 12.2%
WPCP Average Daily Flow (MGD) 0.0% 1.7% 1.7% 0.0% 2.2% 2.2% 0.0% 9.7% 11.6%
WPCP Annual Dry Weather Flow (MG) 0.0% 1.9% 1.9% 0.0% 2.3% 2.3% 0.0% 10.2% 12.2%
WPCP Annual Total Flow (MG) 0.0% 1.7% 1.7% 0.0% 2.2% 2.2% 0.0% 9.7% 11.6% WPCP + CSO + Stormwater
Annual Total Flow (MG) 0.0% 1.7% 1.7% 0.0% -0.6% -0.6% 0.0% 7.3% 8.7%
Total Nitrogen (pounds per day) 0.0% 1.7% 1.7% 0.0% 1.3% 1.3% 0.0% 9.5% 11.3% Total Nitrogen (pounds per year) 0.0% 1.7% 1.7% 0.0% 1.3% 1.3% 0.0% 9.5% 11.3% Fecal Coliform (count per year,
billion) 0.0% 3.0% 3.0% 0.0% -33.5% -33.5% 0.0% 9.4% 9.5%
BOD-5 (pounds per day) 0.0% 1.8% 1.8% 0.0% -4.4% -4.4% 0.0% 7.6% 8.9%
Total Loadings
BOD-5 (pounds per year) 0.0% 1.8% 1.8% 0.0% -4.4% -4.4% 0.0% 7.6% 8.9%
Jamaica Plan DEIS WPCP and CSO Impact Analysis January 2007
Rockaway WPCP Drainage Area TOTAL
Category Existing Conditions Future Conditions
Without Project and No MS4 Improvements
Future Conditions With Project and No MS4 Improvements
Existing ConditionsFuture Conditions
Without Project and No MS4 Improvements
Future Conditions With Project and No MS4 Improvements
total Jamaica WPCP
0.0% 5.0% 5.0% 0.0% 5.1% 5.8% 0.7% 2.0% WPCP 0.0% 4.8% 4.8% 0.0% 4.8% 5.4% 0.6% 1.9%
0.0% 5.0% 5.0% 0.0% 5.1% 5.8% 0.7% 2.0% 0.0% 4.8% 4.8% 0.0% 4.8% 5.4% 0.6% 1.9% 0.0% 4.8% 4.8% 0.0% 5.2% 5.9% 0.7% 1.9% 0.0% 4.8% 4.8% 0.0% 5.2% 5.9% 0.7% 1.9% 0.0% 4.8% 4.8% 0.0% 4.5% 5.2% 0.6% 1.9% 0.0% 4.8% 4.8% 0.0% 5.1% 5.8% 0.7% 1.9% 0.0% 4.8% 4.8% 0.0% 5.1% 5.8% 0.7% 1.9% #DIV/0! #DIV/0! #DIV/0! 0.0% -10.8% -10.8% 0.0% 0.000150698
CSO #DIV/0! #DIV/0! #DIV/0! 0.0% -14.3% -14.3% 0.0% 0.000395113 #DIV/0! #DIV/0! #DIV/0! 0.0% -14.3% -14.3% 0.0% 0.000395113 #DIV/0! #DIV/0! #DIV/0! 0.0% -17.8% -17.7% 0.0% 0.000828532 #DIV/0! #DIV/0! #DIV/0! 0.0% -12.2% -12.2% 0.0% 0.000415948 #DIV/0! #DIV/0! #DIV/0! 0.0% -12.2% -12.2% 0.0% 0.000415948 0 0 0 0 0 0 0.0% 0 Stormwater (non-
CSO) 0 0 0 0 0 0 0.0% 0
0 0 0 0 0 0 0.0% 0 0 0 0 0 0 0 0.0% 0 0 0 0 0 0 0 0.0% 0 0 0 0 0 0 0 0.0% 0 0.0% 5.0% 5.0% 0.0% 5.1% 5.8% 0.7% 2.0%
Total Loadings 0.0% 4.8% 4.8% 0.0% 4.8% 5.4% 0.6% 1.9% 0.0% 5.0% 5.0% 0.0% 5.1% 5.8% 0.7% 2.0% 0.0% 4.8% 4.8% 0.0% 4.8% 5.4% 0.6% 1.9% 0.0% 3.6% 3.6% 0.0% 3.1% 3.6% 0.5% 1.4% 0.0% 4.5% 4.5% 0.0% 4.8% 5.5% 0.7% 1.8% 0.0% 4.5% 4.5% 0.0% 4.8% 5.5% 0.7% 1.8% 0.0% 0.0% 0.0% 0.0% -12.8% -12.7% 0.0% 0.1% 0.0% 2.9% 2.9% 0.0% 2.1% 2.6% 0.5% 1.3% 0.0% 2.9% 2.9% 0.0% 2.1% 2.6% 0.5% 1.3%

Jamaica Plan DEIS WPCP and CSO Impact Analysis January 2007
Page 18 of 26
TN Loads from Overflows to the Jamaica BayWatershed
TotQ (MG) frm SW (lb/day) frm CSO (lb/dTotQ (MG) frm SW (lb/da frm CSO (lb/daTotQ (MG) frm SW (lb/day) frm CSO (lb/d TotQ (MG) frm SW (lb/dafrm CSO (lb2005 CY Existing 11278.4 262.1 378.4 917.1 13.2 73.2 6938.4 226.1 228.4 2459.5 116.8 02015 No Build 11325.4 262.1 396.1 924.4 13.2 75.1 5959.3 226.1 111.6 2459.5 116.8 02015 Build 11326.3 262.1 396.2 924.4 13.2 75.1 5959.3 226.1 111.6 2459.5 116.8 0
BOD Loads from Overflows to the Jamaica BayWatershed
TotQ (MG) frm SW (lb/day) frm CSO (lb/dTotQ (MG) frm SW (lb/da frm CSO (lb/daTotQ (MG) frm SW (lb/day) frm CSO (lb/d TotQ (MG) frm SW (lb/dafrm CSO (lb2005 CY Existing 11278.4 1188.1 1773.0 917.1 60.0 398.6 6938.4 1024.8 947.1 2459.5 529.5 02015 No Build 11325.4 1188.1 1861.9 924.4 60.0 409.7 5959.3 1024.8 467.3 2459.5 529.5 02015 Build 11326.3 1188.1 1862.6 924.4 60.0 409.7 5959.3 1024.8 467.3 2459.5 529.5 0
26W
Pollutant Concentrations SW (MG) San (MG) Storm (MG) Tot Q (MG)2005 CY 278.58 98.10 540.39 917.06
Location TN (mg/L) BOD (mg/L) Location FC (#/100mL) 2015 278.58 101.69 544.17 924.44Storm Sewers (all watersheds) 2.08 9.43 Sanitary (all watersheds) 4000000
26 Ward 21.21 126.00 26 Ward 120000Coney Island 32.03 124.00 Coney Island 120000 CIJamaica 29.33 148.00 Jamaica 35000
Rockaway 19.25 82.02 Rockaway 35000 SW (MG) San (MG) Storm (MG) Tot Q (MG)2005 CY 4760.19 182.75 1995.48 6938.42
2015 4760.19 79.94 1119.19 5959.32Pollutant Concentrations from the DEP Bible
JAMTotal N (mg/L) BOD (mg/L) Total N (mg/L) BOD (mg/L) Total N (mg/L) BOD (mg/L)
Jan '05 28.76 153 20.32 126 31.89 118 SW (MG) San (MG) Storm (MG) Tot Q (MG)Feb '05 29.78 141 20.09 110 31.56 136 2005 CY 5518.56 168.41 5591.45 11278.42Mar '05 29.82 155 20.68 137 31.17 137 2015 NB 5518.56 193.30 5613.58 11325.44Apr '05 27.51 144 21.09 125 29.25 113 2015 Build 5518.56 193.48 5614.28 11326.31May '05 29.75 142 22.42 125 33.46 122Jun '05 30.34 154 22.65 132 34.83 119 SW (MG)Average 29.33 148 21.21 126 32.03 124 Rockaway 2005=2015 2459.52
Pollutant Concentrations
LTCP DEP LTCP DEP2.08 N/A 9.43 N/A
26 Ward 25.72 21.21 121.99 126Coney Island 22.06 32.03 107.44 124Jamaica 31.95 29.33 172.38 148
Pollutant Concentrations
Location TN (mg/L) BOD (mg/L) Location FC (#/100mL)Storm Sewers (all watersheds) 2.08 9.43 Sanitary (all watersheds) 4000000
26 Ward 25.72 121.99 26 Ward 120000Coney Island 22.06 107.44 Coney Island 120000Jamaica 31.95 172.38 Jamaica 35000Rockaway 19.25 82.02 Rockaway 35000
CSOs
CI ROC
Jamaica 26th Ward Coney Island
26WJAM
CSOs
CSOs
CI ROC26WJAM
San
itary
Sto
rmw
ater
TN (mg/L) BOD (mg/L)
San
itary
Sto
rmw
ate
San
itary
Storm Sewers (all watersheds)

Jamaica Plan DEIS WPCP and CSO Impact Analysis January 2007
Page 19 of 26
TN Loads from Overflows to the Jamaica BayWatershed
TotQ (MG) frm SW (lb) frm CSO (lb) TotQ (MG) frm SW (lb) frm CSO (lb) TotQ (MG) frm SW (lb) frm CSO (lb) TotQ (MG)2005 CY Existing 11278.4 95672.9 138107.6 917.1 4829.6 26710.6 6938.4 82525.5 83383.0 2459.52015 No Build 11325.4 95672.9 144575.3 924.4 4829.6 27411.4 5959.3 82525.5 40744.3 2459.52015 Build 11326.3 95672.9 144629.8 924.4 4829.6 27411.4 5959.3 82525.5 40744.3 2459.5
BOD Loads from Overflows to the Jamaica BayWatershed
TotQ (MG) frm SW (lb) frm CSO (lb) TotQ (MG) frm SW (lb) frm CSO (lb) TotQ (MG) frm SW (lb) frm CSO (lb) TotQ (MG)2005 CY Existing 11278.4 433663.4 647141.2 917.1 21891.4 145487.5 6938.4 374068.9 345687.5 2459.52015 No Build 11325.4 433663.4 679580.3 924.4 21891.4 149558.7 5959.3 374068.9 170569.2 2459.52015 Build 11326.3 433663.4 679849.5 924.4 21891.4 149558.7 5959.3 374068.9 170569.2 2459.5
FC Loads from Overflows to the Jamaica BayWatershed
TotQ (MG) frm SW (# billion) frm CSO (#/billion) TotQ (MG) frm SW (# billion) frm CSO (#/billioTotQ (MG) frm SW (# billion) frm CSO (#/billion) TotQ (MG)2005 CY Existing 11278.4 7.301E+06 3.286E+07 917.1 1.264E+06 1.610E+07 6938.4 2.159E+07 3.668E+07 2459.52015 No Build 11325.4 7.301E+06 3.665E+07 924.4 1.264E+06 1.662E+07 5959.3 2.159E+07 1.716E+07 2459.52015 Build 11326.3 7.301E+06 3.668E+07 924.4 1.264E+06 1.662E+07 5959.3 2.159E+07 1.716E+07 2459.5
Pollutant Concentrations
Location TN (mg/L) BOD (mg/L) Location FC (#/100mL)Storm Sewers (all watersheds) 2.08 9.43 Sanitary (all watersheds) 4000000
26 Ward 21.21 126.00 26 Ward 120000Coney Island 32.03 124.00 Coney Island 120000Jamaica 29.33 148.00 Jamaica 35000
Rockaway 19.25 82.02 Rockaway 35000
Pollutant Concentrations from the DEP Bible
Total N (mg/L) BOD (mg/L) Total N (mg/L) BOD (mg/L) Total N (mg/L) BOD (mg/L)Jan '05 28.76 153 20.32 126 31.89 118Feb '05 29.78 141 20.09 110 31.56 136Mar '05 29.82 155 20.68 137 31.17 137Apr '05 27.51 144 21.09 125 29.25 113May '05 29.75 142 22.42 125 33.46 122Jun '05 30.34 154 22.65 132 34.83 119Average 29.33 148 21.21 126 32.03 124
Pollutant Concentrations
LTCP DEP LTCP DEP2.08 N/A 9.43 N/A
26 Ward 25.72 21.21 121.99 126Coney Island 22.06 32.03 107.44 124Jamaica 31.95 29.33 172.38 148
Pollutant Concentrations
Location TN (mg/L) BOD (mg/L) Location FC (#/100mL)Storm Sewers (all watersheds) 2.08 9.43 Sanitary (all watersheds) 4000000
26 Ward 25.72 121.99 26 Ward 120000Coney Island 22.06 107.44 Coney Island 120000Jamaica 31.95 172.38 Jamaica 35000Rockaway 19.25 82.02 Rockaway 35000S
anita
ry
Sto
rmw
ate
San
itary
Storm Sewers (all watersheds)
JAM
San
itary
Sto
rmw
ater
TN (mg/L) BOD (mg/L)
Jamaica 26th Ward Coney Island
JAM
JAM CI
CI26W
CI26W
26W
Jamaica Plan DEIS WPCP and CSO Impact Analysis January 2007
Page 20 of 26
Parameter WPCP Existing Conditions Future Conditions Without Project
Future Conditions With Project
26th Ward 59 60 60
Coney Island 93 95 95Jamaica 86 94 96
Rockaway 21 22 22TOTAL 259 271 273
26th Ward 6,805 6,920 6,920Coney Island 14,009 14,310 14,310
Jamaica 14,964 16,422 16,704Rockaway 2,350 2,462 2,462
TOTAL 38,128 40,115 40,396
26th Ward 95 97 97Coney Island 81 83 83
Jamaica 90 99 100Rockaway 3 4 4
TOTAL 270 282 284
26th Ward 3,476 3,535 3,535Coney Island 6,015 6,144 6,144
Jamaica 6,402 7,026 7,146Rockaway 818 857 857
TOTAL 16,711 17,563 17,683
Average Daily Flow (Dry Weather & Wet
Weather) (MGD)
Total Nitrogen (pounds per day)
Fecal Coliform (billion count per day)
BOD-5 (pounds per day)
Average Daily Flow (MGD)
0
50
100
150
200
250
300
26th Ward Coney Island Jamaica Rockaway TOTAL
WPCP
MG
D
Total Nitrogen (pounds per day)
05,000
10,00015,00020,00025,00030,00035,00040,00045,000
26th Ward Coney Island Jamaica Rockaway TOTAL
WPCP
Poun
ds P
er D
ay
Fecal Coliform (billion count per day)
0
50
100
150
200
250
300
26th Ward Coney Island Jamaica Rockaway TOTAL
WPCPB
illio
n C
ount
per
Day
BOD-5 (pounds per day)
0
5,000
10,000
15,000
20,000
26th Ward ConeyIsland
Jamaica Rockaway TOTAL
WPCP
Poun
ds P
er D
ay
Existing ConditionsFuture Conditions Without ProjectFuture Conditions With Project

Jamaica Plan DEIS WPCP and CSO Impact Analysis January 2007
Page 21 of 26
Load Per Day EXISTING CONDITIONS
Lookup # 4 5 11 12 13
WPCP (CY 2005)
Average Daily Dry Weather
Flow (MGD)
Average Daily Flow
(Dry Weather &
Wet Weather)
(MGD)
Total Nitrogen Load (mg/day)
Total Nitrogen Load
(pounds/day)
Total Nitrogen
Load (tons/day)
Fecal Coliform Load (billon count / day)
BOD-5 Load (mg / day)
BOD-5 Load (pounds /
day)
BOD-5 Load (tons / day)
13 26th Ward 52.00 59.00 3,086,549,060.44 6,804.67 3.40 95.43 1,576,775,424.51 3,476.19 1.7427 Coney Island 87.00 93.00 6,354,381,491.21 14,009.00 7.00 81.25 2,728,335,543.32 6,014.94 3.0141 Jamaica 82.00 86.00 6,787,621,869.89 14,964.13 7.48 89.79 2,903,865,087.74 6,401.92 3.2055 Rockaway 20.00 21.00 1,066,009,812.49 2,350.15 1.18 3.38 371,235,333.66 818.43 0.41
TOTAL 241.00 259.00 17,294,562,234.03 38,127.94 19.06 269.85 7,580,211,389.22 16,711.49 8.36
Load Per Year EXISTING CONDITIONS
Lookup #
WPCP (CY 2005)
Average Daily Dry Weather
Flow (MG/Year)
Average Daily Flow
(Dry Weather &
Wet Weather) (MG/Year)
Total Nitrogen Load (mg/year)
Total Nitrogen Load
(pounds/year)
Total Nitrogen
Load (tons/year)
Fecal Coliform Load (billion count / year)
BOD-5 Load (mg / year)
BOD-5 Load (pounds /
year)
BOD-5 Load tons / year)
13 26th Ward 18,980 21,535 1,126,590,407,059.84 2,483,703.74 1,241.85 34,833.00 575,523,029,945.19 1,268,809.58 634.4027 Coney Island 31,755 33,945 2,319,349,244,292.23 5,113,283.73 2,556.64 29,656.83 995,842,473,311.07 2,195,454.23 1,097.7341 Jamaica 29,930 31,390 2,477,481,982,510.00 5,461,906.33 2,730.95 32,771.68 1,059,910,757,025.86 2,336,700.45 1,168.3555 Rockaway 7,300 7,665 389,093,581,559.67 857,803.49 428.90 1,233.15 135,500,896,784.76 298,727.99 149.36
TOTAL 87,965.00 94,535.00 6,312,515,215,421.74 13,916,697.29 6,958.35 98,494.66 2,766,777,157,066.88 6,099,692.26 3,049.85

Jamaica Plan DEIS WPCP and CSO Impact Analysis January 2007
Page 22 of 26
Load Per Year
FUTURE CONDITIONS
WITHOUT PROJECT
Lookup #
WPCP (CY 2005)
Average Daily Dry Weather
Flow (MG/Year)
Average Daily Flow
(Dry Weather &
Wet Weather) (MG/Year)
Total Nitrogen Load (mg/year)
Total Nitrogen Load
(pounds/year)
Total Nitrogen
Load (tons/year)
Fecal Coliform Load (billion count / year)
BOD-5 Load (mg / year)
BOD-5 Load (pounds /
year)
BOD-5 Load tons / year)
13 26th Ward 19,345 21,900 1,145,685,159,721.87 2,525,800.42 1,262.90 35,423.39 585,277,657,571.38 1,290,314.83 645.1627 Coney Island 32,485 34,675 2,369,227,722,664.11 5,223,246.82 2,611.62 30,294.61 1,017,258,440,479.05 2,242,668.30 1,121.3341 Jamaica 32,989 34,449 2,718,892,436,154.57 5,994,124.64 2,997.06 35,965.01 1,163,190,433,117.45 2,564,392.89 1,282.2055 Rockaway 7,665 8,030 407,621,847,348.22 898,651.28 449.33 1,291.87 141,953,320,441.18 312,953.13 156.48
TOTAL 92,483.70 99,053.70 6,641,427,165,888.78 14,641,823.16 7,320.91 102,974.88 2,907,679,851,609.05 6,410,329.15 3,205.16

Jamaica Plan DEIS WPCP and CSO Impact Analysis January 2007
Page 23 of 26
Load Per Day
FUTURE CONDITIONS
WITH PROJECT
Lookup # 4 5 11 12 13
WPCP (CY 2005)
Average Daily Dry Weather
Flow (MGD)
Average Daily Flow
(Dry Weather &
Wet Weather)
(MGD)
Total Nitrogen Load (mg/day)
Total Nitrogen Load
(pounds/day)
Total Nitrogen
Load (tons/day)
Fecal Coliform Load (billon count / day)
BOD-5 Load (mg / day)
BOD-5 Load (pounds /
day)
BOD-5 Load (tons / day)
13 26th Ward 53.00 60.00 3,138,863,451.29 6,920.00 3.46 97.05 1,603,500,431.70 3,535.11 1.7727 Coney Island 89.00 95.00 6,491,034,856.61 14,310.27 7.16 83.00 2,787,009,425.97 6,144.30 3.0741 Jamaica 92.00 96.00 7,576,880,226.85 16,704.14 8.35 100.23 3,241,523,818.87 7,146.33 3.5755 Rockaway 21.00 22.00 1,116,772,184.52 2,462.06 1.23 3.54 388,913,206.69 857.41 0.43
TOTAL 255.00 273.00 18,323,550,719.28 40,396.47 20.20 283.81 8,020,946,883.24 17,683.14 8.84
Load Per Year
FUTURE CONDITIONS
WITH PROJECT
Lookup #
WPCP (CY 2005)
Average Daily Dry Weather
Flow (MG/Year)
Average Daily Flow
(Dry Weather &
Wet Weather) (MG/Year)
Total Nitrogen Load (mg/year)
Total Nitrogen Load
(pounds/year)
Total Nitrogen
Load (tons/year)
Fecal Coliform Load (billion count / year)
BOD-5 Load (mg / year)
BOD-5 Load (pounds /
year)
BOD-5 Load tons / year)
13 26th Ward 19,345 21,900 1,145,685,159,721.87 2,525,800.42 1,262.90 35,423.39 585,277,657,571.38 1,290,314.83 645.1627 Coney Island 32,485 34,675 2,369,227,722,664.11 5,223,246.82 2,611.62 30,294.61 1,017,258,440,479.05 2,242,668.30 1,121.3341 Jamaica 33,580 35,040 2,765,561,282,801.86 6,097,011.72 3,048.51 36,582.34 1,183,156,193,889.33 2,608,409.81 1,304.2055 Rockaway 7,665 8,030 407,621,847,348.22 898,651.28 449.33 1,291.87 141,953,320,441.18 312,953.13 156.48
TOTAL 93,075.00 99,645.00 6,688,096,012,536.06 14,744,710.23 7,372.36 103,592.21 2,927,645,612,380.94 6,454,346.07 3,227.17

Jamaica Plan DEIS WPCP and CSO Impact Analysis January 2007
Page 24 of 26
“not in spreadsheets” designation indicates that Organic Nitrogen data was not quantified separately in the NYCDEP database as a component of TKN or TN, but was included in TKN and TN.
Lookup # 2 3 4 5 6 7 8 9 10 11 12 13
WPCP Month (CY 2005)
Average Daily Dry Weather Flow (MGD)
Average Daily Flow (Dry Weather &
Wet Weather) (MGD)
NH3 (mg/L) Organic N (mg/L) TKN (mg/L) NO3 (mg/L) NO2 (mg/L)
Total Nitrogen
(TN=TKN+NO2+NO3, mg/L)
Fecal Coliform
Load (table 5) (count / 100
ml)
BOD-5 Load (plant effluent
total Carbonaceous BOD, table
4) (mg/L)
1 26th Ward Jan-05 57.00 63.00 6.70 2.90 9.60 7.40 0.90 17.90 36.00 7.002 Feb-05 55.00 59.00 7.90 3.20 11.10 3.44 0.91 15.45 9.00 7.003 Mar-05 53.00 60.00 7.00 3.20 10.20 3.66 2.59 16.45 9.00 8.004 Apr-05 50.00 61.00 5.90 3.10 9.00 3.95 0.78 13.73 13.00 9.005 May-05 48.00 52.00 9.20 3.20 12.40 2.38 0.76 15.54 74.00 6.006 Jun-05 51.00 55.00 9.10 3.50 12.60 0.60 0.80 14.00 59.00 8.00
7 Jul-05 51.00 57.00 7.55 not in spreadsheets 11.02 0.19 0.79 12.00 102.00 7.50
8 Aug-05 49.00 51.00 7.90 11.39 0.32 0.86 12.57 48.00 7.22
9 Sep-05 52.00 53.00 9.00 12.91 0.31 0.82 14.04 6.3010 Oct-05 51.00 71.00 5.58 9.09 0.79 0.67 10.55 55.00 5.39
11 Nov-05 54.00 62.00 6.20 9.98 0.55 1.32 11.85 31.00 7.90
12 Dec-05 51.00 59.00 4.17 7.45 2.29 2.04 11.78 34.00 5.45
13 AVERAGE (rounded) 52.00 59.00 7.18 3.18 10.56 2.16 1.10 13.82 42.73 7.06
1415 Coney Island Jan-05 86.00 90.00 15.20 4.50 19.70 0.39 0.22 20.31 60.00 7.0016 Feb-05 86.00 92.00 15.10 5.10 20.20 0.19 0.13 20.52 27.00 10.0017 Mar-05 84.00 91.00 15.80 4.70 20.50 0.13 0.12 20.75 29.00 12.0018 Apr-05 87.00 95.00 14.70 3.50 18.20 0.34 0.15 18.69 46.00 9.0019 May-05 86.00 90.00 15.00 4.10 19.10 0.47 0.16 19.73 21.00 8.0020 Jun-05 86.00 92.00 13.60 4.60 18.20 0.58 0.77 19.55 30.00 8.00
21 Jul-05 86.00 92.00 8.00 not in spreadsheets 10.80 2.45 1.31 14.56 4.00 7.00
22 Aug-05 84.00 85.00 8.10 11.20 1.43 2.35 14.98 1.00 5.0023 Sep-05 85.00 87.00 12.40 16.30 0.74 0.93 17.97 4.00 7.0024 Oct-05 93.00 114.00 9.80 13.10 0.58 1.47 15.15 24.00 7.0025 Nov-05 90.00 96.00 9.60 13.30 1.84 1.35 16.49 15.00 5.0026 Dec-05 87.00 93.00 10.70 14.30 2.00 1.57 17.87 16.00 8.00
27 AVERAGE (rounded) 87.00 93.00 12.33 4.42 16.24 0.93 0.88 18.05 23.08 7.75
2829 Jamaica Jan-05 79.00 83.00 13.40 4.30 17.70 3.44 0.67 21.81 41.00 10.0030 Feb-05 79.00 82.00 15.30 4.50 19.80 2.17 0.43 22.40 39.00 11.0031 Mar-05 78.00 83.00 16.60 5.60 22.20 0.36 0.24 22.80 39.00 13.0032 Apr-05 83.00 90.00 15.80 5.00 20.80 0.28 0.27 21.35 24.00 10.0033 May-05 82.00 84.00 15.40 4.80 20.20 1.08 0.60 21.88 24.00 9.0034 Jun-05 82.00 85.00 14.60 4.70 19.30 1.07 0.72 21.09 25.00 8.00
35 Jul-05 84.00 86.00 14.30 not in spreadsheets 18.60 1.47 0.77 20.84 11.00 9.00
36 Aug-05 82.00 83.00 13.90 17.60 1.57 1.11 20.28 8.00 8.0037 Sep-05 79.00 80.00 11.80 16.30 2.91 1.24 20.45 5.00 7.0038 Oct-05 87.00 103.00 9.20 13.40 3.00 0.99 17.39 26.00 7.0039 Nov-05 85.00 90.00 10.30 14.40 4.23 0.86 19.49 63.00 8.0040 Dec-05 82.00 88.00 10.30 14.70 5.00 0.66 20.36 26.00 7.00
41 AVERAGE (rounded) 82.00 86.00 13.41 4.82 17.92 2.22 0.71 20.85 27.58 8.92
4243 Rockaway Jan-05 19.00 20.00 3.00 3.30 6.30 7.12 0.67 14.09 4.00 11.0044 Feb-05 19.00 19.00 9.60 4.50 14.10 1.82 0.37 16.29 3.00 5.0045 Mar-05 18.00 19.00 11.80 3.00 14.80 0.70 0.45 15.95 2.00 4.0046 Apr-05 20.00 21.00 5.20 2.30 7.50 5.22 0.97 13.69 2.00 4.0047 May-05 20.00 21.00 4.00 1.90 5.90 7.47 0.98 14.35 2.00 4.0048 Jun-05 20.00 21.00 4.50 2.40 6.90 5.59 1.25 13.74 3.00 3.00
49 Jul-05 21.00 22.00 3.75 not in spreadsheets 5.62 4.27 1.48 11.37 5.00 4.00
50 Aug-05 20.00 20.00 2.20 4.95 5.12 2.58 12.65 6.00 4.0051 Sep-05 19.00 19.00 3.92 5.86 5.81 1.85 13.52 4.00 4.0052 Oct-05 22.00 27.00 1.81 3.66 4.29 1.48 9.43 13.00 4.0053 Nov-05 21.00 21.00 4.35 6.39 4.08 1.20 11.67 2.00 3.0054 Dec-05 20.00 21.00 9.73 12.38 1.13 0.66 14.17 5.00 6.00
55 AVERAGE (rounded) 20.00 21.00 5.32 2.90 7.86 4.39 1.16 13.41 4.25 4.67
56

Jamaica Plan DEIS WPCP and CSO Impact Analysis January 2007
Page 25 of 26
Lookup # 2 3 5
Infrastructure Improvement Description
Existing CSO Flow
(MG/year)
Project CSO Flow
(MG/year)
CSO Flow Reduction /
Increase (incremental stormwater increase, MG/year)
CSO TN (lbs/MG)
CSO BOD (lbs/MG)
CSO Fecal Coliform
(billion count / MG)
Stormwater TN (lbs/MG)
Stormwater BOD (lbs/MG)
Stormwater Fecal
Coliform (billion count
/ MG)
Laurleton High Level
Storm Sewer Separation
Reduced CSO flows to
Thurston904.00 75.40 828.60 23.98 112.35 5,705.29 17.34 78.58 1,323.00
26th Ward Expansion
(Fresh)
Reduced CSO flows to Fresh Creek (WPCP flows from 170
MGD to 220 MGD)
324.00 192.00 132.00 41.83 227.86 25,213.70 17.34 78.58 4,536.00
26th Ward Expansion (Hendrix)
Reduced CSO flows to
Hendrix Creek (WPCP flows
from 170 MGD to 220 MGD)
33.00 0.00 33.00 41.83 227.86 25,213.70 17.34 78.58 4,536.00
26th Ward Expansion
(Spring Creek)
Increased CSO flows to Spring Creek (WPCP flows from 170
MGD to 220 MGD)
249.00 270.00 -21.00 41.83 227.86 25,213.70 17.34 78.58 4,536.00
Total (Laurelton + 26th Ward
Improvements)
1,510.00 537.40 972.60 na na na na na na
TN Existing CSO Load (lbs/year)
TN Project CSO Load (lbs/year)
TN Project Incremental Stormwater
Load (lbs/year)
TN Total Project Load
(lbs/year)
TN Total Project
Reduction (lbs/year)
BOD Existing CSO Load (lbs/year)
BOD Project CSO Load (lbs/year)
BOD Project Incremental Stormwater
Load (lbs/year)
BOD Total Project Load
(lbs/year)
BOD Total Project
Reduction (lbs/year)
Laurleton High Level
Storm Sewer Separation
Reduced CSO flows to
Thurston21,675.74 1,807.91 14,365.10 16,173.01 5,502.73 101,567.63 8,471.46 65,113.69 73,585.15 27,982.49
26th Ward Expansion
(Fresh)
Reduced CSO flows to Fresh Creek (WPCP flows from 170
MGD to 220 MGD)
13,554.29 8,032.17 2,288.43 10,320.60 3,233.69 73,827.67 43,749.73 10,372.93 54,122.66 19,705.01
26th Ward Expansion (Hendrix)
Reduced CSO flows to
Hendrix Creek (WPCP flows
from 170 MGD to 220 MGD)
1,380.53 0.00 572.11 572.11 808.42 7,519.49 0.00 2,593.23 2,593.23 4,926.25
26th Ward Expansion
(Spring Creek)
Increased CSO flows to Spring Creek (WPCP flows from 170
MGD to 220 MGD)
10,416.72 11,295.24 0.00 11,295.24 -878.52 56,737.93 61,523.06 0.00 61,523.06 -4,785.13
Total (Laurelton + 26th Ward
Improvements)
47,027.28 21,135.32 17,225.64 38,360.96 8,666.32 239,652.72 113,744.25 78,079.84 191,824.09 47,828.63
Flow
s an
d C
once
ntra
tions
Load
s Pe
r Yea
r

Jamaica Plan DEIS WPCP and CSO Impact Analysis January 2007
Page 26 of 26
mg pound tons checks flow mg/L mg/d tons/day tons/yr907,185,818.87 2,000.00 1.00 58.58 13.82 3,064,577,016.28 3.38 1,233.01 (0.02)
453,592.91 1.00 5.00E-04 93.00 18.05 6,354,381,491.21 7.00 2,556.64 (0.00) 1.00 2.20E-06 1.10E-09 86.00 20.85 6,787,621,869.89 7.48 2,730.95 (0.00)
21.00 13.41 1,066,009,812.49 1.18 428.90 (0.00) L gallon million gallons 20.00 14.30 1,082,627,770.22 1.19 435.59 0.00
3,785,411.78 1,000,000.00 1.00 58.58 17.90 3,969,314,659.29 4.38 1,597.03 4.38 3.79 1.00 1.00E-06 58.58 17.90 3,969,314,659.29 4.38 1,597.03 4.38 1.00 2.64E-01 2.64E-07 58.58 17.90 3,969,314,659.29 4.38 1,597.03 4.38
58.58 17.90 3,969,314,659.29 4.38 1,597.03 #VALUE!100 ml gallon million gallons
37,854,117.84 1,000,000.00 1.00 37.85 1.00 5.00E-04
1.00 2.64E-02 2.64E-08
day year365.00 1.00
1.00 2.74E-03
NITROGEN FLOW WEIGHTED CONC. AND LOADINGDAY Daily Flow INF-TN INF-TN-LO EFF-TN EFF-TN-LOAD
MGD mg/L Lb/d mg/L Lb/d
1.00 22.00 16.70 3,064.12 11.40 2,091.67 2.00 17.00 15.10 2,140.88 10.70 1,517.05 3.00 21.00 20.60 3,607.88 10.80 1,891.51 4.00 22.00 19.10 3,504.47 11.80 2,165.06 5.00 22.00 19.50 3,577.86 13.70 2,513.68 6.00 20.00 19.00 3,169.20 15.90 2,652.12 7.00 20.00 17.60 2,935.68 14.30 2,385.24