appendix e - oregon
TRANSCRIPT

Appendix E
Sediment Oxygen Demand in Selected Sites of the Lost River and Klamath River
By
J.M. Eilers MaxDepth Aquatics, Inc.
And Richard Raymond
Environmental Science Resources, LLC January, 2005

This Page Intentionally Left Blank

MaxDepth Aquatics, Inc.
Sediment Oxygen Demand in Selected Sites of the Lost River and Klamath River
Prepared for
Tetra Tech, Inc. Fairfax, VA
By
J.M. Eilers MaxDepth Aquatics, Inc.
Bend, OR
And
Richard Raymond Environmental Science Resources, LLC
Corvallis, OR
January, 2005
SOD in the Klamath and Lost Rivers January 2005
ABSTRACT Six sediment cores were collected in July 2004 from five sites in the Lost River and Klamath River systems and incubated 600 hours to determine rates of sediment oxygen demand (SOD) and release of nitrogen and phosphorus. The SOD rates ranged from 1.3 to 3.6 g/m2/d, with the highest rates measured in the three cores from Lake Ewauna. Ammonia release was measured only in the sediment from Lake Ewauna and phosphorus release rates were greatest in the Lake Ewauna cores. The SOD rates measured from the cores collected in 2004 were similar to previous studies conducted in the Klamath system.
MaxDepth Aquatics, Inc. 2

SOD in the Klamath and Lost Rivers January 2005
INTRODUCTION The Lost and Klamath Rivers currently do not meet water quality standards. As part of the process for the TMDL analysis of these systems, Tetra Tech scientists are applying a mathematical model to help explain the current conditions and to evaluate approaches for improving water quality to meet water quality standards. To achieve a better calibration of the water quality model, it is desirable to have information regarding the rate of oxygen uptake in the sediments, referred to as sediment oxygen demand (SOD). The SOD can be a critical component of oxygen metabolism in many rivers and where possible it is best to collect site-specific data for this information rather than having to rely on ranges of values derived from the literature. The purpose of this project is to provide Tetra Tech staff with specific information regarding SOD in targeted areas of the Lost and Klamath River systems. METHODS Sediment coring sites listed in Table 1 were determined in consultation with staff from Tetra Tech, Inc., the Oregon Department of Environmental Quality (DEQ) and the North Coast Regional Water Quality Control Board (NCRWQCB). The site in the Klamath Estuary (KRE-01) was based on coordinates provided by the NCRWQCB. The sites in Lake Ewauna (EWA-01) and downstream (EWA-02 and EWA-03) were determined by Steve Kirk, DEQ, who was present during collection of sediment cores from these three sites. Sediment samples were collected with a 90 mm diameter sediment corer equipped with a pneumatic device for retaining the sediments (Figure A-1). The corer was lowered slowly into the sediments with a hydraulic winch to provide an undisturbed core. The one exception was at site HPUS where the corer was manually lowered into the sediments. The cores were retained in the vertical position and placed upright in a container and packed with ice. The sediment cores were transported to Corvallis, OR for incubation by Environmental Sciences Resources. The water overlying the sediment was siphoned off and replaced with distilled water prior to initiating the incubation and sampling. The cores were filled to the top with distilled water and sealed to eliminate exchange with the atmosphere. Ports were provided to allow sampling of the cores without exposure to the atmosphere. Measurements of temperature, dissolved oxygen (DO), pH, specific conductance, and ORP (redox potential) were made with a YSI 600XLM multiparameter sonde following calibration of the instrument according to manufacturer’s recommendations. Aliquots of the water in the incubation tubes were periodically extracted, placed on ice, and transported to the CH2M-Hill analytical laboratory in Corvallis for analysis of ortho-phosphorus, nitrate (nitrate + nitrite), and ammonia. The volume of water extracted for analytical purposes was replaced in each. A core tube filled with distilled water (labeled as “Blank”) was treated in identical fashion as the other cores to provide an indication of the effect of the core and incubation assembly on the results. Analytical methods are described in the QAPP filed for the project.
MaxDepth Aquatics, Inc. 3

SOD in the Klamath and Lost Rivers January 2005
Table 1. Sampling sites for collection of sediment core samples. Site Name Site Code Latitude Longitude Description Elapsed
Timec (hr) Harpold Dama
HPUS 42 09.244 121 39.773 Upstream of dam 44
Wilson Reservoir
WIL 42 09.141 121 39.807 Upstream of diversion dam
47
Lake Ewauna 1
EWA-01 42 13.025 121 46.893 In shallows adjacent to outfall
73
Lake Ewauna 2 & 3b
EWA-02 EWA-03
42 10.626 121 47.845 Above Hwy 97 Bridge, downstream of log rafts
71
Klamath Estuary
KRE-01 41 32.44 124 4.59 Offshore of south boat ramp
96
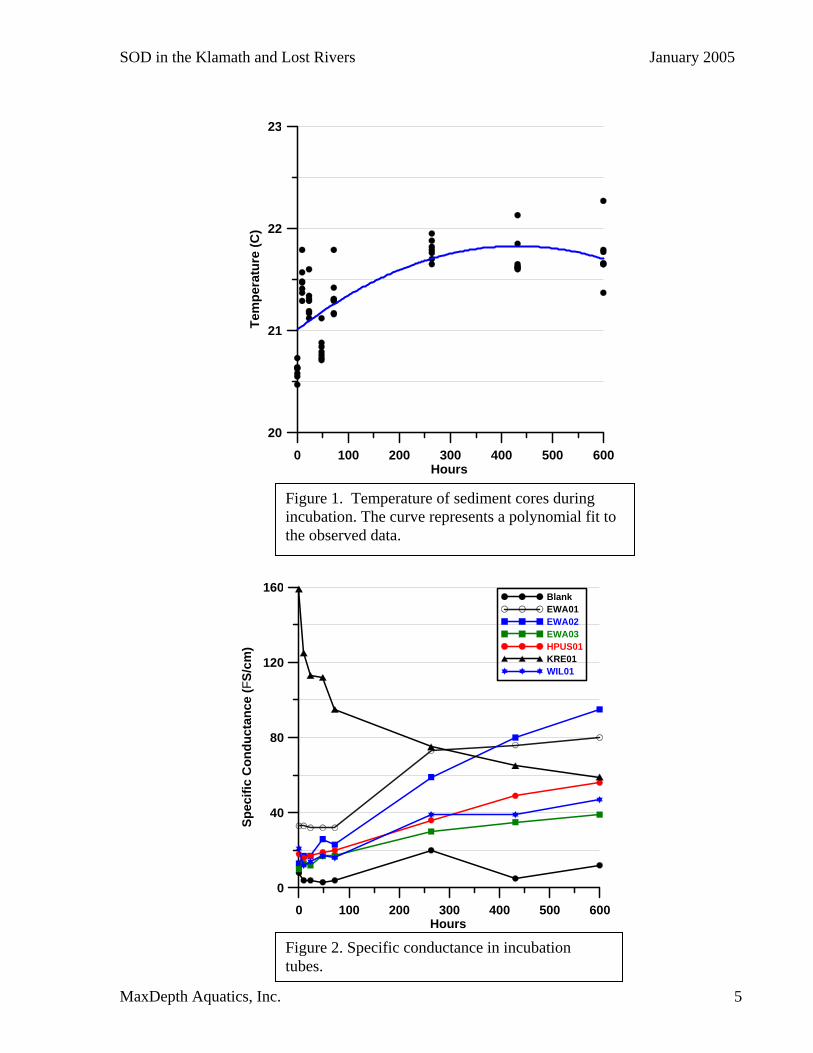
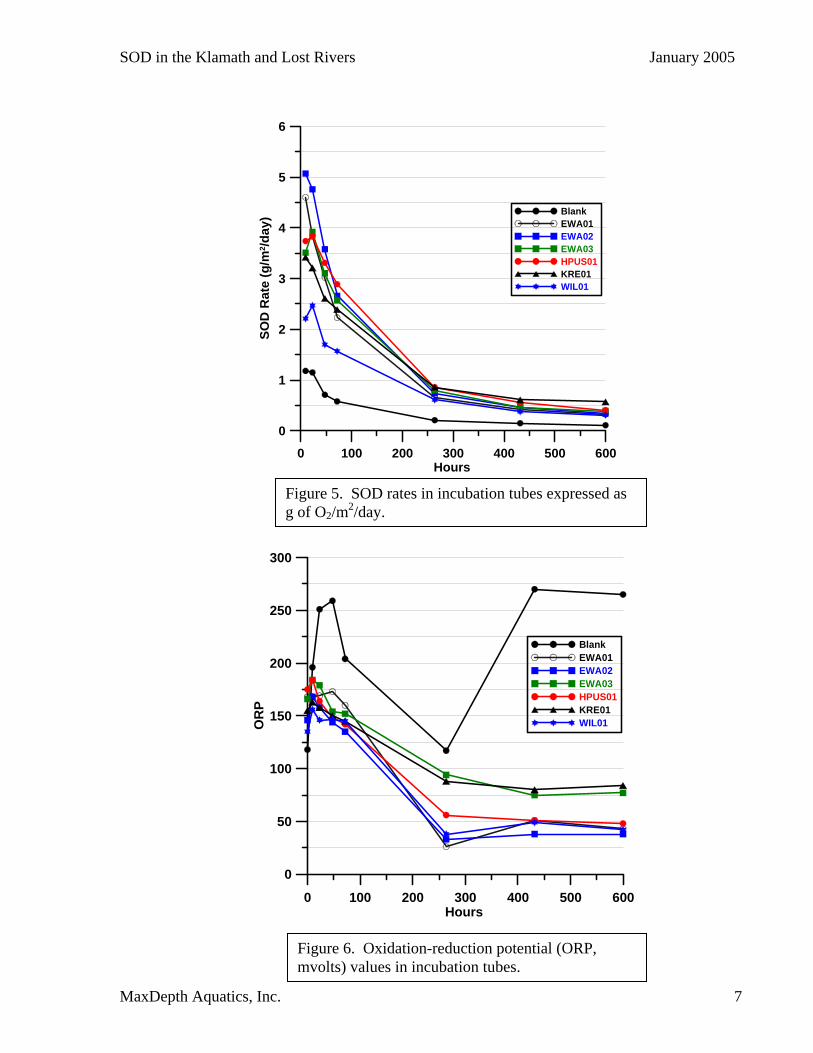
a This site was substituted for ARDMUS (Anderson-Rose Dam) because of difficulty with access for the ARDMUS site. b Cores co-located within several meters c Time between collection of sediment core and first in-situ measurement RESULTS The results of the in-situ and laboratory analyses are shown in Figures 1-9. Temperature remained between 21 °C and 22 °C during the incubation. Specific conductance increased during the incubation in all cores, except for KRE01, which showed a substantial decrease. Dissolved oxygen (DO) concentrations decreased most rapidly in the first 48 hours and generally approached minimum values in the first 72 hours (Figure 3). However, KRE01 and to a lesser extent WIL01, showed a lower rate of oxygen depletion. KRE01 was the only core that continued to show a decrease in DO throughout the period of incubation. However, some of this response may be related to a small leak in this core that persisted during the course of the study. Patterns in rates of oxygen consumption and cumulative oxygen depletion (Figure 4) reflected the rates in depletion of oxygen concentrations. The actual SOD (Figure 5) is a rate calculated for each measurement interval, whereas Figure 4 shows the cumulative consumption of oxygen during the entire incubation. ORP values declined during the course of the incubation, but remained positive and showed little change after 250 hours of incubation. pH showed a rapid decrease during the incubation and stabilized below pH 6 in most cores after 72 hours. The one exception was in EWA01 which showed an apparent increase midway during the incubation, but then returned to values similar to other cores after 400 hours of incubation. The blank core showed substantial variation in pH, presumably because of the low conductance values in the distilled-water only core and the problems associated with measuring pH in very dilute solutions. Ortho-phosphorus increased in most cores, but only after 250 hours of incubation. Again, the one exception was with core KRE01 where phosphorus concentrations declined during the incubation period. Nitrate concentrations were never observed at measurable concentrations during the incubation. However, ammonia showed substantial increases in cores EWA01, EWA02, and EWA03. No significant increases in ammonia were observed in the other cores.
MaxDepth Aquatics, Inc. 4
SOD in the Klamath and Lost Rivers January 2005
0 100 200 300 400 500 600Hours
20
21
22
23
Tem
pera
ture
(C)
Figure 1. Temperature of sediment cores during incubation. The curve represents a polynomial fit to the observed data.
0 100 200 300 400 500 600Hours
0
40
80
120
160
Spec
ific
Con
duct
ance
(FS/
cm)
BlankEWA01EWA02EWA03
HPUS01KRE01WIL01
Figure 2. Specific conductance in incubation tubes.
MaxDepth Aquatics, Inc. 5

SOD in the Klamath and Lost Rivers January 2005
0 100 200 300 400 500 600Hours
0
20
40
60
80
100
120
Dis
solv
ed O
xyge
n (%
) BlankEWA01EWA02EWA03HPUS01KRE01WIL01
Figure 3. Dissolved oxygen (percent saturation) in incubation tubes.
0 100 200 300 400 500 600Hours
-2
0
2
4
6
Oxy
gen
Con
sum
ptio
n (g
/m2 /d
)
BlankEWA01EWA02EWA03
HPUS01KRE01WIL01
Figure 4. Oxygen consumption rate in incubation tubes.
MaxDepth Aquatics, Inc. 6
SOD in the Klamath and Lost Rivers January 2005
0 100 200 300 400 500 600Hours
0
1
2
3
4
5
6
SOD
Rat
e (g
/m2 /d
ay) Blank
EWA01EWA02EWA03HPUS01KRE01WIL01
Figure 5. SOD rates in incubation tubes expressed as
g of O2/m2/day.
0 100 200 300 400 500 600Hours
0
50
100
150
200
250
300
OR
P
BlankEWA01EWA02EWA03
HPUS01KRE01WIL01
Figure 6. Oxidation-reduction potential (ORP, mvolts) values in incubation tubes.
MaxDepth Aquatics, Inc. 7

SOD in the Klamath and Lost Rivers January 2005
0 100 200 300 400 500 600Hours
5
6
7
8
9
10
pH
BlankEWA01EWA02EWA03HPUS01KRE01WIL01
Figure 7. pH in incubation tubes.
1 10 10Hours
0
0
0.1
0.2
0.3
0.4
0.5
Ort
ho-P
hosp
horu
s (m
g/L)
BlankEWA01EWA02EWA03HPUS01KRE01WIL01
Figure 8. Ortho-phosphorus concentrations in incubation tubes. The X
axis is displayed in a log scale to show the early changes in P release.
MaxDepth Aquatics, Inc. 8

SOD in the Klamath and Lost Rivers January 2005
1 10 100Hours
0
0.4
0.8
1.2
1.6
2
Am
mon
ia (m
g N
/L)
BlankEWA01EWA02EWA03HPUS01KRE01WIL01
Figure 9. Ammonia concentrations in incubation tubes, shown in log scale.
The SOD incubations for the Klamath and Lost River sites show relatively modest rates of oxygen uptake by the sediments. The measured values in the sediment cores ranged from about 2.5 to 4.8 g/m2/d (uncorrected for blank) or 1.32 to 3.61 g/m2/d (corrected for blank). (Table 2). The greatest SOD rates were observed in the three cores from Lake Ewauna (EWA01-03) and from the Harpold Dam (HPUS) site. The lowest long-term rate of SOD (Figure 5) was observed in the core from the Klamath Estuary (KRE01), although the lowest SOD24 rate was measured in WIL01 (Table 2). This is not surprising since the sediment from the estuary was comprised of a high proportion of sand, whereas the other cores contained a high proportion of fine–textured material with a higher content of organic matter. The sediment composition of the cores shows the very low carbon and nitrogen content of the Klamath Estuary core and the relatively low content of phosphorus compared to the other cores (Table 3).
MaxDepth Aquatics, Inc. 9

SOD in the Klamath and Lost Rivers January 2005
Table 2. Sediment oxygen demand in sediments collected from sites in the Lost River and Klamath River.
Site Core Raw SOD g/m2/d
(1st 24 hrs)
SOD g/m2/d
(corrected for blank)
Blank BLANK 1.15 -- Lake
Ewauna EWA01 3.83 2.68
Lake Ewauna
EWA02 4.76 3.61
Lake Ewauna
EWA03 3.92 2.77
Wilson Reservoir
WIL01 2.47 1.32
Harpold Dam
HPUS01 3.84 2.69
Klamath Estuary
KRE01 3.21 2.06
Table 3. Sediment composition from the incubation cores (following incubation).
Core C (%)
N (%)
P (ppm)
Wood Chips (Dry Wt, g)
Lake Ewauna
EWA01 15.2a 0.82a 699a 21.34
Lake Ewauna
EWA02 9.2a 0.72a 437a 23.96
Lake Ewauna
EWA03 16.8a 0.80a 476a 23.10
Wilson Reservoir
WIL01 2.69 0.28 463 __
Harpold Dam
HPUS01 2.8 0.3 508 __
Klamath Estuary
KRE01 0.2 0.02 320 __
a Analytical results do not include wood chips, which were removed for measurements of mass.
MaxDepth Aquatics, Inc. 10
SOD in the Klamath and Lost Rivers January 2005
DISCUSSION The rates of oxygen depletion are similar to previously reported results from the area (Eilers and Raymond 2003, Raymond and Eilers 2004, USGS [http://or.water.usgs.gov/projs_dir/lake_ewauna_sod/rate_table.html], Wood 2001). The sediments from Lake Ewauna all contained considerable amounts of wood fiber ranging in size from sawdust up through bark and wood chips several centimeters long. Even with the large pieces of wood fiber (cf Figure A-5) removed from the Lake Ewauna cores, the carbon content was still high. We are uncertain how to explain the relatively high “SOD” measured in the blank core. Wood (2001) also reported a moderately high blank value (0.6 g/m2/d) from her sediment core incubations. It may be that we did not allow the blank core to adequately equilibrate following the introduction of the distilled water, which would have resulted in a slight supersaturation at the beginning and thus provide an apparent oxygen consumption during the initial incubation period. The three cores from Lake Ewauna and the HPUS core showed moderate release of phosphorus from the sediments, whereas little or no phosphorus was released from the other cores. The absence of phosphorus release from the Wilson Reservoir core (WIL01) is surprising in that upstream at HPUS01 there was considerable release of phosphorus. The HPUS core had a slightly higher P content compared to the WIL01 site, but this difference is probably insufficient to explain the differences in P release during the incubation. The net retention of phosphorus in core KRE01 may reflect a change in sediment binding sites in the conversion from what we presume was brackish water in the estuary to fresh water in the incubation chamber. Also, the relatively high proportion of sand in KRE01 would offer relatively few binding sites for phosphorus. The only cores to release appreciable ammonia during the incubation were the three Lake Ewauna cores. The abundance of wood fiber may provide a substantial source of nitrogen for ammonification under conditions of depleted oxygen. During collection of cores from Lake Ewauna, we observed a considerable amount of gas being released from the sediment. The gas retained in the sediment cores may also have served as a source for the ammonia observed in the Lake Ewauna incubation cores, although no gas evolution was observed during the incubations. The cores EWA-02 and EWA-03 were gathered only several meters apart and were designated as “duplicates”. However, the results show that there were generally greater differences between the “duplicates” compared to EWA-01 and EWA-02. This suggests that localized variations in sediment composition can alter the SOD and rates of nutrient release to a considerable degree. This is consistent with the findings of Wood (2001) who observed localized variations in SOD rates for Upper Klamath Lake (Table 4). With such a small sample size of sediment cores for this and related studies, it is not possible to say with confidence that theses samples adequately characterize the extent of variation in SOD rates for the Lost River or the Klamath River. Based on how the sample sites were selected, generally in deposition zones with above-average sediment accumulation, we would expect that the samples from this study would be biased towards the high side. Inclusion of the SOD rates from the thalweg would be expected to be less
MaxDepth Aquatics, Inc. 11
SOD in the Klamath and Lost Rivers January 2005
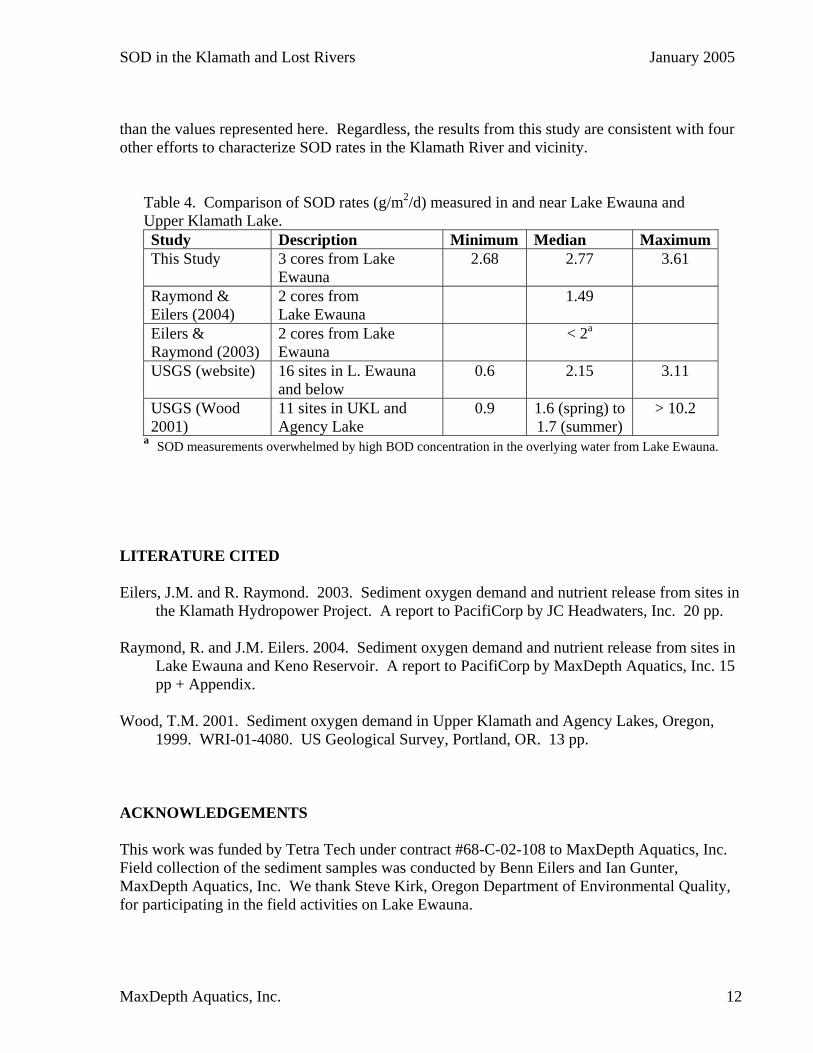
than the values represented here. Regardless, the results from this study are consistent with four other efforts to characterize SOD rates in the Klamath River and vicinity. Table 4. Comparison of SOD rates (g/m2/d) measured in and near Lake Ewauna and Upper Klamath Lake.
Study Description Minimum Median MaximumThis Study 3 cores from Lake
Ewauna 2.68 2.77 3.61
Raymond & Eilers (2004)
2 cores from Lake Ewauna
1.49
Eilers & Raymond (2003)
2 cores from Lake Ewauna
< 2a
USGS (website) 16 sites in L. Ewauna and below
0.6 2.15 3.11
USGS (Wood 2001)
11 sites in UKL and Agency Lake
0.9 1.6 (spring) to 1.7 (summer)
> 10.2
a SOD measurements overwhelmed by high BOD concentration in the overlying water from Lake Ewauna. LITERATURE CITED Eilers, J.M. and R. Raymond. 2003. Sediment oxygen demand and nutrient release from sites in
the Klamath Hydropower Project. A report to PacifiCorp by JC Headwaters, Inc. 20 pp. Raymond, R. and J.M. Eilers. 2004. Sediment oxygen demand and nutrient release from sites in
Lake Ewauna and Keno Reservoir. A report to PacifiCorp by MaxDepth Aquatics, Inc. 15 pp + Appendix.
Wood, T.M. 2001. Sediment oxygen demand in Upper Klamath and Agency Lakes, Oregon,
1999. WRI-01-4080. US Geological Survey, Portland, OR. 13 pp. ACKNOWLEDGEMENTS This work was funded by Tetra Tech under contract #68-C-02-108 to MaxDepth Aquatics, Inc. Field collection of the sediment samples was conducted by Benn Eilers and Ian Gunter, MaxDepth Aquatics, Inc. We thank Steve Kirk, Oregon Department of Environmental Quality, for participating in the field activities on Lake Ewauna.
MaxDepth Aquatics, Inc. 12

SOD in the Klamath and Lost Rivers January 2005
APPENDICES
1. Site and Core Photos
Figure A-1. Retrieving a sediment core from Lake
Ewauna using hydraulic winch and pneumatic sediment retention device.
MaxDepth Aquatics, Inc. 13
SOD in the Klamath and Lost Rivers January 2005
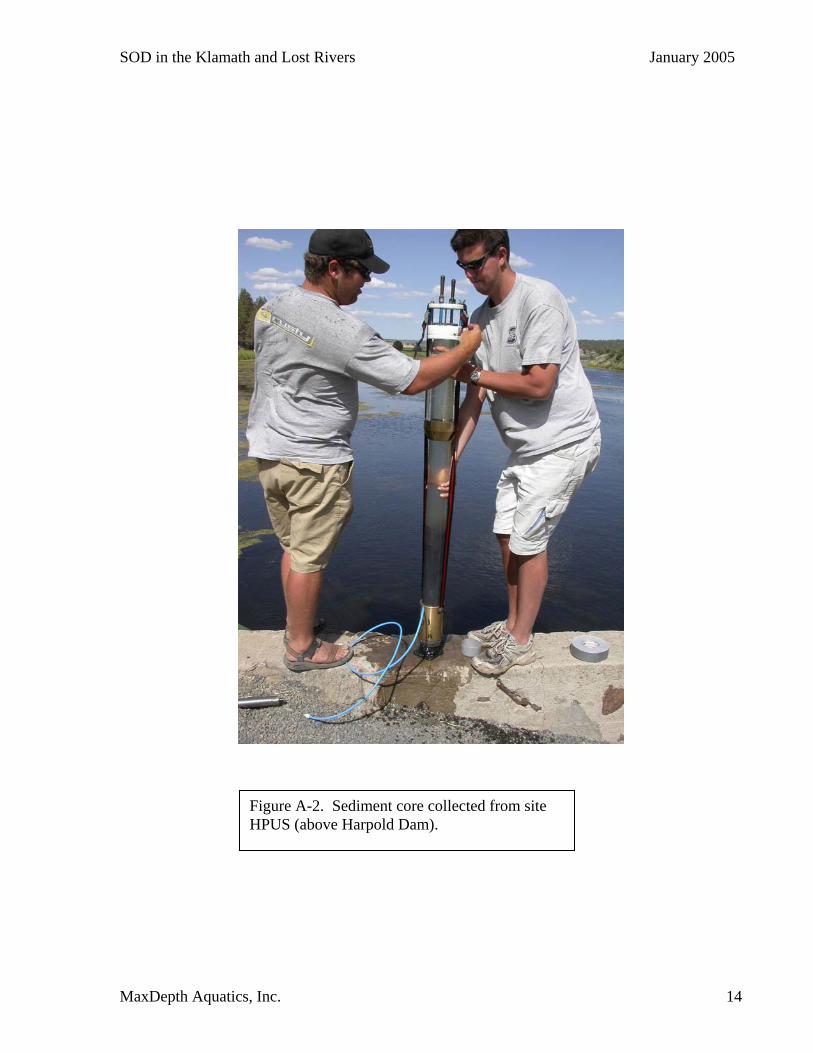
Figure A-2. Sediment core collected from site HPUS (above Harpold Dam).
MaxDepth Aquatics, Inc. 14

SOD in the Klamath and Lost Rivers January 2005
MaxDepth Aquat
Figure A-3. Sediment core EWA-01 collected from Lake Ewauna. Note wood chips extending from the sediment-water interface. The light colored area in thelower half of the core represents gas present in the sediment.
ics, Inc. 15

SOD in the Klamath and Lost Rivers January 2005
Figure A-4. Approximate location for collection of cores EWA-02 and
EWA-03 just upstream of the Hwy 97 bridge.
MaxDepth Aquatics, Inc. 16

SOD in the Klamath and Lost Rivers January 2005
Figure A-5. Wood chips from sediment cores EWA-02 and EWA-03 (top) and a close-up of wood chips from core EWA-01.
MaxDepth Aquatics, Inc. 17