appendix e visual assessment - bpa.gov e visual... · the transmission line towers would carry ......
TRANSCRIPT
Appendix E
Visual Assessment


Visual Resource Report in Support of the
I‐5 Corridor Reinforcement Project Environmental Impact Statement
Prepared for:
Bonneville Power Administration
P.O. Box 3621 Portland, OR 97208‐3621
Prepared by:
Golder Associates Inc.
March 2012

Appendix E Visual Resource Report
I-5 Corridor Reinforcement Project March 2012

Appendix E Visual Resource Report
I-5 Corridor Reinforcement Project i March 2012
Table of Contents
1.0 Introduction ................................................................................................................................ 1
1.1 Data Sources ........................................................................................................................... 1
1.2 Analytical Methods ................................................................................................................ 1
1.2.1 Visual Resource Inventory .............................................................................................. 4
1.2.2 Visual Simulations........................................................................................................... 6
1.2.3 Visual Contrast Rating .................................................................................................... 7
1.3 Definition of the Study Area .................................................................................................. 8
2.0 Affected Environment ................................................................................................................ 9
2.1 Willapa Hills ........................................................................................................................... 9
2.2 Cowlitz/Chehalis Foothills ..................................................................................................... 9
2.3 Western Cascades Lowlands and Valleys ............................................................................ 10
2.4 Valley Foothills .................................................................................................................... 10
2.5 Portland/Vancouver Basin .................................................................................................... 11
2.6 Substations ............................................................................................................................ 11
2.6.1 Sundial Substation ......................................................................................................... 11
2.6.2 Casey Road Substation .................................................................................................. 11
2.6.3 Baxter Road Substation ................................................................................................. 12
2.6.4 Monahan Creek Substation ............................................................................................ 12
2.7 West Alternative ................................................................................................................... 12
2.7.1 Scenic Quality Ratings .................................................................................................. 13
2.7.2 Sensitivity Ratings and Overall Landscape Ratings ...................................................... 14
2.8 Central Alternative ............................................................................................................... 15
2.8.1 Scenic Quality Ratings .................................................................................................. 16
2.8.2 Sensitivity Ratings and Overall Landscape Ratings ...................................................... 17
2.9 East Alternative .................................................................................................................... 18
2.9.1 Scenic Quality Ratings .................................................................................................. 19
2.9.2 Sensitivity Ratings and Overall Landscape Ratings ...................................................... 20
2.10 Crossover Alternative ......................................................................................................... 21
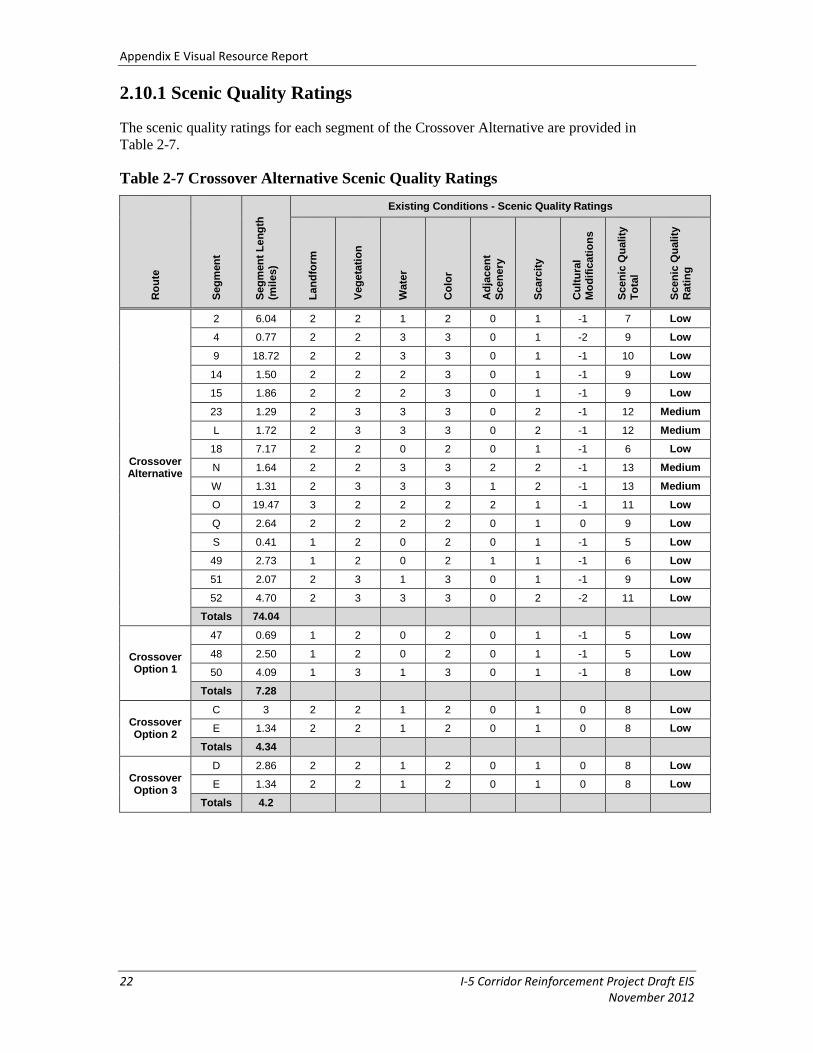
2.10.1 Scenic Quality Ratings ................................................................................................ 22
2.10.2 Sensitivity Ratings and Overall Landscape Ratings .................................................... 23
3.0 Environmental Consequences .................................................................................................. 24
3.1 Visual Impact ....................................................................................................................... 24
3.1.1 Impact Levels ................................................................................................................ 24
3.2 Impacts Common to Action Alternatives ............................................................................. 25
3.3 Substations ............................................................................................................................ 25
3.3.1 Sundial Substation ......................................................................................................... 25

Appendix E Visual Resource Report
ii I-5 Corridor Reinforcement Project March 2012
3.3.2 Casey Road Substation .................................................................................................. 25
3.3.3 Baxter Road Substation ................................................................................................. 25
3.3.4 Monahan Creek Substation ............................................................................................ 25
3.4 West Alternative ................................................................................................................... 26
3.4.1 West Option 1 ................................................................................................................ 37
3.4.2 West Option 2 ................................................................................................................ 39
3.4.3 West Option 3 ................................................................................................................ 43
3.5 Central Alternative ............................................................................................................... 44
3.5.1 Central Option 1 ............................................................................................................ 47
3.5.2 Central Option 2 ............................................................................................................ 47
3.5.3 Central Option 3 ............................................................................................................ 48
3.6 East Alternative .................................................................................................................... 51
3.6.1 East Option 1 ................................................................................................................. 54
3.6.2 East Option 2 ................................................................................................................. 55
3.6.3 East Option 3 ................................................................................................................. 55
3.7 Crossover Alternative ........................................................................................................... 55
3.7.1 Crossover Option 1 ........................................................................................................ 57
3.7.2 Crossover Option 2 ........................................................................................................ 58
3.7.3 Crossover Option 3 ........................................................................................................ 58
3.8 No Action Alternative .......................................................................................................... 59
4.0 Mitigation Measures ................................................................................................................. 60
5.0 Unavoidable Impacts ................................................................................................................ 61
6.0 Cumulative Effects of the Project ............................................................................................. 62
7.0 Federal, State, Local, and Permit Requirements Review ......................................................... 63
8.0 List of Preparers ....................................................................................................................... 64
9.0 References ................................................................................................................................ 65
10.0 Acronyms and Glossary ......................................................................................................... 66

Appendix E Visual Resource Report
I-5 Corridor Reinforcement Project iii March 2012
List of Tables
Table 1-1 Viewpoints
Table 1-2 Scenic Quality Evaluation Criteria Ranking
Table 1-3 Visual Resource Landscape Rating
Table 1-4 Degree of Contrast Criteria
Table 2-1 West Alternative Scenic Quality Ratings
Table 2-2 West Alternative Sensitivity and Overall Landscape Ratings
Table 2-3 Central Alternative Scenic Quality Ratings
Table 2-4 Central Alternative Sensitivity and Overall Landscape Ratings
Table 2-5 East Alternative Scenic Quality Ratings
Table 2-6 East Alternative Sensitivity and Overall Landscape Ratings
Table 2-7 Crossover Alternative Scenic Quality Ratings
Table 2-8 Crossover Alternative Sensitivity and Overall Landscape Ratings
Table 3-1 Visual Impact Rating
Table 3-2 West Alternative Contrast Ratings and Visual Impact
Table 3-3 Central Alternative Contrast Ratings and Visual Impact
Table 3-4 East Alternative Contrast Ratings and Visual Impact
Table 3-5 Crossover Alternative Contrast Ratings and Visual Impact
List of Figures
Figure 1-1 Viewpoint Locations
Figure 3-1 Viewpoint 25-1
Figure 3-2 Viewpoint 25-2
Figure 3-3 Viewpoint 25-3
Figure 3-4 Viewpoint 41-1
Figure 3-5 Viewpoint 50-1
Figure 3-6 Viewpoint 52-1
Figure 3-7 Viewpoint 40-1
Figure 3-8 Viewpoint 48-1
Figure 3-9 Viewpoint 51-1
Figure 3-10 Viewpoint M-1
Figure 3-11 Viewpoint K-1

Appendix E Visual Resource Report
iv I-5 Corridor Reinforcement Project March 2012

Appendix E Visual Resource Report
I-5 Corridor Reinforcement Project Draft EIS 1 November 2012
1.0 Introduction
This resource report describes the existing conditions and potential impacts on visual resources
from construction and operation of a proposed electrical transmission line route for the I-5
Corridor Reinforcement Project (project). The Bonneville Power Administration (BPA) proposes
to construct a new 500-kV transmission line in a north/south alignment between a new substation
near Castle Rock, Washington and a new substation near BPA’s existing Troutdale Substation in
Multnomah County, Oregon. The transmission line towers would carry conductors for the
electricity, overhead ground wires for lightning protection, and fiber for communication needs.
BPA would construct new and improved existing access roads to accommodate construction and
maintenance of the new transmission line. The route alternatives consist of segments, some of
which are sited parallel to existing transmission lines, either within or adjacent to the existing
right-of-way, and some would be located in new right-of-way. The information provided in this
report may be used in part to select a preferred route and to support a National Environmental
Policy Act (NEPA) Environmental Impact Statement (EIS) for the project.
Four alternatives (West, Central, East, and Crossover) are described and evaluated. Each
alternative is comprised of segments. Each alternative also includes options which consider one
or more other segments in lieu of one or more of the alternative segments. Three alternative sites
for the new north substation are under consideration near Castle Rock. These substations are
each assigned to specific alternatives. One substation site is proposed at the south end of the
project in Oregon.
Section 1 of this report identifies data sources, analytical methods, and defines the study area
used in the evaluation. Section 2 provides an overview of the affected environment, including
descriptions of the alternatives, their options, and potential substation sites. Section 3 describes
the potential impacts of implementing the project. Impact levels are defined and impacts
common to all alternatives are included. Section 4 presents mitigation measures to minimize
impacts on visual quality. Unavoidable impacts that may remain after all mitigation measures
have been implemented are included in Section 5. Cumulative impacts are discussed in Section 6
and include an evaluation of the project in conjunction with other future development. Section 7
provides a description of the review and permit requirements of applicable laws, regulations, and
plans.
1.1 Data Sources
No previous investigations or studies are relevant to or were used for this study. Tower designs
were selected from tower design data provided by BPA on February 10, 2011. Photos used for
this effort were taken by Golder Associates Inc. (Golder).
1.2 Analytical Methods
The method of assessment used for this analysis is based on the Bureau of Land Management’s
(BLM) Visual Resource Management (VRM) system. This method is effective for a variety of
different development types, including transmission line projects. Other methods such as those
designed specifically for forestry are effective for categorizing the landscape and rating the visual
effects of forestry operations, clear cut logging cutblocks, or selective logging. These methods
are less suitable for assessing transmission projects and the visual changes introduced by them,
including construction of transmission towers, circuits/lines, roads, and substations.

Appendix E Visual Resource Report
2 I-5 Corridor Reinforcement Project Draft EIS November 2012
Golder visited the route segments at locations where potentially important visual changes could
occur. Due to the size of the project and remoteness of certain segments, only selected key areas
were visited. Much of the Central and East alternatives is only accessible by logging roads and is
not considered to contain key viewing areas. Golder took photos from 11 viewpoints to aid in the
visual resource assessment. We identified areas of likely importance on maps of the area. In the
field, specific locations were identified that offered a view of the project. The viewpoints are
listed in Table 1-1 and their locations are depicted in Figure 1-1.
Table 1-1 Viewpoints
Viewpoint Segment New
Towers Visible
Existing Line Existing Towers Visible
Easting Northing Direction of View
(Bearing) Location
25-1 25
25/77 to 25/80
Ross-Lexington No 1
6/1 to 6/4 528696 5063610 N
NE Salmon Creek Avenue
25-2 25 25/124
McNary-Ross No 1 / Bonneville PH1-Alcoa No 1&2 6/3 531509 5057281 NNE
NE 76th
Avenue – Walnut Grove
25-3 25 25/78 Ross-Lexington No 1 6/3 528398 5064676 E
WSU Vancouver Campus
40-1 40
40/12 to 40/14
North Bonneville-Ross No 1 / North Bonneville-Ross No 2
26/3 to 26/5 542086 5053784 EES
NW Underwood Street
41-1 41 41/4 to 41/7
Bonneville PH1-Alcoa No 1&2 N/A 543041 5054564 NW
NE 28th
Street
48-1 48 48/1 to 48/7
North Bonneville-Ross No 1 / North Bonneville-Ross No 2
24/2 to 24/4 546833 5053813 WWS
NE 267th
Avenue
50-1 50 50/5 to 50/10
Bonneville PH1-Alcoa No 1&2
3/5, 3/6, 4/1 to 4/4 545856 5052407 NW NE 3
rd Street
51-1 51 51/4 to 51/11
North Bonneville-Troutdale No 1 / North Bonneville-Troutdale No 2 N/A 548814 5053008 S
NE Zeek Road
52-1 52 52/3-52/10
North Bonneville-Troutdale No 1 / North Bonneville-Troutdale No 2 / North Camas-Oak Park No 1
1/1 to 1/12, 2/1 to 2/8 548234 5047480 NNE
Parking Lot Lewis and Clark Highway - Camas
M-1 M M/2 to M/4 N/A N/A 534066 5089450 S
Swimming Beach – Ariel – Lake Merwin
K-1 K K/79 N/A N/A 549193 5093744 EES Yale Bridge Road

Appendix E Visual Resource Report
I-5 Corridor Reinforcement Project Draft EIS 3 November 2012
Figure 1-1 Viewpoint Locations

Appendix E Visual Resource Report
4 I-5 Corridor Reinforcement Project Draft EIS November 2012
Golder collected photos with a Nikon D50 digital camera using a focal length of approximately
50mm (35mm film equivalent), considered consistent with the view perceived by the human eye
(Horenstein et al. 2001). This is the standard focal length used in the development of photo
simulations for visual resource assessment. Where potentially affected landforms were too large
to fit into a single frame, multiple overlapping photos were taken.
The affected environment is discussed below in Section 2.0. This assessment is based on field
observations, photos, maps, and visualization software (Google Earth). The project is divided
into segments, comprising the alternatives, which traverse the landscape. Because the landscape
often changes both in its scenic quality and its sensitivity across a particular segment area, a
viewpoint that is representative of the most altered view does not reflect the overall visual impact
for the entire segment. Other factors that are taken into account are the relative number of
viewers, viewing conditions, length of view, and viewer sensitivity.
The general methods of the BLM VRM system are to inventory the visual resources of an area
using the BLM Visual Resource Inventory methods and to perform analysis on a proposed
alteration using the Visual Resource Contrast Rating (USDI 1986a, 1986b).
1.2.1 Visual Resource Inventory
The visual resource inventory process involves rating an area of land, in this case the area
underlying and surrounding the proposed transmission line segments, measuring its visual appeal,
determining the sensitivity or public concern for the scenic quality, and determining the visibility
of the land to sensitive viewing locations (USDI 1986a). Ratings are performed with the
understanding that all land has scenic value and that certain landscapes have more broadly
appealing features than others. The value placed on the visual landscape is in the context of how
and by whom it is viewed.
1.2.1.1 Scenic Quality
Scenic quality is a measure of the overall appeal of a view. The first step in the visual resource
inventory process is to rate the scenic quality. The resulting ranking is High, Medium, or Low,
which is determined based on several key factors (USDI 1986a). The key factors and the criteria
used to rate them in this visual resource assessment are listed in Table 1-2.
With a maximum possible score of 32, values are totaled with results of 19 or more ranked High,
12 to 18 ranked Medium, and 11 or less ranked Low (these values are represented by A, B, and C
respectively in the BLM VRM system).
1.2.1.2 Sensitivity
The second step in the visual resources inventory is ranking sensitivity levels. Sensitivity is a
way of ranking public concern for visual resources. Factors considered in ranking sensitivity are
the type of users, amount of use, public interest, adjacent land uses, special areas, and other
factors that may be identified in other studies or research. Each of the sensitivity factors is
assigned a ranking of High, Medium, or Low. Based on the ranking result, an overall sensitivity
level is then assigned. The overall ranking is not necessarily an average of the individual factor
rankings, since it is possible for certain factors to outweigh others. For example, public interest
may be very high, despite other factors being low, indicating a generally high level of concern.

Appendix E Visual Resource Report
I-5 Corridor Reinforcement Project Draft EIS 5 November 2012
Table 1-2 Scenic Quality Evaluation Criteria Ranking
Key Factor Rating Criteria and Score
Landform
High vertical relief as expressed in prominent cliffs, spires, or massive rock outcrops, or severe surface variation or highly eroded formations including major badlands or dune systems; or detail features dominant and exceptionally striking and intriguing such as glaciers.
Steep canyons, mesas, buttes, cinder cones, and drumlins; or interesting erosional patterns or variety in size and shape of landforms; or detail features which are interesting though not dominant or exceptional.
Low rolling hills, foothills, or flat valley bottoms; or few or no interesting landscape features.
5 3 1
Vegetation
A variety of vegetative types as expressed in interesting forms, textures, and patterns.
Some variety of vegetation, but only one or two major types.
Little or no variety or contrast in vegetation.
5 3 1
Water
Clear and clean appearing, still, or cascading white water, any of which are a dominant factor in the landscape.
Flowing, or still, but not dominant in the landscape.
Absent, or present, but not noticeable.
5 3 0
Color
Rich color combinations, variety or vivid color; or pleasing contrasts in the soil, rock, vegetation, water or snow fields.
Some intensity or variety in colors and contrast of the soil, rock and vegetation, but not a dominant scenic element.
Subtle color variations, contrast, or interest; generally mute tones.
5 3 1
Influence of Adjacent Scenery
(Beyond the landform being evaluated)
Adjacent scenery greatly enhances visual quality.
Adjacent scenery moderately enhances overall visual quality.
Adjacent scenery has little or no influence on overall visual quality.
5 3 0
Scarcity
One of a kind; or unusually memorable, or very rare within region. Consistent chance for exceptional wildlife or wildflower viewing, etc.
Distinctive, though somewhat similar to others within the region.
Interesting within its setting, but fairly common within the region.
5 3 1
Cultural Modifications
(changes to the visual landscape discernable as artifical, such as buildings or roads)
Modifications add favorably to visual variety while promoting visual harmony.
Modifications add little or no visual variety to the area, and introduce no discordant elements.
Modifications add variety but are very discordant and promote strong disharmony.
2 0 -4
Source: Illustration 2 – Scenic Quality Inventory and Evaluation Chart. Manual 8410a. (USDI 1986a)

Appendix E Visual Resource Report
6 I-5 Corridor Reinforcement Project Draft EIS November 2012
The type of user has an influence on visual sensitivity, as perceptions of the landscape tend to
vary based on the intended use of the land. Recreational sightseers tend to be highly sensitive to
changes in scenic quality. Industrial workers travelling through the area regularly, such as
forestry workers, tend to be less sensitive. Residents tend to have high sensitivity due to their
attachment to the landscape and the duration of their views.
The amount of use influences sensitivity; as with a greater number of viewers, sensitivity
generally increases. Public interest is generally expressed in public meetings, newspaper articles,
websites, signs, and letters. A high public response and level of concern over a project indicate a
higher sensitivity. The adjacent land use can influence sensitivity, as it can influence the type and
expectations of the viewers. For example, adjacent commercial or industrial land use would be
less sensitive than adjacent residential or recreational use. Special areas such as parks, natural
areas, designated scenic areas, etc., can be indicative of a potentially higher level of sensitivity,
but may depend on management objectives set out for the area.
1.2.1.3 Visual Landscape Rating
The scenic quality and sensitivity rankings are combined into a visual landscape rating based on
the following table (see Table 1-3).
Table 1-3 Visual Resource Landscape Rating
Visual Resource
User Sensitivity
High Medium Low
Scenic Quality
High High High High
Medium High Medium Low
Low Medium Low Low
Source: Illustration 11 – Determining Visual Resource Inventory Classes. Manual 8410a. (USDI 1986a)
1.2.2 Visual Simulations
To assess the visual contrast of the project with the existing conditions, a 3-D computer landscape
model of the study area was created using Visual Nature Studio (VNS) software (2010). VNS
allows GIS and other spatial data to be incorporated into a 3-D landscape model. With a Digital
Elevation Model used as the ground surface, vegetation is added to the model based on National
Land Cover Data classified satellite imagery. Key existing views and project features are added
to the model, including vegetation clearing, transmission towers, conductors, and substations.
Transmission tower objects are the approximate size and design of the planned towers, based on
descriptions provided by BPA.
At key viewpoints, visual simulations were created that simulate the appearance of the project
facilities that correspond to the photographs taken in the field. The rendered images from the
modeled views were then used for evaluating contrast.
Appendix E Visual Resource Report
I-5 Corridor Reinforcement Project Draft EIS 7 November 2012
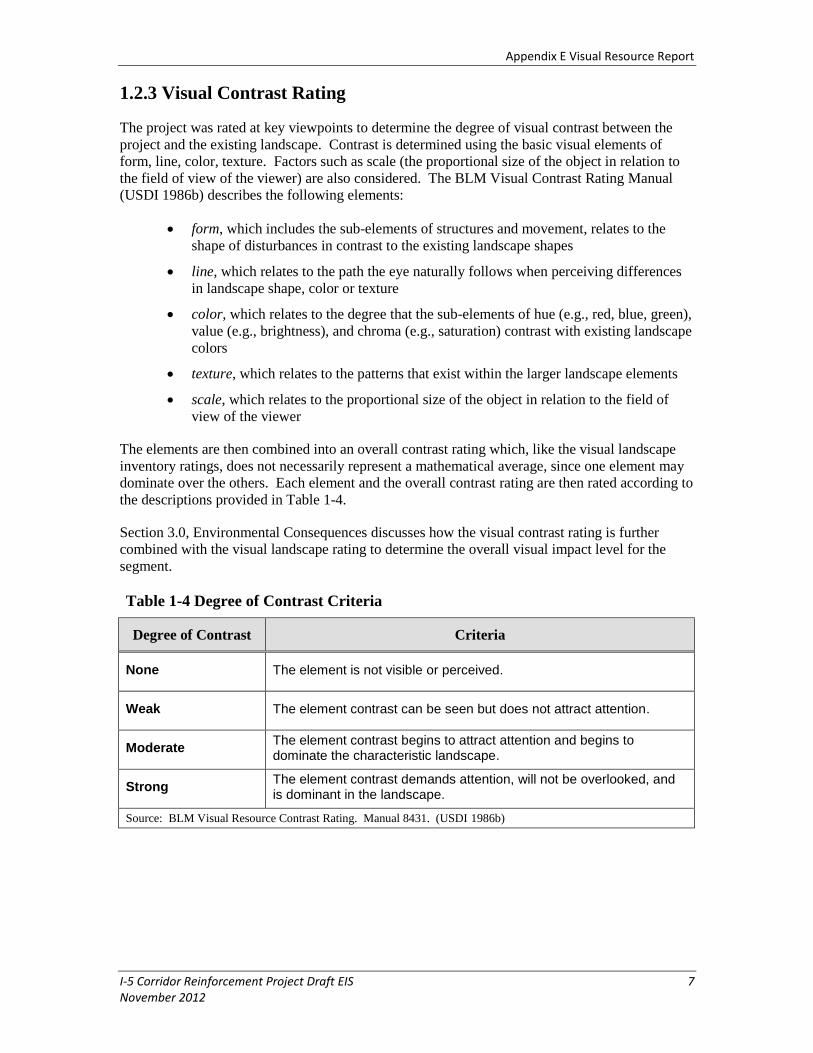
1.2.3 Visual Contrast Rating
The project was rated at key viewpoints to determine the degree of visual contrast between the
project and the existing landscape. Contrast is determined using the basic visual elements of
form, line, color, texture. Factors such as scale (the proportional size of the object in relation to
the field of view of the viewer) are also considered. The BLM Visual Contrast Rating Manual
(USDI 1986b) describes the following elements:
form, which includes the sub-elements of structures and movement, relates to the
shape of disturbances in contrast to the existing landscape shapes
line, which relates to the path the eye naturally follows when perceiving differences
in landscape shape, color or texture
color, which relates to the degree that the sub-elements of hue (e.g., red, blue, green),
value (e.g., brightness), and chroma (e.g., saturation) contrast with existing landscape
colors
texture, which relates to the patterns that exist within the larger landscape elements
scale, which relates to the proportional size of the object in relation to the field of
view of the viewer
The elements are then combined into an overall contrast rating which, like the visual landscape
inventory ratings, does not necessarily represent a mathematical average, since one element may
dominate over the others. Each element and the overall contrast rating are then rated according to
the descriptions provided in Table 1-4.
Section 3.0, Environmental Consequences discusses how the visual contrast rating is further
combined with the visual landscape rating to determine the overall visual impact level for the
segment.
Table 1-4 Degree of Contrast Criteria
Degree of Contrast Criteria
None The element is not visible or perceived.
Weak The element contrast can be seen but does not attract attention.
Moderate The element contrast begins to attract attention and begins to dominate the characteristic landscape.
Strong The element contrast demands attention, will not be overlooked, and is dominant in the landscape.
Source: BLM Visual Resource Contrast Rating. Manual 8431. (USDI 1986b)

Appendix E Visual Resource Report
8 I-5 Corridor Reinforcement Project Draft EIS November 2012
1.3 Definition of the Study Area
The study area for a Visual Resources Assessment is defined as the area within 5 miles of the
project. A distance of 5 miles was used because it represents locations with a potential
foreground or middle-ground view (USDI 1986a) and the maximum distance at which a
transmission line would create a dominant or intrusive presence to the viewer.

Appendix E Visual Resource Report
I-5 Corridor Reinforcement Project Draft EIS 9 November 2012
2.0 Affected Environment
The U.S. Environmental Protection Agency (EPA) Ecoregions provide a description of the
physiography and general land use of the affected environment. The affected environment
traverses several ecoregions as described by the United States Geological Survey (EPA 2007).
Ecoregions are areas of general similarity in ecosystems and in the type, quality, and quantity of
environmental resources; they are designed to serve as a spatial framework for the research,
assessment, management, and monitoring of ecosystems and ecosystem components (see
http://www.epa.gov/wed/pages/ecoregions/level_iii_iv.htm#Level III). This hierarchical system
has subdivisions from Level I to Level IV, with Level I being the coarsest level (dividing North
America into 15 ecological regions) and Level IV being the finest level. The Level III
Ecoregions that dominate the study area’s landscape include the Coast Range, Puget Lowland,
Cascades, and Willamette Valley. These are further divided into Level IV Ecoregions. Level IV
regions crossed by the study area include the Willapa Hills within the Coast Range; the
Cowlitz/Chehalis Foothills within the Puget Lowland; the Western Cascades Lowlands and
Valleys within the Cascades; and the Valley Foothills and Portland/Vancouver Basin within the
Willamette Valley.
The affected environment consists of valley basins and foothills between the Coast Range on the
west and the West Cascades to the east of the study area. The ecoregions traversed by the project
are described in general in the following paragraphs. A more detailed rating of scenic quality and
sensitivity is also provided in Sections 2.1 through 2.4.
2.1 Willapa Hills
At the north end of the project, all action alternatives originate in the Willapa Hills Level IV
ecoregion. Segments A, B and E are contained in this region; segments C and D as well as the
northern portions of segments 1, 2, 3 and F intersect it. This ecoregion consists of low, rolling
hills and gently sloping mountains and fewer drainages than surrounding areas (EPA 2007).
Visually, the region’s landforms are uninteresting and the vegetation patterns do not form
interesting or unique textures or patterns. Water features are not prominent. With fairly uniform
vegetation, there are few interesting color differences, so it does not form a strong scenic element.
The consistent vegetation and low rolling hills result in few long-range views. the hills and
vegetation limit visual effects and result in adjacent scenery having little influence. The region is
relatively sparsely populated, with the neighborhood of Longview Heights in the south and
scattered residential acreages throughout other areas.
2.2 Cowlitz/Chehalis Foothills
All action alternatives also pass through a narrow section of the Cowlitz/Chehalis Foothills Level
IV ecoregion. Segments 4, 5, 7 and 8 are contained in this region, the northern portions of
segments 9, 11 and F as well as the southern portion of Segment 3 intersect it. This region in the
study area consists of rolling to steeply sloping hills and the relatively flat Cowlitz River Valley.
This region also forms the corridor for the Interstate (I-5) and contains the urban areas of
Longview/Kelso and Castle Rock.
The landforms are non-dramatic and of little visual interest. The vegetation does not tend to vary
to form interesting patterns or textures, but rather acts to visually contain the views so that long-
range viewing opportunities are rare. There is water present, predominantly the Cowlitz River;
however, it is not cascading or pristine, so only contributes to somewhat enhance scenic quality.
Appendix E Visual Resource Report
10 I-5 Corridor Reinforcement Project Draft EIS November 2012
There are some color variations in the vegetation; however, they do not dominate or create a
strong scenic element. The influence of adjacent scenery is limited due to the few long-range
viewing opportunities. The visual characteristics of this region are common in much of south-
western Washington and northwest Oregon.
2.3 Western Cascades Lowlands and Valleys
Covering a large part of the study area, the Western Cascades Lowlands and Valleys Level IV
ecoregion includes the many valleys and ridges that stretch out west from the Cascade Range.
Segments 10, 12, 14, 15, 18, 23, 26, 28, 30, 35, G to J, and L to W are contained in this region.
The southern portions of segments 9, 11 and F, the northern portion of Segment 25, and the
eastern portions of segments 39 and 49 intersect it. These segments include most of the East and
Central alternatives.
The region has moderate to steeply sloping hills with western hemlock (Tsuga heterophylla) and
Douglas-fir (Pseudotsuga menziesii) forests. The area has intensive forestry activity throughout.
Although in general it is sparsely populated, it includes the communities of Ariel, Amboy, and
Yacolt in the North; Venersborg and Hockinson in the Southwest; and the rural residential areas
of Camas and Washougal in the South. The Kalama River, Lewis River, Lake Merwin, Yale
Lake, portions of the Gifford Pinchot National Forest, Moulton Falls Park, and other small
recreation sites are within this region of the study area.
The landforms of this region, while having more geographic relief than others in the study area,
are not dominant or exceptional. The vegetation is fairly consistent and does not form interesting
patterns or textures in most places. It tends to be most varied and interesting around the rivers
and lakes mentioned above. Although not dominant through most of the area, water contributes
to scenic quality around Merwin and Yale Lake and along the banks of watercourses. For the
most part, water is not striking, cascading, or pristine. Color contributes to scenic quality,
primarily in the fall. Otherwise, the landscape is dominated by similar shades of green
throughout most of the area during the majority of the year.
2.4 Valley Foothills
West of the Western Cascades Lowlands and Valleys, the Valley Foothills Level IV ecoregion
contains or is intersected by many of the smaller segments of the project in the Camas area.
Segments 38, 41, 43, 45 and 47 fall completely within this region, segments 36B, 37, 39, 46, 48,
49, 50 and 51 intersect it. It is also intersected by a small northern portion of Segment 25.
This ecoregion is a transition zone between the Portland/Vancouver Basin to the west and the
Western Cascades Lowlands and Valleys to the east. It is dryer than the neighboring
mountainous ecosystems and has vegetation reflective of that, with Oregon oak (Quercus
garryana) and Douglas-fir as the native vegetation. The non-native land use, which is more
common than native vegetation, is made up of rural residential developments, woodlands,
pastures, tree farms, vineyards, and orchards.
The landforms of this region consist of low rolling foothills with few dramatic features. There is
some variety in the vegetation; however, it is rarely expressed in interesting forms, textures, or
patterns. Visible water is rare throughout the ecoregion and for the most part does not contribute
to scenic quality. There are some variations in color, which contribute slightly to the scenic
quality; however, they are mostly shades of green and are not a dominant scenic element.
Adjacent scenery has little effect on scenic quality, as most adjacent scenery is either blocked by

Appendix E Visual Resource Report
I-5 Corridor Reinforcement Project Draft EIS 11 November 2012
the topography and vegetation or is not a strong positive influence. The scarcity of the scenery is
considered low, as the scenic elements found in the Valley Foothills are common throughout
much of southwestern Washington and Oregon.
2.5 Portland/Vancouver Basin
The Portland/Vancouver Basin Level IV ecoregion is composed of floodplains and undulating
terraces. Segments 36, 36A, 40 and 52 are contained in the region; segments 36B, 37, 46, 48, 50
and 51 as well as the southern portions of Segment 25 intersect it. All action alternatives move
through this ecoregion before terminating at Sundial Substation.
The landforms of the region are dominated by low relief floodplains with small rolling hills on
the eastern edge. These non-dramatic landforms do little to contribute to scenic quality.
Vegetation is moderately varied in the ecoregion, as the change from rolling hills to floodplains
results in more interesting forms, patterns, and textures. The vegetation patterns in the ecoregion
moderately enhance scenic quality. Water moderately enhances the scenic quality from select
locations surrounding the Columbia and Lewis Rivers, and other small creeks. As a scenic
element, the water is limited in its influence because it is only visible in select locations and
because it is not generally cascading or pristine. Color variations due to the diverse vegetation
moderately enhance the scenic quality, but do not tend to be a dominant landscape element.
Adjacent scenery is generally not highly visible or has little influence on scenic quality. This
type of landscape is similar to other valley and basin ecoregions in southwestern Washington and
northwestern Oregon.
2.6 Substations
2.6.1 Sundial Substation
The Sundial Substation is located in an area of Low scenic quality, owing to the flat relief
floodplains; only somewhat varied vegetation consisting of smaller patches of forest, shrubs and
open pastures; some influence of water, but that is not cascading or pristine; some color variations
that are not a dominant scenic feature; no influence from adjacent scenery (due to limited
visibility); somewhat distinctive scenery, but still common to floodplain landscape; and many
negative cultural modifications due to proximity to an existing industrial park. The area has
Medium sensitivity, given its location next to the Columbia River; high amount of use; low
public interest; little influence of adjacent land use; no special areas; or other considerations. The
combined Low scenic quality rating and Medium sensitivity rating result in a Low visual
landscape rating.
2.6.2 Casey Road Substation
The proposed site of the Casey Road Substation is located in a remote area. . of Low scenic
quality, in consideration of the low rolling foothills lacking dominant vertical relief or specific
interesting landforms; a dense, uniform mixed-wood vegetation that is currently partly logged;
very little visible water; few color variations; and no influence of adjacent scenery due to limited
visibility. The site has a visual landscape common to the region, and includes negative cultural
modifications such as the right-of-way of an existing transmission line and logging activity. The
area has Low sensitivity, given the following factors: the type of use does not include residential
use, parks, or other sensitive recreational uses; the amount of use is low; there is low public
interest; the adjacent land uses do not increase the sensitivity; and there are not any special areas.
Appendix E Visual Resource Report
12 I-5 Corridor Reinforcement Project Draft EIS November 2012
The Low scenic quality rating and Medium sensitivity rating result in a Low visual landscape
rating.
2.6.3 Baxter Road Substation
The site is located approximately 2.5 miles from the Casey Road site, in an area of Low scenic
quality, with low rolling foothills with few interesting features, little variety of vegetation, very
little visible water, few color variations, and no influence of adjacent scenery. The site has a
visual landscape common to the region, and there are no enhancing cultural modifications. The
area has Low sensitivity, given the following factors: the type of use does not include residential
use, parks, or other sensitive recreational uses; the amount of use is low; there is low public
interest; the adjacent land uses do not increase the sensitivity; and there are not any special areas.
The Low scenic quality rating and Medium sensitivity rating result in a Low visual landscape
rating.
2.6.4 Monahan Creek Substation
The Monahan Creek Substation is located in an area of Low scenic quality, in consideration of
the low foothills lacking dominant vertical relief or specific interesting landforms; largely
uniform vegetation consisting primarily of mixed-wood forest and small open pastures; very little
visible influence of water on the landscape; few color variations in the vegetation; no influence of
adjacent scenery (due to limited visibility); a commonly occurring landscape throughout the
region; and negatively influencing cultural modifications (buildings and other structures). The
area is Medium sensitivity, given the rural residential usage, amount of use, and public interest.
The combined Low scenic quality rating and Medium sensitivity rating result in a Low visual
landscape rating.
2.7 West Alternative
The West Alternative originates in the Willapa Hills ecoregion, where it passes through rolling
vegetated hills and rural residential areas before entering the West Side Highway and Kelso in the
Puget Lowland ecoregion. Through the Puget Lowland ecoregion it passes through many
residential and rural-residential areas. The hills become larger and the population less dense as it
passes into the Western Cascades Lowlands and Valleys. After crossing the Lewis River, the
alternative enters the Portland/Vancouver Basin ecoregion. The physiographic characteristics of
the study area are consistent with the descriptions provided for the ecoregions through which the
alternative passes.
The landscape along this alternative is consistent with the description of ecoregions, but the
sensitivity varies locally with land use. Proximity to residential areas is the primary determinant
for sensitivity along the alternative. The West Alternative portion of the study area is relatively
close to residential areas for most of its length. At the north end it passes through rural residential
areas northwest of West Side Highway. Rural residential areas have fewer users of the land, so
the amount of use is lower than in more densely populated residential areas. However, public
concern for the visual landscape in these areas may be higher due to the expectation of rural
residents to have a more natural or open landscape. As the alternative crosses through West Side
Highway and Kelso it runs through or close to residential areas.
The segment then crosses the Coweeman River and again crosses rural residential areas, which
elevate the sensitivity. As the alternative continues south, across the Lewis River, it passes
through agricultural land, which tends to be less sensitive than rural residential. The density of

Appendix E Visual Resource Report
I-5 Corridor Reinforcement Project Draft EIS 13 November 2012
residences increases south towards Hazel Dell. As the alternative shifts to a predominantly east-
west direction it passes through urban residential, commercial, and industrial land. Crossing NE
4th Plain Road and heading SE towards Mill Plain and Camas, the alternative again passes
through open space and rural residential areas. Public interest is high along the alternative, with
signs on many yards expressing opposition to the project running through populated areas.
2.7.1 Scenic Quality Ratings
The scenic quality ratings for each segment of the West Alternative are provided in Table 2-1.
Table 2-1 West Alternative Scenic Quality Ratings
Ro
ute
Seg
men
t
Seg
men
t L
en
gth
(mil
es)
Existing Conditions – Scenic Quality Ratings L
an
dfo
rm
Veg
eta
tio
n
Wate
r
Co
lor
Ad
jacen
t
Scen
ery
Scarc
ity
Cu
ltu
ral
Mo
dif
icati
on
s
Scen
ic
Qu
ali
ty T
ota
l
Scen
ic
Qu
ali
ty
Rati
ng
West Alternative
2 6.04 2 2 1 2 0 1 -1 7 Low
4 0.77 2 2 3 3 0 1 -2 9 Low
9 18.72 2 2 3 3 0 1 -1 10 Low
25 29.87 1 3 3 3 1 1 -2 10 Low
36B 1.41 1 2 0 2 0 1 -1 5 Low
41 1.27 1 3 1 3 0 1 -1 8 Low
45 0.67 1 2 0 2 0 1 -1 5 Low
50 4.09 1 3 1 3 0 1 -1 8 Low
52 4.65 2 3 3 3 0 2 -2 11 Low
Totals 67.49
West Option 1
36 0.22 1 2 0 2 0 1 -1 5 Low
40 2.69 1 4 2 4 0 1 -1 11 Low
46 0.46 1 2 2 2 0 1 -1 7 Low
Totals 3.37
West Option 2
36 0.22 1 2 0 2 0 1 -1 5 Low
36A 1.03 1 2 0 2 0 1 -1 5 Low
37 0.67 1 2 0 2 0 1 -1 5 Low
38 0.66 1 2 0 2 0 1 -1 5 Low
43 1.86 1 3 0 2 0 1 -1 6 Low
48 2.49 1 2 0 2 0 1 -1 5 Low
51 2.07 2 3 1 3 0 1 -1 9 Low
Totals 9.00
West Option 3
36 0.22 1 2 0 2 0 1 -1 5 Low
36A 1.03 1 2 0 2 0 1 -1 5 Low
37 0.67 1 2 0 2 0 1 -1 5 Low
38 0.66 1 2 0 2 0 1 -1 5 Low
39 5.35 1 2 1 2 0 1 -1 6 Low
T 0.31 1 2 0 2 0 1 -1 5 Low
49 2.73 1 2 0 2 1 1 -1 6 Low
51 2.07 2 3 1 3 0 1 -1 9 Low
Totals 13.04

Appendix E Visual Resource Report
14 I-5 Corridor Reinforcement Project Draft EIS November 2012
2.7.2 Sensitivity Ratings and Overall Landscape Ratings
The sensitivity rankings and overall landscape rating based on scenic quality and sensitivity for
each West Alternative segment are listed in Table 2-2.
Table 2-2 West Alternative Sensitivity and Overall Landscape Rating
Ro
ute
Seg
men
t
Seg
men
t L
en
gth
(mil
es)
Existing Conditions – Sensitivity and Overall Landscape Rating
Ty
pe o
f
User
Am
ou
nt
of
Use
Pu
bli
c
Inte
rest
Ad
jacen
t
Use
Sp
ecia
l
Are
as
Sen
sit
ivit
y
Rati
ng
La
nd
scap
e
Rati
ng
West Alternative
2 6.04 H M M L L Medium Low
4 0.77 H H M L L High Medium
9 18.72 H H H L L High Medium
25 29.87 H H H L L High Medium
36B 1.41 H H H L L High Medium
41 1.27 H H H L L High Medium
45 0.67 H H H L L High Medium
50 4.09 H H H L L High Medium
52 4.65 H H H L L High Medium
Totals 67.49
West Option 1
36 0.22 H H H L L High Medium
40 2.69 H H H M L High Medium
46 0.46 H H H L L High Medium
Totals 3.37
West Option 2
36 0.22 H H H L L High Medium
36A 1.03 H H H L L High Medium
37 0.67 H H H L L High Medium
38 0.66 M L M L L Medium Low
43 1.86 H H H L L High Medium
48 2.49 H H H L L High Medium
51 2.07 H M H L L High Medium
Totals 9.00
West Option 3
36 0.22 H H H L L High Medium
36A 1.03 H H H L L High Medium
37 0.67 H H H L L High Medium
38 0.66 M L M L L Medium Low
39 5.35 H H H L L High Medium
T 0.31 M L M M L Medium Low
49 2.73 H M M H L Medium Low
51 2.07 H M H L L High Medium
Totals 13.04
Notes:
H = high rating for sensitivity conditions, M = medium rating, L = low rating

Appendix E Visual Resource Report
I-5 Corridor Reinforcement Project Draft EIS 15 November 2012
2.8 Central Alternative
The Central Alternative shares many characteristics with the West and Crossover alternatives.
Northwest of the Cowlitz River the alternatives are very similar with only slight localized
differences. East of the Cowlitz River, the Central Alternative crosses the Cowlitz/Chehalis
Foothills ecoregion described in Section 2.0. The alternative then enters the Western Cascades
Lowlands and Valleys ecoregion, which is also described in Section 2.0.
Through the portion of the Central Alternative located southeast of the Cowlitz River and north of
the Lewis River, the alternative has generally Low sensitivity. This area is sparsely populated
and has limited use. Sensitivity and scenic quality are higher near the Lewis River just west of
Lake Merwin through Ariel. Near Amboy and Yacolt, and east of Lewisville and Battle Ground,
the alternative is located amongst rural residential homes and has Medium sensitivity. Midway
south along Segment P, the route turns east and away from rural residential areas until
Segment 35, where the route passes near the rural residential homes of Camas.

Appendix E Visual Resource Report
16 I-5 Corridor Reinforcement Project Draft EIS November 2012
2.8.1 Scenic Quality Ratings
The scenic quality ratings for each segment of the Central Alternative are provided in Table 2-3.
Table 2-3 Central Alternative Scenic Quality Ratings R
ou
te
Seg
men
t
Seg
men
t L
en
gth
(mil
es)
Existing Conditions - Scenic Quality Ratings
La
nd
form
Veg
eta
tio
n
Wate
r
Co
lor
Ad
jacen
t S
cen
ery
Scarc
ity
Cu
ltu
ral
Mo
dif
icati
on
s
Scen
ic Q
uality
To
tal
Scen
ic Q
uality
Rati
ng
s
Central Alternative
B 0.78 2 2 1 2 0 1 0 8 Low
F 15.86 2 3 3 3 0 2 -2 11 Low
G 1.39 2 2 1 2 0 1 -1 7 Low
H 1.53 2 2 2 2 0 1 0 9 Low
10 7.93 2 2 2 2 0 1 -1 8 Low
12 4.96 2 2 2 2 0 1 0 9 Low
15 1.86 2 2 2 3 0 1 -1 9 Low
23 1.29 2 3 3 3 0 2 -1 12 Medium
L 1.71 2 3 3 3 0 2 -1 12 Medium
18 7.17 2 2 0 2 0 1 -1 6 Low
28 5.94 2 2 1 2 2 1 -2 8 Low
V 5.96 2 2 2 2 0 1 -2 7 Low
P 8.62 1 2 0 2 0 1 -1 5 Low
35 2.52 1 2 1 2 0 1 -1 6 Low
T 0.31 1 2 0 2 0 1 -1 5 Low
49 2.73 1 2 0 2 1 1 -1 6 Low
51 2.07 2 3 1 3 0 1 -1 9 Low
52 4.70 2 3 3 3 0 2 -2 11 Low
Totals 77.33
Central Option 1
A 2.50 2 2 1 2 0 1 0 8 Low
Totals 2.50
Central Option 2
1 6.42 2 2 1 2 0 1 -1 7 Low
4 0.77 2 2 3 3 0 1 -2 9 Low
5 1.93 2 2 3 3 0 1 -1 10 Low
8 1.61 2 2 1 2 1 1 -1 8 Low
11 5 2 2 2 2 0 1 -1 8 Low
Totals 15.73
Central Option 3
M 2.39 2 3 3 3 0 2 -1 12 Medium
26 6.54 2 2 1 2 1 1 -1 8 Low
30 6.01 2 3 3 3 1 1 -1 12 Medium
Totals 14.94

Appendix E Visual Resource Report
I-5 Corridor Reinforcement Project Draft EIS 17 November 2012
2.8.2 Sensitivity Ratings and Overall Landscape Ratings
The sensitivity rankings and overall landscape rating based on scenic quality and sensitivity for
each Central Alternative segment is presented in Table 2-4.
Table 2-4 Central Alternative Sensitivity and Overall Landscape Rating
Ro
ute
Seg
men
t
Seg
men
t L
en
gth
(mil
es)
Existing Conditions -Sensitivity and Overall Landscape Rating
Ty
pe o
f
User
Am
ou
nt
of
Use
Pu
bli
c
Inte
rest
Ad
jacen
t
Use
Sp
ecia
l
Are
as
Sen
sit
ivit
y
Rati
ng
La
nd
scap
e
Rati
ng
Central Alternative
B 0.78 L M M L L Low Low
F 15.86 M H M L L Medium Low
G 1.39 L L L L L Low Low
H 1.53 L L L L L Low Low
10 7.93 L L L L L Low Low
12 4.96 L L M L L Low Low
15 1.86 L L L L L Low Low
23 1.29 M H H L L Medium Medium
L 1.71 H M H L L High High
18 7.17 M L M H L Medium Low
28 5.94 M M M L L Medium Low
V 5.96 L L M L L Low Low
P 8.62 H L M H L Medium Low
35 2.52 L L H H L Medium Low
T 0.31 M L M M L Medium Low
49 2.73 H M M H L Medium Low
51 2.07 H M H L L High Medium
52 4.70 H H H L L High Medium
Totals 77.33
Central Option 1
A 2.50 L L L L L Low Low
Totals 2.50
Central Option 2
1 6.42 M M M L L Medium Low
4 0.77 H H M L L High Medium
5 1.93 M H H L L Medium Low
8 1.61 M L M L L Low Low
11 5 L L L L L Low Low
Totals 15.73
Central Option 3
M 2.39 H M H L L High High
26 6.54 H M H L L High Medium
30 6.01 M M H H L Medium Medium
Totals 14.94
Notes:
H = high rating for sensitivity conditions, M = medium rating, L = low rating

Appendix E Visual Resource Report
18 I-5 Corridor Reinforcement Project Draft EIS November 2012
2.9 East Alternative
The East Alternative originates west of Castle Rock in the Willapa Hills ecoregion, described in
Section 2.0. The alternative crosses the Cowlitz River and extends across the Cowlitz/Chehalis
Foothills ecoregion for approximately 8 miles before entering the Western Cascades Lowlands
and Valleys ecoregion, described in Section 2.0. The East Alternative shares the portion of the
route south of Lake Merwin and Yale Lake with the Crossover Alternative.
The sensitivity of the area surrounding the East Alternative is mostly based on land use. At the
north end of the alternative, sensitivity is Low as there are not homes, roads or recreation areas.
Near the north end of Castle Rock, sensitivity increases due to the increased amount of use and
type of users. The number of potential viewers increases in the vicinity of Highway 504 and I-5.
Highway 504 is a designated state scenic drive, where the sensitivity of Segment F is considered
greater. East of Castle Rock viewer sensitivity is considered Low, as there are few residences,
roads, or recreation areas. Segment K, covering most of the northern portion of the alternative,
has Low sensitivity for most of its length because there are few homes, few roads, and low levels
of use. Sensitivity is increased at the south end of Segment K, where it crosses Lewis River
Road, and extends across the rural residential areas northwest of Ariel, and across the east end of
Lake Merwin. South of Lake Merwin, the alternative shares segments with those described in
Section 2.10 for the Crossover Alternative.

Appendix E Visual Resource Report
I-5 Corridor Reinforcement Project Draft EIS 19 November 2012
2.9.1 Scenic Quality Ratings
The scenic quality ratings for each segment of the East Alternative are provided in Table 2-5.
General descriptions of the ratings are provided in Section 2.0.
Table 2-5 East Alternative Scenic Quality Ratings
Ro
ute
Seg
men
t
Seg
men
t L
en
gth
(mil
es)
Existing Conditions - Scenic Quality Ratings
La
nd
form
Veg
eta
tio
n
Wate
r
Co
lor
Ad
jacen
t
Scen
ery
Scarc
ity
Cu
ltu
ral
Mo
dif
icati
on
s
Scen
ic Q
uality
T
ota
l
Scen
ic Q
uality
Rati
ng
s
East Alternative
B 0.78 2 2 1 2 0 1 0 8 Low
F 15.86 2 3 3 3 0 2 -2 11 Low
I 2.77 2 3 2 3 0 1 0 11 Low
K 22.8 2 3 3 3 2 2 -1 14 Medium
W 1.31 2 3 3 3 1 2 -1 13 Medium
O 19.47 3 2 2 2 2 1 -1 11 Low
Q 2.63 2 2 2 2 0 1 0 9 Low
S 0.41 1 2 0 2 0 1 -1 5 Low
49 2.73 1 2 0 2 1 1 -1 6 Low
51 2.07 2 3 1 3 0 1 -1 9 Low
52 4.70 2 3 3 3 0 2 -2 11 Low
Totals 75.53
East Option 1
3 7.82 2 2 3 3 0 2 -1 11 Low
7 2.05 2 2 1 2 1 1 -1 8 Low
11 5 2 2 2 2 0 1 -1 8 Low
J 2.72 2 2 1 2 0 1 0 8 Low
Totals 17.59
East Option 2
U 6.11 2 3 1 2 2 1 -1 10 Low
V 5.96 2 2 2 2 0 1 -2 7 Low
P 8.62 1 2 0 2 0 1 -1 5 Low
35 2.52 1 2 1 2 0 1 -1 6 Low
T 0.31 1 2 0 2 0 1 -1 5 Low
Totals 23.52
East Option 3
R 3.68 2 2 1 2 1 1 -1 8 Low
Totals 3.68

Appendix E Visual Resource Report
20 I-5 Corridor Reinforcement Project Draft EIS November 2012
2.9.2 Sensitivity Ratings and Overall Landscape Ratings
The sensitivity rankings and overall landscape rating based on scenic quality and sensitivity for
each segment of the East Alternative are provided in Table 2-6.
Table 2-6 East Alternative Sensitivity and Overall Landscape Rating
Ro
ute
Seg
men
t
Seg
men
t L
en
gt
h (
mil
es)
Existing Conditions -Sensitivity and Overall Landscape Rating
Ty
pe o
f
User
Am
ou
nt
of
Use
Pu
bli
c
Inte
rest
Ad
jacen
t
Use
Sp
ecia
l
Are
as
Sen
sit
ivit
y
Rati
ng
La
nd
scap
e
Rati
ng
East Alternative
B 0.78 L M M L L Low Low
F 15.86 M H M M M Medium Low
I 2.77 M L M L L Medium Low
K 22.8 H H M L L Medium Medium
W 1.31 H M M L L Medium Medium
O 19.47 L L M L L Low Low
Q 2.63 M L L L L Low Low
S 0.41 M L M M L Medium Low
49 2.73 H M M H L Medium Low
51 2.07 H M H L L High Medium
52 4.70 H H H L L High Medium
Totals 75.53
East
Option 1
3 7.82 M H M L L Medium Low
7 2.05 H M M L L Medium Low
11 5 L L L L L Low Low
J 2.72 L L L L L Low Low
Totals 17.59
East Option 2
U 6.11 L L L M L Low Low
V 5.96 L L M L L Low Low
P 8.62 H L M H L Medium Low
35 2.52 L L H H L Medium Low
T 0.31 M L M M L Medium Low
Totals 23.52
East Option 3
R 3.68 L L L L L Low Low
Totals 3.68
Notes:
H = high rating for sensitivity conditions, M = medium rating, L = low rating

Appendix E Visual Resource Report
I-5 Corridor Reinforcement Project Draft EIS 21 November 2012
2.10 Crossover Alternative
The Crossover Alternative shares the northern half of the route with the West Alternative. The
Crossover Alternative passes through the Western Cascades Lowlands and Valleys ecoregion and
does not enter the Valley Foothills and Portland/Vancouver Basin until near its southern limit.
The physiographic characteristics and scenic quality of the area surrounding the alternative are
consistent with the ecoregion descriptions provided in Section 2.0.
The sensitivity varies along the alternative, with land use influencing the sensitivity. Near
Amboy and Ariel, there are residential users, motorists, and recreational users of the landscape.
South of Lake Merwin, sensitivity is lower, as there are fewer residences close to the alternative.
Recreational land use becomes more influential on sensitivity; however, there is not a high
amount of use, so sensitivity is Low to Medium. Entering the rural residential areas of Camas,
the sensitivity becomes Medium to High, depending on the number and proximity of residences.
Appendix E Visual Resource Report
22 I-5 Corridor Reinforcement Project Draft EIS November 2012
2.10.1 Scenic Quality Ratings
The scenic quality ratings for each segment of the Crossover Alternative are provided in
Table 2-7.
Table 2-7 Crossover Alternative Scenic Quality Ratings
Ro
ute
Seg
men
t
Seg
men
t L
en
gth
(mil
es)
Existing Conditions - Scenic Quality Ratings
La
nd
form
Veg
eta
tio
n
Wate
r
Co
lor
Ad
jacen
t
Scen
ery
Scarc
ity
Cu
ltu
ral
Mo
dif
icati
on
s
Scen
ic Q
uality
T
ota
l
Scen
ic Q
uality
R
ati
ng
Crossover Alternative
2 6.04 2 2 1 2 0 1 -1 7 Low
4 0.77 2 2 3 3 0 1 -2 9 Low
9 18.72 2 2 3 3 0 1 -1 10 Low
14 1.50 2 2 2 3 0 1 -1 9 Low
15 1.86 2 2 2 3 0 1 -1 9 Low
23 1.29 2 3 3 3 0 2 -1 12 Medium
L 1.72 2 3 3 3 0 2 -1 12 Medium
18 7.17 2 2 0 2 0 1 -1 6 Low
N 1.64 2 2 3 3 2 2 -1 13 Medium
W 1.31 2 3 3 3 1 2 -1 13 Medium
O 19.47 3 2 2 2 2 1 -1 11 Low
Q 2.64 2 2 2 2 0 1 0 9 Low
S 0.41 1 2 0 2 0 1 -1 5 Low
49 2.73 1 2 0 2 1 1 -1 6 Low
51 2.07 2 3 1 3 0 1 -1 9 Low
52 4.70 2 3 3 3 0 2 -2 11 Low
Totals 74.04
Crossover Option 1
47 0.69 1 2 0 2 0 1 -1 5 Low
48 2.50 1 2 0 2 0 1 -1 5 Low
50 4.09 1 3 1 3 0 1 -1 8 Low
Totals 7.28
Crossover Option 2
C 3 2 2 1 2 0 1 0 8 Low
E 1.34 2 2 1 2 0 1 0 8 Low
Totals 4.34
Crossover Option 3
D 2.86 2 2 1 2 0 1 0 8 Low
E 1.34 2 2 1 2 0 1 0 8 Low
Totals 4.2

Appendix E Visual Resource Report
I-5 Corridor Reinforcement Project Draft EIS 23 November 2012
2.10.2 Sensitivity Ratings and Overall Landscape Ratings
The sensitivity rankings and overall landscape rating based on scenic quality and sensitivity for
each segment of the Crossover Alternative are presented in Table 2-8.
Table 2-8 Crossover Alternative Sensitivity and Overall Landscape Rating
Ro
ute
Seg
men
t
Seg
men
t L
en
gt
h (
mil
es)
Existing Conditions -Sensitivity and Overall Landscape Rating
Ty
pe o
f
User
Am
ou
nt
of
Use
Pu
bli
c
Inte
rest
Ad
jacen
t
Use
Sp
ecia
l
Are
as
Sen
sit
ivit
y
Rati
ng
La
nd
scap
e
Rati
ng
Crossover Alternative
2 6.04 H M M L L Medium Low
4 0.77 H H M L L High Medium
9 18.72 H H H L L High Medium
14 1.50 L L L L L Low Low
15 1.86 L L L L L Low Low
23 1.29 M H H L L Medium Medium
L 1.72 H M H L L High High
18 7.17 M L M H L Medium Low
N 1.64 H M M H L Medium Medium
W 1.31 H M M L L Medium Medium
O 19.47 L L M L L Low Low
Q 2.64 M L L L L Low Low
S 0.41 M L M M L Medium Low
49 2.73 H M M H L Medium Low
51 2.07 H M H L L High Medium
52 4.70 H H H L L High Medium
Totals 74.04
Crossover Option 1
47 0.69 H H H L L High Medium
48 2.50 H H H L L High Medium
50 4.09 H H H L L High Medium
Totals 7.28
Crossover Option 2
C 3 L L L L L Low Low
E 1.34 H M M L L Medium Low
Totals 4.34
Crossover Option 3
D 2.86 L L L L L Low Low
E 1.34 H M M L L Medium Low
Totals 4.2
Notes:
H = high rating, M = medium rating, L = low rating

Appendix E Visual Resource Report
24 I-5 Corridor Reinforcement Project Draft EIS November 2012
3.0 Environmental Consequences
3.1 Visual Impact
The visual impact of the project is a function of the visual landscape rating (described in Section
1.2.1) and the visual contrast rating. Visual landscape ratings are provided for each segment in
Tables 2-2, 2-4, 2-6, and 2-8; visual contrast ratings are provided for each segment in the segment
descriptions below. These two ratings can be combined in Table 3-1 to determine the visual
impact, which is rated as Negligible, Low, Moderate or High. This table rates the impact of the
contrast of the project segments against the overall landscape in which it occurs. See Section
3.1.1 for more detail on how these impacts are determined.
Table 3-1 Visual Impact Rating
Visual Resource
Landscape Rating
Low Medium High
Overall Segment Contrast
None Negligible Negligible Negligible
Weak Low Low Moderate
Moderate Low Moderate High
Strong Moderate High High
Source: Golder 2010
3.1.1 Impact Levels
Impacts would be high where project activities would result in the following:
A High or Medium landscape rating, and project features that dominate the
landscape, or
A High landscape rating, and project features that attract attention to the landscape.
Impacts would be moderate where project activities would result in the following:
A High landscape rating, and project features that do not attract attention to the
landscape, or
A Medium landscape rating, and project features that attract attention to the
landscape, or
A Low landscape rating, and project features that dominate the landscape.
Impacts would be low where project activities would result in the following:
A Medium or Low landscape rating, and project features that do not attract attention
to the landscape, or
A Low landscape rating, and project features that attract attention to the landscape.
No impact would occur where project features are visually negligible or not visible at all.

Appendix E Visual Resource Report
I-5 Corridor Reinforcement Project Draft EIS 25 November 2012
3.2 Impacts Common to Action Alternatives
Every action alternative would result in visual alterations to the landscape. Managing visual
quality is a balancing act between placing disturbances in either more remote locations or
adjacent to existing disturbances. Remote locations have fewer potential viewers, but are often
less disturbed and therefore more sensitive to additional disturbances and viewers present may be
more sensitive to potential changes. Sites close or adjacent to existing disturbances tend to be of
a lower scenic quality, but often have higher populations and thus more potential viewers. As
visual impact is a function of scenic quality, sensitivity, and contrast, the effects of alternatives
are often balanced out.
The duration of the impacts is common to all action alternatives. The impacts discussed below
are considered permanent for the life of the project. The landscape can be visually restored to
existing conditions following the removal of transmission towers and re-growth of vegetation, so
the alterations are not permanent, unless these facilities are never removed or are replaced with
new facilities at the same location in the future.
3.3 Substations
3.3.1 Sundial Substation
There are no sensitive viewpoints that are expected to have a view of the Sundial Substation. The
existing conditions of the area have many industrial operations, which would result in a lower
contrast of the substation. The contrast is expected to be Weak, as it is unlikely to draw viewer’s
attention. With a contrast rating of Weak and a landscape rating of Low, the overall visual
impact would likely be Low.
3.3.2 Casey Road Substation
The Casey Road Substation is not expected to be visible from any significant sensitive
viewpoints. The visual impact of the Casey Road Substation would likely be Low.
3.3.3 Baxter Road Substation
The Baxter Road substation site sits in a small topographical depression and is surrounded by
vegetation. The site is not expected to be visible from any significant sensitive viewpoints. The
visual impact of the Baxter Road Substation would likely be Low.
3.3.4 Monahan Creek Substation
Monahan Creek Substation would likely be visible to surrounding residents and to motorists and
commuters along Delameter Road and Monahan Road. The location of the substation would
likely mean few long-range views; however, the substation would likely dominate the attention of
viewers that have a foreground view, including users of Delameter Road. From beyond the
immediately adjacent area, foreground vegetation would likely block views of most of the
substation. No scenic viewpoints or designated areas are expected to be affected. The substation
would likely be visible, attract attention, but not completely dominate the visual character of the
landscape and therefore have a contrast rating of Moderate. With a contrast rating of Moderate
and a landscape rating of Low, the expected visual impact of the substation is Low.

Appendix E Visual Resource Report
26 I-5 Corridor Reinforcement Project Draft EIS November 2012
3.4 West Alternative
The impacts of the West Alternative and its options are summarized in Table 3-2. The contrast
and impact of the segments within the options are discussed below.
Table 3-2 West Alternative Contrast Ratings and Visual Impact
Route Segment
Segment Length (miles)
Contrast Ratings1 and Visual Impact
Form Line Color Texture Scale Overall
Contrast Visual Impact
West Alternative
2 6.04 Strong Strong Moderate Moderate Strong Moderate Low
4 0.77 n/a n/a n/a n/a n/a Strong High
9 18.72 n/a n/a n/a n/a n/a Moderate Moderate
252 29.87 Moderate Moderate Weak Weak Strong Moderate Moderate
36B 1.41 n/a n/a n/a n/a n/a Moderate Moderate
41 1.27 Moderate Weak Weak Weak Moderate Moderate Moderate
45 0.67 n/a n/a n/a n/a n/a Moderate Moderate
50 4.09 Moderate Moderate Weak Weak Moderate Moderate Moderate
52 4.65 Weak Weak Weak Weak Moderate Weak Low
Totals 67.49
West Option 1
36 0.22 n/a n/a n/a n/a n/a Weak Low
40 2.69 Moderate Moderate Weak Weak Strong Moderate Moderate
46 0.46 n/a n/a n/a n/a n/a Moderate Moderate
Totals 3.37
West Option 2
36 0.22 n/a n/a n/a n/a n/a Weak Low
36A 1.03 n/a n/a n/a n/a n/a Weak Low
37 0.67 n/a n/a n/a n/a n/a Strong High
38 0.66 n/a n/a n/a n/a n/a Weak Low
43 1.86 n/a n/a n/a n/a n/a Weak Low
48 2.49 Moderate Moderate Weak Weak Strong Moderate Moderate
51 2.07 Moderate Moderate Weak Weak Weak Moderate Moderate
Totals 9.00
West Option 3
36 0.22 n/a n/a n/a n/a n/a Weak Low
36A 1.03 n/a n/a n/a n/a n/a Weak Low
37 0.67 n/a n/a n/a n/a n/a Strong High
38 0.66 n/a n/a n/a n/a n/a Weak Low
39 5.35 n/a n/a n/a n/a n/a Moderate Moderate
T 0.31 n/a n/a n/a n/a n/a Weak Low
49 2.73 n/a n/a n/a n/a n/a Moderate Low
51 2.07 Moderate Moderate Weak Weak Weak Moderate Moderate
Totals 13.04
Notes:
1. Only segments that had a visual simulation produced have individual contrast ratings for form, line, color, texture, and
scale.
2. Contrast rating for form, line, color, texture and scale is for Viewpoint 25-1, overall contrast rating and visual impact is for
Viewpoints 25-1, 25-2 and 25-3.

Appendix E Visual Resource Report
I-5 Corridor Reinforcement Project Draft EIS 27 November 2012
Segment 2: Typical views towards Segment 2 would be partially or fully obstructed by
vegetation and some residences. The segment would be visible near Delameter road on the north
end of the segment and then from a select few rural residences at a few locations along Hazel Dell
Road and rural residences in the area of Trout Lake Road. It would also be visible at the southern
end of the segment in Longview. With a landscape rating of Low and an overall contrast rating
of Moderate, the impact of the segment would likely be Low.
Segment 4: This short segment runs adjacent to a residential area at the south end of the
neighborhood of the West Side Highway and across I-5. For the residences along the right-of-
way, the contrast would be Strong due to the scale of the towers created by their proximity. With
an existing landscape rating of Medium and a contrast rating of Strong, the overall impact of
Segment 4 would likely be High.
Segment 9: Segment 9 covers a long distance between Kelso/Longview and just north of the
Lewis River, running adjacent to existing circuits. At the north end, the segment crosses over I-5
and through rural residential areas that decrease in density farther south along the segment. The
expected contrast along Segment 9 would likely be Moderate or Strong, due to the large scale of
the towers relative to their proximity to residences. The overall contrast of the segment is
Moderate, as only certain residences would have the view dominated by the segment. The
experience of most viewers would be slightly more distant and the line would be visible, but
would not totally dominate the view. With a landscape rating of Medium and a contrast rating of
Moderate, the overall impact of the segment would likely be Moderate.
Segment 25: Typical views of Segment 25 are from residences adjacent to the right-of-way or
from nearby residential areas. The towers would dominate the view of anyone located adjacent to
the right-of-way due to the towers’ large scale and proximity to the viewer. From slightly farther
away, the view of the segment would be partially obscured by trees and other houses. Most
views would have many other existing visual alterations in the view, which would dilute the
viewer’s attention towards the segment. Three visual simulations along Segment 25 were created
and are depicted in Figures 3-1 to 3-3.
Viewpoint 25-1 is specifically located on NE Salmon Creek Avenue; it is also representative of
views from within or adjacent to the right-of-way through the low density rural residential areas
north of Hazel Dell. The segment expands the cleared right-of-way, which disrupts the form of
the vegetation. The patchy vegetation patterns of this area, however, mitigate the contrast of the
vegetation clearing, resulting in a Moderate contrast rating for form. The line of the horizon is
altered by both the vegetation clearing and the towers. Also the transmission lines themselves
create a line that the eye naturally follows, which draws the viewer’s attention. Since this line
contrast element already exists, the contrast of the segment is lessened, resulting in a Moderate
line contrast rating. The color of the cleared area is very similar to existing conditions. The
towers are a contrasting color, but do not attract attention, resulting in a Weak color contrast
rating. The texture of the vegetation clearing is very similar to the existing conditions and
surrounding landscape and therefore was given a Weak texture contrast rating. The scale of the
clearing has increased, as well as the size of the proposed transmission towers. The size of these
towers relative to the existing structures and surrounding vegetation draw the attention of the
viewer and were assigned a Strong contrast rating for scale. The overall contrast rating of
Segment 25 from this viewpoint is Moderate.

Appendix E Visual Resource Report
28 I-5 Corridor Reinforcement Project Draft EIS November 2012
Figure 3-1 Viewpoint 25-1 Looking North from NE Salmon Creek Avenue, Hazel Dell. West Alternative. Shows existing
Ross-Lexington No. 1 line and towers 6/1 to 6/4. Simulation shows new towers 25/77 to 25/80.

Appendix E Visual Resource Report
I-5 Corridor Reinforcement Project Draft EIS 29 November 2012
Figure 3-2 Viewpoint 25-2 Looking North-Northeast from NE 76th Avenue, Walnut Grove. West Alternative. Shows
existing McNary-Ross No. 1 and Bonneville PH1-Alcoa No. 1&2 lines and Tower 6/34.
Simulation shows new Tower 25/124.

Appendix E Visual Resource Report
30 I-5 Corridor Reinforcement Project Draft EIS November 2012
Figure 3-3 Viewpoint 25-3 Looking East from WSU Campus, Vancouver. West Alternative. Shows existing Ross-
Lexington No. 1 line and Tower 6/3. Simulation shows new Tower 25/78.

Appendix E Visual Resource Report
I-5 Corridor Reinforcement Project Draft EIS 31 November 2012
Viewpoint 25-2 is located in a residential neighborhood on the corner of NE 76th Avenue and
NE 64th Street. It is representative of the view that would likely be experienced by many
potential viewers in the neighborhoods surrounding Segment 25. The segment consists of
existing right-of-way through suburban areas, so the main change is the visibility of the proposed
towers above houses. The segment has Weak form contrast, as the main body of the view is
largely unchanged. The line contrast is Moderate because the line of the horizon above the trees
is more prominently disrupted by the taller towers. The color of the segment is very similar to
existing conditions, so has Weak contrast. The texture element is also very similar to existing
conditions and displays Weak contrast. The scale is a Moderate contrast, as the size of the
proposed towers stands out more over the trees and houses and begins to dominate the landscape.
The overall contrast of Segment 25 with the existing landscape at this viewpoint is Moderate.
Viewpoint 25-3 is located on the parking lot of Washington State University’s Vancouver campus
in Mt. Vista. It is representative of the view likely to be experienced by students and staff of the
university as well as some residents of Mt. Vista. In this area, Segment 25 follows an existing
right-of-way and the main change is the addition of new, taller towers to the right-of-way. The
segment has Weak form contrast because the main body of the view is largely unchanged. The
segment has Moderate line contrast, as the line of the horizon above the trees is more prominently
disrupted by the taller towers. The color of the segment is very similar to existing conditions, so
has Weak contrast. The texture element is also very similar to existing conditions and displays
Weak contrast. The element of scale moderately contrasts, as the size of the towers now stands
out more over the trees and begins to dominate the landscape. The overall contrast of Segment 25
with the existing landscape at this viewpoint is Moderate.
The overall contrast of Segment 25 across its considerable length is Moderate. The effect of
vegetation clearing is moderated because it follows an existing right-of-way. The project’s
towers are larger and taller than existing structures, which would draw the attention of more
viewers, but the towers are unlikely to be dominant in the landscape in contrast to existing
conditions. With a landscape rating of Medium and an overall contrast of Moderate, the overall
impact of Segment 25 on visual resources would likely be Moderate.
Segment 36B: This segment parallels segments 36 and 36A, and would run along the south side
of the existing right-of-way. Typical views would have an unobstructed view of the segment.
Some clearing of vegetation would be required where the segment crosses NE 199th Avenue and
therefore has a Moderate contrast. The segment would be visible from the residences along NE
Stoney Meadows Drive that back onto the open space as well as from NE 199th Avenue. With the
segment on the south side of the existing right-of-way, the vegetation buffer between the
residential area around NE 48th Circle and the towers would be maintained and visibility from
48th Circle is predicted to be limited. With a Moderate overall contrast and Medium landscape
rating, the overall visual impact would likely be Moderate.
Segment 41: Typical views of Segment 41 would be from the Great Mountain Golf Course,
NE 28th Street, and few residences along NE 28
th Street. The typical view from the golf course
would be unobstructed, whereas most residents would have a partially obstructed view.
A visual simulation viewpoint along Segment 41 is depicted in Figure 3-4. Viewpoint 41-1
simulates the view from NE 28th Street looking northwest. It is also representative of other
unobstructed views that would be typical of those found on the golf course and to residents that
are directly adjacent to the right-of-way. The triple-circuit tower replaces the previous double-
circuit tower. The proposed tower for this segment is approximately twice the height than the
tower it replaces, but requires little new right-of-way clearing. The segment has Moderate form
contrast because the substantially larger tower draws more attention to its shape in contrast to its

Appendix E Visual Resource Report
32 I-5 Corridor Reinforcement Project Draft EIS November 2012
surroundings. The line contrast is Weak, as the line of the horizon and the line of the circuits is
similar to existing conditions. The color contrast is Weak, as the colors are very similar to
existing conditions. The contrast in texture is also Weak. The scale is Moderate, as the larger
towers stand out from their surroundings and begin to dominate the view. The overall contrast of
the segment from this viewpoint is Moderate.
The overall contrast for the segment is Moderate. With a contrast rating of Moderate and a
landscape rating of Medium, the overall visual impact of Segment 41 would likely be Moderate.
Segment 45: Typical views of Segment 45 would be direct, close views by residences along the
right-of-way or partially obstructed views by nearby residents and motorists along NE 28th Street
other smaller residential roads. Segment 45 shares characteristics with Segment 41 and the same
contrast ratings apply as the ratings for Viewpoint 41-1 and the segment overall. The overall
contrast for the segment is Moderate. With a contrast rating of Moderate and a landscape rating
of Medium, the overall visual impact of Segment 45 would likely be Moderate.
Segment 50: Typical views of this segment are along rural roads or from residences adjacent to
the segment. For much of its length, the segment passes through agricultural fields with open
views but few viewers. At both ends of the segment, it passes through rural residential
neighborhoods where the segment is highly visible from homes immediately adjacent to the right-
of-way and would also be visible from more distant residences.
A visual simulation viewpoint along Segment 50 is depicted in Figure 3-5. Viewpoint 50-1
shows the view from NE 3rd
Street looking northwest through an open rural section of
Segment 50. This view is typical of the central section of the segment. The form of the
segment has Moderate contrast with existing conditions, as the additional larger tower has a
different shape than the existing towers, which promotes further disharmony in the landscape.
The line contrast is Moderate, as the eye is drawn in similar ways as with existing conditions but
the effect is increased to start to dominate the landscape. There is Weak contrast in the color
element because there is little effect on vegetation and the towers and lines resemble existing
conditions. There is Weak texture contrast, as the towers and lines are adjacent to existing lines
and do not alter the vegetation in this view. The contrast in scale is Moderate, as the larger
towers attract the attention of the viewer and begin to dominate their surroundings. Overall the
contrast of the segment at this viewpoint is Moderate.
At the southeast end of the segment, the configuration is a triple circuit to minimize the right-of-
way requirements. The larger triple-circuit tower would likely have a Moderate contrast with the
existing conditions. The overall contrast for the segment is expected to be Moderate. With a
landscape rating of Medium and an overall contrast rating of Moderate, the visual impact of
Segment 50 would likely be Moderate.

Appendix E Visual Resource Report
I-5 Corridor Reinforcement Project Draft EIS 33 November 2012
Figure 3-4 Viewpoint 41-1 Looking Northwest from NE 28th Street, North of Camas, South of State Highway 500. West
Alternative. Shows existing Bonneville PH1-Alcoa No. 1&2 line. Simulation shows new towers
41/4 to 41/7.

Appendix E Visual Resource Report
34 I-5 Corridor Reinforcement Project Draft EIS November 2012
Figure 3-5 Viewpoint 50-1 Looking Northwest from NE 3rd Street, North of Camas. West Alternative and Crossover
Option 1. Shows Bonneville PH1-Alcoa No. 1&2 line and existing towers 3/5, 3/6, and 4/1 to
4/4. Simulation shows new towers 50/5 to 50/10.

Appendix E Visual Resource Report
I-5 Corridor Reinforcement Project Draft EIS 35 November 2012
Segment 52: Views of Segment 52 range from unobstructed, distant views in open rural areas,
close up views from roads and residences along the right-of-way in Camas, and views from
Highway 14. North of the Columbia River Valley, the view and configuration would be similar
to Viewpoint 51-1, as the landscape and line configuration are similar. The rebuilt 230-kV lines
and proposed towers are larger than existing circuits and are no longer matching, so have more
contrast than the existing towers. The contrast is Weak, however, because the size of the cleared
right-of-way and number of towers remains relatively unchanged and is unlikely to dominate the
characteristic landscape any more than existing conditions.
A visual simulation viewpoint along Segment 52 is depicted in Figure 3-6. Viewpoint 52-1
simulates the view of the segment from the Lewis and Clark Camp National Historic Site, located
along Highway 14 (the Lewis and Clark Highway). It represents a middle-distance view of the
segment as it descends into the Columbia River Valley. The contrast in form is Weak, as from
this distance the greater size and shape of the towers do not begin to dominate the view. The line
contrast is Weak because the line the eye follows changes very little from existing conditions.
The color contrast is Weak, because colors are maintained from existing conditions. Texture
contrast is also Weak, as there are not noticeable texture changes. The contrast in scale is
Moderate, as the larger towers are noticeably larger than existing conditions and their
surroundings. The overall contrast at this viewpoint is Weak, as the changes are noticeable, but
are not dominant when compared to existing conditions.
The overall contrast of Segment 52 is Weak: the new towers, though noticeably larger and less
harmonious, replace existing towers and therefore do not dominate the landscape in comparison
to the existing landscape. With an overall Weak contrast and a landscape rating of Medium, the
overall visual impact of the segment would likely be Low.
Overall Impact: The West Alternative has Moderate impact extending for most of the length of
the alternative. There are “hot spots” of High impact localized to a fairly limited number of
residences on segments 4 and 36. This alternative does not impact any recognized scenic areas or
viewpoints, but has localized impacts on a large number of residents along the proposed route.
The overall impact of the West Alternative would likely be Moderate to High.

Appendix E Visual Resource Report
36 I-5 Corridor Reinforcement Project Draft EIS November 2012
Figure 3-6 Viewpoint 52-1 Looking North-Northeast from Lewis and Clark Highway, Camas. All action alternatives.
Shows existing lines North Bonneville-Troutdale No. 1, North Bonneville-Troutdale No. 2, and
North Camas-Oak Park No. 1, and existing towers 1/1 to 1/12, and 2/1 to 2/8. Simulation shows
new towers 52/3 to 52/10.

Appendix E Visual Resource Report
I-5 Corridor Reinforcement Project Draft EIS 37 November 2012
3.4.1 West Option 1
West Option 1 replaces segments 36b, 41 and 45 with segments 36, 40 and 46.
Segment 36: Through most of its short length, Segment 36 passes through rural fields where
typical views would have a clear view of the segment, since it passes over flat ground with little
vegetation. The contrast would be Weak because little vegetation clearing would be required and
only the towers would be visible. The segment would be visible from the residences along NE
Stoney Meadows Drive that back onto the open space. With a Weak overall contrast and
Medium landscape rating, the overall impact would likely be Low.
Segment 40: For much of its length, views of Segment 40 are from several hundred feet away,
across relatively open rural terrain. There are unobstructed or partially obstructed views from
several residential roads and homes southwest of the segment. At the south end of the segment, it
passes over NE Goodwin Road and through Camas Meadows Golf Course.
A visual simulation along Segment 40 is depicted in Figure 3-7. Viewpoint 40-1 depicts the view
from the Lacamas Heritage Trail parking area off NE Goodwin Road. This portion of the
segment includes the rebuilding of the existing 230-kV lines onto a new double-circuit 500-kV
tower with the new line. This results in a tower height 2-3 times higher than the existing tower
but minimizes the need for additional right-of-way or clearing. The form of the segment contrasts
moderately with existing conditions as the shape of the new towers has changed and is more
visible in the distance. The segment has Moderate line contrast with existing conditions as the
towers now project much higher above the line of the horizon and above the ground, which draws
the path of the eye to the alteration. The contrast in color is Weak, as the larger towers result in
more metallic grey in the view; however, the color element alone does not attract attention. The
texture contrast is also Weak, as it does not attract the viewer’s attention. The contrast in scale is
Strong, as the proposed towers dominate the view from close up and are visible from greater
distances since they are taller than the surrounding trees. The overall contrast at Viewpoint 40-1
is Moderate.
The overall contrast of Segment 40 is Moderate, due to the taller towers that would be visible
from a greater distance and would begin dominating the view from closer viewpoints. With an
overall contrast of Moderate and a landscape rating of Medium, the overall visual impact of the
segment would likely be Moderate.
Segment 46: This short segment passes through green space, the Lacamas Heritage Trail, and
near residences. Views from the trail would be from directly in the right-of-way and would be
similar to Viewpoint 40-1. It has the same contrast rating as Viewpoint 40-1 (Moderate). From
residences set back from the right-of-way, the view would likely be partially obstructed by
vegetation and other houses. The contrast from these locations would likely also be Moderate, as
the towers would not be as prominent as closer up; however, the larger proposed double-circuit
towers would be more visible above foreground obstructions such as houses or trees. With an
overall contrast rating of Moderate and a landscape rating of Medium, the overall visual impact of
Segment 46 would likely be Moderate.
Overall Impact: West Option 1 removes three segments with Moderate impacts and adds three
segments with impacts similar to those they replace. West Option 1 is considered to have the
same overall impact as the West Alternative.

Appendix E Visual Resource Report
38 I-5 Corridor Reinforcement Project Draft EIS November 2012
Figure 3-7 Viewpoint 40-1 Looking East-Southeast from Lacamas Heritage Trail Parking Area. West Option 1. Shows
existing lines North Bonneville-Ross No. 1 and North Bonneville-Ross No. 2, and towers 26/3
to 26/5. Simulation shows new towers 40/12 to 40/14.

Appendix E Visual Resource Report
I-5 Corridor Reinforcement Project Draft EIS 39 November 2012
3.4.2 West Option 2
West Option 2 replaces segments 36B, 41, 45and 50 with segments 36, 36A, 37, 38, 43, 48 and
51.
Segment 36: See West Option 1, Segment 36.
Segment 36A: This segment would be very similar to Segment 36. Typical views would have a
clear view of the segment. As little vegetation clearing would be required and only the towers
would be visible, the contrast would be Weak. The segment would be visible from the residences
along NE Stoney Meadows Drive that back onto the open space as well as from NE 199th
Avenue. With a Weak overall contrast and Medium landscape rating, the overall impact would
likely be Low.
Segment 37: Segment 37 would be visible from the residences along the north edge of the right-
of-way, specifically from the residential area around NE 48th Circle and from NE 199
th Ave. The
segment would remove much of the treed visual barrier between the residences and the right-of-
way. This would cause the segment to be very prominent, as well as cause the previously
obstructed existing segments to be visible. From these residences, the contrast would be Strong.
From the road, the expected contrast is Weak: to motorists, the segment would only be visible
momentarily where it runs perpendicular to the road and would not likely attract the attention of
viewers.
The impact of Segment 37 is localized to specific residences and would have little impact beyond
the residential area around NE 48th Circle. The overall contrast is Strong. With a Strong overall
contrast and a Medium landscape rating, the overall visual impact of the segment would likely be
High.
Segment 38: Views of Segment 38 would be largely obscured by vegetation. The top of the
towers may be visible to some residents. The expected contrast of any potential views is Weak,
as they are unlikely to attract the viewer’s attention. With a Weak contrast and Low landscape
rating, the overall visual impact of Segment 38 would likely be Low.
Segment 43: Views of Segment 43 would be mostly obstructed in the northern half of the
segment. It would be visible to nearby residents and roadways. Because Segment 43 would be
new right-of-way, it would attract the viewer’s attention from the existing landscape; however,
because the landscape consists of patches of trees, the discontinuous patterns would reduce the
attention drawn to the segment. The overall anticipated contrast of Segment 43 is Weak. With a
Weak contrast rating and Medium landscape rating, the overall visual impact of the
segment would likely be Low.
Segment 48: Segment 48 would be seen by rural residences adjacent to the right-of-way and
more distant residences with a partially obscured view. It would also be visible to motorists
along NE 267th Avenue, which is crossed by the segment.
A visual simulation viewpoint along Segment 48 is depicted in Figure 3-8. Viewpoint 48-1
simulates the view from NE 267th Ave looking west-southwest. Right-of-way width is not
changed by West Option 2, but larger double-circuit towers are added. These towers have
Moderate form contrast, as they have a different, less harmonious shape, and are visible from
much farther away. The proposed towers have Moderate line contrast, as they stand out above
the line of the horizon well into the distance, whereas only the nearest existing towers are above
the horizon. The color contrast color is Weak, as the larger towers result in more metallic grey in

Appendix E Visual Resource Report
40 I-5 Corridor Reinforcement Project Draft EIS November 2012
the view; however, the color element alone does not attract attention. The texture contrast is also
Weak, as it does not attract the viewer’s attention. The contrast in scale is Strong, as the
proposed towers dominate the view from close up and would be visible from greater distances
than the existing towers since the proposed towers are taller than the surrounding trees. The
overall contrast at Viewpoint 48-1 is Moderate.
The overall contrast of the segment is Moderate, as most potential views would be similar to
Viewpoint 48-1. With an overall contrast rating of Moderate and a landscape rating of Medium,
the overall visual impact of Segment 48 would likely be Moderate.
Segment 51: Views of Segment 51 are typically from rural residences and roads. Along this
segment, the existing 230-kV towers would be replaced with one taller 230-kV double-circuit
tower and a similarly sized single circuit 500-kV tower. The proposed towers are approximately
twice the height of the existing towers and would no longer match, which is less harmonious than
the existing matching towers. This is visually preferable, however, to a third set of towers and a
wider right-of-way.
A visual simulation viewpoint along Segment 51 is depicted in Figure 3-9. Viewpoint 51-1
simulates the view from NE Zeek Road, looking south. The towers have Moderate form contrast,
as they are larger than existing towers, have a different, less harmonious shape, and are visible
farther into the distance. The taller towers also have Moderate line contrast, as they stand out
above the line of the horizon well into the distance. The contrast of the project’s color is Weak:
the larger towers result in more metallic grey in the view, but the color element alone does not
attract attention. The texture contrast is also Weak, because it does not attract the viewer’s
attention. The contrast in scale is Moderate, as the proposed towers are more prominent than the
existing towers, but do not dominate the view and the characteristic landscape. The overall
contrast at Viewpoint 51-1 is Moderate.
The overall contrast of Segment 51 is Moderate, as most viewing conditions would be similar to
Viewpoint 51-1.
With an overall contrast rating of Moderate and a landscape rating of Medium, the overall visual
impact of Segment 51 would likely be Moderate.
Overall Impact: West Option 2 removes three segments with Moderate impact and adds two
segments with Low impact, four segments with Moderate and one segment with High impact.
This option shares the impact of the West Alternative; however, the impact to residents along NE
48th Circle is increased from Moderate (Segment 36B) to High (Segment 37), the visual impact to
the golf course is removed and the impact on residents along NE 28th Street is transferred to
farther east to a new right-of-way. This option is less preferable to West Option 1 and the West
Alternative, since it would result in High impacts to several residents, would require new right-of-
way and would add more and longer segments with Low and Moderate impact.
The most preferable (lowest impact) options for the West Alternative are West Option 1 and the
main alternative, followed by West Option 2 and West Option 3.

Appendix E Visual Resource Report
I-5 Corridor Reinforcement Project Draft EIS 41 November 2012
Figure 3-8 Viewpoint 48-1 Looking West-Southwest from NE 267
th Avenue, North of Camas. West Option 2, Crossover
Option 2. Shows existing lines North Bonneville-Ross No. 1 and North Bonneville-Ross No. 2,
and towers 24/2 to 24/4. Simulation shows new towers 48/1 to 48/7.

Appendix E Visual Resource Report
42 I-5 Corridor Reinforcement Project Draft EIS November 2012
Figure 3-9 Viewpoint 51-1 Looking South from NE Zeek Road, Washougal. Central, East, and Crossover Alternatives, and
West Options 2 and 3. Shows existing lines North Bonneville-Troutdale No. 1 and North
Bonneville-Troutdale No. 2. Simulation shows new towers 51/4 to 51/11.

Appendix E Visual Resource Report
I-5 Corridor Reinforcement Project Draft EIS 43 November 2012
3.4.3 West Option 3
West Option 3 replaces segments 36B, 41, 45 and 50 with segments 36, 36A, 37, 38, 39, T, 49
and 51.
Segment 36: See West Option 1, Segment 36.
Segment 36A: See West Option 2, Segment 36A.
Segment 37: See West Option 2, Segment 37.
Segment 38: See West Option 2, Segment 38.
Segment 39: Views of Segment 39 would typically be from rural residences and glimpse views
along roadways. The widened right-of-way and addition of the single-circuit 500-kV tower
would, from locations along the right-of-way, resemble Viewpoint 25-1 (see Figure 3-1). It
would likely have Moderate contrast from existing conditions. The overall contrast of
Segment 39 is expected to be Moderate, since there are residences scattered along the length of
the segment that would be exposed to both the proposed segment and existing towers due to the
right-of-way widening and removal of vegetation that is currently acting as a visual barrier. With
a contrast of Moderate and a landscape rating of Medium, the overall visual impact of
Segment 39 would likely be Moderate.
Segment T: There are no major public views of this segment as it is located amongst mature
vegetation and is not on exposed terrain, and the views of the segment from the closest residences
would likely be blocked by vegetation. The overall visual impact of Segment T would likely be
Low.
Segment 49: Views of Segment 49 would likely be limited through the northern two thirds of the
segment, as it is not exposed to roads, residences, or other viewpoints of consideration. Near the
southern end of the segment, there are rural residences located immediately adjacent to the right-
of-way. At the southern section, the existing right-of-way would be maintained and a double
circuit installed. This would allow existing visual buffers to be maintained. The taller towers
would likely be visible above the trees to a handful of residents. The anticipated overall contrast
of the segment is Moderate, as the scale of the double-circuit towers attracts the viewer’s
attention. With an overall contrast of Moderate and a landscape rating of Low, the overall visual
impact of the segment would likely be Low.
Segment 51: See West Option 2, Segment 51.
Overall Impact: West Option 3 removes four segments with a Moderate impact but adds two
segments with Low impact, four segments with Moderate impact, and one segment (Segment 37)
with High impact. This option is less preferable than West Option 1, West Option 2, and the
West Alternative, since it would result in High impacts to several residents, and would add more
and longer segments with Low impacts and similar or longer segments with Moderate impacts
compared to all other options.
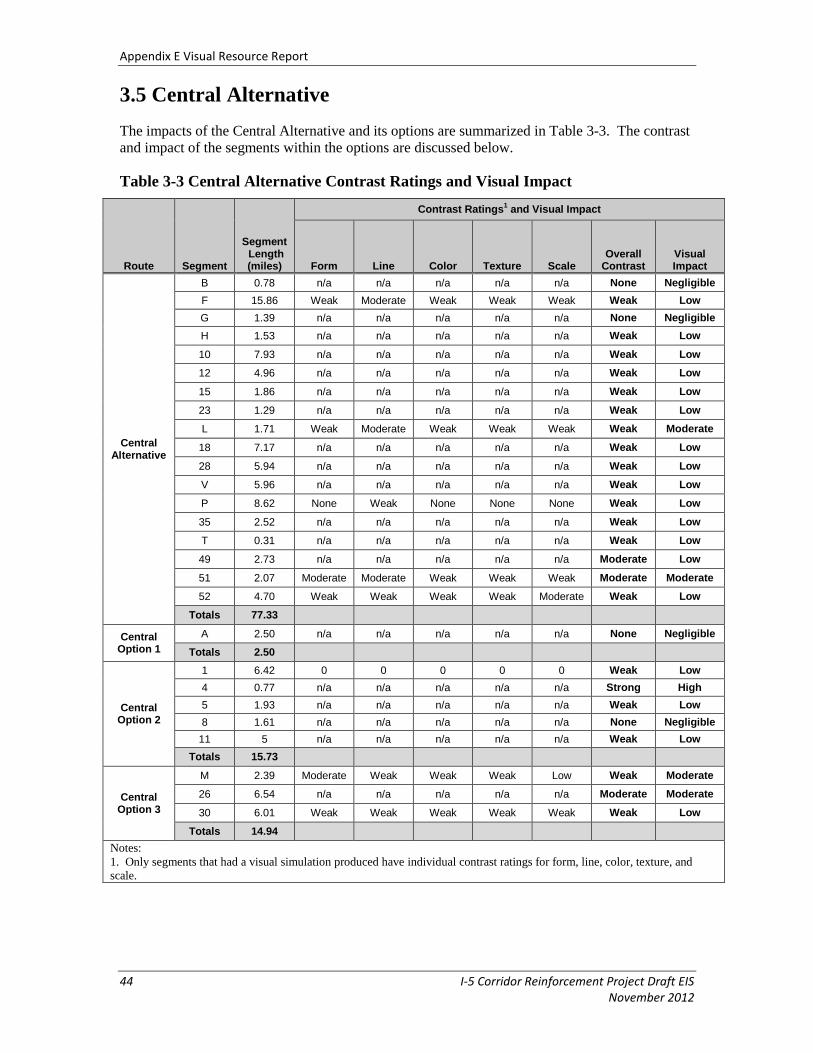
Appendix E Visual Resource Report
44 I-5 Corridor Reinforcement Project Draft EIS November 2012
3.5 Central Alternative
The impacts of the Central Alternative and its options are summarized in Table 3-3. The contrast
and impact of the segments within the options are discussed below.
Table 3-3 Central Alternative Contrast Ratings and Visual Impact
Route Segment
Segment Length (miles)
Contrast Ratings1 and Visual Impact
Form Line Color Texture Scale Overall
Contrast Visual Impact
Central Alternative
B 0.78 n/a n/a n/a n/a n/a None Negligible
F 15.86 Weak Moderate Weak Weak Weak Weak Low
G 1.39 n/a n/a n/a n/a n/a None Negligible
H 1.53 n/a n/a n/a n/a n/a Weak Low
10 7.93 n/a n/a n/a n/a n/a Weak Low
12 4.96 n/a n/a n/a n/a n/a Weak Low
15 1.86 n/a n/a n/a n/a n/a Weak Low
23 1.29 n/a n/a n/a n/a n/a Weak Low
L 1.71 Weak Moderate Weak Weak Weak Weak Moderate
18 7.17 n/a n/a n/a n/a n/a Weak Low
28 5.94 n/a n/a n/a n/a n/a Weak Low
V 5.96 n/a n/a n/a n/a n/a Weak Low
P 8.62 None Weak None None None Weak Low
35 2.52 n/a n/a n/a n/a n/a Weak Low
T 0.31 n/a n/a n/a n/a n/a Weak Low
49 2.73 n/a n/a n/a n/a n/a Moderate Low
51 2.07 Moderate Moderate Weak Weak Weak Moderate Moderate
52 4.70 Weak Weak Weak Weak Moderate Weak Low
Totals 77.33
Central Option 1
A 2.50 n/a n/a n/a n/a n/a None Negligible
Totals 2.50
Central Option 2
1 6.42 0 0 0 0 0 Weak Low
4 0.77 n/a n/a n/a n/a n/a Strong High
5 1.93 n/a n/a n/a n/a n/a Weak Low
8 1.61 n/a n/a n/a n/a n/a None Negligible
11 5 n/a n/a n/a n/a n/a Weak Low
Totals 15.73
Central Option 3
M 2.39 Moderate Weak Weak Weak Low Weak Moderate
26 6.54 n/a n/a n/a n/a n/a Moderate Moderate
30 6.01 Weak Weak Weak Weak Weak Weak Low
Totals 14.94
Notes:
1. Only segments that had a visual simulation produced have individual contrast ratings for form, line, color, texture, and
scale.

Appendix E Visual Resource Report
I-5 Corridor Reinforcement Project Draft EIS 45 November 2012
Segment B: Segment B is not expected to be visible from any significant viewpoints. The overall
impact of this segment would likely be Negligible.
Segment F: Views of Segment F are typically obstructed by surrounding vegetation. The
segment is most visible as it crosses the Cowlitz River valley. As it crosses the valley and travels
south along the slopes on the east side of the valley, locations with potential views of the
segment include views from the Cowlitz River, I-5, Highway 504, and roads and residences
surrounding Bond Road on the east side of I-5. In general, there are few viewing opportunities of
the segment along this route. The view from the river, I-5 and highways would likely be a
glimpse view of the lines overhead and would likely have Weak contrast, as the segment is not
likely to attract the attention of the viewer. There is one residence that would be directly adjacent
to the right-of-way. To this resident, the contrast is likely to be Moderate to Strong. The overall
contrast of Segment F is Weak, as it is unlikely to significantly attract the attention of viewers.
With a landscape rating of Low and an overall contrast rating of Weak, the overall impact of the
segment would likely be Low.
Segment G: Segment G is not expected to be visible from any significant viewpoints. The
overall impact of this segment would likely be Negligible.
Segment H: Segment H would not likely have any considerable viewing locations. It may be
visible from a few rural residences located at the end of Mahaffey Road, although the views
would be oblique and likely partially obstructed. As such, the expected contrast for the
segment is Weak. With a landscape rating of Low and an overall contrast rating of Weak, the
overall impact of the segment is Low.
Segment 10: Segment 10 would not likely have any considerable viewing locations, as it passes
mainly through uninhabited forest without long range exposure to potential viewers. At the very
south end of the segment, it passes over Kalama River Road and the Kalama River. At these
locations the lines would be visible overhead; however, the towers would not likely be visible due
to foreground vegetation. The contrast of just the lines passing over the river and road is likely to
be Weak. With a landscape rating of Low and an overall contrast rating of Weak, the overall
impact of the segment would likely be Low.
Segment 12: For most of its length Segment 12 would not likely have any considerable viewing
locations, as it passes through mainly forest. At the very south end of the segment it would likely
have slight exposure to the roads and residences in the Lewis River Valley. The small portion of
the segment that could be visible passes through existing cutblocks, which would limit the
contrast of the right-of-way clearing. The closest potential views would be approximately 1 mile
away, so the towers are likely to have Weak contrast with the landscape. The overall contrast
expected for the segment is Weak. With a landscape rating of Low and an overall contrast rating
of Weak, the overall impact of the segment would likely be Low.
Segment 15: Views of Segment 15 would likely be limited to a few rural residences located on
Tangen Road. Views to the Lewis River Valley and Ariel would likely be obstructed by
topography and vegetation. Where views exist, the contrast would be mitigated by the existing
transmission line right-of-way that runs parallel to the segment. For the few residences on the hill
on Tangen Road, the contrast would likely be Moderate, as the segment would likely attract
attention, but would not dominate the landscape. The overall contrast of the segment is expected
to be Weak. With a landscape rating of Low and an overall contrast rating of Weak, the overall
impact of the segment would likely be Low.

Appendix E Visual Resource Report
46 I-5 Corridor Reinforcement Project Draft EIS November 2012
Segment 23: Segment 23 would be visible from the Lewis River Road and limited locations
along the Lewis River, and select residences in Ariel and across the Lewis River would have
partially obstructed views of the segment. The new right-of-way follows and widens the right-of-
way of an existing transmission line, so the contrast with existing conditions is lessened. The
expected contrast is Weak, as there are few unobstructed views and more distant views would be
mitigated by the existing cleared vegetation. With a contrast of Weak and a landscape rating of
Medium, the overall visual impact of Segment 23 would likely be Low.
Segment L: Segment L would likely be visible from Ariel, Lake Merwin, and occasional rural
residences south of Lake Merwin. With a contrast rating of Weak and a landscape rating of High,
the overall visual impact of the segment would likely be Moderate.
Segment 18: Views of Segment 18 are likely to be very limited, as it passes through forest that
does not have any revealing landforms, such as exposed hillsides. At the east end of the segment
there are rural residences adjacent to the right-of-way. Depending on the right-of-way vegetation
clearing requirements, certain homes may not have vegetation obstructing the view to the right-
of-way. Based on initial tower placement, however, there are not likely to be any direct
unobstructed views of the towers. Since most of the segment would not be noticeable or would
be heavily obstructed by vegetation, the contrast is likely Weak. With an overall contrast of
Weak and a landscape rating of Low, the visual impact would likely be Low.
Segment 28: At the north end of the segment, it passes over NE Yale Bridge Road/Highway 503
and through Chelatchie Prairie. Here the segment would be visible to motorists and the few
residences on the small prairie. The segment would likely have a Moderate contrast, as the
towers would attract attention on the flat prairie and the right-of-way clearing would attract
attention, particularly as it ascends the steep slope on the south side of the prairie. Neither would
likely dominate the view. Farther south, the segment would also likely be visible to residents
located off Healy Road. There would likely be a Moderate contrast to those few residents with an
unobstructed view. The segment south of Healy Road would not likely be visible from any
considerable viewpoints. The overall contrast of the segment is Weak, as it is only visible in
limited locations and would largely go unnoticed. With a landscape rating of Low and an overall
contrast rating of Weak, the overall impact of the segment would likely be Low.
Segment V: Views of the segment are mostly obstructed by foreground vegetation and
topography. The subtle relief and topography make views of the landscape rare and usually
partly obstructed. At the south end of Segment V, it passes over the East Fork of the Lewis
River, over NE Sunset Falls Road, and near (approximately 600 feet from) a few rural residences.
Views from the river are likely to be just of the lines passing overhead, as the foreground
vegetation would likely block the views of the rest of the towers. The contrast at the river is
likely to be Weak, as the lines are not likely to draw the attention of viewers. The segment would
not likely draw the attention of motorists, as it would pass perpendicularly over the road and
would only be visible as a brief glimpse; therefore, it would likely have a Weak contrast. From
nearby rural residences, views are likely to be obstructed by vegetation and topography. The
overall contrast of the segment is Weak. With a landscape rating of Low and an overall contrast
rating of Weak, the overall impact of the segment is Low.
Segment P: Segment P passes along the western edge of the foothills and the eastern edge of the
rural residences of Hockinson and Venersborg. There are no major public viewpoints close to
this segment. Most views from nearby residences are likely to be obstructed by vegetation;
however, there would likely be a few residences with a direct view of the segment. To these
residents, the contrast would likely be Moderate to Strong, as the proximity of the towers would
begin to dominate the view.

Appendix E Visual Resource Report
I-5 Corridor Reinforcement Project Draft EIS 47 November 2012
The overall contrast of the segment is Weak, as there are no public viewing areas that are affected
and localized views are likely to be isolated and limited to only a few locations. With a landscape
rating of Low and an overall contrast rating of Weak, the overall impact of the segment would
likely be Low.
Segment 35: Views of Segment 35 are likely to be obstructed by foreground vegetation. The
segment crosses NE Lessard Road and within a few hundred feet of a few residences, but is not
likely to be visible through the vegetation. The contrast of the segment is likely to be Weak.
With a landscape rating of Low and an overall contrast rating of Weak, the overall impact of the
segment would likely be Low.
Segment T: Segment T is not expected to be visible from any significant viewpoints. The overall
impact of this segment would likely be Negligible.
Segment 49: See West Option 3, Segment 49.
Segment 51: See West Option 2, Segment 51.
Segment 52: See West Alternative, Segment 52.
Overall Impact: Most of the Central Alternative runs through sparsely populated land with few
sensitive viewers. Most impacts are Low, with a few Moderate impacts around Lake Merwin and
Camas. The High impact reported for Segment 4 is localized and affects a relatively few number
of residents. The overall impact of the Central Alternative is Low to Moderate.
3.5.1 Central Option 1
Central Option 1 adds Segment A to extend the transmission line from the site of the proposed
Baxter Road Substation to the proposed Casey Road Substation.
Segment A: Segment A is not expected to be visible from any significant viewpoints. The overall
impact of this segment would likely be Negligible.
Overall Impact: Central Option 1 adds one segment of Negligible impact. Central Option 1 is
considered to have a visual impact similar to the Central Alternative.
3.5.2 Central Option 2
Central Option 2 replaces segments B, F and G and the proposed Baxter Road Substation with
segments 1, 4, 5, 8 and 11 and the proposed Monahan Creek Substation.
Segment 1: Typical views of Segment 1 would be at least partially blocked by the surrounding
vegetation. The segment would be visible from Delameter Road and select residences in that
area, although it is unlikely to be dominant in the landscape, due to the subtle relief and trees that
block the view. South along the segment there is little expected visibility of the segment, as there
are few residences or roads nearby and the route does not follow highly exposed terrain. Near the
south end of Segment 1, as it passes down the hillside into Longview, it would likely be visible
from a few residences on the north edge of Beacon Hill.
The contrast from Segment 1 is expected to range from None to Weak, as it is not likely to be
visible along much of its length. It would be visible from certain locations, but is unlikely to
Appendix E Visual Resource Report
48 I-5 Corridor Reinforcement Project Draft EIS November 2012
draw the attention of the viewer. With a landscape rating of Low and a contrast rating of Weak,
the overall impact of the segment would likely be Low.
Segment 4: This short segment runs adjacent to a residential area at the south end of the
neighborhood of West Side Highway and across the Cowlitz River. For the residences along the
right-of-way, the contrast would be Strong due to the scale of the towers created by their
proximity. With an existing landscape rating of Medium and a contrast rating of Strong, the
overall impact of Segment 4 would likely be High.
Segment 5: Segment 5 is largely obscured by the surrounding vegetation. The segment would be
visible to motorists as it passes over I-5 and would have an expected contrast rating of Weak.
The duration of the view would very brief as it crosses perpendicular to the road and the right-of-
way clearing and towers are not likely to be noticeable farther away. The segment would also
have partially obscured views from residences along Kitchen Drive and Holcomb Road. For
most locations, the contrast would likely be Weak. For isolated residences adjacent to the
segment, however, the contrast could be Moderate. The overall contrast for the segment is Weak,
as it is unlikely to draw the attention of most viewers. With a landscape rating of Low and an
overall contrast rating of Weak, the overall impact of the segment would likely be Low.
Segment 8: There are no potential viewpoints that are expected to have considerable views of
Segment 8, as they are likely to be screened by terrain and vegetation. The overall visual impact
of Segment 8 would likely be Negligible.
Segment 11: Segment 11 passes largely through forest with no considerable viewing
opportunities. The segment does, however, pass through a rural area where it would likely be
visible along parts of Rose Valley Road and to some residents of Clearwater Road. Views from
the valley would likely be mostly obstructed by vegetation. The linear nature of the disturbance
would draw more attention when visible than existing non-linear disturbances. The angle of
viewing and the trees would likely mask the disturbance so the contrast would likely be Weak.
With a landscape rating of Low and an overall contrast rating of Weak, the overall impact of the
segment is Low.
Overall Impact: Central Option 2 replaces two segments with a Negligible impact and one
segment with a Low impact. These are replaced with one segment with a Negligible impact,
three segments with a Low impact, and one segment with a High impact. Central Option 2 also
replaces the Baxter Road Substation, rated at a Low impact with the Monahan Creek Substation,
rated at a Moderate impact. Central Option 2 has a higher overall visual impact than the Central
Alternative and Central Option 1.
3.5.3 Central Option 3
Central Option 3 replaces segments L, 18, 28 and V with segments M, 26 and 30.
Segment M: The main view of interest for Segment M is at the north end where it crosses the
Lewis River, south of Ariel. Both the river and nearby Merwin Lake attract recreational users
who are likely to be more sensitive to potential changes to the visual landscape. From Ariel the
view across the river to the south side of the valley would likely be partially obstructed by
foreground vegetation. Where views are possible the tower would likely be visible on the far
side, and the right-of-way clearing may be noticeable but not dominant up the hill on the south
side. The level of contrast would largely depend on whether the vegetation can maintained on the
river valley slope. Assuming that the vegetation can be kept in the right-of-way through the
lower part of the valley on the steeper slopes, the contrast would likely be Weak. Farther south

Appendix E Visual Resource Report
I-5 Corridor Reinforcement Project Draft EIS 49 November 2012
along the segment, the surrounding vegetation and topography would result in few or obstructed
views of the segment and Weak contrast.
A visual simulation viewpoint along Segment M is depicted in Figure 3-10. Viewpoint M-1
simulates the view from the swimming beach on Lake Merwin in Ariel, looking south. The
location has Moderate form contrast, as the larger towers have a different, less harmonious shape,
and are visible into the distance. The location has Weak line contrast, as the towers do not stand
out above the line of the horizon. The contrast of the segment’s color is Weak, as the towers
result in more metallic grey in the view; however, the color element alone does not attract
attention. The texture contrast is also Weak, as it does not attract the viewer’s attention. The
contrast in scale is Weak, as the proposed towers are only somewhat prominent, and do not
dominate the view and the characteristic landscape. The overall contrast at Viewpoint M-1 is
Low.
The overall contrast of the Segment M would likely be Weak, since the segment would generally
be less visible than at Viewpoint M-1. With an overall contrast of Weak and a landscape rating
of High, the overall visual impact would likely be Moderate.
Segment 26: Potential viewing locations of Segment 26 include rural residential homes and
Highway 503. There are no key public viewpoints that are likely to be affected. Rural residential
homes immediately adjacent to the right-of-way would likely have a Moderate to Strong contrast.
From Highway 503 and other public roads, the contrast of the segment is likely going to be
Weak, as the segment would pass over the road and would only offer a glimpse view to motorists.
Overall, the contrast of the segment would likely be Moderate. With an overall contrast of
Moderate and a landscape rating of Medium, the overall visual impact of Segment 26 would
likely be Moderate.
Segment 30: Typical views of Segment 30 are obstructed by vegetation and topography.
Potential public viewing locations include Yacolt, 2 miles to the East, and where the
segment crosses the East Fork of the Lewis River west of Lucia Falls and Moulton Falls Park.
There are also a few rural residences close to the segment. From the Lewis River, the contrast of
the segment is expected to be Weak, as foreground vegetation would block the view of the
towers. The lines would be visible crossing the river, but are unlikely to draw the attention of the
viewer. From residences, the contrast would likely be moderate, as the towers may be visible
above the trees. With an overall contrast of Weak and a landscape rating of Medium, the overall
visual impact of the segment would likely be Low.
Overall Impact: Central Option 3 adds one segment with a Low and two segments with a
Moderate impact and removes three segments with a Low impact and one segment with a
Moderate impact. The most noticeable visual impact resulting from Central Option 3 would
occur where it crosses the Lewis River near Ariel. The difference between the two crossings does
not affect the visual impact rating. However, the option does add Segment 26, which has a higher
visual impact (Moderate) than the segments it replaces. Central Option 3 is considered to have a
higher visual impact than the Central Alternative and Central Option 1 and a lower impact than
Central Option 2.
The most preferable (lowest impact) options for the Central Alternative are Central Option 1 and
the main alternative, followed by Central Option 3 and Central Option 2.

Appendix E Visual Resource Report
50 I-5 Corridor Reinforcement Project Draft EIS November 2012
Figure 3-10 Viewpoint M-1 Looking South near Swimming Beach on Lake Merwin, Ariel. Central and Crossover
Alternatives. Simulation shows new towers M/2 to M/4.

Appendix E Visual Resource Report
I-5 Corridor Reinforcement Project Draft EIS 51 November 2012
3.6 East Alternative
The impacts of the East Alternative and its options are summarized in Table 3-4. The contrast
and impact of the segments within the options are discussed below.
Table 3-4 East Alternative Contrast Ratings and Visual Impact
Route Segment
Segment Length (miles)
Contrast Ratings1 and Visual Impact
Form Line Color Texture Scale Overall
Contrast Visual Impact
East Alternative
B 0.78 n/a n/a n/a n/a n/a None Negligible
F 15.86 Weak Moderate Weak Weak Weak Weak Low
I 2.77 n/a n/a n/a n/a n/a Weak Low
K 22.8 Moderate Weak Weak Weak Moderate Weak Low
W 1.31 n/a n/a n/a n/a n/a Weak Low
O 19.47 Weak Weak Weak Weak Weak Weak Low
Q 2.63 n/a n/a n/a n/a n/a Weak Low
S 0.41 n/a n/a n/a n/a n/a None Negligible
49 2.73 n/a n/a n/a n/a n/a Moderate Low
51 2.07 Moderate Moderate Weak Weak Weak Moderate Moderate
52 4.70 Weak Weak Weak Weak Moderate Weak Low
Totals 75.53
East Option 1
3 7.82 0 0 0 0 0 Moderate Low
7 2.05 n/a n/a n/a n/a n/a Weak Low
11 5 n/a n/a n/a n/a n/a Weak Low
J 2.72 n/a n/a n/a n/a n/a None Negligible
Totals 17.59
East Option 2
U 6.11 n/a n/a n/a n/a n/a None Negligible
V 5.96 n/a n/a n/a n/a n/a Weak Low
P 8.62 None Weak None None None Weak Low
35 2.52 n/a n/a n/a n/a n/a Weak Low
T 0.31 n/a n/a n/a n/a n/a Weak Low
Totals 23.52
East Option 3
R 3.68 n/a n/a n/a n/a n/a None Negligible
Totals 3.68
Notes:
1. Only segments that had a visual simulation produced have individual contrast ratings for form, line, color, texture, and
scale.
Segment B: See Central Alternative, Segment B.
Segment F: See Central Alternative, Segment F.
Segment I: Views of this segment are largely obstructed by vegetation and topography. No
significant viewpoints are likely to have views of the segment. Some locations along Rose Valley

Appendix E Visual Resource Report
52 I-5 Corridor Reinforcement Project Draft EIS November 2012
Road may have views toward the segment. These views are likely to be partially obstructed and
portions of the segment that are visible are likely not to attract attention. The overall contrast of
Segment I is likely Weak. With a contrast rating of Weak and a landscape rating of Medium, the
overall visual impact of the segment would likely be Low.
Segment K: The majority of Segment K is obstructed by vegetation. At the south end of the
segment, it descends between Lake Merwin and Yale Lake. The segment would be briefly visible
as it crosses Lewis River Road and would be visible from Yale Road as it passes through an open
area east of the road. At both these locations it is likely to have Weak contrast, as it would not
likely attract the attention of viewers. Views to residences are likely to be at least partially
obscured by vegetation, so the expected contrast is Weak. The segment crosses Lake Merwin,
east of the Yale Bridge. From Lake Merwin the lines would be visible, and potentially the tops of
the towers as well.
A visual simulation viewpoint along Segment K is depicted at Viewpoint K-1 (see Figure 3-11).
Viewpoint K-1 simulates the view from Yale Bridge Road just south of the intersection with
Lewis River Road, looking east. The segment has Moderate form contrast at this location, as the
larger towers have a different, less harmonious shape, and are visible farther into the distance.
The segment has Weak line contrast, as the taller towers now stand out above the vegetation but
not above the line of the horizon. The contrast of the segment’s color is Weak, as the larger
towers result in more metallic grey in the view; however, the color element alone does not attract
attention. The texture contrast is also Weak, as it does not attract the viewer’s attention. The
contrast of the scale is Moderate, as the proposed towers are more prominent, but do not dominate
the view and the characteristic landscape.
The overall contrast at Viewpoint K-1, and Segment K, is Weak. . With an overall contrast of
Weak and a landscape rating of Medium, the overall visual impact would likely be Low.
Segment W: Views to Segment W are expected to be largely obstructed by vegetation. The most
significant view would be as the segment crosses over a small arm of Lake Merwin. The towers
are likely going to be set back from the top of the escarpment with the underlying vegetation
retained, so as not to be visible from the water. With only the lines visible, the anticipated
contrast is Weak. With an overall contrast of Weak and a landscape rating of Medium, the visual
impact would likely be Low.
Segment O: There are few potential views of Segment O, as there are no major roads in this area.
Longer range views could be possible due to the greater relief; however, the landforms do not
appear to expose the segment to longer range views. With an overall contrast of Weak and a
landscape rating of Low, the visual impact would likely be Low.
Segment Q: Views to Segment Q would likely be restricted to motorists traveling along NE
Boulder Creek Road. Rural residents nearby would likely not have a direct view of the segment
due to vegetation. The overall contrast of the view would likely be Weak. With an overall
contrast of Weak and a landscape rating of Low, the visual impact would likely be Low.
Segment S: There are no potential viewpoints that are expected to have meaningful views of
Segment S, as they are likely to be screened by terrain and vegetation. The overall visual impact
of Segment S would likely be Negligible.
Segment 49: See West Option 3, Segment 49.
Segment 51: See West Option 2, Segment 51.

Appendix E Visual Resource Report
I-5 Corridor Reinforcement Project Draft EIS 53 November 2012
Figure 3-11 Viewpoint K-1 Looking East-Southeast from Yale Bridge Road, Ariel. East Alternative. Simulation shows new
Tower K/79.
Appendix E Visual Resource Report
54 I-5 Corridor Reinforcement Project Draft EIS November 2012
Segment 52: See West Alternative, Segment 52.
Overall Impact: Most of the impacts of the East Alternative are found in the south end, as it
passes through Camas. Most of the segments have Negligible to Low Impact, as there are few
potential sensitive viewpoints and the segments have little contrast with the landscape. The
overall impact of the East Alternative is Low to Moderate.
3.6.1 East Option 1
East Option 1 replaces segments B, F and I and the proposed Baxter Substation with segments 3,
7, 11 and J and the proposed Monahan Substation.
Segment 3: Typical views of Segment 3 are partially or fully obstructed by foreground
vegetation. There are, however, locations along Delameter Road, Hazel Dell Road, Highway
411, the rural residences located between Kelso and Castle Rock, I-5, and the residences near
Ostrander Road that would have a view of the segment.
At Delameter Road, the segment would likely be visible as it leaves the substation, but would not
likely be dominant on the landscape due to the subtle relief and vegetation. Where the segment
crosses Hazel Dell Road, the towers and lines would likely be visible above the trees from the
adjacent residences and briefly visible to motorists as they pass underneath the lines. There are
also about five residences at the top of the hill along Pilgrim Road that would have a view of the
segment, if their properties have a view to the south and beyond the trees. In these areas, the
contrast would likely be Weak to Moderate. Along Hazel Dell Road, the segment would likely be
visible to motorists and some residences along the road. The top of the transmission towers
would likely just be visible at the top of the hill on the east side of the road. The contrast would
likely be Weak, as it would not draw the viewer’s attention due to its angle of viewing and being
largely obscured. The view from Highway 411 would likely be a very brief view of the lines
where they pass over the road. The contrast here would likely be Weak, as this type of view does
not tend to draw the attention of motorists.
Along the flat floodplain, the segment would be visible from several residences, where the
segment would likely have a Weak to Moderate contrast. Where Segment 3 crosses the
Interstate, the contrast would likely be Weak, as the lines would pass over the highway and would
only be momentarily visible since they cross perpendicularly. The neighborhood at the south end
of Segment 3 would likely have view of the segment with a Moderate contrast.
The overall contrast rating for Segment 3 is Moderate, as some residences would have a view in
which the segment could dominate the viewer’s attention. With a landscape rating of Low and a
contrast rating of Moderate, the overall impact of Segment 3 would likely be Moderate.
Segment 7: Most of Segment 7 would be obstructed by foreground vegetation and topography.
Residents on the hill off Ostrander Road may have a view of the segment as it crosses the hillside
at the west end of the segment. These views are likely to be partially obstructed and roughly half
a mile from the segment. From these locations, the contrast of the segment with the existing
landscape would likely be Weak. The overall contrast for the segment would likely be Weak.
With a landscape rating of Low and an overall contrast rating of Weak, the overall impact of the
segment would likely be Low.
Segment 11: See Central Option 2, Segment 11.

Appendix E Visual Resource Report
I-5 Corridor Reinforcement Project Draft EIS 55 November 2012
Segment J: Segment J is not expected to be visible from any significant viewpoints. The overall
impact of this segment would likely be Negligible.
Overall Impact: East Option 1 replaces one segment with a Negligible impact and two segments
with a Low impact with one segment with a Negligible impact and four segments with a Low
impact. The option also replaces the Baxter Road Substation, rated at a Low impact, with the
Monahan Creek Substation, rated at a Moderate impact. East Option 1 has a slightly higher
impact than the East Alternative.
3.6.2 East Option 2
East Option 2 replaces segments O, Q and S with segments U, V, P, 35 and T.
Segment U: Segment U is not expected to be visible from any significant viewpoints. The
overall impact of this segment would likely be Negligible.
Segment V: See Central Alternative, Segment V.
Segment P: See Central Alternative, Segment P.
Segment 35: See Central Alternative, Segment 35.
Segment T: See Central Alternative, Segment T.
Overall Impact: East Option 2 replaces one segment with a Negligible impact and two segments
with a Low impact with one segment with a Negligible impact and four segments with a Low
impact. The choice between East Option 2 and the East Alternative is mainly a balance between
Low impacts to outdoor and recreational users of the landscape in East Option 2, and Low
impacts to residences in the East Alternative. East Option 2 is considered to have visual impacts
similar to the East Alternative.
3.6.3 East Option 3
East Option 3 replaces Segment Q with Segment R.
Segment R: Segment R is not expected to be visible from any significant viewpoints. The overall
impact of this segment would likely be Negligible.
Overall Impact: East Option 3 replaces one segment with Low impact with a segment with
Negligible impact. East Option 3 is considered to have visual impacts similar to the East
Alternative.
The most preferable (lowest impact) options for the East Alternative are East Option 2, East
Option 3, and the East Alternative.
3.7 Crossover Alternative
The impacts of the Crossover Alternative and its options are summarized in Table 3-5. The
contrast and impact of the segments within the options are discussed below.
Segment 2: See West Alternative, Segment 2.
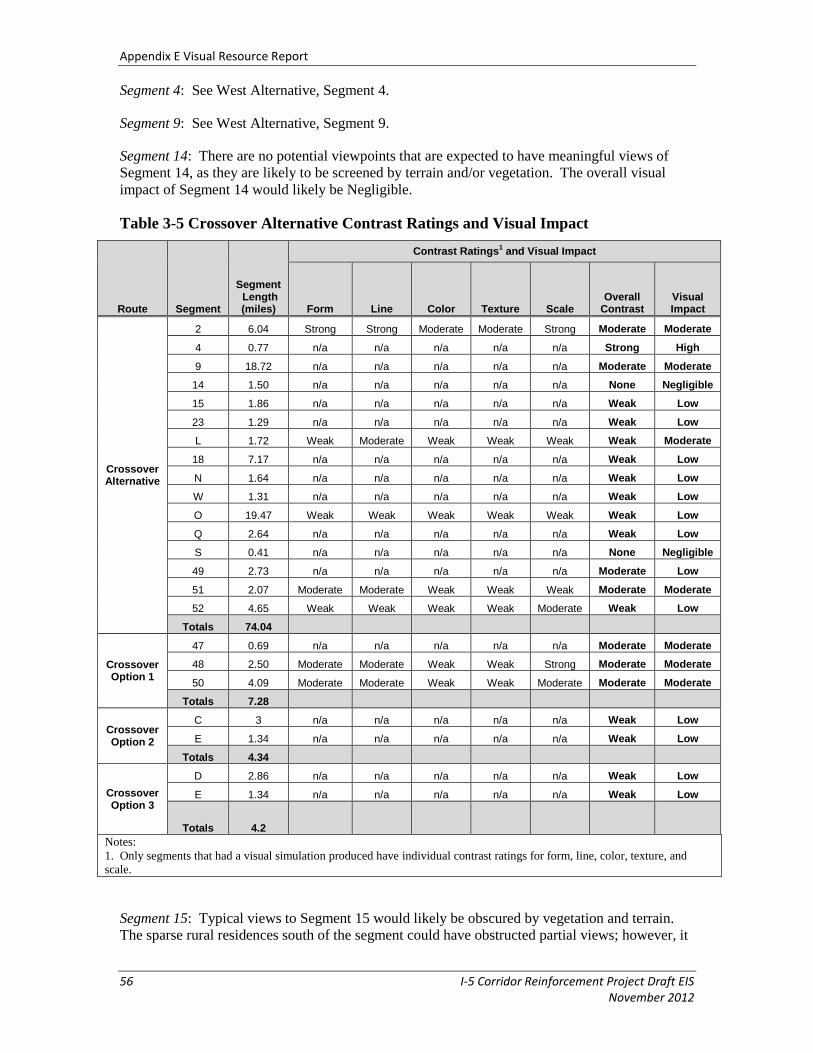
Appendix E Visual Resource Report
56 I-5 Corridor Reinforcement Project Draft EIS November 2012
Segment 4: See West Alternative, Segment 4.
Segment 9: See West Alternative, Segment 9.
Segment 14: There are no potential viewpoints that are expected to have meaningful views of
Segment 14, as they are likely to be screened by terrain and/or vegetation. The overall visual
impact of Segment 14 would likely be Negligible.
Table 3-5 Crossover Alternative Contrast Ratings and Visual Impact
Route Segment
Segment Length (miles)
Contrast Ratings1 and Visual Impact
Form Line Color Texture Scale Overall
Contrast Visual Impact
Crossover Alternative
2 6.04 Strong Strong Moderate Moderate Strong Moderate Moderate
4 0.77 n/a n/a n/a n/a n/a Strong High
9 18.72 n/a n/a n/a n/a n/a Moderate Moderate
14 1.50 n/a n/a n/a n/a n/a None Negligible
15 1.86 n/a n/a n/a n/a n/a Weak Low
23 1.29 n/a n/a n/a n/a n/a Weak Low
L 1.72 Weak Moderate Weak Weak Weak Weak Moderate
18 7.17 n/a n/a n/a n/a n/a Weak Low
N 1.64 n/a n/a n/a n/a n/a Weak Low
W 1.31 n/a n/a n/a n/a n/a Weak Low
O 19.47 Weak Weak Weak Weak Weak Weak Low
Q 2.64 n/a n/a n/a n/a n/a Weak Low
S 0.41 n/a n/a n/a n/a n/a None Negligible
49 2.73 n/a n/a n/a n/a n/a Moderate Low
51 2.07 Moderate Moderate Weak Weak Weak Moderate Moderate
52 4.65 Weak Weak Weak Weak Moderate Weak Low
Totals 74.04
Crossover Option 1
47 0.69 n/a n/a n/a n/a n/a Moderate Moderate
48 2.50 Moderate Moderate Weak Weak Strong Moderate Moderate
50 4.09 Moderate Moderate Weak Weak Moderate Moderate Moderate
Totals 7.28
Crossover Option 2
C 3 n/a n/a n/a n/a n/a Weak Low
E 1.34 n/a n/a n/a n/a n/a Weak Low
Totals 4.34
Crossover Option 3
D 2.86 n/a n/a n/a n/a n/a Weak Low
E 1.34 n/a n/a n/a n/a n/a Weak Low
Totals 4.2
Notes:
1. Only segments that had a visual simulation produced have individual contrast ratings for form, line, color, texture, and
scale.
Segment 15: Typical views to Segment 15 would likely be obscured by vegetation and terrain.
The sparse rural residences south of the segment could have obstructed partial views; however, it

Appendix E Visual Resource Report
I-5 Corridor Reinforcement Project Draft EIS 57 November 2012
is unlikely that the segment would contrast with the existing landscape and draw the attention of
potential viewers. There is one rural residence that appears to have a line of sight to the segment.
The overall contrast of the segment is Weak. With an overall contrast of Weak and a landscape
rating of Low, the overall visual impact of Segment 15 would likely be Low.
Segment 23: See Central Alternative, Segment 23.
Segment L: See Central Alternative, Segment L.
Segment 18: See Central Alternative, Section 18.
Segment N: Views of Segment N are likely to be largely obstructed by vegetation. The
segment would be visible as it crosses NE Yale Bridge Road. At the road crossing, the segment
is unlikely to attract the attention of motorists, as it crosses perpendicular to the road and due to
the vegetation, would only be visible briefly as motorists pass under the lines. The new right-of-
way partly follows and widens the right-of-way of an existing transmission line, so the contrast
with existing conditions is lessened. The expected contrast is Weak at the crossing. The overall
expected contrast is Weak. With an overall contrast of Weak and a landscape rating of Medium,
the visual impact would likely be Low.
Segment W: See East Alternative, Segment W.
Segment O: See East Alternative, Segment O.
Segment Q: See East Alternative, Segment Q.
Segment S: See East Alternative, Segment S.
Segment 49: See West Option 3, Segment 49.
Segment 51: See West Option 2, Segment 51.
Segment 52: See West Alternative, Segment 52.
Overall Impact: The Crossover Alternative is mostly Low to Moderate impact for most of its
length. Segment 4 has localized High impact to a limited number of residences. The cross-over
avoids the more populated western routes and results in fewer affected residents. This alternative
does not impact any recognized scenic areas or viewpoints. The overall impact of this alternative
is Low to Moderate.
3.7.1 Crossover Option 1
Crossover Option 1 replaces Segment 51 with segments 47, 48 and 50.
Segment 47 would be seen by rural residences adjacent to the right-of-way, and more distant
residences with a partially obscured view. The overall contrast of the segment is Moderate. With
an overall contrast rating of Moderate and a landscape rating of Medium, the overall visual
impact of Segment 47 would likely be Moderate.
Segment 48: See West Option 2, Segment 48.
Segment 50: See West Alternative, Segment 50.

Appendix E Visual Resource Report
58 I-5 Corridor Reinforcement Project Draft EIS November 2012
Overall Impact: Crossover Option 1 adds three segments with a Moderate impact through a rural
residential area and eliminates one with a similar impact. Crossover Option 1 offers few visual
benefits to offset the added length and exposure to a greater number of sensitive viewers, since it
only eliminates one segment of Moderate impact. This option has a higher impact than the
Crossover Alternative and is therefore less preferable.
3.7.2 Crossover Option 2
Crossover Option 2 adds segments C and E to extend the transmission line from the site of the
proposed Monahan Creek Substation to the proposed Baxter Road Substation.
Segment C: Views of Segment C are expected to be screened by vegetation and topography. The
segment would likely be visible at the south end to the rural residents near Melton Road. The
segment would run on existing right-of-way with reconfigured towers. As such, the expected
contrast of the segment is Weak. With an overall contrast of Weak and a landscape rating of
Low, the visual impact would likely be Low.
Segment E: Segment E would likely be visible from Monahan Road, Delameter Road, and the
rural residents located along the right-of-way. The segment would run on existing right-of-way
with reconfigured towers. As such, the expected contrast of the segment is Weak. The
segment would run on existing right-of-way with reconfigured towers. As such, the expected
contrast of the segment is Weak. With an overall contrast of Weak and a landscape rating of
Low, the visual impact would likely be Low.
Overall Impact: Crossover Option 2 adds two segments of Low impact to the Crossover
Alternative. It does not change the overall rating of the alternative, but it does have a higher
overall impact because it adds segments to the main alternative without replace any segments.
However, the option includes the replacement of the Monahan Creek Substation with the Baxter
Road Substation, which has lower visual impacts. Crossover Option 2 is therefore preferred over
the Crossover Alternative and Crossover Option 1.
3.7.3 Crossover Option 3
Crossover Option 2 adds segments D and E to extend the transmission line from the site of the
proposed Monahan Creek Substation to the proposed Baxter Road Substation.
Segment D: Views of Segment D are expected to be screened by vegetation and topography. The
segment would likely be visible at the south end to the rural residents near Melton Road. The
segment would require new right-of-way, which would add to the contrast compared to existing
conditions; however, it is unlikely that the contrast would attract attention. The expected contrast
of the segment is Weak. With an overall contrast of Weak and a landscape rating of Low, the
visual impact would likely be Low.
Segment E: See Crossover Option 2, Segment E.
Overall Impact: Crossover Option 3 is similar to Crossover Option 2, except that Segment D
requires new right-of-way. Although the segment remains a Low impact, it would be slightly
higher impact than Crossover Option 2. However, it would be preferred over Crossover Option 1
and the Crossover Alternative due to the relocation of the substation.

Appendix E Visual Resource Report
I-5 Corridor Reinforcement Project Draft EIS 59 November 2012
The most preferable (lowest impact) option for the Crossover Alternative is Crossover Option 2,
followed by Crossover Option 3, the Crossover Alternative, and Crossover Option 1.
3.8 No Action Alternative
Under the No Action Alternative, visual conditions would continue as described in Section 2,
Affected Environment. Transmission lines in existing right-of-way would continue to be visible
by surrounding viewers. In areas without existing transmission lines, other visual alterations
would continue to occur, such as forestry, urban development, and transportation.

Appendix E Visual Resource Report
60 I-5 Corridor Reinforcement Project Draft EIS November 2012
4.0 Mitigation Measures
Standard mitigation measures to minimize impacts to visual quality include the following:
Use dulled towers to reduce light reflectivity and overall tower visibility.
Use non-reflective conductors and non-luminous, non-reflective insulators.
Place towers so that they would not be visible from nearby communities when
possible.
Site new towers near existing towers and use a similar tower type, where
possible. This would lessen visual clutter that can result when different types of
towers are visible in a vast open landscape.
Where feasible, site new towers to take advantage of existing screening offered
by topography and/or vegetation.
Set towers back from road crossings to minimize intrusion on views along road
corridors. Preserve existing vegetation along the roadway if possible to screen
the transmission lines and towers. Allow the growth of dense masses of medium
shrubs parallel to the roadway where the transmission line right-of-way crosses.
Minimize ground-disturbing activities and dispose of all waste soil off-site.
If wetlands would be disturbed, preserve the existing topsoil in wetland areas
near disturbed tower sites by stockpiling it during construction and spreading it
after construction so native plant communities would regenerate and blend with
the surroundings. Phase and integrate these activities with the project
construction schedule to ensure the quickest rehabilitation of sites.
Leave low-growing vegetation where possible.
Use techniques to re-vegetate cut and fill slopes on access roads and near tower
locations.
Minimize access road placement in highly sensitive areas.

Appendix E Visual Resource Report
I-5 Corridor Reinforcement Project Draft EIS 61 November 2012
5.0 Unavoidable Impacts
If all mitigation measures are employed, the transmission towers, vegetation clearing, access
roads and substations would still be visible from some locations. Towers of this size are
unavoidably visible from some locations, exposing certain viewers to changes in the visual
landscape. The visual impact of the West Alternative is considered Moderate to High, while the
impacts of the remaining alternatives are considered Low to Moderate. The higher impact rating
for the West Alternative is primarily due to the higher number of potential viewers.
Depending on the option selected, potential High visual impacts for the West, Crossover, and
Central alternatives could occur where the transmission lines run in close proximity to residential
neighborhoods, specifically in the area of the West Side Highway (Segment 4) and around NE
48th Circle (Segment 37).

Appendix E Visual Resource Report
62 I-5 Corridor Reinforcement Project Draft EIS November 2012
6.0 Cumulative Effects of the Project
Cumulative effects refer to environmental impacts that are additive or interactive (synergistic) in
nature and result from multiple activities over time, including the action alternatives. The U.S.
Council on Environmental Quality defines cumulative effects as "the impacts on the environment
that result from the incremental impact of the action when added to other past, present, and
reasonably foreseeable future actions regardless of what agency (federal or nonfederal) or person
undertakes such other actions."
The potential for cumulative effects on the visual resources that may result from this project
would be largely dependent on the extent of current and future urban and rural residential
development consistent with county development plans, and on current and proposed forest
harvesting operations.
Ongoing residential development will likely further encroach into what are now open spaces that
are generally considered to have intrinsic scenic value. Developments also introduce more
sensitive viewers to an area, which then can have the effect of increasing the perceived sensitivity
to changes in the landscape resulting in changes to the landscape rating. This may cause existing
and new developments to be received more negatively.
Forestry operations in the study area will continue into the future and are expected to continue to
have a similar effect on the visual resources as they do under the current conditions. Forest
management practices have generally improved in recent years in the area of visual impact and
aesthetics, and as such, this trend would likely result in a reduction of visual impacts from future
forest harvesting activities. The cumulative impact of the project with other existing and
approved developments would likely be low, as the character of the affected ecoregions is not
likely to change. The area encompassing the West Alternative would likely be subject to the
most potential impacts in terms of viewers, as residential developments increase in the
Portland/Vancouver Basin and open space is replaced by housing developments. With no major
reasonably foreseeable developments known for the ecoregions of the East, Central, and
Crossover alternatives, the cumulative impact for these alternatives would likely be low.

Appendix E Visual Resource Report
I-5 Corridor Reinforcement Project Draft EIS 63 November 2012
7.0 Federal, State, Local, and Permit
Requirements Review
Federal Regulations
The National Environmental Policy Act (NEPA) requires in 42 USC Section 4321 that all actions
sponsored, funded, permitted, or approved by federal agencies undergo planning to ensure that
environmental considerations such as those related to visual resources are given due weight in
decision-making. NEPA Section 101(b)(2) states that it is the “continuing responsibility of the
Federal Government to use all practicable means, consistent with other essential considerations”
to “ assure for all Americans safe, healthful, productive, and aesthetically and culturally pleasing
surroundings”.
State Regulations
There are no state visual resources regulations in Oregon or Washington that apply to this project.
The Washington State Environmental Policy Act (SEPA) considers visual resources as an
element of the environment in its EIS requirements. Agencies with review authority under SEPA
can prepare their own EIS or adopt a NEPA EIS for those projects that they feel require an EIS
under SEPA.
Local Regulations
There are no specific local regulations specific to visual resources that apply to this project. See
discussion on SEPA under State Regulations above.
Permit Requirements
There are no permits required with respect to visual resources.

Appendix E Visual Resource Report
64 I-5 Corridor Reinforcement Project Draft EIS November 2012
8.0 List of Preparers
Kevin Graham. GIS and Visualization Specialist. Visual Resources Task Lead and Author.
Peter Thiede. GIS and Visualization Specialist.

Appendix E Visual Resource Report
I-5 Corridor Reinforcement Project Draft EIS 65 November 2012
9.0 References
References
Horenstein, H., Hart, R., Gearty, T, Goldberg, V. 2001. Photography. Prentice Hall, Upper
Saddle River, NJ. Page 75
United States Department of the Interior (USDI). 1986a. Visual Resource Inventory. BLM
Manual Handbook H-8410-1. Bureau of Land Management, Washington, D.C. 7 pages.
United States Department of the Interior (USDI). 1986b. Visual Resource Contrast Rating.
BLM Manual Handbook H-8431. Bureau of Land Management, Washington, D.C.
United States Environmental Protection Agency (EPA). 2007. Level III Ecoregions of the
Conterminous United States. Western Ecology Division. Corvalis, OR.

Appendix E Visual Resource Report
66 I-5 Corridor Reinforcement Project Draft EIS November 2012
10.0 Acronyms and Glossary
Acronyms
BLM Bureau of Land Management
BPA Bonneville Power Administration
GIS Geographic Information System
I Interstate
kV kilovolt
NEPA National Environmental Policy Act
SEPA State Environmental Policy Act
USDI U.S. Department of the Interior
VNS Visual Nature Studio
VRM Visual Resource Management
WSU Washington State University
Glossary
cultural modifications – Any human-caused changes in the land form, water form, vegetation, or
the addition of a structure that create a visual contrast in the basic elements (form, line, color,
texture) of the naturalistic character of a landscape.
cumulative impacts – Impacts created by the incremental effect of an action when added to other
past, present, and reasonably foreseeable future actions.
double-circuit – Two separate electrical circuits (for alternating current, each circuit consists of
three separate conductors or bundles of conductors) on the same transmission towers.
foreground and middle-ground view – The area visible from a travel route, use area, or other
observation point to a distance of 3 to 5 miles. The outer boundary of this zone is defined as the
point where the texture and form of individual plants are no longer apparent in the landscape.
long-range view – The area visible from a travel route, use area, or other observation point to a
distance of greater than 5 miles. Also called the background distance zone.
right-of-way – An easement for a certain purpose over the land of another, such as a strip of land
used for a road, electric transmission line, pipeline, etc.
scenic quality– A rating of the overall appeal of a view that is categorized as High, Medium, or
Low, which is determined based on several key factors (BLM 1986). The key factors include
landform, vegetation, water, color, influence of adjacent scenery, scarcity, and cultural

Appendix E Visual Resource Report
I-5 Corridor Reinforcement Project Draft EIS 67 November 2012
modifications. With a maximum possible score of 32, values are totaled with results of 19 or
more ranked “High”, 12 to 18 ranked “Medium”, and 11 or less ranked “Low”.
sensitivity levels – In reference to visual resources, sensitivity is an evaluation of the viewer and
as a way of ranking public concern.
single-circuit – One electrical circuit that consists of three separate conductors or bundles of
conductors on one tower.
single-circuit tower – A tower that can support only one transmission line.

Appendix E Visual Resource Report
68 I-5 Corridor Reinforcement Project Draft EIS November 2012
Page intentionally left blank