ekxc ffe`kfi`e^ - oregon state...
TRANSCRIPT

Del
iver
ed b
y P
ublis
hing
Tec
hnol
ogy
to O
rego
n S
tate
Uni
vers
ity IP
128
193
164
203
on
Wed
09
Nov
201
1 18
53
57C
opyr
ight
(c)
Car
togr
aphy
and
Geo
grap
hic
Info
rmat
ion
Soc
iety
All
right
s re
serv
ed
Cartographic and Geometric Components of a GlobalSampling Design for Environmental Monitoring
Denis White A Jon Kimerling and W Scott Overton
ABSTRACT A comprehensive environmental monitoring program based on a sound statistical design isnecessary to provide estimates of the status of and changes or trends in the condition of ecological resourcesA sampling design based upon a systematic grid can adequately assess the condition of many types of resourcesand retain flexibility for addressing new issues as they arise The randomization of this grid requires that it beregular and retain equal-area cells when projected on the surface of the earth After review of existing approachesto constructing regular subdivisions of the earths surface we propose the development of the sampling grid onthe Lambert azimuthal equal~areamap projection of the earths surface to the face of a truncated icosahedron fitto the globe This geometric model has less deviation in area when subdivided as a spherical tessellation thanany of the spherical Platonic solids and less distortion in shape over the extent of a face when used for aprojection surface by the Lambert azimuthal projection A hexagon face of the truncated icosahedron covers theentire conterminous United States and can be decomposed into a triangular grid at an appropriate density forsampling The geometry of the triangular grid provides for varying the density and points on the grid can beaddressed in several ways
KEYWORDS global sampling design sampling grid map projections polyhedral tessellation truncatedicosahedron hierarchical grid geometry
Introduction
The health of the environment is an issue of globalnational regional and local concern Recent trendsin energy production and climate change for exam-
ple reemphasize the need for a wide-area focus in assess-ing the quality of the environment In this paper we firstdiscuss the salient aspects of a statistically designed envi-ronmental monitoring program that is responsive to theseconcerns Then we review and analyze several approachesto a global geometry that could be used to implement thestatistical design Finally we describe the properties of aregular sampling grid placed on the surface of an appro-priate global model
Environmental Monitoring to MeetMany Needs
The US Environmental Protection Agency (EPA) is re-sponding to a widely shared view that the United Statesneeds more comprehensive and sound knowledge of thestate of the environment by planning a long-term ecologicalmonitoring program (Messer Linthurst and Overton 1991)The goal of such a monitoring program is to assess gen-erally the health of the environment across the United States
Denis White is a research geographer with MET US Envi-ronmental Protection Agency Environmental Research Labora-tory 200 S W 35th Street Corvallis OR 97333 A Jon Kimerlingis professor of geography in the Department of Geosciences Or-egon State University Corvallis OR 97331 W Scott Overtonis professor of statistics in the Department of Statistics OregonState University Corvallis OR 97331
and other parts of North America and possibly the entireglobe The program will be based upon a comprehensivestatistical design in order to obtain sound estimates of thestatus of and trends in the condition of the environmentwith known degrees of confidence
Developing the monitoring program requires a designthat can sample any spatially distributed and identifiableecological resource (such as types of forests lakes andstreams wetlands estuaries deserts and grasslands andagricultural ecosystems) without having an explicit sam-pling frame available as there would be in a conventional
sampling design for a single resource The design shouldlead to explicit probability samples for well-defined popu-lations of resources but also be flexible to accommodatethe sampling of many different kinds of ecological re-sources and emerging kinds of environmental stresses
Specific objectives of the monitoring program for indi-vidual ecological resource types are the description of thestatus and changes or trends in status of various biolog-ical chemical and physical indicators of its health for broadregions of the United States An important additional ob-jective is determining the association among indicators ofsources of environmental stress exposure to stress andbiological response to stress This objective prescribes somedegree of coincidence in sampling in space and time
Statistical Design StrategyThe design strategy chosen to meet these objectives is basedupon a grid of points at which each ecological resource typewill be sampled The neighborhood of each point will becharacterized by ecological and land-use criteria A collec-tion of sampling units of each resource type in the neigh-
Cartography and Geographic Information Systems Vol 19 No1 1992 pp 5-22
Del
iver
ed b
y P
ublis
hing
Tec
hnol
ogy
to O
rego
n S
tate
Uni
vers
ity IP
128
193
164
203
on
Wed
09
Nov
201
1 18
53
57C
opyr
ight
(c)
Car
togr
aphy
and
Geo
grap
hic
Info
rmat
ion
Soc
iety
All
right
s re
serv
ed
borhood of each point will constitute a Tier 1 sample to beused to estimate the structural properties of the regionaland national populations of these types The structuralproperties include the numbers of resource units their sur-face area linear dimension shape landscape pattern andother geometric or geophysical measures obtainable fromremotely sensed imagery A subsample of this Tier 1 sam-ple will be used for field sampling of other attributes of theresources This double sample (Cochran 1977)will consti-tute Tier 2 of the design Field measurements will includefor example chemical analyses of water samples visualsymptoms of foliage damage to forests species composi-tion of wetlands and other indicators of environmentalwell-being
The efficient statistical properties of estimates made fromthe double sample derive in large part from the extensive-ness of the Tier 1 sample and the relevance of the infor-mation in the data on that sample to the data in the doublesample But a major advantage of this design strategy isthat the Tier 1 characterization of areas around the gridpoints is not restricted to the ~esources identified a prioriOther resources may be sampled at a later time in responseto a new issue regarding their health The primary designdevice to implement this adaptive capability is the samplinggrid
Rationale for Cartographic and GeometricProperties of Design
The program objectives and design strategy lead to a set ofcriteria for the cartographic and geometric properties of thedesign The specification of a probability sample requiresthat the sampling grid be positioned randomly The moststraightforward randomization is by a single random trans-lation of the grid in a plane followed by the projection ofthe randomized grid onto the earths surface An equal-area map projection is required to preserve the samplingprobabilities The equal-area property also assures that anyfixed-size area has the same probability of being sampledregardless of its location
Thus a regular systematic grid of sampling points in theplane of an equal-area map projection best achieves therandomization and equal-area criteria Additional criteriaare that the grid provide compact areas within which toselect sampling units and that it not be aligned with anyregularly spaced cultural or physical landscape featuresAlso methods for enhancing the density of the grid in aregular hierarchical pattern are useful for increased sam-pling of rare ecological resources and methods for reduc-ing the density are useful for implementing regular cyclicalsampling in time Finally we want a grid system that canconveniently cover the conterminous United States and beextended to other parts of the country and potentially toother parts of the world
Projecting from the earths surface to a plane results inarea or shape distortion or both Over large areas of theearth the magnitudes of these distortions can become quitelarge Therefore it is important to select anmiddot appropriatelysized and shaped piece of the earth on which to implementthe sampling grid We review below a number of ap-proaches to this problem Sincewe have specified an equal-
6
area map projection the primary concern is with shape (orscale) distortion across the projection surface However itis also useful to review and analyze area distortions in oth-erwise attractive approaches
Global Framework
Review of Alternative GeometriesA number of approaches to subdividing the surface of theearth in a regular way for large area or global data analysishave been suggested The approaches can be classified asmap-projection approaches polyhedral tessellations andadaptive subdivision systems
Map-Projection Approaches Existing map-projection co-ordinate systems provide potential frameworks for subdi-vision Tobler and Chen (1986) proposed the Lambertcylindrical equal-area projection as the basis for a quadtree(Samet 1984)referencing and storage system Their solutionattempts to satisfy several principles regular hierarchicaldata structuring easy conversion to other systems directrelation to latitude and longitude and equal-area subdivi-sions This is achieved by first representing the earth inLamberts cylindrical projection then transforming the rec-tangular representation derived from the cylindrical pro-jection into a square by an area preserving quadrature andfinally placing a square grid upon the result The verticalgrid lines of this system are meridians spaced at regularintervals and the horizontal grid lines are parallels spacedproportional to the sine function While meeting the au-thors requirements this system has one major disadvan-tage for our application the variation in shape of thesubdivision cells on the earth from nearly square at theequator to acute isosceles triangles at the poles
Mark and Lauzon (1985) proposed an addressing andstorage system based upon the Universal Transverse Mer-cator (UTM)coordinate system They propose to divide the60UTMzones into north to south subzones that are squarein the projection plane (Depending upon the ultimate cellsize of the data base division into east-west subzones mightalso be necessary) Each subzone is then further subdividedinto a regular square grid of patches and each patch intoa square grid of cells for data storage Patch and cell ad-dresses can then be implemented as linear quad tree ad-dresses convenient for computer representation For ouruse the UTM-based system has the major disadvantage ofnot representing the earths surface in equal-area pieces Italso has major discontinuitiesin the polar regions and lesserdiscontinuities at the edges of the zones
Polyhedral Tessellations Another set of approaches tosubdividing the world uses knowledge of three-dimen-sional geometry first developed in ancient Greece The Pla-tonic solids are the five regular polyhedra the tetrahedronhexahedron (cube) octahedron dodecahedron and ico-sahedron (Coxeter 1948 Pearce and Pearce 1978) Thesesolids can be inscribed in a sphere as the basis of a worldsubdivision system Dutton (1989) for example has pro-posed using an octahedron as the basis for a system calleda quaternary triangular mesh (QTM) The octahedron is
Cartography and Geographic Information Systems
Del
iver
ed b
y P
ublis
hing
Tec
hnol
ogy
to O
rego
n S
tate
Uni
vers
ity IP
128
193
164
203
on
Wed
09
Nov
201
1 18
53
57C
opyr
ight
(c)
Car
togr
aphy
and
Geo
grap
hic
Info
rmat
ion
Soc
iety
All
right
s re
serv
ed
initially aligned with the cardinal points of the latitude andlongitude coordinate system that is the six vertices areplaced at the poles and along the equator at 0 90 - 90and 180 degrees of longitude Each triangular face of theoctahedron is then recursively subdivided into four subtri-angles by placing vertices at the midpoints of the edgesuntil the size of the faces or the distance between verticesis small enough to resolve the features of interest Duttoncalculates that I-meter resolution is obtained after 21 levelsof decomposition A variation on QTM proposed by Good-child and Shiren (1989)uses a different numbering systemfor the four subtriangles at any level and provides astraightforward conversion between latitude and longitudeand the QTM coordinate system The QTM systems likeUTM do not subdivide into equal-area cells and thus arenot suitable for a sampling design specifying the equal-areaproperty
The dodecahedron has been used by Wickman Elversand Edvarson (1974) for creating a global sampling net-work They initially subdivide each pentagon of the do-decahedron into five isosceles spherical triangles and thenrecursively subdivide these triangles into four pseudo-tri-angles An equal-area subdivision is obtained by connect-ing edge midpoints with two equal-length great circle arcsjoined at a vertex slightly displaced from the single greatcircle arc connecting the midpoints so as to create equalareas The polygons created are four- and six-sided figuresclose to triangular in shape Thus this system maintainsthe equal-area property on the sphere The primary dis-advantage for our application is the small irregularities inshape which prevent the use of a simple randomizationscheme
Fekete (1990)has used the icosahedron as a model forrepresenting data distributions on the sphere Single-val-ued spherical surfaces are modeled as triangles whose ver-tices are projected onto the sphere The model is initiatedwith the vertices of the icosahedron and recursively sub-divided as in the QTM models until the error in represent-ing the surface values (not necessarily in resolving location)is below a prescribed minimum The fourfold recursivesubdivision allows an adaptation of the planar quad treecalled the sphere quadtree for data storage and address-ing As with QTM the icosahedral tessellation with recur-sive triangular subdivisiondoes not produce equal-areacellsthough the area and shape variation is less than that pro-duced by the octahedral tessellation (see the followinganalysis)
Adaptive Subdivision Systems The two preceding ap-proaches are based upon regular decompositions of mapprojections of the earth to a plane or upon decompositionsof regular polyhedra fit to the earth or upon a hybrid ofthese An alternative approach starts with a given patternof objects on the earth and tessellates a surface of arealunits based upon some property Lukatela (1987)describesa system for creating the Dirichlet network on a spheroidThe Dirichlet network is also known as the Voronoi orThiessen network (Upton and Fingleton 1985) This net-work separates the spheroid into polygons whose loci areall points closest to the set of original points that definedthe network The only sets of points known to result in
Cartography and Geographic Information Systems
perfect equal-area Dirichlet tessellations are the centers ofthe faces of the respective Platonic solids fit to the sphere(Coxeter 1969) Lukatela has described (personal commu-nication) for example a decomposition starting with thevertices ofmiddota dodecahedron and creating the next level ofDirichlettessellationfrom the vertices of the preceding levelOnly at the level of the original dodecahedron does thisapproach have regular size and shape cells
Two previous studies have considered respacing paral-lels and meridians to obtain equal-area cells on the sphere(or spheroid) Bailey (1956)contrasted the two cases of res-pacing only the parallels or only the meridians Paul (1973)investigated several cases of combining both While obtain-ing an equal-area subdivision on the sphere these gridsystems do not provide for an equal-area regular grid inthe plane except within a cell Furthermore the cellsarequadrilateral and therefore less compact than some othershapes Another possible adaptive approach not exploredin the literature to our knowledge is (quadratic) optimi-zation applied to a sphere Our problem stated in the lan-guage of optimization is the placement of an arbitrarynumber of cells on the sphere with an objective functionspecifying equality of area and compactness of shapeEquality of area could alternatively be specified as aconstraint
A New Approach and RationaleBased upon our survey of existing proposals for global sub-division systems we conclude that none meet all of theobjectives of equal area equal and compactly shaped sub-divisions with minimal scale distortion and a hierarchicalstructure for enhancement and reduction We also regardexisting map projections optimized for coverage of specificareas such as the standard Albers equal-area conic projec-tion configured for the United States to be appropriate forthose specific areas but difficult to extend elsewhereTherefore we propose a new system based upon an equal-area map projectiol1-onto plates of a semiregular (or Ar-chimedean) polyhedron but with possible adaptations forrepositioning the polyhedron to best fit different parts ofthe earth or for covering large or noncompactly shapedareas of interest This system uses the truncated icosahed-ron a 32-face polyhedron with 20 hexagons and 12 pen-tagons arranged in a five-way symmetry about a centralaxis connecting two pentagons This solid achieves the bestcompromise among the regular and semiregular polyhedrain meeting the following objectives faces large enough tocover significant subcontinents (such as central NorthAmerica including the conterminous United States) facessmall enough to keep scale distortions in map projectionsto about 2 percent compact and similar face shapes (hex-agon and pentagon) andsome degree of familiarity (thepattern often used to construct soccerballs) The systematicsampling grid can then be defined as a regular decompo-sition of the grid formed by the vertices and center of ahexagon of this model The map projection we propose isthe Lambert azimuthal equal-area projection with a tangentplane We support our proposal with an analysis of thespherical tessellations of regular polyhedra and alterna-tively map projections upon the faces of these polyhedraWe similarly analyze the truncated icosahedron
7
Del
iver
ed b
y P
ublis
hing
Tec
hnol
ogy
to O
rego
n S
tate
Uni
vers
ity IP
128
193
164
203
on
Wed
09
Nov
201
1 18
53
57C
opyr
ight
(c)
Car
togr
aphy
and
Geo
grap
hic
Info
rmat
ion
Soc
iety
All
right
s re
serv
ed
hexahecton (atle)
Figure 1 The five regular polyhedra or Platonic solids
Table 1 Geometric characteristics of the Platonic solids
tetrahedron hexahedron octahedron dodecahedron icosahedron
face polygon triangle square triangle pentagon triangle
number of faces 4 6 8 12 20number of edges 6 12 12 30 30number of vertices 4 8 6 20 12proportion of total 114 116 18 1112 1120area in each face
Analysis of Spherical Tessellations of Regular PolyhedraThe five regular or Platonic polyhedra are shown in Figure1 and listed with their properties in Table 1 A circumscrib-ing sphere can be made to touch all vertices of each poly-hedron and polyhedron edges can be thought of as chordsof circles that can be projected onto the sphere as great-circle segments called geodesic lines These geodesic linesform the edges of spherical triangles squares or pentagonsthat completely cover the sphere and are regular in thesense that all sides and interior angles are equal (Figure 2)The area of each spherical polygon relative to the entiresphere will be the same as in the Platonic solid for exam-ple each spherical triangle projected from an icosahedronwill cover 120 of the spheres surface area Vertices ofspherical polygons with these characteristics are equallyspaced and hence provide an ideal set of starting points
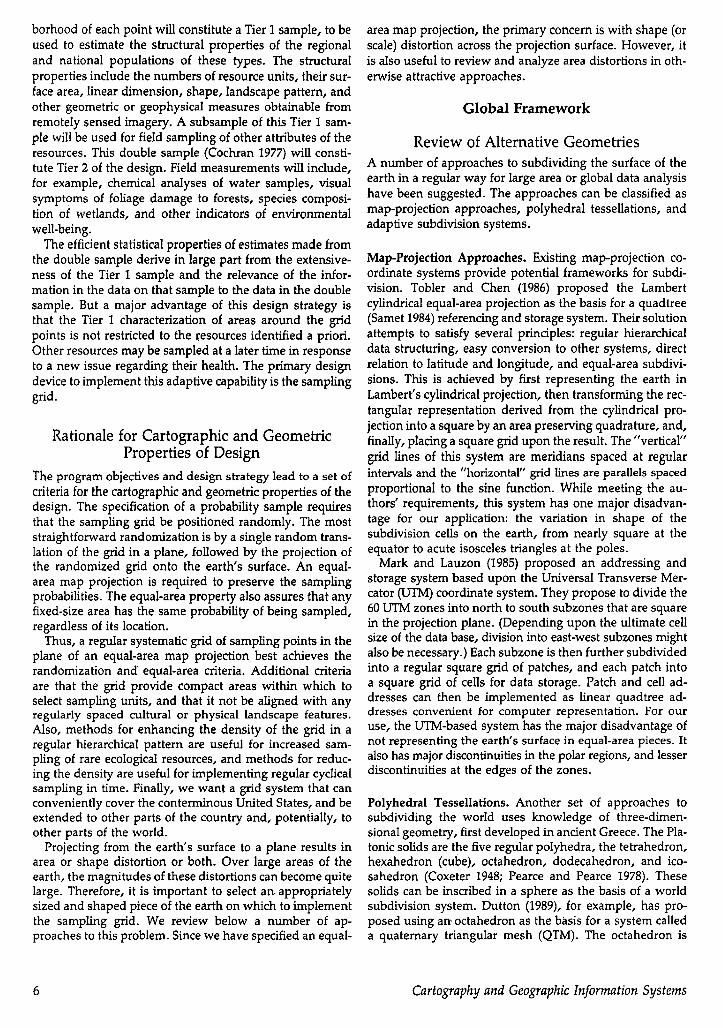
for subdividing the globe further Figure 3 portrays one faceof each spherical tessellation using the Lambert azimuthalprojection
Since further subdivision of any of these five sphericalpolyhedra will produce spherical polygons unequal in sizeor shape or both the question of which polyhedron pro-duces the least overall size and shape distortion is of con-siderable interest Distortions in size and shape can bestudied by subdividing a spherical face of each polyhedronin the same manner and comparing the areas and interiorangles of the smaller polygons formed It helps if all pol-ygons are of the same degree which suggests triangulatingthe faces into a network similar to themiddot triangular networksthat comprise geodesic domes (Popko 1968)
The most popular method of triangle subdivision in geo-desic construction is called the alternate method (Gasson
tetrahedron
Figure 2 The spherical tessellations of the five regular polyhedra
8 Cartography and Geographic Information Systems
Del
iver
ed b
y P
ublis
hing
Tec
hnol
ogy
to O
rego
n S
tate
Uni
vers
ity IP
128
193
164
203
on
Wed
09
Nov
201
1 18
53
57C
opyr
ight
(c)
Car
togr
aphy
and
Geo
grap
hic
Info
rmat
ion
Soc
iety
All
right
s re
serv
ed
tetrahedron hexaheaon (obl) tetrahedron
tnrcated ~icosahedron - bullbullbullbullbullbullhexagon pentagon
Figure 4 The two- and four-frequency subdivision of oneface of each spherical tessellation
~
( ~ ~
- - -I ---
-~-- --
tnnated tnnatedicosahedron Icosahoctcnhexagon pentagon
Figure 3 One face of each spherical tessellation with a 15deglatitude 30deg longitude geodetic grid
1983) and can be applied directly to the geodesic edge linesfor each different spherical triangle In the alternate methodfour new triangles are constructed by creating vertices atthe midpoint of each edge of the parent triangle In thegeodesic field this is called a two-frequency subdivisi~nof a triangle Performing this quartering procedure agamproduces a four-frequency subdivision
The two- and four-frequency subdivisions of the spher-ical polyhedra are shown in Figure 4 Cube and dode~a-hedron faces must be first subdivided into four and fivetriangles respectively that are identical in size and shapebut have only two equal interior angles Tetrahedron oc-tahedron and icosahedron faces are triangular and thefaces for each are identical in size and shape and havethree identical interior angles The areas and interior anglesof these two- and four-frequency triangles onthe spherecannot all be equal and the deviation in area and interiorangles can be determined through spherical trigon~metI
The deviations in spherical triangle areas are gIVen mTable 2 as percentages of the average area for two- andfour-frequency subdivisions of each polyhedron Remem-bering that the spherical cube and dodecahedron faces havebeen initially divided into four and five triangles of equalsize and shape respectively the numbers demonstrate thatarea differences among triangles generally decrease in pro-portion to the area of the starting triangle reaching a dif-ference of zero for infinitely small initial triangles Averagedeviations in area also appear to be the same for the two-and four-frequency data prompting a conjecture that the
amount of deviation is independent of subdivision fre-quency The range of area deviation is approximately threetimes the average deviation for all two-frequency subdivi-sions and four-frequency subdivisions have a wider de-viation range than the two-frequency Further investigationis needed to determine if the deviation range approachesa maximum limit with increasing subdivision
The area deviation data point out the benefits of usingsmall initial triangles as the starting point for defining sam-ple points as the vertices of triangles formed by successivequartering It is also desirable to have sample points froma network of similarly shaped spherical triangles consid-ering that an initial equilateral triangle network cannot beobtained except from the spherical tessellations of the tet-rahedron octahedron and icosahedron
One measure of similarity is the deviation of triangle in-terior angles from those of an equilateral triangle of thesame surface area This measure can be extended to alltriangles in a two- or four-frequency subdivision giving theaverage interior angle deviations and deviation ranges listedin Table 2 The icosahedron and dodecahedron subdivi-sions clearly deviate the least from the equilateral ideal Theaverage deviation appears to be stable with increasing sub-division frequencies and the deviation range should slowlyincrease to a maximum of 30 percent for both This is pri-marily due to the starting triangles being small in area andclose to equilateral in both cases
Truncated Icosahedron Tessellation Subdividing the ico-
Cartography and Geographic Information Systems 9
Del
iver
ed b
y P
ublis
hing
Tec
hnol
ogy
to O
rego
n S
tate
Uni
vers
ity IP
128
193
164
203
on
Wed
09
Nov
201
1 18
53
57C
opyr
ight
(c)
Car
togr
aphy
and
Geo
grap
hic
Info
rmat
ion
Soc
iety
All
right
s re
serv
ed
Table 2 Deviation in area and interior angles for two- and four-frequency subdivisions of the initial spherical trianglesfrom the Platonic solids
tetmhedron hexahedron octahedron dodecahedron icosahedron
~ ~ ~ ~ ~ iml ~ fIN ~ ~
avg triangle area 625 156 104 026 3125 078 0417 0104 125 0312( of sphere)
avg deviation 500 500 632 665 2019 2019 234 234 725 725( of avg A area)
deviation range 1330 22693 2217 2846 5384 7754 715 91 1933 2564( of avg A area)
avg interior angle 750 6375 625 60625 675 61875 610 6025 630 6075(degrees)
avg deviation 400 4046 1912 1914 1891 194 836 837 734 784( of avg int angle)
deviation range 1000 13643 6657 7286 5224 6906 271l 2906 2178 279( of avg int angle)
sahedron and dodecahedron using the alternate methodwill produce sample points at vertices of spherical trianglesthat are approXimately equal in size and shape but themaximum deviations are unacceptably large for many sam-pling systems Minimizing these deviations requires smallerhexagonally shaped faces so that nearly equilateral trian-gles are formed when the hexagon is triangulated Suchhexagons are a characteristic of the semiregular polyhedroncalled the truncated icosahedron one of the 14 Archime-dean solids (13 discovered in ancient Greece the 14th inthe 20th century [Lyusternik 1963]) These solids have con-gruent vertices and regular polygons as faces but may havemore than one kind of regular polygon The truncated ico-sahedron (Figure 5) can be conceptualized as an icosahed-ron with each of the 12 vertices truncated to form apentagon leaving 20 hexagons in the remainder of the 20original triangular faces There is only one size of trunca-tion that creates precisely regular pentagons and hexagonsfrom the icosahedron As with the Platonic polyhedra acircumscribing sphere can be fit to the 60 truncated icosa-hedron vertices and the 90 edges can be projected onto
Figure 5 The truncated icosahedron as polyhedron and asspherical tessellation
10
the sphere to form the soccer ball pattern as seen inFigure 5 for the globe
The hexagon of this model is 667 percent of the area ofan icosahedron triangle but 718 percent of a spherical ico-sahedral triangle The total area of the pieces of the threepentagons in one triangle is correspondingly reduced from333 percent to 282 percent of the icosahedral triangle Onthe globe the hexagon is large enough to cover the con-terminous 48 states of the United States plus southernCanada and northern MeXico The truncated icosahedronhexagon is therefore an excellent starting point for a large-area triangular sampling grid
The favorable geometric properties of the hexagonal facescan be seen in Figure 4 which shows a two- and four-frequency subdivision into what appear to be equilateralspherical triangles This is a slight misperception since thesetriangles do deviate slightly in area and shape as sum-marized in Table 3 The average deviation of less than 1percent is a threefold improvement over the dodecahedronsubdivision and the improvement in the deviation rangeis even better As with the spherical Platonic solids theaverage deviation app~ars constant with increased subdi-vision frequencies and the deviation range increasesgradually
Even more striking is the nearly fivefold decrease in theaverage deviation in interior angles relative to the icosa-hedron coupled with a threefold to fourfold decrease inthe deviation range This translates to angles ranging fromapproXimately 58 to 62 degrees for the four-frequency sub-division The deviation range increases little with furthersubdivision and reaches a maXimum of 713 percent as thespherical triangles become geometrically indistinguishablefrom plane triangles The vertices of these triangles are likely
Cartography and Geographic Information Systems
Del
iver
ed b
y P
ublis
hing
Tec
hnol
ogy
to O
rego
n S
tate
Uni
vers
ity IP
128
193
164
203
on
Wed
09
Nov
201
1 18
53
57C
opyr
ight
(c)
Car
togr
aphy
and
Geo
grap
hic
Info
rmat
ion
Soc
iety
All
right
s re
serv
ed
Table 3 Deviation in area and interior angles for two- and four-frequency subdivisions of the initial spherical trianglesfrom the hexagons and pentagons of the truncated icosahedron
hexagon triangles pentagon triangles
2 freo 4 freq 2 freq 4 freo
average triangle area 01496 00374 01174 002935( of sphere)
average deviation 082 082 066 067( of avg ~ area)
deviation range 222 279 220 250( of avg 11 area)
average interior angle 60359 600898 602818 6007045(degrees)
average deviation 156 156 1187 1187( of avg int angle)
deviation range 621 691 2917 2979( ofavg int angle)
to be the closest to an equal area equal-shape samplinggrid based on recursively subdividing the sphere acrossareas the size of the conterminous United States
A global sampling system based on the truncated icosa-hedron will have 282 percent of the earths surface fallingwithin the 12 pentagons Each pentagon can be dividedinto five identical spherical isosceles triangles (Figure 4)each of which can be further partitioned into two- four-and higher-frequency subdivisions using the alternatemethod As seen in Table 3 both the average deviation andthe deviation range in the areas of the two- and four-fre-quency triangles are slightly less than the correspondingtriangles from the subdivision of the spherical hexagonSince each of these five triangles is 785 percent of the areaof a triangle in the initial division of the spherical hexagonsubdividing in this manner gives triangles 215 percentsmaller on average than those in the same frequency sub-division of the hexagon triangles
The average interior angle is also closer to 60 degrees forthe pentagon subdivision but the angular deviation anddeviation range is far greater than for the hexagon This isdue to the pentagon triangles not being equilateral butrather nearly the shape of a 72-54-54 degree plane isoscelestriangle Deviation within the individual angles is smallhowever since the maximum range for the larger angle willbe from 701 to 720 degrees and for the two smaller anglesfrom 540 to 5569 degrees These values represent the limitof these angles with increasing subdivision
Map-Projection Surface Tessellation of Polyhedral Faces Ahigh-frequency subdivision of a truncated icosahedron faceproduces a triangular sampling grid defined by spherical
Cartography and Geographic Information Systems
triangles nearly equal in area and shape However thisapproach suffers in that all triangles differ slightly andtheir vertices and distortion characteristics become tediousto compute as the triangular network density is increasedto thousands of faces
A map-projection surface tessellation is another possi-bility~ Here the polyhedron faces on the sphere are trans-formed into a planar map-projection surface upon whicha grid of equilateral triangle vertices can be plotted andretransformed into latitude and longitude positions on thesphere or spheroid The advantages to this approach areseveral including the ability to project onto an equal-areamap-projection surface so that equilateral triangles on theprojection surface define equal-area triangles on the sphereor spheroid This is accomplished in the map-projectionequations by differentially distorting the map scale alongthe parallels and meridians so that identical equilateral tri-angles on the projection surface define triangles of equalarea but continuously varying shape on the globe Theadvantage over directly subdividing the sphere is that theshape distortion is gradual and can be computed easily forevery sample point as can the geographic coordinates
Equal-area map projections of Platonic solids and trun-cated icosahedron faces are illustrated in Figure 6 TheLambert azimuthal equal-area map projection was usedthroughout because shape distortion is the same along anycircle of a given radius from the projection center If thepolyhedral face center is made the projection center shapedistortion will vary in a circular pattern away from the cen-ter and a projection surface with a minimal range in shapedistortion will result due to the symmetry in each poly-hedron face This projection produces the shape distortion
11
Del
iver
ed b
y P
ublis
hing
Tec
hnol
ogy
to O
rego
n S
tate
Uni
vers
ity IP
128
193
164
203
on
Wed
09
Nov
201
1 18
53
57C
opyr
ight
(c)
Car
togr
aphy
and
Geo
grap
hic
Info
rmat
ion
Soc
iety
All
right
s re
serv
ed
k bullbullbull 225 bullbulllila
tetrahedron
k = 126bullbullbullbullbullbull
k = 126--
hexahedron (OJbe)
octahedron
k = 56mill
dodecahedron
k bullbullbull 56IIlIlI
icosahedron
truncatedicosahedronhexagon
k= 16
truncatedicosahedronpentagon
Figure 6 The I-percent scale distortion contours from the Lambert azimuthal equal-area projection of one face of eachspherical tessellation
12 Cartography and Geographic Information Systems
Del
iver
ed b
y P
ublis
hing
Tec
hnol
ogy
to O
rego
n S
tate
Uni
vers
ity IP
128
193
164
203
on
Wed
09
Nov
201
1 18
53
57C
opyr
ight
(c)
Car
togr
aphy
and
Geo
grap
hic
Info
rmat
ion
Soc
iety
All
right
s re
serv
ed
indicated by the concentric circles in Figure 6 These circlesare the contours of distortion along the parallel (k distor-tion) in 1 percent increments
These distortion maps show the expected decreases inshape distortion with decreasing face sizes The map-pro-jection surface for the tetrahedron spherical face has thegreatest distortion with the map scale along the parallel atthe farthest face edge being more than 22 percent largerthan the scale at the face center In an equal-area projectionthe map scale along a meridian (h distortion) at a face edgemust then be 18-plus percent smaller (h = 11k = 11225)than at the zero-distortion face center The maximum shapedistortion is less on the projected faces of the cube andoctahedron and still less on the projections of the dode-cahedron and icosahedron faces Because of its small sizeand roughly circular shape the truncated icosahedron hex-agon face has the lowest maximum distortion of all thesefigures Here the map scale at the farthest face edge is amaximum of 22 percent larger along the parallel and 22percent smaller along the meridian The conterminous UnitedStates easily falls within the 2 percent scale distortion circle
The difference between determining sample points byrecursive subdivision of spherical polyhedra faces and bysubdivision of equilateral triangles on an equal-area mapprojection of the spherical faces can now be stated moreclearly Direct subdivision of the spherical face produces anetwork of sample points that is nearly regular in the areaand shape of the triangles that define the point locationsThe triangles are however slightly different in area andshape with some being close to the equilateral ideal andothers deviating significantly The triangles defined on theLambert projection on the other hand are equal in areaand represent equal-area spherical triangles on the globeThe shape distortion introduced by the Lambert equal-areamap projection is systematic easy to compute and smallerin range than the distortion introduced by recursive sub-division directly on the sphere
A similar subdivision procedure will create a grid of eversmaller 72-54-54 degree isosceles triangles on each penta-gon face These will be 205 percent smaller in area thanhexagon triangles for the same subdivision frequency Fig-ure 6 shows a maximum scale distortion at each edge vertexof 16 percent along the parallel The 06 percent differencein maximum scale distortion on the pentagon and hexagonfaces is due to the polyhedron being slightly modified tocircumscribe the globe This means that the center of eachhexagon and pentagon touches the globe but the distancebetween the globe center and hexagon edge vertex on theprojection surface is 265 percent longer than for the samevertex on the adjacent pentagon projection surface Theformulas for the Lambert projection transform this differ-ence in distance to 06 percent meaning that the (x y)projection coordinates for each pentagon must be multi-plied by a 1006 scaling constant if the distance betweentwo edge vertices on the projection is to match the distancebetween the same two vertices on the hexagon projectionThis small-scale enlargement required for creation of per-fectly matching polyhedron vertices must be taken into ac-count when computing the areas of triangles on the pentagonface
Cartography and Geographic Information Systems
Interfaces Between Adjacent Facesand Pentagon Grids
The Lambert azimuthal map projection transforms verticesof a spherical hexagon and pentagon into vertices of regularhexagons and pentagons on the projection plane The geo-desic lines between vertices that bound each spherical poly-gon are not projected as straight lines but rather as slightcurves bowing outward from the projection center Thiscomplicates the generation of sample points on the projec-tion surface since regular hexagons and pentagons on theplane are required for p~ints to be vertices of triangles ofequal area and shape These can be created only by equallyspacing a row of sample points along each edge of a planarregular hexagon or pentagon according to the desired sam-pling density
This procedure introduces the problem of how to setsample points within the slivers created between the planarpolygon edges and the slightly bowed spherical polygonedges These slivers are narrow (362 km and 285 km max-imum widths for the hexagon and pentagon edges re-spectively) meaning that lune-like slivers with maximumwidths of 724 and 647 km respectively are formed be-tween hexagon-hexagon and hexagon-pentagon edges
One solution is to place additional points in the sliverbetween two adjacent sampling grids One method for thisis to extend the triangular grid from one of the two adjacenthexagons into the sliver clipping to the sliver boundaryFigure 7a is a schematic illustration of how the sliver (greatlyexaggerated in width) appears in the Lambert projectionwith two hexagons meeting in a straight line and the greatcircle dividing the sliver projected as an arc into the op-
bullFigure 7 Spherical slivers between plane hexagons in theLambert azimuthal and gnomonic projections (exaggeratedin width for illustration purposes) (a) Top A randomizedgrid across two adjacent hexagons each shown in the Lammiddotbert azimuthal projection Each hexagons portion of thesliver is shown as a halfmiddotlune from the straight hex edge tothe great circle arc separating the hexagons The great-circlearc between the hexagons thus appears twice (b) BottomA randomized grid across two adjacent hexagons in thegnomonic projection The great-circle arc between the hex-agons is shown in a thin line Sample points from eachhexagon are extended by one row into the sliver
13
Del
iver
ed b
y P
ublis
hing
Tec
hnol
ogy
to O
rego
n S
tate
Uni
vers
ity IP
128
193
164
203
on
Wed
09
Nov
201
1 18
53
57C
opyr
ight
(c)
Car
togr
aphy
and
Geo
grap
hic
Info
rmat
ion
Soc
iety
All
right
s re
serv
ed
posite hexagon Figure 7b illustrates the situation in a gno-monic projection which represents the great circlebetweentwo hexagon vertices as a straight line and the hexagonedges as arcs The interface between a hexagon and a pen-tagon can be handled in a similar way
A more elegant solution is to unbow each edge of theprojected spherical polygon by modifying the map-projec-tion equations to produce regular hexagons and pentagonsJohn Snyder (1991)has very recently devised such a pro-jection to be called the Equal-Area Polyhedral ProjectionAfter deriving this projection he found that Irving Fisherhad used the same concept in a design for the icosahedronreported as a footnote in Bradley (1946)but Snyder hascarried the derivation further to include other polyhedrainverse formulas and distortion analysis Snyders idea isbest understood by examining one of the six equilateraltriangles forming a pole-centered hexagon (Figure 8) Thescale in the meridional direction has been progressivelyreduced from the edge to the center of the triangle baseThis reduction allows the geographic coordinates of posi-tions along the great-circle triangle base to be projected toa straight line eliminatingthe sliversbetween adjacent facesThe projection is made equal area by adjusting the spacingof meridians from the edge to center of the triangle re-sulting in a maximum angular deformation of 375 degreesand a maximum scale distortion of 33 percent Since thisis done for the six hexagon edges all hexagon-to-hexagonedges will match exactly The Equal-Area Polyhedral Pro-jection can also be applied to the five isosceles triangles
Lambert Azimuthal
Equal Area Projection
NP
composing each pentagon Pentagon-hexagon edges matchto within 1 part in 105 of the length of a side
The placement of a grid on a pentagon of a truncatedicosahedron introduces additional issues An equilateraltriangular grid cannot include the vertices of a pentagonOne solution is to divide the equal-area projected surfaceof the pentagon into five isosceles triangles and subdividethese into congruent triangles such that the spacing be-tween points and areas of the triangles are close to thoseof the equilateral triangles of the hexagon grid (Figure 9a)A second possibility is to extend the five adjacent hexagongrids into the adjoining triangle of the pentagon or ineffect to use the icosahedron as the model solid (Figures9b and 9c) As shown above this sacrifices the low distor-tion characteristics that can be achieved on the projectedhexagons and pentagons of the truncated icosahedron
Advantages and Disadvantages of DifferentGlobal Configurations
For the application of this global tessellation to a samplingnetwork for the conterminous United States we have po-sitioned the solid such that one hexagon covers all of theland area in the conterminous states and nearby coastalwaters and such that a neighboring hexagon covers all ofAlaska except the end of the Aleutian chain of islands(Figure 10)Also note that the Hawaiian Islands fall withina third hexagon In placing the truncated icosahedron tooptimize the coverage of central North America with a sin-gle hexagon other parts of the world may naturally be less
Equal Area
Polyhedral Projection
NP
Straight Line Drawn BetweenHexagon Vertices as StartingLine for Triangular Sampling
Curved Great Circleat Hexagon Edge
Straight Great Circle Lineat Hexagon Edge
Figure 8 The Lambert Azimuthal Equal-Area and the Equal-Area Polyhedral (designed by John Snyder) map projectionsof one-sixth of a truncated icosahedron hexagon centered on the North Pole
14 Cartography and Geographic Information Systems
Del
iver
ed b
y P
ublis
hing
Tec
hnol
ogy
to O
rego
n S
tate
Uni
vers
ity IP
128
193
164
203
on
Wed
09
Nov
201
1 18
53
57C
opyr
ight
(c)
Car
togr
aphy
and
Geo
grap
hic
Info
rmat
ion
Soc
iety
All
right
s re
serv
ed
Implementing a Sampling Grid in the Planeof a Truncated Icosahedron Hexagon
dinate system is known And the incorporation of data fromdifferent sampling designs into global or continental scaleecological or geophysical models is likewise not limited bydifferent sampling geometries since data can be placed intoa common georeferencing system either as aggregate pop-ulation estimates or as individual sampling observationswhose location coordinates are converted to a commonsystem
Extending the configuration for good coverage of centralNorth America Alaska and Hawaii takes advantage of theexisting cartographic development and provides good cov-erage for several other parts of the world most notably theIndian subcontinent and central South America Unfortu-nately it splits Europe into east and west and divides Japaninto two hexagons This configuration is shown in threeorthographic views in Figure 11
An alternative fixed configuration of the truncated ico-sahedron can be labeled the polar configuration as it is thenatural orientation for a rotational sphere In this case thecenters of two pentagons are placed at the poles and thepattern is fixed about the rotational axis of the earth byarbitrarily locating one of the meridional edges betweentwo hexagons along the Greenwich meridian This config-uration avoids any element of chauvinism and perhapsbest relates to other standard reference systems such aslatitude-longitude Study areas such as the north polar re-gion are covered symmetrically with this placement how-ever many other areas require several faces including manythat could be covered well by a single hexagon such asAustralia and Europe This configuration is shown in theHammer-Aitoff projection in Figure 12
The final alternative is to recognize again that there is noknown optimal tessellation figure and no optimal config-uration pattern for the truncated icosahedron as a compro-mise model Since the primary objective of this geometricmodel of the earth is for probability sampling and sincewe specify an equal-area map-projection approach as bestsuited for this objective an adaptive policy toward globalconfigurations has certain advantages In this view eacharea of interest on the earth is covered by the best configuration of truncated icosahedron faces or possibly by othermodels and associated projections In many if not mostcases the truncated icosahedron faces with the Lambertazimuthal projection provide a good compromise betweenarea of coverage and map-projection distortion Such anadaptive approach requires mechanisms for reconcilingoverlapping grids from designs developed on different cen-ters or for creating seams between such designs Thisproblem is similar to the seam problem between adjacenthexagons and between hexagons and adjacent pentagonson the truncated icosahedron
Systematic Point Grids in the PlaneThe three regular polygon tessellations in the plane (Cox-eter 1969) the triangular square and hexagonal tessella-tions have corresponding dual-point grids - the hexagonalsquare and triangular grids-whose points are the centers
bull 0 bullbull 00000 bullbull 0 bullbullbullbull
bullbull 00 bullbullbull 00 bullbull 0 0 o bullbullbullbullbullbullbullbull 0 bullbullbull 0 bullbullbullbullbullbullbullbullbullbullbullbullbullbullbull 0 bullbullbull 00 bullbull
bullbull bull bull bullbullbull bullbullbull 0 bullbullbullbullbullbull 0 bullbullbull 0 0 00
Figure 9 Placement of regular grids on the pentagon of thetruncated icosahedron (a) Top Sample grid placed on oneof the isosceles triangles (b) Middle The hexagon grid (largertriangle) clipped to the pentagon triangle (c) Bottom Howthe hexagon grid meets on two adjacent pentagon triangles
well covered Several alternatives are possible for address-ing the placement of sampling grids in different parts ofthe world One of course is to use this particular config-uration as it extends across the globe Second a less-spe-cific configuration could be used Third no singleconfiguration need be specified rather an adaptive solu-tion suited to any area of interest could be used
Several criteria are not important in choosing one of thesealternatives For making global or continental scale esti-mates of population attributes the lack of coherence amongdifferent geometries from different sampling designs is nota problem as long as the probability structures of the var-ious designs are known Mapping discrete or continuouspopulation distributions for the globe or for large areas ofthe globe also is not affected by different sampling geo-metries as long as the conversion to some standard coor-
Cartography and Geographic Information Systems 15
Del
iver
ed b
y P
ublis
hing
Tec
hnol
ogy
to O
rego
n S
tate
Uni
vers
ity IP
128
193
164
203
on
Wed
09
Nov
201
1 18
53
57C
opyr
ight
(c)
Car
togr
aphy
and
Geo
grap
hic
Info
rmat
ion
Soc
iety
All
right
s re
serv
ed
bullQ
~ ~~~ ~ bull ~_
middotmiddotdmiddot ~ ~~~ ~ ~lt ~ ~ middotmiddotmiddotmiddotmiddotmiddotmiddotmiddotmiddotmiddotmiddotC
Figure 10 Hexagons of the truncated icosahedron covering central North America and Alaska
of the corresponding polygons (Figure 13) Any of the threecan define an equal-area sampling network The triangulargrid and its corresponding hexagonal tessellation have theadvantage of being the most compact and isotropic Fur-thermore some modest statistical advantages accrue to thetriangular grid because of its geometric properties (Switzer1975 Olea 1984 Matern 1986) The square grid has theadvantage of most frequent and easy application The tri-angular tessellation and its corresponding hexagonal pointgrid appear to have little advantage for our application Wechoose to use the triangular grid to take advantage of com-pactness and greater directional freedom
Hierarchical Decomposition of Triangular GridsThe triangular grid can be decomposed in several waysThe theory for these decompositions is contained in thealgebraic theory of groups (Dacey 1964 Hudson 1967) The
16
three lowest-order decompositions (aside from the identitydecomposition) that maintain the triangular structure andhence uniform probabilities under randomization result inincreases in density by factors of 3 4 and 7 (The literatureof central place theory in economic geography describesthese hierarchies as applied to the dual tessellations of hex-agons [Chris taller 1966 Losch 1954)
To implement these decompositions we can develop al-gorithms for transforming a grid to a higher density Inorder to provide a consistent description each algorithmfor density enhancement is described as a transformationin the plane of a unit figure containing the additional pointsThe algorithms are applied to the unit figure associatedwith each original grid point For this presentation theoriginal grid is assumed to be aligned such that one of itsthree axes is parallel to the x axis of the cartesian grid
For the threefold enhancement the unit figure is an equi-lateral triangle with one vertex corresponding to a point
Cartography and Geographic Information Systems
Del
iver
ed b
y P
ublis
hing
Tec
hnol
ogy
to O
rego
n S
tate
Uni
vers
ity IP
128
193
164
203
on
Wed
09
Nov
201
1 18
53
57C
opyr
ight
(c)
Car
togr
aphy
and
Geo
grap
hic
Info
rmat
ion
Soc
iety
All
right
s re
serv
ed
Figure 11 The truncated icosahedron as placed on the globefor optimal coverage of the conterminous United StatesAlaska and Hawaii shown in three orthographic projections
on the original grid at the origin a second point at ( - V2- y32) and the third at (12 - Y32) The second andthird points of the unit figure are scaled by dly3 where dis the distance between points in the original grid androtated by -rr6 (Figure 14) Since there is three-way sym-metry in a triangular grid two threefold enhancements bringthe grid back into the original alignment An alternativeway to conceptualize this is by placing an additional point
at the geometric center of each triangle formed by threeneighboring points in the original grid (as for example inMandelbrot [1988])
For the fourfold enhancement the unit figure is a rhom-bus with one vertex corresponding to a point on the orig-inal grid at the origin a second point at (-12 - y32)a third at (12 - y32) and the fourth at (10) The lastthree points are scaled by d2 d defined as above Thereis no rotation in the fourfold enhancement (Figure 15) Analternative way to conceptualize this is by placing an ad-ditional point halfway between all pairs of neighboring pointsin the original grid
For the sevenfold enhancement the unit figure is a hex-agon whose center is a point on the original grid and whosevertices are (01) (- Y3212) (- Y32 - V2) (0 -1)(Y32 - V2) (Y32V2) The six points of the hexagon arescaled by d7 d defined as above and rotated by -arctan(13y3) (Figure 16) (See Richardson [1961] and van Roessel[1988] for related discussions) Alternating sevenfold en-hancements can realign with the original grid by alternatingthe sign of the angle of rotation
The geometric logic of enhancement applies as well toreductions of an original grid with the algorithms appro-priately inverted Furthermore these basic factors of en-hancement and reduction may be combined to achieve manyadditional factors Thus a sevenfold enhancement with afourfold reduction results in a 74 increase in density Inour application the enhancements will typically be used toincrease the density of sampling for rare resources and thereductions for periodic cycles of sampling in time
Base Grids for SamplingA hexagon is a convenient figure from which to create atriangular grid since the vertices and the center form aseven-point starting grid A suitable compromise between
Figure 12 The polar configuration of the truncated icosahedron shown in the Hammer-Aitoff projection
Cartography and Geographic Information Systems 17
Del
iver
ed b
y P
ublis
hing
Tec
hnol
ogy
to O
rego
n S
tate
Uni
vers
ity IP
128
193
164
203
on
Wed
09
Nov
201
1 18
53
57C
opyr
ight
(c)
Car
togr
aphy
and
Geo
grap
hic
Info
rmat
ion
Soc
iety
All
right
s re
serv
ed
(-1123-112)
bull(-112-312)
(00)II -----~
(10)bull(1123-112)
bull(112-312)
middot middot middot middot middotmiddot middot middot middot middotmiddot middot middot middot middot
(O-13)
bull
bull(112-1123)
bull
bull
bullbull
bull
bull
bullbull
bull
bull
bull
Figure 13 Regular tessellations in the plane with corre-sponding dual-point grids (a) Top Triangular tessellationwith hexagonal grid (b) Middle Square tessellation withsquare grid (c) Bottom Hexagonal tessellation with trian-gular grid
the desired spatial resolution of sampling and the projectedavailable financial resources can determine the density ofa base sampling grid For our application an approximately640 square krn hexagon tessellation about the points corre-sponding to a distance between sampling points of ap-proximately 27 kilometers has been suggested This canbe very closely realized with a decomposition of the hex-agon of the truncated icosahedron by a factor of 32 bull 45 ortwo enhancements by 3 followed by five enhancements by4 The increase in density is by a factor of 9216 corre-sponding to a linear increase by a factor of 96 Thus eachedge of the large hexagon can be divided into 96 equal partsand the derived points connected to obtain a triangular gridfor this base sampling density containing 27937 points
Addressing SystemsUniquely identifying points on the sampling grid is nec-essary for assigning attributes to the points The simplest
18
Figure 14 Threefold enhancement and reduction (a) TopUnit figure scaled to unit grid before rotation (b) MiddleAfter rotation by TT6 enhancement complete (c) BottomThree levels of the threefold decomposition hierarchy
system is to number sequentially by rows and to numberwithin rows of one of the axes of the grid Enhancementsin grid density require additional numbers or addressesin the sequence and a history of awarded numbers to avoidduplication Two other addressing systems merit attention
The first is a cross-reference system with existing coor-dinate systems The most useful of these is the standardgeographic system of latitude and longitude Each pointcan be assigned a pair of numbers in latitude and longitude(or a concatenated or interleaved single number) with suf-ficient precision to uniquely specify the point In particularsince the maximum distance that occurs in a 7S-minutequadrangle in the conterminous United States is less than20 kms and hence there can be no more than one basesampling point in any quad the numbering conventionadopted by the US Geological Survey for these large scaletopographic quadrangles could be effectively used (USGS1985) The potential for enhancement of density also com-plicates this approach requiring enough digits of precision
Cartography and Geographic Information Systems
Del
iver
ed b
y P
ublis
hing
Tec
hnol
ogy
to O
rego
n S
tate
Uni
vers
ity IP
128
193
164
203
on
Wed
09
Nov
201
1 18
53
57C
opyr
ight
(c)
Car
togr
aphy
and
Geo
grap
hic
Info
rmat
ion
Soc
iety
All
right
s re
serv
ed
(10)bull (0117)
(-f3l271127) ~(~Of~(3127112f1)
bull bull (10)I
(-f3l2f1-11217) ~ _--~ (31217-112f1)(O-117)
(-14-314)
bull(-12middot312)
(00) (1120)11------
bullbull - - - bull 4 (14-314)
bull(112-312)
bull(-12-312)
bull(112middot312)
bull bull bull bull bull(11433114)
(-217f3l7) r - - (51143114)I I bull I bull~ I
(-5I14-3114) __ ~ (217 3f7)11-
(-114-33114)
bull bull bull bull bullbull bull bull bull bull
Figure 15 Fourfold enhancement and reduction (a) TopUnit figure scaled to unit grid no rotation needed en-hancement complete (b) Bottom Three levels of the four-fold decomposition hierarchy bull bullto be reserved in advance or the use of additional identi-fication for enhanced grid points
The second system makes use of the decomposition ge-ometry to construct a single hierarchical identification sys-tem This approach is analogous to that of Dutton (1989)Goodchild and Shiren (1989) and Wickman and others (1974)for their respective polyhedral systems it is also analogousto that of Morton (1966) and Gargantini (1982) for squarehierarchies in the plane and Gibson and Lucas (1982) forhexagonal hierarchies in the plane (and higher dimen-sions) In our system of mixed hierarchies (Lindgren 1967Woldenberg 1982) both a radix or base number and a digitin that radix need to be specified In Figure 17 the digitconventions are given for the threefold fourfold and sev-enfold systems respectively At any finer level of the three-fold fourfold or sevenfold hierarchy a ternary quaternaryor septenary digit respectively uniquely identifies the pointsderived from a single point on the coarser level A two-digit address (without radix) is shown for a point in a two-level fourfold hierarchy in Figure 18a
When mixing hierarchies the composition of enhance-ments is commutative so that there is more than one ad-dress for a point but no two points can have the sameaddress One possible notation for addresses in the mixedenvironment is left-to-right concatenation of successive lev-els of decomposition with subscripts indicating the radicesAn example with a two-level fourfold-by-threefold hier-archy is shown in Figure 18b
Since the base grid is fixed in our application a conden-sation of addresses for these points may be achieved bycombining the two threefold enhancements into a nonan-ary (radix 9) digit followed by five quaternary digits forthe five fourfold enhancements With positional order as-
Cartography and Geographic Information Systems
bullbullbullbullbullbullbullbullbullbullbullbullbullbullbullbullbullbullbullbullbullbullbullbullbullbullbullbullbullbullbullbullbullbullbullbullbullbullbullbullbullbull
Figure 16 Sevenfold enhancement and reduction (a) TopUnit figure scaled to unit grid before rotation (b) MiddleAfter rotation by -tan-1(l3y13) enhancement complete (c)Bottom Three levels of the sevenfold decompositionhierarchy
signed and thus no radix digits required only a six-digitaddress for the baseline points is necessary for the decom-position from one of the four rhombuses or part rhom-buses (triangles) of the North American hexagon Addinga digit on the front of the address for the initial rhombusmakes a total of seven This scheme is shown in Figure 19The four rhombuses or parts are numbered as in the four-fold enhancement system Therefore for example therhombus beneath (to the south of) the center of the hexa-gon extending to but not induding the grid rows joiningthe three large hexagon vertices southeast south andsouthwest of the center is number 3 It is subdivided intonine rhombuses numbered 0 to 8 northwest to southeastwithin row and northeast to southwest across rows This
19
Del
iver
ed b
y P
ublis
hing
Tec
hnol
ogy
to O
rego
n S
tate
Uni
vers
ity IP
128
193
164
203
on
Wed
09
Nov
201
1 18
53
57C
opyr
ight
(c)
Car
togr
aphy
and
Geo
grap
hic
Info
rmat
ion
Soc
iety
All
right
s re
serv
ed
bull bull
bullbull bull bull bull bull bull bullbull
bullbullbullbullbullbullbullbullbullbull
Figure 17 The three addressing systems (a) Top Threefoldsystem (b) Middle Fourfold system (c) Bottom Sevenfoldsystem
accounts for the two threefold enhancements in the base-line grid Rhombuses are then successively quartered fivetimes to identify a single point An example address on thegrid of the North American hexagon is shown in Figure 20Alternatively four of the five fourfold enhancements couldbe represented by two hexadecimal digits with a singlequaternary digit at the end further condensing the ad-
20
3Figure 19 Baseline addressing scheme for a hexagon fromthe truncated icosahedron The five highest-order digits areshown in one area
dress This addressing system could form the basis for amodified quad tree storage system where the second levelhas nonanary rather than quaternary nodes requiringmodifications to quad tree access and searching algorithms
Cartography and Geographic Information Systems
Del
iver
ed b
y P
ublis
hing
Tec
hnol
ogy
to O
rego
n S
tate
Uni
vers
ity IP
128
193
164
203
on
Wed
09
Nov
201
1 18
53
57C
opyr
ight
(c)
Car
togr
aphy
and
Geo
grap
hic
Info
rmat
ion
Soc
iety
All
right
s re
serv
ed
~ bull- bull-
Figure 20 Baseline sampling grid with addressing for theNorth American hexagon The darkened points address is3321320 or 339EOusing hexadecimal condensation
For identifying sample points uniquely across adjacentfaces of the truncated icosahedron model an additionallevel of addressing would be necessary to specify the facePoints introduced in the seam between two faces also wouldneed special treatment For points derived from a differentglobal configuration of the truncated icosahedron identi-fication of the configuration also would be necessary
SummaryWe have described the cartography and geometry of a sam-pling design that can address a wide variety of environ-mental issues especially the assessment of the environmentalquality of major ecological resources This design is fun-damentally based upon a systematic grid of sampling lo-cations placed on the plane of an equal-area map projectionfrom the surface of the earth The plane can be construedas the face of a regular geometric model fit to the surfaceof the earth The faces of the geometric model provide anappropriate compromise between large-enough areas ofcoverage and small-enough distortion characteristics of themap projection upon them The plane grid is placed in atriangular pattern with a regular geometry for varying thedensity and with several options for addressing the points
ACKNOWLEDGMENTSWe would like to acknowledge the contributions of Waldo ToblerGeoffreyDutton Hrovoje Lukatela and MichaelGoodchild to ourunderstanding of the issues in global geometry and to thank JohnSnyder for inspiration and advice on map projections We alsothank Rick Linthurst Jay Messer and Dan McKenzie of EPAsEnvironmental Monitoring and Assessment Program for encour-
Cartography and Geographic Information Systems
aging and sponsoring our work This research has been supportedby EPA contracts 68-C8-0006with METI 68-03-3439with Kilke1lyEnvironmental Associates 68-CO-0021with Technical ResourcesInc and cooperative agreement CR816721with Oregon StateUniversity
REFERENCES
BaileyHP 1956Two Grid Systems that Divide the Entire Sur-faceof the Earth into Quadrilaterals of EqualArea TransactionsAmerican Geophysical Union vol 37 no 5 pp 628-635
Bradley AD 1946 Equal-Area Projection on the IcosahedronGeographical Review vol 36 no 1 pp 101-104
Christaller W 1966The Central Places of Southern Germany trans-lated by C Baskin Englewood CliffsNew Jersey Prentice Hall
Cochran WG 1977Sampling Techniques third edition New York-John Wiley and Sons
Coxeter HSM 1948 Regular Polytopes London Methuen andCompany Ltd
CoxeterHSM 1969Introduction to Geometry second edition NewYorkJohn Wiley and Sons
Dacey MF 1964A Note on Some Number Properties of a Hex-agonal HierarchicalPlane Lattice Journal of Regional Science vol5 no 2 pp 63-67
Dutton GH 1989Modeling Locational Uncertainty via Hierar-chicalTessellation Accuracy of Spatial Databases MF Goodchildand S Gopal (eds) London Taylor amp Francis
Fekete G 1990 Sphere Quadtrees A New Data Structure toSupport the Visualization of Spherically Distributed Data Pro-ceedings of the SPIESPSE Symposium on Electronic Imaging Scienceand Technology
Gargantini I 1982 An Effective Way to Represent QuadtreesCommunications of the Association for Computing Machinery vol 25no 12 pp 905-910
Gasson PC 1983Geometry of Spatial Forms Chichester EnglandEllisHorwood Limited
Gibson L and D Lucas 1982 Spatial Data Processing UsingBalanced Ternary Proceedings of the IEEE Computer Society Con-ference on Pattern Recognition and Image Processing pp 566-571
Goodchild MF and Y Shiren 1989A HierarchicalSpatial DataStructure for Global Geographic Information Systems Tech-nical Paper 89-5 National Center for Geographic Informationand Analysis University of California Santa Barbara
HudsonJc 1967An AlgebraicRelationbetween the Losch andChristaller Central Place Networks The Professional Geographervol 19 no 3 pp 133-135
Lindgren CES 1967The Geometry of Mixed Hexagonal Hier-archies in the Context of Central PlaceTheory Harvard Papersin Theoretical Geography No7 Laboratory for ComputerGraphics and Spatial Analysis Graduate Schoolof Design Har-vard University
Losch A 1954The Economics of Location translated by WH Wog-10mand WF Stolper New Haven Connecticut YaleUniversityPress
Lukatela H 1987 Hipparchus Geopositioning Model An Ov-erview Proceedings Auto-Carta 8 pp 87-96
Lyustemik LA 1963Convex Figures and Polyhedra translated byTJ Smith New York Dover Publications
Mandelbrot BB 1988 Fractal Landscapes without Creases andwith Rivers The Science of Fractal Images HC Peitgen and DSaupe (eds) New York Springer-Verlag
Matern B 1986 Spatial Variation second edition Lecture Notesin Statistics no 36 Berlin Springer-Verlag
Mark DM and JP Lauzon 1985 Approaches for Quadtree-Based Geographic Information Systems at Continental or GlobalScales Proceedings Auto-Carta 7 pp 355-364
21
Del
iver
ed b
y P
ublis
hing
Tec
hnol
ogy
to O
rego
n S
tate
Uni
vers
ity IP
128
193
164
203
on
Wed
09
Nov
201
1 18
53
57C
opyr
ight
(c)
Car
togr
aphy
and
Geo
grap
hic
Info
rmat
ion
Soc
iety
All
right
s re
serv
ed
Messer JJ RA Linthurst and WS Overton 1991 An EPAProgram for Monitoring Ecological Status and Trends Environ-mental Monitoring and Assessment no 17 pp 67-78
Morton G 1966 A Computer-Oriented Geodetic Data Base anda New Technique in File Sequencing Internal memorandumInternational Business Machines Canada Ltd
Olea RA 1984 Sampling Design Optimization for Spatial Func-tions Mathematical Geology vol 16 no 4 pp 369-392
Paul MK 1973 On Computation of Equal Area Blocks BulletinGrodesique no 107 pp 73-84
Pearce P and S Pearce 1978 Polyhedra Primer New York VanNostrand Reinhold Company
Popko E 1968 Geodesics Detroit University of Detroit PressRichardson LF 1961 The Problem of Contiguity General Sys-
tems no 6 pp 139-187Samet H 1984 The Quadtree and Related Hierarchical Data
Structures Association for Computing Machinery Computing Sur-veys vol 16 no 2 pp 187-260
Snyder JP 1987 Map Projections-A Working Manual US Geo-logical Survey Professional Paper 1395
Snyder JP 1991 An Equal-Area Map Projection for PolyhedralGlobes Manuscript submitted for publication
22
Switzer P 1975 Estimation of the Accuracy of Qualitative MapsDisplay and Analysis of Spatial Data Je Davis and MJ Mc-Cullagh (eds) New York John Wiley and Sons
Tobler W and Z-t Chen 1986 A Quadtree for Global Infor-mation Storage Geographical Analysis vol 18 no 4 pp 360-371
Upton G and B Fingleton 1985 Spatial Data Analysis by ExamplePoint Pattern and Quantitative Data Chichester England JohnWiley and Sons
US Geological Survey 1985 and other dates Indices to Topo-graphic and Other Map Coverage (by state) National MappingDivision
van Roessel JW 1988 Conversion of Cartesian Coordinates fromand to Generalized Balanced Ternary Addresses Photogram-metric Engineering and Remote Sensing vol 54 no 11 pp 1565-1570
Wickman FE E Elvers and K Edvarson 1974 A System ofDomains for Global Sampling Problems Geografisker AnnalerSeries A vol 56 nos 3-4 pp 201-212
Woldenberg MJ 1979 A Periodic Table of Spatial HierarchiesPhilosophy in Geography S Gale and G Olsson (eds) DordrechtThe Netherlands D Reidel Publishing Company
Cartography and Geographic Information Systems
Del
iver
ed b
y P
ublis
hing
Tec
hnol
ogy
to O
rego
n S
tate
Uni
vers
ity IP
128
193
164
203
on
Wed
09
Nov
201
1 18
53
57C
opyr
ight
(c)
Car
togr
aphy
and
Geo
grap
hic
Info
rmat
ion
Soc
iety
All
right
s re
serv
ed
borhood of each point will constitute a Tier 1 sample to beused to estimate the structural properties of the regionaland national populations of these types The structuralproperties include the numbers of resource units their sur-face area linear dimension shape landscape pattern andother geometric or geophysical measures obtainable fromremotely sensed imagery A subsample of this Tier 1 sam-ple will be used for field sampling of other attributes of theresources This double sample (Cochran 1977)will consti-tute Tier 2 of the design Field measurements will includefor example chemical analyses of water samples visualsymptoms of foliage damage to forests species composi-tion of wetlands and other indicators of environmentalwell-being
The efficient statistical properties of estimates made fromthe double sample derive in large part from the extensive-ness of the Tier 1 sample and the relevance of the infor-mation in the data on that sample to the data in the doublesample But a major advantage of this design strategy isthat the Tier 1 characterization of areas around the gridpoints is not restricted to the ~esources identified a prioriOther resources may be sampled at a later time in responseto a new issue regarding their health The primary designdevice to implement this adaptive capability is the samplinggrid
Rationale for Cartographic and GeometricProperties of Design
The program objectives and design strategy lead to a set ofcriteria for the cartographic and geometric properties of thedesign The specification of a probability sample requiresthat the sampling grid be positioned randomly The moststraightforward randomization is by a single random trans-lation of the grid in a plane followed by the projection ofthe randomized grid onto the earths surface An equal-area map projection is required to preserve the samplingprobabilities The equal-area property also assures that anyfixed-size area has the same probability of being sampledregardless of its location
Thus a regular systematic grid of sampling points in theplane of an equal-area map projection best achieves therandomization and equal-area criteria Additional criteriaare that the grid provide compact areas within which toselect sampling units and that it not be aligned with anyregularly spaced cultural or physical landscape featuresAlso methods for enhancing the density of the grid in aregular hierarchical pattern are useful for increased sam-pling of rare ecological resources and methods for reduc-ing the density are useful for implementing regular cyclicalsampling in time Finally we want a grid system that canconveniently cover the conterminous United States and beextended to other parts of the country and potentially toother parts of the world
Projecting from the earths surface to a plane results inarea or shape distortion or both Over large areas of theearth the magnitudes of these distortions can become quitelarge Therefore it is important to select anmiddot appropriatelysized and shaped piece of the earth on which to implementthe sampling grid We review below a number of ap-proaches to this problem Sincewe have specified an equal-
6
area map projection the primary concern is with shape (orscale) distortion across the projection surface However itis also useful to review and analyze area distortions in oth-erwise attractive approaches
Global Framework
Review of Alternative GeometriesA number of approaches to subdividing the surface of theearth in a regular way for large area or global data analysishave been suggested The approaches can be classified asmap-projection approaches polyhedral tessellations andadaptive subdivision systems
Map-Projection Approaches Existing map-projection co-ordinate systems provide potential frameworks for subdi-vision Tobler and Chen (1986) proposed the Lambertcylindrical equal-area projection as the basis for a quadtree(Samet 1984)referencing and storage system Their solutionattempts to satisfy several principles regular hierarchicaldata structuring easy conversion to other systems directrelation to latitude and longitude and equal-area subdivi-sions This is achieved by first representing the earth inLamberts cylindrical projection then transforming the rec-tangular representation derived from the cylindrical pro-jection into a square by an area preserving quadrature andfinally placing a square grid upon the result The verticalgrid lines of this system are meridians spaced at regularintervals and the horizontal grid lines are parallels spacedproportional to the sine function While meeting the au-thors requirements this system has one major disadvan-tage for our application the variation in shape of thesubdivision cells on the earth from nearly square at theequator to acute isosceles triangles at the poles
Mark and Lauzon (1985) proposed an addressing andstorage system based upon the Universal Transverse Mer-cator (UTM)coordinate system They propose to divide the60UTMzones into north to south subzones that are squarein the projection plane (Depending upon the ultimate cellsize of the data base division into east-west subzones mightalso be necessary) Each subzone is then further subdividedinto a regular square grid of patches and each patch intoa square grid of cells for data storage Patch and cell ad-dresses can then be implemented as linear quad tree ad-dresses convenient for computer representation For ouruse the UTM-based system has the major disadvantage ofnot representing the earths surface in equal-area pieces Italso has major discontinuitiesin the polar regions and lesserdiscontinuities at the edges of the zones
Polyhedral Tessellations Another set of approaches tosubdividing the world uses knowledge of three-dimen-sional geometry first developed in ancient Greece The Pla-tonic solids are the five regular polyhedra the tetrahedronhexahedron (cube) octahedron dodecahedron and ico-sahedron (Coxeter 1948 Pearce and Pearce 1978) Thesesolids can be inscribed in a sphere as the basis of a worldsubdivision system Dutton (1989) for example has pro-posed using an octahedron as the basis for a system calleda quaternary triangular mesh (QTM) The octahedron is
Cartography and Geographic Information Systems
Del
iver
ed b
y P
ublis
hing
Tec
hnol
ogy
to O
rego
n S
tate
Uni
vers
ity IP
128
193
164
203
on
Wed
09
Nov
201
1 18
53
57C
opyr
ight
(c)
Car
togr
aphy
and
Geo
grap
hic
Info
rmat
ion
Soc
iety
All
right
s re
serv
ed
initially aligned with the cardinal points of the latitude andlongitude coordinate system that is the six vertices areplaced at the poles and along the equator at 0 90 - 90and 180 degrees of longitude Each triangular face of theoctahedron is then recursively subdivided into four subtri-angles by placing vertices at the midpoints of the edgesuntil the size of the faces or the distance between verticesis small enough to resolve the features of interest Duttoncalculates that I-meter resolution is obtained after 21 levelsof decomposition A variation on QTM proposed by Good-child and Shiren (1989)uses a different numbering systemfor the four subtriangles at any level and provides astraightforward conversion between latitude and longitudeand the QTM coordinate system The QTM systems likeUTM do not subdivide into equal-area cells and thus arenot suitable for a sampling design specifying the equal-areaproperty
The dodecahedron has been used by Wickman Elversand Edvarson (1974) for creating a global sampling net-work They initially subdivide each pentagon of the do-decahedron into five isosceles spherical triangles and thenrecursively subdivide these triangles into four pseudo-tri-angles An equal-area subdivision is obtained by connect-ing edge midpoints with two equal-length great circle arcsjoined at a vertex slightly displaced from the single greatcircle arc connecting the midpoints so as to create equalareas The polygons created are four- and six-sided figuresclose to triangular in shape Thus this system maintainsthe equal-area property on the sphere The primary dis-advantage for our application is the small irregularities inshape which prevent the use of a simple randomizationscheme
Fekete (1990)has used the icosahedron as a model forrepresenting data distributions on the sphere Single-val-ued spherical surfaces are modeled as triangles whose ver-tices are projected onto the sphere The model is initiatedwith the vertices of the icosahedron and recursively sub-divided as in the QTM models until the error in represent-ing the surface values (not necessarily in resolving location)is below a prescribed minimum The fourfold recursivesubdivision allows an adaptation of the planar quad treecalled the sphere quadtree for data storage and address-ing As with QTM the icosahedral tessellation with recur-sive triangular subdivisiondoes not produce equal-areacellsthough the area and shape variation is less than that pro-duced by the octahedral tessellation (see the followinganalysis)
Adaptive Subdivision Systems The two preceding ap-proaches are based upon regular decompositions of mapprojections of the earth to a plane or upon decompositionsof regular polyhedra fit to the earth or upon a hybrid ofthese An alternative approach starts with a given patternof objects on the earth and tessellates a surface of arealunits based upon some property Lukatela (1987)describesa system for creating the Dirichlet network on a spheroidThe Dirichlet network is also known as the Voronoi orThiessen network (Upton and Fingleton 1985) This net-work separates the spheroid into polygons whose loci areall points closest to the set of original points that definedthe network The only sets of points known to result in
Cartography and Geographic Information Systems
perfect equal-area Dirichlet tessellations are the centers ofthe faces of the respective Platonic solids fit to the sphere(Coxeter 1969) Lukatela has described (personal commu-nication) for example a decomposition starting with thevertices ofmiddota dodecahedron and creating the next level ofDirichlettessellationfrom the vertices of the preceding levelOnly at the level of the original dodecahedron does thisapproach have regular size and shape cells
Two previous studies have considered respacing paral-lels and meridians to obtain equal-area cells on the sphere(or spheroid) Bailey (1956)contrasted the two cases of res-pacing only the parallels or only the meridians Paul (1973)investigated several cases of combining both While obtain-ing an equal-area subdivision on the sphere these gridsystems do not provide for an equal-area regular grid inthe plane except within a cell Furthermore the cellsarequadrilateral and therefore less compact than some othershapes Another possible adaptive approach not exploredin the literature to our knowledge is (quadratic) optimi-zation applied to a sphere Our problem stated in the lan-guage of optimization is the placement of an arbitrarynumber of cells on the sphere with an objective functionspecifying equality of area and compactness of shapeEquality of area could alternatively be specified as aconstraint
A New Approach and RationaleBased upon our survey of existing proposals for global sub-division systems we conclude that none meet all of theobjectives of equal area equal and compactly shaped sub-divisions with minimal scale distortion and a hierarchicalstructure for enhancement and reduction We also regardexisting map projections optimized for coverage of specificareas such as the standard Albers equal-area conic projec-tion configured for the United States to be appropriate forthose specific areas but difficult to extend elsewhereTherefore we propose a new system based upon an equal-area map projectiol1-onto plates of a semiregular (or Ar-chimedean) polyhedron but with possible adaptations forrepositioning the polyhedron to best fit different parts ofthe earth or for covering large or noncompactly shapedareas of interest This system uses the truncated icosahed-ron a 32-face polyhedron with 20 hexagons and 12 pen-tagons arranged in a five-way symmetry about a centralaxis connecting two pentagons This solid achieves the bestcompromise among the regular and semiregular polyhedrain meeting the following objectives faces large enough tocover significant subcontinents (such as central NorthAmerica including the conterminous United States) facessmall enough to keep scale distortions in map projectionsto about 2 percent compact and similar face shapes (hex-agon and pentagon) andsome degree of familiarity (thepattern often used to construct soccerballs) The systematicsampling grid can then be defined as a regular decompo-sition of the grid formed by the vertices and center of ahexagon of this model The map projection we propose isthe Lambert azimuthal equal-area projection with a tangentplane We support our proposal with an analysis of thespherical tessellations of regular polyhedra and alterna-tively map projections upon the faces of these polyhedraWe similarly analyze the truncated icosahedron
7
Del
iver
ed b
y P
ublis
hing
Tec
hnol
ogy
to O
rego
n S
tate
Uni
vers
ity IP
128
193
164
203
on
Wed
09
Nov
201
1 18
53
57C
opyr
ight
(c)
Car
togr
aphy
and
Geo
grap
hic
Info
rmat
ion
Soc
iety
All
right
s re
serv
ed
hexahecton (atle)
Figure 1 The five regular polyhedra or Platonic solids
Table 1 Geometric characteristics of the Platonic solids
tetrahedron hexahedron octahedron dodecahedron icosahedron
face polygon triangle square triangle pentagon triangle
number of faces 4 6 8 12 20number of edges 6 12 12 30 30number of vertices 4 8 6 20 12proportion of total 114 116 18 1112 1120area in each face
Analysis of Spherical Tessellations of Regular PolyhedraThe five regular or Platonic polyhedra are shown in Figure1 and listed with their properties in Table 1 A circumscrib-ing sphere can be made to touch all vertices of each poly-hedron and polyhedron edges can be thought of as chordsof circles that can be projected onto the sphere as great-circle segments called geodesic lines These geodesic linesform the edges of spherical triangles squares or pentagonsthat completely cover the sphere and are regular in thesense that all sides and interior angles are equal (Figure 2)The area of each spherical polygon relative to the entiresphere will be the same as in the Platonic solid for exam-ple each spherical triangle projected from an icosahedronwill cover 120 of the spheres surface area Vertices ofspherical polygons with these characteristics are equallyspaced and hence provide an ideal set of starting points
for subdividing the globe further Figure 3 portrays one faceof each spherical tessellation using the Lambert azimuthalprojection
Since further subdivision of any of these five sphericalpolyhedra will produce spherical polygons unequal in sizeor shape or both the question of which polyhedron pro-duces the least overall size and shape distortion is of con-siderable interest Distortions in size and shape can bestudied by subdividing a spherical face of each polyhedronin the same manner and comparing the areas and interiorangles of the smaller polygons formed It helps if all pol-ygons are of the same degree which suggests triangulatingthe faces into a network similar to themiddot triangular networksthat comprise geodesic domes (Popko 1968)
The most popular method of triangle subdivision in geo-desic construction is called the alternate method (Gasson
tetrahedron
Figure 2 The spherical tessellations of the five regular polyhedra
8 Cartography and Geographic Information Systems
Del
iver
ed b
y P
ublis
hing
Tec
hnol
ogy
to O
rego
n S
tate
Uni
vers
ity IP
128
193
164
203
on
Wed
09
Nov
201
1 18
53
57C
opyr
ight
(c)
Car
togr
aphy
and
Geo
grap
hic
Info
rmat
ion
Soc
iety
All
right
s re
serv
ed
tetrahedron hexaheaon (obl) tetrahedron
tnrcated ~icosahedron - bullbullbullbullbullbullhexagon pentagon
Figure 4 The two- and four-frequency subdivision of oneface of each spherical tessellation
~
( ~ ~
- - -I ---
-~-- --
tnnated tnnatedicosahedron Icosahoctcnhexagon pentagon
Figure 3 One face of each spherical tessellation with a 15deglatitude 30deg longitude geodetic grid
1983) and can be applied directly to the geodesic edge linesfor each different spherical triangle In the alternate methodfour new triangles are constructed by creating vertices atthe midpoint of each edge of the parent triangle In thegeodesic field this is called a two-frequency subdivisi~nof a triangle Performing this quartering procedure agamproduces a four-frequency subdivision
The two- and four-frequency subdivisions of the spher-ical polyhedra are shown in Figure 4 Cube and dode~a-hedron faces must be first subdivided into four and fivetriangles respectively that are identical in size and shapebut have only two equal interior angles Tetrahedron oc-tahedron and icosahedron faces are triangular and thefaces for each are identical in size and shape and havethree identical interior angles The areas and interior anglesof these two- and four-frequency triangles onthe spherecannot all be equal and the deviation in area and interiorangles can be determined through spherical trigon~metI
The deviations in spherical triangle areas are gIVen mTable 2 as percentages of the average area for two- andfour-frequency subdivisions of each polyhedron Remem-bering that the spherical cube and dodecahedron faces havebeen initially divided into four and five triangles of equalsize and shape respectively the numbers demonstrate thatarea differences among triangles generally decrease in pro-portion to the area of the starting triangle reaching a dif-ference of zero for infinitely small initial triangles Averagedeviations in area also appear to be the same for the two-and four-frequency data prompting a conjecture that the
amount of deviation is independent of subdivision fre-quency The range of area deviation is approximately threetimes the average deviation for all two-frequency subdivi-sions and four-frequency subdivisions have a wider de-viation range than the two-frequency Further investigationis needed to determine if the deviation range approachesa maximum limit with increasing subdivision
The area deviation data point out the benefits of usingsmall initial triangles as the starting point for defining sam-ple points as the vertices of triangles formed by successivequartering It is also desirable to have sample points froma network of similarly shaped spherical triangles consid-ering that an initial equilateral triangle network cannot beobtained except from the spherical tessellations of the tet-rahedron octahedron and icosahedron
One measure of similarity is the deviation of triangle in-terior angles from those of an equilateral triangle of thesame surface area This measure can be extended to alltriangles in a two- or four-frequency subdivision giving theaverage interior angle deviations and deviation ranges listedin Table 2 The icosahedron and dodecahedron subdivi-sions clearly deviate the least from the equilateral ideal Theaverage deviation appears to be stable with increasing sub-division frequencies and the deviation range should slowlyincrease to a maximum of 30 percent for both This is pri-marily due to the starting triangles being small in area andclose to equilateral in both cases
Truncated Icosahedron Tessellation Subdividing the ico-
Cartography and Geographic Information Systems 9
Del
iver
ed b
y P
ublis
hing
Tec
hnol
ogy
to O
rego
n S
tate
Uni
vers
ity IP
128
193
164
203
on
Wed
09
Nov
201
1 18
53
57C
opyr
ight
(c)
Car
togr
aphy
and
Geo
grap
hic
Info
rmat
ion
Soc
iety
All
right
s re
serv
ed
Table 2 Deviation in area and interior angles for two- and four-frequency subdivisions of the initial spherical trianglesfrom the Platonic solids
tetmhedron hexahedron octahedron dodecahedron icosahedron
~ ~ ~ ~ ~ iml ~ fIN ~ ~
avg triangle area 625 156 104 026 3125 078 0417 0104 125 0312( of sphere)
avg deviation 500 500 632 665 2019 2019 234 234 725 725( of avg A area)
deviation range 1330 22693 2217 2846 5384 7754 715 91 1933 2564( of avg A area)
avg interior angle 750 6375 625 60625 675 61875 610 6025 630 6075(degrees)
avg deviation 400 4046 1912 1914 1891 194 836 837 734 784( of avg int angle)
deviation range 1000 13643 6657 7286 5224 6906 271l 2906 2178 279( of avg int angle)
sahedron and dodecahedron using the alternate methodwill produce sample points at vertices of spherical trianglesthat are approXimately equal in size and shape but themaximum deviations are unacceptably large for many sam-pling systems Minimizing these deviations requires smallerhexagonally shaped faces so that nearly equilateral trian-gles are formed when the hexagon is triangulated Suchhexagons are a characteristic of the semiregular polyhedroncalled the truncated icosahedron one of the 14 Archime-dean solids (13 discovered in ancient Greece the 14th inthe 20th century [Lyusternik 1963]) These solids have con-gruent vertices and regular polygons as faces but may havemore than one kind of regular polygon The truncated ico-sahedron (Figure 5) can be conceptualized as an icosahed-ron with each of the 12 vertices truncated to form apentagon leaving 20 hexagons in the remainder of the 20original triangular faces There is only one size of trunca-tion that creates precisely regular pentagons and hexagonsfrom the icosahedron As with the Platonic polyhedra acircumscribing sphere can be fit to the 60 truncated icosa-hedron vertices and the 90 edges can be projected onto
Figure 5 The truncated icosahedron as polyhedron and asspherical tessellation
10
the sphere to form the soccer ball pattern as seen inFigure 5 for the globe
The hexagon of this model is 667 percent of the area ofan icosahedron triangle but 718 percent of a spherical ico-sahedral triangle The total area of the pieces of the threepentagons in one triangle is correspondingly reduced from333 percent to 282 percent of the icosahedral triangle Onthe globe the hexagon is large enough to cover the con-terminous 48 states of the United States plus southernCanada and northern MeXico The truncated icosahedronhexagon is therefore an excellent starting point for a large-area triangular sampling grid
The favorable geometric properties of the hexagonal facescan be seen in Figure 4 which shows a two- and four-frequency subdivision into what appear to be equilateralspherical triangles This is a slight misperception since thesetriangles do deviate slightly in area and shape as sum-marized in Table 3 The average deviation of less than 1percent is a threefold improvement over the dodecahedronsubdivision and the improvement in the deviation rangeis even better As with the spherical Platonic solids theaverage deviation app~ars constant with increased subdi-vision frequencies and the deviation range increasesgradually
Even more striking is the nearly fivefold decrease in theaverage deviation in interior angles relative to the icosa-hedron coupled with a threefold to fourfold decrease inthe deviation range This translates to angles ranging fromapproXimately 58 to 62 degrees for the four-frequency sub-division The deviation range increases little with furthersubdivision and reaches a maXimum of 713 percent as thespherical triangles become geometrically indistinguishablefrom plane triangles The vertices of these triangles are likely
Cartography and Geographic Information Systems
Del
iver
ed b
y P
ublis
hing
Tec
hnol
ogy
to O
rego
n S
tate
Uni
vers
ity IP
128
193
164
203
on
Wed
09
Nov
201
1 18
53
57C
opyr
ight
(c)
Car
togr
aphy
and
Geo
grap
hic
Info
rmat
ion
Soc
iety
All
right
s re
serv
ed
Table 3 Deviation in area and interior angles for two- and four-frequency subdivisions of the initial spherical trianglesfrom the hexagons and pentagons of the truncated icosahedron
hexagon triangles pentagon triangles
2 freo 4 freq 2 freq 4 freo
average triangle area 01496 00374 01174 002935( of sphere)
average deviation 082 082 066 067( of avg ~ area)
deviation range 222 279 220 250( of avg 11 area)
average interior angle 60359 600898 602818 6007045(degrees)
average deviation 156 156 1187 1187( of avg int angle)
deviation range 621 691 2917 2979( ofavg int angle)
to be the closest to an equal area equal-shape samplinggrid based on recursively subdividing the sphere acrossareas the size of the conterminous United States
A global sampling system based on the truncated icosa-hedron will have 282 percent of the earths surface fallingwithin the 12 pentagons Each pentagon can be dividedinto five identical spherical isosceles triangles (Figure 4)each of which can be further partitioned into two- four-and higher-frequency subdivisions using the alternatemethod As seen in Table 3 both the average deviation andthe deviation range in the areas of the two- and four-fre-quency triangles are slightly less than the correspondingtriangles from the subdivision of the spherical hexagonSince each of these five triangles is 785 percent of the areaof a triangle in the initial division of the spherical hexagonsubdividing in this manner gives triangles 215 percentsmaller on average than those in the same frequency sub-division of the hexagon triangles
The average interior angle is also closer to 60 degrees forthe pentagon subdivision but the angular deviation anddeviation range is far greater than for the hexagon This isdue to the pentagon triangles not being equilateral butrather nearly the shape of a 72-54-54 degree plane isoscelestriangle Deviation within the individual angles is smallhowever since the maximum range for the larger angle willbe from 701 to 720 degrees and for the two smaller anglesfrom 540 to 5569 degrees These values represent the limitof these angles with increasing subdivision
Map-Projection Surface Tessellation of Polyhedral Faces Ahigh-frequency subdivision of a truncated icosahedron faceproduces a triangular sampling grid defined by spherical
Cartography and Geographic Information Systems
triangles nearly equal in area and shape However thisapproach suffers in that all triangles differ slightly andtheir vertices and distortion characteristics become tediousto compute as the triangular network density is increasedto thousands of faces
A map-projection surface tessellation is another possi-bility~ Here the polyhedron faces on the sphere are trans-formed into a planar map-projection surface upon whicha grid of equilateral triangle vertices can be plotted andretransformed into latitude and longitude positions on thesphere or spheroid The advantages to this approach areseveral including the ability to project onto an equal-areamap-projection surface so that equilateral triangles on theprojection surface define equal-area triangles on the sphereor spheroid This is accomplished in the map-projectionequations by differentially distorting the map scale alongthe parallels and meridians so that identical equilateral tri-angles on the projection surface define triangles of equalarea but continuously varying shape on the globe Theadvantage over directly subdividing the sphere is that theshape distortion is gradual and can be computed easily forevery sample point as can the geographic coordinates
Equal-area map projections of Platonic solids and trun-cated icosahedron faces are illustrated in Figure 6 TheLambert azimuthal equal-area map projection was usedthroughout because shape distortion is the same along anycircle of a given radius from the projection center If thepolyhedral face center is made the projection center shapedistortion will vary in a circular pattern away from the cen-ter and a projection surface with a minimal range in shapedistortion will result due to the symmetry in each poly-hedron face This projection produces the shape distortion
11
Del
iver
ed b
y P
ublis
hing
Tec
hnol
ogy
to O
rego
n S
tate
Uni
vers
ity IP
128
193
164
203
on
Wed
09
Nov
201
1 18
53
57C
opyr
ight
(c)
Car
togr
aphy
and
Geo
grap
hic
Info
rmat
ion
Soc
iety
All
right
s re
serv
ed
k bullbullbull 225 bullbulllila
tetrahedron
k = 126bullbullbullbullbullbull
k = 126--
hexahedron (OJbe)
octahedron
k = 56mill
dodecahedron
k bullbullbull 56IIlIlI
icosahedron
truncatedicosahedronhexagon
k= 16
truncatedicosahedronpentagon
Figure 6 The I-percent scale distortion contours from the Lambert azimuthal equal-area projection of one face of eachspherical tessellation
12 Cartography and Geographic Information Systems
Del
iver
ed b
y P
ublis
hing
Tec
hnol
ogy
to O
rego
n S
tate
Uni
vers
ity IP
128
193
164
203
on
Wed
09
Nov
201
1 18
53
57C
opyr
ight
(c)
Car
togr
aphy
and
Geo
grap
hic
Info
rmat
ion
Soc
iety
All
right
s re
serv
ed
indicated by the concentric circles in Figure 6 These circlesare the contours of distortion along the parallel (k distor-tion) in 1 percent increments
These distortion maps show the expected decreases inshape distortion with decreasing face sizes The map-pro-jection surface for the tetrahedron spherical face has thegreatest distortion with the map scale along the parallel atthe farthest face edge being more than 22 percent largerthan the scale at the face center In an equal-area projectionthe map scale along a meridian (h distortion) at a face edgemust then be 18-plus percent smaller (h = 11k = 11225)than at the zero-distortion face center The maximum shapedistortion is less on the projected faces of the cube andoctahedron and still less on the projections of the dode-cahedron and icosahedron faces Because of its small sizeand roughly circular shape the truncated icosahedron hex-agon face has the lowest maximum distortion of all thesefigures Here the map scale at the farthest face edge is amaximum of 22 percent larger along the parallel and 22percent smaller along the meridian The conterminous UnitedStates easily falls within the 2 percent scale distortion circle
The difference between determining sample points byrecursive subdivision of spherical polyhedra faces and bysubdivision of equilateral triangles on an equal-area mapprojection of the spherical faces can now be stated moreclearly Direct subdivision of the spherical face produces anetwork of sample points that is nearly regular in the areaand shape of the triangles that define the point locationsThe triangles are however slightly different in area andshape with some being close to the equilateral ideal andothers deviating significantly The triangles defined on theLambert projection on the other hand are equal in areaand represent equal-area spherical triangles on the globeThe shape distortion introduced by the Lambert equal-areamap projection is systematic easy to compute and smallerin range than the distortion introduced by recursive sub-division directly on the sphere
A similar subdivision procedure will create a grid of eversmaller 72-54-54 degree isosceles triangles on each penta-gon face These will be 205 percent smaller in area thanhexagon triangles for the same subdivision frequency Fig-ure 6 shows a maximum scale distortion at each edge vertexof 16 percent along the parallel The 06 percent differencein maximum scale distortion on the pentagon and hexagonfaces is due to the polyhedron being slightly modified tocircumscribe the globe This means that the center of eachhexagon and pentagon touches the globe but the distancebetween the globe center and hexagon edge vertex on theprojection surface is 265 percent longer than for the samevertex on the adjacent pentagon projection surface Theformulas for the Lambert projection transform this differ-ence in distance to 06 percent meaning that the (x y)projection coordinates for each pentagon must be multi-plied by a 1006 scaling constant if the distance betweentwo edge vertices on the projection is to match the distancebetween the same two vertices on the hexagon projectionThis small-scale enlargement required for creation of per-fectly matching polyhedron vertices must be taken into ac-count when computing the areas of triangles on the pentagonface
Cartography and Geographic Information Systems
Interfaces Between Adjacent Facesand Pentagon Grids
The Lambert azimuthal map projection transforms verticesof a spherical hexagon and pentagon into vertices of regularhexagons and pentagons on the projection plane The geo-desic lines between vertices that bound each spherical poly-gon are not projected as straight lines but rather as slightcurves bowing outward from the projection center Thiscomplicates the generation of sample points on the projec-tion surface since regular hexagons and pentagons on theplane are required for p~ints to be vertices of triangles ofequal area and shape These can be created only by equallyspacing a row of sample points along each edge of a planarregular hexagon or pentagon according to the desired sam-pling density
This procedure introduces the problem of how to setsample points within the slivers created between the planarpolygon edges and the slightly bowed spherical polygonedges These slivers are narrow (362 km and 285 km max-imum widths for the hexagon and pentagon edges re-spectively) meaning that lune-like slivers with maximumwidths of 724 and 647 km respectively are formed be-tween hexagon-hexagon and hexagon-pentagon edges
One solution is to place additional points in the sliverbetween two adjacent sampling grids One method for thisis to extend the triangular grid from one of the two adjacenthexagons into the sliver clipping to the sliver boundaryFigure 7a is a schematic illustration of how the sliver (greatlyexaggerated in width) appears in the Lambert projectionwith two hexagons meeting in a straight line and the greatcircle dividing the sliver projected as an arc into the op-
bullFigure 7 Spherical slivers between plane hexagons in theLambert azimuthal and gnomonic projections (exaggeratedin width for illustration purposes) (a) Top A randomizedgrid across two adjacent hexagons each shown in the Lammiddotbert azimuthal projection Each hexagons portion of thesliver is shown as a halfmiddotlune from the straight hex edge tothe great circle arc separating the hexagons The great-circlearc between the hexagons thus appears twice (b) BottomA randomized grid across two adjacent hexagons in thegnomonic projection The great-circle arc between the hex-agons is shown in a thin line Sample points from eachhexagon are extended by one row into the sliver
13
Del
iver
ed b
y P
ublis
hing
Tec
hnol
ogy
to O
rego
n S
tate
Uni
vers
ity IP
128
193
164
203
on
Wed
09
Nov
201
1 18
53
57C
opyr
ight
(c)
Car
togr
aphy
and
Geo
grap
hic
Info
rmat
ion
Soc
iety
All
right
s re
serv
ed
posite hexagon Figure 7b illustrates the situation in a gno-monic projection which represents the great circlebetweentwo hexagon vertices as a straight line and the hexagonedges as arcs The interface between a hexagon and a pen-tagon can be handled in a similar way
A more elegant solution is to unbow each edge of theprojected spherical polygon by modifying the map-projec-tion equations to produce regular hexagons and pentagonsJohn Snyder (1991)has very recently devised such a pro-jection to be called the Equal-Area Polyhedral ProjectionAfter deriving this projection he found that Irving Fisherhad used the same concept in a design for the icosahedronreported as a footnote in Bradley (1946)but Snyder hascarried the derivation further to include other polyhedrainverse formulas and distortion analysis Snyders idea isbest understood by examining one of the six equilateraltriangles forming a pole-centered hexagon (Figure 8) Thescale in the meridional direction has been progressivelyreduced from the edge to the center of the triangle baseThis reduction allows the geographic coordinates of posi-tions along the great-circle triangle base to be projected toa straight line eliminatingthe sliversbetween adjacent facesThe projection is made equal area by adjusting the spacingof meridians from the edge to center of the triangle re-sulting in a maximum angular deformation of 375 degreesand a maximum scale distortion of 33 percent Since thisis done for the six hexagon edges all hexagon-to-hexagonedges will match exactly The Equal-Area Polyhedral Pro-jection can also be applied to the five isosceles triangles
Lambert Azimuthal
Equal Area Projection
NP
composing each pentagon Pentagon-hexagon edges matchto within 1 part in 105 of the length of a side
The placement of a grid on a pentagon of a truncatedicosahedron introduces additional issues An equilateraltriangular grid cannot include the vertices of a pentagonOne solution is to divide the equal-area projected surfaceof the pentagon into five isosceles triangles and subdividethese into congruent triangles such that the spacing be-tween points and areas of the triangles are close to thoseof the equilateral triangles of the hexagon grid (Figure 9a)A second possibility is to extend the five adjacent hexagongrids into the adjoining triangle of the pentagon or ineffect to use the icosahedron as the model solid (Figures9b and 9c) As shown above this sacrifices the low distor-tion characteristics that can be achieved on the projectedhexagons and pentagons of the truncated icosahedron
Advantages and Disadvantages of DifferentGlobal Configurations
For the application of this global tessellation to a samplingnetwork for the conterminous United States we have po-sitioned the solid such that one hexagon covers all of theland area in the conterminous states and nearby coastalwaters and such that a neighboring hexagon covers all ofAlaska except the end of the Aleutian chain of islands(Figure 10)Also note that the Hawaiian Islands fall withina third hexagon In placing the truncated icosahedron tooptimize the coverage of central North America with a sin-gle hexagon other parts of the world may naturally be less
Equal Area
Polyhedral Projection
NP
Straight Line Drawn BetweenHexagon Vertices as StartingLine for Triangular Sampling
Curved Great Circleat Hexagon Edge
Straight Great Circle Lineat Hexagon Edge
Figure 8 The Lambert Azimuthal Equal-Area and the Equal-Area Polyhedral (designed by John Snyder) map projectionsof one-sixth of a truncated icosahedron hexagon centered on the North Pole
14 Cartography and Geographic Information Systems
Del
iver
ed b
y P
ublis
hing
Tec
hnol
ogy
to O
rego
n S
tate
Uni
vers
ity IP
128
193
164
203
on
Wed
09
Nov
201
1 18
53
57C
opyr
ight
(c)
Car
togr
aphy
and
Geo
grap
hic
Info
rmat
ion
Soc
iety
All
right
s re
serv
ed
Implementing a Sampling Grid in the Planeof a Truncated Icosahedron Hexagon
dinate system is known And the incorporation of data fromdifferent sampling designs into global or continental scaleecological or geophysical models is likewise not limited bydifferent sampling geometries since data can be placed intoa common georeferencing system either as aggregate pop-ulation estimates or as individual sampling observationswhose location coordinates are converted to a commonsystem
Extending the configuration for good coverage of centralNorth America Alaska and Hawaii takes advantage of theexisting cartographic development and provides good cov-erage for several other parts of the world most notably theIndian subcontinent and central South America Unfortu-nately it splits Europe into east and west and divides Japaninto two hexagons This configuration is shown in threeorthographic views in Figure 11
An alternative fixed configuration of the truncated ico-sahedron can be labeled the polar configuration as it is thenatural orientation for a rotational sphere In this case thecenters of two pentagons are placed at the poles and thepattern is fixed about the rotational axis of the earth byarbitrarily locating one of the meridional edges betweentwo hexagons along the Greenwich meridian This config-uration avoids any element of chauvinism and perhapsbest relates to other standard reference systems such aslatitude-longitude Study areas such as the north polar re-gion are covered symmetrically with this placement how-ever many other areas require several faces including manythat could be covered well by a single hexagon such asAustralia and Europe This configuration is shown in theHammer-Aitoff projection in Figure 12
The final alternative is to recognize again that there is noknown optimal tessellation figure and no optimal config-uration pattern for the truncated icosahedron as a compro-mise model Since the primary objective of this geometricmodel of the earth is for probability sampling and sincewe specify an equal-area map-projection approach as bestsuited for this objective an adaptive policy toward globalconfigurations has certain advantages In this view eacharea of interest on the earth is covered by the best configuration of truncated icosahedron faces or possibly by othermodels and associated projections In many if not mostcases the truncated icosahedron faces with the Lambertazimuthal projection provide a good compromise betweenarea of coverage and map-projection distortion Such anadaptive approach requires mechanisms for reconcilingoverlapping grids from designs developed on different cen-ters or for creating seams between such designs Thisproblem is similar to the seam problem between adjacenthexagons and between hexagons and adjacent pentagonson the truncated icosahedron
Systematic Point Grids in the PlaneThe three regular polygon tessellations in the plane (Cox-eter 1969) the triangular square and hexagonal tessella-tions have corresponding dual-point grids - the hexagonalsquare and triangular grids-whose points are the centers
bull 0 bullbull 00000 bullbull 0 bullbullbullbull
bullbull 00 bullbullbull 00 bullbull 0 0 o bullbullbullbullbullbullbullbull 0 bullbullbull 0 bullbullbullbullbullbullbullbullbullbullbullbullbullbullbull 0 bullbullbull 00 bullbull
bullbull bull bull bullbullbull bullbullbull 0 bullbullbullbullbullbull 0 bullbullbull 0 0 00
Figure 9 Placement of regular grids on the pentagon of thetruncated icosahedron (a) Top Sample grid placed on oneof the isosceles triangles (b) Middle The hexagon grid (largertriangle) clipped to the pentagon triangle (c) Bottom Howthe hexagon grid meets on two adjacent pentagon triangles
well covered Several alternatives are possible for address-ing the placement of sampling grids in different parts ofthe world One of course is to use this particular config-uration as it extends across the globe Second a less-spe-cific configuration could be used Third no singleconfiguration need be specified rather an adaptive solu-tion suited to any area of interest could be used
Several criteria are not important in choosing one of thesealternatives For making global or continental scale esti-mates of population attributes the lack of coherence amongdifferent geometries from different sampling designs is nota problem as long as the probability structures of the var-ious designs are known Mapping discrete or continuouspopulation distributions for the globe or for large areas ofthe globe also is not affected by different sampling geo-metries as long as the conversion to some standard coor-
Cartography and Geographic Information Systems 15
Del
iver
ed b
y P
ublis
hing
Tec
hnol
ogy
to O
rego
n S
tate
Uni
vers
ity IP
128
193
164
203
on
Wed
09
Nov
201
1 18
53
57C
opyr
ight
(c)
Car
togr
aphy
and
Geo
grap
hic
Info
rmat
ion
Soc
iety
All
right
s re
serv
ed
bullQ
~ ~~~ ~ bull ~_
middotmiddotdmiddot ~ ~~~ ~ ~lt ~ ~ middotmiddotmiddotmiddotmiddotmiddotmiddotmiddotmiddotmiddotmiddotC
Figure 10 Hexagons of the truncated icosahedron covering central North America and Alaska
of the corresponding polygons (Figure 13) Any of the threecan define an equal-area sampling network The triangulargrid and its corresponding hexagonal tessellation have theadvantage of being the most compact and isotropic Fur-thermore some modest statistical advantages accrue to thetriangular grid because of its geometric properties (Switzer1975 Olea 1984 Matern 1986) The square grid has theadvantage of most frequent and easy application The tri-angular tessellation and its corresponding hexagonal pointgrid appear to have little advantage for our application Wechoose to use the triangular grid to take advantage of com-pactness and greater directional freedom
Hierarchical Decomposition of Triangular GridsThe triangular grid can be decomposed in several waysThe theory for these decompositions is contained in thealgebraic theory of groups (Dacey 1964 Hudson 1967) The
16
three lowest-order decompositions (aside from the identitydecomposition) that maintain the triangular structure andhence uniform probabilities under randomization result inincreases in density by factors of 3 4 and 7 (The literatureof central place theory in economic geography describesthese hierarchies as applied to the dual tessellations of hex-agons [Chris taller 1966 Losch 1954)
To implement these decompositions we can develop al-gorithms for transforming a grid to a higher density Inorder to provide a consistent description each algorithmfor density enhancement is described as a transformationin the plane of a unit figure containing the additional pointsThe algorithms are applied to the unit figure associatedwith each original grid point For this presentation theoriginal grid is assumed to be aligned such that one of itsthree axes is parallel to the x axis of the cartesian grid
For the threefold enhancement the unit figure is an equi-lateral triangle with one vertex corresponding to a point
Cartography and Geographic Information Systems
Del
iver
ed b
y P
ublis
hing
Tec
hnol
ogy
to O
rego
n S
tate
Uni
vers
ity IP
128
193
164
203
on
Wed
09
Nov
201
1 18
53
57C
opyr
ight
(c)
Car
togr
aphy
and
Geo
grap
hic
Info
rmat
ion
Soc
iety
All
right
s re
serv
ed
Figure 11 The truncated icosahedron as placed on the globefor optimal coverage of the conterminous United StatesAlaska and Hawaii shown in three orthographic projections
on the original grid at the origin a second point at ( - V2- y32) and the third at (12 - Y32) The second andthird points of the unit figure are scaled by dly3 where dis the distance between points in the original grid androtated by -rr6 (Figure 14) Since there is three-way sym-metry in a triangular grid two threefold enhancements bringthe grid back into the original alignment An alternativeway to conceptualize this is by placing an additional point
at the geometric center of each triangle formed by threeneighboring points in the original grid (as for example inMandelbrot [1988])
For the fourfold enhancement the unit figure is a rhom-bus with one vertex corresponding to a point on the orig-inal grid at the origin a second point at (-12 - y32)a third at (12 - y32) and the fourth at (10) The lastthree points are scaled by d2 d defined as above Thereis no rotation in the fourfold enhancement (Figure 15) Analternative way to conceptualize this is by placing an ad-ditional point halfway between all pairs of neighboring pointsin the original grid
For the sevenfold enhancement the unit figure is a hex-agon whose center is a point on the original grid and whosevertices are (01) (- Y3212) (- Y32 - V2) (0 -1)(Y32 - V2) (Y32V2) The six points of the hexagon arescaled by d7 d defined as above and rotated by -arctan(13y3) (Figure 16) (See Richardson [1961] and van Roessel[1988] for related discussions) Alternating sevenfold en-hancements can realign with the original grid by alternatingthe sign of the angle of rotation
The geometric logic of enhancement applies as well toreductions of an original grid with the algorithms appro-priately inverted Furthermore these basic factors of en-hancement and reduction may be combined to achieve manyadditional factors Thus a sevenfold enhancement with afourfold reduction results in a 74 increase in density Inour application the enhancements will typically be used toincrease the density of sampling for rare resources and thereductions for periodic cycles of sampling in time
Base Grids for SamplingA hexagon is a convenient figure from which to create atriangular grid since the vertices and the center form aseven-point starting grid A suitable compromise between
Figure 12 The polar configuration of the truncated icosahedron shown in the Hammer-Aitoff projection
Cartography and Geographic Information Systems 17
Del
iver
ed b
y P
ublis
hing
Tec
hnol
ogy
to O
rego
n S
tate
Uni
vers
ity IP
128
193
164
203
on
Wed
09
Nov
201
1 18
53
57C
opyr
ight
(c)
Car
togr
aphy
and
Geo
grap
hic
Info
rmat
ion
Soc
iety
All
right
s re
serv
ed
(-1123-112)
bull(-112-312)
(00)II -----~
(10)bull(1123-112)
bull(112-312)
middot middot middot middot middotmiddot middot middot middot middotmiddot middot middot middot middot
(O-13)
bull
bull(112-1123)
bull
bull
bullbull
bull
bull
bullbull
bull
bull
bull
Figure 13 Regular tessellations in the plane with corre-sponding dual-point grids (a) Top Triangular tessellationwith hexagonal grid (b) Middle Square tessellation withsquare grid (c) Bottom Hexagonal tessellation with trian-gular grid
the desired spatial resolution of sampling and the projectedavailable financial resources can determine the density ofa base sampling grid For our application an approximately640 square krn hexagon tessellation about the points corre-sponding to a distance between sampling points of ap-proximately 27 kilometers has been suggested This canbe very closely realized with a decomposition of the hex-agon of the truncated icosahedron by a factor of 32 bull 45 ortwo enhancements by 3 followed by five enhancements by4 The increase in density is by a factor of 9216 corre-sponding to a linear increase by a factor of 96 Thus eachedge of the large hexagon can be divided into 96 equal partsand the derived points connected to obtain a triangular gridfor this base sampling density containing 27937 points
Addressing SystemsUniquely identifying points on the sampling grid is nec-essary for assigning attributes to the points The simplest
18
Figure 14 Threefold enhancement and reduction (a) TopUnit figure scaled to unit grid before rotation (b) MiddleAfter rotation by TT6 enhancement complete (c) BottomThree levels of the threefold decomposition hierarchy
system is to number sequentially by rows and to numberwithin rows of one of the axes of the grid Enhancementsin grid density require additional numbers or addressesin the sequence and a history of awarded numbers to avoidduplication Two other addressing systems merit attention
The first is a cross-reference system with existing coor-dinate systems The most useful of these is the standardgeographic system of latitude and longitude Each pointcan be assigned a pair of numbers in latitude and longitude(or a concatenated or interleaved single number) with suf-ficient precision to uniquely specify the point In particularsince the maximum distance that occurs in a 7S-minutequadrangle in the conterminous United States is less than20 kms and hence there can be no more than one basesampling point in any quad the numbering conventionadopted by the US Geological Survey for these large scaletopographic quadrangles could be effectively used (USGS1985) The potential for enhancement of density also com-plicates this approach requiring enough digits of precision
Cartography and Geographic Information Systems
Del
iver
ed b
y P
ublis
hing
Tec
hnol
ogy
to O
rego
n S
tate
Uni
vers
ity IP
128
193
164
203
on
Wed
09
Nov
201
1 18
53
57C
opyr
ight
(c)
Car
togr
aphy
and
Geo
grap
hic
Info
rmat
ion
Soc
iety
All
right
s re
serv
ed
(10)bull (0117)
(-f3l271127) ~(~Of~(3127112f1)
bull bull (10)I
(-f3l2f1-11217) ~ _--~ (31217-112f1)(O-117)
(-14-314)
bull(-12middot312)
(00) (1120)11------
bullbull - - - bull 4 (14-314)
bull(112-312)
bull(-12-312)
bull(112middot312)
bull bull bull bull bull(11433114)
(-217f3l7) r - - (51143114)I I bull I bull~ I
(-5I14-3114) __ ~ (217 3f7)11-
(-114-33114)
bull bull bull bull bullbull bull bull bull bull
Figure 15 Fourfold enhancement and reduction (a) TopUnit figure scaled to unit grid no rotation needed en-hancement complete (b) Bottom Three levels of the four-fold decomposition hierarchy bull bullto be reserved in advance or the use of additional identi-fication for enhanced grid points
The second system makes use of the decomposition ge-ometry to construct a single hierarchical identification sys-tem This approach is analogous to that of Dutton (1989)Goodchild and Shiren (1989) and Wickman and others (1974)for their respective polyhedral systems it is also analogousto that of Morton (1966) and Gargantini (1982) for squarehierarchies in the plane and Gibson and Lucas (1982) forhexagonal hierarchies in the plane (and higher dimen-sions) In our system of mixed hierarchies (Lindgren 1967Woldenberg 1982) both a radix or base number and a digitin that radix need to be specified In Figure 17 the digitconventions are given for the threefold fourfold and sev-enfold systems respectively At any finer level of the three-fold fourfold or sevenfold hierarchy a ternary quaternaryor septenary digit respectively uniquely identifies the pointsderived from a single point on the coarser level A two-digit address (without radix) is shown for a point in a two-level fourfold hierarchy in Figure 18a
When mixing hierarchies the composition of enhance-ments is commutative so that there is more than one ad-dress for a point but no two points can have the sameaddress One possible notation for addresses in the mixedenvironment is left-to-right concatenation of successive lev-els of decomposition with subscripts indicating the radicesAn example with a two-level fourfold-by-threefold hier-archy is shown in Figure 18b
Since the base grid is fixed in our application a conden-sation of addresses for these points may be achieved bycombining the two threefold enhancements into a nonan-ary (radix 9) digit followed by five quaternary digits forthe five fourfold enhancements With positional order as-
Cartography and Geographic Information Systems
bullbullbullbullbullbullbullbullbullbullbullbullbullbullbullbullbullbullbullbullbullbullbullbullbullbullbullbullbullbullbullbullbullbullbullbullbullbullbullbullbullbull
Figure 16 Sevenfold enhancement and reduction (a) TopUnit figure scaled to unit grid before rotation (b) MiddleAfter rotation by -tan-1(l3y13) enhancement complete (c)Bottom Three levels of the sevenfold decompositionhierarchy
signed and thus no radix digits required only a six-digitaddress for the baseline points is necessary for the decom-position from one of the four rhombuses or part rhom-buses (triangles) of the North American hexagon Addinga digit on the front of the address for the initial rhombusmakes a total of seven This scheme is shown in Figure 19The four rhombuses or parts are numbered as in the four-fold enhancement system Therefore for example therhombus beneath (to the south of) the center of the hexa-gon extending to but not induding the grid rows joiningthe three large hexagon vertices southeast south andsouthwest of the center is number 3 It is subdivided intonine rhombuses numbered 0 to 8 northwest to southeastwithin row and northeast to southwest across rows This
19
Del
iver
ed b
y P
ublis
hing
Tec
hnol
ogy
to O
rego
n S
tate
Uni
vers
ity IP
128
193
164
203
on
Wed
09
Nov
201
1 18
53
57C
opyr
ight
(c)
Car
togr
aphy
and
Geo
grap
hic
Info
rmat
ion
Soc
iety
All
right
s re
serv
ed
bull bull
bullbull bull bull bull bull bull bullbull
bullbullbullbullbullbullbullbullbullbull
Figure 17 The three addressing systems (a) Top Threefoldsystem (b) Middle Fourfold system (c) Bottom Sevenfoldsystem
accounts for the two threefold enhancements in the base-line grid Rhombuses are then successively quartered fivetimes to identify a single point An example address on thegrid of the North American hexagon is shown in Figure 20Alternatively four of the five fourfold enhancements couldbe represented by two hexadecimal digits with a singlequaternary digit at the end further condensing the ad-
20
3Figure 19 Baseline addressing scheme for a hexagon fromthe truncated icosahedron The five highest-order digits areshown in one area
dress This addressing system could form the basis for amodified quad tree storage system where the second levelhas nonanary rather than quaternary nodes requiringmodifications to quad tree access and searching algorithms
Cartography and Geographic Information Systems
Del
iver
ed b
y P
ublis
hing
Tec
hnol
ogy
to O
rego
n S
tate
Uni
vers
ity IP
128
193
164
203
on
Wed
09
Nov
201
1 18
53
57C
opyr
ight
(c)
Car
togr
aphy
and
Geo
grap
hic
Info
rmat
ion
Soc
iety
All
right
s re
serv
ed
~ bull- bull-
Figure 20 Baseline sampling grid with addressing for theNorth American hexagon The darkened points address is3321320 or 339EOusing hexadecimal condensation
For identifying sample points uniquely across adjacentfaces of the truncated icosahedron model an additionallevel of addressing would be necessary to specify the facePoints introduced in the seam between two faces also wouldneed special treatment For points derived from a differentglobal configuration of the truncated icosahedron identi-fication of the configuration also would be necessary
SummaryWe have described the cartography and geometry of a sam-pling design that can address a wide variety of environ-mental issues especially the assessment of the environmentalquality of major ecological resources This design is fun-damentally based upon a systematic grid of sampling lo-cations placed on the plane of an equal-area map projectionfrom the surface of the earth The plane can be construedas the face of a regular geometric model fit to the surfaceof the earth The faces of the geometric model provide anappropriate compromise between large-enough areas ofcoverage and small-enough distortion characteristics of themap projection upon them The plane grid is placed in atriangular pattern with a regular geometry for varying thedensity and with several options for addressing the points
ACKNOWLEDGMENTSWe would like to acknowledge the contributions of Waldo ToblerGeoffreyDutton Hrovoje Lukatela and MichaelGoodchild to ourunderstanding of the issues in global geometry and to thank JohnSnyder for inspiration and advice on map projections We alsothank Rick Linthurst Jay Messer and Dan McKenzie of EPAsEnvironmental Monitoring and Assessment Program for encour-
Cartography and Geographic Information Systems
aging and sponsoring our work This research has been supportedby EPA contracts 68-C8-0006with METI 68-03-3439with Kilke1lyEnvironmental Associates 68-CO-0021with Technical ResourcesInc and cooperative agreement CR816721with Oregon StateUniversity
REFERENCES
BaileyHP 1956Two Grid Systems that Divide the Entire Sur-faceof the Earth into Quadrilaterals of EqualArea TransactionsAmerican Geophysical Union vol 37 no 5 pp 628-635
Bradley AD 1946 Equal-Area Projection on the IcosahedronGeographical Review vol 36 no 1 pp 101-104
Christaller W 1966The Central Places of Southern Germany trans-lated by C Baskin Englewood CliffsNew Jersey Prentice Hall
Cochran WG 1977Sampling Techniques third edition New York-John Wiley and Sons
Coxeter HSM 1948 Regular Polytopes London Methuen andCompany Ltd
CoxeterHSM 1969Introduction to Geometry second edition NewYorkJohn Wiley and Sons
Dacey MF 1964A Note on Some Number Properties of a Hex-agonal HierarchicalPlane Lattice Journal of Regional Science vol5 no 2 pp 63-67
Dutton GH 1989Modeling Locational Uncertainty via Hierar-chicalTessellation Accuracy of Spatial Databases MF Goodchildand S Gopal (eds) London Taylor amp Francis
Fekete G 1990 Sphere Quadtrees A New Data Structure toSupport the Visualization of Spherically Distributed Data Pro-ceedings of the SPIESPSE Symposium on Electronic Imaging Scienceand Technology
Gargantini I 1982 An Effective Way to Represent QuadtreesCommunications of the Association for Computing Machinery vol 25no 12 pp 905-910
Gasson PC 1983Geometry of Spatial Forms Chichester EnglandEllisHorwood Limited
Gibson L and D Lucas 1982 Spatial Data Processing UsingBalanced Ternary Proceedings of the IEEE Computer Society Con-ference on Pattern Recognition and Image Processing pp 566-571
Goodchild MF and Y Shiren 1989A HierarchicalSpatial DataStructure for Global Geographic Information Systems Tech-nical Paper 89-5 National Center for Geographic Informationand Analysis University of California Santa Barbara
HudsonJc 1967An AlgebraicRelationbetween the Losch andChristaller Central Place Networks The Professional Geographervol 19 no 3 pp 133-135
Lindgren CES 1967The Geometry of Mixed Hexagonal Hier-archies in the Context of Central PlaceTheory Harvard Papersin Theoretical Geography No7 Laboratory for ComputerGraphics and Spatial Analysis Graduate Schoolof Design Har-vard University
Losch A 1954The Economics of Location translated by WH Wog-10mand WF Stolper New Haven Connecticut YaleUniversityPress
Lukatela H 1987 Hipparchus Geopositioning Model An Ov-erview Proceedings Auto-Carta 8 pp 87-96
Lyustemik LA 1963Convex Figures and Polyhedra translated byTJ Smith New York Dover Publications
Mandelbrot BB 1988 Fractal Landscapes without Creases andwith Rivers The Science of Fractal Images HC Peitgen and DSaupe (eds) New York Springer-Verlag
Matern B 1986 Spatial Variation second edition Lecture Notesin Statistics no 36 Berlin Springer-Verlag
Mark DM and JP Lauzon 1985 Approaches for Quadtree-Based Geographic Information Systems at Continental or GlobalScales Proceedings Auto-Carta 7 pp 355-364
21
Del
iver
ed b
y P
ublis
hing
Tec
hnol
ogy
to O
rego
n S
tate
Uni
vers
ity IP
128
193
164
203
on
Wed
09
Nov
201
1 18
53
57C
opyr
ight
(c)
Car
togr
aphy
and
Geo
grap
hic
Info
rmat
ion
Soc
iety
All
right
s re
serv
ed
Messer JJ RA Linthurst and WS Overton 1991 An EPAProgram for Monitoring Ecological Status and Trends Environ-mental Monitoring and Assessment no 17 pp 67-78
Morton G 1966 A Computer-Oriented Geodetic Data Base anda New Technique in File Sequencing Internal memorandumInternational Business Machines Canada Ltd
Olea RA 1984 Sampling Design Optimization for Spatial Func-tions Mathematical Geology vol 16 no 4 pp 369-392
Paul MK 1973 On Computation of Equal Area Blocks BulletinGrodesique no 107 pp 73-84
Pearce P and S Pearce 1978 Polyhedra Primer New York VanNostrand Reinhold Company
Popko E 1968 Geodesics Detroit University of Detroit PressRichardson LF 1961 The Problem of Contiguity General Sys-
tems no 6 pp 139-187Samet H 1984 The Quadtree and Related Hierarchical Data
Structures Association for Computing Machinery Computing Sur-veys vol 16 no 2 pp 187-260
Snyder JP 1987 Map Projections-A Working Manual US Geo-logical Survey Professional Paper 1395
Snyder JP 1991 An Equal-Area Map Projection for PolyhedralGlobes Manuscript submitted for publication
22
Switzer P 1975 Estimation of the Accuracy of Qualitative MapsDisplay and Analysis of Spatial Data Je Davis and MJ Mc-Cullagh (eds) New York John Wiley and Sons
Tobler W and Z-t Chen 1986 A Quadtree for Global Infor-mation Storage Geographical Analysis vol 18 no 4 pp 360-371
Upton G and B Fingleton 1985 Spatial Data Analysis by ExamplePoint Pattern and Quantitative Data Chichester England JohnWiley and Sons
US Geological Survey 1985 and other dates Indices to Topo-graphic and Other Map Coverage (by state) National MappingDivision
van Roessel JW 1988 Conversion of Cartesian Coordinates fromand to Generalized Balanced Ternary Addresses Photogram-metric Engineering and Remote Sensing vol 54 no 11 pp 1565-1570
Wickman FE E Elvers and K Edvarson 1974 A System ofDomains for Global Sampling Problems Geografisker AnnalerSeries A vol 56 nos 3-4 pp 201-212
Woldenberg MJ 1979 A Periodic Table of Spatial HierarchiesPhilosophy in Geography S Gale and G Olsson (eds) DordrechtThe Netherlands D Reidel Publishing Company
Cartography and Geographic Information Systems
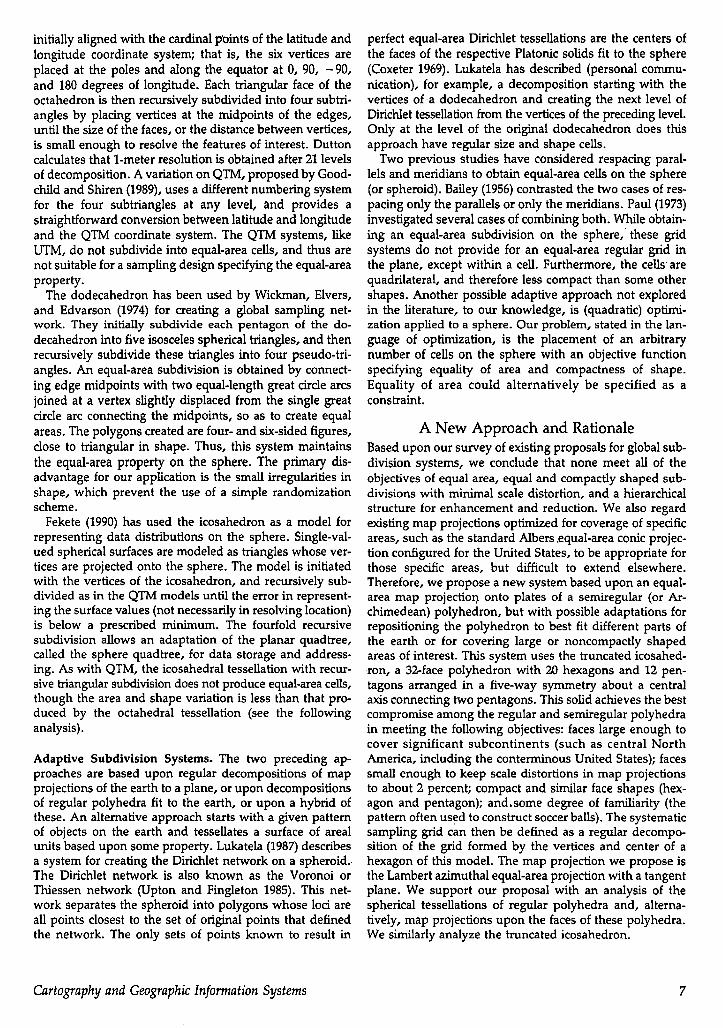
Del
iver
ed b
y P
ublis
hing
Tec
hnol
ogy
to O
rego
n S
tate
Uni
vers
ity IP
128
193
164
203
on
Wed
09
Nov
201
1 18
53
57C
opyr
ight
(c)
Car
togr
aphy
and
Geo
grap
hic
Info
rmat
ion
Soc
iety
All
right
s re
serv
ed
hexahecton (atle)
Figure 1 The five regular polyhedra or Platonic solids
Table 1 Geometric characteristics of the Platonic solids
tetrahedron hexahedron octahedron dodecahedron icosahedron
face polygon triangle square triangle pentagon triangle
number of faces 4 6 8 12 20number of edges 6 12 12 30 30number of vertices 4 8 6 20 12proportion of total 114 116 18 1112 1120area in each face
Analysis of Spherical Tessellations of Regular PolyhedraThe five regular or Platonic polyhedra are shown in Figure1 and listed with their properties in Table 1 A circumscrib-ing sphere can be made to touch all vertices of each poly-hedron and polyhedron edges can be thought of as chordsof circles that can be projected onto the sphere as great-circle segments called geodesic lines These geodesic linesform the edges of spherical triangles squares or pentagonsthat completely cover the sphere and are regular in thesense that all sides and interior angles are equal (Figure 2)The area of each spherical polygon relative to the entiresphere will be the same as in the Platonic solid for exam-ple each spherical triangle projected from an icosahedronwill cover 120 of the spheres surface area Vertices ofspherical polygons with these characteristics are equallyspaced and hence provide an ideal set of starting points
for subdividing the globe further Figure 3 portrays one faceof each spherical tessellation using the Lambert azimuthalprojection
Since further subdivision of any of these five sphericalpolyhedra will produce spherical polygons unequal in sizeor shape or both the question of which polyhedron pro-duces the least overall size and shape distortion is of con-siderable interest Distortions in size and shape can bestudied by subdividing a spherical face of each polyhedronin the same manner and comparing the areas and interiorangles of the smaller polygons formed It helps if all pol-ygons are of the same degree which suggests triangulatingthe faces into a network similar to themiddot triangular networksthat comprise geodesic domes (Popko 1968)
The most popular method of triangle subdivision in geo-desic construction is called the alternate method (Gasson
tetrahedron
Figure 2 The spherical tessellations of the five regular polyhedra
8 Cartography and Geographic Information Systems
Del
iver
ed b
y P
ublis
hing
Tec
hnol
ogy
to O
rego
n S
tate
Uni
vers
ity IP
128
193
164
203
on
Wed
09
Nov
201
1 18
53
57C
opyr
ight
(c)
Car
togr
aphy
and
Geo
grap
hic
Info
rmat
ion
Soc
iety
All
right
s re
serv
ed
tetrahedron hexaheaon (obl) tetrahedron
tnrcated ~icosahedron - bullbullbullbullbullbullhexagon pentagon
Figure 4 The two- and four-frequency subdivision of oneface of each spherical tessellation
~
( ~ ~
- - -I ---
-~-- --
tnnated tnnatedicosahedron Icosahoctcnhexagon pentagon
Figure 3 One face of each spherical tessellation with a 15deglatitude 30deg longitude geodetic grid
1983) and can be applied directly to the geodesic edge linesfor each different spherical triangle In the alternate methodfour new triangles are constructed by creating vertices atthe midpoint of each edge of the parent triangle In thegeodesic field this is called a two-frequency subdivisi~nof a triangle Performing this quartering procedure agamproduces a four-frequency subdivision
The two- and four-frequency subdivisions of the spher-ical polyhedra are shown in Figure 4 Cube and dode~a-hedron faces must be first subdivided into four and fivetriangles respectively that are identical in size and shapebut have only two equal interior angles Tetrahedron oc-tahedron and icosahedron faces are triangular and thefaces for each are identical in size and shape and havethree identical interior angles The areas and interior anglesof these two- and four-frequency triangles onthe spherecannot all be equal and the deviation in area and interiorangles can be determined through spherical trigon~metI
The deviations in spherical triangle areas are gIVen mTable 2 as percentages of the average area for two- andfour-frequency subdivisions of each polyhedron Remem-bering that the spherical cube and dodecahedron faces havebeen initially divided into four and five triangles of equalsize and shape respectively the numbers demonstrate thatarea differences among triangles generally decrease in pro-portion to the area of the starting triangle reaching a dif-ference of zero for infinitely small initial triangles Averagedeviations in area also appear to be the same for the two-and four-frequency data prompting a conjecture that the
amount of deviation is independent of subdivision fre-quency The range of area deviation is approximately threetimes the average deviation for all two-frequency subdivi-sions and four-frequency subdivisions have a wider de-viation range than the two-frequency Further investigationis needed to determine if the deviation range approachesa maximum limit with increasing subdivision
The area deviation data point out the benefits of usingsmall initial triangles as the starting point for defining sam-ple points as the vertices of triangles formed by successivequartering It is also desirable to have sample points froma network of similarly shaped spherical triangles consid-ering that an initial equilateral triangle network cannot beobtained except from the spherical tessellations of the tet-rahedron octahedron and icosahedron
One measure of similarity is the deviation of triangle in-terior angles from those of an equilateral triangle of thesame surface area This measure can be extended to alltriangles in a two- or four-frequency subdivision giving theaverage interior angle deviations and deviation ranges listedin Table 2 The icosahedron and dodecahedron subdivi-sions clearly deviate the least from the equilateral ideal Theaverage deviation appears to be stable with increasing sub-division frequencies and the deviation range should slowlyincrease to a maximum of 30 percent for both This is pri-marily due to the starting triangles being small in area andclose to equilateral in both cases
Truncated Icosahedron Tessellation Subdividing the ico-
Cartography and Geographic Information Systems 9
Del
iver
ed b
y P
ublis
hing
Tec
hnol
ogy
to O
rego
n S
tate
Uni
vers
ity IP
128
193
164
203
on
Wed
09
Nov
201
1 18
53
57C
opyr
ight
(c)
Car
togr
aphy
and
Geo
grap
hic
Info
rmat
ion
Soc
iety
All
right
s re
serv
ed
Table 2 Deviation in area and interior angles for two- and four-frequency subdivisions of the initial spherical trianglesfrom the Platonic solids
tetmhedron hexahedron octahedron dodecahedron icosahedron
~ ~ ~ ~ ~ iml ~ fIN ~ ~
avg triangle area 625 156 104 026 3125 078 0417 0104 125 0312( of sphere)
avg deviation 500 500 632 665 2019 2019 234 234 725 725( of avg A area)
deviation range 1330 22693 2217 2846 5384 7754 715 91 1933 2564( of avg A area)
avg interior angle 750 6375 625 60625 675 61875 610 6025 630 6075(degrees)
avg deviation 400 4046 1912 1914 1891 194 836 837 734 784( of avg int angle)
deviation range 1000 13643 6657 7286 5224 6906 271l 2906 2178 279( of avg int angle)
sahedron and dodecahedron using the alternate methodwill produce sample points at vertices of spherical trianglesthat are approXimately equal in size and shape but themaximum deviations are unacceptably large for many sam-pling systems Minimizing these deviations requires smallerhexagonally shaped faces so that nearly equilateral trian-gles are formed when the hexagon is triangulated Suchhexagons are a characteristic of the semiregular polyhedroncalled the truncated icosahedron one of the 14 Archime-dean solids (13 discovered in ancient Greece the 14th inthe 20th century [Lyusternik 1963]) These solids have con-gruent vertices and regular polygons as faces but may havemore than one kind of regular polygon The truncated ico-sahedron (Figure 5) can be conceptualized as an icosahed-ron with each of the 12 vertices truncated to form apentagon leaving 20 hexagons in the remainder of the 20original triangular faces There is only one size of trunca-tion that creates precisely regular pentagons and hexagonsfrom the icosahedron As with the Platonic polyhedra acircumscribing sphere can be fit to the 60 truncated icosa-hedron vertices and the 90 edges can be projected onto
Figure 5 The truncated icosahedron as polyhedron and asspherical tessellation
10
the sphere to form the soccer ball pattern as seen inFigure 5 for the globe
The hexagon of this model is 667 percent of the area ofan icosahedron triangle but 718 percent of a spherical ico-sahedral triangle The total area of the pieces of the threepentagons in one triangle is correspondingly reduced from333 percent to 282 percent of the icosahedral triangle Onthe globe the hexagon is large enough to cover the con-terminous 48 states of the United States plus southernCanada and northern MeXico The truncated icosahedronhexagon is therefore an excellent starting point for a large-area triangular sampling grid
The favorable geometric properties of the hexagonal facescan be seen in Figure 4 which shows a two- and four-frequency subdivision into what appear to be equilateralspherical triangles This is a slight misperception since thesetriangles do deviate slightly in area and shape as sum-marized in Table 3 The average deviation of less than 1percent is a threefold improvement over the dodecahedronsubdivision and the improvement in the deviation rangeis even better As with the spherical Platonic solids theaverage deviation app~ars constant with increased subdi-vision frequencies and the deviation range increasesgradually
Even more striking is the nearly fivefold decrease in theaverage deviation in interior angles relative to the icosa-hedron coupled with a threefold to fourfold decrease inthe deviation range This translates to angles ranging fromapproXimately 58 to 62 degrees for the four-frequency sub-division The deviation range increases little with furthersubdivision and reaches a maXimum of 713 percent as thespherical triangles become geometrically indistinguishablefrom plane triangles The vertices of these triangles are likely
Cartography and Geographic Information Systems
Del
iver
ed b
y P
ublis
hing
Tec
hnol
ogy
to O
rego
n S
tate
Uni
vers
ity IP
128
193
164
203
on
Wed
09
Nov
201
1 18
53
57C
opyr
ight
(c)
Car
togr
aphy
and
Geo
grap
hic
Info
rmat
ion
Soc
iety
All
right
s re
serv
ed
Table 3 Deviation in area and interior angles for two- and four-frequency subdivisions of the initial spherical trianglesfrom the hexagons and pentagons of the truncated icosahedron
hexagon triangles pentagon triangles
2 freo 4 freq 2 freq 4 freo
average triangle area 01496 00374 01174 002935( of sphere)
average deviation 082 082 066 067( of avg ~ area)
deviation range 222 279 220 250( of avg 11 area)
average interior angle 60359 600898 602818 6007045(degrees)
average deviation 156 156 1187 1187( of avg int angle)
deviation range 621 691 2917 2979( ofavg int angle)
to be the closest to an equal area equal-shape samplinggrid based on recursively subdividing the sphere acrossareas the size of the conterminous United States
A global sampling system based on the truncated icosa-hedron will have 282 percent of the earths surface fallingwithin the 12 pentagons Each pentagon can be dividedinto five identical spherical isosceles triangles (Figure 4)each of which can be further partitioned into two- four-and higher-frequency subdivisions using the alternatemethod As seen in Table 3 both the average deviation andthe deviation range in the areas of the two- and four-fre-quency triangles are slightly less than the correspondingtriangles from the subdivision of the spherical hexagonSince each of these five triangles is 785 percent of the areaof a triangle in the initial division of the spherical hexagonsubdividing in this manner gives triangles 215 percentsmaller on average than those in the same frequency sub-division of the hexagon triangles
The average interior angle is also closer to 60 degrees forthe pentagon subdivision but the angular deviation anddeviation range is far greater than for the hexagon This isdue to the pentagon triangles not being equilateral butrather nearly the shape of a 72-54-54 degree plane isoscelestriangle Deviation within the individual angles is smallhowever since the maximum range for the larger angle willbe from 701 to 720 degrees and for the two smaller anglesfrom 540 to 5569 degrees These values represent the limitof these angles with increasing subdivision
Map-Projection Surface Tessellation of Polyhedral Faces Ahigh-frequency subdivision of a truncated icosahedron faceproduces a triangular sampling grid defined by spherical
Cartography and Geographic Information Systems
triangles nearly equal in area and shape However thisapproach suffers in that all triangles differ slightly andtheir vertices and distortion characteristics become tediousto compute as the triangular network density is increasedto thousands of faces
A map-projection surface tessellation is another possi-bility~ Here the polyhedron faces on the sphere are trans-formed into a planar map-projection surface upon whicha grid of equilateral triangle vertices can be plotted andretransformed into latitude and longitude positions on thesphere or spheroid The advantages to this approach areseveral including the ability to project onto an equal-areamap-projection surface so that equilateral triangles on theprojection surface define equal-area triangles on the sphereor spheroid This is accomplished in the map-projectionequations by differentially distorting the map scale alongthe parallels and meridians so that identical equilateral tri-angles on the projection surface define triangles of equalarea but continuously varying shape on the globe Theadvantage over directly subdividing the sphere is that theshape distortion is gradual and can be computed easily forevery sample point as can the geographic coordinates
Equal-area map projections of Platonic solids and trun-cated icosahedron faces are illustrated in Figure 6 TheLambert azimuthal equal-area map projection was usedthroughout because shape distortion is the same along anycircle of a given radius from the projection center If thepolyhedral face center is made the projection center shapedistortion will vary in a circular pattern away from the cen-ter and a projection surface with a minimal range in shapedistortion will result due to the symmetry in each poly-hedron face This projection produces the shape distortion
11
Del
iver
ed b
y P
ublis
hing
Tec
hnol
ogy
to O
rego
n S
tate
Uni
vers
ity IP
128
193
164
203
on
Wed
09
Nov
201
1 18
53
57C
opyr
ight
(c)
Car
togr
aphy
and
Geo
grap
hic
Info
rmat
ion
Soc
iety
All
right
s re
serv
ed
k bullbullbull 225 bullbulllila
tetrahedron
k = 126bullbullbullbullbullbull
k = 126--
hexahedron (OJbe)
octahedron
k = 56mill
dodecahedron
k bullbullbull 56IIlIlI
icosahedron
truncatedicosahedronhexagon
k= 16
truncatedicosahedronpentagon
Figure 6 The I-percent scale distortion contours from the Lambert azimuthal equal-area projection of one face of eachspherical tessellation
12 Cartography and Geographic Information Systems
Del
iver
ed b
y P
ublis
hing
Tec
hnol
ogy
to O
rego
n S
tate
Uni
vers
ity IP
128
193
164
203
on
Wed
09
Nov
201
1 18
53
57C
opyr
ight
(c)
Car
togr
aphy
and
Geo
grap
hic
Info
rmat
ion
Soc
iety
All
right
s re
serv
ed
indicated by the concentric circles in Figure 6 These circlesare the contours of distortion along the parallel (k distor-tion) in 1 percent increments
These distortion maps show the expected decreases inshape distortion with decreasing face sizes The map-pro-jection surface for the tetrahedron spherical face has thegreatest distortion with the map scale along the parallel atthe farthest face edge being more than 22 percent largerthan the scale at the face center In an equal-area projectionthe map scale along a meridian (h distortion) at a face edgemust then be 18-plus percent smaller (h = 11k = 11225)than at the zero-distortion face center The maximum shapedistortion is less on the projected faces of the cube andoctahedron and still less on the projections of the dode-cahedron and icosahedron faces Because of its small sizeand roughly circular shape the truncated icosahedron hex-agon face has the lowest maximum distortion of all thesefigures Here the map scale at the farthest face edge is amaximum of 22 percent larger along the parallel and 22percent smaller along the meridian The conterminous UnitedStates easily falls within the 2 percent scale distortion circle
The difference between determining sample points byrecursive subdivision of spherical polyhedra faces and bysubdivision of equilateral triangles on an equal-area mapprojection of the spherical faces can now be stated moreclearly Direct subdivision of the spherical face produces anetwork of sample points that is nearly regular in the areaand shape of the triangles that define the point locationsThe triangles are however slightly different in area andshape with some being close to the equilateral ideal andothers deviating significantly The triangles defined on theLambert projection on the other hand are equal in areaand represent equal-area spherical triangles on the globeThe shape distortion introduced by the Lambert equal-areamap projection is systematic easy to compute and smallerin range than the distortion introduced by recursive sub-division directly on the sphere
A similar subdivision procedure will create a grid of eversmaller 72-54-54 degree isosceles triangles on each penta-gon face These will be 205 percent smaller in area thanhexagon triangles for the same subdivision frequency Fig-ure 6 shows a maximum scale distortion at each edge vertexof 16 percent along the parallel The 06 percent differencein maximum scale distortion on the pentagon and hexagonfaces is due to the polyhedron being slightly modified tocircumscribe the globe This means that the center of eachhexagon and pentagon touches the globe but the distancebetween the globe center and hexagon edge vertex on theprojection surface is 265 percent longer than for the samevertex on the adjacent pentagon projection surface Theformulas for the Lambert projection transform this differ-ence in distance to 06 percent meaning that the (x y)projection coordinates for each pentagon must be multi-plied by a 1006 scaling constant if the distance betweentwo edge vertices on the projection is to match the distancebetween the same two vertices on the hexagon projectionThis small-scale enlargement required for creation of per-fectly matching polyhedron vertices must be taken into ac-count when computing the areas of triangles on the pentagonface
Cartography and Geographic Information Systems
Interfaces Between Adjacent Facesand Pentagon Grids
The Lambert azimuthal map projection transforms verticesof a spherical hexagon and pentagon into vertices of regularhexagons and pentagons on the projection plane The geo-desic lines between vertices that bound each spherical poly-gon are not projected as straight lines but rather as slightcurves bowing outward from the projection center Thiscomplicates the generation of sample points on the projec-tion surface since regular hexagons and pentagons on theplane are required for p~ints to be vertices of triangles ofequal area and shape These can be created only by equallyspacing a row of sample points along each edge of a planarregular hexagon or pentagon according to the desired sam-pling density
This procedure introduces the problem of how to setsample points within the slivers created between the planarpolygon edges and the slightly bowed spherical polygonedges These slivers are narrow (362 km and 285 km max-imum widths for the hexagon and pentagon edges re-spectively) meaning that lune-like slivers with maximumwidths of 724 and 647 km respectively are formed be-tween hexagon-hexagon and hexagon-pentagon edges
One solution is to place additional points in the sliverbetween two adjacent sampling grids One method for thisis to extend the triangular grid from one of the two adjacenthexagons into the sliver clipping to the sliver boundaryFigure 7a is a schematic illustration of how the sliver (greatlyexaggerated in width) appears in the Lambert projectionwith two hexagons meeting in a straight line and the greatcircle dividing the sliver projected as an arc into the op-
bullFigure 7 Spherical slivers between plane hexagons in theLambert azimuthal and gnomonic projections (exaggeratedin width for illustration purposes) (a) Top A randomizedgrid across two adjacent hexagons each shown in the Lammiddotbert azimuthal projection Each hexagons portion of thesliver is shown as a halfmiddotlune from the straight hex edge tothe great circle arc separating the hexagons The great-circlearc between the hexagons thus appears twice (b) BottomA randomized grid across two adjacent hexagons in thegnomonic projection The great-circle arc between the hex-agons is shown in a thin line Sample points from eachhexagon are extended by one row into the sliver
13
Del
iver
ed b
y P
ublis
hing
Tec
hnol
ogy
to O
rego
n S
tate
Uni
vers
ity IP
128
193
164
203
on
Wed
09
Nov
201
1 18
53
57C
opyr
ight
(c)
Car
togr
aphy
and
Geo
grap
hic
Info
rmat
ion
Soc
iety
All
right
s re
serv
ed
posite hexagon Figure 7b illustrates the situation in a gno-monic projection which represents the great circlebetweentwo hexagon vertices as a straight line and the hexagonedges as arcs The interface between a hexagon and a pen-tagon can be handled in a similar way
A more elegant solution is to unbow each edge of theprojected spherical polygon by modifying the map-projec-tion equations to produce regular hexagons and pentagonsJohn Snyder (1991)has very recently devised such a pro-jection to be called the Equal-Area Polyhedral ProjectionAfter deriving this projection he found that Irving Fisherhad used the same concept in a design for the icosahedronreported as a footnote in Bradley (1946)but Snyder hascarried the derivation further to include other polyhedrainverse formulas and distortion analysis Snyders idea isbest understood by examining one of the six equilateraltriangles forming a pole-centered hexagon (Figure 8) Thescale in the meridional direction has been progressivelyreduced from the edge to the center of the triangle baseThis reduction allows the geographic coordinates of posi-tions along the great-circle triangle base to be projected toa straight line eliminatingthe sliversbetween adjacent facesThe projection is made equal area by adjusting the spacingof meridians from the edge to center of the triangle re-sulting in a maximum angular deformation of 375 degreesand a maximum scale distortion of 33 percent Since thisis done for the six hexagon edges all hexagon-to-hexagonedges will match exactly The Equal-Area Polyhedral Pro-jection can also be applied to the five isosceles triangles
Lambert Azimuthal
Equal Area Projection
NP
composing each pentagon Pentagon-hexagon edges matchto within 1 part in 105 of the length of a side
The placement of a grid on a pentagon of a truncatedicosahedron introduces additional issues An equilateraltriangular grid cannot include the vertices of a pentagonOne solution is to divide the equal-area projected surfaceof the pentagon into five isosceles triangles and subdividethese into congruent triangles such that the spacing be-tween points and areas of the triangles are close to thoseof the equilateral triangles of the hexagon grid (Figure 9a)A second possibility is to extend the five adjacent hexagongrids into the adjoining triangle of the pentagon or ineffect to use the icosahedron as the model solid (Figures9b and 9c) As shown above this sacrifices the low distor-tion characteristics that can be achieved on the projectedhexagons and pentagons of the truncated icosahedron
Advantages and Disadvantages of DifferentGlobal Configurations
For the application of this global tessellation to a samplingnetwork for the conterminous United States we have po-sitioned the solid such that one hexagon covers all of theland area in the conterminous states and nearby coastalwaters and such that a neighboring hexagon covers all ofAlaska except the end of the Aleutian chain of islands(Figure 10)Also note that the Hawaiian Islands fall withina third hexagon In placing the truncated icosahedron tooptimize the coverage of central North America with a sin-gle hexagon other parts of the world may naturally be less
Equal Area
Polyhedral Projection
NP
Straight Line Drawn BetweenHexagon Vertices as StartingLine for Triangular Sampling
Curved Great Circleat Hexagon Edge
Straight Great Circle Lineat Hexagon Edge
Figure 8 The Lambert Azimuthal Equal-Area and the Equal-Area Polyhedral (designed by John Snyder) map projectionsof one-sixth of a truncated icosahedron hexagon centered on the North Pole
14 Cartography and Geographic Information Systems
Del
iver
ed b
y P
ublis
hing
Tec
hnol
ogy
to O
rego
n S
tate
Uni
vers
ity IP
128
193
164
203
on
Wed
09
Nov
201
1 18
53
57C
opyr
ight
(c)
Car
togr
aphy
and
Geo
grap
hic
Info
rmat
ion
Soc
iety
All
right
s re
serv
ed
Implementing a Sampling Grid in the Planeof a Truncated Icosahedron Hexagon
dinate system is known And the incorporation of data fromdifferent sampling designs into global or continental scaleecological or geophysical models is likewise not limited bydifferent sampling geometries since data can be placed intoa common georeferencing system either as aggregate pop-ulation estimates or as individual sampling observationswhose location coordinates are converted to a commonsystem
Extending the configuration for good coverage of centralNorth America Alaska and Hawaii takes advantage of theexisting cartographic development and provides good cov-erage for several other parts of the world most notably theIndian subcontinent and central South America Unfortu-nately it splits Europe into east and west and divides Japaninto two hexagons This configuration is shown in threeorthographic views in Figure 11
An alternative fixed configuration of the truncated ico-sahedron can be labeled the polar configuration as it is thenatural orientation for a rotational sphere In this case thecenters of two pentagons are placed at the poles and thepattern is fixed about the rotational axis of the earth byarbitrarily locating one of the meridional edges betweentwo hexagons along the Greenwich meridian This config-uration avoids any element of chauvinism and perhapsbest relates to other standard reference systems such aslatitude-longitude Study areas such as the north polar re-gion are covered symmetrically with this placement how-ever many other areas require several faces including manythat could be covered well by a single hexagon such asAustralia and Europe This configuration is shown in theHammer-Aitoff projection in Figure 12
The final alternative is to recognize again that there is noknown optimal tessellation figure and no optimal config-uration pattern for the truncated icosahedron as a compro-mise model Since the primary objective of this geometricmodel of the earth is for probability sampling and sincewe specify an equal-area map-projection approach as bestsuited for this objective an adaptive policy toward globalconfigurations has certain advantages In this view eacharea of interest on the earth is covered by the best configuration of truncated icosahedron faces or possibly by othermodels and associated projections In many if not mostcases the truncated icosahedron faces with the Lambertazimuthal projection provide a good compromise betweenarea of coverage and map-projection distortion Such anadaptive approach requires mechanisms for reconcilingoverlapping grids from designs developed on different cen-ters or for creating seams between such designs Thisproblem is similar to the seam problem between adjacenthexagons and between hexagons and adjacent pentagonson the truncated icosahedron
Systematic Point Grids in the PlaneThe three regular polygon tessellations in the plane (Cox-eter 1969) the triangular square and hexagonal tessella-tions have corresponding dual-point grids - the hexagonalsquare and triangular grids-whose points are the centers
bull 0 bullbull 00000 bullbull 0 bullbullbullbull
bullbull 00 bullbullbull 00 bullbull 0 0 o bullbullbullbullbullbullbullbull 0 bullbullbull 0 bullbullbullbullbullbullbullbullbullbullbullbullbullbullbull 0 bullbullbull 00 bullbull
bullbull bull bull bullbullbull bullbullbull 0 bullbullbullbullbullbull 0 bullbullbull 0 0 00
Figure 9 Placement of regular grids on the pentagon of thetruncated icosahedron (a) Top Sample grid placed on oneof the isosceles triangles (b) Middle The hexagon grid (largertriangle) clipped to the pentagon triangle (c) Bottom Howthe hexagon grid meets on two adjacent pentagon triangles
well covered Several alternatives are possible for address-ing the placement of sampling grids in different parts ofthe world One of course is to use this particular config-uration as it extends across the globe Second a less-spe-cific configuration could be used Third no singleconfiguration need be specified rather an adaptive solu-tion suited to any area of interest could be used
Several criteria are not important in choosing one of thesealternatives For making global or continental scale esti-mates of population attributes the lack of coherence amongdifferent geometries from different sampling designs is nota problem as long as the probability structures of the var-ious designs are known Mapping discrete or continuouspopulation distributions for the globe or for large areas ofthe globe also is not affected by different sampling geo-metries as long as the conversion to some standard coor-
Cartography and Geographic Information Systems 15
Del
iver
ed b
y P
ublis
hing
Tec
hnol
ogy
to O
rego
n S
tate
Uni
vers
ity IP
128
193
164
203
on
Wed
09
Nov
201
1 18
53
57C
opyr
ight
(c)
Car
togr
aphy
and
Geo
grap
hic
Info
rmat
ion
Soc
iety
All
right
s re
serv
ed
bullQ
~ ~~~ ~ bull ~_
middotmiddotdmiddot ~ ~~~ ~ ~lt ~ ~ middotmiddotmiddotmiddotmiddotmiddotmiddotmiddotmiddotmiddotmiddotC
Figure 10 Hexagons of the truncated icosahedron covering central North America and Alaska
of the corresponding polygons (Figure 13) Any of the threecan define an equal-area sampling network The triangulargrid and its corresponding hexagonal tessellation have theadvantage of being the most compact and isotropic Fur-thermore some modest statistical advantages accrue to thetriangular grid because of its geometric properties (Switzer1975 Olea 1984 Matern 1986) The square grid has theadvantage of most frequent and easy application The tri-angular tessellation and its corresponding hexagonal pointgrid appear to have little advantage for our application Wechoose to use the triangular grid to take advantage of com-pactness and greater directional freedom
Hierarchical Decomposition of Triangular GridsThe triangular grid can be decomposed in several waysThe theory for these decompositions is contained in thealgebraic theory of groups (Dacey 1964 Hudson 1967) The
16
three lowest-order decompositions (aside from the identitydecomposition) that maintain the triangular structure andhence uniform probabilities under randomization result inincreases in density by factors of 3 4 and 7 (The literatureof central place theory in economic geography describesthese hierarchies as applied to the dual tessellations of hex-agons [Chris taller 1966 Losch 1954)
To implement these decompositions we can develop al-gorithms for transforming a grid to a higher density Inorder to provide a consistent description each algorithmfor density enhancement is described as a transformationin the plane of a unit figure containing the additional pointsThe algorithms are applied to the unit figure associatedwith each original grid point For this presentation theoriginal grid is assumed to be aligned such that one of itsthree axes is parallel to the x axis of the cartesian grid
For the threefold enhancement the unit figure is an equi-lateral triangle with one vertex corresponding to a point
Cartography and Geographic Information Systems
Del
iver
ed b
y P
ublis
hing
Tec
hnol
ogy
to O
rego
n S
tate
Uni
vers
ity IP
128
193
164
203
on
Wed
09
Nov
201
1 18
53
57C
opyr
ight
(c)
Car
togr
aphy
and
Geo
grap
hic
Info
rmat
ion
Soc
iety
All
right
s re
serv
ed
Figure 11 The truncated icosahedron as placed on the globefor optimal coverage of the conterminous United StatesAlaska and Hawaii shown in three orthographic projections
on the original grid at the origin a second point at ( - V2- y32) and the third at (12 - Y32) The second andthird points of the unit figure are scaled by dly3 where dis the distance between points in the original grid androtated by -rr6 (Figure 14) Since there is three-way sym-metry in a triangular grid two threefold enhancements bringthe grid back into the original alignment An alternativeway to conceptualize this is by placing an additional point
at the geometric center of each triangle formed by threeneighboring points in the original grid (as for example inMandelbrot [1988])
For the fourfold enhancement the unit figure is a rhom-bus with one vertex corresponding to a point on the orig-inal grid at the origin a second point at (-12 - y32)a third at (12 - y32) and the fourth at (10) The lastthree points are scaled by d2 d defined as above Thereis no rotation in the fourfold enhancement (Figure 15) Analternative way to conceptualize this is by placing an ad-ditional point halfway between all pairs of neighboring pointsin the original grid
For the sevenfold enhancement the unit figure is a hex-agon whose center is a point on the original grid and whosevertices are (01) (- Y3212) (- Y32 - V2) (0 -1)(Y32 - V2) (Y32V2) The six points of the hexagon arescaled by d7 d defined as above and rotated by -arctan(13y3) (Figure 16) (See Richardson [1961] and van Roessel[1988] for related discussions) Alternating sevenfold en-hancements can realign with the original grid by alternatingthe sign of the angle of rotation
The geometric logic of enhancement applies as well toreductions of an original grid with the algorithms appro-priately inverted Furthermore these basic factors of en-hancement and reduction may be combined to achieve manyadditional factors Thus a sevenfold enhancement with afourfold reduction results in a 74 increase in density Inour application the enhancements will typically be used toincrease the density of sampling for rare resources and thereductions for periodic cycles of sampling in time
Base Grids for SamplingA hexagon is a convenient figure from which to create atriangular grid since the vertices and the center form aseven-point starting grid A suitable compromise between
Figure 12 The polar configuration of the truncated icosahedron shown in the Hammer-Aitoff projection
Cartography and Geographic Information Systems 17
Del
iver
ed b
y P
ublis
hing
Tec
hnol
ogy
to O
rego
n S
tate
Uni
vers
ity IP
128
193
164
203
on
Wed
09
Nov
201
1 18
53
57C
opyr
ight
(c)
Car
togr
aphy
and
Geo
grap
hic
Info
rmat
ion
Soc
iety
All
right
s re
serv
ed
(-1123-112)
bull(-112-312)
(00)II -----~
(10)bull(1123-112)
bull(112-312)
middot middot middot middot middotmiddot middot middot middot middotmiddot middot middot middot middot
(O-13)
bull
bull(112-1123)
bull
bull
bullbull
bull
bull
bullbull
bull
bull
bull
Figure 13 Regular tessellations in the plane with corre-sponding dual-point grids (a) Top Triangular tessellationwith hexagonal grid (b) Middle Square tessellation withsquare grid (c) Bottom Hexagonal tessellation with trian-gular grid
the desired spatial resolution of sampling and the projectedavailable financial resources can determine the density ofa base sampling grid For our application an approximately640 square krn hexagon tessellation about the points corre-sponding to a distance between sampling points of ap-proximately 27 kilometers has been suggested This canbe very closely realized with a decomposition of the hex-agon of the truncated icosahedron by a factor of 32 bull 45 ortwo enhancements by 3 followed by five enhancements by4 The increase in density is by a factor of 9216 corre-sponding to a linear increase by a factor of 96 Thus eachedge of the large hexagon can be divided into 96 equal partsand the derived points connected to obtain a triangular gridfor this base sampling density containing 27937 points
Addressing SystemsUniquely identifying points on the sampling grid is nec-essary for assigning attributes to the points The simplest
18
Figure 14 Threefold enhancement and reduction (a) TopUnit figure scaled to unit grid before rotation (b) MiddleAfter rotation by TT6 enhancement complete (c) BottomThree levels of the threefold decomposition hierarchy
system is to number sequentially by rows and to numberwithin rows of one of the axes of the grid Enhancementsin grid density require additional numbers or addressesin the sequence and a history of awarded numbers to avoidduplication Two other addressing systems merit attention
The first is a cross-reference system with existing coor-dinate systems The most useful of these is the standardgeographic system of latitude and longitude Each pointcan be assigned a pair of numbers in latitude and longitude(or a concatenated or interleaved single number) with suf-ficient precision to uniquely specify the point In particularsince the maximum distance that occurs in a 7S-minutequadrangle in the conterminous United States is less than20 kms and hence there can be no more than one basesampling point in any quad the numbering conventionadopted by the US Geological Survey for these large scaletopographic quadrangles could be effectively used (USGS1985) The potential for enhancement of density also com-plicates this approach requiring enough digits of precision
Cartography and Geographic Information Systems
Del
iver
ed b
y P
ublis
hing
Tec
hnol
ogy
to O
rego
n S
tate
Uni
vers
ity IP
128
193
164
203
on
Wed
09
Nov
201
1 18
53
57C
opyr
ight
(c)
Car
togr
aphy
and
Geo
grap
hic
Info
rmat
ion
Soc
iety
All
right
s re
serv
ed
(10)bull (0117)
(-f3l271127) ~(~Of~(3127112f1)
bull bull (10)I
(-f3l2f1-11217) ~ _--~ (31217-112f1)(O-117)
(-14-314)
bull(-12middot312)
(00) (1120)11------
bullbull - - - bull 4 (14-314)
bull(112-312)
bull(-12-312)
bull(112middot312)
bull bull bull bull bull(11433114)
(-217f3l7) r - - (51143114)I I bull I bull~ I
(-5I14-3114) __ ~ (217 3f7)11-
(-114-33114)
bull bull bull bull bullbull bull bull bull bull
Figure 15 Fourfold enhancement and reduction (a) TopUnit figure scaled to unit grid no rotation needed en-hancement complete (b) Bottom Three levels of the four-fold decomposition hierarchy bull bullto be reserved in advance or the use of additional identi-fication for enhanced grid points
The second system makes use of the decomposition ge-ometry to construct a single hierarchical identification sys-tem This approach is analogous to that of Dutton (1989)Goodchild and Shiren (1989) and Wickman and others (1974)for their respective polyhedral systems it is also analogousto that of Morton (1966) and Gargantini (1982) for squarehierarchies in the plane and Gibson and Lucas (1982) forhexagonal hierarchies in the plane (and higher dimen-sions) In our system of mixed hierarchies (Lindgren 1967Woldenberg 1982) both a radix or base number and a digitin that radix need to be specified In Figure 17 the digitconventions are given for the threefold fourfold and sev-enfold systems respectively At any finer level of the three-fold fourfold or sevenfold hierarchy a ternary quaternaryor septenary digit respectively uniquely identifies the pointsderived from a single point on the coarser level A two-digit address (without radix) is shown for a point in a two-level fourfold hierarchy in Figure 18a
When mixing hierarchies the composition of enhance-ments is commutative so that there is more than one ad-dress for a point but no two points can have the sameaddress One possible notation for addresses in the mixedenvironment is left-to-right concatenation of successive lev-els of decomposition with subscripts indicating the radicesAn example with a two-level fourfold-by-threefold hier-archy is shown in Figure 18b
Since the base grid is fixed in our application a conden-sation of addresses for these points may be achieved bycombining the two threefold enhancements into a nonan-ary (radix 9) digit followed by five quaternary digits forthe five fourfold enhancements With positional order as-
Cartography and Geographic Information Systems
bullbullbullbullbullbullbullbullbullbullbullbullbullbullbullbullbullbullbullbullbullbullbullbullbullbullbullbullbullbullbullbullbullbullbullbullbullbullbullbullbullbull
Figure 16 Sevenfold enhancement and reduction (a) TopUnit figure scaled to unit grid before rotation (b) MiddleAfter rotation by -tan-1(l3y13) enhancement complete (c)Bottom Three levels of the sevenfold decompositionhierarchy
signed and thus no radix digits required only a six-digitaddress for the baseline points is necessary for the decom-position from one of the four rhombuses or part rhom-buses (triangles) of the North American hexagon Addinga digit on the front of the address for the initial rhombusmakes a total of seven This scheme is shown in Figure 19The four rhombuses or parts are numbered as in the four-fold enhancement system Therefore for example therhombus beneath (to the south of) the center of the hexa-gon extending to but not induding the grid rows joiningthe three large hexagon vertices southeast south andsouthwest of the center is number 3 It is subdivided intonine rhombuses numbered 0 to 8 northwest to southeastwithin row and northeast to southwest across rows This
19
Del
iver
ed b
y P
ublis
hing
Tec
hnol
ogy
to O
rego
n S
tate
Uni
vers
ity IP
128
193
164
203
on
Wed
09
Nov
201
1 18
53
57C
opyr
ight
(c)
Car
togr
aphy
and
Geo
grap
hic
Info
rmat
ion
Soc
iety
All
right
s re
serv
ed
bull bull
bullbull bull bull bull bull bull bullbull
bullbullbullbullbullbullbullbullbullbull
Figure 17 The three addressing systems (a) Top Threefoldsystem (b) Middle Fourfold system (c) Bottom Sevenfoldsystem
accounts for the two threefold enhancements in the base-line grid Rhombuses are then successively quartered fivetimes to identify a single point An example address on thegrid of the North American hexagon is shown in Figure 20Alternatively four of the five fourfold enhancements couldbe represented by two hexadecimal digits with a singlequaternary digit at the end further condensing the ad-
20
3Figure 19 Baseline addressing scheme for a hexagon fromthe truncated icosahedron The five highest-order digits areshown in one area
dress This addressing system could form the basis for amodified quad tree storage system where the second levelhas nonanary rather than quaternary nodes requiringmodifications to quad tree access and searching algorithms
Cartography and Geographic Information Systems
Del
iver
ed b
y P
ublis
hing
Tec
hnol
ogy
to O
rego
n S
tate
Uni
vers
ity IP
128
193
164
203
on
Wed
09
Nov
201
1 18
53
57C
opyr
ight
(c)
Car
togr
aphy
and
Geo
grap
hic
Info
rmat
ion
Soc
iety
All
right
s re
serv
ed
~ bull- bull-
Figure 20 Baseline sampling grid with addressing for theNorth American hexagon The darkened points address is3321320 or 339EOusing hexadecimal condensation
For identifying sample points uniquely across adjacentfaces of the truncated icosahedron model an additionallevel of addressing would be necessary to specify the facePoints introduced in the seam between two faces also wouldneed special treatment For points derived from a differentglobal configuration of the truncated icosahedron identi-fication of the configuration also would be necessary
SummaryWe have described the cartography and geometry of a sam-pling design that can address a wide variety of environ-mental issues especially the assessment of the environmentalquality of major ecological resources This design is fun-damentally based upon a systematic grid of sampling lo-cations placed on the plane of an equal-area map projectionfrom the surface of the earth The plane can be construedas the face of a regular geometric model fit to the surfaceof the earth The faces of the geometric model provide anappropriate compromise between large-enough areas ofcoverage and small-enough distortion characteristics of themap projection upon them The plane grid is placed in atriangular pattern with a regular geometry for varying thedensity and with several options for addressing the points
ACKNOWLEDGMENTSWe would like to acknowledge the contributions of Waldo ToblerGeoffreyDutton Hrovoje Lukatela and MichaelGoodchild to ourunderstanding of the issues in global geometry and to thank JohnSnyder for inspiration and advice on map projections We alsothank Rick Linthurst Jay Messer and Dan McKenzie of EPAsEnvironmental Monitoring and Assessment Program for encour-
Cartography and Geographic Information Systems
aging and sponsoring our work This research has been supportedby EPA contracts 68-C8-0006with METI 68-03-3439with Kilke1lyEnvironmental Associates 68-CO-0021with Technical ResourcesInc and cooperative agreement CR816721with Oregon StateUniversity
REFERENCES
BaileyHP 1956Two Grid Systems that Divide the Entire Sur-faceof the Earth into Quadrilaterals of EqualArea TransactionsAmerican Geophysical Union vol 37 no 5 pp 628-635
Bradley AD 1946 Equal-Area Projection on the IcosahedronGeographical Review vol 36 no 1 pp 101-104
Christaller W 1966The Central Places of Southern Germany trans-lated by C Baskin Englewood CliffsNew Jersey Prentice Hall
Cochran WG 1977Sampling Techniques third edition New York-John Wiley and Sons
Coxeter HSM 1948 Regular Polytopes London Methuen andCompany Ltd
CoxeterHSM 1969Introduction to Geometry second edition NewYorkJohn Wiley and Sons
Dacey MF 1964A Note on Some Number Properties of a Hex-agonal HierarchicalPlane Lattice Journal of Regional Science vol5 no 2 pp 63-67
Dutton GH 1989Modeling Locational Uncertainty via Hierar-chicalTessellation Accuracy of Spatial Databases MF Goodchildand S Gopal (eds) London Taylor amp Francis
Fekete G 1990 Sphere Quadtrees A New Data Structure toSupport the Visualization of Spherically Distributed Data Pro-ceedings of the SPIESPSE Symposium on Electronic Imaging Scienceand Technology
Gargantini I 1982 An Effective Way to Represent QuadtreesCommunications of the Association for Computing Machinery vol 25no 12 pp 905-910
Gasson PC 1983Geometry of Spatial Forms Chichester EnglandEllisHorwood Limited
Gibson L and D Lucas 1982 Spatial Data Processing UsingBalanced Ternary Proceedings of the IEEE Computer Society Con-ference on Pattern Recognition and Image Processing pp 566-571
Goodchild MF and Y Shiren 1989A HierarchicalSpatial DataStructure for Global Geographic Information Systems Tech-nical Paper 89-5 National Center for Geographic Informationand Analysis University of California Santa Barbara
HudsonJc 1967An AlgebraicRelationbetween the Losch andChristaller Central Place Networks The Professional Geographervol 19 no 3 pp 133-135
Lindgren CES 1967The Geometry of Mixed Hexagonal Hier-archies in the Context of Central PlaceTheory Harvard Papersin Theoretical Geography No7 Laboratory for ComputerGraphics and Spatial Analysis Graduate Schoolof Design Har-vard University
Losch A 1954The Economics of Location translated by WH Wog-10mand WF Stolper New Haven Connecticut YaleUniversityPress
Lukatela H 1987 Hipparchus Geopositioning Model An Ov-erview Proceedings Auto-Carta 8 pp 87-96
Lyustemik LA 1963Convex Figures and Polyhedra translated byTJ Smith New York Dover Publications
Mandelbrot BB 1988 Fractal Landscapes without Creases andwith Rivers The Science of Fractal Images HC Peitgen and DSaupe (eds) New York Springer-Verlag
Matern B 1986 Spatial Variation second edition Lecture Notesin Statistics no 36 Berlin Springer-Verlag
Mark DM and JP Lauzon 1985 Approaches for Quadtree-Based Geographic Information Systems at Continental or GlobalScales Proceedings Auto-Carta 7 pp 355-364
21
Del
iver
ed b
y P
ublis
hing
Tec
hnol
ogy
to O
rego
n S
tate
Uni
vers
ity IP
128
193
164
203
on
Wed
09
Nov
201
1 18
53
57C
opyr
ight
(c)
Car
togr
aphy
and
Geo
grap
hic
Info
rmat
ion
Soc
iety
All
right
s re
serv
ed
Messer JJ RA Linthurst and WS Overton 1991 An EPAProgram for Monitoring Ecological Status and Trends Environ-mental Monitoring and Assessment no 17 pp 67-78
Morton G 1966 A Computer-Oriented Geodetic Data Base anda New Technique in File Sequencing Internal memorandumInternational Business Machines Canada Ltd
Olea RA 1984 Sampling Design Optimization for Spatial Func-tions Mathematical Geology vol 16 no 4 pp 369-392
Paul MK 1973 On Computation of Equal Area Blocks BulletinGrodesique no 107 pp 73-84
Pearce P and S Pearce 1978 Polyhedra Primer New York VanNostrand Reinhold Company
Popko E 1968 Geodesics Detroit University of Detroit PressRichardson LF 1961 The Problem of Contiguity General Sys-
tems no 6 pp 139-187Samet H 1984 The Quadtree and Related Hierarchical Data
Structures Association for Computing Machinery Computing Sur-veys vol 16 no 2 pp 187-260
Snyder JP 1987 Map Projections-A Working Manual US Geo-logical Survey Professional Paper 1395
Snyder JP 1991 An Equal-Area Map Projection for PolyhedralGlobes Manuscript submitted for publication
22
Switzer P 1975 Estimation of the Accuracy of Qualitative MapsDisplay and Analysis of Spatial Data Je Davis and MJ Mc-Cullagh (eds) New York John Wiley and Sons
Tobler W and Z-t Chen 1986 A Quadtree for Global Infor-mation Storage Geographical Analysis vol 18 no 4 pp 360-371
Upton G and B Fingleton 1985 Spatial Data Analysis by ExamplePoint Pattern and Quantitative Data Chichester England JohnWiley and Sons
US Geological Survey 1985 and other dates Indices to Topo-graphic and Other Map Coverage (by state) National MappingDivision
van Roessel JW 1988 Conversion of Cartesian Coordinates fromand to Generalized Balanced Ternary Addresses Photogram-metric Engineering and Remote Sensing vol 54 no 11 pp 1565-1570
Wickman FE E Elvers and K Edvarson 1974 A System ofDomains for Global Sampling Problems Geografisker AnnalerSeries A vol 56 nos 3-4 pp 201-212
Woldenberg MJ 1979 A Periodic Table of Spatial HierarchiesPhilosophy in Geography S Gale and G Olsson (eds) DordrechtThe Netherlands D Reidel Publishing Company
Cartography and Geographic Information Systems
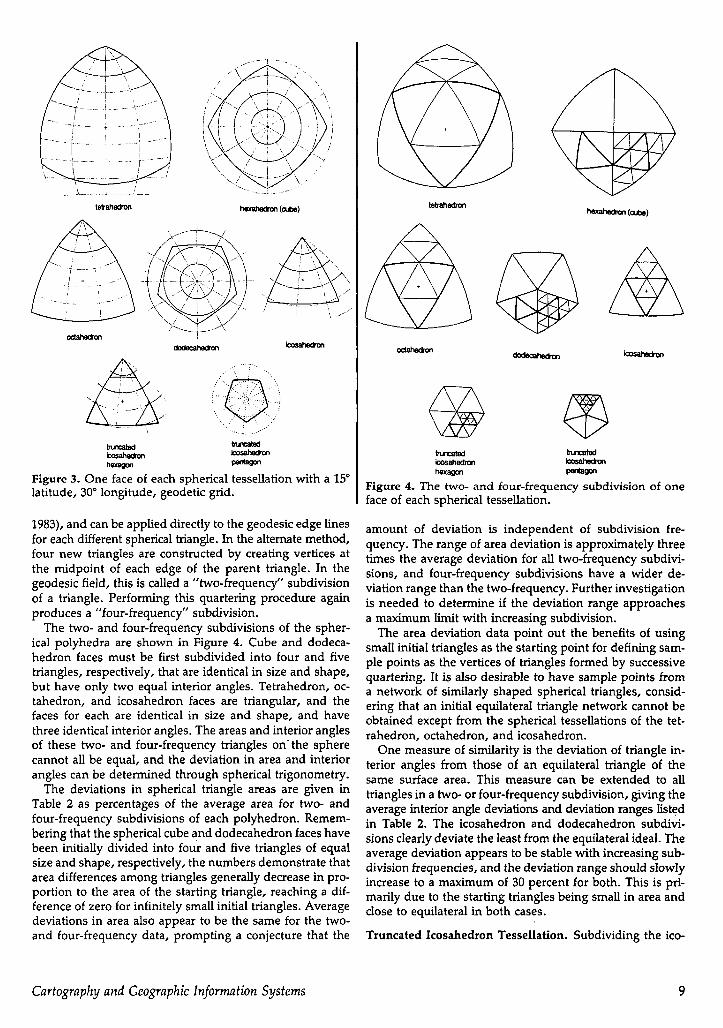
Del
iver
ed b
y P
ublis
hing
Tec
hnol
ogy
to O
rego
n S
tate
Uni
vers
ity IP
128
193
164
203
on
Wed
09
Nov
201
1 18
53
57C
opyr
ight
(c)
Car
togr
aphy
and
Geo
grap
hic
Info
rmat
ion
Soc
iety
All
right
s re
serv
ed
(10)bull (0117)
(-f3l271127) ~(~Of~(3127112f1)
bull bull (10)I
(-f3l2f1-11217) ~ _--~ (31217-112f1)(O-117)
(-14-314)
bull(-12middot312)
(00) (1120)11------
bullbull - - - bull 4 (14-314)
bull(112-312)
bull(-12-312)
bull(112middot312)
bull bull bull bull bull(11433114)
(-217f3l7) r - - (51143114)I I bull I bull~ I
(-5I14-3114) __ ~ (217 3f7)11-
(-114-33114)
bull bull bull bull bullbull bull bull bull bull
Figure 15 Fourfold enhancement and reduction (a) TopUnit figure scaled to unit grid no rotation needed en-hancement complete (b) Bottom Three levels of the four-fold decomposition hierarchy bull bullto be reserved in advance or the use of additional identi-fication for enhanced grid points
The second system makes use of the decomposition ge-ometry to construct a single hierarchical identification sys-tem This approach is analogous to that of Dutton (1989)Goodchild and Shiren (1989) and Wickman and others (1974)for their respective polyhedral systems it is also analogousto that of Morton (1966) and Gargantini (1982) for squarehierarchies in the plane and Gibson and Lucas (1982) forhexagonal hierarchies in the plane (and higher dimen-sions) In our system of mixed hierarchies (Lindgren 1967Woldenberg 1982) both a radix or base number and a digitin that radix need to be specified In Figure 17 the digitconventions are given for the threefold fourfold and sev-enfold systems respectively At any finer level of the three-fold fourfold or sevenfold hierarchy a ternary quaternaryor septenary digit respectively uniquely identifies the pointsderived from a single point on the coarser level A two-digit address (without radix) is shown for a point in a two-level fourfold hierarchy in Figure 18a
When mixing hierarchies the composition of enhance-ments is commutative so that there is more than one ad-dress for a point but no two points can have the sameaddress One possible notation for addresses in the mixedenvironment is left-to-right concatenation of successive lev-els of decomposition with subscripts indicating the radicesAn example with a two-level fourfold-by-threefold hier-archy is shown in Figure 18b
Since the base grid is fixed in our application a conden-sation of addresses for these points may be achieved bycombining the two threefold enhancements into a nonan-ary (radix 9) digit followed by five quaternary digits forthe five fourfold enhancements With positional order as-
Cartography and Geographic Information Systems
bullbullbullbullbullbullbullbullbullbullbullbullbullbullbullbullbullbullbullbullbullbullbullbullbullbullbullbullbullbullbullbullbullbullbullbullbullbullbullbullbullbull
Figure 16 Sevenfold enhancement and reduction (a) TopUnit figure scaled to unit grid before rotation (b) MiddleAfter rotation by -tan-1(l3y13) enhancement complete (c)Bottom Three levels of the sevenfold decompositionhierarchy
signed and thus no radix digits required only a six-digitaddress for the baseline points is necessary for the decom-position from one of the four rhombuses or part rhom-buses (triangles) of the North American hexagon Addinga digit on the front of the address for the initial rhombusmakes a total of seven This scheme is shown in Figure 19The four rhombuses or parts are numbered as in the four-fold enhancement system Therefore for example therhombus beneath (to the south of) the center of the hexa-gon extending to but not induding the grid rows joiningthe three large hexagon vertices southeast south andsouthwest of the center is number 3 It is subdivided intonine rhombuses numbered 0 to 8 northwest to southeastwithin row and northeast to southwest across rows This
19
Del
iver
ed b
y P
ublis
hing
Tec
hnol
ogy
to O
rego
n S
tate
Uni
vers
ity IP
128
193
164
203
on
Wed
09
Nov
201
1 18
53
57C
opyr
ight
(c)
Car
togr
aphy
and
Geo
grap
hic
Info
rmat
ion
Soc
iety
All
right
s re
serv
ed
bull bull
bullbull bull bull bull bull bull bullbull
bullbullbullbullbullbullbullbullbullbull
Figure 17 The three addressing systems (a) Top Threefoldsystem (b) Middle Fourfold system (c) Bottom Sevenfoldsystem
accounts for the two threefold enhancements in the base-line grid Rhombuses are then successively quartered fivetimes to identify a single point An example address on thegrid of the North American hexagon is shown in Figure 20Alternatively four of the five fourfold enhancements couldbe represented by two hexadecimal digits with a singlequaternary digit at the end further condensing the ad-
20
3Figure 19 Baseline addressing scheme for a hexagon fromthe truncated icosahedron The five highest-order digits areshown in one area
dress This addressing system could form the basis for amodified quad tree storage system where the second levelhas nonanary rather than quaternary nodes requiringmodifications to quad tree access and searching algorithms
Cartography and Geographic Information Systems
Del
iver
ed b
y P
ublis
hing
Tec
hnol
ogy
to O
rego
n S
tate
Uni
vers
ity IP
128
193
164
203
on
Wed
09
Nov
201
1 18
53
57C
opyr
ight
(c)
Car
togr
aphy
and
Geo
grap
hic
Info
rmat
ion
Soc
iety
All
right
s re
serv
ed
~ bull- bull-
Figure 20 Baseline sampling grid with addressing for theNorth American hexagon The darkened points address is3321320 or 339EOusing hexadecimal condensation
For identifying sample points uniquely across adjacentfaces of the truncated icosahedron model an additionallevel of addressing would be necessary to specify the facePoints introduced in the seam between two faces also wouldneed special treatment For points derived from a differentglobal configuration of the truncated icosahedron identi-fication of the configuration also would be necessary
SummaryWe have described the cartography and geometry of a sam-pling design that can address a wide variety of environ-mental issues especially the assessment of the environmentalquality of major ecological resources This design is fun-damentally based upon a systematic grid of sampling lo-cations placed on the plane of an equal-area map projectionfrom the surface of the earth The plane can be construedas the face of a regular geometric model fit to the surfaceof the earth The faces of the geometric model provide anappropriate compromise between large-enough areas ofcoverage and small-enough distortion characteristics of themap projection upon them The plane grid is placed in atriangular pattern with a regular geometry for varying thedensity and with several options for addressing the points
ACKNOWLEDGMENTSWe would like to acknowledge the contributions of Waldo ToblerGeoffreyDutton Hrovoje Lukatela and MichaelGoodchild to ourunderstanding of the issues in global geometry and to thank JohnSnyder for inspiration and advice on map projections We alsothank Rick Linthurst Jay Messer and Dan McKenzie of EPAsEnvironmental Monitoring and Assessment Program for encour-
Cartography and Geographic Information Systems
aging and sponsoring our work This research has been supportedby EPA contracts 68-C8-0006with METI 68-03-3439with Kilke1lyEnvironmental Associates 68-CO-0021with Technical ResourcesInc and cooperative agreement CR816721with Oregon StateUniversity
REFERENCES
BaileyHP 1956Two Grid Systems that Divide the Entire Sur-faceof the Earth into Quadrilaterals of EqualArea TransactionsAmerican Geophysical Union vol 37 no 5 pp 628-635
Bradley AD 1946 Equal-Area Projection on the IcosahedronGeographical Review vol 36 no 1 pp 101-104
Christaller W 1966The Central Places of Southern Germany trans-lated by C Baskin Englewood CliffsNew Jersey Prentice Hall
Cochran WG 1977Sampling Techniques third edition New York-John Wiley and Sons
Coxeter HSM 1948 Regular Polytopes London Methuen andCompany Ltd
CoxeterHSM 1969Introduction to Geometry second edition NewYorkJohn Wiley and Sons
Dacey MF 1964A Note on Some Number Properties of a Hex-agonal HierarchicalPlane Lattice Journal of Regional Science vol5 no 2 pp 63-67
Dutton GH 1989Modeling Locational Uncertainty via Hierar-chicalTessellation Accuracy of Spatial Databases MF Goodchildand S Gopal (eds) London Taylor amp Francis
Fekete G 1990 Sphere Quadtrees A New Data Structure toSupport the Visualization of Spherically Distributed Data Pro-ceedings of the SPIESPSE Symposium on Electronic Imaging Scienceand Technology
Gargantini I 1982 An Effective Way to Represent QuadtreesCommunications of the Association for Computing Machinery vol 25no 12 pp 905-910
Gasson PC 1983Geometry of Spatial Forms Chichester EnglandEllisHorwood Limited
Gibson L and D Lucas 1982 Spatial Data Processing UsingBalanced Ternary Proceedings of the IEEE Computer Society Con-ference on Pattern Recognition and Image Processing pp 566-571
Goodchild MF and Y Shiren 1989A HierarchicalSpatial DataStructure for Global Geographic Information Systems Tech-nical Paper 89-5 National Center for Geographic Informationand Analysis University of California Santa Barbara
HudsonJc 1967An AlgebraicRelationbetween the Losch andChristaller Central Place Networks The Professional Geographervol 19 no 3 pp 133-135
Lindgren CES 1967The Geometry of Mixed Hexagonal Hier-archies in the Context of Central PlaceTheory Harvard Papersin Theoretical Geography No7 Laboratory for ComputerGraphics and Spatial Analysis Graduate Schoolof Design Har-vard University
Losch A 1954The Economics of Location translated by WH Wog-10mand WF Stolper New Haven Connecticut YaleUniversityPress
Lukatela H 1987 Hipparchus Geopositioning Model An Ov-erview Proceedings Auto-Carta 8 pp 87-96
Lyustemik LA 1963Convex Figures and Polyhedra translated byTJ Smith New York Dover Publications
Mandelbrot BB 1988 Fractal Landscapes without Creases andwith Rivers The Science of Fractal Images HC Peitgen and DSaupe (eds) New York Springer-Verlag
Matern B 1986 Spatial Variation second edition Lecture Notesin Statistics no 36 Berlin Springer-Verlag
Mark DM and JP Lauzon 1985 Approaches for Quadtree-Based Geographic Information Systems at Continental or GlobalScales Proceedings Auto-Carta 7 pp 355-364
21
Del
iver
ed b
y P
ublis
hing
Tec
hnol
ogy
to O
rego
n S
tate
Uni
vers
ity IP
128
193
164
203
on
Wed
09
Nov
201
1 18
53
57C
opyr
ight
(c)
Car
togr
aphy
and
Geo
grap
hic
Info
rmat
ion
Soc
iety
All
right
s re
serv
ed
Messer JJ RA Linthurst and WS Overton 1991 An EPAProgram for Monitoring Ecological Status and Trends Environ-mental Monitoring and Assessment no 17 pp 67-78
Morton G 1966 A Computer-Oriented Geodetic Data Base anda New Technique in File Sequencing Internal memorandumInternational Business Machines Canada Ltd
Olea RA 1984 Sampling Design Optimization for Spatial Func-tions Mathematical Geology vol 16 no 4 pp 369-392
Paul MK 1973 On Computation of Equal Area Blocks BulletinGrodesique no 107 pp 73-84
Pearce P and S Pearce 1978 Polyhedra Primer New York VanNostrand Reinhold Company
Popko E 1968 Geodesics Detroit University of Detroit PressRichardson LF 1961 The Problem of Contiguity General Sys-
tems no 6 pp 139-187Samet H 1984 The Quadtree and Related Hierarchical Data
Structures Association for Computing Machinery Computing Sur-veys vol 16 no 2 pp 187-260
Snyder JP 1987 Map Projections-A Working Manual US Geo-logical Survey Professional Paper 1395
Snyder JP 1991 An Equal-Area Map Projection for PolyhedralGlobes Manuscript submitted for publication
22
Switzer P 1975 Estimation of the Accuracy of Qualitative MapsDisplay and Analysis of Spatial Data Je Davis and MJ Mc-Cullagh (eds) New York John Wiley and Sons
Tobler W and Z-t Chen 1986 A Quadtree for Global Infor-mation Storage Geographical Analysis vol 18 no 4 pp 360-371
Upton G and B Fingleton 1985 Spatial Data Analysis by ExamplePoint Pattern and Quantitative Data Chichester England JohnWiley and Sons
US Geological Survey 1985 and other dates Indices to Topo-graphic and Other Map Coverage (by state) National MappingDivision
van Roessel JW 1988 Conversion of Cartesian Coordinates fromand to Generalized Balanced Ternary Addresses Photogram-metric Engineering and Remote Sensing vol 54 no 11 pp 1565-1570
Wickman FE E Elvers and K Edvarson 1974 A System ofDomains for Global Sampling Problems Geografisker AnnalerSeries A vol 56 nos 3-4 pp 201-212
Woldenberg MJ 1979 A Periodic Table of Spatial HierarchiesPhilosophy in Geography S Gale and G Olsson (eds) DordrechtThe Netherlands D Reidel Publishing Company
Cartography and Geographic Information Systems
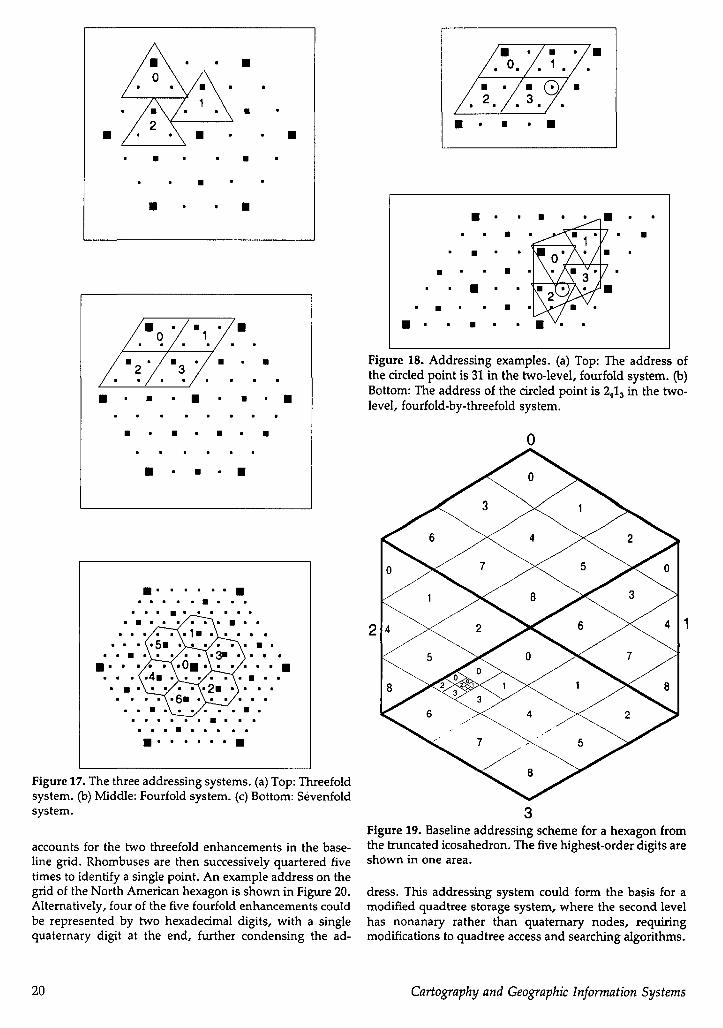
Del
iver
ed b
y P
ublis
hing
Tec
hnol
ogy
to O
rego
n S
tate
Uni
vers
ity IP
128
193
164
203
on
Wed
09
Nov
201
1 18
53
57C
opyr
ight
(c)
Car
togr
aphy
and
Geo
grap
hic
Info
rmat
ion
Soc
iety
All
right
s re
serv
ed
Messer JJ RA Linthurst and WS Overton 1991 An EPAProgram for Monitoring Ecological Status and Trends Environ-mental Monitoring and Assessment no 17 pp 67-78
Morton G 1966 A Computer-Oriented Geodetic Data Base anda New Technique in File Sequencing Internal memorandumInternational Business Machines Canada Ltd
Olea RA 1984 Sampling Design Optimization for Spatial Func-tions Mathematical Geology vol 16 no 4 pp 369-392
Paul MK 1973 On Computation of Equal Area Blocks BulletinGrodesique no 107 pp 73-84
Pearce P and S Pearce 1978 Polyhedra Primer New York VanNostrand Reinhold Company
Popko E 1968 Geodesics Detroit University of Detroit PressRichardson LF 1961 The Problem of Contiguity General Sys-
tems no 6 pp 139-187Samet H 1984 The Quadtree and Related Hierarchical Data
Structures Association for Computing Machinery Computing Sur-veys vol 16 no 2 pp 187-260
Snyder JP 1987 Map Projections-A Working Manual US Geo-logical Survey Professional Paper 1395
Snyder JP 1991 An Equal-Area Map Projection for PolyhedralGlobes Manuscript submitted for publication
22
Switzer P 1975 Estimation of the Accuracy of Qualitative MapsDisplay and Analysis of Spatial Data Je Davis and MJ Mc-Cullagh (eds) New York John Wiley and Sons
Tobler W and Z-t Chen 1986 A Quadtree for Global Infor-mation Storage Geographical Analysis vol 18 no 4 pp 360-371
Upton G and B Fingleton 1985 Spatial Data Analysis by ExamplePoint Pattern and Quantitative Data Chichester England JohnWiley and Sons
US Geological Survey 1985 and other dates Indices to Topo-graphic and Other Map Coverage (by state) National MappingDivision
van Roessel JW 1988 Conversion of Cartesian Coordinates fromand to Generalized Balanced Ternary Addresses Photogram-metric Engineering and Remote Sensing vol 54 no 11 pp 1565-1570
Wickman FE E Elvers and K Edvarson 1974 A System ofDomains for Global Sampling Problems Geografisker AnnalerSeries A vol 56 nos 3-4 pp 201-212
Woldenberg MJ 1979 A Periodic Table of Spatial HierarchiesPhilosophy in Geography S Gale and G Olsson (eds) DordrechtThe Netherlands D Reidel Publishing Company
Cartography and Geographic Information Systems