appendix b. weighting the ndns core sample
TRANSCRIPT

Appendix B. Weighting the NDNS core sample Sarah Tipping
B.1 Introduction
NDNS requires weights to adjust for differences in sample selection and response. The
weights adjust for differential selection probabilities of households and individuals, non-
response to the individual questionnaire, non-response to the nurse visit and non-
response to providing a blood sample. Non-response weights were generated using
logistic regression modelling and calibration. Figures presented in this report are based
on weighted data.1
B.2 Selection weights
Selection weights are required to correct for the unequal selection of:
1. dwelling units at multi dwelling unit2 addresses,
2. catering units at multi catering unit3 addresses,
3. individuals within dwelling or catering units, and
4. the sample across months.
Most addresses selected from the Postcode Address File (PAF) contain a single
dwelling unit. However, a small number of addresses contain multiple dwelling units; at
these addresses the interviewer selected one dwelling unit at random using a Kish grid.4
The selected dwelling unit was then included in the sample. The dwelling unit selection
weights (w1) adjust for this selection. The weights are equivalent to the number of
dwelling units identified at the address and were trimmed at three to avoid any large
values. The dwelling unit selection weights ensure dwelling units at addresses
containing more than one are not under-represented in the issued sample.
At each selected dwelling unit the interviewer enumerated the number of catering units
and selected one at random using a Kish grid.4 The catering unit selection weights (w2)
adjust for this selection of catering units. The catering unit selection weights ensure that
National Diet and Nutrition Survey Headline results from Years 1 and 2 (combined)of the Rolling Programme (2008/2009 - 2009/10). Supplementary report: Blood analytes 1
catering units in multi-occupied dwelling units or addresses are not under-represented
in the sample.
The selection of individuals within catering units depended on the selection ‘type’ of the
address. Each sample point contained nine general sample addresses and 18 child
boost addresses. At general sample addresses one adult (aged 19 years and over) and,
where available, one child (aged 1.5 to 18 years) were selected at random from each
responding catering unit by the interviewer. At child boost addresses one child was
selected at random by the interviewer. Adults and children were weighted separately as
they will always be analysed separately, hence this sample design feature reduced
costs but does not increase the degree of clustering in the sample.
Individual selection weights (w3) are required to ensure individuals in larger catering
units are not under-represented in the sample. The individual selection weight is the
inverse of the individual selection probabilities. For adults this is equivalent to the
number of eligible adults in the catering unit, for children this is the number of eligible
children in the catering unit. Pregnant or breastfeeding women were not eligible for the
survey and were excluded from selection.
Prior to the launch of Year 1 fieldwork, NDNS used a ‘Run In’ sample to test field
procedures. The Run In sample was selected alongside the Year 1 sample using the
same methods and was subsequently incorporated into the Year 1 data. The Run In
sample was carried out in February and March 2008, therefore an additional set of
weights were needed to correct for the unequal distribution of the sample across
months in Year 1. The Run In sample weights (w4) ensure the full sample (the Year 1
sample plus Run In and the Year 2 sample) is seasonally representative.
The combined selection weight (wsel) is the product of the dwelling unit, catering unit
and individual selection weights and the Run In weight.
National Diet and Nutrition Survey Headline results from Years 1 and 2 (combined)of the Rolling Programme (2008/2009 - 2009/10). Supplementary report: Blood analytes 2

B.3 Individual calibration weight
A set of household weights were not required as all analyses have been carried out at
the individual level; any information collected about the household or catering unit has
been reported in terms of the individual.
A set of individual weights were generated for the analysis of fully responding
individuals (the 2,126 individuals who responded to the individual interview and
completed three or four food diary days). These weights were generated using
calibration methods. The aim was to reduce bias resulting from sampling error and
differential non-response by age and sex and Government Office Region to the
individual interview. An iterative procedure was used to adjust a starting weight until the
distribution of the (weighted) sample matched that of the population for a set of key
variables. The adjustment kept the values of the final weights as close as possible to
those of the initial weights, which ensured the properties of the initial weights were
retained in the final calibrated weights. The composite selection weights (wsel),
described in section B.2, were used as the initial weights.
The key variables used to create the individual weight were: age (grouped); by sex; and
Government Office Region. The population figures used were taken from the 2009 mid-
year population estimates.5 The calibration was run separately for adults and children,
children from the general sample and child boost addresses were weighted together as
the two samples of children should be analysed together. The figures used for weighting
adults are shown in Table B.1; those used for weighting children are shown in Table
B.2. (Tables B.1, B.2)
The calibration weights generated were re-scaled so that the sum of the weights
equalled the number of participating individuals; these are the final individual weights for
the core sample (wti_adY12 and wti_chY12). Thus the final individual weights adjust for
dwelling unit, catering unit and individual selection, the Year 1 Run In sample, and for
the age/sex and regional profiles of participating individuals.
National Diet and Nutrition Survey Headline results from Years 1 and 2 (combined)of the Rolling Programme (2008/2009 - 2009/10). Supplementary report: Blood analytes 3
B.4 Nurse interview non-response weight
Participants who completed three or four food diary days (i.e. those deemed fully
productive) were asked for their consent for a nurse to contact them to arrange a visit.
Approximately three quarters of these participants (76% of adults, 77% of children) went
on to do a nurse interview. Non-response weights were generated to adjust for
differences between participants and non-participants to the nurse visit. These weights
have been used for all analyses of nurse level data.
A number of cross-tabulations were run and chi-square tests used to check which
variables from the individual and household questionnaires had a significant relationship
with nurse visit response. These variables were then used in the weighting.
The first step in creating the nurse weights was to model response behaviour using
logistic regression.6 A logistic regression models the relationship between an outcome
variable (response to the nurse interview) and a set of predictor variables. The predictor
variables were a set of socio-demographic, participant and household/catering unit
characteristics collected during the interview. Adults and children were modelled
separately. The model generated a predicted probability for each participant. This is the
probability the participant would take part in the nurse interview, given the
characteristics of the individual and the household/catering unit. Participants with
characteristics associated with non-response were under-represented in the nurse
sample and therefore receive a low predicted probability. These predicted probabilities
were then used to generate a set of non-response weights; participants with a low
predicted probability got a larger weight, increasing their representation in the sample.
The full non-response models for adults and children are given in Tables B.3 and B.4. (Tables B.3, B.4)
The final stage of designing the nurse weights was to calibrate the weights produced by
the non-response model. The weighting totals were estimates based on weighted data
from the individual questionnaire. This stage of weighting makes participants to the
nurse visit match the population distribution in terms of age, sex and Government Office
National Diet and Nutrition Survey Headline results from Years 1 and 2 (combined)of the Rolling Programme (2008/2009 - 2009/10). Supplementary report: Blood analytes 4

Region and match the weighted participants to the individual questionnaire in terms of
household size, ethnicity of Main Food Provider (MFP) and economic activity of the
Household Reference Person (HRP). The figures used for weighting adults are shown
in the first column of Table B.9; those used for weighting children are shown in the first
column of Table B.10. The initial weights were the weights from the non-response
model. (Tables B.9, B.10)
As before the calibration weights were re-scaled so that the sum of the weights equalled
the number of participants who had a nurse visit. These are the final nurse weights for
the core sample (wtn_adY12 and wtn_chY12) and adjust for unequal selection, non-
response to the household/MFP and individual interviews and non-response to the
nurse visit.
B.5 Effective sample size
The effect of the sample design on the precision of survey estimates is indicated by the
effective sample size (neff). The effective sample size measures the size of an
(unweighted) simple random sample that would achieve the same precision (standard
error) as the design being implemented. If the effective sample size is close to the
actual sample size then the design is efficient and has a good level of precision. The
lower the effective sample size, the lower the level of precision. The actual sample size
of individual interviews/participants is 1,031 and the effective sample size is 837. This
means the individual sample has the same level of precision as a simple random
sample of 837 hence a 95% confidence interval around an estimate of 50% is (46.6%,
53.4%). Had the effective sample size been 1,031, and therefore equal to the actual
sample size, the confidence intervals would have been (46.9%, 53.1%). Large
fluctuations in the size of the selection probabilities (and therefore large fluctuations in
the size of the selection weights) will cause the effective sample size to be low
compared with the actual sample size. Samples that select one person per household
tend to have lower efficiency than samples that select all household members due to
the selection weights required to make the sample representative. However, this aspect
National Diet and Nutrition Survey Headline results from Years 1 and 2 (combined)of the Rolling Programme (2008/2009 - 2009/10). Supplementary report: Blood analytes 5

of the sample design was unavoidable in NDNS as eating habits are so highly
correlated within households.
The efficiency of a sample is given by the ratio of the effective sample size to the actual
sample size. The individual sample has an efficiency of 81%. Table B.5 shows the
effective sample size and efficiency of the final individual and nurse weights.
(Table B.5)
In addition to the weights, the precision of estimates is also affected by the degree to
which the sample is clustered. The NDNS sample was clustered within geographical
areas to reduce fieldwork costs. A high degree of clustering can have a negative impact
on the precision of the survey estimates, since individuals within a cluster tend to be
more alike. Design factors (defts) show the extent to which the sample design has
increased the standard error and can be used to assess the impact of clustering. The
effects of clustering vary; it impacts more on some survey estimates than others. Table
B.6 shows the design factors due to clustering for a number of estimates. Other
elements of the sample design have been ignored to enable the impact of clustering to
be isolated. Whilst the impact on some estimates is relatively large, the overall effects
are small. For example, the estimate for children of the mean proportion of food energy
taken from saturated fat has a design factor of 1.11, this means the standard error (and
therefore confidence interval) around this estimate was increased by 11% by the
clustered design. (Table B.6)
B.6 Impact of the weights
The impact of the non-response and selection weights on the data can be seen in
Tables B.7 to B.10. Tables B.7 and B.8 compare weighted fully productive individuals
(those completing three or four food diary days) to the UK population. Tables B.9 and
B.10 compare those visited by a nurse to individuals who responded to the individual
interview and completed at least three food diary days.
(Tables B.7 to B.10)
National Diet and Nutrition Survey Headline results from Years 1 and 2 (combined)of the Rolling Programme (2008/2009 - 2009/10). Supplementary report: Blood analytes 6

B.7 Alcohol and smoking weight An additional weight was required for a specific analysis of smoking behaviour and
alcohol use of individuals aged 16 years and over. The alcohol and smoking weight
allows the results for young people aged 16 to 18 years to be analysed with the results
for adults aged 19 years and over. This weight was generated for all core sample
participants at general sample addresses7 who were aged 16 years and over and had
competed an individual interview and at least three food diary days. A nurse weight was
not required for this specific sample. As before, calibration methods were used to
generate the weights. The initial weight was the composite selection weight (wsel),
described in section B.2. This weight was adjusted using an iterative procedure to give
a final weight (wti_adY1216) that made the age, sex and regional distribution of the
weighted sample representative of the UK population aged 16 years and over. Table
B.11 shows the weighted and unweighted distribution of the participants aged 16 years
and over. (Table B.11)
B.8 Blood weights An additional set of weights was generated to correct for differential non-response to
giving a blood sample. Non-response, whether due to refusal or inability to give a blood
sample, will cause the blood data to be biased if there are systematic differences
between individuals that provide a blood sample and individuals that do not.
Blood samples were taken during the nurse visit. Only participants who fulfilled certain
eligibility criteria were asked whether they would be prepared to give a blood sample.
Participants were ineligible if they:
• had a clotting or bleeding disorder (e.g. conditions such as haemophilia and low
platelets (thrombocytopenia))
• had ever had a fit
• were currently on anticoagulant drugs, e.g. Warfarin therapy
• had volunteered information that they are HIV or Hepatitis B or C positive
National Diet and Nutrition Survey Headline results from Years 1 and 2 (combined)of the Rolling Programme (2008/2009 - 2009/10). Supplementary report: Blood analytes 7

Response to the blood sample was higher for adults than for children; 50% of adults
and 27% of children who had completed three or four diary days provided a blood
sample. Response amongst children was closely linked to age: whilst 39% of those
aged 11 to 18 years provided a blood sample, only 19% of younger children (aged 1.5
to 10 years) did so.
The ‘blood participants’ (i.e. those who provided a blood sample) were weighted to
match all ‘nurse participants’ (i.e. those who were visited by a nurse and were eligible to
provide a blood sample). It can be assumed that the eligible nurse participants
(weighted by the nurse weight) are representative of all eligible persons in the
population, since the nurse weights make the full nurse sample representative of the
population. The final blood weights should therefore make the blood sample participants
representative of all eligible persons in the population. This assumption is made
because there are no available estimates of the actual eligible population (i.e. the
population providing a blood sample).
The methods used to generate the blood weights were similar to those used to generate
the nurse weights. Cross-tabs and chi-square tests were used to check which variables
from the individual and household questionnaires were significantly associated with a
participant giving blood. These variables were then entered into a logistic regression
model.
A logistic regression models the relationship between a binary outcome variable
(whether or not a participant gave blood) and a set of predictor variables. The predictor
variables were a set of socio-demographic participant and household characteristics
collected from the individual interview. Adults and children were modeled separately.
The model generated a predicted probability for each participant. This is the probability
the participant would give blood during the nurse interview, given the characteristics of
the participant and the household. Participants with characteristics associated with non-
response were under-represented in the blood sample and therefore received a low
predicted probability. These predicted probabilities were then used to generate a set of
National Diet and Nutrition Survey Headline results from Years 1 and 2 (combined)of the Rolling Programme (2008/2009 - 2009/10). Supplementary report: Blood analytes 8

non-response weights; participantswith a low predicted probability received a larger
weight, increasing their representation in the sample.
The small sample size for children led to a very basic model that contained only age
and sex, household size and region. The adult sample was larger therefore more
variables were entered into the adult model. This contained age and sex, region,
household size, ethnicity and general health. The full models for adults and children are
given in Tables B.12 and B.13.
(Tables B.12, B.13)
The non-response weights from the model were combined with the final nurse weights
to give the final blood weights (the final nurse weights incorporate the selection weights,
weights for non-response to the individual questionnaire and weights for non-response
to the nurse visit). These weights were scaled, so the mean weight equalled one and
the weighted sample size matched the unweighted sample size.
The final stage of the nurse weights was to calibrate the weights produced by the non-
response model. This step was not done for the blood weights. The weighted blood
sample was already very close to the weighted eligible nurse sample and hence this
additional step was not necessary. The impact of the weights on key variables for adults
and children are shown in Tables B.14 and B.15.
(Tables B.14, B.15)
1 Chapter 2 which covers response rates uses unweighted data. 2 A Dwelling Unit is an address or part of an address, which has its own front door. The front door does not have to be at street level, but it must separate one part of the address from other parts (i.e. only those who live behind the door have access to the area, it is not a communal part of the address). 3 A Catering Unit is a “group of people who eat food that is bought and prepared for them (largely) as a group”. A household will consist of more than one catering unit if any of its members generally buy and prepare food separately from other members. For example, a household of students may share a living space but they all cook and prepare food independently and hence would form separate catering units within the household.
National Diet and Nutrition Survey Headline results from Years 1 and 2 (combined)of the Rolling Programme (2008/2009 - 2009/10). Supplementary report: Blood analytes 9

4 A Kish grid is a framework to ensure that the unit is selected without interviewer bias. The number of units is listed across the top of the grid, with a random number below to indicate which unit should be selected. 5 (Office for National Statistics. Mid 2009 Population Estimates. [Online] Available: http://www.statistics.gov.uk/statbase/Product.asp?vlnk=15106 (accessed 17/01/2011). 6 This step was not carried out on Year 1 data. The small sample sizes resulted in weak non-response models and this stage was left out. 7 It was more efficient to exclude those aged 16 to 18 years from the child boost than include them and weight them down.
National Diet and Nutrition Survey Headline results from Years 1 and 2 (combined)of the Rolling Programme (2008/2009 - 2009/10). Supplementary report: Blood analytes 10

Appendix B TABLES: Weighting the NDNS core sample
B.1 2009 mid-year population estimates for adults (aged 19 years and over). B.2 2009 mid-year population estimates for children (aged 1.5 to 18 years). B.3 Non-response nurse model for adults (aged 19 years and over). B.4 Non-response nurse model for children (aged 1.5 to 18 years). B.5 Effective sample size (neff) and efficiency of weights. B.6 Estimated design factors (defts) due to the effects of clustering for a set of key survey estimates. B.7 Weighted and unweighted distribution of fully productive adults (aged 19 years and over) completing three or four food diary days. B.8 Weighted and unweighted distribution of fully productive children (aged 1.5 to 18 years) completing three or four food diary days. B.9 Weighted and unweighted distribution of adult participants (aged 19 years and over) to the nurse visit. B.10 Weighted and unweighted distribution of child participants (aged 1.5 to 18 years) to the nurse visit. B.11 Weighted and unweighted distribution of participants aged 16 years and over (for smoking behaviour and alcohol use weights). B.12 Non-response blood model for adult participants (aged 19 years and over). B.13 Non-response blood model for child participants (aged 1.5 to 18 years). B.14 Weighted distribution of adult participants (aged 19 years and over)
providing a blood sample. B.15 Weighted distribution of child participants (aged 1.5 to 18 years) providing a blood sample.
National Diet and Nutrition Survey Headline results from Years 1 and 2 (combined)of the Rolling Programme (2008/2009 - 2009/10). Supplementary report: Blood analytes 11

Table B.1
2009 mid-year population estimates1 for adults (aged 19 years and over) Estimate PercentGovernment Office Region North East 2,023,915 4.2North West 5,320,959 11.1Yorkshire & the Humber 4,078,043 8.5East Midlands 3,459,520 7.2West Midlands 4,159,118 8.7East of England 4,455,897 9.3London 5,997,729 12.5South East 6,506,960 13.6South West 4,108,912 8.6Wales 2,328,628 4.9Scotland 4,084,631 8.5Northern Ireland 1,331,000 2.8 Age in years (grouped) by sex Males 19-29 4,712,490 9.8Males 30-39 4,068,789 8.5Males 40-49 4,523,232 9.5Males 50-59 3,689,579 7.7Males 60-64 1,817,994 3.8Males 65-69 1,364,484 2.9Males 70+ 3,057,932 6.4Females 19-29 4,524,411 9.5Females 30-39 4,084,952 8.5Females 40-49 4,631,401 9.7Females 50-59 3,795,520 7.9Females 60-64 1,901,153 4.0Females 65-69 1,472,579 3.1Females 70+ 4,210,796 8.8 Total 47,855,312 100
1 (Office for National Statistics. Mid 2009 Population Estimates. [Online] Available: http://www.statistics.gov.uk/statbase/Product.asp?vlnk=15106 (accessed 17/01/2011).
National Diet and Nutrition Survey Headline results from Years 1 and 2 (combined)of the Rolling Programme (2008/2009 - 2009/10). Supplementary report: Blood analytes 12

Table B.2 2009 mid-year population estimates1 for children (aged 1.5 to 18 years) Estimate PercentGovernment Office Region North East 515,578 4.0North West 1,446,298 11.3Yorkshire & the Humber 1,081,683 8.5East Midlands 911,218 7.1West Midlands 1,165,342 9.1East of England 1,203,146 9.4London 1,570,023 12.3South East 1,773,152 13.9South West 1,034,843 8.1Wales 617,990 4.8Scotland 1,019,759 8.0Northern Ireland 419,550 3.3 Age in years (grouped) by sex Males 1.5-3 963,815 7.6Males 4-6 1,080,841 8.5Males 7-10 1,387,434 10.9Males 11-14 1,490,292 11.7Males 15-18 1,613,923 12.6Females 1.5-3 918,832 7.2Females 4-6 1,028,279 8.1Females 7-10 1,327,931 10.4Females 11-14 1,420,114 11.1Females 15-18 1,527,119 12.0 Total 12,758,580 100
1 (Office for National Statistics. Mid 2009 Population Estimates. [Online] Available: http://www.statistics.gov.uk/statbase/Product.asp?vlnk=15106 (accessed 17/01/2011).
National Diet and Nutrition Survey Headline results from Years 1 and 2 (combined)of the Rolling Programme (2008/2009 - 2009/10). Supplementary report: Blood analytes 13

Table B.3 Non-response nurse model for adults (aged 19 years and over)1,2,3,4,5
B S.E. Wald df Sig. Exp(B) Number of people in catering unit 14.294 4 .006
1 baseline 2 -.540 .244 4.889 1 .027 .583 3 -.330 .282 1.368 1 .242 .719 4 .144 .324 .197 1 .657 1.155 5+ -.749 .301 6.181 1 .013 .473
Ethnic group 4.362 1 .037 White baseline Not white -.581 .278 4.362 1 .037 .560
Housing tenure 1.294 1 .255 Own/buying baseline Rent -.203 .179 1.294 1 .255 .816 Age in years (grouped) by sex 15.766 13 .262
Males 19-29 baseline Males 30-39 -.015 .358 .002 1 .966 .985 Males 40-49 -.641 .333 3.714 1 .054 .527 Males 50-59 .275 .382 .521 1 .470 1.317 Males 60-64 .281 .511 .303 1 .582 1.325 Males 65-69 .132 .523 .064 1 .801 1.141 Males 70+ .070 .403 .031 1 .861 1.073 Females 19-29 -.168 .336 .251 1 .616 .845 Females 30-39 -.254 .350 .526 1 .468 .776 Females 40-49 -.089 .342 .067 1 .796 .915 Females 50-59 .180 .376 .230 1 .632 1.197 Females 60-64 -.457 .435 1.103 1 .294 .633 Females 65-69 1.041 .643 2.622 1 .105 2.831 Females 70+ -.245 .369 .440 1 .507 .783 Government Office Region 20.062 11 .044
North East baseline North West -.151 .475 .101 1 .751 .860 Yorkshire & the Humber -.920 .470 3.831 1 .050 .399 East Midlands -.072 .505 .020 1 .887 .931 West Midlands -.779 .472 2.722 1 .099 .459 East of England -.773 .466 2.748 1 .097 .462 London -.019 .475 .002 1 .969 .982 South East -.125 .463 .073 1 .787 .882 South West -.567 .475 1.425 1 .233 .567 Wales -.424 .525 .651 1 .420 .655 Scotland -.310 .486 .405 1 .524 .734 Northern Ireland .446 .721 .383 1 .536 1.562 Constant 2.015 .521 14.979 1 .000 7.501
1 The response is 1 = individual aged 19+ years responded to the nurse visit, 0 = non response 2 Only variables that are significant at the 0.05 level are included in the model
National Diet and Nutrition Survey Headline results from Years 1 and 2 (combined)of the Rolling Programme (2008/2009 - 2009/10). Supplementary report: Blood analytes 14

3 The model R2 is 0.056 (Cox and Snell) 4 B is the estimate coefficient with standard error S.E. 5 The Wald-test measures the impact of the categorical variable on the model with the appropriate number of
degrees of freedom df. If the test is significant (sig. < 0.05) then the categorical variable is considered to be ‘significantly associated’ with the response variable and therefore included in the model
National Diet and Nutrition Survey Headline results from Years 1 and 2 (combined)of the Rolling Programme (2008/2009 - 2009/10). Supplementary report: Blood analytes 15

Table B.4 Non-response nurse model for children (aged 1.5 to 18 years) 1,2,3,4,5
B S.E. Wald df Sig. Exp(B) Number of people in catering unit 10.848 3 .013
2 baseline 3 .578 .349 2.748 1 .097 1.782 4 .994 .345 8.312 1 .004 2.703 5+ .593 .342 3.010 1 .083 1.810
Work status of HRP 11.001 2 .004 Never worked baseline Currently working (full or part time)
1.119 .364 9.438 1 .002 3.062
Previously worked, not now
.685 .377 3.305 1 .069 1.984
Ethnic group 3.044 1 .081 White baseline Not white -.388 .222 3.044 1 .081 .679
Housing tenure 2.979 1 .084 Own/buying baseline Rent .328 .190 2.979 1 .084 1.389 Age in years (grouped) by sex 6.899 9 .648
Males 1.5-3 baseline Males 4-6 -.002 .361 .000 1 .995 .998 Males 7-10 .095 .344 .077 1 .781 1.100 Males 11-14 -.018 .334 .003 1 .957 .982 Males 15-18 .292 .339 .743 1 .389 1.339 Females 1.5-3 -.069 .369 .035 1 .852 .933 Females 4-6 .420 .383 1.205 1 .272 1.522 Females 7-10 .589 .367 2.572 1 .109 1.802 Females 11-14 .286 .348 .676 1 .411 1.331 Females 15-18 .334 .344 .940 1 .332 1.396 Government Office Region 16.803 11 .114
North East baseline North West -1.180 .580 4.139 1 .042 .307 Yorkshire & the Humber
-1.355 .593 5.233 1 .022 .258
East Midlands -1.443 .601 5.760 1 .016 .236 West Midlands -1.200 .590 4.140 1 .042 .301 East of England -1.689 .578 8.537 1 .003 .185 London -1.100 .583 3.559 1 .059 .333 South East -.783 .585 1.791 1 .181 .457 South West -.904 .613 2.175 1 .140 .405 Wales -1.222 .631 3.752 1 .053 .295 Scotland -1.149 .600 3.672 1 .055 .317 Northern Ireland -1.558 .659 5.591 1 .018 .211 Constant .484 .773 .393 1 .531 1.623
National Diet and Nutrition Survey Headline results from Years 1 and 2 (combined)of the Rolling Programme (2008/2009 - 2009/10). Supplementary report: Blood analytes 16

1 The response is 1 = individual aged 1.5-18 years responded to the nurse visit, 0 = non response 2 Only variables that are significant at the 0.05 level are included in the model 3 The model R2 is 0.047 (Cox and Snell) 4 B is the estimate coefficient with standard error S.E. 5 The Wald-test measures the impact of the categorical variable on the model with the appropriate number of
degrees of freedom df. If the test is significant (sig. < 0.05) then the categorical variable is considered to be ‘significantly associated’ with the response variable and therefore included in the model
National Diet and Nutrition Survey Headline results from Years 1 and 2 (combined)of the Rolling Programme (2008/2009 - 2009/10). Supplementary report: Blood analytes 17

Table B.5 Effective sample size (neff) and efficiency of weights
Variable
name Variable
label N Min Max Mean Std.
Deviation Effective sample
size (neff)
Efficiency
wti_adY12 Adult weight
for individual and diary
1031 0.22 3.51 1.00 0.48 837 81%
wtn_adY12 Adult weight for nurse visit
780 0.18 2.76 1.00 0.50 625 80%
Wtb_adY12 Adult weight for blood sample
511 0.21 3.53 1.00 0.60 383 75%
wti_chY12 Child weight
for individual and diary
1095 0.25 2.94 1.00 0.51 866 79%
wtn_chY12 Child weight for nurse visit
838 0.23 3.21 1.00 0.53 655 78%
Wtb_chY12 Child weight for blood sample
300 0.27 2.63 1.00 0.54 233 78%
Table B.6 Estimated design factors (defts) due to the effects of clustering for a set of key survey estimates Survey estimates Children Adults Mean deft Mean deftMean % energy from saturated fatty acids 80 1.11 94 1.00Mean fruit intake g/day 13 1.17 13 1.08 % deft % deftHow often eat meals out 3 or more times per week 2 1.03 5 0.981-2 times per week 16 1.04 22 0.951-2 times per month 51 1.03 43 1.04Rarely or never 31 1.03 29 1.10 Type of appetite Good 65 1.02 67 1.11Average 27 1.02 27 1.11Poor 7 1.09 6 1.16 Use of food services (lunch club, meals on wheels, etc)
Yes - 21 1.08No - 79 1.08 What usually has for lunch at school Cooked school meal 34 1.11 - Cold school meal 7 0.98 - Packed lunch (from home) 46 1.11 - Buy lunch from shop/cafe 9 1.03 -
National Diet and Nutrition Survey Headline results from Years 1 and 2 (combined)of the Rolling Programme (2008/2009 - 2009/10). Supplementary report: Blood analytes 18

Goes home 2 1.07 - Does not eat lunch 2 0.96 - Base (unweighted) 1095 1031
National Diet and Nutrition Survey Headline results from Years 1 and 2 (combined)of the Rolling Programme (2008/2009 - 2009/10). Supplementary report: Blood analytes 19

Table B.7
Weighted and unweighted distribution of fully productive adults (aged 19 years and over) completing three or four food diary days
Population estimates
Fully productive adults
Unweighted Weighted by
selection wtWeighted by
wti_adY12 % % % % Government Office Region North East 4.2 4.0 3.5 4.2 North West 11.1 11.2 11.6 11.1 Yorkshire & the Humber
8.5 8.2 7.8 8.5
East Midlands 7.2 9.1 8.8 7.2 West Midlands 8.7 10.0 9.8 8.7 East of England 9.3 8.8 9.3 9.3 London 12.5 9.1 9.7 12.5 South East 13.6 14.3 14.4 13.6 South West 8.6 8.3 8.6 8.6 Wales 4.9 5.9 5.5 4.9 Scotland 8.5 7.5 7.3 8.5 Northern Ireland 2.8 3.6 3.6 2.8 Age in years (grouped) by sex
Males 19-29 9.8 6.5 8.0 9.8 Males 30-39 8.5 7.9 7.6 8.5 Males 40-49 9.5 8.1 8.2 9.5 Males 50-59 7.7 7.8 8.4 7.7 Males 60-64 3.8 3.4 3.7 3.8 Males 65-69 2.9 2.8 3.0 2.9 Males 70+ 6.4 6.5 5.7 6.4 Females 19-29 9.5 8.1 8.2 9.5 Females 30-39 8.5 11.9 11.8 8.5 Females 40-49 9.7 9.6 10.6 9.7 Females 50-59 7.9 10.4 10.3 7.9 Females 60-64 4.0 4.8 4.3 4.0 Females 65-69 3.1 3.3 3.1 3.1 Females 70+ 8.8 9.1 6.9 8.8 Base (unweighted) 47,855,312 1,031 1,031 1,031
National Diet and Nutrition Survey Headline results from Years 1 and 2 (combined)of the Rolling Programme (2008/2009 - 2009/10). Supplementary report: Blood analytes 20
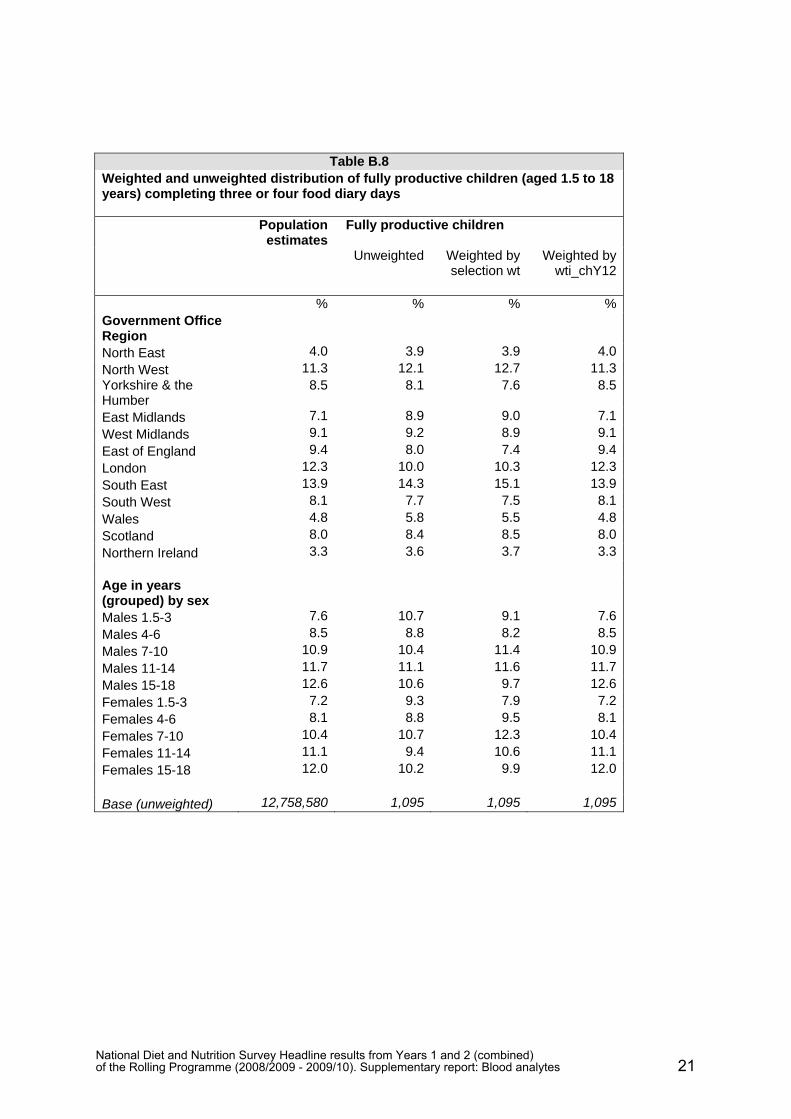
Table B.8 Weighted and unweighted distribution of fully productive children (aged 1.5 to 18 years) completing three or four food diary days
Population
estimates Fully productive children
Unweighted Weighted by selection wt
Weighted by wti_chY12
% % % % Government Office Region North East 4.0 3.9 3.9 4.0 North West 11.3 12.1 12.7 11.3 Yorkshire & the Humber
8.5 8.1 7.6 8.5
East Midlands 7.1 8.9 9.0 7.1 West Midlands 9.1 9.2 8.9 9.1 East of England 9.4 8.0 7.4 9.4 London 12.3 10.0 10.3 12.3 South East 13.9 14.3 15.1 13.9 South West 8.1 7.7 7.5 8.1 Wales 4.8 5.8 5.5 4.8 Scotland 8.0 8.4 8.5 8.0 Northern Ireland 3.3 3.6 3.7 3.3 Age in years (grouped) by sex
Males 1.5-3 7.6 10.7 9.1 7.6 Males 4-6 8.5 8.8 8.2 8.5 Males 7-10 10.9 10.4 11.4 10.9 Males 11-14 11.7 11.1 11.6 11.7 Males 15-18 12.6 10.6 9.7 12.6 Females 1.5-3 7.2 9.3 7.9 7.2 Females 4-6 8.1 8.8 9.5 8.1 Females 7-10 10.4 10.7 12.3 10.4 Females 11-14 11.1 9.4 10.6 11.1 Females 15-18 12.0 10.2 9.9 12.0 Base (unweighted) 12,758,580 1,095 1,095 1,095
National Diet and Nutrition Survey Headline results from Years 1 and 2 (combined)of the Rolling Programme (2008/2009 - 2009/10). Supplementary report: Blood analytes 21

Table B.9 Weighted and unweighted distribution of adult participants (aged 19 years and over) to the nurse visit
Participants
completing three or four
food diary days
Participants to nurse visit
Weighted by wti_adY12
Unweighted Weighted by selection wt
Weighted by model NR wt
only
Weighted by wtn_adY12
% % % % %Number of people in catering unit 1 16.7 27.9 16.4 16.9 16.72 35.2 31.7 34.1 35.1 35.23 21.2 18.7 22.2 21.2 21.24 15.1 14.0 17.1 15.3 15.15+ 11.8 7.7 10.3 11.6 11.8 Work status Working (full or part time)
62.6 59.6 63.4 62.3 62.6
Not working 37.4 40.4 36.6 37.7 37.4 Ethnic group White 91.2 93.5 93.0 91.3 91.2Not white 8.8 6.5 7.0 8.7 8.8 Housing tenure Own/buying 71.3 70.3 73.2 71.8 71.3Rent 28.7 29.7 26.8 28.2 28.7 Type of appetite Good 66.9 66.7 67.7 67.6 66.9Average 27.4 26.8 26.6 26.9 27.4Poor 5.7 6.5 5.7 5.6 5.7 Avoid any foods Yes 60.6 61.2 61.5 60.5 60.6No 39.4 38.8 38.5 39.5 39.4
National Diet and Nutrition Survey Headline results from Years 1 and 2 (combined)of the Rolling Programme (2008/2009 - 2009/10). Supplementary report: Blood analytes 22

Table B.9 Weighted and unweighted distribution of adult participants (aged 19 years and over) to the nurse visit
Participants
completing three or four
food diary days
Participants to nurse visit
Weighted by wti_adY12
Unweighted Weighted by selection wt
Weighted by model NR wt
only
Weighted by wtn_adY12
% % % % % Government Office Region
North East 4.2 4.6 3.8 4.2 4.2North West 11.1 11.7 12.3 11.3 11.1Yorkshire & the Humber
8.5 7.4 6.7 8.5 8.5
East Midlands 7.2 9.6 9.5 7.3 7.2West Midlands 8.7 8.7 8.9 8.7 8.7East of England 9.3 7.9 8.3 9.3 9.3London 12.5 9.1 10.0 12.1 12.5South East 13.6 15.0 15.4 13.7 13.6South West 8.6 8.5 8.2 8.6 8.6Wales 4.9 5.6 5.4 4.9 4.9Scotland 8.5 7.7 7.5 8.6 8.5Northern Ireland 2.8 4.1 4.1 2.8 2.8 Age in years (grouped) by sex
Males 19-29 9.8 6.5 8.2 9.7 9.8Males 30-39 8.5 7.9 7.7 8.6 8.5Males 40-49 9.5 7.2 7.0 9.5 9.5Males 50-59 7.7 8.6 9.3 7.7 7.7Males 60-64 3.8 3.8 4.1 3.8 3.8Males 65-69 2.9 2.7 3.2 2.9 2.9Males 70+ 6.4 6.7 5.8 6.4 6.4Females 19-29 9.5 7.4 7.9 9.0 9.5Females 30-39 8.5 11.4 11.1 8.8 8.5Females 40-49 9.7 9.7 10.5 9.7 9.7Females 50-59 7.9 10.8 10.8 8.0 7.9Females 60-64 4.0 4.4 3.8 4.0 4.0Females 65-69 3.1 3.8 3.7 3.1 3.1Females 70+ 8.8 9.0 6.8 8.8 8.8 Base (unweighted) 1,031 780 780 780 780
National Diet and Nutrition Survey Headline results from Years 1 and 2 (combined)of the Rolling Programme (2008/2009 - 2009/10). Supplementary report: Blood analytes 23

Table B.10 Weighted and unweighted distribution of child participants (aged 1.5 to 18 years) to the nurse visit
Participants completing
three or four food diary
days
Participants to nurse visit
Weighted by wti_chY12
Unweighted Weighted by selection wt
Weighted by model NR wt
only
Weighted by wtn_chY12
% % % % %Number of people in catering unit 1 0.0 0.0 0.0 0.0 0.02 4.3 3.6 6.2 4.3 4.33 23.6 22.8 32.9 23.6 23.64 38.4 40.5 39.5 38.5 38.35+ 33.8 33.1 21.4 33.6 33.8 Work status of HRP Working (full or part-time)
79.5 81.6 83.3 79.7 79.4
Not working 16.7 15.5 14.4 16.7 16.8 Ethnic group White 83.8 85.6 86.9 84.0 83.8Not white 16.2 14.4 13.1 16.0 16.2 Housing tenure Own/buying 66.1 66.4 67.4 66.2 66.0Rent 33.9 33.6 32.6 33.8 34.0 Type of appetite Good 65.5 66.0 65.9 65.6 65.5Average 27.3 26.6 26.7 26.8 27.3Poor 7.2 7.4 7.4 7.6 7.2 Avoid any foods Yes 75.8 75.5 74.2 76.6 75.8No 24.2 24.5 25.8 23.4 24.2
National Diet and Nutrition Survey Headline results from Years 1 and 2 (combined)of the Rolling Programme (2008/2009 - 2009/10). Supplementary report: Blood analytes 24

Table B.10 Weighted and unweighted distribution of child participants (aged 1.5 to 18 years) to the nurse visit
Participants completing
three or four food diary
days
Participants to nurse visit
Weighted by wti_chY12
Unweighted Weighted by selection wt
Weighted by model NR wt
only
Weighted by wtn_chY12
% % % % %Government Office Region
North East 4.0 4.6 4.5 4.1 4.0North West 11.3 12.4 12.1 11.3 11.3Yorkshire & the Humber
8.5 7.2 7.4 8.5 8.5
East Midlands 7.1 8.7 8.7 7.2 7.1West Midlands 9.1 8.8 8.8 9.2 9.1East of England 9.4 6.4 7.2 9.3 9.4London 12.3 10.1 9.9 12.1 12.3South East 13.9 16.4 15.8 13.9 13.9South West 8.1 8.0 8.2 8.2 8.1Wales 4.8 5.4 5.7 4.9 4.8Scotland 8.0 8.6 8.5 8.0 8.0Northern Ireland 3.3 3.4 3.2 3.3 3.3 Age in years (grouped) by sex
Males 1.5-3 7.6 8.7 10.5 7.5 7.6Males 4-6 8.5 7.8 8.2 8.4 8.5Males 7-10 10.9 11.3 10.1 10.9 10.9Males 11-14 11.7 11.2 10.7 11.6 11.7Males 15-18 12.7 9.8 10.6 12.6 12.6Females 1.5-3 7.2 7.5 9.1 7.1 7.2Females 4-6 8.1 10.0 9.1 8.1 8.1Females 7-10 10.4 13.2 11.8 10.5 10.4Females 11-14 11.1 10.4 9.7 11.3 11.1Females 15-18 11.9 10.0 10.1 11.9 12.0 Base (unweighted) 1,095 838 838 838 838
National Diet and Nutrition Survey Headline results from Years 1 and 2 (combined)of the Rolling Programme (2008/2009 - 2009/10). Supplementary report: Blood analytes 25
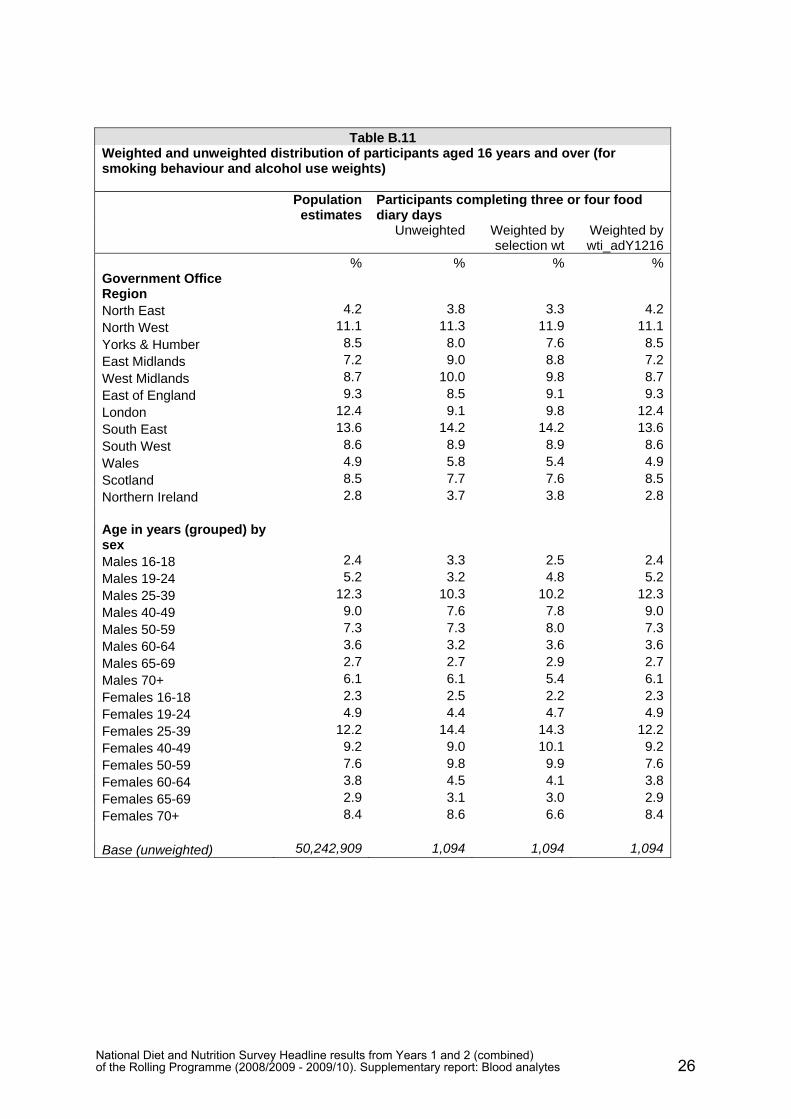
Table B.11 Weighted and unweighted distribution of participants aged 16 years and over (for smoking behaviour and alcohol use weights)
Population estimates
Participants completing three or four food diary days
Unweighted Weighted by
selection wt Weighted by wti_adY1216
% % % %Government Office Region North East 4.2 3.8 3.3 4.2North West 11.1 11.3 11.9 11.1Yorks & Humber 8.5 8.0 7.6 8.5East Midlands 7.2 9.0 8.8 7.2West Midlands 8.7 10.0 9.8 8.7East of England 9.3 8.5 9.1 9.3London 12.4 9.1 9.8 12.4South East 13.6 14.2 14.2 13.6South West 8.6 8.9 8.9 8.6Wales 4.9 5.8 5.4 4.9Scotland 8.5 7.7 7.6 8.5Northern Ireland 2.8 3.7 3.8 2.8 Age in years (grouped) by sex
Males 16-18 2.4 3.3 2.5 2.4Males 19-24 5.2 3.2 4.8 5.2Males 25-39 12.3 10.3 10.2 12.3Males 40-49 9.0 7.6 7.8 9.0Males 50-59 7.3 7.3 8.0 7.3Males 60-64 3.6 3.2 3.6 3.6Males 65-69 2.7 2.7 2.9 2.7Males 70+ 6.1 6.1 5.4 6.1Females 16-18 2.3 2.5 2.2 2.3Females 19-24 4.9 4.4 4.7 4.9Females 25-39 12.2 14.4 14.3 12.2Females 40-49 9.2 9.0 10.1 9.2Females 50-59 7.6 9.8 9.9 7.6Females 60-64 3.8 4.5 4.1 3.8Females 65-69 2.9 3.1 3.0 2.9Females 70+ 8.4 8.6 6.6 8.4 Base (unweighted) 50,242,909 1,094 1,094 1,094
National Diet and Nutrition Survey Headline results from Years 1 and 2 (combined)of the Rolling Programme (2008/2009 - 2009/10). Supplementary report: Blood analytes 26

Table B.12
Non-response blood model for adults (aged 19 years and over)1,2,3,4,5 B S.E. Wald df Sig. Exp(B)
Number of people in catering unit
3.317 4 .506
1 baseline 2 -.056 .291 .036 1 .849 .946 3 -.121 .326 .137 1 .711 .886 4 .130 .367 .124 1 .724 1.138 5+ -.482 .370 1.696 1 .193 .618
Ethnic group 1.261 1 .261 White baseline Not white .396 .353 1.261 1 .261 1.486
Housing tenure .488 1 .485 Own/buying baseline Rent -.156 .223 .488 1 .485 .856 Work status 1.341 1 .247 Working (full or part time) baseline Not working -.288 .249 1.341 1 .247 .750 Age in years (grouped) by sex
25.943 13 .017
Males 19-29 baseline Males 30-39 .723 .423 2.916 1 .088 2.060 Males 40-49 -.142 .391 .132 1 .717 .868 Males 50-59 .774 .432 3.218 1 .073 2.169 Males 60-64 .998 .561 3.161 1 .075 2.713 Males 65-69 .549 .588 .871 1 .351 1.731 Males 70+ 1.329 .562 5.602 1 .018 3.778 Females 19-29 .051 .378 .018 1 .893 1.052 Females 30-39 .838 .427 3.838 1 .050 2.311 Females 40-49 1.029 .421 5.977 1 .014 2.799 Females 50-59 .369 .413 .799 1 .371 1.447 Females 60-64 2.601 .871 8.907 1 .003 13.475 Females 65-69 .470 .594 .626 1 .429 1.600 Females 70+ 1.058 .491 4.643 1 .031 2.881 Government Office Region
18.391 11 .073
North East baseline North West -.903 .551 2.688 1 .101 .405 Yorkshire & the Humber .276 .599 .213 1 .645 1.318 East Midlands -.515 .580 .790 1 .374 .597 West Midlands -.162 .584 .077 1 .781 .850 East of England -.827 .566 2.133 1 .144 .437 London -.193 .564 .117 1 .732 .824 South East -.128 .551 .054 1 .817 .880 South West .189 .590 .102 1 .749 1.208 Wales -.029 .634 .002 1 .963 .971 Scotland .277 .598 .215 1 .643 1.319 Northern Ireland -.074 .705 .011 1 .916 .929
National Diet and Nutrition Survey Headline results from Years 1 and 2 (combined)of the Rolling Programme (2008/2009 - 2009/10). Supplementary report: Blood analytes 27

Table B.12 Non-response blood model for adults (aged 19 years and over)1,2,3,4,5
B S.E. Wald df Sig. Exp(B) General health (self-assessed)
1.245 1 .264
Good baseline Fair/poor -.273 .245 1.245 1 .264 .761 Weight measured 8.816 1 .003 Yes baseline No -1.52 .512 8.816 1 .003 .219 Constant .918 .625 2.159 1 .142 2.504
1 The response is 1 = individual aged 19+ years gave blood, 0 = non response 2 Only variables that are significant at the 0.05 level are included in the model 3 The model R2 is 0.089 (Cox and Snell) 4 B is the estimate coefficient with standard error S.E. 5 The Wald-test measures the impact of the categorical variable on the model with the appropriate number of
degrees of freedom df. If the test is significant (sig. < 0.05) then the categorical variable is considered to be ‘significantly associated’ with the response variable and therefore included in the model
National Diet and Nutrition Survey Headline results from Years 1 and 2 (combined)of the Rolling Programme (2008/2009 - 2009/10). Supplementary report: Blood analytes 28

Table B.13
Non-response blood model for children (aged 1.5 to 18 years)1,2,3,4,5 B S.E. Wald df Sig. Exp(B)
Age in years (grouped) by sex
25.943 13 .017
Males 1.5-3 baseline Males 4-6 .284 .435 .426 1 .514 1.328 Males 7-10 .727 .408 3.182 1 .074 2.070 Males 11-14 1.229 .405 9.197 1 .002 3.417 Males 15-18 2.162 .406 28.305 1 .000 8.687 Females 1.5-3 -.172 .491 .123 1 .726 .842 Females 4-6 .069 .452 .024 1 .878 1.072 Females 7-10 .771 .412 3.510 1 .061 2.163 Females 11-14 1.332 .404 10.847 1 .001 3.789 Females 15-18 1.539 .405 14.464 1 .000 4.662 Government Office Region
27.222 11 .004
North East baseline North West .299 .461 .420 1 .517 1.348 Yorkshire & the Humber .401 .486 .680 1 .410 1.493 East Midlands .262 .499 .276 1 .599 1.300 West Midlands .155 .471 .108 1 .743 1.167 East of England .296 .470 .397 1 .529 1.345 London 1.241 .458 7.360 1 .007 3.460 South East .452 .449 1.017 1 .313 1.572 South West .901 .492 3.360 1 .067 2.463 Wales .969 .551 3.089 1 .079 2.635 Scotland 1.252 .484 6.695 1 .010 3.496 Northern Ireland -.174 .587 .088 1 .767 .840 Constant -1.70 .506 11.224 1 .001 .184
1 The response is 1 = individual aged 19+ years responded to the nurse visit, 0 = non response 2 Only variables that are significant at the 0.05 level are included in the model 3 The model R2 is 0.130 (Cox and Snell) 4 B is the estimate coefficient with standard error S.E. 5 The Wald-test measures the impact of the categorical variable on the model with the appropriate number of
degrees of freedom df. If the test is significant (sig. < 0.05) then the categorical variable is considered to be ‘significantly associated’ with the response variable and therefore included in the model
National Diet and Nutrition Survey Headline results from Years 1 and 2 (combined)of the Rolling Programme (2008/2009 - 2009/10). Supplementary report: Blood analytes 29

Table B.14 Weighted distributions of adult participants (aged 19 years and over) providing a blood sample
Eligible respondents
at the nurse visitParticipants giving a blood sample
Weighted by wtn_adY12
Weighted by wtb_adY12
% %Number of people in catering unit 1 16.4 16.52 35.4 35.03 22.0 22.34+ 26.2 26.2 Work status Working (full or part time) 63.6 63.8Not working 36.4 36.2 Ethnic group White 90.9 90.8Not white 9.1 9.2 Housing tenure Own/buying 73.7 73.8Rent 26.3 26.2 Type of appetite Good 68.1 68.4Average 26.5 26.7Poor 5.4 4.8 Avoid any foods Yes 60.4 62.5No 39.6 37.5 Government Office Region North East 3.7 3.7North West 10.2 9.8Yorkshire & the Humber 8.8 8.9East Midlands 7.3 7.5West Midlands 8.5 8.6East of England 8.8 8.7London 13.4 13.7South East 13.6 13.7South West 9.0 9.0Wales 4.8 4.6Scotland 8.8 8.9Northern Ireland 3.1 3.0
National Diet and Nutrition Survey Headline results from Years 1 and 2 (combined)of the Rolling Programme (2008/2009 - 2009/10). Supplementary report: Blood analytes 30

Table B.14 Weighted distributions of adult participants (aged 19 years and over) providing a blood sample
Eligible respondents
at the nurse visitParticipants giving a blood sample
Weighted by wtn_adY12
Weighted by wtb_adY12
% %Age in years (grouped) by sex Males 19-29 9.4 9.1Males 30-39 8.3 8.4Males 40-49 9.0 9.2Males 50-59 7.8 8.0Males 60-64 4.0 4.0Males 65-69 3.0 2.9Males 70+ 5.9 6.0Females 19-29 9.2 9.2Females 30-39 8.8 8.8Females 40-49 9.8 9.8Females 50-59 8.4 8.3Females 60-64 4.3 4.3Females 65-69 3.1 3.2Females 70+ 9.0 8.8 General health (self-assessed) Very good 36.3 35.9Good 45.5 45.7Fair 14.8 14.4Poor 3.1 3.3Very poor 0.4 0.6 Marital status Married 52.8 52.5Cohabiting 15.3 15.7Single 17.0 16.9Widowed 6.4 6.0Divorced 6.6 7.0Separated 1.8 1.9 Any qualifications Yes 77.1 77.9No 22.9 22.1 Cigarette smoking status Current cigarette smoker 19.7 20.0Ex-regular cigarette smoker 23.5 22.1Never regular cigarette smoker 56.8 57.9
National Diet and Nutrition Survey Headline results from Years 1 and 2 (combined)of the Rolling Programme (2008/2009 - 2009/10). Supplementary report: Blood analytes 31

Table B.14 Weighted distributions of adult participants (aged 19 years and over) providing a blood sample
Eligible respondents
at the nurse visitParticipants giving a blood sample
Weighted by wtn_adY12
Weighted by wtb_adY12
% %Frequency drank any alcohol in last 12 months Almost every day 11.8 11.3Five or six days a week 3.8 4.5Three or four days a week 15.3 16.5Once or twice a week 34.8 33.4Once or twice a month 14.0 13.5Once every couple of months 9.3 8.5Once or twice a year 10.2 11.7Not at all in the last 12 months 0.8 0.5 Base (unweighted) 693 511
National Diet and Nutrition Survey Headline results from Years 1 and 2 (combined)of the Rolling Programme (2008/2009 - 2009/10). Supplementary report: Blood analytes 32

Table B.15
Weighted distributions of child participants (aged 1.5 to 18 years) providing a blood sample
Eligible respondents
at the nurse visitParticipants giving
a blood sample Weighted by
wtn_chY12Weighted by
wtb_chY12% %
Number of people in catering unit 2 4.3 5.33 23.1 21.94 38.5 39.05+ 34.1 33.8 Work status of HRP Never worked 3.6 3.9Currently working (full or part time) 80.7 78.9Previously worked, not now 15.7 17.2 Ethnic group White 83.7 84.1Not white 16.3 15.9 Housing tenure Own/buying 66.9 69.6Rent 33.1 30.4 Type of appetite Good 64.8 65.9Average 28.0 25.5Poor 7.2 8.7 Avoid any foods Yes 75.7 74.7No 24.3 25.3 Government Office Region North East 4.4 4.2North West 11.5 10.9Yorkshire & the Humber 7.8 7.0East Midlands 7.0 6.9West Midlands 9.9 10.1East of England 9.7 10.1London 12.0 12.7South East 13.8 14.8South West 7.5 7.8Wales 4.2 4.1Scotland 8.5 8.7Northern Ireland 3.7 2.7
National Diet and Nutrition Survey Headline results from Years 1 and 2 (combined)of the Rolling Programme (2008/2009 - 2009/10). Supplementary report: Blood analytes 33

Table B.15 Weighted distributions of child participants (aged 1.5 to 18 years) providing a blood sample
Eligible respondents
at the nurse visitParticipants giving
a blood sample Weighted by
wtn_chY12Weighted by
wtb_chY12% %
Age in years (grouped) by sex Males 1.5-3 7.0 7.0Males 4-6 8.5 8.6Males 7-10 10.9 10.4Males 11-14 11.4 11.3Males 15-18 13.9 14.5Females 1.5-3 6.6 5.9Females 4-6 8.1 7.2Females 7-10 10.4 11.3Females 11-14 11.6 12.2Females 15-18 11.6 11.6 General health (self-assessed) Very good 60.9 60.1Good 32.7 33.0Fair 5.2 5.2Poor 0.8 1.0very poor 0.4 0.7 Base (unweighted) 718 300
National Diet and Nutrition Survey Headline results from Years 1 and 2 (combined)of the Rolling Programme (2008/2009 - 2009/10). Supplementary report: Blood analytes 34