appendix b air quality and greenhouse gas impact …
TRANSCRIPT

APPENDIX B AIR QUALITY AND GREENHOUSE GAS IMPACT ANALYSES

[This Page Left Intentionally Blank]

APPENDIX B1 AIR QUALITY IMPACT ANALYSIS

[This Page Left Intentionally Blank]

Six Basins Strategic Plan AIR QUALITY IMPACT ANALYSIS CITIES OF CLAREMONT, POMONA, LA VERNE, & UPLAND, & THE COUNTY OF LOS ANGELES SIX BASINS WATERMASTER PREPARED BY: Haseeb Qureshi [email protected] Alyssa Tamase [email protected]
FEBRUARY 23, 2021
13854-02 AQ Report

Six Basins Strategic Plan Air Quality Impact Analysis
Six Basins Strategic Plan Air Quality Impact Analysis
13854-02 AQ Report.pdf i
TABLE OF CONTENTS TABLE OF CONTENTS ........................................................................................................................... I APPENDICES ...................................................................................................................................... II LIST OF EXHIBITS ................................................................................................................................ II LIST OF TABLES .................................................................................................................................. II LIST OF ABBREVIATED TERMS ............................................................................................................ III EXECUTIVE SUMMARY ....................................................................................................................... 1
ES.1 Summary of Findings ..................................................................................................................... 1 ES.2 Regulatory Requirements ............................................................................................................. 1 ES.3 Mitigation Measures ..................................................................................................................... 2
1 INTRODUCTION ......................................................................................................................... 4 1.1 Site Location .................................................................................................................................. 4 1.2 Project Description ........................................................................................................................ 4
2 AIR QUALITY SETTING ................................................................................................................ 9 2.1 South Coast Air Basin (SCAB) ........................................................................................................ 9 2.2 Regional Climate ........................................................................................................................... 9 2.3 Wind Patterns and Project Location ........................................................................................... 10 2.4 Criteria Pollutants ....................................................................................................................... 11 2.5 Existing Air Quality ...................................................................................................................... 18 2.6 Regional Air Quality .................................................................................................................... 21 2.7 Local Air Quality .......................................................................................................................... 21 2.8 Regulatory Background ............................................................................................................... 22
3 PROJECT AIR QUALITY IMPACT ................................................................................................ 28 3.1 Introduction ................................................................................................................................ 28 3.2 Standards of Significance ............................................................................................................ 28 3.3 Models Employed To Analyze Air Quality ................................................................................... 29 3.4 Construction Emissions ............................................................................................................... 29 3.5 Operational Emissions ................................................................................................................ 32 3.6 Localized Significance .................................................................................................................. 33 3.7 Construction-Source Emissions LST Analysis .............................................................................. 35 3.8 Operational-Source Emissions LST Analysis ................................................................................ 37 3.9 CO “Hot Spot” Analysis ............................................................................................................... 37 3.10 AQMP .......................................................................................................................................... 39 3.11 Potential Impacts to Sensitive Receptors ................................................................................... 41 3.12 Odors ........................................................................................................................................... 41 3.13 Cumulative Impacts .................................................................................................................... 42
4 REFERENCES ............................................................................................................................ 45 5 CERTIFICATIONS ...................................................................................................................... 48
Six Basins Strategic Plan Air Quality Impact Analysis
13854-02 AQ Report.pdf ii
APPENDICES
APPENDIX 2.1: STATE/FEDERAL ATTAINMENT STATUS OF CRITERIA POLLUTANTS APPENDIX 3.1: CALEEMOD PROJECT CONSTRUCTION (UNMITIGATED) EMISSIONS MODEL OUTPUTS APPENDIX 3.2: CALEEMOD PROJECT CONSTRUCTION (MITIGATED) EMISSIONS MODEL OUTPUTS
LIST OF EXHIBITS EXHIBIT 1-A: PROJECT LOCATION MAP ............................................................................................... 5
LIST OF TABLES TABLE ES-1: SUMMARY OF CEQA SIGNIFICANCE FINDINGS ................................................................. 1 TABLE 1-1: PROPOSED PROJECTS TO OPTIMIZE CONJUNCTIVE WATER MANAGEMENT ........................ 7 TABLE 2-1: CRITERIA POLLUTANTS .................................................................................................... 11 TABLE 2-2: AMBIENT AIR QUALITY STANDARDS (1 OF 2).................................................................... 19 TABLE 2-2: AMBIENT AIR QUALITY STANDARDS (2 OF 2).................................................................... 20 TABLE 2-3: ATTAINMENT STATUS OF CRITERIA POLLUTANTS IN THE SCAB ......................................... 21 TABLE 2-4: PROJECT AREA AIR QUALITY MONITORING SUMMARY 2017-2019.................................... 22 TABLE 3-1: MAXIMUM DAILY REGIONAL EMISSIONS THRESHOLDS .................................................... 28 TABLE 3-2: PROPOSED PROJECTS TO OPTIMIZE CONJUNCTIVE WATER MANAGEMENT ...................... 29 TABLE 3-3: CONSTRUCTION EQUIPMENT ASSUMPTIONS ................................................................... 30 TABLE 3-4: OVERALL CONSTRUCTION EMISSIONS SUMMARY – WITHOUT MITIGATION ..................... 31 TABLE 3-5: OVERALL CONSTRUCTION EMISSIONS SUMMARY – WITH MITIGATION ............................ 32 TABLE 3-6: MAXIMUM DAILY LOCALIZED CONSTRUCTION EMISSIONS THRESHOLDS .......................... 36 TABLE 3-7: LOCALIZED CONSTRUCTION-SOURCE EMISSIONS – WITHOUT MITIGATION ....................... 36 TABLE 3-8: CONSTRUCTION LOCALIZED SIGNIFICANCE SUMMARY – WITH MITIGATION ..................... 36 TABLE 3-9: CO MODEL RESULTS ........................................................................................................ 38 TABLE 3-10: TRAFFIC VOLUMES ........................................................................................................ 39

Six Basins Strategic Plan Air Quality Impact Analysis
13854-02 AQ Report.pdf iii
LIST OF ABBREVIATED TERMS % Percent °F Degrees Fahrenheit (1) Reference µg/m3 Microgram per Cubic Meter 1992 CO Plan 1992 Federal Attainment Plan for Carbon Monoxide 1993 CEQA Handbook SCAQMD’s CEQA Air Quality Handbook (1993) 2016-2040 RTP/SCS 2016-2040 Regional Transportation Plan/Sustainable Communities Strategy AB 2595 California Clean Air Act AQIA Air Quality Impact Analysis AQMP Air Quality Management Plan BAAQMD Bay Area Air Quality Management District C2H3Cl Vinyl Chloride CAA Federal Clean Air Act CAAQS California Ambient Air Quality Standards CalEEMod California Emissions Estimator Model CalEPA California Environmental Protection Agency CALGreen California Green Building Standards Code CAPCOA California Air Pollution Control Officers Association CARB California Air Resources Board CCR California Code of Regulations CEC California Energy Commission CEQA California Environmental Quality Act CEQA Guidelines 2019 CEQA Statute and Guidelines CO Carbon Monoxide COHb Carboxyhemoglobin EIR Environmental Impact Reports EMFAC EMissions FACtor Model EPA Environmental Protection Agency GAC Granular Activated Carbon GHG Greenhouse Gas H2S Hydrogen Sulfide HI Hazard Index hp Horsepower IX Ion Exchange lbs Pounds

Six Basins Strategic Plan Air Quality Impact Analysis
13854-02 AQ Report.pdf iv
lbs/day Pounds Per Day LST Localized Significance Threshold LST Methodology Final Localized Significance Threshold Methodology MICR Maximum Individual Cancer Risk MM Mitigation Measures MWELO California Department of Water Resources’ Model Water
Efficient N2 Nitrogen N2O Nitrous Oxide NAAQS National Ambient Air Quality Standards NO Nitric Oxide NO2 Nitrogen Dioxide NOX Nitrogen Oxides O2 Oxygen O3 Ozone O2 Deficiency Chronic Hypoxemia Pb Lead PM10 Particulate Matter 10 microns in diameter or less PM2.5 Particulate Matter 2.5 microns in diameter or less ppm Parts Per Million Project Six Basins Strategic Plan ROG Reactive Organic Gases SCAB South Coast Air Basin SCAG Southern California Association of Governments SCAQMD South Coast Air Quality Management District SIPs State Implementation Plans SO2 Sulfur Dioxide SO4 Sulfates SOX Sulfur Oxides SRA Source Receptor Area TAG Total Acres Graded Title 24 California Building Code TITLE I Non-Attainment Provisions TITLE II Mobile Sources Provisions VOC Volatile Organic Compounds vph Vehicles Per Hour

Six Basins Strategic Plan Air Quality Impact Analysis
13854-02 AQ Report.pdf v
This page intentionally left blank

Six Basins Strategic Plan Air Quality Impact Analysis
13854-02 AQ Report.pdf 1
EXECUTIVE SUMMARY
ES.1 SUMMARY OF FINDINGS
The results of this Six Basins Strategic Plan Air Quality Impact Analysis (AQIA) are summarized below based on the significance criteria in Section 3 of this report consistent with Appendix G of the California Environmental Quality Act (CEQA) Guidelines (CEQA Guidelines) (1). Table ES-1 shows the findings of significance for each potential air quality impact under CEQA before and after any required mitigation measures (MM) described below.
TABLE ES-1: SUMMARY OF CEQA SIGNIFICANCE FINDINGS
Analysis Report Section
Significance Findings
Unmitigated Mitigated
Regional Construction Emissions 3.4 Potentially Significant Less Than Significant
Localized Construction Emissions 3.7 Less Than Significant n/a
Regional Operational Emissions 3.5 Less Than Significant n/a
Localized Operational Emissions 3.8 Less Than Significant n/a
CO “Hot Spot” Analysis 3.9 Less Than Significant n/a
Air Quality Management Plan 3.10 Potentially Significant Less Than Significant
Sensitive Receptors 3.11 Less Than Significant n/a
Odors 3.12 Less Than Significant n/a
Cumulative Impacts 3.13 Potentially Significant Less Than Significant
ES.2 REGULATORY REQUIREMENTS
There are numerous requirements that development projects must comply with by law, and that were put in place by federal, State, and local regulatory agencies for the improvement of air quality. The two most pertinent regulatory requirements that apply to the proposed Project and which are required by South Coast Air Quality Management District (SCAQMD) Rules that are currently applicable during construction activity for this Project are Rule 403 (Fugitive Dust) (2).
Six Basins Strategic Plan Air Quality Impact Analysis
13854-02 AQ Report.pdf 2
SCAQMD RULE 403
This rule is intended to reduce the amount of particulate matter entrained in the ambient air as a result of anthropogenic (human-made) fugitive dust sources by requiring actions to prevent and reduce fugitive dust emissions. Rule 403 applies to any activity or human-made condition capable of generating fugitive dust and requires best available control measures to be applied to earth moving and grading activities.
ES.3 MITIGATION MEASURES
The Project construction-source emissions would exceed SCAQMD regional thresholds for nitrogen oxides (NOX) emissions. The following mitigation measures are designed to reduce Project construction-source NOX emissions. After application of MM AQ-1, Project construction-source emissions impacts would be less than significant.
MM AQ-1
When using construction equipment greater than 150 horsepower (>150 HP), the Construction Contractor shall ensure that off-road diesel construction equipment complies with the Environmental Protection Agency (EPA)/California Air Resources Board (CARB) Tier 3 emissions standards or equivalent and shall ensure that all construction equipment is tuned and maintained in accordance with the manufacturer’s specifications.

Six Basins Strategic Plan Air Quality Impact Analysis
13854-02 AQ Report.pdf 3
This page intentionally left blank
Six Basins Strategic Plan Air Quality Impact Analysis
13854-02 AQ Report.pdf 4
1 INTRODUCTION
This report presents the results of the AQIA prepared by Urban Crossroads, Inc., for the proposed Six Basins Strategic Plan (Project). The purpose of this AQIA is to evaluate the potential impacts to air quality associated with construction and operation of the Project and recommend measures to mitigate impacts considered potentially significant in comparison to thresholds established by the SCAQMD.
1.1 SITE LOCATION
The proposed Six Basins Strategic Plan Project is generally located within the Cities of Claremont, Pomona, La Verne, and Upland, in addition to unincorporated County of Los Angeles, as shown on Exhibit 1-A.
1.2 PROJECT DESCRIPTION
The Six Basins Watermaster Parties are proposing to rehabilitate, enhance, or construct a number of water projects in a coordinated manner to optimize conjunctive water management activities in the Six Basins to increase reliability and sustainability of regional water supplies. There are four goals for the Project: (1) enhance water supplies, (2) enhance basin management, (3) protect and enhance water quality and (4) equitably finance the Strategic Plan implementation. For the environmental evaluation of the Six Basins Project, Proposed Projects to Optimize Conjunctive Water Management, have been placed in four categories. The four categories are:
Project Category 1: Pump and treat groundwater in the Pomona Basin.
This category of projects consists of improvements to existing facilities in the Pomona Basin including: (1) increasing groundwater production at some existing wells; and (2) increasing treatment capacity at existing sites either through the construction of ion exchange (IX) or biological treatment facilities to remove Cr-6, nitrate and perchlorate; or expanding the existing air stripping facility or construct a granular activated carbon (GAC) facility to remove constituents.
Project Category 2: Stormwater and Supplemental water Recharge Projects
This category of projects represents improvements that would be undertaken at the San Antonio Spreading Grounds and the Thompson Creek Spreading Grounds to enhance stormwater recharge and supplemental water recharge; enhance stormwater recharge at the Pedley Spreading Grounds; to create an area for the recharge of stormwater and supplemental water at the Los Angeles County Fairplex; and to identify opportunities for stormwater recharge through compliance with the Municipal Separate Storm Sewer System (MS-4).
More specifically, the San Antonio Spreading Grounds includes:
• 50 acres in area within a larger 90-acre area within the San Antonio Creek wash, west of the San Antonio Creek Channel, east of the power transmission lines, south of the existing LACFCD basins, and north of the extension of East Pomello Drive.

Six Basins Strategic Plan Air Quality Impact Analysis
13854-02 AQ Report.pdf 5
EXHIBIT 1-A: PROJECT LOCATION MAP
LEGEND: @J Project Identification (PID)
~ Potential Water Treatment Facility

Six Basins Strategic Plan Air Quality Impact Analysis
13854-02 AQ Report.pdf 6
• 150-200 feet in depth (depending on groundwater level). • Approximately 2.5 million tons of aggregate material will be excavated with typical aggregate
mining equipment (dozers, scrapers) and hauled to a portable crusher within the excavation area. • A total of approximately 20 million tons would be excavated over a five year period. • Material is crushed on site and released onto a conveyor system. A typical system consists of a
rubberized belt on a series of rollers within a frame that may range in size from 2-4 feet in width and between 2-4 feet above ground surface.
• Material would be conveyed to an active mining area between Holliday Pits 4 and 5. The material would be either stockpiled at that location of conveyed south to be processed at the Foothill Plant locate south of Baseline Road – no material is transported by haul truck.
• The crusher and conveyor system are portable and can be moved around the excavated area as mining lowers the level of the excavation area.
• Excavation activities at the SASG site could take up to 5 years to complete but could be completed in 2 years depending on the ultimate depth.
• No transport of excavated material would be hauled on surface streets through neighborhoods.
Project Category 3: Temporary Surplus Projects
Projects in this category include: 1) rehabilitating Pomona’s P-20 wellhead treatment facility, 2) constructing new production wells and monitoring wells; and 3) construction of new underground pipelines to interconnect some sites.
Project Category 4: Monitoring programs in support of the Strategic Plan.
This category of projects consists of the research for and development of groundwater monitoring programs to support the design of new wells and treatment facilities (Project Categories 1 and 3) and provide groundwater production and water-level data to the Watermaster Parties, supporting well-siting investigations, and other support functions to monitor and develop new strategies and projects for conjunctive water use.
The Proposed Projects to Optimize Conjunctive Water Management included in the program-level Six Basins Project are listed on Table 1-1.

Six Basins Strategic Plan Air Quality Impact Analysis
13854-02 AQ Report.pdf 7
TABLE 1-1: PROPOSED PROJECTS TO OPTIMIZE CONJUNCTIVE WATER MANAGEMENT
PID1 Project Description
Pump and Treat2
A Increase Groundwater Production and Treatment Capacity at Reservoir 5 Treatment Facility B Increase Groundwater Production and Treatment Capacity at Lincoln/Mills Treatment Facility
C Rehabilitate Del Monte 4 and Add Arsenic Treatment
D Construct Durward 2 Well and a Wellhead Treatment Facility
E Rehabilitate Old Baldy Well and Construct Wellhead Treatment Facility
Recharge Improvements
F Enhance Stormwater Recharge at the San Antonio Spreading Grounds G3 Enhance Supplemental-Water Recharge at the SASG
H4 Enhance Stormwater Recharge at the Thompson Creek Spreading Grounds
I Supplemental-Water Recharge at the TCSG
J5 Enhance Stormwater Recharge at the Pedley Spreading Grounds
K6 Recharge Stormwater and Supplemental Water at the LA County Fairplex
N Enhance Stormwater Recharge through MS-4 Compliance
O7 Create a Conservation Pool Behind San Antonio Dam
Temporary Surplus
L8 Construct Interconnections between water supply agencies M9 Rehabilitate P-20 and a Wellhead Treatment Facility
P10 Construct New Production Wells Source: Wildermuth Environmental, Inc., Final Strategic Plan for the Six Basins, November 2017, Table 6-2. 1 Project Identification Number. 2 Pump and Treat projects will be carried out at existing well sites and/or treatment facilities. No new site disturbance is anticipated through the physical expansion of a well site or treatment facility. 3 Potential area of disturbance to expand the SASG is 50 acres to a depth of up to 16 feet. To recharge recycled water, a pipeline of up to 68,000 lineal feet would be constructed. 4 Potential area of disturbance to expand the TCSG is 143 acres to a depth of up to 10 feet. 5 Potential area of disturbance to expand the Pedley Spreading Grounds is 6 acres to a depth of up to 10 feet. 6 Potential area of disturbance to create the new Fairplex water recharge facilities is 100 acres to a depth of up to 10 feet. 7 Subsequent to the completion of the Draft Strategic Plan, the Watermaster Parties determined that this project was speculative at this time and is no longer being considered in conjunction with the other Strategic Plan projects. 8 Pipe sizes ranging from 8” to 20” in diameter. 9 See note No. 2 above. 10 Construction of new production wells is assumed to disturb up to 0.5 acre per well site (includes well site and site access).

Six Basins Strategic Plan Air Quality Impact Analysis
13854-02 AQ Report.pdf 8
This page intentionally left blank

Six Basins Strategic Plan Air Quality Impact Analysis
13854-02 AQ Report.pdf 9
2 AIR QUALITY SETTING
This section provides an overview of the existing air quality conditions in the Project area and region.
2.1 SOUTH COAST AIR BASIN (SCAB)
The Project site is located in the SCAB within the jurisdiction of SCAQMD (3). The SCAQMD was created by the 1977 Lewis-Presley Air Quality Management Act, which merged four county air pollution control bodies into one regional district. Under the Act, the SCAQMD is responsible for bringing air quality in areas under its jurisdiction into conformity with federal and state air quality standards. As previously stated, the Project site is located within the SCAB, a 6,745-square mile subregion of the SCAQMD, which includes portions of Los Angeles, Riverside, and San Bernardino Counties, and all of Orange County.
The SCAB is bounded by the Pacific Ocean to the west and the San Gabriel, San Bernardino, and San Jacinto Mountains to the north and east. The Los Angeles County portion of the Mojave Desert Air Basin is bounded by the San Gabriel Mountains to the south and west, the Los Angeles / Kern County border to the north, and the Los Angeles / San Bernardino County border to the east. The Riverside County portion of the Salton Sea Air Basin is bounded by the San Jacinto Mountains in the west and spans eastward up to the Palo Verde Valley.
2.2 REGIONAL CLIMATE
The regional climate has a substantial influence on air quality in the SCAB. In addition, the temperature, wind, humidity, precipitation, and amount of sunshine influence the air quality.
The annual average temperatures throughout the SCAB vary from the low to middle 60s degrees Fahrenheit (°F). Due to a decreased marine influence, the eastern portion of the SCAB shows greater variability in average annual minimum and maximum temperatures. January is the coldest month throughout the SCAB, with average minimum temperatures of 47°F in downtown Los Angeles and 36°F in San Bernardino. All portions of the SCAB have recorded maximum temperatures above 100°F.
Although the climate of the SCAB can be characterized as semi-arid, the air near the land surface is quite moist on most days because of the presence of a marine layer. This shallow layer of sea air is an important modifier of SCAB climate. Humidity restricts visibility in the SCAB, and the conversion of sulfur dioxide (SO2) to sulfates (SO4) is heightened in air with high relative humidity. The marine layer provides an environment for that conversion process, especially during the spring and summer months. The annual average relative humidity within the SCAB is 71% along the coast and 59% inland. Since the ocean effect is dominant, periods of heavy early morning fog are frequent and low stratus clouds are a characteristic feature. These effects decrease with distance from the coast.
More than 90% of the SCAB’s rainfall occurs from November through April. The annual average rainfall varies from approximately nine inches in Riverside to fourteen inches in downtown Los

Six Basins Strategic Plan Air Quality Impact Analysis
13854-02 AQ Report.pdf 10
Angeles. Monthly and yearly rainfall totals are extremely variable. Summer rainfall usually consists of widely scattered thunderstorms near the coast and slightly heavier shower activity in the eastern portion of the SCAB with frequency being higher near the coast.
Due to its generally clear weather, about three-quarters of available sunshine is received in the SCAB. The remaining one-quarter is absorbed by clouds. The ultraviolet portion of this abundant radiation is a key factor in photochemical reactions. On the shortest day of the year there are approximately 10 hours of possible sunshine, and on the longest day of the year there are approximately 14½ hours of possible sunshine.
The importance of wind to air pollution is considerable. The direction and speed of the wind determines the horizontal dispersion and transport of the air pollutants. During the late autumn to early spring rainy season, the SCAB is subjected to wind flows associated with the traveling storms moving through the region from the northwest. This period also brings five to ten periods of strong, dry offshore winds, locally termed “Santa Anas” each year. During the dry season, which coincides with the months of maximum photochemical smog concentrations, the wind flow is bimodal, typified by a daytime onshore sea breeze and a nighttime offshore drainage wind. Summer wind flows are created by the pressure differences between the relatively cold ocean and the unevenly heated and cooled land surfaces that modify the general northwesterly wind circulation over southern California. Nighttime drainage begins with the radiational cooling of the mountain slopes. Heavy, cool air descends the slopes and flows through the mountain passes and canyons as it follows the lowering terrain toward the ocean. Another characteristic wind regime in the SCAB is the “Catalina Eddy,” a low level cyclonic (counterclockwise) flow centered over Santa Catalina Island which results in an offshore flow to the southwest. On most spring and summer days, some indication of an eddy is apparent in coastal sections.
In the SCAB, there are two distinct temperature inversion structures that control vertical mixing of air pollution. During the summer, warm high-pressure descending (subsiding) air is undercut by a shallow layer of cool marine air. The boundary between these two layers of air is a persistent marine subsidence/inversion. This boundary prevents vertical mixing which effectively acts as an impervious lid to pollutants over the entire SCAB. The mixing height for the inversion structure is normally situated 1,000 to 1,500 feet above mean sea level.
A second inversion-type forms in conjunction with the drainage of cool air off the surrounding mountains at night followed by the seaward drift of this pool of cool air. The top of this layer forms a sharp boundary with the warmer air aloft and creates nocturnal radiation inversions. These inversions occur primarily in the winter when nights are longer and onshore flow is weakest. They are typically only a few hundred feet above mean sea level. These inversions effectively trap pollutants, such as NOX and CO from vehicles, as the pool of cool air drifts seaward. Winter is therefore a period of high levels of primary pollutants along the coastline.
2.3 WIND PATTERNS AND PROJECT LOCATION
The distinctive climate of the Project area and the SCAB is determined by its terrain and geographical location. The SCAB is located in a coastal plain with connecting broad valleys and

Six Basins Strategic Plan Air Quality Impact Analysis
13854-02 AQ Report.pdf 11
low hills, bounded by the Pacific Ocean in the southwest quadrant with high mountains forming the remainder of the perimeter.
Wind patterns across the south coastal region are characterized by westerly and southwesterly onshore winds during the day and easterly or northeasterly breezes at night. Winds are characteristically light although the speed is somewhat greater during the dry summer months than during the rainy winter season.
2.4 CRITERIA POLLUTANTS
Criteria pollutants are pollutants that are regulated through the development of human health based and/or environmentally based criteria for setting permissible levels. Criteria pollutants, their typical sources, and health effects are identified below (4):
TABLE 2-1: CRITERIA POLLUTANTS
Criteria Pollutant Description Sources Health Effects
CO CO is a colorless, odorless gas produced by the incomplete combustion of carbon-containing fuels, such as gasoline or wood. CO concentrations tend to be the highest during the winter morning, when little to no wind and surface-based inversions trap the pollutant at ground levels. Because CO is emitted directly from internal combustion engines, unlike ozone (O3), motor vehicles operating at slow speeds are the primary source of CO in the SCAB. The highest ambient CO concentrations are generally found near congested transportation corridors and intersections.
Any source that burns fuel such as automobiles, trucks, heavy construction equipment, farming equipment and residential heating.
Individuals with a deficient blood supply to the heart are the most susceptible to the adverse effects of CO exposure. The effects observed include earlier onset of chest pain with exercise, and electrocardiograph changes indicative of decreased oxygen (O2) supply to the heart. Inhaled CO has no direct toxic effect on the lungs but exerts its effect on tissues by interfering with O2
transport and competing with O2 to combine with hemoglobin present in the blood to form carboxyhemoglobin (COHb). Hence, conditions with an increased demand for O2
supply can be adversely affected by exposure to CO. Individuals most at risk include fetuses, patients with diseases involving heart and blood vessels, and patients with chronic hypoxemia (O2
deficiency) as seen at high altitudes.
Six Basins Strategic Plan Air Quality Impact Analysis
13854-02 AQ Report.pdf 12
Criteria Pollutant Description Sources Health Effects
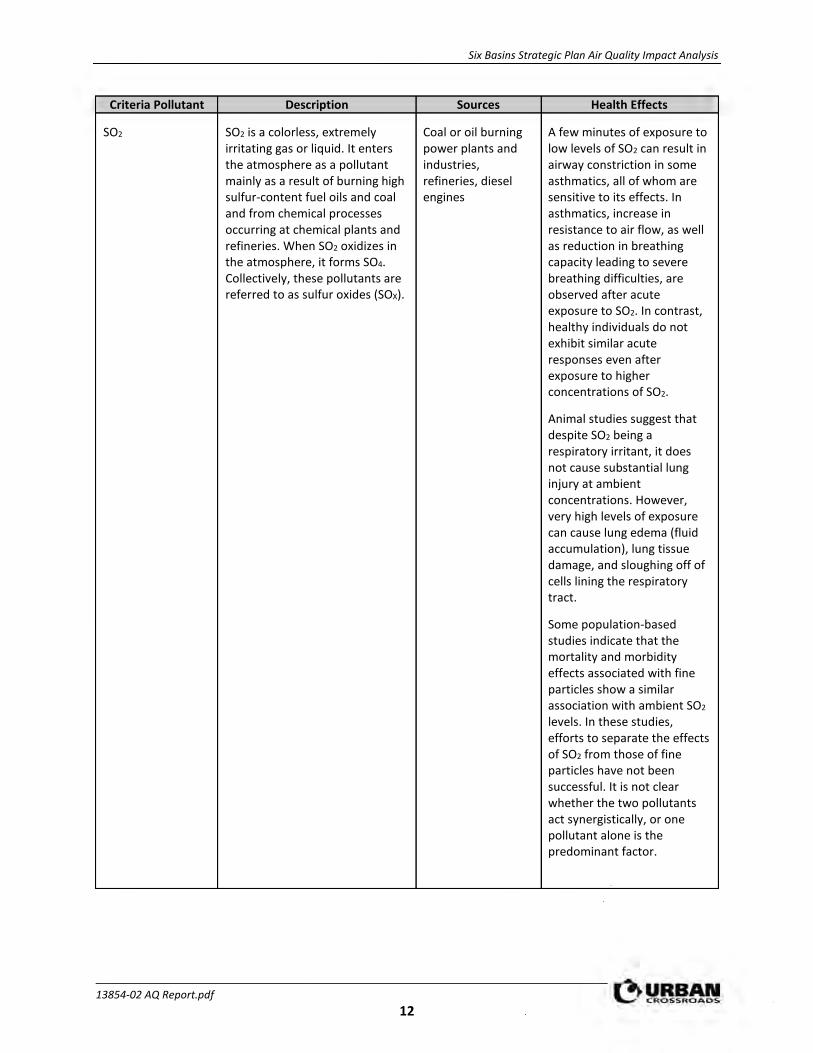
SO2 SO2 is a colorless, extremely irritating gas or liquid. It enters the atmosphere as a pollutant mainly as a result of burning high sulfur-content fuel oils and coal and from chemical processes occurring at chemical plants and refineries. When SO2 oxidizes in the atmosphere, it forms SO4. Collectively, these pollutants are referred to as sulfur oxides (SOX).
Coal or oil burning power plants and industries, refineries, diesel engines
A few minutes of exposure to low levels of SO2 can result in airway constriction in some asthmatics, all of whom are sensitive to its effects. In asthmatics, increase in resistance to air flow, as well as reduction in breathing capacity leading to severe breathing difficulties, are observed after acute exposure to SO2. In contrast, healthy individuals do not exhibit similar acute responses even after exposure to higher concentrations of SO2.
Animal studies suggest that despite SO2 being a respiratory irritant, it does not cause substantial lung injury at ambient concentrations. However, very high levels of exposure can cause lung edema (fluid accumulation), lung tissue damage, and sloughing off of cells lining the respiratory tract.
Some population-based studies indicate that the mortality and morbidity effects associated with fine particles show a similar association with ambient SO2 levels. In these studies, efforts to separate the effects of SO2 from those of fine particles have not been successful. It is not clear whether the two pollutants act synergistically, or one pollutant alone is the predominant factor.
Six Basins Strategic Plan Air Quality Impact Analysis
13854-02 AQ Report.pdf 13
Criteria Pollutant Description Sources Health Effects
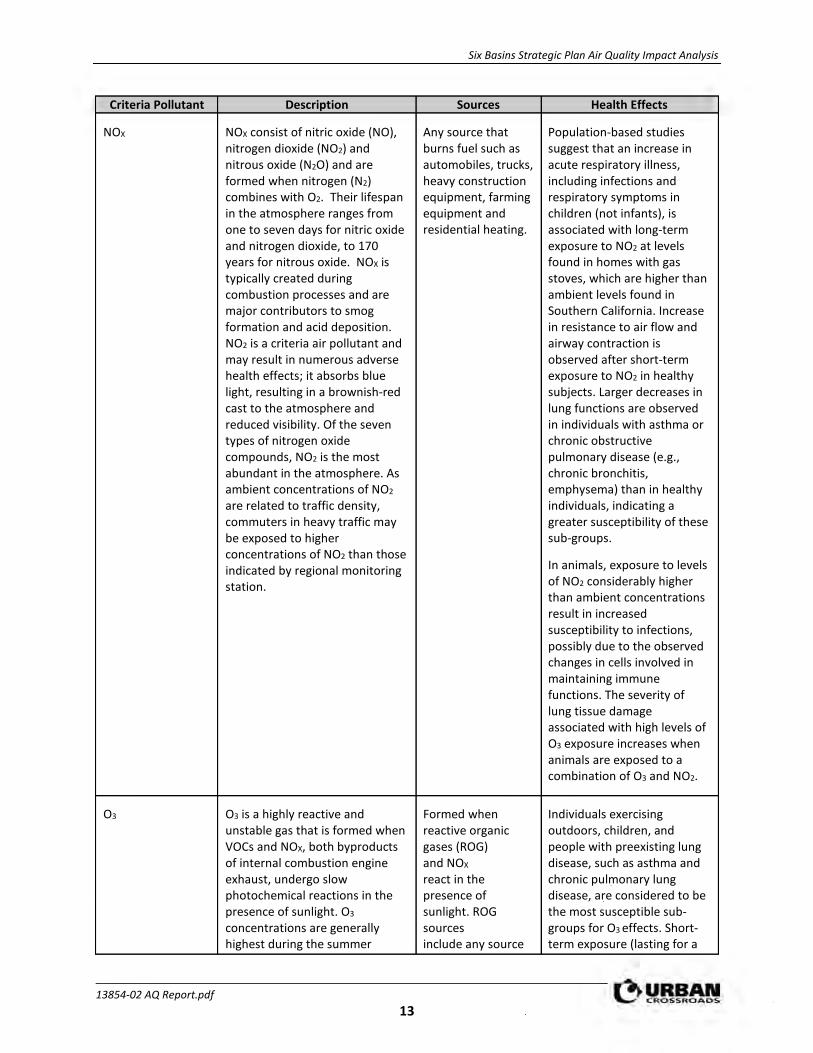
NOX NOX consist of nitric oxide (NO), nitrogen dioxide (NO2) and nitrous oxide (N2O) and are formed when nitrogen (N2) combines with O2. Their lifespan in the atmosphere ranges from one to seven days for nitric oxide and nitrogen dioxide, to 170 years for nitrous oxide. NOX is typically created during combustion processes and are major contributors to smog formation and acid deposition. NO2 is a criteria air pollutant and may result in numerous adverse health effects; it absorbs blue light, resulting in a brownish-red cast to the atmosphere and reduced visibility. Of the seven types of nitrogen oxide compounds, NO2 is the most abundant in the atmosphere. As ambient concentrations of NO2 are related to traffic density, commuters in heavy traffic may be exposed to higher concentrations of NO2 than those indicated by regional monitoring station.
Any source that burns fuel such as automobiles, trucks, heavy construction equipment, farming equipment and residential heating.
Population-based studies suggest that an increase in acute respiratory illness, including infections and respiratory symptoms in children (not infants), is associated with long-term exposure to NO2 at levels found in homes with gas stoves, which are higher than ambient levels found in Southern California. Increase in resistance to air flow and airway contraction is observed after short-term exposure to NO2 in healthy subjects. Larger decreases in lung functions are observed in individuals with asthma or chronic obstructive pulmonary disease (e.g., chronic bronchitis, emphysema) than in healthy individuals, indicating a greater susceptibility of these sub-groups.
In animals, exposure to levels of NO2 considerably higher than ambient concentrations result in increased susceptibility to infections, possibly due to the observed changes in cells involved in maintaining immune functions. The severity of lung tissue damage associated with high levels of O3 exposure increases when animals are exposed to a combination of O3 and NO2.
O3 O3 is a highly reactive and unstable gas that is formed when VOCs and NOX, both byproducts of internal combustion engine exhaust, undergo slow photochemical reactions in the presence of sunlight. O3 concentrations are generally highest during the summer
Formed when reactive organic gases (ROG) and NOX react in the presence of sunlight. ROG sources include any source
Individuals exercising outdoors, children, and people with preexisting lung disease, such as asthma and chronic pulmonary lung disease, are considered to be the most susceptible sub-groups for O3 effects. Short-term exposure (lasting for a

Six Basins Strategic Plan Air Quality Impact Analysis
13854-02 AQ Report.pdf 14
Criteria Pollutant Description Sources Health Effects months when direct sunlight, light wind, and warm temperature conditions are favorable to the formation of this pollutant.
that burns fuels, (e.g., gasoline, natural gas, wood, oil) solvents, petroleum processing and storage and pesticides.
few hours) to O3 at levels typically observed in Southern California can result in breathing pattern changes, reduction of breathing capacity, increased susceptibility to infections, inflammation of the lung tissue, and some immunological changes. Elevated O3 levels are associated with increased school absences. In recent years, a correlation between elevated ambient O3 levels and increases in daily hospital admission rates, as well as mortality, has also been reported. An increased risk for asthma has been found in children who participate in multiple outdoor sports and live in communities with high O3 levels.
O3 exposure under exercising conditions is known to increase the severity of the responses described above. Animal studies suggest that exposure to a combination of pollutants that includes O3 may be more toxic than exposure to O3 alone. Although lung volume and resistance changes observed after a single exposure diminish with repeated exposures, biochemical and cellular changes appear to persist, which can lead to subsequent lung structural changes.
Particulate Matter PM10: A major air pollutant consisting of tiny solid or liquid particles of soot, dust, smoke, fumes, and aerosols. Particulate matter pollution is a major cause of reduce visibility (haze) which is caused by the scattering of light
Sources of PM10 include road dust, windblown dust and construction. Also formed from other pollutants (acid rain, NOX, SOX,
A consistent correlation between elevated ambient fine particulate matter (PM10 and PM2.5) levels and an increase in mortality rates, respiratory infections, number and severity of

Six Basins Strategic Plan Air Quality Impact Analysis
13854-02 AQ Report.pdf 15
Criteria Pollutant Description Sources Health Effects and consequently the significant reduction air clarity. The size of the particles (10 microns or smaller, about 0.0004 inches or less) allows them to easily enter the lungs where they may be deposited, resulting in adverse health effects. Additionally, it should be noted that PM10 is considered a criteria air pollutant.
PM2.5: A similar air pollutant to PM10 consisting of tiny solid or liquid particles which are 2.5 microns or smaller (which is often referred to as fine particles). These particles are formed in the atmosphere from primary gaseous emissions that include SO4 formed from SO2 release from power plants and industrial facilities and nitrates that are formed from NOX release from power plants, automobiles and other types of combustion sources. The chemical composition of fine particles highly depends on location, time of year, and weather conditions. PM2.5 is a criteria air pollutant.
organics). Incomplete combustion of any fuel.
PM2.5 comes from fuel combustion in motor vehicles, equipment and industrial sources, residential and agricultural burning. Also formed from reaction of other pollutants (acid rain, NOX, SOX, organics).
asthma attacks and the number of hospital admissions has been observed in different parts of the United States and various areas around the world. In recent years, some studies have reported an association between long-term exposure to air pollution dominated by fine particles and increased mortality, reduction in lifespan, and an increased mortality from lung cancer.
Daily fluctuations in PM2.5
concentration levels have also been related to hospital admissions for acute respiratory conditions in children, to school and kindergarten absences, to a decrease in respiratory lung volumes in normal children, and to increased medication use in children and adults with asthma. Recent studies show lung function growth in children is reduced with long term exposure to particulate matter.
The elderly, people with pre-existing respiratory or cardiovascular disease, and children appear to be more susceptible to the effects of high levels of PM10 and PM2.5.
VOC VOCs are hydrocarbon compounds (any compound containing various combinations of hydrogen and carbon atoms) that exist in the ambient air. VOCs contribute to the formation of smog through atmospheric photochemical reactions and/or may be toxic. Compounds of carbon (also known as organic compounds) have different levels of reactivity; that is, they do not react at the same speed or do not
Organic chemicals are widely used as ingredients in household products. Paints, varnishes and wax all contain organic solvents, as do many cleaning, disinfecting, cosmetic, degreasing and hobby products.
Breathing VOCs can irritate the eyes, nose and throat, can cause difficulty breathing and nausea, and can damage the central nervous system as well as other organs. Some VOCs can cause cancer. Not all VOCs have all these health effects, though many have several.
Six Basins Strategic Plan Air Quality Impact Analysis
13854-02 AQ Report.pdf 16
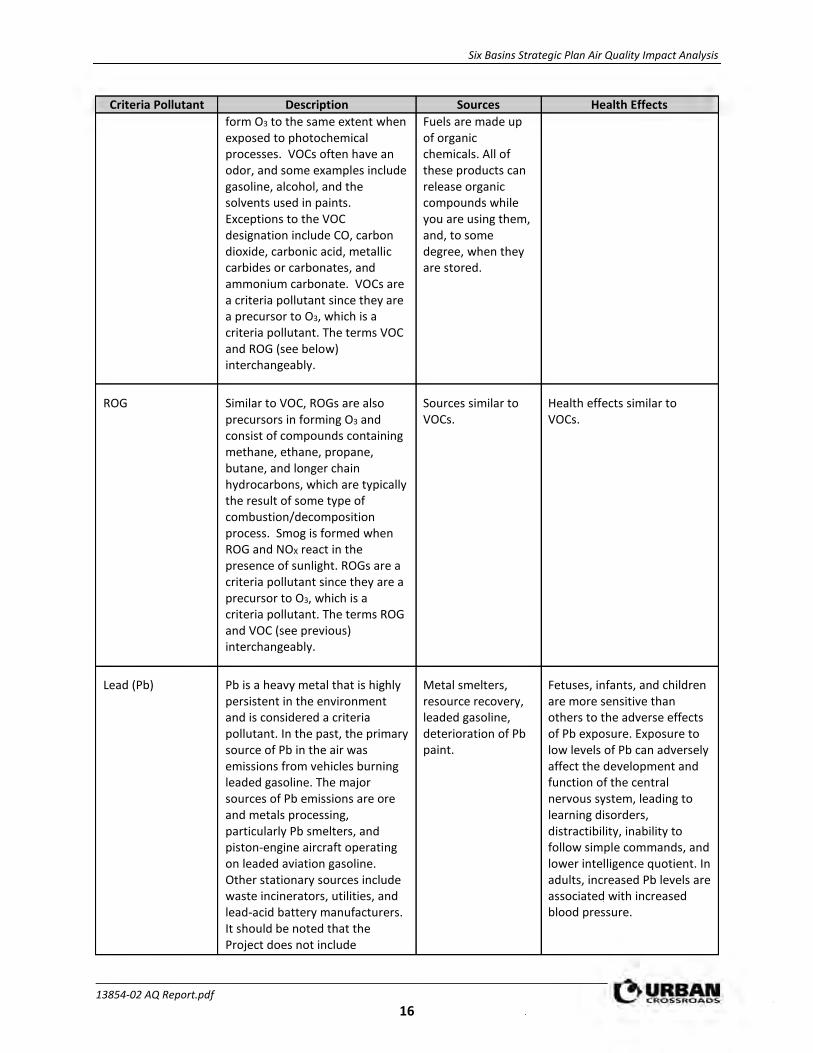
Criteria Pollutant Description Sources Health Effects form O3 to the same extent when exposed to photochemical processes. VOCs often have an odor, and some examples include gasoline, alcohol, and the solvents used in paints. Exceptions to the VOC designation include CO, carbon dioxide, carbonic acid, metallic carbides or carbonates, and ammonium carbonate. VOCs are a criteria pollutant since they are a precursor to O3, which is a criteria pollutant. The terms VOC and ROG (see below) interchangeably.
Fuels are made up of organic chemicals. All of these products can release organic compounds while you are using them, and, to some degree, when they are stored.
ROG Similar to VOC, ROGs are also precursors in forming O3 and consist of compounds containing methane, ethane, propane, butane, and longer chain hydrocarbons, which are typically the result of some type of combustion/decomposition process. Smog is formed when ROG and NOX react in the presence of sunlight. ROGs are a criteria pollutant since they are a precursor to O3, which is a criteria pollutant. The terms ROG and VOC (see previous) interchangeably.
Sources similar to VOCs.
Health effects similar to VOCs.
Lead (Pb) Pb is a heavy metal that is highly persistent in the environment and is considered a criteria pollutant. In the past, the primary source of Pb in the air was emissions from vehicles burning leaded gasoline. The major sources of Pb emissions are ore and metals processing, particularly Pb smelters, and piston-engine aircraft operating on leaded aviation gasoline. Other stationary sources include waste incinerators, utilities, and lead-acid battery manufacturers. It should be noted that the Project does not include
Metal smelters, resource recovery, leaded gasoline, deterioration of Pb paint.
Fetuses, infants, and children are more sensitive than others to the adverse effects of Pb exposure. Exposure to low levels of Pb can adversely affect the development and function of the central nervous system, leading to learning disorders, distractibility, inability to follow simple commands, and lower intelligence quotient. In adults, increased Pb levels are associated with increased blood pressure.

Six Basins Strategic Plan Air Quality Impact Analysis
13854-02 AQ Report.pdf 17
Criteria Pollutant Description Sources Health Effects operational activities such as metal processing or Pb acid battery manufacturing. As such, the Project is not anticipated to generate a quantifiable amount of Pb emissions.
Pb poisoning can cause anemia, lethargy, seizures, and death; although it appears that there are no direct effects of Pb on the respiratory system. Pb can be stored in the bone from early age environmental exposure, and elevated blood Pb levels can occur due to breakdown of bone tissue during pregnancy, hyperthyroidism (increased secretion of hormones from the thyroid gland) and osteoporosis (breakdown of bony tissue). Fetuses and breast-fed babies can be exposed to higher levels of Pb because of previous environmental Pb exposure of their mothers.
Odor Odor means the perception experienced by a person when one or more chemical substances in the air come into contact with the human olfactory nerves (5).
Odors can come from many sources including animals, human activities, industry, natures, and vehicles.
Offensive odors can potentially affect human health in several ways. First, odorant compounds can irritate the eye, nose, and throat, which can reduce respiratory volume. Second, studies have shown that the VOCs that cause odors can stimulate sensory nerves to cause neurochemical changes that might influence health, for instance, by compromising the immune system. Finally, unpleasant odors can trigger memories or attitudes linked to unpleasant odors, causing cognitive and emotional effects such as stress.
Six Basins Strategic Plan Air Quality Impact Analysis
13854-02 AQ Report.pdf 18
2.5 EXISTING AIR QUALITY
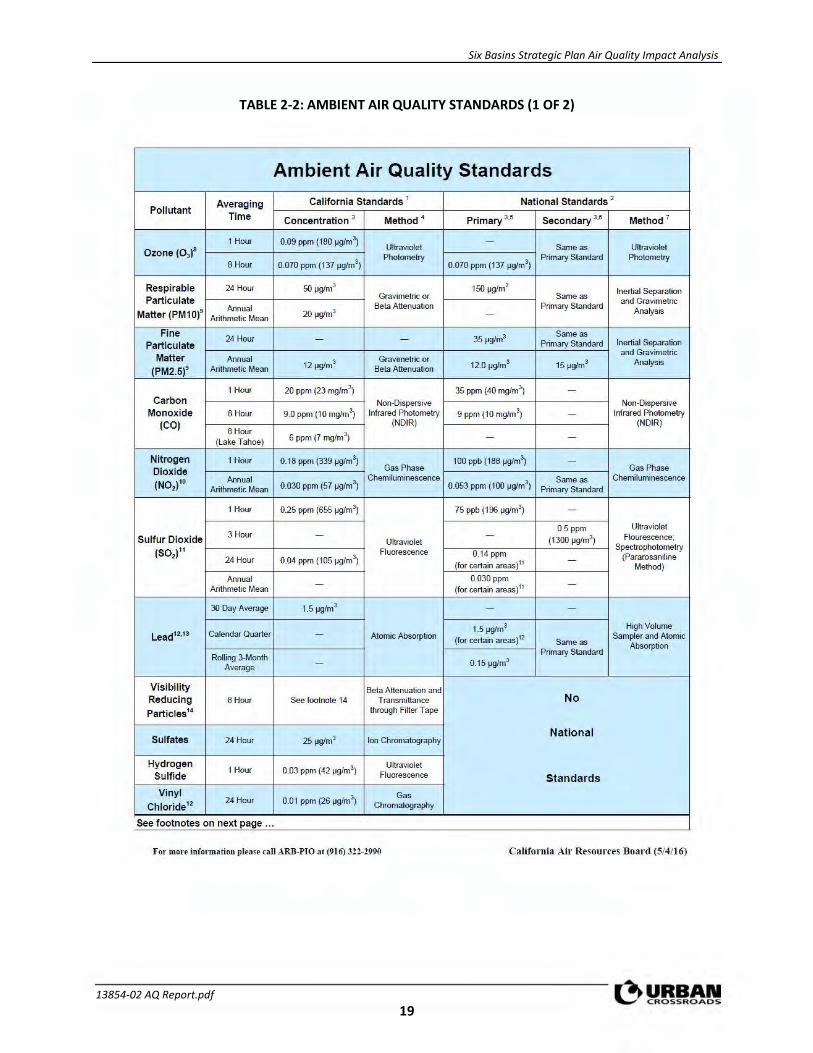
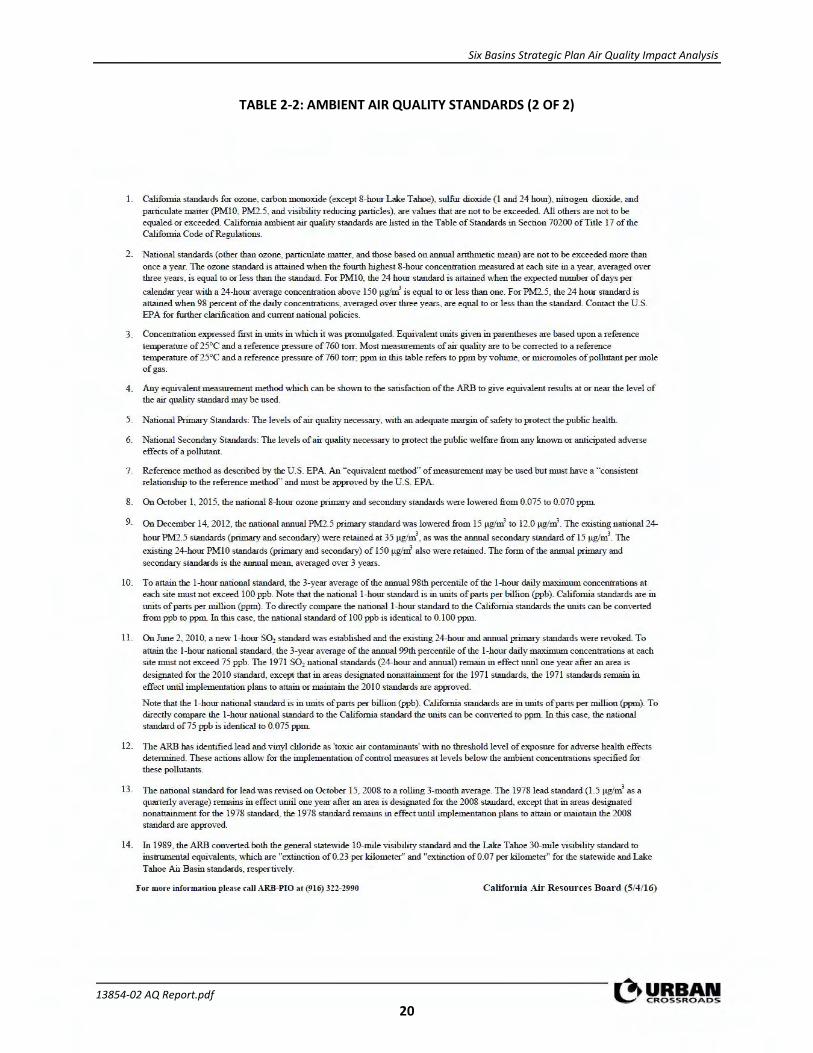
Existing air quality is measured at established SCAQMD air quality monitoring stations. Monitored air quality is evaluated in the context of ambient air quality standards. These standards are the levels of air quality that are considered safe, with an adequate margin of safety, to protect the public health and welfare. National Ambient Air Quality Standards (NAAQS) and California Ambient Air Quality Standards (CAAQS) currently in effect are shown in Table 2-2 (6).
The determination of whether a region’s air quality is healthful or unhealthful is determined by comparing contaminant levels in ambient air samples to the state and federal standards. At the time of this AQIA, the most recent state and federal standards were updated by CARB on May 4, 2016 and are presented in Table 2-2. The air quality in a region is considered to be in attainment by the state if the measured ambient air pollutant levels for O3, CO (except 8-hour Lake Tahoe), SO2 (1 and 24 hour), NO2, PM10, and PM2.5 do not exceed standards. All others are not to be equaled or exceeded. It should be noted that the three-year period is presented for informational purposes and is not the basis for how the State assigns attainment status. Attainment status for a pollutant means that the SCAQMD meets the standards set by the EPA or the California EPA (CalEPA). Conversely, nonattainment means that an area has monitored air quality that does not meet the NAAQS or CAAQS standards. In order to improve air quality in nonattainment areas, CARB has implemented a State Implementation Plan (SIP). The SIP outlines the measures that the state will take to improve air quality. Once nonattainment areas meet the standards and additional redesignation requirements, the EPA will designate the area as a maintenance area (7).
Six Basins Strategic Plan Air Quality Impact Analysis
13854-02 AQ Report.pdf 19
TABLE 2-2: AMBIENT AIR QUALITY STANDARDS (1 OF 2)
Ambient Air Quality Standards
Averaging California Standards ' National Standards 2
Pollutant Time Concentration 3 Method 4 Primary ... Secondary ' ·0 Method 7
1 Hour 0.09 ppm (180 µg/m3} -
Ozone (0 3)8 Ultraviolet Same as Ultraviolet
8 Hour 0.070 ppm (137 µglm3}
Photometry 0.070 ppm (137 µg/m3
} Primary Standard Photometry
Respirable 24 Hour 50 µgin/ 150 µg/m3 Inertial Separation
Particulate Gravimetric or Same as and Gravimetric
Matter (PM1 o)" Annual 20 µglm3
Beta Attenuation Primary Standard Analysis
Arithmetic Mean -
Fine 24 Hour 35 µg/m3 Same as
Particulate - -
Primary Standard Inertial Separation
Matter and Gravimetric
Annual 12 µglm3 Gravimetric or
12.0 µglm3 15 µglm3 Analysis (PM2.5)9 Arithmetic Mean Beta Attenuation
1 Hour 20 ppm (23 mg/m3} 35 ppm (40 mg/m3
} -
Carbon Non-Dispersive Non-Dispersive Monoxide 8 Hour 9.0 ppm (10 mg/m3
) Infrared Photometry 9 ppm (10 mglm 3} - Infrared Photometry
(CO) (NDIR} (NDIR} 8 Hour
6 ppm (7 mg/m3) (Lake Tahoe)
- -
Nitrogen 1 Hour 0.18 ppm (339 µg/m3} 100 ppb (188 µg/m3
) -
Dioxide Gas Phase Gas Phase
(N02)10 Annual
0.030 ppm (57 µg/m3}
Chemiluminescence 0.053 ppm (100 µg/m3
} Same as Chemiluminescence
Arithmetic Mean Primary Standard
1 Hour 0.25 ppm (655 µg/m3} 75 ppb (196 µglm3
} -
0.S ppm Ultraviolet
Sulfur Dioxide 3 Hour - -
(1300 µg/m3) Flourescence;
Ultraviolet
(S0, )11 Fluorescence 0.14 ppm Spectrophotometry
24 Hour 0.04 ppm (105 µg/m3} - (Pararosaniline
(for certain areas}" Method}
Annual 0.030 ppm Arithmetic Mean -
(for certain areas} 11 -
30 Day Average 1.5 µg/m3 - -
Calendar Quarter 1.5 µglm3 High Volume
Lead12•13 - Atomic Absorption
(for certain areas)12 Sampler and Atomic Same as Absorption
Rolling 3-Month Primary Standard
Average - 0.15 µg/m3
Visibility Beta Attenuation and Reducing 8 Hour See footnote 14 Transmittance No
Particles14 through Filter Tape
Sulfates 24 Hour 25 µglm3 Ion Chromatography Natio na l
Hydrogen 1 Hour 0.03 ppm (42 µg/m3
} Ultraviolet
Sulfide Fluorescence Standards
Vinyl 24 Hour 0.01 ppm (26 µg/m3
} Gas
Chloride" Chromatography
See footnotes on next page ...
f or more information please ca ll ARB-PIO al (916) 322-2990 California Air Resources Boa rd (5/4/16)
Six Basins Strategic Plan Air Quality Impact Analysis
13854-02 AQ Report.pdf 20
TABLE 2-2: AMBIENT AIR QUALITY STANDARDS (2 OF 2)
I . California standards for ozone, carbon monoxide (except 8-hour Lake Tahoe), sulfur dioxide (I and 24 hour), nitrogen dioxide, and
particulate matter (PMIO, PM2.5, and v isibility reducing particles). are values that are not to be exceeded. All others are not to be equaled or exceeded. California ambient air quality standards are listed in the Table of Standards in Section 70200 of Title 17 oftl1e California Code of Regulations.
2 . National standards (other than ozone, particulate matter, and those based on annual arithmetic mean) are not to be exceeded more than
once a year. The ozone standard is attained ·when the fou:nh highest. 8-hour concentration measured at each site in a year~ averaged over three years, is equal to or less than the standard. For PMI0, th e 24 hour standard is attained when tl1e expected number of days per
calendar year with a 24-hour average concentration above 150 pglm1 is equal to or less than one. For PM2.5, the 24 hour standard is attained when 98 percent of the daily concentrations, averaged over three years, are eqlk'tl to or less than the standard. Contact the U.S. EPA for forther clarification and current natiorial policies.
3. Concentration expressed first in wllts in which it was promulgated. Equivalent units given in parentheses are based upon a reference
temperamre of25°C and a reference pressure of 760 torr. Most measureme·nts of air quality are to be corrected to a reference temperanu-e of 25°C and a reference pressure of 760 torr; ppin in this table refers to ppm by volume, or mic:romoles of pollutant per mole of gas.
4 . .A11y equivalent n1e.asureme11t n1ethod which can be shown to the satisfaction of the ARB to give equivalent results at or near the level of the air quality standard may be used.
5. National Printary Standards: The levels of air quality necessary, with an adequate margin of safety to protect the p ublic healili.
6. National Secondary Standards: The levels of air quality necessary to protect the public welfare from any knO\vn or anticipated adverse effects of a pollutant.
7 . Reference method as described by the U.S. EPA. An "equivalent method" of measurement may be used but must have a "consistent relationship to the reference method" and m1tst be approved by the U.S. EPA.
8. Ou October I , 2015, the national 8-hour ozone primary and secondary standards were lowered from 0.075 to 0.070 ppm.
9 . Ou December 14, 2012, the national annual PM2.5 primary standard was lowered from 15 r1glm' to 12.0 ftg/m3. T11e existing national 24-
hour PM2.5 stan dards (primary and secondaty) were retained at 35 11glm1
, as was the annual secondaty standard of 15 rcglm1. The
existing 24-hour PMI0 standards (primary and secondaty) of 150 11glni also were retained. The form of the annual printary and
secondary standards is the annual me~ averaged over 3 years.
10. To attain the I -hour national standard, the 3-year average of the annual 98th percentile of the I-hour daily maximum concentrations at each site must not exceed 100 ppb. Note that the national I-hour standard is in units of parts per billion (ppb) California standards are in
units of parts per million (pprn). To directly compare the national I-hour standard to t.l1e California standards the tut.its can be converted from ppb to ppm In tit.is case, the national standard of I 00 ppb is identical to 0.100 ppm.
11. On June 2, 2010, a new I -hour SO, standard was established an d the existing 24-hour and annual prtlllarY standards were rev oked. To
attain the I -hour national standard, the 3-year average o f the annual 99th percentile of the I-hour daily maxim.um concentrations at each site must not exceed 75 ppb. T11e 1971 SO, national standards (24-hour and annual) rentain in effect ,mtil one year after an area is
design ated for ilie 2010 stan dard, except that in areas designated nonattainment for the 1971 standards, the 1971 standards remain in
effect 1111til implementation p lans to attain or maintain the 2010 standards are approved.
Note that the I -hour national standard is in mt.its of parts per billion (ppb ). California standards are in units of parts per million (ppm). To directly compare the I-hour national standard to die California standard the units can be converted to ppm. In this case, the national standard of75 ppb is identical to 0.075 ppm.
12. The ARB has identified lead and v ti1yl cltloride as 'toxic air contarninants ' w ith no threshold level of exposure for adverse heald1 effects detennined. These action,; allow for the implementation of control measures at levels belo"v the ambient concentrations specified for iliese pollutants.
13. The national standard for lead was revised on October 15, 2008 to a rolling 3-monili average. The 1978 lead standard (1.5 ftg/m3
as a quarterly average) remains in effect until one year after an area is designated for d1e 2008 standard, except that in areas designated nonattainment for the 1978 standard, the 1978 standard remains in effect tmtil in,plementation plans to attain or maintain the 2008 standard are approved.
14. In 1989, the ARB converted both the general statewide 10-mile visibihty standard and the Lake Tahoe 30-mile visibility standard to instnuuental equivalents. which are "extinction of0.23 per kilometer" and "extinction of0.07 per kilometer11 for the statewide and Lake
Tahoe Air Basin standards, respectively .
f or more information please call ARB-PIO at (916) 322-2990 California Air Resources Board (5/4/16)
Six Basins Strategic Plan Air Quality Impact Analysis
13854-02 AQ Report.pdf 21
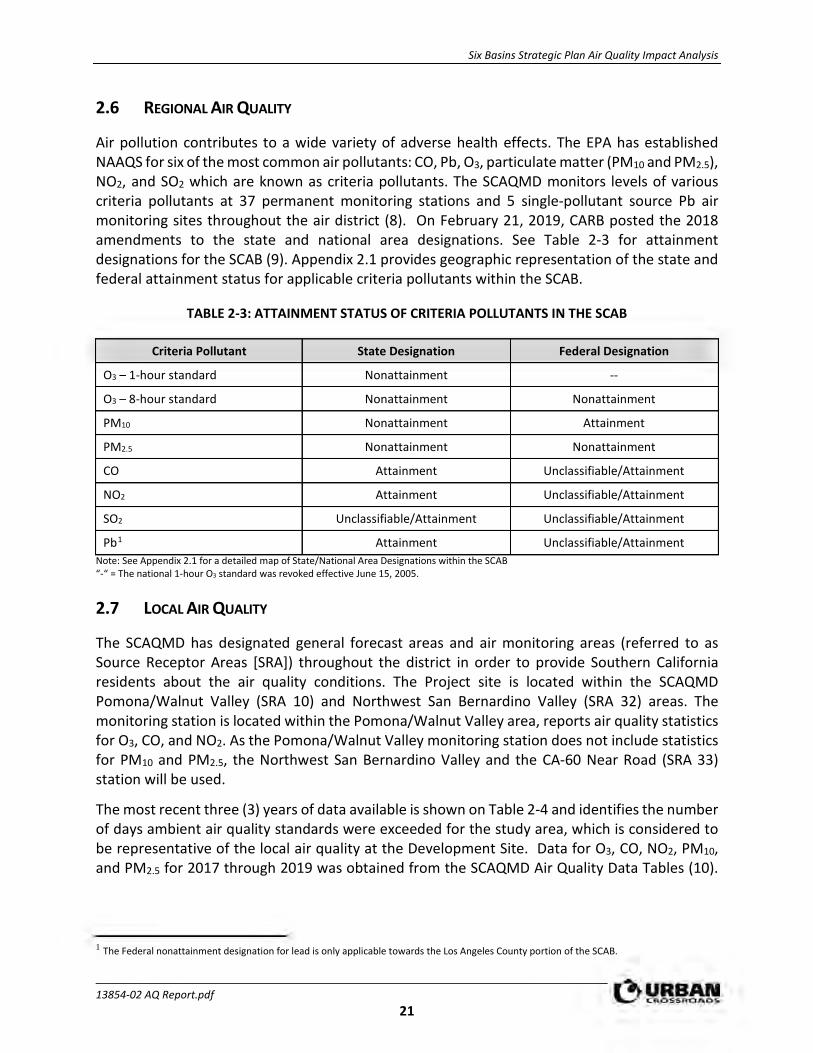
2.6 REGIONAL AIR QUALITY
Air pollution contributes to a wide variety of adverse health effects. The EPA has established NAAQS for six of the most common air pollutants: CO, Pb, O3, particulate matter (PM10 and PM2.5), NO2, and SO2 which are known as criteria pollutants. The SCAQMD monitors levels of various criteria pollutants at 37 permanent monitoring stations and 5 single-pollutant source Pb air monitoring sites throughout the air district (8). On February 21, 2019, CARB posted the 2018 amendments to the state and national area designations. See Table 2-3 for attainment designations for the SCAB (9). Appendix 2.1 provides geographic representation of the state and federal attainment status for applicable criteria pollutants within the SCAB.
TABLE 2-3: ATTAINMENT STATUS OF CRITERIA POLLUTANTS IN THE SCAB
Criteria Pollutant State Designation Federal Designation
O3 – 1-hour standard Nonattainment --
O3 – 8-hour standard Nonattainment Nonattainment
PM10 Nonattainment Attainment
PM2.5 Nonattainment Nonattainment
CO Attainment Unclassifiable/Attainment
NO2 Attainment Unclassifiable/Attainment
SO2 Unclassifiable/Attainment Unclassifiable/Attainment
Pb1 Attainment Unclassifiable/Attainment Note: See Appendix 2.1 for a detailed map of State/National Area Designations within the SCAB “-“ = The national 1-hour O3 standard was revoked effective June 15, 2005.
2.7 LOCAL AIR QUALITY
The SCAQMD has designated general forecast areas and air monitoring areas (referred to as Source Receptor Areas [SRA]) throughout the district in order to provide Southern California residents about the air quality conditions. The Project site is located within the SCAQMD Pomona/Walnut Valley (SRA 10) and Northwest San Bernardino Valley (SRA 32) areas. The monitoring station is located within the Pomona/Walnut Valley area, reports air quality statistics for O3, CO, and NO2. As the Pomona/Walnut Valley monitoring station does not include statistics for PM10 and PM2.5, the Northwest San Bernardino Valley and the CA-60 Near Road (SRA 33) station will be used.
The most recent three (3) years of data available is shown on Table 2-4 and identifies the number of days ambient air quality standards were exceeded for the study area, which is considered to be representative of the local air quality at the Development Site. Data for O3, CO, NO2, PM10, and PM2.5 for 2017 through 2019 was obtained from the SCAQMD Air Quality Data Tables (10).
1 The Federal nonattainment designation for lead is only applicable towards the Los Angeles County portion of the SCAB.

Six Basins Strategic Plan Air Quality Impact Analysis
13854-02 AQ Report.pdf 22
Additionally, data for SO2 has been omitted as attainment is regularly met in the SCAB and few monitoring stations measure SO2 concentrations.
TABLE 2-4: PROJECT AREA AIR QUALITY MONITORING SUMMARY 2017-2019
Pollutant Standard Year
2017 2018 2019
O3
Maximum Federal 1-Hour Concentration (ppm) 0.147 0.112 0.096
Maximum Federal 8-Hour Concentration (ppm) 0.114 0.081 0.083
Number of Days Exceeding State 1-Hour Standard > 0.09 ppm 18 7 1
Number of Days Exceeding State/Federal 8-Hour Standard > 0.070 ppm 35 10 12
CO
Maximum Federal 1-Hour Concentration > 35 ppm 2.0 2.1 1.7
Maximum Federal 8-Hour Concentration > 20 ppm 1.6 1.8 1.3
NO2
Maximum Federal 1-Hour Concentration > 0.100 ppm 0.081 0.068 0.064
Annual Federal Standard Design Value 0.021 0.019 0.018
PM10
Maximum Federal 24-Hour Concentration (µg/m3) > 150 µg/m3 106 73 125
Annual Federal Arithmetic Mean (µg/m3) 31.5 32.3 28.1
Number of Days Exceeding Federal 24-Hour Standard > 150 µg/m3 0 0 0
Number of Days Exceeding State 24-Hour Standard > 50 µg/m3 26 14 7
PM2.5
Maximum Federal 24-Hour Concentration (µg/m3) > 35 µg/m3 44.80 47.90 41.30
Annual Federal Arithmetic Mean (µg/m3) > 12 µg/m3 14.43 14.31 12.70
Number of Days Exceeding Federal 24-Hour Standard > 35 µg/m3 7 5 5 ppm = Parts Per Million µg/m3 = Microgram per Cubic Meter Source: Data for O3, CO, NO2, PM10, and PM2.5 was obtained from SCAQMD Air Quality Data Tables.
2.8 REGULATORY BACKGROUND
2.8.1 FEDERAL REGULATIONS
The EPA is responsible for setting and enforcing the NAAQS for O3, CO, NOX, SO2, PM10, and Pb (11). The EPA has jurisdiction over emissions sources that are under the authority of the federal government including aircraft, locomotives, and emissions sources outside state waters (Outer Continental Shelf). The EPA also establishes emission standards for vehicles sold in states other than California. Automobiles sold in California must meet the stricter emission requirements of CARB.

Six Basins Strategic Plan Air Quality Impact Analysis
13854-02 AQ Report.pdf 23
The Federal Clean Air Act (CAA) was first enacted in 1955 and has been amended numerous times in subsequent years (1963, 1965, 1967, 1970, 1977, and 1990). The CAA establishes the federal air quality standards, the NAAQS, and specifies future dates for achieving compliance (12). The CAA also mandates that states submit and implement SIPs for local areas not meeting these standards. These plans must include pollution control measures that demonstrate how the standards will be met.
The 1990 amendments to the CAA that identify specific emission reduction goals for areas not meeting the NAAQS require a demonstration of reasonable further progress toward attainment and incorporate additional sanctions for failure to attain or to meet interim milestones. The sections of the CAA most directly applicable to the development of the Project site include Title I (Non-Attainment Provisions) and Title II (Mobile Source Provisions) (13) (14). Title I provisions were established with the goal of attaining the NAAQS for the following criteria pollutants O3, NO2, SO2, PM10, CO, PM2.5, and Pb. The NAAQS were amended in July 1997 to include an additional standard for O3 and to adopt a NAAQS for PM2.5. Table 2-3 (previously presented) provides the NAAQS within the SCAB.
Mobile source emissions are regulated in accordance with Title II provisions. These provisions require the use of cleaner burning gasoline and other cleaner burning fuels such as methanol and natural gas. Automobile manufacturers are also required to reduce tailpipe emissions of hydrocarbons and NOX. NOX is a collective term that includes all forms of NOX which are emitted as byproducts of the combustion process.
2.8.2 CALIFORNIA REGULATIONS
CARB
CARB, which became part of the CalEPA in 1991, is responsible for ensuring implementation of the California Clean Air Act (AB 2595), responding to the federal CAA, and for regulating emissions from consumer products and motor vehicles. AB 2595 mandates achievement of the maximum degree of emissions reductions possible from vehicular and other mobile sources in order to attain the state ambient air quality standards by the earliest practical date. CARB established the CAAQS for all pollutants for which the federal government has NAAQS and, in addition, establishes standards for SO4, visibility, hydrogen sulfide (H2S), and vinyl chloride (C2H3Cl). However, at this time, H2S and C2H3Cl are not measured at any monitoring stations in the SCAB because they are not considered to be a regional air quality problem. Generally, the CAAQS are more stringent than the NAAQS (15) (11).
Local air quality management districts, such as the SCAQMD, regulate air emissions from stationary sources such as commercial and industrial facilities. All air pollution control districts have been formally designated as attainment or non-attainment for each CAAQS.
Serious non-attainment areas are required to prepare Air Quality Management Plans (AQMP) that include specified emission reduction strategies in an effort to meet clean air goals. These plans are required to include:
• Application of Best Available Retrofit Control Technology to existing sources;

Six Basins Strategic Plan Air Quality Impact Analysis
13854-02 AQ Report.pdf 24
• Developing control programs for area sources (e.g., architectural coatings and solvents) and indirect sources (e.g. motor vehicle use generated by residential and commercial development);
• A District permitting system designed to allow no net increase in emissions from any new or modified permitted sources of emissions;
• Implementing reasonably available transportation control measures and assuring a substantial reduction in growth rate of vehicle trips and miles traveled;
• Significant use of low emissions vehicles by fleet operators;
• Sufficient control strategies to achieve a 5% or more annual reduction in emissions or 15% or more in a period of three years for ROGs, NOX, CO and PM10. However, air basins may use alternative emission reduction strategy that achieves a reduction of less than 5% per year under certain circumstances.
TITLE 24 ENERGY EFFICIENCY STANDARDS AND CALIFORNIA GREEN BUILDING STANDARDS
CCR Title 24 Part 6: The California Energy Code was first adopted in 1978 in response to a legislative mandate to reduce California’s energy consumption.
The standards are updated periodically to allow consideration and possible incorporation of new energy efficient technologies and methods. CCR, Title 24, Part 11: California Green Building Standards Code (CALGreen) is a comprehensive and uniform regulatory code for all residential, commercial, and school buildings that went in effect on January 1, 2009, and is administered by the California Building Standards Commission.
CALGreen is updated on a regular basis, with the most recent approved update consisting of the 2019 California Green Building Code Standards that became effective January 1, 2020.
Local jurisdictions are permitted to adopt more stringent requirements, as state law provides methods for local enhancements. CALGreen recognizes that many jurisdictions have developed existing construction waste and demolition ordinances and defers to them as the ruling guidance provided they establish a minimum 65% diversion requirement.
The code also provides exemptions for areas not served by construction waste and demolition recycling infrastructure. The State Building Code provides the minimum standard that buildings must meet in order to be certified for occupancy, which is generally enforced by the local building official.
Energy efficient buildings require less electricity; therefore, increased energy efficiency reduces fossil fuel consumption and decreases greenhouse gas (GHG) emissions. The 2019 version of Title 24 was adopted by the California Energy Commission (CEC) and became effective on January 1, 2020.
The 2019 Title 24 standards will result in less energy use, thereby reducing air pollutant emissions associated with energy consumption in the SCAB and across the State of California. For example, the 2019 Title 24 standards require solar photovoltaic systems for new homes, establish requirements for newly constructed healthcare facilities, encourage demand responsive technologies for residential buildings, and update indoor and outdoor lighting requirements for nonresidential buildings.
Six Basins Strategic Plan Air Quality Impact Analysis
13854-02 AQ Report.pdf 25
The CEC anticipates that single-family homes built with the 2019 standards will use approximately 7% less energy compared to the residential homes built under the 2016 standards. Additionally, after implementation of solar photovoltaic systems, homes built under the 2019 standards will use about 53% less energy than homes built under the 2016 standards. Nonresidential buildings (such as the Project) will use approximately 30% less energy due to lighting upgrade requirements (18).
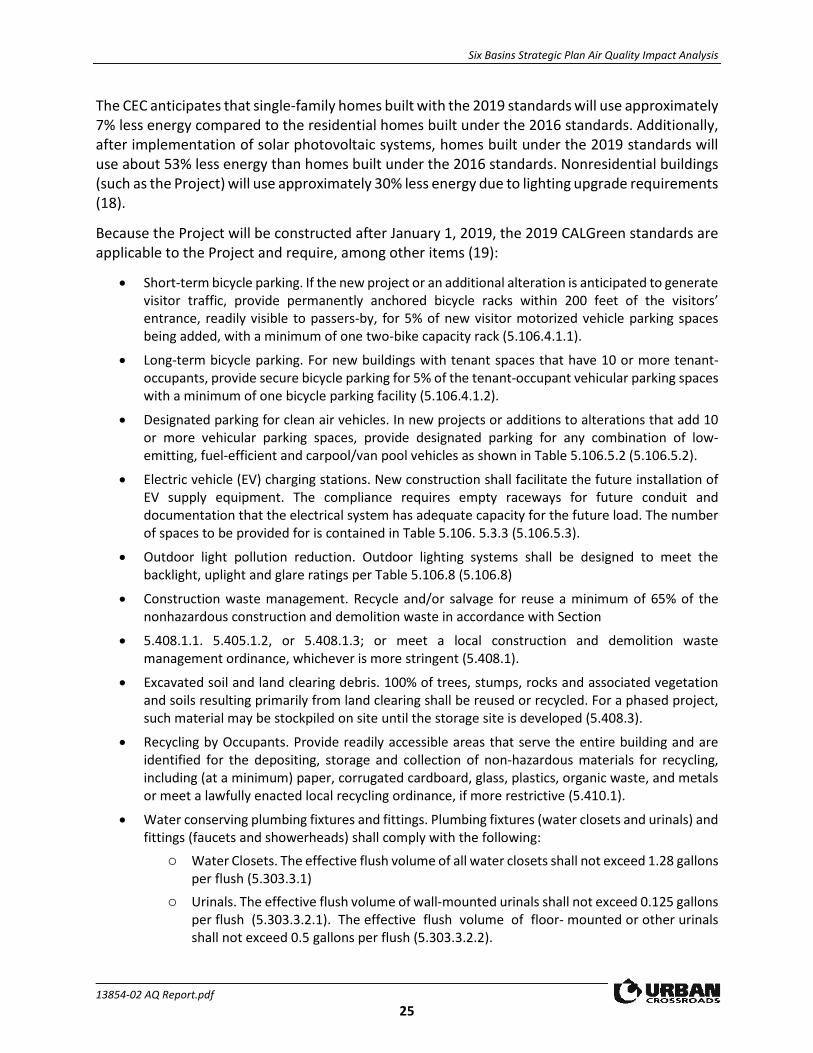
Because the Project will be constructed after January 1, 2019, the 2019 CALGreen standards are applicable to the Project and require, among other items (19):
• Short-term bicycle parking. If the new project or an additional alteration is anticipated to generate visitor traffic, provide permanently anchored bicycle racks within 200 feet of the visitors’ entrance, readily visible to passers-by, for 5% of new visitor motorized vehicle parking spaces being added, with a minimum of one two-bike capacity rack (5.106.4.1.1).
• Long-term bicycle parking. For new buildings with tenant spaces that have 10 or more tenant-occupants, provide secure bicycle parking for 5% of the tenant-occupant vehicular parking spaces with a minimum of one bicycle parking facility (5.106.4.1.2).
• Designated parking for clean air vehicles. In new projects or additions to alterations that add 10 or more vehicular parking spaces, provide designated parking for any combination of low-emitting, fuel-efficient and carpool/van pool vehicles as shown in Table 5.106.5.2 (5.106.5.2).
• Electric vehicle (EV) charging stations. New construction shall facilitate the future installation of EV supply equipment. The compliance requires empty raceways for future conduit and documentation that the electrical system has adequate capacity for the future load. The number of spaces to be provided for is contained in Table 5.106. 5.3.3 (5.106.5.3).
• Outdoor light pollution reduction. Outdoor lighting systems shall be designed to meet the backlight, uplight and glare ratings per Table 5.106.8 (5.106.8)
• Construction waste management. Recycle and/or salvage for reuse a minimum of 65% of the nonhazardous construction and demolition waste in accordance with Section
• 5.408.1.1. 5.405.1.2, or 5.408.1.3; or meet a local construction and demolition waste management ordinance, whichever is more stringent (5.408.1).
• Excavated soil and land clearing debris. 100% of trees, stumps, rocks and associated vegetation and soils resulting primarily from land clearing shall be reused or recycled. For a phased project, such material may be stockpiled on site until the storage site is developed (5.408.3).
• Recycling by Occupants. Provide readily accessible areas that serve the entire building and are identified for the depositing, storage and collection of non-hazardous materials for recycling, including (at a minimum) paper, corrugated cardboard, glass, plastics, organic waste, and metals or meet a lawfully enacted local recycling ordinance, if more restrictive (5.410.1).
• Water conserving plumbing fixtures and fittings. Plumbing fixtures (water closets and urinals) and fittings (faucets and showerheads) shall comply with the following:
o Water Closets. The effective flush volume of all water closets shall not exceed 1.28 gallons per flush (5.303.3.1)
o Urinals. The effective flush volume of wall-mounted urinals shall not exceed 0.125 gallons per flush (5.303.3.2.1). The effective flush volume of floor- mounted or other urinals shall not exceed 0.5 gallons per flush (5.303.3.2.2).

Six Basins Strategic Plan Air Quality Impact Analysis
13854-02 AQ Report.pdf 26
o Showerheads. Single showerheads shall have a minimum flow rate of not more than 1.8 gallons per minute and 80 psi (5.303.3.3.1). When a shower is served by more than one showerhead, the combine flow rate of all showerheads and/or other shower outlets controlled by a single valve shall not exceed 1.8 gallons per minute at 80 psi (5.303.3.3.2).
o Faucets and fountains. Nonresidential lavatory faucets shall have a maximum flow rate of not more than 0.5 gallons per minute at 60 psi (5.303.3.4.1). Kitchen faucets shall have a maximum flow rate of not more than 1.8 gallons per minute of 60 psi (5.303.3.4.2). Wash fountains shall have a maximum flow rate of not more than 1.8 gallons per minute (5.303.3.4.3). Metering faucets shall not deliver more than 0.20 gallons per cycle (5.303.3.4.4). Metering faucets for wash fountains shall have a maximum flow rate not more than 0.20 gallons per cycle (5.303.3.4.5).
• Outdoor portable water use in landscaped areas. Nonresidential developments shall comply with a local water efficient landscape ordinance or the current California Department of Water Resources’ Model Water Efficient (MWELO), whichever is more stringent (5.304.1).
• Water meters. Separate submeters or metering devices shall be installed for new buildings or additions in excess of 50,000 sf or for excess consumption where any tenant within a new building or within an addition that is project to consume more than 1,000 gallons per day (5.303.1.1 and 5.303.1.2).
• Outdoor water use in rehabilitated landscape projects equal or greater than 2,500 sf. Rehabilitated landscape projects with an aggregate landscape area equal to or greater than 2,500 sf requiring a building or landscape permit (5.304.3).
• Commissioning. For new buildings 10,000 sf and over, building commissioning shall be included in the design and construction processes of the building project to verify that the building systems and components meet the owner’s or owner representative’s project requirements (5.410.2).
2.8.3 AQMP
Currently, the NAAQS and CAAQS are exceeded in most parts of the SCAB. In response, the SCAQMD has adopted a series of AQMP to meet the state and federal ambient air quality standards (16). AQMPs are updated regularly in order to more effectively reduce emissions, accommodate growth, and to minimize any negative fiscal impacts of air pollution control on the economy. A detailed discussion on the AQMP and Project consistency with the AQMP is provided in Section 3.10.

Six Basins Strategic Plan Air Quality Impact Analysis
13854-02 AQ Report.pdf 27
This page intentionally left blank

Six Basins Strategic Plan Air Quality Impact Analysis
13854-02 AQ Report.pdf 28
3 PROJECT AIR QUALITY IMPACT
3.1 INTRODUCTION
This study quantifies air quality emissions generated by construction and operation of the Project and addresses whether the Project conflicts with implementation of the SCAQMD’s AQMP and Lead Agency planning regulations. The analysis of Project-generated air emissions determines whether the Project would result in a cumulatively considerable net increase of any criteria pollutant for which the SCAB is in non-attainment under an applicable NAAQS and CAAQS. Additionally, the Project has been evaluated to determine whether the Project would expose sensitive receptors to substantial pollutant concentrations and the impacts of odors. The significance of these potential impacts is described in the following sections.
3.2 STANDARDS OF SIGNIFICANCE
The criteria used to determine the significance of potential Project-related air quality impacts are taken from the CEQA Guidelines (14 CCR §§15000, et seq.). Based on these thresholds, a project would result in a significant impact related to air quality if it would (1):
• Conflict with or obstruct implementation of the applicable air quality plan.
• Result in a cumulatively considerable net increase of any criteria pollutant for which the project region is in non-attainment under an applicable federal or state ambient air quality standard.
• Expose sensitive receptors to substantial pollutant concentrations.
• Result in other emissions (such as those leading to odors) adversely affecting a substantial number of people.
The SCAQMD has also developed regional significance thresholds for other regulated pollutants, as summarized at Table 3-1 (17). The SCAQMD’s CEQA Air Quality Significance Thresholds (April 2019) indicate that any projects in the SCAB with daily emissions that exceed any of the indicated thresholds should be considered as having an individually and cumulatively significant air quality impact.
TABLE 3-1: MAXIMUM DAILY REGIONAL EMISSIONS THRESHOLDS
Pollutant Regional Construction Threshold Regional Operational Thresholds
NOX 100 lbs/day 55 lbs/day
VOC 75 lbs/day 55 lbs/day
PM10 150 lbs/day 150 lbs/day
PM2.5 55 lbs/day 55 lbs/day
SOX 150 lbs/day 150 lbs/day
CO 550 lbs/day 550 lbs/day
Pb 3 lbs/day 3 lbs/day lbs/day = Pounds Per Day
Six Basins Strategic Plan Air Quality Impact Analysis
13854-02 AQ Report.pdf 29
3.3 MODELS EMPLOYED TO ANALYZE AIR QUALITY
3.3.1 CALEEMOD
Land uses such as the Project affect air quality through construction-source and operational-source emissions.
On October 17, 2017, the SCAQMD in conjunction with the California Air Pollution Control Officers Association (CAPCOA) and other California air districts, released the latest version of the CalEEMod Version 2016.3.2. The purpose of this model is to calculate construction-source and operational-source criteria pollutant (VOCs, NOX, SOX, CO, PM10, and PM2.5) and GHG emissions from direct and indirect sources; and quantify applicable air quality and GHG reductions achieved from MMs (18). Accordingly, the latest version of CalEEMod has been used for this Project to determine construction air quality emissions. Output from the model runs for construction activity are provided in Appendices 3.1 through 3.2.
3.4 CONSTRUCTION EMISSIONS
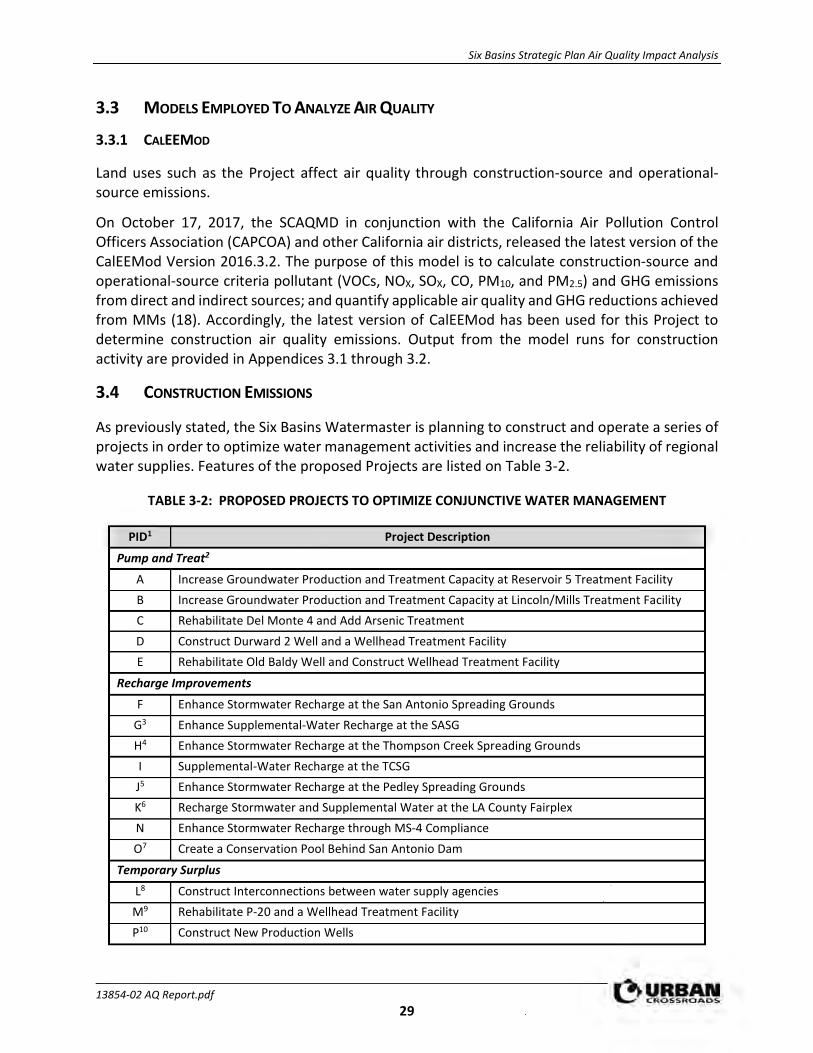
As previously stated, the Six Basins Watermaster is planning to construct and operate a series of projects in order to optimize water management activities and increase the reliability of regional water supplies. Features of the proposed Projects are listed on Table 3-2.
TABLE 3-2: PROPOSED PROJECTS TO OPTIMIZE CONJUNCTIVE WATER MANAGEMENT
PID1 Project Description
Pump and Treat2
A Increase Groundwater Production and Treatment Capacity at Reservoir 5 Treatment Facility B Increase Groundwater Production and Treatment Capacity at Lincoln/Mills Treatment Facility C Rehabilitate Del Monte 4 and Add Arsenic Treatment D Construct Durward 2 Well and a Wellhead Treatment Facility E Rehabilitate Old Baldy Well and Construct Wellhead Treatment Facility
Recharge Improvements
F Enhance Stormwater Recharge at the San Antonio Spreading Grounds G3 Enhance Supplemental-Water Recharge at the SASG H4 Enhance Stormwater Recharge at the Thompson Creek Spreading Grounds I Supplemental-Water Recharge at the TCSG J5 Enhance Stormwater Recharge at the Pedley Spreading Grounds K6 Recharge Stormwater and Supplemental Water at the LA County Fairplex N Enhance Stormwater Recharge through MS-4 Compliance O7 Create a Conservation Pool Behind San Antonio Dam
Temporary Surplus
L8 Construct Interconnections between water supply agencies M9 Rehabilitate P-20 and a Wellhead Treatment Facility P10 Construct New Production Wells

Six Basins Strategic Plan Air Quality Impact Analysis
13854-02 AQ Report.pdf 30
Because few details are known at this time regarding construction of specific projects, it is assumed that construction any Project feature listed on Table 1-1 may occur simultaneously. As a conservative measure, and in order to identify the maximum daily emissions, this AQIA assumes that the Project would construct the following features simultaneously:
• One new treatment facility;
• 8,500 linear feet conveyance pipeline;
• San Antonio Spreading Grounds.
3.4.1 CONSTRUCTION DURATION
During construction activities associated with individual projects, emissions of VOCs, NOX, SOX, CO, PM10, and PM2.5 will likely be released through the burning of fossil fuel in construction equipment, grading fugitive dust, asphalt paving, and the application of architectural coatings during painting activity. As previously stated, individual project-specific details are currently unknown. As such, and for purposes of analysis, construction of the above features is expected to commence in August 2021 and will last through September 2022. Construction duration utilized in the analysis represents a “worst-case” analysis scenario should construction occur any time after the respective dates since emission factors for construction decrease as the analysis year increases.
3.4.2 CONSTRUCTION EQUIPMENT
Associated equipment was based on information provided by the Project applicant. Please refer to specific detailed modeling inputs/outputs contained in Appendix 3.1 of this AQIA. A detailed summary of construction equipment is provided at Table 3-3.
TABLE 3-3: CONSTRUCTION EQUIPMENT ASSUMPTIONS
Equipment Amount Hours Per Day
Bore/Drill Rigs 1 6
Cranes 1 6
Crushing/Proc. Equipment 1 6
Excavators 2 6
Generator Sets 1 6
Graders 1 6
Off-Highway Trucks 1 4
Pavers 2 6
Paving Equipment 1 6
Rollers 1 6
Rubber Tired Dozers 1 6
Tractors/Loaders/Backhoes 2 6
Welders 1 6 Source: Construction equipment based on information provided by the Project Applicant.
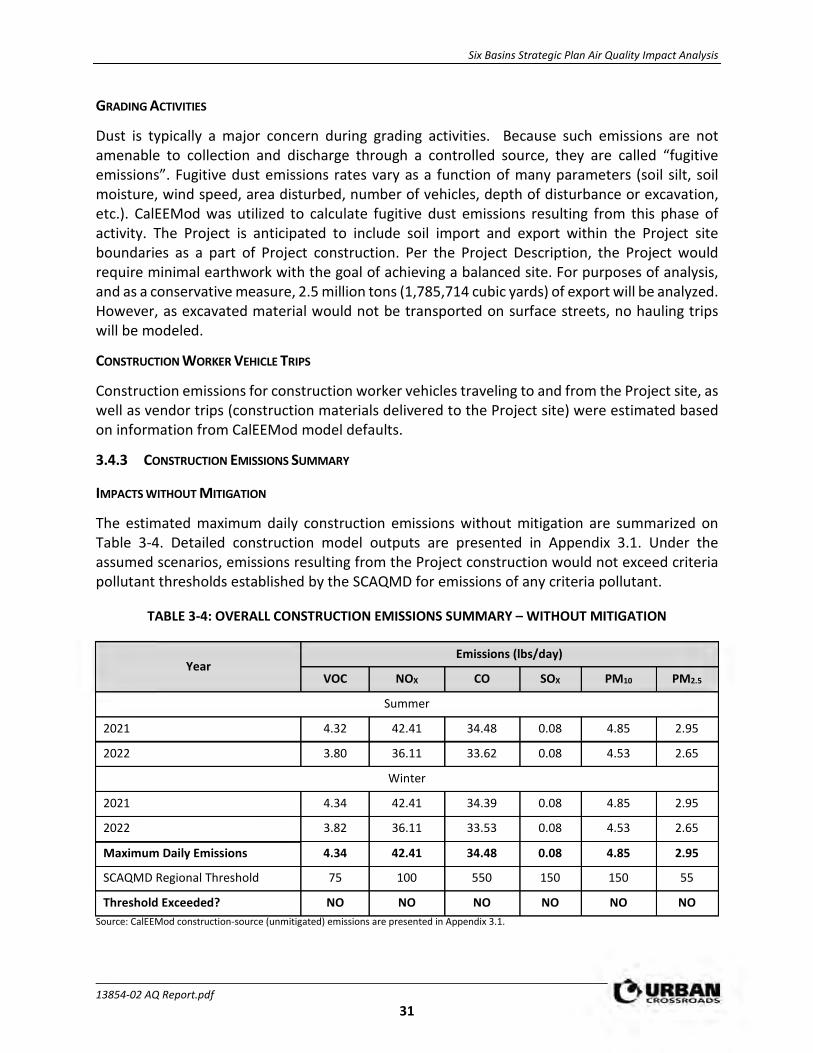
Six Basins Strategic Plan Air Quality Impact Analysis
13854-02 AQ Report.pdf 31
GRADING ACTIVITIES
Dust is typically a major concern during grading activities. Because such emissions are not amenable to collection and discharge through a controlled source, they are called “fugitive emissions”. Fugitive dust emissions rates vary as a function of many parameters (soil silt, soil moisture, wind speed, area disturbed, number of vehicles, depth of disturbance or excavation, etc.). CalEEMod was utilized to calculate fugitive dust emissions resulting from this phase of activity. The Project is anticipated to include soil import and export within the Project site boundaries as a part of Project construction. Per the Project Description, the Project would require minimal earthwork with the goal of achieving a balanced site. For purposes of analysis, and as a conservative measure, 2.5 million tons (1,785,714 cubic yards) of export will be analyzed. However, as excavated material would not be transported on surface streets, no hauling trips will be modeled.
CONSTRUCTION WORKER VEHICLE TRIPS
Construction emissions for construction worker vehicles traveling to and from the Project site, as well as vendor trips (construction materials delivered to the Project site) were estimated based on information from CalEEMod model defaults.
3.4.3 CONSTRUCTION EMISSIONS SUMMARY
IMPACTS WITHOUT MITIGATION
The estimated maximum daily construction emissions without mitigation are summarized on Table 3-4. Detailed construction model outputs are presented in Appendix 3.1. Under the assumed scenarios, emissions resulting from the Project construction would not exceed criteria pollutant thresholds established by the SCAQMD for emissions of any criteria pollutant.
TABLE 3-4: OVERALL CONSTRUCTION EMISSIONS SUMMARY – WITHOUT MITIGATION
Year Emissions (lbs/day)
VOC NOX CO SOX PM10 PM2.5
Summer
2021 4.32 42.41 34.48 0.08 4.85 2.95
2022 3.80 36.11 33.62 0.08 4.53 2.65
Winter
2021 4.34 42.41 34.39 0.08 4.85 2.95
2022 3.82 36.11 33.53 0.08 4.53 2.65
Maximum Daily Emissions 4.34 42.41 34.48 0.08 4.85 2.95
SCAQMD Regional Threshold 75 100 550 150 150 55
Threshold Exceeded? NO NO NO NO NO NO Source: CalEEMod construction-source (unmitigated) emissions are presented in Appendix 3.1.
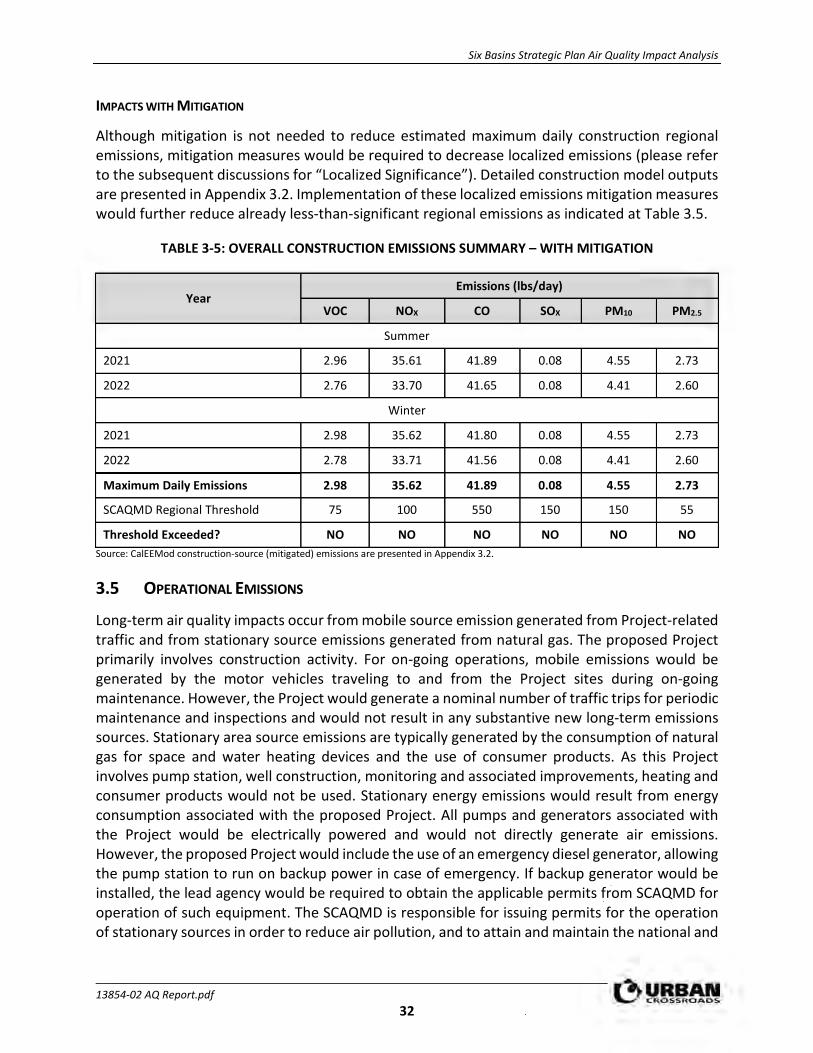
Six Basins Strategic Plan Air Quality Impact Analysis
13854-02 AQ Report.pdf 32
IMPACTS WITH MITIGATION
Although mitigation is not needed to reduce estimated maximum daily construction regional emissions, mitigation measures would be required to decrease localized emissions (please refer to the subsequent discussions for “Localized Significance”). Detailed construction model outputs are presented in Appendix 3.2. Implementation of these localized emissions mitigation measures would further reduce already less-than-significant regional emissions as indicated at Table 3.5.
TABLE 3-5: OVERALL CONSTRUCTION EMISSIONS SUMMARY – WITH MITIGATION
Year Emissions (lbs/day)
VOC NOX CO SOX PM10 PM2.5
Summer
2021 2.96 35.61 41.89 0.08 4.55 2.73
2022 2.76 33.70 41.65 0.08 4.41 2.60
Winter
2021 2.98 35.62 41.80 0.08 4.55 2.73
2022 2.78 33.71 41.56 0.08 4.41 2.60
Maximum Daily Emissions 2.98 35.62 41.89 0.08 4.55 2.73
SCAQMD Regional Threshold 75 100 550 150 150 55
Threshold Exceeded? NO NO NO NO NO NO Source: CalEEMod construction-source (mitigated) emissions are presented in Appendix 3.2.
3.5 OPERATIONAL EMISSIONS
Long-term air quality impacts occur from mobile source emission generated from Project-related traffic and from stationary source emissions generated from natural gas. The proposed Project primarily involves construction activity. For on-going operations, mobile emissions would be generated by the motor vehicles traveling to and from the Project sites during on-going maintenance. However, the Project would generate a nominal number of traffic trips for periodic maintenance and inspections and would not result in any substantive new long-term emissions sources. Stationary area source emissions are typically generated by the consumption of natural gas for space and water heating devices and the use of consumer products. As this Project involves pump station, well construction, monitoring and associated improvements, heating and consumer products would not be used. Stationary energy emissions would result from energy consumption associated with the proposed Project. All pumps and generators associated with the Project would be electrically powered and would not directly generate air emissions. However, the proposed Project would include the use of an emergency diesel generator, allowing the pump station to run on backup power in case of emergency. If backup generator would be installed, the lead agency would be required to obtain the applicable permits from SCAQMD for operation of such equipment. The SCAQMD is responsible for issuing permits for the operation of stationary sources in order to reduce air pollution, and to attain and maintain the national and
Six Basins Strategic Plan Air Quality Impact Analysis
13854-02 AQ Report.pdf 33
California ambient air quality standards in the SCAB. The Project would not result in a cumulatively considerable net increase of any criteria pollutant for which the Project region is non-attainment. Backup generators would be used only in emergency situations and for routine testing and maintenance purposes and would not contribute a substantial amount of emissions capable of exceeding SCAQMD thresholds. As Project operations would not exceed SCAQMD thresholds, the Project would not violate an air quality standard or contribute to an existing violation. Therefore, Project operations would not result in a cumulatively considerable net increase of any criteria pollutant and impacts would be less than significant.
3.6 LOCALIZED SIGNIFICANCE
BACKGROUND ON LOCALIZED SIGNIFICANCE THRESHOLD (LST) DEVELOPMENT
The analysis makes use of methodology included in the SCAQMD Final Localized Significance Threshold Methodology (LST Methodology). The SCAQMD has established that impacts to air quality are significant if there is a potential to contribute or cause localized exceedances of the federal and/or state ambient air quality standards (NAAQS/CAAQS). Collectively, these are referred to as Localized Significance Thresholds (LSTs).
The SCAQMD established LSTs in response to the SCAQMD Governing Board’s Environmental Justice Initiative I-42. LSTs represent the maximum emissions from a project that would not cause or contribute to an exceedance of the most stringent applicable federal or state ambient air quality standard at the nearest residence or sensitive receptor. The SCAQMD states that lead agencies can use the LSTs as another indicator of significance in its air quality impact analyses.
LSTs were developed in response to environmental justice and health concerns raised by the public regarding exposure of individuals to criteria pollutants in local communities. To address the issue of localized significance, the SCAQMD adopted LSTs that show whether a project would cause or contribute to localized air quality impacts and thereby cause or contribute to potential localized adverse health effects. The analysis makes use of methodology included in the LST Methodology (19).
APPLICABILITY OF LSTS FOR THE PROJECT
LSTs apply to CO, NO2, PM10, and PM2.5. The SCAQMD produced look-up tables for projects less than or equal to 5 acres in size.
In order to determine the appropriate methodology for determining localized impacts that could occur as a result of Project-related construction, the following process is undertaken:
• Identify the maximum daily on-site emissions that will occur during construction activity:
2 The purpose of SCAQMD’s Environmental Justice program is to ensure that everyone has the right to equal protection from air pollution and fair access to the decision-making process that works to improve the quality of air within their communities. Further, the SCAQMD defines Environmental Justice as “…equitable environmental policymaking and enforcement to protect the health of all residents, regardless of age, culture, ethnicity, gender, race, socioeconomic status, or geographic location, from the health effects of air pollution.”
Six Basins Strategic Plan Air Quality Impact Analysis
13854-02 AQ Report.pdf 34
o The maximum daily on-site emissions could be based on information provided by the Project Applicant; or
o The SCAQMD’s Fact Sheet for Applying CalEEMod to Localized Significance Thresholds and CalEEMod User’s Guide Appendix A: Calculation Details for CalEEMod can be used to determine the maximum site acreage that is actively disturbed based on the construction equipment fleet and equipment hours as estimated in CalEEMod (20) (21).
• If the total acreage disturbed is less than or equal to 5 acres per day, then the SCAQMD’s screening look-up tables are utilized to determine if a Project has the potential to result in a significant impact. The look-up tables establish a maximum daily emissions threshold in lbs/day that can be compared to CalEEMod outputs.
• If the total acreage disturbed is greater than 5 acres per day, then LST impacts may still be conservatively evaluated using the LST look-up tables for a 5-acre disturbance area. Use of the 5-acre disturbance area thresholds can be used to show that even if the daily emissions from all construction activity were emitted within a 5-acre area, and therefore concentrated over a smaller area which would result in greater site adjacent concentrations, the impacts would still be less than significant if the applicable 5-acre thresholds are utilized.
• The LST methodology presents mass emission rates for each SRA, project sizes of 1, 2, and 5 acres, and nearest receptor distances of 25, 50, 100, 200, and 500 meters. For project sizes between the values given, or with receptors at distances between the given receptors, the methodology uses linear interpolation to determine the thresholds.
EMISSIONS CONSIDERED
Based on SCAQMD’s LST Methodology, emissions for concern during construction activities are on-site NOX, CO, PM2.5, and PM10. The LST Methodology clearly states that “off-site mobile emissions from the Project should not be included in the emissions compared to LSTs (22).” As such, for purposes of the construction LST analysis, only emissions included in the CalEEMod “on-site” emissions outputs were considered.
MAXIMUM DAILY DISTURBED-ACREAGE
Based on information provided in the Project Description, the average disturbance of the site on a daily basis is assumed to be 1 acre. In CalEEMod, the Total Acres Graded (TAG) field represents the cumulative distance traversed on the property by the grading equipment. In order to properly grade a piece of land, multiple passes with grading equipment may be required. So even though the lot size is a fixed number of acres, the TAG could be an order of magnitude higher than the footprint of the lot (21). Total Acres Graded (TAG) is a function of the maximum acreage disturbed per day times the number of days of the subphase of construction. As such, the TAG field in CalEEMod has been revised to 365 acres (1 acres per day x 365 days).
RECEPTORS
As previously stated, LSTs represent the maximum emissions from a project that would not cause or contribute to an exceedance of the most stringent applicable NAAQS and CAAQS at the nearest residence or sensitive receptor. Receptor locations are off-site locations where individuals may be exposed to emissions from Project activities.

Six Basins Strategic Plan Air Quality Impact Analysis
13854-02 AQ Report.pdf 35
Some people are especially sensitive to air pollution and are given special consideration when evaluating air quality impacts from projects. These groups of people include children, the elderly and individuals with pre-existing respiratory or cardiovascular illness. Structures that house these persons or places where they gather are defined as “sensitive receptors”. These structures typically include uses such as residences, hotels, and hospitals where an individual can remain for 24 hours. Consistent with the LST Methodology, the nearest land use where an individual could remain for 24 hours to the Project site (in this case the West Valley Detention Center) has been used to determine construction and operational air quality impacts for emissions of PM10 and PM2.5, since PM10 and PM2.5 thresholds are based on a 24-hour averaging time.
LSTs apply, even for non-sensitive land uses, consistent with LST Methodology and SCAQMD guidance. Per the LST Methodology, commercial and industrial facilities are not included in the definition of sensitive receptor because employees and patrons do not typically remain onsite for a full 24 hours but are typically onsite for 8 hours or less. However, LST Methodology explicitly states that “LSTs based on shorter averaging periods, such as the NO2 and CO LSTs, could also be applied to receptors such as industrial or commercial facilities since it is reasonable to assume that a worker at these sites could be present for periods of one to eight hours (22).” Therefore, any adjacent land use where an individual could remain for 1 or 8-hours, that is located at a closer distance to the Project site than the receptor used for PM10 and PM2.5 analysis, must be considered to determine construction and operational LST air impacts for emissions of NO2 and CO since these pollutants have an averaging time of 1 and 8-hours.
PROJECT-RELATED RECEPTORS
The SCAQMD recommends that the nearest sensitive receptor be considered when determining the Project’s potential to cause an individual and cumulatively significant impact.
The nearest residential receptor could potentially be located immediately adjacent to construction activities. It should be noted that the LST Methodology also explicitly states that “It is possible that a project may have receptors closer than 25 meters. Projects with boundaries located closer than 25 meters to the nearest receptor should use the LSTs for receptors located at 25 meters (23).” Consistent with the SCAQMD’s LST Methodology, a 25-meter receptor distance is utilized in this analysis and provide for a conservative i.e. “health protective” standard of care.
3.7 CONSTRUCTION-SOURCE EMISSIONS LST ANALYSIS
3.7.1 LOCALIZED THRESHOLDS FOR CONSTRUCTION ACTIVITY
The SCAQMD’s screening look-up tables are utilized in determining impacts. It should be noted that since the look-up tables identifies thresholds at only 1 acre, 2 acres, and 5 acres, linear regression has been utilized, consistent with SCAQMD guidance, in order to interpolate the threshold values for the other disturbed acreage and distances not identified in the look-up tables. As previously stated, proposed Project could actively disturb approximately 1 acre per day.
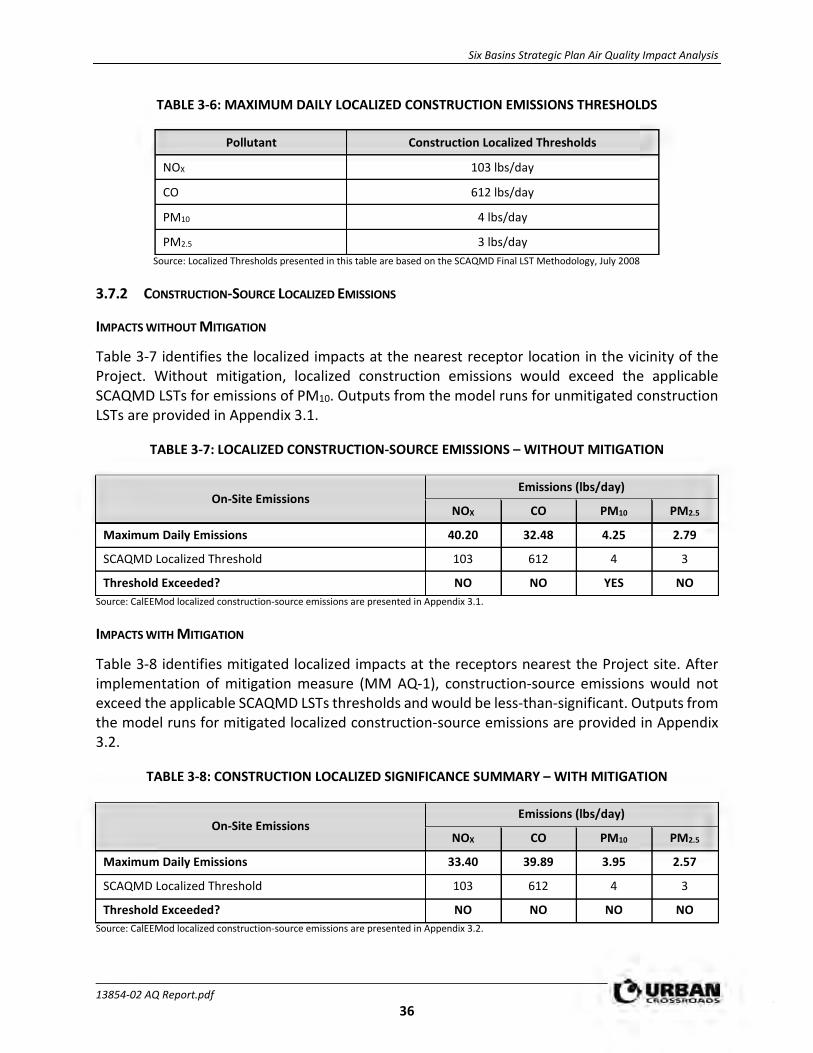
Six Basins Strategic Plan Air Quality Impact Analysis
13854-02 AQ Report.pdf 36
TABLE 3-6: MAXIMUM DAILY LOCALIZED CONSTRUCTION EMISSIONS THRESHOLDS
Pollutant Construction Localized Thresholds
NOX 103 lbs/day
CO 612 lbs/day
PM10 4 lbs/day
PM2.5 3 lbs/day Source: Localized Thresholds presented in this table are based on the SCAQMD Final LST Methodology, July 2008
3.7.2 CONSTRUCTION-SOURCE LOCALIZED EMISSIONS
IMPACTS WITHOUT MITIGATION
Table 3-7 identifies the localized impacts at the nearest receptor location in the vicinity of the Project. Without mitigation, localized construction emissions would exceed the applicable SCAQMD LSTs for emissions of PM10. Outputs from the model runs for unmitigated construction LSTs are provided in Appendix 3.1.
TABLE 3-7: LOCALIZED CONSTRUCTION-SOURCE EMISSIONS – WITHOUT MITIGATION
On-Site Emissions Emissions (lbs/day)
NOX CO PM10 PM2.5
Maximum Daily Emissions 40.20 32.48 4.25 2.79
SCAQMD Localized Threshold 103 612 4 3
Threshold Exceeded? NO NO YES NO Source: CalEEMod localized construction-source emissions are presented in Appendix 3.1.
IMPACTS WITH MITIGATION
Table 3-8 identifies mitigated localized impacts at the receptors nearest the Project site. After implementation of mitigation measure (MM AQ-1), construction-source emissions would not exceed the applicable SCAQMD LSTs thresholds and would be less-than-significant. Outputs from the model runs for mitigated localized construction-source emissions are provided in Appendix 3.2.
TABLE 3-8: CONSTRUCTION LOCALIZED SIGNIFICANCE SUMMARY – WITH MITIGATION
On-Site Emissions Emissions (lbs/day)
NOX CO PM10 PM2.5
Maximum Daily Emissions 33.40 39.89 3.95 2.57
SCAQMD Localized Threshold 103 612 4 3
Threshold Exceeded? NO NO NO NO Source: CalEEMod localized construction-source emissions are presented in Appendix 3.2.
Six Basins Strategic Plan Air Quality Impact Analysis
13854-02 AQ Report.pdf 37
3.8 OPERATIONAL-SOURCE EMISSIONS LST ANALYSIS
According to SCAQMD localized significance threshold methodology, LSTs would apply to the operational phase of a proposed project if the project includes stationary sources or attracts mobile sources that may spend extended periods queuing and idling at the site (e.g., warehouse or transfer facilities). As previously discussed, the project would generate a nominal number of traffic trips in the context of on-going maintenance resulting in a negligible amount of new mobile source emissions. Additionally, all pumps associated with the project are assumed to be electrically powered and would not directly generate air emissions. However, the proposed project may include the use of an emergency diesel generators, allowing pump stations to run on backup power in case of emergency. If backup generator would be installed, the lead agency would be required to obtain the applicable permits from SCAQMD for operation of such equipment. The SCAQMD is responsible for issuing permits for the operation of stationary sources in order to reduce air pollution, and to attain and maintain the national and California ambient air quality standards in the SCAB. Upon compliance with SCAQMD permitting procedures, localized emissions from any potential diesel generator would not result in substantial pollutant concentrations capable of exceeding operational LST thresholds. Therefore, the Project would not expose sensitive receptors to substantial pollutant concentrations and impacts would be less than significant.
3.9 CO “HOT SPOT” ANALYSIS
As discussed below, the Project would not result in potentially adverse CO concentrations or “hot spots.” Further, detailed modeling of Project-specific CO “hot spots” is not needed to reach this conclusion. An adverse CO concentration, known as a “hot spot”, would occur if an exceedance of the state one-hour standard of 20 ppm or the eight-hour standard of 9 ppm were to occur. At the time of the SCAQMD’s CEQA Air Quality Handbook (1993) (1993 CEQA Handbook), the SCAB was designated nonattainment under the CAAQS and NAAQS for CO (24).
It has long been recognized that CO hotspots are caused by vehicular emissions, primarily when idling at congested intersections. In response, vehicle emissions standards have become increasingly stringent in the last twenty years. Currently, the allowable CO emissions standard in California is a maximum of 3.4 grams/mile for passenger cars (there are requirements for certain vehicles that are more stringent). With the turnover of older vehicles, introduction of cleaner fuels, and implementation of increasingly sophisticated and efficient emissions control technologies, CO concentration in the SCAB is now designated as attainment.
To establish a more accurate record of baseline CO concentrations affecting the SCAB, a CO “hot spot” analysis was conducted in 2003 for four busy intersections in Los Angeles at the peak morning and afternoon time periods. This “hot spot” analysis did not predict any violation of CO standards, as shown on Table 3-9.

Six Basins Strategic Plan Air Quality Impact Analysis
13854-02 AQ Report.pdf 38
TABLE 3-9: CO MODEL RESULTS
Intersection Location CO Concentrations (ppm)
Morning 1-hour Afternoon 1-hour 8-hour
Wilshire Boulevard/Veteran Avenue 4.6 3.5 3.7
Sunset Boulevard/Highland Avenue 4 4.5 3.5
La Cienega Boulevard/Century Boulevard 3.7 3.1 5.2
Long Beach Boulevard/Imperial Highway 3 3.1 8.4 Source: 2003 AQMP, Appendix V: Modeling and Attainment Demonstrations Notes: Federal 1-hour standard is 35 ppm and the deferral 8-hour standard is 9.0 ppm.
Based on the SCAQMD's 2003 AQMP and the 1992 Federal Attainment Plan for Carbon Monoxide (1992 CO Plan), peak carbon monoxide concentrations in the SCAB were a result of unusual meteorological and topographical conditions and not a result of traffic volumes and congestion at a particular intersection. As evidence of this, for example, 9.3 ppm 8-hr CO concentration measured at the Long Beach Blvd. and Imperial Hwy. intersection (highest CO generating intersection within the “hot spot” analysis), only 0.7 ppm was attributable to the traffic volumes and congestion at this intersection; the remaining 8.6 ppm were due to the ambient air measurements at the time the 2003 AQMP was prepared (25). In contrast, an adverse CO concentration, known as a “hot spot”, would occur if an exceedance of the state one-hour standard of 20 parts per million (ppm) or the eight-hour standard of 9 ppm were to occur. The ambient 1-hr and 8-hr CO concentration within the Project study area is estimated to be 4.7 ppm and 3.5 ppm, respectively (data from South Central Los Angeles County Monitoring Station for 2018). Therefore, even if the traffic volumes for the proposed Project were double or even triple of the traffic volumes generated at the Long Beach Blvd. and Imperial Hwy. intersection, coupled with the on-going improvements in ambient air quality, the Project would not be capable of resulting in a CO “hot spot” at any study area intersections.
Similar considerations are also employed by other Air Districts when evaluating potential CO concentration impacts. More specifically, the Bay Area Air Quality Management District (BAAQMD) concludes that under existing and future vehicle emission rates, a given project would have to increase traffic volumes at a single intersection by more than 44,000 vehicles per hour (vph)—or 24,000 vph where vertical and/or horizontal air does not mix—in order to generate a significant CO impact (26). Traffic volumes generating the CO concentrations for the “hot spot” analysis is shown on Table 3-10. The busiest intersection evaluated was that at Wilshire Blvd and Veteran Ave., which has a daily traffic volume of approximately 100,000 vph and AM/PM traffic volumes of 8,062 vph and 7,719 vph respectively (27). The 2003 AQMP estimated that the 1-hour concentration for this intersection was 4.6 ppm; this indicates that, should the daily traffic volume increase four times to 400,000 vehicles per day, CO concentrations (4.6 ppm x 4= 18.4 ppm) would still not likely exceed the most stringent 1-hour CO standard (20.0 ppm)3. At buildout of the Project, the highest daily traffic volumes generated at the roadways within the vicinity of the Project are expected to generate less than the highest daily traffic volumes generated at the
3 Based on the ratio of the CO standard (20.0 ppm) and the modeled value (4.6 ppm)
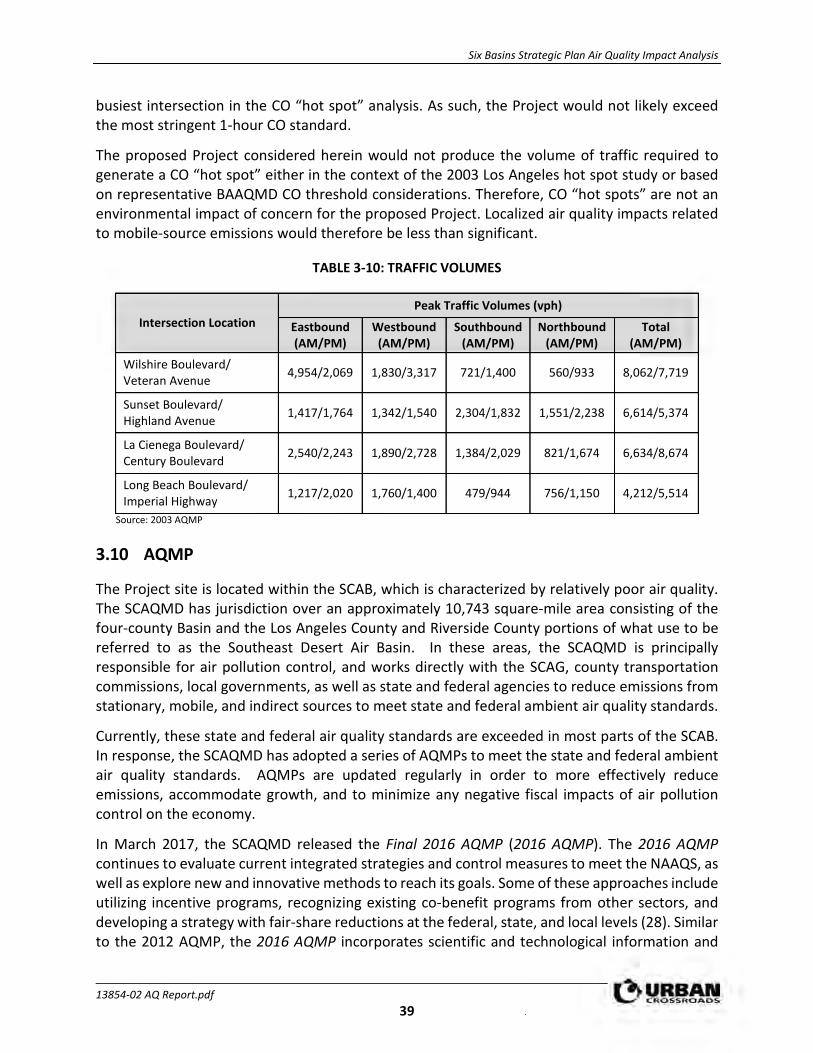
Six Basins Strategic Plan Air Quality Impact Analysis
13854-02 AQ Report.pdf 39
busiest intersection in the CO “hot spot” analysis. As such, the Project would not likely exceed the most stringent 1-hour CO standard.
The proposed Project considered herein would not produce the volume of traffic required to generate a CO “hot spot” either in the context of the 2003 Los Angeles hot spot study or based on representative BAAQMD CO threshold considerations. Therefore, CO “hot spots” are not an environmental impact of concern for the proposed Project. Localized air quality impacts related to mobile-source emissions would therefore be less than significant.
TABLE 3-10: TRAFFIC VOLUMES
Intersection Location Peak Traffic Volumes (vph)
Eastbound (AM/PM)
Westbound (AM/PM)
Southbound (AM/PM)
Northbound (AM/PM)
Total (AM/PM)
Wilshire Boulevard/ Veteran Avenue 4,954/2,069 1,830/3,317 721/1,400 560/933 8,062/7,719
Sunset Boulevard/ Highland Avenue 1,417/1,764 1,342/1,540 2,304/1,832 1,551/2,238 6,614/5,374
La Cienega Boulevard/ Century Boulevard 2,540/2,243 1,890/2,728 1,384/2,029 821/1,674 6,634/8,674
Long Beach Boulevard/ Imperial Highway 1,217/2,020 1,760/1,400 479/944 756/1,150 4,212/5,514
Source: 2003 AQMP
3.10 AQMP
The Project site is located within the SCAB, which is characterized by relatively poor air quality. The SCAQMD has jurisdiction over an approximately 10,743 square-mile area consisting of the four-county Basin and the Los Angeles County and Riverside County portions of what use to be referred to as the Southeast Desert Air Basin. In these areas, the SCAQMD is principally responsible for air pollution control, and works directly with the SCAG, county transportation commissions, local governments, as well as state and federal agencies to reduce emissions from stationary, mobile, and indirect sources to meet state and federal ambient air quality standards.
Currently, these state and federal air quality standards are exceeded in most parts of the SCAB. In response, the SCAQMD has adopted a series of AQMPs to meet the state and federal ambient air quality standards. AQMPs are updated regularly in order to more effectively reduce emissions, accommodate growth, and to minimize any negative fiscal impacts of air pollution control on the economy.
In March 2017, the SCAQMD released the Final 2016 AQMP (2016 AQMP). The 2016 AQMP continues to evaluate current integrated strategies and control measures to meet the NAAQS, as well as explore new and innovative methods to reach its goals. Some of these approaches include utilizing incentive programs, recognizing existing co-benefit programs from other sectors, and developing a strategy with fair-share reductions at the federal, state, and local levels (28). Similar to the 2012 AQMP, the 2016 AQMP incorporates scientific and technological information and

Six Basins Strategic Plan Air Quality Impact Analysis
13854-02 AQ Report.pdf 40
planning assumptions, including the 2016-2040 Regional Transportation Plan/Sustainable Communities Strategy (2016-2040 RTP/SCS), a planning document that supports the integration of land use and transportation to help the region meet the federal CAA requirements (16). The Project’s consistency with the AQMP will be determined using the 2016 AQMP as discussed below.
Criteria for determining consistency with the AQMP are defined in Chapter 12, Section 12.2 and Section 12.3 of the 1993 CEQA Handbook (29). These indicators are discussed below:
3.10.1 CONSISTENCY CRITERION NO. 1
The proposed Project will not result in an increase in the frequency or severity of existing air quality violations or cause or contribute to new violations or delay the timely attainment of air quality standards or the interim emissions reductions specified in the AQMP.
The violations that Consistency Criterion No. 1 refers to are the CAAQS and NAAQS. CAAQS and NAAQS violations would occur if regional or localized significance thresholds were exceeded.
Construction Impacts – Consistency Criterion 1
The violations that Consistency Criterion No. 1 refers to are the CAAQS and NAAQS. CAAQS and NAAQS violations would occur if localized or regional significance thresholds were exceeded. The Project would not exceed the applicable LST thresholds or regional significance thresholds for construction activity after implementation of applicable mitigation measures. Therefore, the Project would not conflict with the AQMP according to this criterion.
On the basis of the preceding discussion, the Project would not conflict with the AQMP according to this criterion.
3.10.2 CONSISTENCY CRITERION NO. 2
The Project will not exceed the assumptions in the AQMP based on the years of Project build-out phase.
The 2016 AQMP demonstrates that the applicable ambient air quality standards can be achieved within the timeframes required under federal law. Growth projections from local general plans adopted by cities in the district are provided to the SCAG, which develops regional growth forecasts, which are then used to develop future air quality forecasts for the AQMP. Development consistent with the growth projections in Six Basins Watermaster General Plan is considered to be consistent with the AQMP.
Construction Impacts – Consistency Criterion 2
Peak day emissions generated by construction activities are largely independent of land use assignments, but rather are a function of development scope and maximum area of disturbance. Irrespective of the site’s land use designation, development of the site to its maximum potential would likely occur, with disturbance of the entire site occurring during construction activities. As such, when considering that no emissions thresholds will be exceeded, a less than significant impact would result.
Six Basins Strategic Plan Air Quality Impact Analysis
13854-02 AQ Report.pdf 41
AQMP CONSISTENCY CONCLUSION
The Project would not result in or cause NAAQS or CAAQS violations. The Project’s does not propose a land use development but rather involves pump station, well construction, monitoring and associated improvements. The Project is therefore considered to be consistent with the AQMP.
3.11 POTENTIAL IMPACTS TO SENSITIVE RECEPTORS
The potential impact of Project-generated air pollutant emissions at sensitive receptors has also been considered. Sensitive receptors can include uses such as long-term health care facilities, rehabilitation centers, and retirement homes. Residences, schools, playgrounds, childcare centers, and athletic facilities can also be considered as sensitive receptors.
Results of the LST analysis indicate that, the Project would not exceed the SCAQMD localized significance thresholds during construction. Therefore, sensitive receptors would not be exposed to substantial pollutant concentrations during Project construction.
Results of the LST analysis indicate that the Project would not exceed the SCAQMD localized significance thresholds during construction activity. Further Project traffic would not create or result in a CO “hotspot.” Therefore, sensitive receptors would not be exposed to substantial pollutant concentrations as the result of Project construction.
3.12 ODORS
The potential for the Project to generate objectionable odors has also been considered. Land uses generally associated with odor complaints include:
• Agricultural uses (livestock and farming)
• Wastewater treatment plants
• Food processing plants
• Chemical plants
• Composting operations
• Refineries
• Landfills
• Dairies
• Fiberglass molding facilities
The Project does not contain land uses typically associated with emitting objectionable odors. Potential odor sources associated with the proposed Project may result from construction equipment exhaust and the application of asphalt and architectural coatings during construction activities and the temporary storage of typical solid waste (refuse) associated with the proposed Project’s (long-term operational) uses. Standard construction requirements would minimize odor impacts from construction. The construction odor emissions would be temporary, short-term, and intermittent in nature and would cease upon completion of the respective phase of
Six Basins Strategic Plan Air Quality Impact Analysis
13854-02 AQ Report.pdf 42
construction and is thus considered less than significant. It is expected that Project-generated refuse would be stored in covered containers and removed at regular intervals in compliance with the solid waste regulations. The proposed Project would also be required to comply with SCAQMD Rule 402 to prevent occurrences of public nuisances. Therefore, odors associated with the proposed Project construction and operations would be less than significant and no mitigation is required (30).
3.13 CUMULATIVE IMPACTS
As previously shown in Table 2-3, the CAAQS designate the Project site as nonattainment for O3 PM10, and PM2.5 while the NAAQS designates the Project site as nonattainment for O3 and PM2.5.
The SCAQMD has published a report on how to address cumulative impacts from air pollution: White Paper on Potential Control Strategies to Address Cumulative Impacts from Air Pollution (31). In this report the SCAQMD clearly states (Page D-3):
“…the SCAQMD uses the same significance thresholds for project specific and cumulative impacts for all environmental topics analyzed in an Environmental Assessment or EIR. The only case where the significance thresholds for project specific and cumulative impacts differ is the Hazard Index (HI) significance threshold for TAC emissions. The project specific (project increment) significance threshold is HI > 1.0 while the cumulative (facility-wide) is HI > 3.0. It should be noted that the HI is only one of three TAC emission significance thresholds considered (when applicable) in a CEQA analysis. The other two are the maximum individual cancer risk (MICR) and the cancer burden, both of which use the same significance thresholds (MICR of 10 in 1 million and cancer burden of 0.5) for project specific and cumulative impacts.
Projects that exceed the project-specific significance thresholds are considered by the SCAQMD to be cumulatively considerable. This is the reason project-specific and cumulative significance thresholds are the same. Conversely, projects that do not exceed the project-specific thresholds are generally not considered to be cumulatively significant.”
Therefore, this analysis assumes that individual projects that do not generate operational or construction emissions that exceed the SCAQMD’s recommended daily thresholds for project-specific impacts would also not cause a cumulatively considerable increase in emissions for those pollutants for which SCAB is in nonattainment, and, therefore, would not be considered to have a significant, adverse air quality impact. Alternatively, individual project-related construction and operational emissions that exceed SCAQMD thresholds for project-specific impacts would be considered cumulatively considerable.
CONSTRUCTION IMPACTS
The Project-specific evaluation of emissions presented in the preceding analysis demonstrates that, after implementation of applicable mitigation measures, Project construction-source air
Six Basins Strategic Plan Air Quality Impact Analysis
13854-02 AQ Report.pdf 43
pollutant emissions would not result in exceedances of regional thresholds. Therefore, Project construction-source emissions would be considered less than significant on a project-specific and cumulative basis.
OPERATIONAL IMPACTS
The Project-specific evaluation of emissions presented in the preceding analysis demonstrates that, Project operational-source air pollutant emissions would not result in exceedances of regional thresholds. Therefore, Project construction-source emissions would be considered less than significant on a project-specific and cumulative basis.

Six Basins Strategic Plan Air Quality Impact Analysis
13854-02 AQ Report.pdf 44
This page intentionally left blank
Six Basins Strategic Plan Air Quality Impact Analysis
13854-02 AQ Report.pdf 45
4 REFERENCES
1. State of California. 2019 CEQA California Environmental Quality Act. 2019. 2. South Coast Air Quality Management District. RULE 403. FUGITIVE DUST. [Online]
https://www.aqmd.gov/docs/default-source/rule-book/rule-iv/rule-403.pdf?sfvrsn=4. 3. —. Southern California Air Basins. [Online]
https://www.arb.ca.gov/msprog/onroad/porttruck/maps/scabc7map.pdf. 4. —. Guidance Document for Addressing Air Quality Issues in General Plans and Local Planning. 2005. 5. St. Croix Sensory, Inc. The "Gray Line" Between Odor Nuisance and Health Effects. 2000. 6. California Air Resources Board. Ambient Air Quality Standards (AAQS). [Online] 2016.
http://www.arb.ca.gov/research/aaqs/aaqs2.pdf. 7. United State Environmental Protection Agency. Frequent Questions about General Conformity . EPA.
[Online] https://www.epa.gov/general-conformity/frequent-questions-about-general-conformity#8.
8. South Coast Air Quality Management District. Annual Air Quality Monitoring Network Plan. [Online] July 2018. http://www.aqmd.gov/docs/default-source/clean-air-plans/air-quality-monitoring-network-plan/annual-air-quality-monitoring-network-plan-v2.pdf?sfvrsn=2.
9. Air Resources Board. State and National Ambient Air Quality Standards. [Online] https://www.arb.ca.gov/regact/2019/stateareadesignations/appc.pdf?_ga=2.169398369.1537615702.1554741141-1192937971.1505156621.
10. District, South Coast Air Quality Management. Air Quality Data Tables. [Online] https://www.aqmd.gov/home/air-quality/air-quality-data-studies/historical-data-by-year.
11. Environmental Protection Agency. National Ambient Air Quality Standards (NAAQS). [Online] 1990. https://www.epa.gov/environmental-topics/air-topics.
12. —. Air Pollution and the Clean Air Act. [Online] http://www.epa.gov/air/caa/. 13. United States Environmental Protection Agency. 1990 Clean Air Act Amendment Summary: Title I.
[Online] https://www.epa.gov/clean-air-act-overview/1990-clean-air-act-amendment-summary-title-i.
14. —. 1990 Clean Air Act Amendment Summary: Title II. [Online] https://www.epa.gov/clean-air-act-overview/1990-clean-air-act-amendment-summary-title-ii.
15. Air Resources Board. California Ambient Air Quality Standards (CAAQS). [Online] 2009. [Cited: April 16, 2018.] http://www.arb.ca.gov/research/aaqs/caaqs/caaqs.htm.
16. Southern California Association of Governments. 2016-2040 Regional Transportation Plan/Sustainable Communities Strategy. [Online] April 2016. http://scagrtpscs.net/Documents/2016/final/f2016RTPSCS.pdf.
17. South Coast Air Quality Management District (SCAQMD). SCAQMD Air Quality Significance Thresholds. [Online] http://www.aqmd.gov/docs/default-source/ceqa/handbook/scaqmd-air-quality-significance-thresholds.pdf?sfvrsn=2.
18. California Air Pollution Control Officers Association (CAPCOA). California Emissions Estimator Model (CalEEMod). [Online] September 2016. www.caleemod.com.
19. Lake Environmental. US EPA Models. Lake Environmental. [Online] http://www.weblakes.com/download/us_epa.html.

Six Basins Strategic Plan Air Quality Impact Analysis
13854-02 AQ Report.pdf 46
20. South Coast Air Quality Management District. Fact Sheet for Applying CalEEMod to Localized Significance Thresholds. [Online] http://www.aqmd.gov/docs/default-source/ceqa/handbook/localized-significance-thresholds/caleemod-guidance.pdf.
21. California Air Pollution Control Officers Association (CAPCOA). Appendix A: Calculation Details for CalEEMod. CalEEMod. [Online] October 2017. http://www.aqmd.gov/docs/default-source/caleemod/02_appendix-a2016-3-2.pdf?sfvrsn=6.
22. South Coast Air Quality Management District. Localized Significance Thresholds Methodology. s.l. : South Coast Air Quality Managment District, 2008.
23. —. Localized Significance Thresholds Methodology. s.l. : South Coast Air Quality Managment District, 2003.
24. —. 2003 Air Quality Management Plan. [Online] 2003. http://www.aqmd.gov/docs/default-source/clean-air-plans/air-quality-management-plans/2003-air-quality-management-plan/2003-aqmp-appendix-v.pdf.
25. —. 2003 Air Quality Management Plan. [Online] 2003. https://www.aqmd.gov/home/air-quality/clean-air-plans/air-quality-mgt-plan/2003-aqmp.
26. Bay Area Air Quality Management District. [Online] http://www.baaqmd.gov/.
27. South Coast Air Quality Management District. 2003 Air Quality Management Plan. [Online] 2003. https://www.aqmd.gov/home/air-quality/clean-air-plans/air-quality-mgt-plan/2003-aqmp.
28. —. Final 2016 Air Quality Management Plan (AQMP). [Online] March 2017. http://www.aqmd.gov/docs/default-source/clean-air-plans/air-quality-management-plans/2016-air-quality-management-plan/final-2016-aqmp/final2016aqmp.pdf?sfvrsn=11.
29. South coast Air Quality Management District. CEQA Air Quality Handbook (1993). 1993. 30. South Coast Air Quality Management District. RULE 402 NUISANCE. [Online]
http://www.aqmd.gov/docs/default-source/rule-book/rule-iv/rule-402.pdf. 31. Goss, Tracy A and Kroeger, Amy. White Paper on Potential Control Strategies to Address Cumulative
Impacts from Air Pollution. [Online] South Coast Air Quality Management District, 2003. http://www.aqmd.gov/rules/ciwg/final_white_paper.pdf.

Six Basins Strategic Plan Air Quality Impact Analysis
13854-02 AQ Report.pdf 47
This page intentionally left blank

Six Basins Strategic Plan Air Quality Impact Analysis
13854-02 AQ Report.pdf 48
5 CERTIFICATIONS
The contents of this air study report represent an accurate depiction of the environmental impacts associated with the proposed Six Basins Strategic Plan. The information contained in this air quality impact assessment report is based on the best available data at the time of preparation. If you have any questions, please contact me directly at [email protected]
Haseeb Qureshi Associate Principal URBAN CROSSROADS, INC. [email protected]
EDUCATION
Master of Science in Environmental Studies California State University, Fullerton • May, 2010
Bachelor of Arts in Environmental Analysis and Design University of California, Irvine • June, 2006
PROFESSIONAL AFFILIATIONS AEP – Association of Environmental Planners AWMA – Air and Waste Management Association ASTM – American Society for Testing and Materials
PROFESSIONAL CERTIFICATIONS Planned Communities and Urban Infill – Urban Land Institute • June 2011 Indoor Air Quality and Industrial Hygiene – EMSL Analytical • April 2008 Principles of Ambient Air Monitoring – CARB • August 2007 AB2588 Regulatory Standards – Trinity Consultants • November 2006 Air Dispersion Modeling – Lakes Environmental • June 2006

Six Basins Strategic Plan Air Quality Impact Analysis
13854-02 AQ Report.pdf 49
This page intentionally left blank
Six Basins Strategic Plan Air Quality Impact Analysis
13854-02 AQ Report.pdf
APPENDIX 2.1:
STATE/FEDERAL ATTAINMENT STATUS OF CRITERIA POLLUTANTS

Six Basins Strategic Plan Air Quality Impact Analysis
13854-02 AQ Report.pdf
This page intentionally left blank

Six Basins Strategic Plan Air Quality Impact Analysis
13854-02 AQ Report.pdf
APPENDIX 3.1:
CALEEMOD PROJECT CONSTRUCTION (UNMITIGATED) EMISSIONS MODEL OUTPUTS

Six Basins Strategic Plan Air Quality Impact Analysis
13854-02 AQ Report.pdf
This page intentionally left blank

Six Basins Strategic Plan Air Quality Impact Analysis
13854-02 AQ Report.pdf
APPENDIX 3.2:
CALEEMOD PROJECT CONSTRUCTION (MITIGATED) EMISSIONS MODEL OUTPUTS

Six Basins Strategic Plan Air Quality Impact Analysis
13854-02 AQ Report.pdf
This page intentionally left blank