appendix a: air quality and greenhouse gas …
TRANSCRIPT
........................................................................................................................
APPENDIX A: AIR QUALITY AND GREENHOUSE GAS EMISSIONS DATA

........................................................................................................................

Air Quality and Greenhouse Gas Background and Modeling Data Page 1
Air Quality and Greenhouse Gas Background and Modeling Data
1. Air Quality Ambient air quality standards (AAQS) have been adopted at State and federal levels for criteria air pollutants. In addition, both the State and federal government regulate the release of toxic air contaminants (TACs). The City of San Francisco is in the San Francisco Bay Area Air Basin (SFBAAB) and is subject to the rules and regulations imposed by the Bay Area Air Quality Management District (BAAQMD), as well as the California AAQS adopted by the California Air Resources Board (CARB) and national AAQS adopted by the United States Environmental Protection Agency (EPA). Federal, State, regional, and local laws, regulations, plans, or guidelines that are potentially applicable to the proposed project are summarized below. The discussion also identifies the natural factors in the air basin that affect air pollution.
1.1 REGULATORY FRAMEWORK 1.1.1 Ambient Air Quality Standards The Clean Air Act (CAA) was passed in 1963 by the U.S. Congress and has been amended several times. The 1970 Clean Air Act amendments strengthened previous legislation and laid the foundation for the regulatory scheme of the 1970s and 1980s. In 1977, Congress again added several provisions, including nonattainment requirements for areas not meeting National AAQS and the Prevention of Significant Deterioration program. The 1990 amendments represent the latest in a series of federal efforts to regulate the protection of air quality in the United States. The CAA allows states to adopt more stringent standards or to include other pollution species. The California Clean Air Act, signed into law in 1988, requires all areas of the State to achieve and maintain the California AAQS by the earliest practical date. The California AAQS tend to be more restrictive than the National AAQS.
Criteria air pollutants are the air pollutants for which AAQS have been developed that are regulated under the CAA. The National and California AAQS are the levels of air quality considered to provide a margin of safety in the protection of the public health and welfare. They are designed to protect “sensitive receptors” most susceptible to further respiratory distress, such as asthmatics, the elderly, very young children, people already weakened by other disease or illness, and persons engaged in strenuous work or exercise. Healthy adults can tolerate occasional exposure to air pollutant concentrations considerably above these minimum standards before adverse effects are observed.
Both California and the federal government have established health-based AAQS for seven air pollutants, which are shown in Table 1. These pollutants are ozone (O3), nitrogen dioxide (NO2), carbon monoxide (CO), sulfur dioxide (SO2), coarse inhalable particulate matter (PM10), fine inhalable particulate matter (PM2.5), and lead (Pb). In addition, the State has set standards for sulfates, hydrogen sulfide, vinyl chloride, and visibility-reducing particles. These standards are designed to protect the health and welfare of the populace with a reasonable margin of safety.

Page 2 Air Quality and Greenhouse Gas Background and Modeling Data
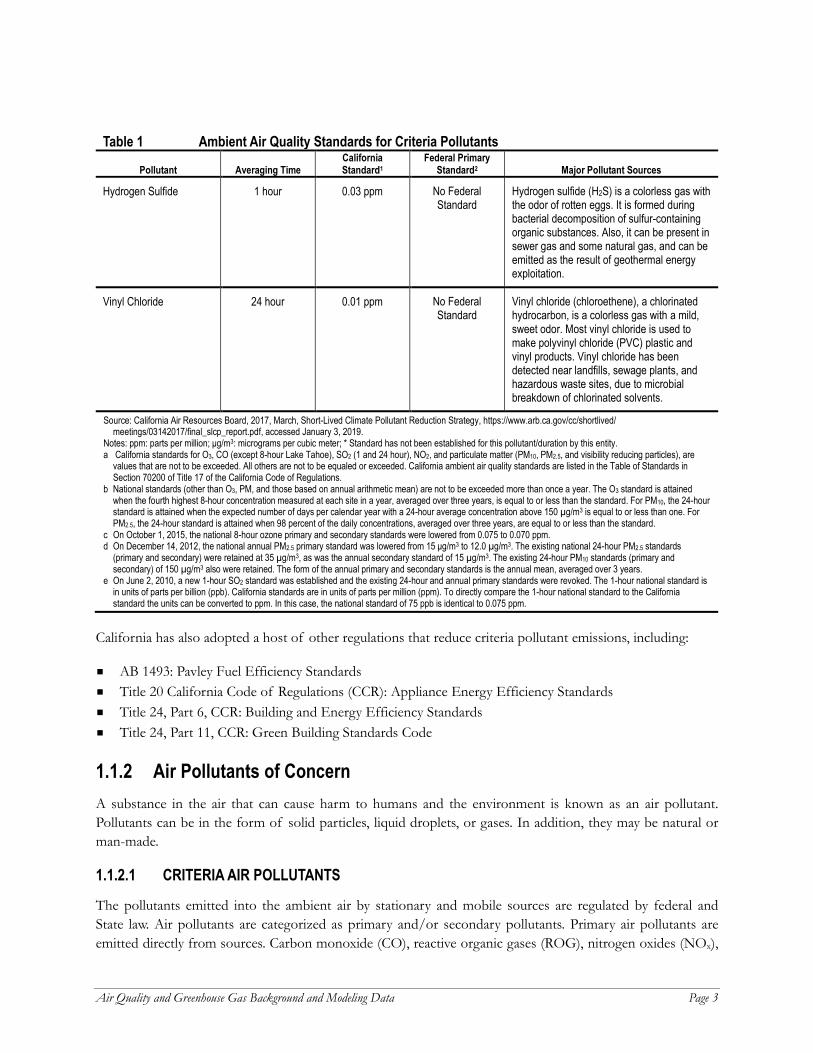
Table 1 Ambient Air Quality Standards for Criteria Pollutants
Pollutant Averaging Time California Standard1
Federal Primary Standard2 Major Pollutant Sources
Ozone (O3)3 1 hour 0.09 ppm * Motor vehicles, paints, coatings, and solvents. 8 hours 0.070 ppm 0.070 ppm
Carbon Monoxide (CO) 1 hour 20 ppm 35 ppm Internal combustion engines, primarily gasoline-powered motor vehicles.
8 hours 9.0 ppm 9 ppm
Nitrogen Dioxide (NO2) Annual Arithmetic Mean
0.030 ppm 0.053 ppm Motor vehicles, petroleum-refining operations, industrial sources, aircraft, ships, and railroads.
1 hour 0.18 ppm 0.100 ppm
Sulfur Dioxide (SO2) Annual Arithmetic Mean
* 0.030 ppm Fuel combustion, chemical plants, sulfur recovery plants, and metal processing.
1 hour 0.25 ppm 0.075 ppm
24 hours 0.04 ppm 0.14 ppm
Respirable Coarse Particulate Matter (PM10)
Annual Arithmetic Mean
20 µg/m3 * Dust and fume-producing construction, industrial, and agricultural operations, combustion, atmospheric photochemical reactions, and natural activities (e.g., wind-raised dust and ocean sprays).
24 hours 50 µg/m3 150 µg/m3
Respirable Fine Particulate Matter (PM2.5)4
Annual Arithmetic Mean
12 µg/m3 12 µg/m3 Dust and fume-producing construction, industrial, and agricultural operations, combustion, atmospheric photochemical reactions, and natural activities (e.g., wind-raised dust and ocean sprays).
24 hours * 35 µg/m3
Lead (Pb) 30-Day Average 1.5 µg/m3 * Present source: lead smelters, battery manufacturing & recycling facilities. Past source: combustion of leaded gasoline. Calendar Quarter * 1.5 µg/m3
Rolling 3-Month Average
* 0.15 µg/m3
Sulfates (SO4)5 24 hours 25 µg/m3 * Industrial processes.
Visibility Reducing Particles
8 hours ExCo =0.23/km visibility of 10≥
miles
No Federal Standard
Visibility-reducing particles consist of suspended particulate matter, which is a complex mixture of tiny particles that consists of dry solid fragments, solid cores with liquid coatings, and small droplets of liquid. These particles vary greatly in shape, size and chemical composition, and can be made up of many different materials such as metals, soot, soil, dust, and salt.
Air Quality and Greenhouse Gas Background and Modeling Data Page 3
Table 1 Ambient Air Quality Standards for Criteria Pollutants
Pollutant Averaging Time California Standard1
Federal Primary Standard2 Major Pollutant Sources
Hydrogen Sulfide 1 hour 0.03 ppm No Federal Standard
Hydrogen sulfide (H2S) is a colorless gas with the odor of rotten eggs. It is formed during bacterial decomposition of sulfur-containing organic substances. Also, it can be present in sewer gas and some natural gas, and can be emitted as the result of geothermal energy exploitation.
Vinyl Chloride 24 hour 0.01 ppm No Federal Standard
Vinyl chloride (chloroethene), a chlorinated hydrocarbon, is a colorless gas with a mild, sweet odor. Most vinyl chloride is used to make polyvinyl chloride (PVC) plastic and vinyl products. Vinyl chloride has been detected near landfills, sewage plants, and hazardous waste sites, due to microbial breakdown of chlorinated solvents.
Source: California Air Resources Board, 2017, March, Short-Lived Climate Pollutant Reduction Strategy, https://www.arb.ca.gov/cc/shortlived/ meetings/03142017/final_slcp_report.pdf, accessed January 3, 2019.
Notes: ppm: parts per million; μg/m3: micrograms per cubic meter; * Standard has not been established for this pollutant/duration by this entity. a California standards for O3, CO (except 8-hour Lake Tahoe), SO2 (1 and 24 hour), NO2, and particulate matter (PM10, PM2.5, and visibility reducing particles), are
values that are not to be exceeded. All others are not to be equaled or exceeded. California ambient air quality standards are listed in the Table of Standards in Section 70200 of Title 17 of the California Code of Regulations.
b National standards (other than O3, PM, and those based on annual arithmetic mean) are not to be exceeded more than once a year. The O3 standard is attained when the fourth highest 8-hour concentration measured at each site in a year, averaged over three years, is equal to or less than the standard. For PM10, the 24-hour standard is attained when the expected number of days per calendar year with a 24-hour average concentration above 150 µg/m3 is equal to or less than one. For PM2.5, the 24-hour standard is attained when 98 percent of the daily concentrations, averaged over three years, are equal to or less than the standard.
c On October 1, 2015, the national 8-hour ozone primary and secondary standards were lowered from 0.075 to 0.070 ppm. d On December 14, 2012, the national annual PM2.5 primary standard was lowered from 15 μg/m3 to 12.0 µg/m3. The existing national 24-hour PM2.5 standards
(primary and secondary) were retained at 35 µg/m3, as was the annual secondary standard of 15 µg/m3. The existing 24-hour PM10 standards (primary and secondary) of 150 µg/m3 also were retained. The form of the annual primary and secondary standards is the annual mean, averaged over 3 years.
e On June 2, 2010, a new 1-hour SO2 standard was established and the existing 24-hour and annual primary standards were revoked. The 1-hour national standard is in units of parts per billion (ppb). California standards are in units of parts per million (ppm). To directly compare the 1-hour national standard to the California standard the units can be converted to ppm. In this case, the national standard of 75 ppb is identical to 0.075 ppm.
California has also adopted a host of other regulations that reduce criteria pollutant emissions, including:
AB 1493: Pavley Fuel Efficiency Standards Title 20 California Code of Regulations (CCR): Appliance Energy Efficiency Standards
Title 24, Part 6, CCR: Building and Energy Efficiency Standards
Title 24, Part 11, CCR: Green Building Standards Code
1.1.2 Air Pollutants of Concern A substance in the air that can cause harm to humans and the environment is known as an air pollutant. Pollutants can be in the form of solid particles, liquid droplets, or gases. In addition, they may be natural or man-made.
1.1.2.1 CRITERIA AIR POLLUTANTS
The pollutants emitted into the ambient air by stationary and mobile sources are regulated by federal and State law. Air pollutants are categorized as primary and/or secondary pollutants. Primary air pollutants are emitted directly from sources. Carbon monoxide (CO), reactive organic gases (ROG), nitrogen oxides (NOx),

Page 4 Air Quality and Greenhouse Gas Background and Modeling Data
sulfur dioxide (SO2), coarse inhalable particulate matter (PM10), fine inhalable particulate matter (PM2.5), and lead (Pb) are primary air pollutants. Of these, CO, SO2, nitrogen dioxide (NO2), PM10, and PM2.5 are “criteria air pollutants,” which means that AAQS have been established for them. ROG and NOx are criteria pollutant precursors that form secondary criteria air pollutants through chemical and photochemical reactions in the atmosphere. Ozone (O3) and NO2 are the principal secondary pollutants.
A description of each of the primary and secondary criteria air pollutants and their known health effects is presented below.
Carbon Monoxide (CO) is a colorless, odorless, toxic gas produced by incomplete combustion of carbon substances, such as gasoline or diesel fuel. CO is a primary criteria air pollutant. CO concentrations tend to be the highest during winter mornings with little or no wind, when surface-based inversions trap the pollutant at ground levels. Because CO is emitted directly from internal combustion engines, motor vehicles operating at slow speeds are the primary source of CO in the air basin. Emissions are highest during cold starts, hard acceleration, stop-and-go driving, and when a vehicle is moving at low speeds. New findings indicate that CO emissions per mile are lowest at about 45 miles per hour (mph) for the average light-duty motor vehicle and begin to increase again at higher speeds. When inhaled at high concentrations, CO combines with hemoglobin in the blood and reduces its oxygen-carrying capacity1. This results in reduced oxygen reaching the brain, heart, and other body tissues. This condition is especially critical for people with cardiovascular diseases, chronic lung disease, or anemia, as well as for fetuses. Even healthy people exposed to high CO concentrations can experience headaches, dizziness, fatigue, unconsciousness, and even death.2 The air basin is designated under the California and National AAQS as being in attainment of CO criteria levels.3
Reactive Organic Gases (ROGs) are compounds composed primarily of hydrogen and carbon atoms. Internal combustion associated with motor vehicle usage is the major source of ROGs. Other sources include evaporative emissions from paints and solvents, the application of asphalt paving, and the use of household consumer products such as aerosols. Adverse effects on human health are not caused directly by ROGs, but rather by reactions of ROGs to form secondary pollutants such as O3. There are no AAQS established for ROGs. However, because they contribute to the formation of O3, BAAQMD has established a significance threshold for this pollutant.
Nitrogen Oxides (NOx) are a by-product of fuel combustion and contribute to the formation of O3, PM10, and PM2.5. The two major components of NOx are nitric oxide (NO) and NO2. The principal component of NOx produced by combustion is NO, but NO reacts with oxygen to form NO2, creating the mixture of NO and NO2 commonly called NOx. NO2 is an acute irritant and at equal concentrations more injurious than NO. At atmospheric concentrations, however, NO2 is only potentially irritating. There is some indication of a relationship between NO2 and chronic pulmonary fibrosis. Some increase in bronchitis in children (two and three years old) has also been observed at concentrations below 0.3 parts per million (ppm). NO2 absorbs blue light; the result is a brownish-red cast to the atmosphere and reduced visibility. NO is a colorless, odorless gas formed from
1 US Environmental Protection Agency. 2017, April 7. Six Common Air Pollutants. https://www.epa.gov/criteria-air-pollutants.
2 Bay Area Air Quality Management District. 2017, May. Appendix C: Sample Air Quality Setting, in California Environmental Quality Act Air Quality Guidelines. 3 California Air Resources Board, 2017, October. Area Designations Maps: State and National. http://www.arb.ca.gov/desig/adm/adm.htm.
Air Quality and Greenhouse Gas Background and Modeling Data Page 5
atmospheric nitrogen and oxygen when combustion takes place under high temperature and/or high pressure.4,5 The air basin is designated an attainment area for NO2 under the National AAQS and California AAQS.6
Sulfur Dioxide (SO2) is a colorless, pungent, irritating gas formed by the combustion of sulfurous fossil fuels. It enters the atmosphere as a result of burning high-sulfur-content fuel oils and coal and from chemical processes at chemical plants and refineries. Gasoline and natural gas have very low sulfur content and do not release significant quantities of SO2. When SO2 forms sulfates (SO4) in the atmosphere, together these pollutants are referred to as sulfur oxides (SOx). Thus, SO2 is both a primary and secondary criteria air pollutant. At sufficiently high concentrations, SO2 may irritate the upper respiratory tract. At lower concentrations and when combined with particulates, SO2 may do greater harm by injuring lung tissue.7 The air basin is designated an attainment area for SO2 under the California and National AAQS.8
Suspended Particulate Matter (PM10 and PM2.5) consists of finely divided solids or liquids such as soot, dust, aerosols, fumes, and mists. Two forms of fine particulates are now recognized and regulated. Inhalable coarse particles, or PM10, include the particulate matter with an aerodynamic diameter of 10 microns (i.e., 10 millionths of a meter or 0.0004-inch) or less. Inhalable fine particles, or PM2.5, have an aerodynamic diameter of 2.5 microns or less (i.e., 2.5 millionths of a meter or 0.0001 inch).
Some particulate matter, such as pollen, occurs naturally. Most particulate matter in the air basin is caused by combustion, factories, construction, grading, demolition, agricultural activities, and motor vehicles. Extended exposure to particulate matter can increase the risk of chronic respiratory disease. PM10 bypasses the body’s natural filtration system more easily than larger particles and can lodge deep in the lungs. An EPA scientific review concluded that PM2.5 penetrates even more deeply into the lungs, and this is more likely to contribute to health effects—at concentrations well below current PM10 standards. These health effects include premature death in people with heart or lung disease, nonfatal heart attacks, irregular heartbeat, aggravated asthma, decreased lung function, increased respiratory symptoms (e.g. irritation of the airways, coughing, or difficulty breathing). Motor vehicles are currently responsible for about half of particulates in the air basin. Wood burning in fireplaces and stoves is another large source of fine particulates.9
Both PM10 and PM2.5 may adversely affect the human respiratory system, especially in people who are naturally sensitive or susceptible to breathing problems. These health effects include premature death and increased hospital admissions and emergency room visits (primarily the elderly and individuals with cardiopulmonary disease); increased respiratory symptoms and disease (children and individual with asthma); and alterations in lung tissue and structure and in respiratory tract defense
4 Bay Area Air Quality Management District. 2017, May. Appendix C: Sample Air Quality Setting, in California Environmental Quality Act Air Quality Guidelines. 5 US Environmental Protection Agency. 2017, April 7. Six Common Air Pollutants. https://www.epa.gov/criteria-air-pollutants. 6 California Air Resources Board, 2017, October. Area Designations Maps: State and National. http://www.arb.ca.gov/desig/adm/adm.htm. 7 Bay Area Air Quality Management District. 2017, May. Appendix C: Sample Air Quality Setting, in California Environmental Quality Act Air Quality Guidelines. 8 California Air Resources Board, 2017, October. Area Designations Maps: State and National. http://www.arb.ca.gov/desig/adm/adm.htm. 9 Bay Area Air Quality Management District. 2017, May. Appendix C: Sample Air Quality Setting, in California Environmental Quality Act Air Quality Guidelines.

Page 6 Air Quality and Greenhouse Gas Background and Modeling Data
mechanisms.10 Diesel particulate matter (DPM) is classified a carcinogen by CARB. The air basin is designated nonattainment under the California AAQS for PM10 and nonattainment under both the California and National AAQS for PM2.5.11,12
Ozone (O3) is commonly referred to as “smog” and is a gas that is formed when ROGs and NOx,—both by-products of internal combustion engine exhaust—undergo photochemical reactions in the presence of sunlight. O3 is a secondary criteria air pollutant. O3 concentrations are generally highest during the summer months when direct sunlight, light winds, and warm temperatures create favorable conditions to the formation of this pollutant. O3 poses a health threat to those who already suffer from respiratory diseases as well as to healthy people. O3 levels usually build up during the day and peak in the afternoon. Short-term exposure can irritate the eyes and cause constriction of the airways. Besides causing shortness of breath, it can aggravate existing respiratory diseases such as asthma, bronchitis, and emphysema. Chronic exposure to high ozone levels can permanently damage lung tissue. O3 can also damage plants and trees and materials such as rubber and fabrics.13 The air basin is designated nonattainment of the 1-hour California AAQS and 8-hour California and National AAQS for O3.14
Lead (Pb) is a metal found naturally in the environment as well as in manufactured products. The major sources of lead emissions have historically been mobile and industrial sources. As a result of the phase-out of leaded gasoline, metal processing is currently the primary source of lead emissions. The highest levels of lead in air are generally found near lead smelters. Other stationary sources are waste incinerators, utilities, and lead-acid battery manufacturers.
Twenty years ago, mobile sources were the main contributor to ambient lead concentrations in the air. In the early 1970s, the EPA set national regulations to gradually reduce the lead content in gasoline. In 1975, unleaded gasoline was introduced for motor vehicles equipped with catalytic converters. The EPA banned the use of leaded gasoline in highway vehicles in December 1995. As a result of the EPA’s regulatory efforts to remove lead from gasoline, emissions of lead from the transportation sector and levels of lead in the air decreased dramatically.15 The air basin is designated in attainment of the California and National AAQS for lead.16 Because emissions of lead are found only in projects that are permitted by BAAQMD, lead is not an air quality of concern for the proposed project.
10 South Coast Air Quality Management District. 2005. Guidance Document for Addressing Air Quality Issues in General Plans and Local Planning. 11 California Air Resources Board, 2017, October. Area Designations Maps: State and National. http://www.arb.ca.gov/desig/adm/adm.htm. 12 On January 9, 2013, the EPA issued a final rule to determine that the SFBAAB has attained the 24-hour PM2.5 National AAQS. This action suspends federal State Implementation Plan planning requirements for the Bay Area. The SFBAAB will continue to be designated nonattainment for the National 24-hour PM2.5 standard until such time as BAAQMD elects to submit a redesignation request and a maintenance plan to EPA and EPA approves the proposed redesignation. 13 Bay Area Air Quality Management District. 2017, May. Appendix C: Sample Air Quality Setting, in California Environmental Quality Act Air Quality Guidelines. 14 California Air Resources Board, 2017, October. Area Designations Maps: State and National. http://www.arb.ca.gov/desig/adm/adm.htm 15 Bay Area Air Quality Management District. 2017, May. Appendix C: Sample Air Quality Setting, in California Environmental Quality Act Air Quality Guidelines. 16 California Air Resources Board, 2017, October. Area Designations Maps: State and National. http://www.arb.ca.gov/desig/adm/adm.htm.
Air Quality and Greenhouse Gas Background and Modeling Data Page 7
1.1.2.2 TOXIC AIR CONTAMINANTS
Public exposure to TACs is a significant environmental health issue in California. In 1983, the California Legislature enacted a program to identify the health effects of TACs and reduce exposure to these contaminants to protect the public health. The California Health and Safety Code defines a TAC as “an air pollutant which may cause or contribute to an increase in mortality or in serious illness, or which may pose a present or potential hazard to human health.” A substance that is listed as a hazardous air pollutant pursuant to Section 112(b) of the federal Clean Air Act (42 U.S. Code Section 7412[b]) is a toxic air contaminant. Under State law, the California Environmental Protection Agency (Cal/EPA), acting through CARB, is authorized to identify a substance as a TAC if it is an air pollutant that may cause or contribute to an increase in mortality or serious illness, or may pose a present or potential hazard to human health.
California regulates TACs primarily through AB 1807 (Tanner Air Toxics Act) and AB 2588 (Air Toxics “Hot Spot” Information and Assessment Act of 1987). The Tanner Air Toxics Act sets up a formal procedure for CARB to designate substances as TACs. Once a TAC is identified, CARB adopts an “airborne toxics control measure” for sources that emit designated TACs. If there is a safe threshold for a substance (i.e. a point below which there is no toxic effect), the control measure must reduce exposure to below that threshold. If there is no safe threshold, the measure must incorporate toxics best available control technology to minimize emissions. To date, CARB has established formal control measures for 11 TACs that it identified as having no safe threshold.
Air toxics from stationary sources are also regulated in California under the Air Toxics “Hot Spot” Information and Assessment Act of 1987. Under AB 2588, TAC emissions from individual facilities are quantified and prioritized by the air quality management district or air pollution control district. High priority facilities are required to perform a health risk assessment and, if specific thresholds are exceeded, are required to communicate the results to the public through notices and public meetings.
At the time of the last update to the TAC list in December 1999, CARB had designated 244 compounds as TACs.17 Additionally, CARB has implemented control measures for a number of compounds that pose high risks and show potential for effective control. The majority of the estimated health risks from TACs can be attributed to relatively few compounds, the most important being particulate matter from diesel-fueled engines.
In 1998, CARB identified DPM as a TAC. Previously, the individual chemical compounds in diesel exhaust were considered TACs. Almost all diesel exhaust particles are 10 microns or less in diameter. Because of their extremely small size, these particles can be inhaled and eventually trapped in the bronchial and alveolar regions of the lungs.
CARB has promulgated the following specific rules to limit TAC emissions:
13 CCR Chapter 10, Section 2485, Airborne Toxic Control Measure to Limit Diesel-Fueled Commercial Motor Vehicle Idling
13 CCR Chapter 10, Section 2480, Airborne Toxic Control Measure to Limit School Bus Idling and Idling at Schools
17 California Air Resources Board , 1999. Final Staff Report: Update to the Toxic Air Contaminant List.

Page 8 Air Quality and Greenhouse Gas Background and Modeling Data
13 CCR Section 2477 and Article 8, Airborne Toxic Control Measure for In-Use Diesel-Fueled Transport Refrigeration Units (TRU) and TRU Generator Sets and Facilities Where TRUs Operate
In addition, to reduce exposure to TACs, CARB developed and approved the Air Quality and Land Use Handbook: A Community Health Perspective to provide guidance regarding the siting of sensitive land uses in the vicinity of freeways, distribution centers, rail yards, ports, refineries, chrome-plating facilities, dry cleaners, and gasoline-dispensing facilities.18 This guidance document was developed to assess compatibility and associated health risks when placing sensitive receptors near existing pollution sources. CARB’s recommendations on the siting of new sensitive land uses were based on a compilation of recent studies that evaluated data on the adverse health effects from proximity to air pollution sources. The key observation in these studies is that proximity to air pollution sources substantially increases exposure and the potential for adverse health effects. There are three carcinogenic toxic air contaminants that constitute the majority of the known health risks from motor vehicle traffic, DPM from trucks, and benzene and 1,3 butadiene from passenger vehicles. CARB recommendations are based on data that show that localized air pollution exposures can be reduced by as much as 80 percent by following CARB minimum distance separations.
1.1.3 Bay Area Air Quality Management District BAAQMD is the agency responsible for assuring that the National and California AAQS are attained and maintained in the SFBAAB. BAAQMD is responsible for:
Adopting and enforcing rules and regulations concerning air pollutant sources.
Issuing permits for stationary sources of air pollutants.
Inspecting stationary sources of air pollutants.
Responding to citizen complaints. Monitoring ambient air quality and meteorological conditions.
Awarding grants to reduce motor vehicle emissions.
Conducting public education campaigns.
Air quality management planning.
Air quality conditions in the air basin have improved significantly since the BAAQMD was created in 1955.19 The BAAQMD prepares air quality management plans (AQMPs) to attain ambient air quality standards in the SFBAAB. The BAAQMD prepares ozone attainment plans (OAPs) for the National O3 standard and clean air plans for the California O3 standard. The BAAQMD prepares these AQMPs in coordination with the Association of Bay Area Governments (ABAG) and the Metropolitan Transportation Commission (MTC). The most recent adopted comprehensive plan is the 2017 Clean Air Plan, which was adopted on April 19, 2017, and incorporates significant new scientific data, primarily in the form of updated emissions inventories, ambient measurements, new meteorological episodes, and new air quality modeling tools.
18 California Air Resources Board. 2005, April. Air Quality Handbook: A Community Health Perspective. 19 Bay Area Air Quality Management District. 2017, May. Appendix C: Sample Air Quality Setting, in California Environmental Quality Act Air Quality Guidelines.
Air Quality and Greenhouse Gas Background and Modeling Data Page 9
1.1.3.1 BAAQMD BAY AREA CLEAN AIR PLAN
2017 Spare the Air, Cool the Climate: A Blueprint for Clean Air and Climate Protection in the Bay Area
BAAQMD adopted the 2017 Clean Air Plan, Spare the Air, Cool the Climate (2017 Clean Air Plan) on April 19, 2017. The 2017 Plan serves as an update to the adopted Bay Area 2010 Clean Air Plan and continues in providing the framework for SFBAAB to achieve attainment of the California and National AAQS. Similar to the Bay Area 2010 Clean Air Plan, the 2017 Clean Air Plan updates the Bay Area’s ozone plan, which is based on the “all feasible measures” approach to meet the requirements of the California CAA. Additionally, it sets a goal of reducing health risk impacts to local communities by 20 percent by 2020. Furthermore, the 2017 Clean Air Plan also lays the groundwork for reducing GHG emissions in the Bay Area to meet the state’s 2030 GHG reduction target and 2050 GHG reduction goal. It also includes a vision for the Bay Area in a post-carbon year 2050 that encompasses the following 20:
Construct buildings that are energy efficient and powered by renewable energy. Walk, bicycle, and use public transit for the majority of trips and use electric-powered autonomous public
transit fleets.
Incubate and produce clean energy technologies.
Live a low-carbon lifestyle by purchasing low-carbon foods and goods in addition to recycling and putting organic waste to productive use.
A comprehensive multipollutant control strategy has been developed to be implemented in the next three to five years to address public health and climate change and to set a pathway to achieve the 2050 vision. The control strategy includes 85 control measures to reduce emissions of ozone, particulate matter, TACs, and GHG from a full range of emission sources. These control measures cover the following sectors: 1) stationary (industrial) sources; 2) transportation; 3) energy; 4) agriculture; 5) natural and working lands; 6) waste management; 7) water; and 8) super-GHG pollutants. Overall, the proposed control strategy is based on the following key priorities:
Reduce emissions of criteria air pollutants and toxic air contaminants from all key sources.
Reduce emissions of “super-GHGs” such as methane, black carbon, and fluorinated gases.
Decrease demand for fossil fuels (gasoline, diesel, and natural gas).
Increase efficiency of the energy and transportation systems.
Reduce demand for vehicle travel, and high-carbon goods and services. Decarbonize the energy system.
Make the electricity supply carbon-free.
Electrify the transportation and building sectors.
20 Bay Area Air Quality Management District. 2017, April 19. Final 2017 Clean Air Plan, Spare the Air, Cool the Climate: A Blueprint for Clean Air and Climate Protection in the Bay Area. http://www.baaqmd.gov/plans-and-climate/air-quality-plans/plans-under-development.

Page 10 Air Quality and Greenhouse Gas Background and Modeling Data
1.1.3.2 BAAQMD’S COMMUNITY AIR RISK EVALUATION PROGRAM (CARE)
The BAAQMD’s Community Air Risk Evaluation (CARE) program was initiated in 2004 to evaluate and reduce health risks associated with exposure to outdoor TACs in the Bay Area. Based on findings of the latest report, DPM was found to account for approximately 85 percent of the cancer risk from airborne toxics. Carcinogenic compounds from gasoline-powered cars and light duty trucks were also identified as significant contributors: 1,3-butadiene contributed 4 percent of the cancer risk-weighted emissions, and benzene contributed 3 percent. Collectively, five compounds—DPM, 1,3-butadiene, benzene, formaldehyde, and acetaldehyde—were found to be responsible for more than 90 percent of the cancer risk attributed to emissions. All of these compounds are associated with emissions from internal combustion engines. The most important sources of cancer risk–weighted emissions were combustion-related sources of DPM, including on-road mobile sources (31 percent), construction equipment (29 percent), and ships and harbor craft (13 percent). A 75 percent reduction in DPM was predicted between 2005 and 2015 when the inventory accounted for CARB’s diesel regulations. Overall, cancer risk from TACs dropped by more than 50 percent between 2005 and 2015, when emissions inputs accounted for State diesel regulations and other reductions.21
Modeled cancer risks from TAC in 2005 were highest near sources of DPM: near core urban areas, along major roadways and freeways, and near maritime shipping terminals. The highest modeled risks were found east of San Francisco, near West Oakland, and the Maritime Port of Oakland. BAAQMD has identified seven impacted communities in the Bay Area:
1. Western Contra Costa County and the cities of Richmond and San Pablo
2. Western Alameda County along the Interstate 880 (I-880) corridor and the cities of Berkeley, Alameda, Oakland, and Hayward
3. San Jose
4. Eastern side of San Francisco
5. Concord
6. Vallejo
7. Pittsburgh and Antioch
The project site is not within a CARE-program impacted community.
The major contributor to acute and chronic non-cancer health effects in the air basin is acrolein (C3H4O). Major sources of acrolein are on-road mobile sources and aircraft near freeways and commercial and military airports.22 Currently CARB does not have certified emission factors or an analytical test method for acrolein.
21 Bay Area Air Quality Management District. 2014. Improving Air Quality & Health in Bay Area Communities, Community Air Risk Program (CARE) Retrospective and Path Forward (2004–2013), April. 22 Bay Area Air Quality Management District. 2006. Community Air Risk Evaluation Program, Phase I Findings and Policy Recommendations Related to Toxic Air Contaminants in the San Francisco Bay Area.

Air Quality and Greenhouse Gas Background and Modeling Data Page 11
Since the appropriate tools needed to implement and enforce acrolein emission limits are not available, the BAAQMD does not conduct health risk screening analysis for acrolein emissions.23
1.1.3.3 REGULATION 7, ODOROUS SUBSTANCES
Sources of objectionable odors may occur within the City. BAAQMD’s Regulation 7, Odorous Substances, places general limitations on odorous substances and specific emission limitations on certain odorous compounds. Odors are also regulated under BAAQMD Regulation 1, Rule 1-301, Public Nuisance, which states that “no person shall discharge from any source whatsoever such quantities of air contaminants or other material which cause injury, detriment, nuisance or annoyance to any considerable number of persons or the public; or which endangers the comfort, repose, health or safety of any such persons or the public, or which causes, or has a natural tendency to cause, injury or damage to business or property.” Under BAAQMD’s Rule 1-301, a facility that receives three or more violation notices within a 30-day period can be declared a public nuisance.
1.1.3.4 OTHER BAAQMD REGULATIONS
In addition to the plans and programs described above, BAAQMD administers a number of specific regulations on various sources of pollutant emissions that would apply to individual development projects allowed under the proposed General Plan, including:
BAAQMD, Regulation 2, Rule 2, New Source Review
BAAQMD, Regulation 2, Rule 5, New Source Review of Toxic Air Contaminants
BAAQMD Regulation 6, Rule 1, General Requirements
BAAQMD Regulation 6, Rule 2, Commercial Cooking Equipment
BAAQMD Regulation 8, Rule 3, Architectural Coatings BAAQMD Regulation 8, Rule 4, General Solvent and Surface Coatings Operations
BAAQMD Regulation 8, Rule 7, Gasoline Dispensing Facilities
BAAQMD Regulation 11, Rule 2, Asbestos, Demolition, Renovation and Manufacturing)
1.1.4 Santa Clara Valley Transportation Authority The Santa Clara Valley Transportation Authority (VTA) is the congestion management agency for Santa Clara County. VTA is tasked with developing a comprehensive transportation improvement program among local jurisdictions that will reduce traffic congestion and improve land use decision-making and air quality. VTA’s latest congestion management program (CMP) is the 2017 Congestion Management Program Document. VTA’s countywide transportation model must be consistent with the regional transportation model developed by the MTC with ABAG data. The countywide transportation model is used to help evaluate cumulative transportation impacts of local land use decisions on the CMP system. In addition, VTA’s updated CMP includes multi-modal performance standards and trip reduction and transportation demand management strategies consistent with the goal of reducing regional vehicle miles traveled in accordance with Senate Bill 375. The 2017 CMP also includes a discussion of Senate Bill 743 implementation and relationship to the
23 Bay Area Air Quality Management District. 2010. Air Toxics NSR Program, Health Risk Screening Analysis Guidelines.
Page 12 Air Quality and Greenhouse Gas Background and Modeling Data
CMP auto level of service standard. Elements discussed in the 2017 CMP for Santa Clara County, include the following:
Transportation Analysis Standards Element:
Monitor and submit report on the level of service on CMP roadway network intersections using CMP software and procedures
Monitor performance of CMP rural highways and freeways.
Multimodal Performance Measures Element:
Collect available transportation performance measurement data for use in land use analysis, deficiency plans and the CIP.
Transportation Model and Database Element:
Certify that the CMP model us consistent with the regional model. Certify that member agency models are consistent with the CMP model.
Land Use Impact Analysis Element:
Prepare a Transportation Impact Analysis (TIA) for projects that generate 100 or more peak hour trips and submit to the CMP according to TIA Guidelines schedule.
Submit relevant conditions of approval to VTA for projects generating TIAs. Prepare quarterly report on VTA comments and local agency adopted conditions for VTA Board,
Congestion Management Program and Planning Committee, Policy Advisory Committee, Technical Advisory Committee, Citizens Advisory Committee, and Bicycle and Pedestrian Advisory Committee.
Prepare and submit land use monitoring data to the CMP on all land use projects approved from July 1 to June 30 of the previous year.
Capital Improvement Program Element:
Develop a list of projects intended to maintain or improve the level of service on the designated system and to maintain transit performance standards.
Monitoring and Conformance Element:
Outline the requirements and procedures established for conducting annual traffic LOS and land use monitoring efforts. Support the Traffic Level of Service and Community Form and Impact Analysis Elements.
Multimodal Improvement Plan Element:
Prepare deficiency plans for facilities that violate CMP traffic LOS standards or that are projected to violate LOS standards using the adopted deficiency plan requirements.
Submit Deficiency Plan Implementation Status Report as part of annual monitoring.
Air Quality and Greenhouse Gas Background and Modeling Data Page 13
1.1.5 Bay Area Commuter Benefits Program Under Air District Regulation 14, Model Source Emissions Reduction Measures, Rule 1, Bay Area Commuter Benefits Program, employers with 50 or more full-time employees within the Air District are required to register and offer commuter benefits to employees. In partnership with the Air District and the MTC, the rule’s purpose is to improve air quality, reduce GHG emissions, and decrease the Bay Area’s traffic congestion by encouraging employees to use alternative commute modes, such as transit, vanpool, carpool, bicycling, and walking. The benefits program allows employees to choose from one of four commuter benefit options including a pre-tax benefit, employer-provided subsidy, employer-provided transit, and alternative commute benefit.
ENVIRONMENTAL SETTING
1.1.6 San Francisco Bay Area Air Basin The BAAQMD is the regional air quality agency for the SFBAAB, which comprises all of Alameda, Contra Costa, Marin, Napa, San Francisco, San Mateo, and Santa Clara counties; the southern portion of Sonoma County; and the southwestern portion of Solano County. Air quality in this area is determined by such natural factors as topography, meteorology, and climate, in addition to the presence of existing air pollution sources and ambient conditions.24
1.1.6.1 METEOROLOGY
The SFBAAB is characterized by complex terrain, consisting of coastal mountain ranges, inland valleys, and bays, which distort normal wind flow patterns. The Coast Range splits, resulting in a western coast gap, Golden Gate, and an eastern coast gap, Carquinez Strait, which allow air to flow in and out of the SFBAAB and the Central Valley.
The climate is dominated by the strength and location of a semi-permanent, subtropical high-pressure cell. During the summer, the Pacific high-pressure cell is centered over the northeastern Pacific Ocean, resulting in stable meteorological conditions and a steady northwesterly wind flow. Upwelling of cold ocean water from below the surface because of the northwesterly flow produces a band of cold water off the California coast.
The cool and moisture-laden air approaching the coast from the Pacific Ocean is further cooled by the presence of the cold water band, resulting in condensation and the presence of fog and stratus clouds along the Northern California coast. In the winter, the Pacific high-pressure cell weakens and shifts southward, resulting in wind flow offshore, the absence of upwelling, and the occurrence of storms. Weak inversions coupled with moderate winds result in a low air pollution potential.
1.1.6.2 WIND PATTERNS
During the summer, winds flowing from the northwest are drawn inland through the Golden Gate and over the lower portions of the San Francisco Peninsula. Immediately south of Mount Tamalpais, the northwesterly winds accelerate considerably and come more directly from the west as they stream through the Golden Gate. 24 This section describing the air basin is from Bay Area Air Quality Management District, 2017, May, Appendix C: Sample Air Quality Setting, in California Environmental Quality Act Air Quality Guidelines.

Page 14 Air Quality and Greenhouse Gas Background and Modeling Data
This channeling of wind through the Golden Gate produces a jet that sweeps eastward and splits off to the northwest toward Richmond and to the southwest toward San Jose when it meets the East Bay hills.
Wind speeds may be strong locally in areas where air is channeled through a narrow opening, such as the Carquinez Strait, the Golden Gate, or the San Bruno gap. For example, the average wind speed at San Francisco International Airport in July is about 17 knots (from 3:00 p.m. to 4:00 p.m.), compared with only 7 knots at San Jose and less than 6 knots at the Farallon Islands.
The air flowing in from the coast to the Central Valley, called the sea breeze, begins developing at or near ground level along the coast in late morning or early afternoon. As the day progresses, the sea breeze layer deepens and increases in velocity while spreading inland. The depth of the sea breeze depends in large part upon the height and strength of the inversion. If the inversion is low and strong, and hence stable, the flow of the sea breeze will be inhibited and stagnant conditions are likely to result.
In the winter, the SFBAAB frequently experiences stormy conditions with moderate to strong winds, as well as periods of stagnation with very light winds. Winter stagnation episodes are characterized by nighttime drainage flows in coastal valleys. Drainage is a reversal of the usual daytime air-flow patterns; air moves from the Central Valley toward the coast and back down toward the Bay from the smaller valleys within the SFBAAB.
1.1.6.3 TEMPERATURE
Summertime temperatures in the SFBAAB are determined in large part by the effect of differential heating between land and water surfaces. Because land tends to heat up and cool off more quickly than water, a large-scale gradient (differential) in temperature is often created between the coast and the Central Valley, and small-scale local gradients are often produced along the shorelines of the ocean and bays. The temperature gradient near the ocean is also exaggerated, especially in summer, because of the upwelling of cold water from the ocean bottom along the coast. On summer afternoons the temperatures at the coast can be 35 degrees Fahrenheit (ºF) cooler than temperatures 15 to 20 miles inland. At night this contrast usually decreases to less than 10ºF.
In the winter, the relationship of minimum and maximum temperatures is reversed. During the daytime the temperature contrast between the coast and inland areas is small, whereas at night the variation in temperature is large.
1.1.6.4 PRECIPITATION
The SFBAAB is characterized by moderately wet winters and dry summers. Winter rains (November through March) account for about 75 percent of the average annual rainfall. The amount of annual precipitation can vary greatly from one part of the SFBAAB to another, even within short distances. In general, total annual rainfall can reach 40 inches in the mountains, but it is often less than 16 inches in sheltered valleys.
During rainy periods, ventilation (rapid horizontal movement of air and injection of cleaner air) and vertical mixing (an upward and downward movement of air) are usually high, and thus pollution levels tend to be low (i.e. air pollutants are dispersed more readily into the atmosphere rather than accumulate under stagnant conditions). However, during the winter, frequent dry periods do occur, when mixing and ventilation are low and pollutant levels build up.
Air Quality and Greenhouse Gas Background and Modeling Data Page 15
1.1.6.5 WIND CIRCULATION
Low wind speed contributes to the buildup of air pollution because it allows more pollutants to be emitted into the air mass per unit of time. Light winds occur most frequently during periods of low sun (fall and winter, and early morning) and at night. These are also periods when air pollutant emissions from some sources are at their peak, namely, commuter traffic (early morning) and wood-burning appliances (nighttime). The problem can be compounded in valleys, when weak flows carry the pollutants up-valley during the day, and cold air drainage flows move the air mass down-valley at night. Such restricted movement of trapped air provides little opportunity for ventilation and leads to buildup of pollutants to potentially unhealthful levels.
1.1.6.6 INVERSIONS
An inversion is a layer of warmer air over a layer of cooler air. Inversions affect air quality conditions significantly because they influence the mixing depth, i.e. the vertical depth in the atmosphere available for diluting air contaminants near the ground. There are two types of inversions that occur regularly in the SFBAAB. Elevation inversions are more common in the summer and fall, and radiation inversions are more common during the winter. The highest air pollutant concentrations in the SFBAAB generally occur during inversions.
1.1.7 Existing Ambient Air Quality 1.1.7.1 ATTAINMENT STATUS OF THE SFBAAB
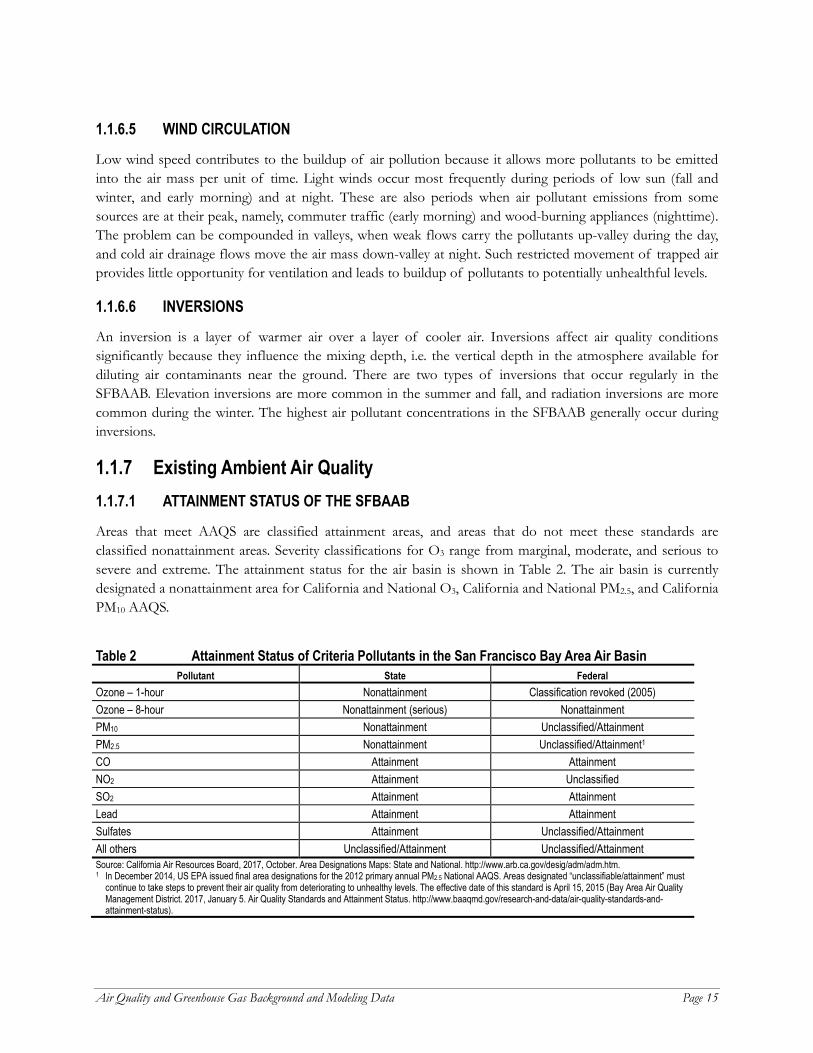
Areas that meet AAQS are classified attainment areas, and areas that do not meet these standards are classified nonattainment areas. Severity classifications for O3 range from marginal, moderate, and serious to severe and extreme. The attainment status for the air basin is shown in Table 2. The air basin is currently designated a nonattainment area for California and National O3, California and National PM2.5, and California PM10 AAQS.
Table 2 Attainment Status of Criteria Pollutants in the San Francisco Bay Area Air Basin Pollutant State Federal
Ozone – 1-hour Nonattainment Classification revoked (2005) Ozone – 8-hour Nonattainment (serious) Nonattainment PM10 Nonattainment Unclassified/Attainment PM2.5 Nonattainment Unclassified/Attainment1
CO Attainment Attainment NO2 Attainment Unclassified SO2 Attainment Attainment Lead Attainment Attainment Sulfates Attainment Unclassified/Attainment All others Unclassified/Attainment Unclassified/Attainment Source: California Air Resources Board, 2017, October. Area Designations Maps: State and National. http://www.arb.ca.gov/desig/adm/adm.htm. 1 In December 2014, US EPA issued final area designations for the 2012 primary annual PM2.5 National AAQS. Areas designated “unclassifiable/attainment” must
continue to take steps to prevent their air quality from deteriorating to unhealthy levels. The effective date of this standard is April 15, 2015 (Bay Area Air Quality Management District. 2017, January 5. Air Quality Standards and Attainment Status. http://www.baaqmd.gov/research-and-data/air-quality-standards-and-attainment-status).
Page 16 Air Quality and Greenhouse Gas Background and Modeling Data
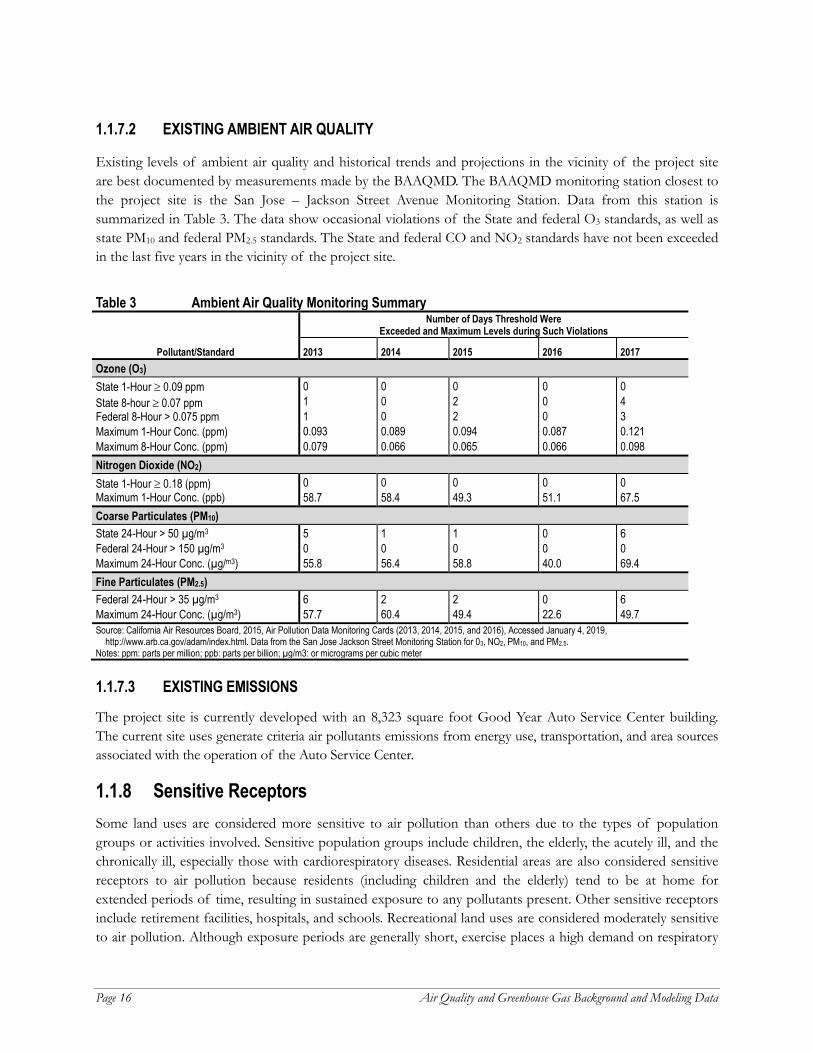
1.1.7.2 EXISTING AMBIENT AIR QUALITY
Existing levels of ambient air quality and historical trends and projections in the vicinity of the project site are best documented by measurements made by the BAAQMD. The BAAQMD monitoring station closest to the project site is the San Jose – Jackson Street Avenue Monitoring Station. Data from this station is summarized in Table 3. The data show occasional violations of the State and federal O3 standards, as well as state PM10 and federal PM2.5 standards. The State and federal CO and NO2 standards have not been exceeded in the last five years in the vicinity of the project site.
Table 3 Ambient Air Quality Monitoring Summary
Pollutant/Standard
Number of Days Threshold Were Exceeded and Maximum Levels during Such Violations
2013 2014 2015 2016 2017 Ozone (O3) State 1-Hour ≥ 0.09 ppm State 8-hour ≥ 0.07 ppm Federal 8-Hour > 0.075 ppm Maximum 1-Hour Conc. (ppm) Maximum 8-Hour Conc. (ppm)
0 1 1 0.093 0.079
0 0 0 0.089 0.066
0 2 2 0.094 0.065
0 0 0 0.087 0.066
0 4 3 0.121 0.098
Nitrogen Dioxide (NO2) State 1-Hour ≥ 0.18 (ppm) Maximum 1-Hour Conc. (ppb)
0 58.7
0 58.4
0 49.3
0 51.1
0 67.5
Coarse Particulates (PM10) State 24-Hour > 50 µg/m3
Federal 24-Hour > 150 µg/m3 Maximum 24-Hour Conc. (µg/m3)
5 0 55.8
1 0 56.4
1 0 58.8
0 0 40.0
6 0 69.4
Fine Particulates (PM2.5) Federal 24-Hour > 35 µg/m3 Maximum 24-Hour Conc. (µg/m3)
6 57.7
2 60.4
2 49.4
0 22.6
6 49.7
Source: California Air Resources Board, 2015, Air Pollution Data Monitoring Cards (2013, 2014, 2015, and 2016), Accessed January 4, 2019, http://www.arb.ca.gov/adam/index.html. Data from the San Jose Jackson Street Monitoring Station for 03, NO2, PM10, and PM2.5.
Notes: ppm: parts per million; ppb: parts per billion; µg/m3: or micrograms per cubic meter 1.1.7.3 EXISTING EMISSIONS
The project site is currently developed with an 8,323 square foot Good Year Auto Service Center building. The current site uses generate criteria air pollutants emissions from energy use, transportation, and area sources associated with the operation of the Auto Service Center.
1.1.8 Sensitive Receptors Some land uses are considered more sensitive to air pollution than others due to the types of population groups or activities involved. Sensitive population groups include children, the elderly, the acutely ill, and the chronically ill, especially those with cardiorespiratory diseases. Residential areas are also considered sensitive receptors to air pollution because residents (including children and the elderly) tend to be at home for extended periods of time, resulting in sustained exposure to any pollutants present. Other sensitive receptors include retirement facilities, hospitals, and schools. Recreational land uses are considered moderately sensitive to air pollution. Although exposure periods are generally short, exercise places a high demand on respiratory

Air Quality and Greenhouse Gas Background and Modeling Data Page 17
functions, which can be impaired by air pollution. In addition, noticeable air pollution can detract from the enjoyment of recreation. Industrial, commercial, retail, and office areas are considered the least sensitive to air pollution. Exposure periods are relatively short and intermittent, since the majority of the workers tend to stay indoors most of the time. In addition, the working population is generally the healthiest segment of the population.
The nearest sensitive receptors are the multi-family residences at the Aviare Apartments to the east of the project site. These residences are approximately 140 feet east of the project site.
1.2 METHODOLOGY The BAAQMD “CEQA Air Quality Guidelines” were prepared to assist in the evaluation of air quality impacts of projects and plans proposed in the Bay Area. The guidelines provide recommended procedures for evaluating potential air impacts during the environmental review process, consistent with CEQA requirements, and include recommended thresholds of significance, mitigation measures, and background air quality information. They also include recommended assessment methodologies for air toxics, odors, and greenhouse gas emissions. In June 2010, the BAAQMD's Board of Directors adopted CEQA thresholds of significance and an update of the CEQA Guidelines. In May 2011, the updated BAAQMD CEQA Air Quality Guidelines were amended to include a risk and hazards threshold for new receptors and modified procedures for assessing impacts related to risk and hazard impacts; however, this later amendment regarding risk and hazards was the subject of the December 17, 2015 Supreme Court decision (California Building Industry Association v BAAQMD), which clarified that CEQA does not require an evaluation of impacts of the environment on a project.25
1.2.1 Criteria Air Pollutant Emissions The proposed project qualifies as a project-level project under BAAQMD’s criteria. For project-level analyses, BAAQMD has adopted screening criteria and significance criteria that would be applicable to the proposed project. If a project exceeds the screening level, it would be required to conduct a full analysis using BAAQMD’s significance criteria.
25 On March 5, 2012, the Alameda County Superior Court issued a judgment finding that the BAAQMD had failed to comply
with CEQA when it adopted the thresholds of significance in the BAAQMD CEQA Air Quality Guidelines. The court did not determine whether the thresholds of significance were valid on their merits, but found that the adoption of the thresholds was a project under CEQA. The court issued a writ of mandate ordering the BAAQMD to set aside the thresholds and cease dissemination of them until the BAAQMD complied with CEQA. Following the court’s order, the BAAQMD released revised CEQA Air Quality Guidelines in May of 2012 that include guidance on calculating air pollution emissions, obtaining information regarding the health impacts of air pollutants, and identifying potential mitigation measures, and which set aside the significance thresholds. The Alameda County Superior Court, in ordering BAAQMD to set aside the thresholds, did not address the merits of the science or evidence supporting the thresholds, and in light of the subsequent case history discussed below, the science and reasoning contained in the BAAQMD 2011 CEQA Air Quality Guidelines provide the latest state-of-the-art guidance available. On August 13, 2013, the First District Court of Appeal ordered the trial court to reverse the judgment and upheld the BAAQMD’s CEQA Guidelines. (California Building Industry Association versus BAAQMD, Case No. A135335 and A136212 (Court of Appeal, First District, August 13, 2013).)

Page 18 Air Quality and Greenhouse Gas Background and Modeling Data
Regional Significance Criteria
BAAQMD’s criteria for regional significance for projects that exceed the screening thresholds are shown in Table 4. Criteria for both construction and operational phases of the project are shown.
Table 4 BAAQMD Regional (Mass Emissions) Criteria Air Pollutant Significance Thresholds
Pollutant
Construction Phase Operational Phase Average Daily Emissions
(lbs/day) Average Daily Emissions
(lbs/day) Maximum Annual Emissions
(Tons/year) ROG 54 54 10
NOx 54 54 10
PM10 82 (Exhaust) 82 15
PM2.5 54 (Exhaust) 54 10
PM10 and PM2.5 Fugitive Dust Best Management Practices None None Source: Bay Area Air Quality Management District. 2017, May. California Environmental Quality Act Air Quality Guidelines, Appendix D: Threshold of Significance
Justification.
Local CO Hotspots
Congested intersections have the potential to create elevated concentrations of CO, referred to as CO hotspots. The significance criteria for CO hotspots are based on the California AAQS for CO, which is 9.0 ppm (8-hour average) and 20.0 ppm (1-hour average). However, with the turnover of older vehicles, introduction of cleaner fuels, and implementation of control technology, the SFBAAB is in attainment of the California and National AAQS, and CO concentrations in the SFBAAB have steadily declined. Because CO concentrations have improved, BAAQMD does not require a CO hotspot analysis if the following criteria are met:
Project is consistent with an applicable congestion management program established by the County Congestion Management Agency for designated roads or highways, the regional transportation plan, and local congestion management agency plans.
The project would not increase traffic volumes at affected intersections to more than 44,000 vehicles per hour.
The project traffic would not increase traffic volumes at affected intersection to more than 24,000 vehicles per hour where vertical and/or horizontal mixing is substantially limited (e.g. tunnel, parking garage, bridge underpass, natural or urban street canyon, below-grade roadway).26
Odors
BAAQMD’s thresholds for odors are qualitative based on BAAQMD’s Regulation 7, Odorous Substances. This rule places general limitations on odorous substances and specific emission limitations on certain odorous compounds. In addition, odors are also regulated under BAAQMD Regulation 1, Rule 1-301, Public Nuisance, which states that no person shall discharge from any source whatsoever such quantities of air
26 Bay Area Air Quality Management District. 2017, May. California Environmental Quality Act Air Quality Guidelines, Appendix D: Threshold of Significance Justification.
Air Quality and Greenhouse Gas Background and Modeling Data Page 19
contaminants or other material which cause injury, detriment, nuisance or annoyance to any considerable number of persons or the public; or which endangers the comfort, repose, health or safety of any such persons or the public, or which causes, or has a natural tendency to cause, injury or damage to business or property. Under BAAQMD’s Rule 1-301, a facility that receives three or more violation notices within a 30-day period can be declared a public nuisance. BAAQMD has established odor screening thresholds for land uses that have the potential to generate substantial odor complaints, including wastewater treatment plants, landfills or transfer stations, composting facilities, confined animal facilities, food manufacturing, and chemical plants.27
1.2.2 Toxic Air Contaminants The BAAQMD’s significance thresholds for local community risk and hazard impacts apply to the siting of a new source. Local community risk and hazard impacts are associated with TACs and PM2.5 because emissions of these pollutants can have significant health impacts at the local level. The purpose of this environmental evaluation is to identify the significant effects of the proposed project on the environment, not the significant effects of the environment on the proposed project (California Building Industry Association v. Bay Area Air Quality Management District [2015] 62 Cal.4th 369 [Case No. S213478]). CEQA does not require an environmental evaluation to analyze the environmental effects of attracting development and people to an area. However, the environmental evaluation must analyze the impacts of environmental hazards on future users when the proposed project exacerbates an existing environmental hazard or condition or if there is an exception to this exemption identified in the Public Resources Code. Schools, residential, commercial, and office uses do not use substantial quantities of TACs and typically do not exacerbate existing hazards, so these thresholds are typically applied to new industrial projects.
For assessing community risk and hazards, sources within a 1,000-foot radius are considered. Sources are defined as freeways, high volume roadways (with volume of 10,000 vehicles or more per day or 1,000 trucks per day), and permitted sources.28,29
The proposed project would generate TACs and PM2.5 during construction activities that could elevate concentrations of air pollutants at the surrounding residential receptors. The BAAQMD has adopted screening tables for air toxics evaluation during construction.30 Construction-related TAC and PM2.5 impacts should be addressed on a case-by-case basis, taking into consideration the specific construction-related characteristics of each project and proximity to off-site receptors, as applicable.31
The project threshold identified below is applied to the proposed project’s construction phase emissions:
27 Bay Area Air Quality Management District. 2017, May. California Environmental Quality Act Air Quality Guidelines.
28 Bay Area Air Quality Management District. 2017, May. California Environmental Quality Act Air Quality Guidelines, Appendix D: Threshold of Significance Justification.
29 Bay Area Air Quality Management District. 2012. Recommended Methods for Screening and Modeling Local Risks and Hazards. 30 Bay Area Air Quality Management District. 2010. Screening Tables for Air Toxics Evaluations during Construction. 31 Bay Area Air Quality Management District. 2017, May. California Environmental Quality Act Air Quality Guidelines, Appendix D: Threshold of Significance Justification.
Page 20 Air Quality and Greenhouse Gas Background and Modeling Data
Community Risk and Hazards – Project
Project-level construction emissions of TACs or PM2.5 from the proposed project to individual sensitive receptors within 1,000 feet of the project site that exceed any of the thresholds listed below are considered a potentially significant community health risk:
Non-compliance with a qualified Community Risk Reduction Plan;
An excess cancer risk level of more than 10 in one million, or a non-cancer (i.e. chronic or acute) hazard index greater than 1.0 would be a significant cumulatively considerable contribution;
An incremental increase of greater than 0.3 micrograms per cubic meter (µg/m3) annual average PM2.5 from a single source would be a significant, cumulatively considerable contribution.32
Community Risk and Hazards – Cumulative
Cumulative sources represent the combined total risk values of each of the individual sources within the 1,000-foot evaluation zone.
A project would have a cumulative considerable impact if the aggregate total of all past, present, and foreseeable future sources within a 1,000-foot radius from the fence line of a source or location of a receptor, plus the contribution from the project, exceeds the following:
Non-compliance with a qualified Community Risk Reduction Plan; or
An excess cancer risk levels of more than 100 in one million or a chronic non-cancer hazard index (from all local sources) greater than 10.0; or
0.8 µg/m3 annual average PM2.5.33
Current BAAQMD guidance recommends the determination of cancer risks using the Office of Environmental Health Hazard Assessment’s (OEHHA) methodology, which was originally adopted in 2003.34,35 In February 2015, OEHHA adopted new health risk assessment guidance which includes several efforts to be more protective of children’s health. These updated procedures include the use of age sensitivity factors to account for the higher sensitivity of infants and young children to cancer causing chemicals, and age-specific breathing rates.36 However, BAAQMD has not formally adopted the new OEHHA methodology into their CEQA guidance. To be conservative, the cancer risks associated with project implementation and significance conclusions were determined using the new 2015 OEHHA guidance for risk assessments.
32 Bay Area Air Quality Management District. 2017, May. California Environmental Quality Act Air Quality Guidelines, Appendix D: Threshold of Significance Justification. 33 Ibid.
34 Bay Area Air Quality Management District. 2012, Recommended Methods for Screening and Modeling Local Risks and Hazards.
35 Office of Environmental Health Hazard Assessment. 2003. Air Toxics Hot Spots Program Guidance Manual for Preparation of Health Risk Assessments.
36 Office of Environmental Health Hazard Assessment. 2015. Air Toxics Hot Spots Program Guidance Manual for Preparation of Health Risk Assessments.
Air Quality and Greenhouse Gas Background and Modeling Data Page 21
2. Greenhouse Gas Emissions Scientists have concluded that human activities are contributing to global climate change by adding large amounts of heat-trapping gases, known as GHG, to the atmosphere. The primary source of these GHG is fossil fuel use. The Intergovernmental Panel on Climate Change (IPCC) has identified four major GHG—water vapor, carbon dioxide (CO2), methane (CH4), and ozone (O3)—that are the likely cause of an increase in global average temperatures observed within the 20th and 21st centuries. Other GHG identified by the IPCC that contribute to global warming to a lesser extent include nitrous oxide (N2O), sulfur hexafluoride (SF6), hydrofluorocarbons, perfluorocarbons, and chlorofluorocarbons.37,38,39 The major GHG are briefly described below.
Carbon dioxide (CO2) enters the atmosphere through the burning of fossil fuels (oil, natural gas, and coal), solid waste, trees and wood products, and respiration, and also as a result of other chemical reactions (e.g. manufacture of cement). Carbon dioxide is removed from the atmosphere (sequestered) when it is absorbed by plants as part of the biological carbon cycle.
Methane (CH4) is emitted during the production and transport of coal, natural gas, and oil. Methane emissions also result from livestock and other agricultural practices and from the decay of organic waste in municipal landfills and water treatment facilities.
Nitrous oxide (N2O) is emitted during agricultural and industrial activities as well as during combustion of fossil fuels and solid waste.
Fluorinated gases are synthetic, strong GHGs that are emitted from a variety of industrial processes. Fluorinated gases are sometimes used as substitutes for ozone-depleting substances. These gases are typically emitted in smaller quantities, but because they are potent GHGs, they are sometimes referred to as high global warming potential (GWP) gases.
Chlorofluorocarbons (CFCs) are GHGs covered under the 1987 Montreal Protocol and used for refrigeration, air conditioning, packaging, insulation, solvents, or aerosol propellants. Since they are not destroyed in the lower atmosphere (troposphere, stratosphere), CFCs drift into the upper atmosphere where, given suitable conditions, they break down ozone. These gases are also ozone-depleting gases and are therefore being replaced by other compounds that are GHGs covered under the Kyoto Protocol.
• Hydrofluorocarbons (HFCs) contain only hydrogen, fluorine, and carbon atoms. They were introduced as alternatives to ozone-depleting substances to serve many industrial,
37 Intergovernmental Panel on Climate Change, 2001. Third Assessment Report: Climate Change 2001, New York: Cambridge University Press. 38 Water vapor (H2O) is the strongest GHG and the most variable in its phases (vapor, cloud droplets, ice crystals). However, water vapor is not considered a pollutant because it is considered part of the feedback loop of changing radiative forcing rather than a primary cause of change. 39 Black carbon contributes to climate change both directly, by absorbing sunlight, and indirectly, by depositing on snow (making it melt faster) and by interacting with clouds and affecting cloud formation. Black carbon is the most strongly light-absorbing component of particulate matter (PM) emitted from burning fuels such as coal, diesel, and biomass. Reducing black carbon emissions globally can have immediate economic, climate, and public health benefits. California has been an international leader in reducing emissions of black carbon, with close to 95 percent control expected by 2020 due to existing programs that target reducing PM from diesel engines and burning activities. However, state and national GHG inventories do not include black carbon yet due to ongoing work related to resolving the precise global warming potential of black carbon. Guidance for CEQA documents does not yet include black carbon.

Page 22 Air Quality and Greenhouse Gas Background and Modeling Data
commercial, and personal needs. HFCs are emitted as by-products of industrial processes and are also used in manufacturing. They do not significantly deplete the stratospheric ozone layer, but they are strong GHGs.
• Perfluorocarbons (PFCs) are a group of human-made chemicals composed of carbon and fluorine only. These chemicals (predominantly perfluoromethane [CF4] and perfluoroethane [C2F6]) were introduced, along with HFCs, as alternatives to the ozone-depleting substances. In addition, PFCs are emitted as by-products of industrial processes and are used in manufacturing. PFCs do not harm the stratospheric ozone layer, but they have a high global warming potential.
• Sulfur Hexafluoride (SF6) is a colorless gas, soluble in alcohol and ether and slightly soluble in water. SF6 is a strong GHG used primarily in electrical transmission and distribution systems as an insulator.
• Hydrochlorofluorocarbons (HCFCs) contain hydrogen, fluorine, chlorine, and carbon atoms. Although ozone-depleting substances, they are less potent at destroying stratospheric ozone than CFCs. They have been introduced as temporary replacements for CFCs and are also GHGs. 40,41
GHGs are dependent on the lifetime, or persistence, of the gas molecule in the atmosphere. Some GHGs have a stronger greenhouse effect than others. These are referred to as high global warming potential (GWP) gases. Table 5 lists the GHG and their relative GWP compared to CO2. The GWP is used to convert GHGs to CO2-equivalent (CO2e) to show the relative potential that different GHGs have to retain infrared radiation in the atmosphere and contribute to the greenhouse effect. For example, under IPCC’s Second Assessment Report, GWP values for CH4 are such that a project generating 10 metric tons (MT) of CH4 would be equivalent to 210 MT of CO2.
40 United States Environmental Protection Agency. 2015. Overview of Greenhouse Gases. http://www3.epa.gov/climatechange/ghgemissions/gases.html. 41 Intergovernmental Panel on Climate Change. 2001. Third Assessment Report: Climate Change 2001, New York: Cambridge University Press.

Air Quality and Greenhouse Gas Background and Modeling Data Page 23
Table 5 GHG Emissions and their Relative Global Warming Potential Compared to CO2
GHGs
Second Assessment Report Atmospheric
Lifetime (Years)
Fourth Assessment Report Atmospheric Lifetime
(Years)
Second Assessment Report
Global Warming Potential Relative to CO2a
Fourth Assessment Report
Global Warming Potential Relative to CO2a
Carbon Dioxide (CO2) 50 to 200 50 to 200 1 1 Methaneb (CH4) 12 (±3) 12 21 25 Nitrous Oxide (N2O) 120 114 310 298 Source: Intergovernmental Panel on Climate Change, 1996, Second Assessment Report: Climate Change 1996, New York: Cambridge University Press; and
Intergovernmental Panel on Climate Change, 2007, Fourth Assessment Report: Climate Change 2001, New York: Cambridge University Press. Notes: The IPCC has published updated global warming potential (GWP) values in its Fifth Assessment Report (2013) that reflect new information on atmospheric lifetimes
of GHGs and an improved calculation of the radiative forcing of CO2. However, GWP values identified in the Second Assessment Report are still used by SCAQMD to maintain consistency in GHG emissions modeling. In addition, the 2008 Scoping Plan was based on the GWP values in the Second Assessment Report.
a Based on 100-year time horizon of the GWP of the air pollutant relative to CO2. b The methane GWP includes direct effects and indirect effects due to the production of tropospheric ozone and stratospheric water vapor. The indirect effect due to the
production of CO2 is not included.
2.1 CALIFORNIA’S GREENHOUSE GAS SOURCES AND RELATIVE CONTRIBUTION
In 2018, the statewide GHG emissions inventory was updated for 2000 to 2016 emissions using the GWPs in IPCC’s AR4.42 Based on these GWPs, California produced 429.4 MMTCO2e GHG emissions in 2016. California’s transportation sector was the single largest generator of GHG emissions, producing 40.5 percent of the state’s total emissions. Industrial sector emissions made up 23.4 percent, and electric power generation made up 16.1 percent of the state’s emissions inventory. Other major sectors of GHG emissions include commercial and residential (12.0 percent), agriculture and forestry (7.9 percent) and other (solvents and chemicals) at 0.2 percent.43
California’s GHG emissions have followed a declining trend since 2007. In 2016, emissions from routine GHG emitting activities statewide were 429 MMTCO2e, 12 MMTCO2e lower than 2015 levels or 12 MMTCO2e lower than 2015 levels. This represents an overall decrease of 13 percent since peak levels in 2004 and 2 MMTCO2e below the 1990 level and the State’s 2020 GHG target. During the 2000 to 2016 period, per capita GHG emissions in California have continued to drop from a peak in 2001 of 14.0 MTCO2e per capita to 10.8 MTCO2e per capita in 2016, a 23 percent decrease. Overall trends in the inventory also demonstrate that the carbon intensity of California’s economy (the amount of carbon pollution per million dollars of gross domestic product (GDP)) is declining, representing a 38 percent decline since the 2001 peak, while the state’s GDP has grown 41 percent during this period.44
2.2 HUMAN INFLUENCE ON CLIMATE CHANGE For approximately 1,000 years before the Industrial Revolution, the amount of GHGs in the atmosphere remained relatively constant. During the 20th century, however, scientists observed a rapid change in the
42 Methodology for determining the statewide GHG inventory is not the same as the methodology used to determine statewide GHG emissions under Assembly Bill 32 (2006). 43 California Air Resources Board, 2018, 2018 Edition California Greenhouse Gas Inventory for 2000-2016: By Category as Defined in the 2008 Scoping Plan, https://www.arb.ca.gov/cc/inventory/data/data.htm, accessed November 20, 2018.
44 California Air Resources Board, 2018, California Greenhouse Emissions for 2000 to 2016 – Trends of Emissions and Other Indicators, https://www.arb.ca.gov/cc/inventory/data/data.htm, accessed November 20, 2018.

Page 24 Air Quality and Greenhouse Gas Background and Modeling Data
climate and the quantity of climate change pollutants in the Earth’s atmosphere that is attributable to human activities. The amount of CO2 in the atmosphere has increased by more than 35 percent since preindustrial times and has increased at an average rate of 1.4 parts per million per year since 1960, mainly due to combustion of fossil fuels and deforestation.45 These recent changes in the quantity and concentration of climate change pollutants far exceed the extremes of the ice ages, and the global mean temperature is warming at a rate that cannot be explained by natural causes alone. Human activities are directly altering the chemical composition of the atmosphere through the buildup of climate change pollutants.46 In the past, gradual changes in the earth’s temperature changed the distribution of species, availability of water, etc. However, human activities are accelerating this process so that environmental impacts associated with climate change no longer occur in a geologic time frame but within a human lifetime.47
Like the variability in the projections of the expected increase in global surface temperatures, the environmental consequences of gradual changes in the Earth’s temperature are hard to predict. Projections of climate change depend heavily upon future human activity. Therefore, climate models are based on different emission scenarios that account for historical trends in emissions and on observations of the climate record that assess the human influence of the trend and projections for extreme weather events. Climate-change scenarios are affected by varying degrees of uncertainty. For example, there are varying degrees of certainty on the magnitude of the trends for:
Warmer and fewer cold days and nights over most land areas.
Warmer and more frequent hot days and nights over most land areas. An increase in frequency of warm spells/heat waves over most land areas.
An increase in frequency of heavy precipitation events (or proportion of total rainfall from heavy falls) over most areas.
Larger areas affected by drought. Intense tropical cyclone activity increases. Increased incidence of extreme high sea level (excluding tsunamis).
2.3 POTENTIAL CLIMATE CHANGE IMPACTS FOR CALIFORNIA Observed changes over the last several decades across the western United States reveal clear signs of climate change. Statewide average temperatures increased by about 1.7 degrees Fahrenheit (°F) from 1895 to 2011, and warming has been greatest in the Sierra Nevada. The years from 2014 through 2016 have shown unprecedented temperatures with 2014 being the warmest. By 2050, California is projected to warm by approximately 2.7°F above 2000 averages, a threefold increase in the rate of warming over the last century. By 2100, average temperatures could increase by 4.1 to 8.6°F, depending on emissions levels.
In California and western North America, observations of the climate have shown: 1) a trend toward warmer winter and spring temperatures; 2) a smaller fraction of precipitation falling as snow; 3) a decrease in the amount of spring snow accumulation in the lower and middle elevation mountain zones; 4) advanced shift in
45 Intergovernmental Panel on Climate Change, 2007, Fourth Assessment Report: Climate Change 2007, New York: Cambridge University Press. 46 California Climate Action Team, 2006, Climate Action Team Report to Governor Schwarzenegger and the Legislature. 47 Intergovernmental Panel on Climate Change, 2007, Fourth Assessment Report: Climate Change 2007, New York: Cambridge University Press.

Air Quality and Greenhouse Gas Background and Modeling Data Page 25
the timing of snowmelt of 5 to 30 days earlier in the spring; and 5) a similar shift (5 to 30 days earlier) in the timing of spring flower blooms. Overall, California has become drier over time with 5 of the 5 years of severe to extreme drought occurring between 2007 and 2016, with unprecedented dry years occurring in 2015 and 2015. Statewide precipitation has become increasingly variable from year to year with the driest consecutive 4 years occurring from 2012 to 2015. According to the California Climate Action Team—a committee of state agency secretaries and the heads of agencies, boards, and departments, led by the Secretary of the California Environmental Protection Agency—even if actions could be taken to immediately curtail climate change emissions, the potency of emissions that have already built up, their long atmospheric lifetimes (see Table 4.6-1), and the inertia of the Earth’s climate system could produce as much as 0.6 degrees Celsius (°C) (1.1°F) of additional warming. Consequently, some impacts from climate change are now considered unavoidable. Global climate change risks to California are shown in Table 4.6-2 and include impacts to public health, water resources, agriculture, coastal sea level, forest and biological resources, and energy.
Specific climate change impacts that could affect the project include:
Water Resources Impacts. By late-century, all projections show drying, and half of the projections suggest 30-year average precipitation will decline by more than 10 percent below the historical average. This drying trend is caused by an apparent decline in the frequency of rain and snowfall. Even in projections with relatively small or no declines in precipitation, central and southern parts of the State can be expected to be drier from the warming effects alone as the spring snowpack will melt sooner, and the moisture contained in soils will evaporate during long dry summer months.48
Wildfire Risks. Earlier snowmelt, higher temperatures and longer dry periods over a longer fire season will directly increase wildfire risk. Indirectly, wildfire risk will also be influenced by potential climate-related changes in vegetation and ignition potential from lightning. Human activities will continue to be the biggest factor in ignition risk. The number of large fires statewide are estimated to increase from 58 percent to 128 percent above historical levels by 2085. Under the same emissions scenario, estimated burned area will increase by 57 percent to 169 percent, depending on location.49
Health Impacts. Many of the gravest threats to public health in California stem from the increase of extreme conditions, principally more frequent, more intense, and longer heat waves. Particular concern centers on the increasing tendency for multiple hot days in succession, and heat waves occurring simultaneously in several regions throughout the State. Public health could also be affected by climate change impacts on air quality, food production, the amount and quality of water supplies, energy pricing and availability, and the spread of infectious diseases. Higher temperatures also increase ground-level ozone levels. Furthermore, wildfires can increase particulate air pollution in the major air basins of California.50
48 California Climate Change Center. 2012. Our Changing Climate 2012, Vulnerability & Adaptation to the Increasing Risks from
Climate Change in California. July. 49 California Council on Science and Technology, 2012, California’s Energy Future: Portraits of Energy Systems for Meeting
Greenhouse Gas Reduction Targets. https://ccst.us/wp-content/uploads/2012ghg.pdf, accessed November 21, 2018. 50 California Council on Science and Technology,2012, California’s Energy Future: Portraits of Energy Systems for Meeting
Greenhouse Gas Reduction Targets, https://ccst.us/wp-content/uploads/2012ghg.pdf, accessed November 21, 2018.

Page 26 Air Quality and Greenhouse Gas Background and Modeling Data
Table 6 Summary of GHG Emissions Risks to California Impact Category Potential Risk
Public Health Impacts Heat waves will be more frequent, hotter, and longer Poor air quality made worse Higher temperatures increase ground-level ozone levels
Water Resources Impacts
Decreasing Sierra Nevada snow pack Challenges in securing adequate water supply Potential reduction in hydropower Loss of winter recreation
Agricultural Impacts
Increasing temperature Increasing threats from pests and pathogens Expanded ranges of agricultural weeds Declining productivity Irregular blooms and harvests
Coastal Sea Level Impacts
Accelerated sea level rise Increasing coastal floods Shrinking beaches Worsened impacts on infrastructure
Forest and Biological Resource Impacts
Increased risk and severity of wildfires Lengthening of the wildfire season Movement of forest areas Conversion of forest to grassland Declining forest productivity Increasing threats from pest and pathogens Shifting vegetation and species distribution Altered timing of migration and mating habits Loss of sensitive or slow-moving species
Energy Demand Impacts Potential reduction in hydropower Increased energy demand
Sources: California Climate Change Center, 2012, Our Changing Climate 2012: Vulnerability and Adaptation to the Increasing Risks from Climate Change in California; California Energy Commission, 2006, Our Changing Climate: Assessing the Risks to California, 2006 Biennial Report, CEC-500-2006-077; California Energy Commission, 2009, The Future Is Now: An Update on Climate Change Science, Impacts, and Response Options for California. CEC-500-2008-0077; California Natural Resources Agency, 2014, Safeguarding California: Reducing Climate Risk, An Update to the 2009 California Climate Adaptation Strategy.
Increase Energ y Demand. Increases in average temperature and higher frequency of extreme heat events combined with new residential development across the State will drive up the demand for cooling in the increasingly hot and longer summer season and decrease demand for heating in the cooler season. Warmer, drier summers also increase system losses at natural gas plants (reduced efficiency in the electricity generation process from higher temperatures) and hydropower plants (lower reservoir levels). Transmission of electricity will also be affected by climate change. Transmission lines lose 7 percent to 8 percent of transmitting capacity in high temperatures while needing to transport greater loads. This means that more electricity needs to be produced to make up for the loss in capacity and the growing demand.51
51 California Council on Science and Technology,2012, California’s Energy Future: Portraits of Energy Systems for Meeting
Greenhouse Gas Reduction Targets, https://ccst.us/wp-content/uploads/2012ghg.pdf, accessed November 21, 2018.

Air Quality and Greenhouse Gas Background and Modeling Data Page 27
2.1 REGULATORY FRAMEWORK 2.1.1 Federal Regulations The U.S. Environmental Protection Agency (EPA) announced on December 7, 2009, that GHG emissions threaten the public health and welfare of the American people and that GHG emissions from on-road vehicles contribute to that threat. The EPA’s final findings respond to the 2007 U.S. Supreme Court decision that GHG emissions fit within the Clean Air Act definition of air pollutants. The findings do not in and of themselves impose any emission reduction requirements, but allow the EPA to finalize the GHG standards proposed in 2009 for new light-duty vehicles as part of the joint rulemaking with the Department of Transportation.52
The EPA’s endangerment finding covers emissions of six key GHGs—CO2, CH4, N2O, hydrofluorocarbons, perfluorocarbons, and SF6—that have been the subject of scrutiny and intense analysis for decades by scientists in the United States and around the world. The first three are applicable to the proposed project because they constitute the majority of GHG emissions from the onsite land uses, and per BAAQMD guidance are the GHG emissions that should be evaluated as part of a GHG emissions inventory.
2.1.1.1 US MANDATORY REPORTING RULE FOR GREENHOUSE GASES (2009)
In response to the endangerment finding, the EPA issued the Mandatory Reporting of GHG Rule that requires substantial emitters of GHG emissions (large stationary sources, etc.) to report GHG emissions data. Facilities that emit 25,000 metric tons (MT) or more of CO2 per year are required to submit an annual report.
2.1.1.2 UPDATE TO CORPORATE AVERAGE FUEL ECONOMY STANDARDS (2010/2012)
The current Corporate Average Fuel Economy (CAFE) standards (for model years 2011 to 2016) incorporate stricter fuel economy requirements promulgated by the federal government and California into one uniform standard. Additionally, automakers are required to cut GHG emissions in new vehicles by roughly 25 percent by 2016 (resulting in a fleet average of 35.5 miles per gallon [mpg] by 2016). Rulemaking to adopt these new standards was completed in 2010. California agreed to allow automakers who show compliance with the national program to also be considered to be in compliance with State requirements. The federal government issued new standards in 2012 for model years 2017–2025, which will require a fleet average of 54.5 mpg in 2025. However, the EPA is reexamining the 2017–2025 emissions standards.
2.1.1.3 EPA REGULATION OF STATIONARY SOURCES UNDER THE CLEAN AIR ACT (ONGOING)
Pursuant to its authority under the Clean Air Act (CAA), the EPA has been developing regulations for new stationary sources such as power plants, refineries, and other large sources of emissions. Pursuant to President Obama’s 2013 Climate Action Plan, the EPA was directed to also develop regulations for existing stationary sources. However, the EPA is reviewing the Clean Power Plan under President Trump’s Energy Independence Executive Order.
52 United States Environmental Protection Agency. 2009. EPA: Greenhouse Gases Threaten Public Health and the
Environment, Science overwhelmingly shows greenhouse gas concentrations at unprecedented levels due to human activity, December, http://yosemite.epa.gov/opa/admpress.nsf/0/08D11A451131BCA585257685005BF252.
Page 28 Air Quality and Greenhouse Gas Background and Modeling Data
2.1.2 State Regulations Current State of California guidance and goals for reductions in GHG emissions are generally embodied in Executive Order S-03-05, Executive Order B-30-15, Assembly Bill 32, Senate Bill 32, and Senate Bill 375.
2.1.2.1 EXECUTIVE ORDER S-03-05
Executive Order S-03-05, signed June 1, 2005. Executive Order S-03-05 set the following GHG reduction targets for the State:
2000 levels by 2010
1990 levels by 2020 80 percent below 1990 levels by 2050
2.1.2.2 ASSEMBLY BILL 32, THE GLOBAL WARMING SOLUTIONS ACT
AB 32 was passed by the California state legislature on August 31, 2006, to place the state on a course toward reducing its contribution of GHG emissions. AB 32 follows the 2020 tier of emissions reduction targets established in Executive Order S-03-05. Under AB 32, California Air Resources Board (CARB) prepared the 2008 Climate Change Scoping Plan, the 2014 Climate Change Scoping Plan, and the 2017 Climate Change Scoping Plan, which are discussed below.
CARB 2008 Scoping Plan
The final Scoping Plan was adopted by CARB on December 11, 2008. The 2008 Scoping Plan identified that GHG emissions in California are anticipated to be 596 MMTCO2e in 2020. In December 2007, CARB approved a 2020 emissions limit of 427 MMTCO2e (471 million tons) for the state. In order to effectively implement the emissions cap, AB 32 directed CARB to establish a mandatory reporting system to track and monitor GHG emissions levels for large stationary sources that generate more than 25,000 MTCO2e per year, prepare a plan demonstrating how the 2020 deadline can be met, and develop appropriate regulations and programs to implement the plan by 2012.
First Update to the Scoping Plan
CARB completed a five-year update to the 2008 Scoping Plan, as required by AB 32. The First Update to the Scoping Plan, adopted at the May 22, 2014, board hearing, highlights California’s progress toward meeting the near-term 2020 GHG emission reduction goals defined in the 2008 Scoping Plan. As part of the update, CARB recalculated the 1990 GHG emission levels with the updated AR4 GWPs, and the 427 MMTCO2e 1990 emissions level and 2020 GHG emissions limit, established in response to AB 32, are slightly higher at 431 MMTCO2e.53
As identified in the Update to the Scoping Plan, California is on track to meeting the goals of AB 32. However, the update also addresses the state’s longer-term GHG goals in a post-2020 element. The post-2020 element provides a high level view of a long-term strategy for meeting the 2050 GHG goals, including a 53 California Air Resources Board, 2014, First Update to the Climate Change Scoping Plan: Building on the Framework, Pursuant to AB 32, The California Global Warming Solutions Act of 2006, http://www.arb.ca.gov/cc/scopingplan/ scopingplan.htm, accessed November 20, 2018.

Air Quality and Greenhouse Gas Background and Modeling Data Page 29
recommendation for the state to adopt a midterm target. According to the Update to the Scoping Plan, local government reduction targets should chart a reduction trajectory that is consistent with or exceeds the trajectory created by statewide goals.54 CARB identified that reducing emissions to 80 percent below 1990 levels will require a fundamental shift to efficient, clean energy in every sector of the economy. Progressing toward California’s 2050 climate targets will require significant acceleration of GHG reduction rates. Emissions from 2020 to 2050 will have to decline several times faster than the rate needed to reach the 2020 emissions limit.55
2.1.2.3 EXECUTIVE ORDER B-30-15
Executive Order B-30-15, signed April 29, 2015, sets a goal of reducing GHG emissions within the state to 40 percent of 1990 levels by year 2030. Executive Order B-30-15 also directs CARB to update the Scoping Plan to quantify the 2030 GHG reduction goal for the state and requires state agencies to implement measures to meet the interim 2030 goal as well as the long-term goal for 2050 in Executive Order S-03-05. It also requires the Natural Resources Agency to conduct triennial updates of the California adaption strategy, Safeguarding California, in order to ensure climate change is accounted for in state planning and investment decisions.
2.1.2.4 SENATE BILL 32 AND ASSEMBLY BILL 197
In September 2016, Governor Brown signed Senate Bill 32 and Assembly Bill 197 into law, making the Executive Order goal for year 2030 into a statewide mandated legislative target. AB 197 established a joint legislative committee on climate change policies and requires the CARB to prioritize direction emissions reductions rather than the market-based cap-and-trade program for large stationary, mobile, and other sources.
2017 Climate Change Scoping Plan Update
Executive Order B-30-15 and SB 32 required CARB to prepare another update to the Scoping Plan to address the 2030 target for the state. On December 14, 2017, CARB adopted the 2017 Climate Change Scoping Plan Update. The 2017 Climate Change Scoping Plan Update includes the regulations and programs to achieve the 2030 target, including strategies consistent with AB 197 requirements. The 2017 Scoping Plan establishes a new emissions limit of 260 MMTCO2e for the year 2030, which corresponds to a 40 percent decrease in 1990 levels by 2030.56
California’s climate strategy will require contributions from all sectors of the economy, including enhanced focus on zero- and near-zero emission (ZE/NZE) vehicle technologies; continued investment in renewables, such as solar roofs, wind, and other types of distributed generation; greater use of low carbon fuels; integrated land conservation and development strategies; coordinated efforts to reduce emissions of short-lived climate pollutants (methane, black carbon, and fluorinated gases); and an increased focus on integrated 54 California Air Resources Board, 2014, First Update to the Climate Change Scoping Plan: Building on the Framework, Pursuant to AB 32, The California Global Warming Solutions Act of 2006, http://www.arb.ca.gov/cc/scopingplan/scopingplan.htm, accessed November 20, 2018. 55 California Air Resources Board, 2014, First Update to the Climate Change Scoping Plan: Building on the Framework, Pursuant to AB 32, The California Global Warming Solutions Act of 2006, http://www.arb.ca.gov/cc/scopingplan/scopingplan.htm, accessed November 20, 2018. 56 California Air Resources Board. 2017, November. California’s 2017 Climate Change Scoping Plan: The Strategy for Achieving California’s 2030 Greenhouse Gas Target. https://www.arb.ca.gov/cc/scopingplan/2030sp_pp_final.pdf.
Page 30 Air Quality and Greenhouse Gas Background and Modeling Data
land use planning, to support livable, transit-connected communities and conservation of agricultural and other lands. Requirements for GHG reductions at stationary sources complement efforts by the local air districts to tighten criteria air pollutants and TACs emissions limits on a broad spectrum of industrial sources. Major elements of the 2017 Scoping Plan framework include:
Implementing and/or increasing the standards of the Mobile Source Strategy, which include increasing ZEV buses and trucks.
Low Carbon Fuel Standard (LCFS), with an increased stringency (18 percent by 2030).
Implementation of SB 350, which expands the Renewables Portfolio Standard (RPS) to 50 percent RPS and doubles energy efficiency savings by 2030.
California Sustainable Freight Action Plan, which improves freight system efficiency and utilizes NZE technology and deployment of ZEV trucks.
Implementing the proposed Short-Lived Climate Pollutant Strategy, which focuses on reducing methane and hydroflurocarbon emissions by 40 percent and anthropogenic black carbon emissions by 50 percent by year 2030.
Continued implementation of SB 375.
Post-2020 Cap-and-Trade Program that includes declining caps.
Development of a Natural and Working Lands Action Plan to secure California’s land base as a net carbon sink.
In addition to the statewide strategies listed above, the 2017 Climate Change Scoping Plan also identified local governments as essential partners in achieving the state’s long-term GHG reduction goals and identified local actions to reduce GHG emissions. As part of the recommended actions, CARB recommends statewide targets of no more than 6 MTCO2e or less per capita by 2030 and 2 MTCO2e or less per capita by 2050. CARB recommends that local governments evaluate and adopt robust and quantitative locally appropriate goals that align with the statewide per capita targets and the state’s sustainable development objectives, and develop plans to achieve the local goals. The statewide per capita goals were developed by applying the percent reductions necessary to reach the 2030 and 2050 climate goals (i.e., 40 percent and 80 percent, respectively) to the state’s 1990 emissions limit established under AB 32. For CEQA projects, CARB states that lead agencies have the discretion to develop evidence-based numeric thresholds (mass emissions, per capita, or per service population) consistent with the Scoping Plan and the state’s long-term GHG goals. To the degree a project relies on GHG mitigation measures, CARB recommends that lead agencies prioritize on-site design features that reduce emissions, especially from vehicle miles traveled (VMT), and direct investments in GHG reductions in the project’s region that contribute potential air quality, health, and economic co-benefits. Where further project design or regional investments are infeasible or not proven to be effective, CARB recommends mitigating potential GHG impacts through purchasing and retiring carbon credits.
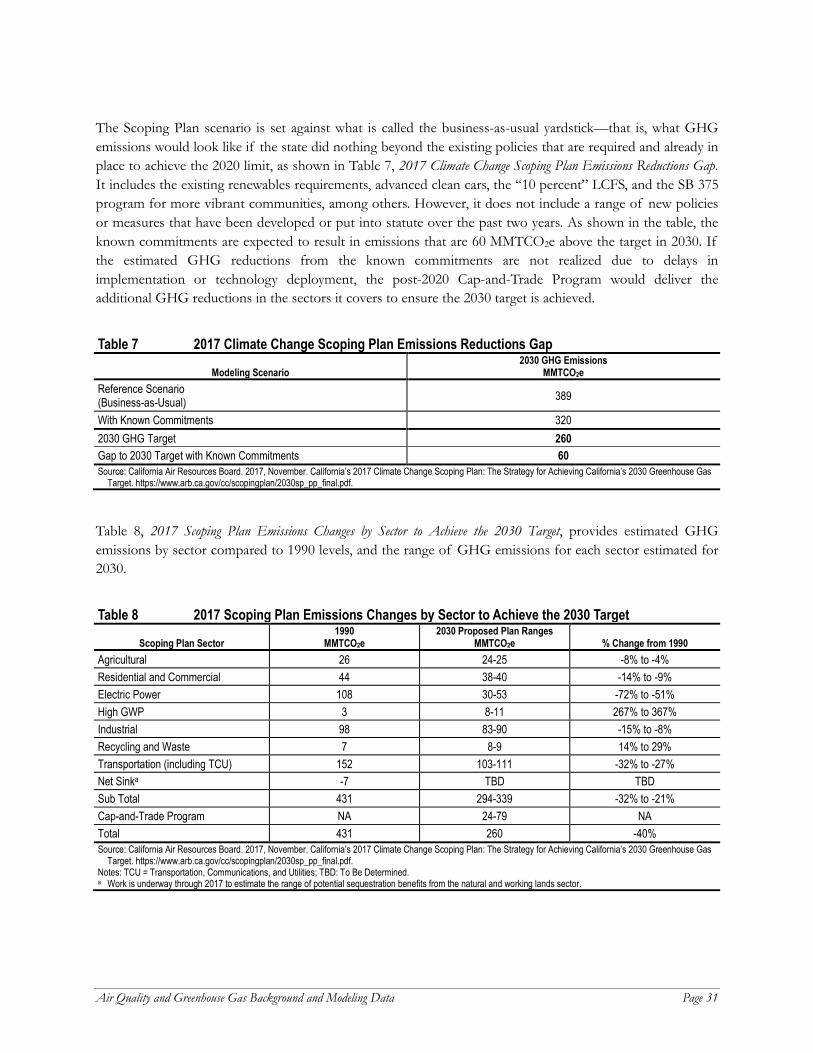
Air Quality and Greenhouse Gas Background and Modeling Data Page 31
The Scoping Plan scenario is set against what is called the business-as-usual yardstick—that is, what GHG emissions would look like if the state did nothing beyond the existing policies that are required and already in place to achieve the 2020 limit, as shown in Table 7, 2017 Climate Change Scoping Plan Emissions Reductions Gap. It includes the existing renewables requirements, advanced clean cars, the “10 percent” LCFS, and the SB 375 program for more vibrant communities, among others. However, it does not include a range of new policies or measures that have been developed or put into statute over the past two years. As shown in the table, the known commitments are expected to result in emissions that are 60 MMTCO2e above the target in 2030. If the estimated GHG reductions from the known commitments are not realized due to delays in implementation or technology deployment, the post-2020 Cap-and-Trade Program would deliver the additional GHG reductions in the sectors it covers to ensure the 2030 target is achieved.
Table 7 2017 Climate Change Scoping Plan Emissions Reductions Gap
Modeling Scenario 2030 GHG Emissions
MMTCO2e Reference Scenario (Business-as-Usual) 389
With Known Commitments 320 2030 GHG Target 260 Gap to 2030 Target with Known Commitments 60 Source: California Air Resources Board. 2017, November. California’s 2017 Climate Change Scoping Plan: The Strategy for Achieving California’s 2030 Greenhouse Gas
Target. https://www.arb.ca.gov/cc/scopingplan/2030sp_pp_final.pdf.
Table 8, 2017 Scoping Plan Emissions Changes by Sector to Achieve the 2030 Target, provides estimated GHG emissions by sector compared to 1990 levels, and the range of GHG emissions for each sector estimated for 2030.
Table 8 2017 Scoping Plan Emissions Changes by Sector to Achieve the 2030 Target
Scoping Plan Sector 1990
MMTCO2e 2030 Proposed Plan Ranges
MMTCO2e % Change from 1990 Agricultural 26 24-25 -8% to -4% Residential and Commercial 44 38-40 -14% to -9% Electric Power 108 30-53 -72% to -51% High GWP 3 8-11 267% to 367% Industrial 98 83-90 -15% to -8% Recycling and Waste 7 8-9 14% to 29% Transportation (including TCU) 152 103-111 -32% to -27% Net Sinka -7 TBD TBD Sub Total 431 294-339 -32% to -21% Cap-and-Trade Program NA 24-79 NA Total 431 260 -40% Source: California Air Resources Board. 2017, November. California’s 2017 Climate Change Scoping Plan: The Strategy for Achieving California’s 2030 Greenhouse Gas
Target. https://www.arb.ca.gov/cc/scopingplan/2030sp_pp_final.pdf. Notes: TCU = Transportation, Communications, and Utilities; TBD: To Be Determined. a Work is underway through 2017 to estimate the range of potential sequestration benefits from the natural and working lands sector.

Page 32 Air Quality and Greenhouse Gas Background and Modeling Data
2.1.2.5 SENATE BILL 375 – SUSTAINABLE COMMUNITIES STRATEGY
SB 375, the Sustainable Communities and Climate Protection Act, was adopted in 2005 to connect the Scoping Plan’s GHG emissions reductions targets for the transportation sector to local land use decisions that affect travel behavior. Its intent is to reduce GHG emissions from light-duty trucks and automobiles (excludes emissions associated with goods movement) by aligning regional long-range transportation plans, investments, and housing allocations to local land use planning to reduce VMT and vehicle trips. Specifically, SB 375 required CARB to establish GHG emissions reduction targets for each of the 18 regions in California managed by a metropolitan planning organization (MPO). The Metropolitan Transportation Commission (MTC) is the MPO for the nine-county San Francisco Bay Area region. MTC’s targets are a 7 percent per capita reduction in GHG emissions from 2005 by 2020, and 15 percent per capita reduction from 2005 levels by 2035.57
2017 Update to the SB 375 Targets
SB 375 requires CARB to periodically update the targets, no later than every 8 years. In June 2017, CARB released updated targets and technical methodology and recently released another update in February 2018. The updated targets consider the need to further reduce VMT, as identified in the draft 2017 Scoping Plan Update, while balancing the need for additional and more flexible revenue sources to incentivize positive planning and action toward sustainable communities. Like the 2010 targets, the updated SB 375 targets are in units of percent per capita reduction in GHG emissions from automobiles and light trucks relative to 2005. This excludes reductions anticipated from implementation of state technology and fuels strategies and any potential future state strategies such as statewide road user pricing. The proposed targets call for greater per capita GHG emission reductions from SB 375 than are currently in place, which for 2035, translate into proposed targets that either match or exceed the emission reduction levels in the MPOs’ currently adopted SCSs. As proposed, CARB staff ’s proposed targets would result in an additional reduction of over 10 MMTCO2e in 2035 compared to the current targets. For the next round of SCS updates, CARB’s updated targets for the MTC/ABAG region are a 10 percent per capita GHG reduction in 2020 from 2005 levels (compared to 7 percent under the 2010 target) and a 19 percent per capita GHG reduction in 2035 from 2005 levels (compared to the 2010 target of 15 percent).58 The updated targets and methodology will take effect on January 1, 2018, and SCS adopted in 2018 and later would be subject to these new targets.
Plan Bay Area, Strategy for a Sustainable Region
Plan Bay Area 2040 is the Bay Area’s RTP/SCS and was adopted jointly by ABAG and MTC on July 26, 2017. It lays out a development scenario for the region, which, when integrated with the transportation network and other transportation measures and policies, would reduce GHG emissions from transportation (excluding goods movement) beyond the per capita reduction targets identified by CARB. Plan Bay Area 2040 is a limited and focused update to the 2013 Plan Bay Area, with updated planning assumptions that incorporate key economic, demographic, and financial trends from the last several years.
57 California Air Resources Board. 2010. Staff Report, Proposed Regional Greenhouse Gas Emission Reduction Targets for Automobiles and Light Trucks Pursuant to Senate Bill 375, August. 58 California Air Resources Board. 2018, February. Proposed Update to the SB 375 Greenhouse Gas Emission Reduction Targets. https://www.arb.ca.gov/cc/sb375/sb375_target_update_final_staff_report_feb2018.pdf.

Air Quality and Greenhouse Gas Background and Modeling Data Page 33
As part of the implementing framework for Plan Bay Area, local governments have identified Priority Development Areas (PDAs) to focus growth. PDAs are transit-oriented, infill development opportunity areas in existing communities. Overall, well over two-thirds of all regional growth in the Bay Area by 2040 is allocated in PDAs. Per the Final Plan Bay Area 2040, while the projected number of new housing units and new jobs within PDAs would increase to 629,000 units and 707,000 jobs compared to the adopted Plan Bay Area 2013, its overall share would be reduced to 77 percent and 55 percent.59 However, Plan Bay Area 2040 remains on track to meet a 16 percent per capita reduction of GHG emissions by 2035 and a 10 percent per capita reduction by 2020 from 2005 conditions.60 The proposed project site is not within a PPA.61
2.1.2.6 OTHER APPLICABLE MEASURES
Transportation
Assembly Bill 1493
California vehicle GHG emission standards were enacted under AB 1493 (Pavley I). Pavley I is a clean-car standard that reduces GHG emissions from new passenger vehicles (light-duty auto to medium-duty vehicles) from 2009 through 2016 and is anticipated to reduce GHG emissions from new passenger vehicles by 30 percent in 2016. California implements the Pavley I standards through a waiver granted to California by the EPA. In 2012, the EPA issued a Final Rulemaking that sets even more stringent fuel economy and GHG emissions standards for model year 2017 through 2025 light-duty vehicles.62 In January 2012, CARB approved the Advanced Clean Cars program (formerly known as Pavley II) for model years 2017 through 2025. The program combines the control of smog, soot, and global warming gases and requirements for greater numbers of zero-emission vehicles into a single package of standards. Under California’s Advanced Clean Car program, by 2025, new automobiles will emit 34 percent fewer global warming gases and 75 percent fewer smog-forming emissions.63
Executive Order S-1-07
On January 18, 2007, the State set a new Low Carbon Fuel Standard (LCFS) for transportation fuels sold in California. Executive Order S-1-07 sets a declining standard for GHG emissions measured in carbon dioxide equivalent gram per unit of fuel energy sold in California. The LCFS requires a reduction of 2.5 percent in the carbon intensity of California’s transportation fuels by 2015 and a reduction of at least 10 percent by 2020. The LCFS applies to refiners, blenders, producers, and importers of transportation fuels and would use 59 Metropolitan Transportation Commission (MTC) and Association of Bay Area Governments (ABAG). 2017, March. Plan Bay Area 2040 Plan. 60 Metropolitan Transportation Commission (MTC) and Association of Bay Area Governments (ABAG). 2017, March. Plan Bay Area 2040 Plan. 61 Associated Bay Area Governments (ABAG). July 2015. Priority Development Area Showcase, http://gis.abag.ca.gov/website/PDAShowcase/. 62 See also the discussion on the update to the CAFE standards under federal laws, above. In January 2012, CARB approved the Advanced Clean Cars program (formerly known as Pavley II) for model years 2017 through 2025. The program combines the control of smog, soot and global warming gases and requirements for greater numbers of zero-emission vehicles into a single package of standards. Under California’s Advanced Clean Car program, by 2025, new automobiles will emit 34 percent fewer global warming gases and 75 percent fewer smog-forming emissions.
63 See also the discussion on the update to the CAFE standards under Federal Laws, above. In January 2012, CARB approved the Advanced Clean Cars program (formerly known as Pavley II) for model years 2017 through 2025. The program combines the control of smog, soot and global warming gases and requirements for greater numbers of zero-emission vehicles into a single package of standards. Under California’s Advanced Clean Car program, by 2025, new automobiles will emit 34 percent fewer global warming gases and 75 percent fewer smog-forming emissions.

Page 34 Air Quality and Greenhouse Gas Background and Modeling Data
market-based mechanisms to allow these providers to choose how they reduce emissions during the “fuel cycle,” using the most economically feasible methods.
Executive Order B-16-2012
On March 23, 2012, the State identified that CARB, the California Energy Commission (CEC), the Public Utilities Commission, and other relevant agencies worked with the Plug-in Electric Vehicle Collaborative and the California Fuel Cell Partnership to establish benchmarks to accommodate zero-emissions vehicles in major metropolitan areas, including infrastructure to support them (e.g. electric vehicle charging stations). The executive order also directs the number of zero-emission vehicles in California’s State vehicle fleet to increase through the normal course of fleet replacement so that at least 10 percent of fleet purchases of light-duty vehicles are zero-emission by 2015 and at least 25 percent by 2020. The executive order also establishes a target for the transportation sector of reducing GHG emissions from the transportation sector 80 percent below 1990 levels.
Renewables Portfolio Standard
Senate Bills 1078, 107, X1-2, and Executive Order S-14-08
A major component of California’s Renewable Energy Program is the renewable portfolio standard (RPS) established under Senate Bills 1078 (Sher) and 107 (Simitian). Under the RPS, certain retail sellers of electricity were required to increase the amount of renewable energy each year by at least 1 percent in order to reach at least 20 percent by December 30, 2010. Executive Order S-14-08 was signed in November 2008, which expanded the State’s Renewable Energy Standard to 33 percent renewable power by 2020. This standard was adopted by the legislature in 2011 (SBX1-2). The increase in renewable sources for electricity production will decrease indirect GHG emissions from development projects because electricity production from renewable sources is generally considered carbon neutral.
Senate Bill 350
Senate Bill 350 (de Leon), was signed into law September 2015. SB 350 establishes tiered increases to the RPS of 40 percent by 2024, 45 percent by 2027, and 50 percent by 2030. SB 350 also set a new goal to double the energy efficiency savings in electricity and natural gas through energy efficiency and conservation measures.
Executive Order B-55-18 and SB 100
SB 100 and Executive Order B-55-18 were signed by Governor Brown on September 10, 2018. Under the existing RPS, 25 percent of retail sales are required to be from renewable sources by December 31, 2016, 33 percent by December 31, 2020, 40 percent by December 31, 2024, 45 percent by December 31, 2027, and 50 percent by December 31, 2030. SB 100 raises California’s RPS requirement to 50 percent renewable resources target by December 31, 2026, and to achieve a 60 percent target by December 31, 2030. SB 100 also requires that retail sellers and local publicly owned electric utilities procure a minimum quantity of electricity products from eligible renewable energy resources so that the total kilowatt hours of those products sold to their retail end-use customers achieve 44 percent of retail sales by December 31, 2024, 52 percent by December 31, 2027, and 60 percent by December 31, 2030.
Air Quality and Greenhouse Gas Background and Modeling Data Page 35
In addition to targets under AB 32 and SB32, Executive Order B-55-18 establishes a carbon neutrality goal for the state of California by 2045; and sets a goal to maintain net negative emissions thereafter. The Executive Order directs the California Natural Resources Agency, CalEPA, the Department of Food and Agriculture, and CARB to include sequestration targets in the Natural and Working Lands Climate Change Implementation Plan consistent with the carbon neutrality goal.
Energy Efficiency
California Building Standards Code – Building Energy Efficiency Standards
Energy conservation standards for new residential and nonresidential buildings were adopted by the California Energy Resources Conservation and Development Commission (now the CEC) in June 1977 and most recently revised in 2013 (Title 24, Part 6, of the California Code of Regulations [CCR]). Title 24 requires the design of building shells and building components to conserve energy. The standards are updated periodically to allow for consideration and possible incorporation of new energy efficiency technologies and methods. On May 31, 2012, the CEC adopted the 2013 Building Energy Efficiency Standards, which went into effect on July 1, 2014. Buildings that are constructed in accordance with the 2013 Building Energy Efficiency Standards are 25 percent (residential) to 30 percent (nonresidential) more energy efficient than the 2008 standards as a result of better windows, insulation, lighting, ventilation systems, and other features that reduce energy consumption in homes and businesses.
Most recently, the CEC adopted the 2016 Building Energy Efficiency Standards. The 2016 Standards will continue to improve upon the current 2013 Standards for new construction of, and additions and alterations to, residential and nonresidential buildings. These standards went into effect on January 1, 2017. Under the 2016 Standards, residential buildings are 28 percent more energy efficient than the 2013 Standards while non-residential buildings are 5 percent more energy efficient than the 2013 Standards.64
The 2016 standards will not get us to zero net energy (ZNE). However, they do get us very close to the State’s goal and make important steps toward changing residential building practices in California.65
The 2019 standards move towards cutting energy use in new homes by more than 50 percent and will require installation of solar photovoltaic systems for single-family homes and multi-family buildings of 3 stories and less. Four key areas the 2019 standards will focus on include 1) smart residential photovoltaic systems; 2) updated thermal envelope standards (preventing heat transfer from the interior to exterior and vice versa); 3) residential and nonresidential ventilation requirements; 4) and nonresidential lighting requirements.66 Under the 2019 standards, nonresidential buildings will be 30 percent more energy efficient compared to the 2016 standards while single-family homes will be 7 percent more energy efficient. When accounting for the
64 California Energy Commission (CEC). 2015, June 10. 2016 Building Energy Efficiency Standards, Adoption Hearing
Presentation. http://www.energy.ca.gov/title24/2016standards/rulemaking/documents. 65 California Energy Commission (CEC). 2015. 2016 Building Energy Efficiency Standards Frequently Asked Questions.
http://www.energy.ca.gov/title24/2016standards/rulemaking/documents/2016_Building_Energy_Efficiency_Standards_FAQ.pdf. 66 California Energy Commission (CEC). 2018. News Release: Energy Commission Adopts Standards Requiring Solar Systems for New Homes, First in Nation. http://www.energy.ca.gov/releases/2018_releases/2018-05-09_building_standards_adopted_nr.html.
Page 36 Air Quality and Greenhouse Gas Background and Modeling Data
electricity generated by the solar photovoltaic system, single-family homes would use 53 percent less energy compared to homes built to the 2016 standards.67
California Green Building Standards Code – CALGreen
On July 17, 2008, the California Building Standards Commission adopted the nation’s first green building standards. The California Green Building Standards Code (Part 11, Title 24, known as “CALGreen”) was adopted as part of the California Building Standards Code (Title 24, CCR). CALGreen established planning and design standards for sustainable site development, energy efficiency (in excess of the California Energy Code requirements), water conservation, material conservation, and internal air contaminants.68 The mandatory provisions of the California Green Building Code Standards became effective January 1, 2011, was last updated in 2016. The CEC adopted the 2019 CALGreen on May 9, 2018. The 2019 CALGreen standards become effective January 1, 2020.
2006 Appliance Energy Efficiency Regulations
The 2006 Appliance Efficiency Regulations (Title 20, CCR Sections 1601 through 1608) were adopted by the California Energy Commission on October 11, 2006, and approved by the California Office of Administrative Law on December 14, 2006. The regulations include standards for both federally regulated appliances and non–federally regulated appliances. Though these regulations are now often viewed as “business-as-usual,” they exceed the standards imposed by all other states, and they reduce GHG emissions by reducing energy demand.
Solid Waste
AB 939
California’s Integrated Waste Management Act of 1989 (AB 939, Public Resources Code 40050 et seq.) set a requirement for cities and counties throughout the State to divert 50 percent of all solid waste from landfills by January 1, 2000, through source reduction, recycling, and composting. In 2008, the requirements were modified to reflect a per capita requirement rather than tonnage. To help achieve this, the act requires that each city and county prepare and submit a source reduction and recycling element. AB 939 also established the goal for all California counties to provide at least 15 years of ongoing landfill capacity. AB 341 (Chapter 476, Statutes of 2011) increased the statewide goal for waste diversion to 75 percent by 2020 and requires recycling of waste from commercial and multifamily residential land uses.
AB 1327
The California Solid Waste Reuse and Recycling Access Act (AB 1327, California Public Resources Code Sections 42900 et seq.) requires areas to be set aside for collecting and loading recyclable materials in development projects. The act required the California Integrated Waste Management Board to develop a model ordinance for adoption by any local agency requiring adequate areas for collection and loading of recyclable materials as part of development projects. Local agencies are required to adopt the model or an ordinance of their own. Section 5.408 of the 2016 California Green Building Standards Code (Title 24, 67 California Energy Commission (CEC). 2018. 2019 Building Energy and Efficiency Standards Frequently Asked Questions. http://www.energy.ca.gov/title24/2019standards/documents/2018_Title_24_2019_Building_Standards_FAQ.pdf.
68 The green building standards became mandatory in the 2010 edition of the code.
Air Quality and Greenhouse Gas Background and Modeling Data Page 37
California Code of Regulations, Part 11) also requires that at least 65 percent of the nonhazardous construction and demolition waste from nonresidential construction operations be recycled and/or salvaged for reuse.
AB 1826
AB 1826, signed on October of 2014, requires businesses to recycle their organic waste on and after April 1, 2016, depending on the amount of waste they generate per week. This law also requires that on and after January 1, 2016, local jurisdictions implement an organic waste recycling program to divert organic waste generated by businesses, including multifamily residential dwellings that consist of five or more units. Organic waste means food waste, green waste, landscape and pruning waste, nonhazardous wood waste, and food-soiled paper waste that is mixed in with food waste.
Water Efficiency
SBX7-7
The 20x2020 Water Conservation Plan was issued by the Department of Water Resources (DWR) in 2010 pursuant to Senate Bill 7, which was adopted during the 7th Extraordinary Session of 2009–2010 and therefore dubbed “SBX7-7.” SBX7-7 mandated urban water conservation and authorized the DWR to prepare a plan implementing urban water conservation requirements (20x2020 Water Conservation Plan). In addition, it required agricultural water providers to prepare agricultural water management plans, measure water deliveries to customers, and implement other efficiency measures. SBX7-7 requires urban water providers to adopt a water conservation target of 20 percent reduction in urban per capita water use by 2020 compared to 2005 baseline use.
AB 1881
The Water Conservation in Landscaping Act of 2006 (AB 1881) requires local agencies to adopt the updated DWR model ordinance or equivalent. AB 1881 also requires the Energy Commission, in consultation with the department, to adopt, by regulation, performance standards and labeling requirements for landscape irrigation equipment, including irrigation controllers, moisture sensors, emission devices, and valves to reduce the wasteful, uneconomic, inefficient, or unnecessary consumption of energy or water.
Short-Lived Climate Pollutant Strategy
Senate Bill 1383
On September 19, 2016, the Governor signed SB 1383 to supplement the GHG reduction strategies in the Scoping Plan to consider short-lived climate pollutants, including black carbon and CH4. Black carbon is the light-absorbing component of fine particulate matter (PM) produced during incomplete combustion of fuels. SB 1383 requires the state board, no later than January 1, 2018, to approve and begin implementing that comprehensive strategy to reduce emissions of short-lived climate pollutants to achieve a reduction in methane by 40 percent, hydrofluorocarbon gases by 40 percent, and anthropogenic black carbon by 50 percent below 2013 levels by 2030, as specified. The bill also establishes targets for reducing organic waste in landfill. In April 2016, CARB adopted the Proposed Short-Lived Climate Pollutant Strategy, which identifies the state’s approach to reducing anthropogenic and biogenic sources of short-lived climate pollutants.

Page 38 Air Quality and Greenhouse Gas Background and Modeling Data
Anthropogenic sources of black carbon include on- and off-road transportation, residential wood burning, fuel combustion (charbroiling), and industrial processes. According to CARB, ambient levels of black carbon in California are 90 percent lower than in the early 1960s, despite the tripling of diesel fuel use.69 In-use on-road rules are expected to reduce black carbon emissions from on-road sources by 80 percent between 2000 and 2020.
2.1.3 Local Regulations 2.1.3.1 CITY OF CUPERTINO CLIMATE ACTION PLAN
The City of Cupertino published the public draft Climate Action Plan (CAP) in December, 2014 to achieve the GHG reduction target of AB 32 for target year 2020. The CAP serves to support California’s statewide climate change efforts through identification of actions that can be taken locally, by residents, businesses, and the City itself, to ensure the State’s ambitious reduction goals can be achieved. The strategies outlined in the CAP seek to not only reduce GHG emissions, but also provide energy, water, fuel, and cost savings for the City.70 The goals established by the City’s CAP are the following:
Goal 1 – Reduce Energy Use: Increase energy efficiency in existing homes and buildings and increase use of renewable energy community-wide.
Goal 2 – Encourage Alternative Transportation: Support transit, carpooling, walking, and bicycling as viable transportation modes to decrease the number of single-occupancy vehicle trips within the community.
Goal 3 – Conserve Water: Promote the efficient use and conservation of water in buildings and landscapes.
Goal 4 – Reduce Solid Waste: Strengthen waste reduction efforts through recycling and organics collection and reduced consumption of materials that otherwise end up in landfills.
Goal 5 – Expand Green Infrastructure: Enhance the City’s existing urban forest on public and private lands.
2.2 ENVIRONMENTAL SETTING 2.2.1 Existing Emissions The project site is currently developed with an 8,323 square foot Good Year Auto Service Center building. The current site uses generate criteria air pollutants emissions from energy use, transportation, and area sources associated with the operation of the Auto Service Center.
69 California Air Resources Board. 2017, March. Short-Lived Climate Pollutant Reduction Strategy.
https://www.arb.ca.gov/cc/shortlived/meetings/03142017/final_slcp_report.pdf. 70 City of Cupertino, 2015. Climate Action Plan. January, 2015. http://www.cupertino.org/home/showdocument?id=13531

Air Quality and Greenhouse Gas Background and Modeling Data Page 39
2.3 METHODOLOGY The BAAQMD CEQA Air Quality Guidelines were prepared to assist in the evaluation of air quality impacts of projects and plans proposed within the Bay Area. The guidelines provide recommended procedures for evaluating potential GHG emissions impacts during the environmental review process, consistent with CEQA requirements, and include recommended thresholds of significance, mitigation measures, and background information.
2.3.1 Greenhouse Gas Emissions BAAQMD has a tiered approach for assessing GHG emissions impacts of a project. If a project is within the jurisdiction of an agency that has a “qualified” GHG reduction strategy, the project can assess consistency of its GHG emissions impacts with the reduction strategy.
BAAQMD has adopted screening criteria and significance criteria for development projects that would be applicable for the proposed project. If a project exceeds the Guidelines’ GHG screening-level sizes, the project would be required to conduct a full GHG analysis using the following BAAQMD significance criteria:
1,100 MT of CO2e per year; or 4.6 MT of CO2e per service population (SP) for year 2020
AB 32 requires the statewide GHG emission be reduced to 1990 levels by 2020. On a per-capita basis, that means reducing the annual emissions of 14 tons of carbon dioxide for every man, woman, and child in California down to about 10 tons per person by 2020.71 Hence, BAAQMD’s per capita significance threshold is calculated based on the State’s land use sector emissions inventory prepared by CARB and the demographic forecasts for the 2008 Scoping Plan. The land use sector GHG emissions for 1990 were estimated by BAAQMD, as identified in Appendix D of the BAAQMD CEQA Guidelines, to be 295.53 MMTCO2eand the 2020 California service population (SP) to be 64.3 million. Therefore, the significance threshold that would ensure consistency with the GHG reduction goals of AB 32 is estimated at 4.6 MTCO2e/SP for year 2020.72
Land use development projects include residential, commercial, industrial, and public land use facilities. Direct sources of emissions may include on-site combustion of energy, such as natural gas used for heating and cooking, emissions from industrial processes (not applicable for most land use development projects), and fuel combustion from mobile sources. Indirect emissions are emissions produced off-site from energy production, water conveyance due to a project’s energy use and water consumption, and non-biogenic emissions from waste disposal. Biogenic CO2 emissions are not included in the quantification of a project’s GHG emissions, because biogenic CO2 is derived from living biomass (e.g. organic matter present in wood, paper, vegetable oils, animal fat, food, animal, and yard waste) as opposed to fossil fuels. Although GHG emissions from waste generation are included in the GHG inventory for the proposed project, the efficiency threshold of 4.6 MTCO2e per service population for 2020 identified above does not include the waste sector, and it is therefore not considered in the evaluation.
71 California Air Resources Board, 2008. Climate Change Scoping Plan: A Framework for Change. 72 Bay Area Air Quality Management District, 2017, May, California Environmental Quality Act Air Quality Guidelines.

Page 40 Air Quality and Greenhouse Gas Background and Modeling Data
BAAQMD does not have thresholds of significance for construction-related GHG emissions, but requires quantification and disclosure of construction-related GHG emissions.73 For operational phases, if projects exceed the bright line and per capita efficiency targets, GHG emissions would be considered potentially significant in the absence of mitigation measures.
73 Ibid.