appendix a: evaluation of 2013 dsm portfolio · appendix a: evaluation of 2013 dsm portfolio...
TRANSCRIPT

Appendix A: Evaluation of 2013 DSM Portfolio
Submitted to:
SourceGas Arkansas
March 2014
Final
ADM Associates, Inc. VuPoint Research
APSC FILED Time: 3/26/2014 2:23:55 PM: Recvd 3/26/2014 2:04:55 PM: Docket 07-078-TF-Doc. 185

Corporate Headquarters: 3239 Ramos Circle Sacramento, CA 95827 Tel: (916) 363-8383
ADM Associates Inc. Energy Research & Evaluation
200 Brown Road Suite 208 Fremont, CA 94539 Tel: (510) 371-0763
Prepared by: Adam Thomas
Sung Park, P.E. Jeremy Offenstein, Ph.D
Jay Blatchford Brian Harold
Julianna Mandler Don Dohrmann, Ph.D
APSC FILED Time: 3/26/2014 2:23:55 PM: Recvd 3/26/2014 2:04:55 PM: Docket 07-078-TF-Doc. 185

Acknowledgements We would like to thank the staff at SourceGas Arkansas for their time and effort in contributing to the EM&V of the 2013 programs. This evaluation was conducted with regular coordination with staff at SourceGas, who provided quick feedback and turnaround to the requests of the evaluation team as well as open and forthright insights into the operations of their programs.
Further, we would like to acknowledge our gratitude towards SourceGas customers, implementation contractor staff, and trade allies. As with the staff at SourceGas, their active participation allowed for the evaluation team to collect all needed data for this effort.
In final, we would like to thank staff at the Independent Evaluation Monitor for their involvement in providing thorough answers and clarification to the evaluation team when higher-level questions arose over the course of the 2013 EM&V effort.
APSC FILED Time: 3/26/2014 2:23:55 PM: Recvd 3/26/2014 2:04:55 PM: Docket 07-078-TF-Doc. 185

Contents i
TABLE OF CONTENTS Section Title ...................................................................................................... Page
1. Executive Summary .............................................................................................. 1-1
2. General Methodology .......................................................................................... 2-1
3. Portfolio-Level Findings ....................................................................................... 3-1
4. Heating Equipment Rebates ................................................................................ 4-1
5. Water Heating & Conservation - Equipment Rebates ......................................... 5-1
6. Residential New Construction ............................................................................. 6-1
7. Commercial and Industrial (C&I) Solutions Program ........................................... 7-1
8. Commercial Cooking Equipment Rebates ........................................................... 8-1
9. Home Energy Reports .......................................................................................... 9-1
10. Water Heating & Conservation – Low Flow Kits ................................................ 10-1
11. Recommendations for TRM Updates ................................................................ 11-1
12. Appendix A: Site Reports ................................................................................... 12-1
APSC FILED Time: 3/26/2014 2:23:55 PM: Recvd 3/26/2014 2:04:55 PM: Docket 07-078-TF-Doc. 185

Contents ii
LIST OF TABLES
Table 1-1 Gross Impact Summary .............................................................................................................. 1-2
Table 1-2 Net Impact Summary ................................................................................................................. 1-2
Table 1-3 SourceGas 2013 DSM Portfolio Performance against Goals...................................................... 1-3
Table 3-1 SourceGas DSM Portfolio 2013 EM&V Expenditures ................................................................ 3-1
Table 3-2 Summary of Data Collection Efforts ........................................................................................... 3-1
Table 3-3 Assessment of Customer Education by Program ....................................................................... 3-3
Table 3-4 Assessment of Trade Ally Training by Program ......................................................................... 3-4
Table 3-5 Assessment of Marketing & Outreach by Program ................................................................... 3-5
Table 3-6 Assessment of Budgetary, Management, and Program Delivery Resources by Program ......... 3-7
Table 3-7 End-Uses Addressed by Program ............................................................................................... 3-7
Table 3-8 Assessment of Project Comprehensiveness by Program ........................................................... 3-8
Table 3-9 Assessment of Targeted Customer Sectors by Program .......................................................... 3-10
Table 3-10 Assessment of Cost-Effectiveness .......................................................................................... 3-11
Table 3-11 Assessment of Data & QA/QC Procedures by Program ......................................................... 3-13
Table 3-12 Portfolio-Level Summary of Issues & Recommendations ...................................................... 3-15
Table 4-1 Heating Equipment Rebates Historical Performance against Goals .......................................... 4-1
Table 4-2 Determining Appropriate Timing to Conduct a Process Evaluation .......................................... 4-4
Table 4-3 Determining Appropriate Conditions to Conduct a Process Evaluation .................................... 4-5
Table 4-4 SourceGas Heating Equipment Rebates Data Collection Summary........................................... 4-6
Table 4-5 Heating Equipment Rebates Response to 2012 Recommendations ......................................... 4-7
Table 4-6 Heating Equipment Rebates Sources of Program Awareness ................................................. 4-11
Table 4-7 Residential Space Heating Contractor Interactions ................................................................. 4-11
Table 4-8 Heating Equipment Rebates Residential Satisfaction Levels ................................................... 4-13
Table 4-9 Trade Ally Satisfaction Levels ................................................................................................... 4-16
APSC FILED Time: 3/26/2014 2:23:55 PM: Recvd 3/26/2014 2:04:55 PM: Docket 07-078-TF-Doc. 185
Contents iii
Table 4-10 Status of Identified Best-Practice Shortfalls .......................................................................... 4-16
Table 4-11 TRM V3.0 Annual Furnace Heating Load ............................................................................... 4-18
Table 4-12 Weighted Residential Therm Load ......................................................................................... 4-18
Table 4-13 Residential Furnace RUL ........................................................................................................ 4-20
Table 4-14 Timing of Decision to Purchase High Efficiency Relative to Timing of Selection of Contractor 4-22
Table 4-15 Effect of Rebate in Moving up Purchase Timing .................................................................... 4-23
Table 4-16 EFLH Values ............................................................................................................................ 4-26
Table 4-17 Heating Equipment Rebates Verified Therms Savings ........................................................... 4-26
Table 4-18 Heating Equipment Rebates Net Savings Summary .............................................................. 4-27
Table 4-19 Heating Equipment Rebates Summary of Issues & Recommendations ................................ 4-29
Table 5-1 Water Heating Equipment Rebates Program Historical Performance against Goals ................ 5-1
Table 5-2 Determining Appropriate Timing to Conduct a Process Evaluation .......................................... 5-3
Table 5-3 Determining Appropriate Conditions to Conduct a Process Evaluation .................................... 5-4
Table 5-4 SourceGas Heating Equipment Rebates Data Collection Summary........................................... 5-5
Table 5-5 Water Heating Equipment Rebates Response to 2012 Recommendations .............................. 5-7
Table 5-6 Water Heating Equipment Rebates Program Sources of Program Awareness ......................... 5-9
Table 5-7 Water Heating Equipment Rebates Program Residential Satisfaction Levels ......................... 5-11
Table 5-8 Status of Identified Best-Practice Shortfalls ............................................................................ 5-12
Table 5-9 Residential Water Heating Baseline Energy Factors ................................................................ 5-14
Table 5-10 Residential Water Heating Baseline Energy Factors .............................................................. 5-14
Table 5-11 Timing of Decision to Purchase High Efficiency Water Heater Relative to Timing of Selection of Contractor ................................................................................................................................... 5-15
Table 5-12 Effect of Rebate in Moving up Purchase Timing .................................................................... 5-16
Table 5-13 Hot Water Requirements by Facility Size ............................................................................... 5-19
Table 5-14 Hot Water Requirements by Unit or Person .......................................................................... 5-19
APSC FILED Time: 3/26/2014 2:23:55 PM: Recvd 3/26/2014 2:04:55 PM: Docket 07-078-TF-Doc. 185

Contents iv
Table 5-15 Water Heating Equipment Rebates Program Verified Therms Savings ................................. 5-20
Table 5-16 Water Heating Equipment Rebates Program Net Savings Summary .................................... 5-20
Table 5-17 Summary of Recommendations for Water Heating Equipment Rebates Program ............... 5-23
Table 6-1 Residential New Construction Satisfaction Levels ..................................................................... 6-9
Table 7-1 C&I Solutions Program Historical Performance against Goals ................................................... 7-1
Table 7-2 Current C&I Solutions Programs Projects Likely to Install in 2014 ............................................ 7-5
Table 7-3 Custom Project Participation Summary ..................................................................................... 7-5
Table 7-4 Determining Appropriate Timing to Conduct a Process Evaluation .......................................... 7-6
Table 7-5 Determining Appropriate Conditions to Conduct a Process Evaluation .................................... 7-6
Table 7-6 SourceGas C&I Solutions Data Collection Summary .................................................................. 7-9
Table 7-7 C&I Solutions Response to 2012 Recommendations ............................................................... 7-10
Table 7-8 C&I Solutions DI - Value of Sources of Information ................................................................. 7-22
Table 7-9 C&I Solutions Direct Install Satisfaction Levels ........................................................................ 7-24
Table 7-10 Likelihood to Implement Recommended Measures .............................................................. 7-31
Table 7-11 Trade Ally Satisfaction Levels ................................................................................................. 7-37
Table 7-12 DI Aerator Savings Calculation Parameters ........................................................................... 7-40
Table 7-13 1.0 GPM Commercial Aerator Savings ................................................................................... 7-41
Table 7-14 0.5 GPM Commercial Aerator Savings ................................................................................... 7-41
Table 7-15 Pre-Rinse Spray Valves Savings Calculation Parameters ....................................................... 7-42
Table 7-16 DI Commercial Showerhead Savings Calculation Parameters ............................................... 7-43
Table 7-17 1.5 GPM Commercial Showerhead Savings ........................................................................... 7-44
Table 7-18 Commercial Boiler Minimum Efficiency Levels ...................................................................... 7-46
Table 7-19 Commercial EFLH Values ........................................................................................................ 7-46
Table 7-20 Prescriptive Boiler Calculation Review Summary .................................................................. 7-47
Table 7-21 SourceGas C&I Solutions Custom Project Summary .............................................................. 7-48
APSC FILED Time: 3/26/2014 2:23:55 PM: Recvd 3/26/2014 2:04:55 PM: Docket 07-078-TF-Doc. 185
Contents v
Table 7-22 SourceGas C&I Solutions Custom Project Free-Ridership Results ......................................... 7-51
Table 7-23 C&I Solutions Verified Therms Savings .................................................................................. 7-53
Table 7-24 C&I Solutions Net Savings Summary ...................................................................................... 7-53
Table 7-25 Commercial & Industrial Solutions Summary of Issues & Recommendations ...................... 7-56
Table 8-1 Commercial Cooking Equipment Rebates Historical Performance against Goals ..................... 8-1
Table 8-2 Determining Appropriate Timing to Conduct a Process Evaluation .......................................... 8-2
Table 8-3 Determining Appropriate Conditions to Conduct a Process Evaluation .................................... 8-2
Table 8-4 Commercial Cooking Equipment Rebates Data Collection Summary ........................................ 8-3
Table 8-5 Commercial Cooking Equipment Response to 2012 Recommendations................................... 8-5
Table 8-6 Analysis of SourceGas Food Service Equipment Incentive Levels.............................................. 8-8
Table 8-7 Comparison of Food Service Equipment Incentive Levels ......................................................... 8-9
Table 8-8 Commercial Cooking Equipment Rebates Program Verified Therms Savings ......................... 8-10
Table 8-9 Commercial Cooking Equipment Rebates Net Savings Summary ............................................ 8-10
Table 8-10 Summary of Recommendations for Commercial Cooking Equipment Rebates Program ..... 8-13
Table 9-1 Home Energy Reports Program Historical Performance against Goals ..................................... 9-1
Table 9-5 Control Group Statistical Validity Testing .................................................................................. 9-3
Table 9-6 Home Energy Reports Peak-to-Annual Multipliers .................................................................... 9-4
Table 9-7 Home Energy Reports Model Coefficients ................................................................................. 9-4
Table 9-8 Home Energy Reports Savings Summary ................................................................................... 9-5
Table 10-1 Determining Appropriate Timing to Conduct a Process Evaluation ...................................... 10-2
Table 10-2 Determining Appropriate Conditions to Conduct a Process Evaluation ................................ 10-3
Table 8-1 Water Conservation Program Data Collection Summary ........................................................ 10-4
Table 8-4 Water Conservation Program Response to 2012 Recommendations ..................................... 10-5
Table 10-5 Water Conservation Program Sources of Program Awareness ............................................. 10-8
Table 8-7 Low Flow Showerhead Installation Rate .................................................................................. 10-9
APSC FILED Time: 3/26/2014 2:23:55 PM: Recvd 3/26/2014 2:04:55 PM: Docket 07-078-TF-Doc. 185

Contents vi
Table 10-7 Satisfaction Levels with Kit Equipment ................................................................................ 10-11
Table 10-8 Stated Intent to Install Without Program ............................................................................ 10-12
Table 10-9 Timing of Installation in the Absence of the Program ......................................................... 10-12
Table 10-7 Water Conservation Program Satisfaction Levels ................................................................ 10-14
Table 10-11 Faucet Aerator Volume of Use ........................................................................................... 10-16
Table 10-12 Water Main Temperatures by Weather Zone ................................................................... 10-16
Table 10-13 Residential Aerator Gas Savings Values ............................................................................. 10-16
Table 10-14 Showerhead Volume of Use............................................................................................... 10-17
Table 10-15 Residential Showerhead Gas Savings Values ..................................................................... 10-17
Table 10-16 Residential Faucet Aerator Electric Savings Values ........................................................... 10-18
Table 10-17 Residential Showered Electric Savings Values ................................................................... 10-18
Table 10-18 Water Conservation Program Verified Gross Therms Savings ........................................... 10-18
Table 10-19 Water Conservation Program Net Savings Summary ........................................................ 10-18
Table 10-17 Water Conservation Kits Summary of Issues & Recommendations .................................. 10-21
APSC FILED Time: 3/26/2014 2:23:55 PM: Recvd 3/26/2014 2:04:55 PM: Docket 07-078-TF-Doc. 185

Contents vii
LIST OF FIGURES
Figure 3-1 SourceGas Prescriptive Commercial Brochure 3-6
Figure 4-1 Heating Equipment Rebates Commercial Participation by Facility Type 4-3
Figure 4-2 Heating Equipment Rebates by Month 4-4
Figure 4-3 Excerpt from Residential Furnace Application – TRM V3.0 Data Fields 4-8
Figure 4-4 Excerpt from Residential Furnace Application – Early Replacement Data Fields 4-8
Figure 4-5 Differences in Income between Participants and Non-Participants 4-9
Figure 4-6 Differences in Education between Participants and Non-Participants 4-9
Figure 4-7 Differences in Home Age between Participants and Non-Participants 4-10
Figure 4-8 Residential Space Heating Reasons for Purchase of High Efficiency Furnaces 4-12
Figure 4-9 Residential Space Heating Free-Ridership Diagram 4-24
Figure 4-10 Residential Space Heating Free-Ridership Logic Model 4-24
Figure 5-1 Water Heating Equipment Rebates C&I Participation by Facility Type 5-2
Figure 5-2 Water Heating Equipment Rebates Monthly Rebate Totals 5-3
Figure 5-3 Difference in Income between Participants & Non-Participants 5-8
Figure 5-4 Difference in Education between Participants & Non-Participants 5-9
Figure 5-5 Residential Water Heating Reasons for Purchase of High Efficiency Equipment 5-10
Figure 5-6 Residential Water Heating Free-Ridership Flowchart 5-17
Figure 6-1 Sources of Program Awareness – Owner-Occupants 6-3
Figure 6-2 Selection Process for Home Builders 6-4
Figure 6-3 Reasons for Equipment Selection 6-5
Figure 6-4 Timing of learning of Rebate Program vs. Selection of Equipment 6-5
Figure 6-5 Likelihood to Install – High Efficiency Furnaces 6-6
Figure 6-6 Likelihood to Install – High Efficiency Water Heaters 6-7
Figure 6-7 Energy Efficient Options Considered & Installed by Participants 6-8
APSC FILED Time: 3/26/2014 2:23:55 PM: Recvd 3/26/2014 2:04:55 PM: Docket 07-078-TF-Doc. 185

Contents viii
Figure 6-8 Residential New Construction Free-Ridership Flowchart 6-9
Figure 7-1 SourceGas Direct Install Participation Summary 7-2
Figure 7-2 C&I Solutions Direct Install Monthly Therms Savings 7-3
Figure 7-3 Summary of Measures Recommended & Installed 7-4
Figure 7-4 Summary of Therms Recommended & Installed 7-4
Figure 7-5 C&I Solutions Process Flow 7-15
Figure 7-6 Thermal Oxidizer Case Study 7-16
Figure 7-7 Pump Well Cover Case Study 7-17
Figure 7-8 Sample Measure Recommendation Table 7-19
Figure 7-9 Sample Audit Report Consumption Profile 7-20
Figure 7-10 C&I Solutions Direct Install Sample Summary 7-21
Figure 7-11 C&I Solutions Source of Program Awareness 7-22
Figure 7-12 Summary of Natural Gas Loads 7-23
Figure 7-13 C&I Solutions Direct Install Free-Ridership Diagram 7-45
Figure 7-14 C&I Solutions Custom Project Free-Ridership Diagram 7-51
Figure 8-1 SourceGas Prescriptive Commercial Case Study 8-7
Figure 10-1 Summary of Kits Distributed 10-2
Figure 10-2 Differences in Income between Participants and Non-Participants 10-6
Figure 10-3 Differences in Education between Participants and Non-Participants 10-7
Figure 10-4 Water Conservation Program Reasons for Participating 10-8
Figure 10-5 Reasons for Not Installing Low Flow Showerheads 10-9
Figure 10-6 Reasons for Not Installing Faucet Aerators 10-10
Figure 10-7 Low Flow Kit Free-Rider Scoring 10-13
APSC FILED Time: 3/26/2014 2:23:55 PM: Recvd 3/26/2014 2:04:55 PM: Docket 07-078-TF-Doc. 185

Executive Summary 1-1
1. Executive Summary This report is to provide a summary of the evaluation effort of the 2013 Demand Side Management (DSM) portfolio by the SourceGas Arkansas (SourceGas). This evaluation was led by ADM Associates (ADM). This report provides verified gross and net savings estimates for evaluated programs.
1.1 Summary of SourceGas Energy Efficiency Programs
In 2013, the SourceGas DSM portfolio contained the following programs:
Heating Equipment Rebates;
Water Heating & Conservation1;
C&I Solutions;
Commercial Cooking Equipment Rebates;
Home Energy Reports; and
Home Energy Savings.
C&I Boiler Equipment Rebates was folded into C&I Solutions during the 2013 program year. Home Energy Savings began in late 2013 and was not evaluated. Savings for projects closed late in 2013 in the Home Energy Savings Program will be evaluated as part of the 2014 program year.
1.2 Evaluation Objectives
The goals of the 2013 EM&V effort are as follows:
For prescriptive measures, verify that savings are being calculated according to appropriate TRM V3.0 guidelines.
For custom measures, this effort comprises the calculation of savings according to accepted protocols (such as IPMVP). This is to ensure that custom measures are cost-effective and providing reliable savings.
Conduct process evaluation of all SourceGas programs and of the portfolio overall. This is to provide a comprehensive review of program operations, marketing and outreach, quality control procedures, and program successes relative to goals. From this, the Evaluators are to provide program and portfolio-level recommendations for SourceGas. Process evaluation activities include interviews of key program actors, surveys of participants and non-participants, literature reviews and best-practices assessments, and documentation of
1 The two program components, Water Heating Equipment Rebates and Water Conservation Kits, are evaluated as
separate programs.
APSC FILED Time: 3/26/2014 2:23:55 PM: Recvd 3/26/2014 2:04:55 PM: Docket 07-078-TF-Doc. 185

2013 SourceGas DSM Portfolio Final Evaluation Report
Executive Summary 1-2
program activities, successes, and shortcomings. Further, this includes a summary of utility and implementer response to recommendations made in the 2012 process evaluations.
Conduct net-to-gross assessments. The Evaluators conducted program-specific net-to-gross assessments in 2012 and repeated this activity in 2013.
1.3 Summary of Findings
1.3.1 Impact Findings Error! Reference source not found. and 1-2 present the gross and net impact by program.
Table 1-1 Gross Impact Summary
Program Annual Energy
Savings (Therms) Lifetime Energy Savings
(Therms) Peak Therms
Gross Realization
Rate Ex Ante Ex Post Ex Ante Ex Post Ex Ante Ex Post Heating Equipment Rebates 72,654 91,024 1,453,080 1,397,046 736.6 1,585.10 125.3%
Water Heating Equipment Rebates 52,521 59,536 802,962 908,178 153.6 168.9 113.4%
Commercial & Industrial Solutions 998,965 974,522 10,093,409 9,575,833 6,394.50 6,150.30 97.6%
Commercial Cooking Equipment Rebates 11,100 11,100 133,200 133,200 30.4 30.4 100.0%
Home Energy Reports 363,230 438,534 363,230 438,534 7,695.7 9,291.2 120.7%
Water Conservation Kits 12,849 16,017 128,490 160,180 38.5 48.0 124.7%
Total 1,511,319 1,590,733 12,974,371 12,612,971 15,049.3 17,273.9 105.3%
Table 1-2 Net Impact Summary
Program Annual Energy
Savings (Therms) Lifetime Energy Savings
(Therms) Peak Therms
NTGR
Net Realization
Rate Ex Ante Ex Post Ex Ante Ex Post Ex Ante Ex Post Heating Equipment Rebates 62,556 73,841 1,271,445 1,123,305 644.5 1,285.0 81.1% 118.0%
Water Heating Equipment Rebates 41,843 47,232 723,177 739,072 138.6 137.5 79.3% 112.9%
Commercial & Industrial Solutions 987,163 954,191 9,313,834 8,792,995 6,238.8 5,987.6 97.9% 96.7%
Commercial Cooking Equipment Rebates 8,880 8,880 106,560 106,560 24.3 24.3 80.0% 100.0%
Home Energy Reports 363,230 438,534 363,230 438,534 7,695.7 9,291.2 100.0% 120.7%
Water Conservation Kits 11,436 14,406 114,360 144,060 34.3 43.2 89.9% 126.0%
APSC FILED Time: 3/26/2014 2:23:55 PM: Recvd 3/26/2014 2:04:55 PM: Docket 07-078-TF-Doc. 185
2013 SourceGas DSM Portfolio Final Evaluation Report
Executive Summary 1-3
Total 1,475,108 1,537,084 11,892,606 11,344,526 14,776.2 16,768.8 96.6% 104.2%
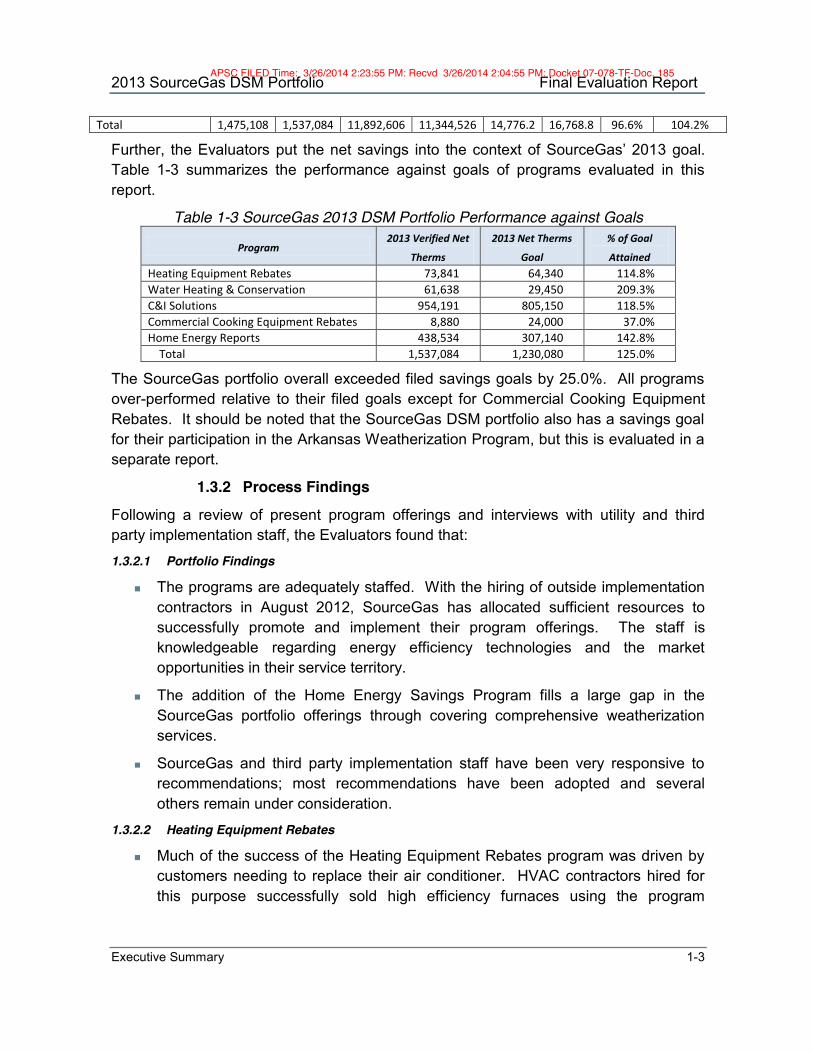
Further, the Evaluators put the net savings into the context of SourceGas’ 2013 goal. Table 1-3 summarizes the performance against goals of programs evaluated in this report.
Table 1-3 SourceGas 2013 DSM Portfolio Performance against Goals
Program 2013 Verified Net
Therms
2013 Net Therms
Goal
% of Goal
Attained Heating Equipment Rebates 73,841 64,340 114.8% Water Heating & Conservation 61,638 29,450 209.3% C&I Solutions 954,191 805,150 118.5% Commercial Cooking Equipment Rebates 8,880 24,000 37.0% Home Energy Reports 438,534 307,140 142.8%
Total 1,537,084 1,230,080 125.0%
The SourceGas portfolio overall exceeded filed savings goals by 25.0%. All programs over-performed relative to their filed goals except for Commercial Cooking Equipment Rebates. It should be noted that the SourceGas DSM portfolio also has a savings goal for their participation in the Arkansas Weatherization Program, but this is evaluated in a separate report.
1.3.2 Process Findings Following a review of present program offerings and interviews with utility and third party implementation staff, the Evaluators found that:
1.3.2.1 Portfolio Findings
The programs are adequately staffed. With the hiring of outside implementation contractors in August 2012, SourceGas has allocated sufficient resources to successfully promote and implement their program offerings. The staff is knowledgeable regarding energy efficiency technologies and the market opportunities in their service territory.
The addition of the Home Energy Savings Program fills a large gap in the SourceGas portfolio offerings through covering comprehensive weatherization services.
SourceGas and third party implementation staff have been very responsive to recommendations; most recommendations have been adopted and several others remain under consideration.
1.3.2.2 Heating Equipment Rebates
Much of the success of the Heating Equipment Rebates program was driven by customers needing to replace their air conditioner. HVAC contractors hired for this purpose successfully sold high efficiency furnaces using the program
APSC FILED Time: 3/26/2014 2:23:55 PM: Recvd 3/26/2014 2:04:55 PM: Docket 07-078-TF-Doc. 185

2013 SourceGas DSM Portfolio Final Evaluation Report
Executive Summary 1-4
incentive, but in many instances the customer installed a standard efficiency air conditioner.
There was significant early replacement in 2013. This is an extension of the activities of HVAC contractors in tacking on the sale of a high efficiency furnace during the replacement of a failed central air conditioner. This has been supported by several ancillary findings:
- Forty-two percent of residential retrofits occurred from the months of May-September. The replacement of furnaces during the summer cooling season is likely indicative of a replacement driven by a customers’ need to replace their air conditioner.
- Interviewed trade allies reported that they often upsell their air conditioning customers on a high efficiency furnace as part of a package deal.
- Seventy-four percent of residential retrofit survey respondents reported having replaced their central air conditioner at the same time as they replaced their furnace.
1.3.2.3 Water Heating Equipment Rebates
The addition of incentives for large condensing storage tank water heaters and for condensing residential water heaters both provide significant additional savings and participation.
The program was further enhanced by the addition of a trade ally incentive for both tankless and storage tank units.
1.3.2.4 Commercial Cooking Equipment Rebates
SourceGas filed to correct the participant and savings goals to more realistically reflect the updated savings in the Arkansas TRM V3.0.
Program staff was responsive to recommendations pertaining to measure incentive levels, and incentive levels have increased for the 2014 program year.
The program has not engaged local trade allies; all 2013 participating trade allies are all based in the Little Rock metro area and are referrals from CenterPoint’s Commercial Food Service CIP. SourceGas program staff has reported, however that they have had their first participation from local food service vendors occur in early 2014.
Participation has been driven almost entirely by new construction projects at K-12 school districts.
APSC FILED Time: 3/26/2014 2:23:55 PM: Recvd 3/26/2014 2:04:55 PM: Docket 07-078-TF-Doc. 185

2013 SourceGas DSM Portfolio Final Evaluation Report
Executive Summary 1-5
1.3.2.5 C&I Solutions
The C&I Solutions Direct Install component was highly successful both in generating cost-effective energy savings and in introducing non-residential customers to energy efficiency. Participants in the direct install component were seen later participating in other SourceGas DSM programs, with the most marked success in this regard being the Water Heating Equipment Rebates Program.
The C&I Solutions custom component showed dramatically increased participation in custom projects, with participation and savings from the custom component nearly tripling compared to 2012.
Trade allies have begun more active participation in the C&I Solutions Program, particularly for steam line insulation and steam traps.
Direct install commercial showerheads were shown to be an effective addition to the program.
Prescriptive boiler rebates are being adequately marketed as a component of C&I Solutions. Participation in this channel was higher in 2013 than in any of the program years during which prescriptive boiler equipment was rebated through the standalone C&I Boiler Equipment Rebates Program.
1.3.2.6 Home Energy Reports
The Home Energy Reports program is cancelled as of the 2014 program year. Over-performance in 2013 is attributable largely to the abnormally cold winter that occurred throughout the Midwest and Southern United States.
1.3.2.7 Water Conservation Program
The program is dramatically improved with the introduction of a new implementer. Energy Federation Inc. (EFI) took over the program in 2013 and significantly increased participation as well as per-participant savings.
Program staff implemented several recommended program enhancements from the 2012 evaluation, including allowing kit customization, screening electric water heating participants, and moving from online to mailer marketing.
1.4 Report Organization
This report is organized with one chapter providing the full impact and process summary of a specified program. The report is organized as follows:
Chapter 2 provides general methodologies;
Chapter 3 provides a summary of portfolio-level issues;
Chapter 4 provides results for the Heating Equipment Rebates Program;
APSC FILED Time: 3/26/2014 2:23:55 PM: Recvd 3/26/2014 2:04:55 PM: Docket 07-078-TF-Doc. 185
2013 SourceGas DSM Portfolio Final Evaluation Report
Executive Summary 1-6
Chapter 5 provides results for the Water Heating Equipment Rebates Program;
Chapter 6 provides an overview of cross-cutting new construction process evaluation issues;
Chapter 7 provides results for the C&I Solutions Program;
Chapter 8 provides results for the Commercial Cooking Equipment Rebates Program;
Chapter 9 provides results for the Home Energy Reports Program;
Chapter 10 provides results for the Water Conservation Kits Program;
Chapter 11 provides a summary of TRM recommendations; and
Appendix A provides the site-level custom reports for the C&I Solutions Program.
APSC FILED Time: 3/26/2014 2:23:55 PM: Recvd 3/26/2014 2:04:55 PM: Docket 07-078-TF-Doc. 185

General Methodology 2-1
2. General Methodology This section details general impact evaluation methodologies by program-type as well as data collection methods applied. This section will present full descriptions of:
Gross Savings Estimation;
Sampling Methodologies;
Free-Ridership determination;
Process Evaluation Methodologies; and
Data Collection Procedures.
2.1 Glossary of Terminology
As a first step to detailing the evaluation methodologies, the Evaluators provide a glossary of terms to follow2:
Ex Ante – Forecasted savings used for program and portfolio planning purposes (from the Latin for “beforehand”)
Ex Post – Savings estimates reported by an evaluator after the energy impact evaluation has been completed (From the Latin for “From something done afterward”)
Deemed Savings – An estimate of an energy savings or demand savings outcome (gross savings) for a single unit of an installed energy efficiency measure. This estimate (a) has been developed from data sources and analytical methods that are widely accepted for the measure and purpose and (b) are applicable to the situation being evaluated. (e.g., assuming 17.36 Therms savings for a low-flow showerhead)
Gross Savings – The change in energy consumption and/or demand that results directly from program-related actions taken by participants in an efficiency program, regardless of why they participated
Gross Realization Rate – Ratio of Ex Post Savings / Ex Ante Savings (eg. If ADM verifies 15 Therms per showerhead, Gross Realization Rate = 15/17.36 = 86%)
Free-Rider – A program participant who would have implemented the program measure or practice in the absence of the program. Free riders can be total, partial, or deferred.
Spillover – Reductions in energy consumption and/or demand caused by the presence of the energy efficiency program that exceed the program-related gross
2 Arkansas TRM V3.0, Volume 1, Pg. 80-86
APSC FILED Time: 3/26/2014 2:23:55 PM: Recvd 3/26/2014 2:04:55 PM: Docket 07-078-TF-Doc. 185
2013 SourceGas DSM Portfolio Final Evaluation Report
General Methodology 2-2
savings of the participants. There can be participant and/or non-participant spillover rates depending on the rate at which participants (and non-participants) adopt energy efficiency measures or take other types of efficiency actions on their own (i.e., without an incentive being offered).
Net Savings – The total change in load that is attributable to an energy efficiency program. This change in load may include, implicitly or explicitly, the effects of free drivers, free riders, energy efficiency standards, changes in the level of energy service, and other causes of changes in energy consumption or demand. (eg., if Free-Ridership for low-flow showerheads = 50%, net savings = 15 Therms x 50% = 7.5 Therms)
Net-to-Gross-Ratio (NTGR) = (1 – Free-Ridership % + Spillover %), also defined as Net Savings / Gross Savings
Ex Ante Net Savings = Ex Ante Gross Savings x Ex Ante Free-Ridership Rate
Ex Post Net Savings = Ex Post Gross Savings x Ex Post Free-Ridership Rate
Net Realization Rate = Ex Post Net Savings / Ex Ante Net Savings
Effective Useful Life (EUL) – An estimate of the median number of years that the efficiency measures installed under a program are still in place and operable.
Gross Lifetime Therms = Ex Post Gross Savings x EUL
2.2 Overview of Methodology
The proposed methodology for the evaluation of the 2013 SourceGas DSM Portfolio is intended to provide:
Net impact results at the 90% confidence and +/-10% precision level; and
Program feedback and recommendations via process evaluation
In doing so, this evaluation will provide the verified net savings results, provide the recommendations for program improvement, and ensure cost-effective use of ratepayer funds. By leveraging experience and lessons learned from impact evaluation of the 2012 program year, the 2013 evaluation is significantly expanded and can provide greater guidance as to methods by which program and portfolio performance could be improved.
2.2.1 Sampling Sampling is necessary to evaluate savings for the SourceGas DSM portfolio insomuch as verification of a census of program participants is typically cost-prohibitive. As per evaluation requirements set forth by the Independent Evaluation Monitor (IEM), samples are drawn in order to ensure 90% confidence at the +/- 10% precision level. Programs are evaluated on one of three bases:
APSC FILED Time: 3/26/2014 2:23:55 PM: Recvd 3/26/2014 2:04:55 PM: Docket 07-078-TF-Doc. 185

2013 SourceGas DSM Portfolio Final Evaluation Report
General Methodology 2-3
Census of all participants
Simple Random Sample
Stratified Random Sample
2.2.1.1 Census of Participants
A census of participant data was used for select programs where such review is feasible. For example, the Home Energy Reports program’s savings estimates are based on a regression model that incorporates billing data for a census of program recipients. Programs that received analysis of a census of participants include:
Home Energy Reports;
Commercial & Industrial Solutions – Custom Component
2.2.1.2 Simple Random Sampling
For programs with relatively homogenous measures (largely in the residential portfolio), ADM conducted a simple random sample of participants. The sample size for verification surveys is calculated to meet 90% confidence and 10% precision (90/10). The sample size to meet 90/10 requirements is calculated based on the coefficient of variation (CV) of savings for program participants. CV is defined as:
𝐶𝑉(𝑥) = 𝑆𝑡𝑎𝑛𝑑𝑎𝑟𝑑 𝐷𝑒𝑣𝑖𝑎𝑡𝑖𝑜𝑛 (𝑥)𝑀𝑒𝑎𝑛(𝑥)
Where x is the average Therms savings per participant. Without data to use as a basis for a higher value, it is typical to apply a CV of 0.5 in residential program evaluations. The resulting sample size is estimated at:
𝑛 = 1.645 ∗ 𝐶𝑉𝑅𝑃
Where,
1.645 = Z score for 90% confidence interval in a normal distribution
CV = Coefficient of Variation
RP = Required Precision, 10% in this evaluation
With 10% required precision (RP), this calls for a sample of 68 for programs with a sufficiently large population. However, in some instances, programs did not have sufficient participation to make a sample of this size cost-effective. In instances of low participation, ADM then applied a finite population correction factor, defined as:
𝑛 = 𝑛1 + 𝑛
𝑁
Where
APSC FILED Time: 3/26/2014 2:23:55 PM: Recvd 3/26/2014 2:04:55 PM: Docket 07-078-TF-Doc. 185

2013 SourceGas DSM Portfolio Final Evaluation Report
General Methodology 2-4
n0 = Sample Required for Large Population
N = Size of Population
n = Corrected Sample
For example, if a program were to have only 100 participants, the finite population correction would result in a final required sample size of 41. The Evaluators applied finite population correction factors in instances of low participation in determining samples required for surveying or onsite verification. Programs subject to Simple Random Sampling include:
Heating Equipment Rebates – Residential;
Water Heating Equipment Rebates – Residential;
Water Conservation Kits; and
Home Energy Reports (survey component only).
2.2.1.3 Stratified Random Sampling
For the SourceGas Commercial & Industrial programs, Simple Random Sampling is not an effective sampling methodology as the CV values observed in business programs are typically very high because the distributions of savings are generally positively skewed. Often, a relatively small number of projects account for a high percentage of the estimated savings for the program.
To address this situation, we use a sample design for selecting projects for the M&V sample that takes such skewness into account. With this approach, we select a number of sites with large savings for the sample with certainty and take a random sample of the remaining sites. To further improve the precision, non-certainty sites are selected for the sample through systematic random sampling. That is, a random sample of sites remaining after the certainty sites have been selected is selected by ordering them according to the magnitude of their savings and using systematic random sampling. Sampling systematically from a list that is ordered according to the magnitude of savings ensures that any sample selected will have some units with high savings, some with moderate savings, and some with low savings. Samples cannot result that have concentrations of sites with atypically high savings or atypically low savings. As a result of this methodology, the required sample for the C&I Solutions Program was reduced to 24 with one certainty stratum and four sample strata. Programs that were evaluated using stratified random sampling include:
Heating Equipment Rebates – Non-Residential;
Water Heating Equipment Rebates – Non-Residential;
Commercial & Industrial Solutions – Direct Install Component.
APSC FILED Time: 3/26/2014 2:23:55 PM: Recvd 3/26/2014 2:04:55 PM: Docket 07-078-TF-Doc. 185
2013 SourceGas DSM Portfolio Final Evaluation Report
General Methodology 2-5
2.2.2 Free-Ridership In determining ex post net savings for the SourceGas DSM portfolio, the Evaluators provide estimates of free-ridership for individual programs. Free-riders are program participants that would have implemented the same energy efficiency measures at nearly the same time absent the program. As per TRM guidelines, free-riders are defined as:
“…program participants who received an incentive but would have installed the same efficiency measure on their own had the program not been offered. This includes partial free riders, defined as customers who, at some point, would have installed the measure anyway, but the program persuaded them to install it sooner or customers who would have installed the measure anyway but the program persuaded them to install more efficient equipment and/or more equipment. For the purposes of EM&V activities, participants who would have installed the equipment within one year will be considered full free riders; whereas participants who would have installed the equipment later than one year will not be considered to be free riders (thus no partial free riders will be allowed).”3
Given this definition, participants are defined as free-riders through a binary scoring mechanism, in being either 0% or 100% free-riders. Models of free-ridership utilized in these EM&V efforts were aimed at providing a probability of free-ridership; this probability value was then rounded to a whole-number free-ridership value.
2.2.2.1 Residential Free-Ridership
The general methodology for evaluating free-ridership among residential participants involved examination of four factors:
(1) Demonstrated financial ability to purchase high efficiency equipment absent the rebate
(2) Importance of the rebate in the decision-making process
(3) Prior planning to purchase high efficiency equipment
(4) Demonstrated behavior in purchasing similar equipment absent a rebate
In this methodology, Part (1) is essentially a gateway value, in that if a participant does not have the financial ability to purchase energy efficient equipment absent a rebate, the other components of free-ridership become moot. As such, if they could not have afforded the high efficiency equipment absent the rebate, free-ridership is scored at 0%. If they did have the financial capability, the Evaluators then examine the other three components. The respondent is determined to be a free-rider based upon a preponderance of evidence of these three factors;; that is, if the respondent’s answers indicate free-ridership in two or more of these three components, they are considered
3 Arkansas TRM V1.0, Pg. 53.
APSC FILED Time: 3/26/2014 2:23:55 PM: Recvd 3/26/2014 2:04:55 PM: Docket 07-078-TF-Doc. 185
2013 SourceGas DSM Portfolio Final Evaluation Report
General Methodology 2-6
free-riders. Specific questions and modifications to this general methodology are presented in the appropriate program chapters.
For residential programs, free-ridership is calculated as the average score determined for the sample of participants surveyed. For programs that are contractor-driven, the free-rider score of a survey respondent incorporates the relative importance of advice from their contractor, provided that the contractor is a program trade ally that received training from the appropriate program. This value is then applied to the program-level savings to discount savings attributable to free-ridership.
2.2.2.2 Prescriptive Non-Residential Free-Ridership
The general methodology for evaluating free-ridership among prescriptive program participants involved examination of four factors:
(1) Demonstrated financial ability to purchase high efficiency equipment absent the rebate
(2) Importance of the rebate in the decision-making process
(3) Prior planning to purchase high efficiency equipment
(4) Importance of the contractor in influencing the decision-making process4
In this methodology, Part (1) is essentially a gateway value, in that if a participant does not have the financial ability to purchase energy efficient equipment absent a rebate, the other components of free-ridership become moot. As such, if they could not have afforded the high efficiency equipment absent the rebate, free-ridership is scored at 0%. If they did have the financial capability, the Evaluators then examine the other three components. The respondent is determined to be a free-rider based upon a preponderance of evidence of these three factors;; that is, if the respondent’s answers indicate free-ridership in two or more of these three components, they are considered free-riders. Specific questions and modifications to this general methodology are presented in the appropriate program chapters.
For non-residential programs, free-ridership is calculated as the average score determined for the sample of participants surveyed. This value is then applied to the program-level savings to discount savings attributable to free-ridership.
2.2.2.3 Custom Free-Ridership
For custom projects from the C&I Solutions Program, free-ridership is assessed on a case-study basis, through which the Evaluators conduct an in-depth interview that includes a battery of questions addressing: 4 Contractor recommendations were considered to be program-inducement in instances where findings from
vendor interviews showed that the program changed the mix of products sold by the vendor and that the vendor responsible for the customers’ installation was a program trade ally.
APSC FILED Time: 3/26/2014 2:23:55 PM: Recvd 3/26/2014 2:04:55 PM: Docket 07-078-TF-Doc. 185

2013 SourceGas DSM Portfolio Final Evaluation Report
General Methodology 2-7
The timing of learning of the program relative to the timing of the planning of the retrofit;
The impact the program incentive has on measure payback relative to the stated payback requirements by the respondent;
Whether the respondent learned of the energy efficiency measure from a program-funded audit; and
Whether any influence the program had in modifying the project affected savings by greater than 50%.
In the C&I Solutions chapter, the free-rider “case studies” are provided for every custom project.
2.2.3 Process Evaluation The Evaluator’s general approach to process evaluation begins with a review of the tests for timing and appropriateness of process evaluation as defined in Protocol C of the TRM V3.0. In this review, the Evaluators determine what aspects of the program warrant a process evaluation (due to issues identified in the 2012 evaluations). Most SourceGas programs over-performed, and as such most of the 2013 process evaluation activity was focused around identifying SourceGas and implementer response to 2012 recommendations.
The 2013 process overviews began with interviews of program staff. These interviews, along with guidance from IEM protocols, inform the establishment of goals for the process evaluation, provide background history of programs, and give an introduction to portfolio-level issues. From this, the Evaluators then develop a list of data collection activities. The data collection procedures for process evaluations typically included:
Participant Surveying. The Evaluators surveyed statistically significant samples of participants in each program in order to provide feedback for the program and provide an assessment of participant satisfaction.
In-Depth Interviews. The Evaluators conducted in-depth interviews with high-level program actors, including SourceGas program staff, third-party implementation staff, and program Trade Allies. These interviews are semi-structured, in having general topics to be covered, without fully prescribed question and answer frameworks.
Review of Marketing Materials. The Evaluators reviewed marketing materials for each program, providing feedback as to the appropriateness of the message in reaching its target audience, the breadth of the audience that the effort is attempting to reach, and identifying possible cross-promotional opportunities.
APSC FILED Time: 3/26/2014 2:23:55 PM: Recvd 3/26/2014 2:04:55 PM: Docket 07-078-TF-Doc. 185

2013 SourceGas DSM Portfolio Final Evaluation Report
General Methodology 2-8
Best Practices Assessment. The Evaluators compared the SourceGas programs and portfolio as a whole against industry best practices. The best practices were drawn from the self-benchmarking tool at eebestpractices.com and from the 2004 Best Practices study completed by Quantum Consulting on behalf of the California Public Utilities Commission5.
5 Volume S – Crosscutting Best Practices and Project Summary. Quantum Consulting. December 2004
APSC FILED Time: 3/26/2014 2:23:55 PM: Recvd 3/26/2014 2:04:55 PM: Docket 07-078-TF-Doc. 185

Portfolio-Level Summary 3-1
3. Portfolio-Level Findings This chapter provides a summary of the portfolio-level findings and any cross-cutting evaluation activities that occurred over the course of the 2013 EM&V Effort. Specifically, this chapter includes:
A summary of program and portfolio performance in 2013;
A summary of EM&V activities and expenditures in 2013;
High-level findings that cut across programs.
3.1 Summary of EM&V Effort
Table 3-1 summarizes the EM&V expenditures by the Evaluators, total EM&V expenditures by all parties, and total program budgets.
Table 3-1 SourceGas DSM Portfolio 2013 EM&V Expenditures
Evaluators’ EM&V
Expenditures
2013 EM&V Expenditures
2013 Program Expenditures
Evaluator’s EM&V as % of
Budget $63,415 $87,254 $2,225,124 2.85%
All programs in the SourceGas DSM Portfolio received a formal process evaluation in 2012. As such, process evaluation activities in 2013 were limited to research areas identified in the 2012 evaluations. Error! Reference source not found. summarizes the data collection efforts for the 2013 EM&V effort. “Interviews” should be distinguished from “Surveys” in that “Interviews” reflect semi-structured, in-depth discussions with high-level program actors (such as utility staff and third-party implementation staff) whereas surveys are fully-structured and typically conducted with program participants.
Table 3-2 Summary of Data Collection Efforts
Program # Site Visits # Surveys # Interviews Heating Equipment Rebates 4 68 10 Water Heating Equipment Rebates 2 23 7 Residential New Construction 0 37 8 C&I Solutions 10 80 9 Commercial Cooking Equipment 1 3 2 Home Energy Reports 0 0 1 Water Conservation Kits 0 100 2 Total 17 311 39
.
APSC FILED Time: 3/26/2014 2:23:55 PM: Recvd 3/26/2014 2:04:55 PM: Docket 07-078-TF-Doc. 185

2013 SourceGas DSM Portfolio Final Evaluation Report
Portfolio-Level Summary 3-2
3.2 Tests of Portfolio Comprehensiveness
The Arkansas Public Service Commission has in place a set of criteria in order to determine whether a DSM portfolio qualifies as “Comprehensive”. These criteria are:
Factor 1: Whether the programs and/or portfolio provide, either directly or through identification and coordination, the education, training, marketing, or outreach needed to address market barriers to the adoption of cost-effective energy efficiency measures;
Factor 2: Whether the programs and/or portfolio, have adequate budgetary, management, and program delivery resources to plan, design, implement, oversee and evaluate energy efficiency programs;
Factor 3: Whether the programs and/or portfolio, reasonably address all major end-uses of electricity or natural gas, or electricity and natural gas, as appropriate;
Factor 4: Whether the programs and/or portfolio, to the maximum extent reasonable, comprehensively address the needs of customers at one time, in order to avoid cream-skimming and lost opportunities;
Factor 5: Whether such programs take advantage of opportunities to address the comprehensive needs of targeted customer sectors (for example, schools, large retail stores, agricultural users, or restaurants) or to leverage non-utility program resources (for example, state or federal tax incentive, rebate, or lending programs);
Factor 6: Whether the programs and/or portfolio enables the delivery of all achievable, cost-effective energy efficiency within a reasonable period of time and maximizes net benefits to customers and to the utility system;
Factor 7: Whether the programs and/or portfolio, have evaluation, measurement, and verification "EM&V") procedures adequate to support program management and improvement, calculation of energy, demand and revenue impacts, and resource planning decisions.
The Evaluators reviewed the SourceGas programs and portfolio in order to assess whether it was in compliance with the APSC Comprehensiveness Goals. In assessing these metrics, the Evaluators score them on numerous subcomponents. The scoring methodology is as follows:
z: Meets all requirements and is in full compliance with this performance indicator
: Meets some requirements and is in partial compliance with this performance indicator
: Is not in compliance with this performance indicator.
NA: Performance indicator is not applicable to this program.
APSC FILED Time: 3/26/2014 2:23:55 PM: Recvd 3/26/2014 2:04:55 PM: Docket 07-078-TF-Doc. 185

2013 SourceGas DSM Portfolio Final Evaluation Report
Portfolio-Level Summary 3-3
3.2.1 Factor 1: Education, Training, Marketing, and Outreach
3.2.1.1 Assessment of Education
The Evaluators assessed the educational components of the SourceGas programs, in order to identify whether the programs were providing potential participants with the needed information to guide their decision-making, and whether the channels used to reach the target markets are appropriate. The Evaluators found that:
SourceGas’ programs used a range of channels to provide educational materials to their programs’ target markets. The educational materials included brochures, case studies, and presentations to trade & industry groups.
SourceGas program staff conducts outreach and education through a wide range of potential program partners, including contractors, retailers, home builders, and local governments.
The breadth of educational materials by program is summarized in Table 3-3. This table and the other tables addressing portfolio comprehensiveness will include entries for the new Home Energy Savings Program, which was not started until November, 2013. This program did not receive EM&V in 2013, but the Evaluators reviewed the program manual to support the comprehensiveness assessment. For factors that require EM&V to address, values of “UK” (“unknown”) will be entered for this program.
Table 3-3 Assessment of Customer Education by Program
Program Provides
Educational Materials
Outreach Through Multiple Channels
Education Targeted to
Specific Market Barriers
Coordination of Education by Multiple
Entities
Heating Equipment Rebates z z z z Water Heating Equipment Rebates6 z z z z Water Conservation Kits z z z NA Home Energy Reports z NA z NA Commercial Cooking Equipment Rebates z z C&I Solutions z z z z Home Energy Savings Program z z UK UK
3.2.1.2 Assessment of Training
The Evaluators reviewed each SourceGas program to assess whether:
1) Whether the program is trade ally-driven
2) If not, is it a program that could or should be trade ally-driven
6 For the comprehensiveness assessment, the Evaluators separated Water Heating & Conservation into two
subprograms: Water Heating Equipment Rebates and Water Conservation Kits.
APSC FILED Time: 3/26/2014 2:23:55 PM: Recvd 3/26/2014 2:04:55 PM: Docket 07-078-TF-Doc. 185

2013 SourceGas DSM Portfolio Final Evaluation Report
Portfolio-Level Summary 3-4
3) The program provides training classes to support their program offerings
4) Whether the programs need trade ally certification
Table 3-4 Assessment of Trade Ally Training by Program
Program Trade Ally Training Offered
Training Requirements
Adhere to Best Practices
Trade Allies Participate in Training
Heating Equipment Rebates z z Water Heating Equipment Rebates z z Water Conservation Kits NA NA NA Home Energy Reports NA NA NA Commercial Cooking Equipment Rebates z C&I Solutions z z z Home Energy Savings Program z UK UK
Heating and Water Heating were marked as partial compliance in that they provide thorough and comprehensive training to HVAC contractors and plumbers but have not done so for home builders. This is marked as an area of outreach expected going forward.
For Commercial Cooking Equipment, the trade allies that have participated have been referrals from CenterPoint’s Commercial Food Service CIP. In 2013, all participating trade allies have been based in the Little Rock metro area, and overall there has been little engagement by local vendors. This is to some degree expected, given that more vendors are concentrated in that portion of the state, but there are local vendors that could be engaged in the program.
SourceGas does not require trade ally registration to participate. Their approach has been to allow all licensed dealers or contractors to apply for the appropriate equipment rebates. The Evaluators have concluded that this has not to-date affected the quality assurance of the programs.
3.2.1.3 Marketing & Outreach
The Evaluators reviewed the marketing and outreach strategies associated with each of the SourceGas programs. These strategies were reviewed to assess whether they adequately addressed the relevant participant barriers, the extent to which trade allies were actively marketing the program (where appropriate), and whether the materials were correctly targeted in marketing a comprehensive approach to energy efficiency.
A summary of the Evaluators’ assessment of SourceGas marketing and outreach is presented in Table 3-5.
APSC FILED Time: 3/26/2014 2:23:55 PM: Recvd 3/26/2014 2:04:55 PM: Docket 07-078-TF-Doc. 185

2013 SourceGas DSM Portfolio Final Evaluation Report
Portfolio-Level Summary 3-5
Table 3-5 Assessment of Marketing & Outreach by Program
Program
Marketing Addresses
Specific Barriers
Trade Allies
Promote Program
Marketing Support Provided to Trade
Allies
Marketing Performed
Through Diverse
Channels Heating Equipment Rebates z z Water Heating Equipment Rebates z z Water Conservation Kits z NA NA z Home Energy Reports z NA NA NA Commercial Cooking Equipment Rebates z C&I Solutions z z Home Energy Savings Program UK UK UK UK
After reviewing the marketing and outreach materials, the Evaluators concluded that:
Most programs have marketing materials that address specific barriers associated with the targeted segments or technologies.
There is a lack of trade ally promotion of the Heating and Water Heating Equipment Rebate Programs among the home builder community. The promotion of the retrofit component is actively driven by HVAC and plumbing contractors, however.
Trade ally involvement in the C&I Solutions Program has improved from 2012, but is not yet up to the standards required. Trade allies for this program reported being largely unaware of the program-level marketing efforts, and though they include incentives in their pitches to potential customers, they are not provided with adequate marketing materials.
The SourceGas programs are marketed through a diverse range of channels, including mass-media advertising, online advertising, meetings and training sessions with professional organizations and trade groups, and partnered marketing with municipal governments.
The SourceGas programs for the non-residential sector all apply past participant case studies in their marketing.
The Evaluators did determine that the materials for trade-ally driven programs could be enhanced by the addition of co-branded materials. SourceGas should consider identifying top-performing trade allies and developing brochures or fact sheets incorporating both the trade ally’s and SourceGas’ logo.
Presently, the commercial program is marketed with dedicated materials. This is a departure from prior program years, during which residential and commercial marketing materials were comingled, which resulted in conflicting information on the same brochures. The brochure used in marketing the prescriptive commercial program is shown in Figure 3-1.
APSC FILED Time: 3/26/2014 2:23:55 PM: Recvd 3/26/2014 2:04:55 PM: Docket 07-078-TF-Doc. 185

2013 SourceGas DSM Portfolio Final Evaluation Report
Portfolio-Level Summary 3-6
Figure 3-1 SourceGas Prescriptive Commercial Brochure
3.3 Factor 2: Budgetary, Management, and Program Delivery Resources
Several performance indicators were assessed in reviewing the adequacy of budgetary, management, and program delivery resources. This included:
Self-reports from program management staff
APSC FILED Time: 3/26/2014 2:23:55 PM: Recvd 3/26/2014 2:04:55 PM: Docket 07-078-TF-Doc. 185

2013 SourceGas DSM Portfolio Final Evaluation Report
Portfolio-Level Summary 3-7
Cost per Therm saved
Review of trade ally resources dedicated to program promotion
Table 3-6 Assessment of Budgetary, Management, and Program Delivery Resources by Program
Program
Budget is Sufficient to
Support Program
Goals
Cost per-Therm
Aligns with Program
Plan
Program Has
Sufficient Staffing
Program Has
Sufficient Trade Ally Support
Heating Equipment Rebates z z z Water Heating Equipment Rebates z z z Water Conservation Kits z z z NA Home Energy Reports z z NA NA Commercial Cooking Equipment Rebates z z C&I Solutions z z z Home Energy Savings Program z UK z UK
From this review, the Evaluators concluded that the SourceGas portfolio overall has the adequate budget and staff allocations. Across all programs, actual costs per-Therm are significantly lower than planned. For example:
Heating Equipment Rebates costs per-Therm are 72.3% of program plan values, while exceeding the participant and savings goals.
Water Heating & Conservation costs per-Therm are 49.5% of program plan values, while exceeding the participant and savings goals.
Commercial Cooking Equipment Rebates had a higher cost per-Therm than anticipated, however. Program plants were for a total cost of $3.84 per net annual Therm, and the Evaluators verified $6.68/annual Therm.
3.4 Factor 3: Addressing Major End-Uses
The Evaluators identified the end-uses served by each of the SourceGas programs. Most SourceGas programs are designed around a specific technology or end-use. Table 3-7 summarizes the end-uses addressed by each program.
Table 3-7 End-Uses Addressed by Program Program HVAC Hot
Water Appliances Food Service
Building Envelope
Industrial Process Behavioral
Heating Equipment Rebates z Water Heating Equipment Rebates z Water Conservation Kits z Home Energy Reports z Commercial Cooking Equipment z C&I Solutions z z z Home Energy Savings Program z z z Measure targeted Measure offered Measure not offered
APSC FILED Time: 3/26/2014 2:23:55 PM: Recvd 3/26/2014 2:04:55 PM: Docket 07-078-TF-Doc. 185

2013 SourceGas DSM Portfolio Final Evaluation Report
Portfolio-Level Summary 3-8
Presently, the SourceGas portfolio covers most end-uses. The Evaluators found that sectors where the program offerings were not providing sufficient outreach and market transformation included:
Residential storage tank water heating. As stated later in this report, the Evaluators concluded that this segment would be better-reached with incentives delivered at the distributor level.
Residential appliances. The TRM V3.0 includes deemed savings for residential appliances, including dishwashers and clothes washers. These are not presently offered in any SourceGas programs. However, given the low unit energy savings of these measures, any offering for this end-use would need to be an upstream, multi-utility effort in order to be cost-effective.
3.5 Factor 4: Comprehensively Addressing Customer Needs
To assess Factor 4, the Evaluators reviewed SourceGas programs to discern the extent of:
Program-provided technical assistance;
Incentives of comprehensive projects/measure suites; and
Tiered incentives for higher efficiency levels.
The SourceGas portfolio has no specific requirements for installation of multiple measures. Customers are able participate to an extent of their choice. This is a program best-practice in enabling customers to engage in energy efficiency in a manner in accordance with their budget constraints. However, there is no specific encouragement in place to incentivize comprehensive projects, as seen elsewhere in Arkansas.
Table 3-8 summarizes the comprehensiveness of offerings for each program.
Table 3-8 Assessment of Project Comprehensiveness by Program
Program
Technical Assistance
and/or Audits
Information Provided for
Comprehensive Efficiency
Bundled Incentives
for Multiple
Measures
Tiered Incentives
for Premium Efficiency
Trade Ally Incentives
for Premium Efficiency
Heating Equipment Rebates z z Water Heating Equipment Rebates z z Water Conservation Kits NA NA NA Home Energy Reports z NA NA NA Commercial Cooking Equipment Rebates z z NA NA NA C&I Solutions z z z Home Energy Savings Program z z z
Findings from the assessment of this factor included:
APSC FILED Time: 3/26/2014 2:23:55 PM: Recvd 3/26/2014 2:04:55 PM: Docket 07-078-TF-Doc. 185
2013 SourceGas DSM Portfolio Final Evaluation Report
Portfolio-Level Summary 3-9
Most SourceGas prescriptive programs offer incentives to trade allies for installation of top-tier efficiency measures. This has included incentives for condensing furnaces, and tankless water heaters.
The SourceGas portfolio offers tiered incentives for premium efficiency across all of their rebate programs. This includes:
- The incentives for the Heating Equipment Rebates Program increase from $400 for units with 90-94.99 AFUE to $600 for units with 95 AFUE or greater.
- Incentives in the Water Heating Equipment Rebates Program range from $50 for .62 EF storage tank water heaters to $500 for tankless and condensing water heaters
- The C&I Solutions program pays an incentive per verified Therm, and as a result projects with higher savings are by design paid a higher incentive.
- The Home Energy Savings Program pays per-square foot incentives for ceiling insulation and per-CFM reduction for duct sealing.
The SourceGas portfolio has programs that bundle on-site technical assistance with direct installation.
The range of technical assistance varies by program. The Heating Equipment and Water Heating Equipment Rebates programs offer technical assistance through trade allies. C&I Solutions provides on-site technical assistance that is directly funded by the program.
The programs have procedures for following up with customers after their participation (including thank-you calls or emails) and verification inspection.
Marketing materials typically make attempts at cross-promotion of programs.
Areas where comprehensiveness can be improved upon include:
None of the programs offer incentives for multiple-measure installation. This is an avenue for encouraging comprehensiveness that should be investigated.
3.6 Factor 5: Targeting Market Sectors & Leveraging Opportunities
The Evaluators reviewed whether the SourceGas portfolio offered a comprehensive range of energy efficiency opportunities to all major customer sectors. Table 3-9 summarizes the market sectors and what programs target or allow each sector.
APSC FILED Time: 3/26/2014 2:23:55 PM: Recvd 3/26/2014 2:04:55 PM: Docket 07-078-TF-Doc. 185

2013 SourceGas DSM Portfolio Final Evaluation Report
Portfolio-Level Summary 3-10
Table 3-9 Assessment of Targeted Customer Sectors by Program
Program
Re
sid
en
tial
Mu
ltif
amily
Mo
bile
Ho
me
Smal
l Co
mm
erc
ial
Larg
e C
om
me
rcia
l
Ind
ust
rial
Agr
icu
ltu
ral
Pu
blic
Se
cto
r
Heating Equipment Rebates z z z z Water Heating Equipment Rebates z z z z z Water Conservation Kits z z z z Home Energy Reports z Commercial Cooking Equipment Rebates z z z C&I Solutions z z z z Home Energy Savings Program z z Program targets this sector Sector is eligible for this program Sector is ineligible for this program
Each sector has several programs for which they are eligible, and at least one program that targets them. Segment-specific findings include:
Agriculture and Industrial sectors are not specifically targeted by the Heating and Water Heating Equipment Rebates programs as the equipment used by these facilities generally requires custom calculations.
Public Sector facilities are targeted with a wide range of programs. This has included residential programs that reach out to public housing authorities.
In addition, the Evaluators reviewed the extent of collaboration and leveraging of available partnership opportunities by SourceGas.
Examples of cross-utility coordination included:
SourceGas has brought on a third-party implementer (CLEAResult) for their C&I Solutions Program. This implementer uses the same program design and incentive levels for CenterPoint and AOG. This has allowed for reduced program costs for C&I Solutions, which is the largest program in each of the three gas utility portfolios.
In late 2013, SourceGas established the Home Energy Savings Program. This weatherization program is using a program model applied elsewhere in Arkansas in by Entergy. SourceGas has arranged program partnering agreements with multiple electric utilities to leverage the effectiveness of program funds. In addition to multiple investor-owned utilities, SourceGas is developing partnerships with municipal utilities and rural cooperatives that have an interest in providing weatherization services to their residential customers.
APSC FILED Time: 3/26/2014 2:23:55 PM: Recvd 3/26/2014 2:04:55 PM: Docket 07-078-TF-Doc. 185
2013 SourceGas DSM Portfolio Final Evaluation Report
Portfolio-Level Summary 3-11
Through a joint contract, the Evaluators provide EM&V to AOG, CenterPoint, and SourceGas Arkansas. This allows for sharing of fixed EM&V costs (such as development of data collection instruments) and more seamless comparison of program offerings and lessons learned across the natural gas energy efficiency portfolio. This has reduced the overall cost of EM&V across all three natural gas utilities.
Examples of coordination with non-utility partners included:
SourceGas’ programs are marketed through industry partners included professional organizations, trade groups, universities, and homeowners associations.
SourceGas works with a local technical college to help provide training opportunities to trade allies and students interested in careers related to energy efficiency.
In addition, the SourceGas programs had promoted available tax credits for qualifying equipment. Many of these have since been phased out (with the depletion of ARRA funding) but it is still a program practice to promote these tax credits when possible.
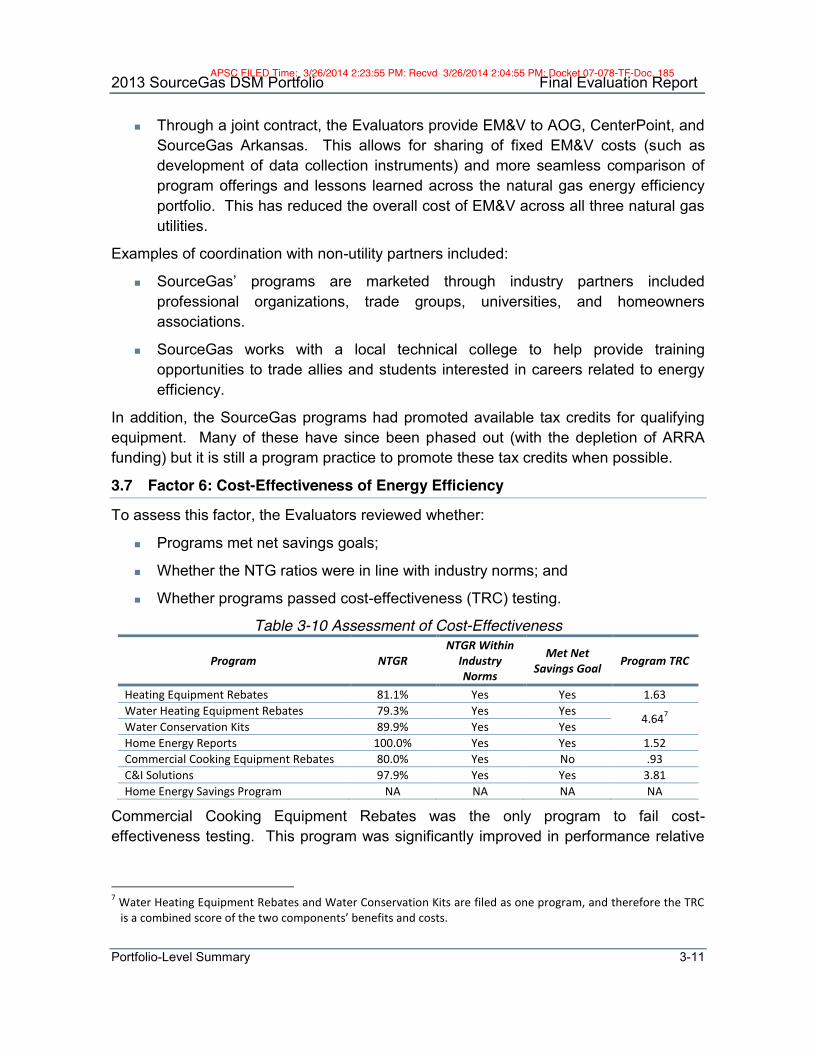
3.7 Factor 6: Cost-Effectiveness of Energy Efficiency
To assess this factor, the Evaluators reviewed whether:
Programs met net savings goals;
Whether the NTG ratios were in line with industry norms; and
Whether programs passed cost-effectiveness (TRC) testing.
Table 3-10 Assessment of Cost-Effectiveness
Program NTGR NTGR Within
Industry Norms
Met Net Savings Goal Program TRC
Heating Equipment Rebates 81.1% Yes Yes 1.63 Water Heating Equipment Rebates 79.3% Yes Yes
4.647 Water Conservation Kits 89.9% Yes Yes Home Energy Reports 100.0% Yes Yes 1.52 Commercial Cooking Equipment Rebates 80.0% Yes No .93 C&I Solutions 97.9% Yes Yes 3.81 Home Energy Savings Program NA NA NA NA
Commercial Cooking Equipment Rebates was the only program to fail cost-effectiveness testing. This program was significantly improved in performance relative
7 Water Heating Equipment Rebates and Water Conservation Kits are filed as one program, and therefore the TRC is a combined score of the two components’ benefits and costs.
APSC FILED Time: 3/26/2014 2:23:55 PM: Recvd 3/26/2014 2:04:55 PM: Docket 07-078-TF-Doc. 185

2013 SourceGas DSM Portfolio Final Evaluation Report
Portfolio-Level Summary 3-12
to 2012 (where the program had a TRC score of .30), and with a small degree of increased scaling, would pass TRC.
3.8 Factor 7: Adequacy of EM&V Procedures The Evaluators conducted a review of EM&V procedures by program as implemented by several parties:
QA/QC and EM&V procedures by SourceGas program staff;
QA/QC and EM&V procedures by third-party implementation staff (where applicable)
QA/QC and EM&V procedures by the Evaluators.
The EM&V of the SourceGas programs incorporated industry best practices and was conducted in an iterative process that incorporated feedback from SourceGas and implementation contractors as well as the Independent Evaluation Monitor (IEM). The Evaluators developed EM&V plans that corresponded to protocols set out in the Arkansas TRM V3.0. However, over the course of the EM&V process, some activities deviated from the EM&V plans:
The sample of interviews for trade allies within the C&I Solutions Program was smaller than anticipated due to a smaller population than expected at the time of EM&V plan development.
Survey samples for Heating Equipment and Water Heating Equipment were scaled down based on lower participation levels.
Further, the Evaluators found that based on 2012 program recommendations, SourceGas has significantly increased the stringency of QA/QC procedures, introducing randomized post-inspection to their programs.
Finally, the Evaluators reviewed the quality of program tracking data in order to assess whether the data allowed for complete evaluation. Further, the Evaluators reviewed the extent to which individual savings calculations were performed using facility-specific inputs into the TRM V3.0 algorithms versus the use of simplifying assumptions8. The results of the review are summarized in Table 3-11.
8 Examples of this could include assuming average facility square footage for commercial water heating and using
that as an input to the savings calculation, as opposed to collecting facility-specific square footage.
APSC FILED Time: 3/26/2014 2:23:55 PM: Recvd 3/26/2014 2:04:55 PM: Docket 07-078-TF-Doc. 185

2013 SourceGas DSM Portfolio Final Evaluation Report
Portfolio-Level Summary 3-13
Table 3-11 Assessment of Data & QA/QC Procedures by Program
Program
Tracking Contains
Necessary Fields
Savings Calculations Performed
and Reported
Savings Calculations
Based on Facility Data
QA/QC Inspections by Program Staff
Heating Equipment Rebates z z z z Water Heating Equipment Rebates z z Water Conservation Kits z z z Home Energy Reports z z z Commercial Cooking Equipment z z z z C&I Solutions z z z z Home Energy Savings Program UK UK UK z
Findings of this review included:
The Heating Equipment Rebates and Water Heating Equipment Rebates programs lacked contact names for most commercial projects in 2012. SourceGas added this in 2013, greatly assisting the EM&V process.
In prior program years, the Evaluators found the C&I Solutions tracking data to be inadequate in that it did not contain contact names, peak Therms calculations, or consistent measure naming. In 2013, it was found that all of these issues had been corrected.
QA/QC inspections are in place for all programs other than the Water Conservation Kits Program. For the Water Conservation Kits Program, post-inspection of participant residences is not likely to add value, and savings calculations by SourceGas already incorporate expected in-service rates. QA/QC is performed by the Evaluators via telephone survey.
3.9 Other Portfolio-Level Findings
The data collected through the program-level evaluations were used to inform findings and recommendations regarding changes and improvements that could be made at both the utility and regulatory level. Portfolio cross-cutting issues are detailed in the subsections to follow.
3.10 Impact of Opt-outs
The Evaluators submitted a data request to SourceGas for a summary of opt-out customers, including:
How many opt-out eligible customers are there;
How many customers have opted out; and
How many opt-out eligible customers have participated in SourceGas programs in 2011-2013.
APSC FILED Time: 3/26/2014 2:23:55 PM: Recvd 3/26/2014 2:04:55 PM: Docket 07-078-TF-Doc. 185

2013 SourceGas DSM Portfolio Final Evaluation Report
Portfolio-Level Summary 3-14
In total, SourceGas has 50 opt out-eligible customers in their service territory. This group consists of 47 industrial facilities, two medical facilities, and one educational facility. For 2013, there were 13 industrial facilities opted-out, in addition to one educational facility. One additional customer has stated their intention to opt out effective 2015.
Of those 50 opt out-eligible customers, 13 have participated in SourceGas programs and received rebates. Ten other opt-out eligible customers have received facility audits through the C&I Solutions Program, but have not yet reserved funds or decided to opt out. Twelve opt-out eligible customers have neither opted out nor engaged in program activity.
3.11 Portfolio-Level Recommendations
The issues examined within these categories and associated recommendations are summarized in Error! Reference source not found..
APSC FILED Time: 3/26/2014 2:23:55 PM: Recvd 3/26/2014 2:04:55 PM: Docket 07-078-TF-Doc. 185

2012 SourceG
as DS
M P
ortfolio Final E
valuation Report
Portfolio-Level S
umm
ary 3-15
Table 3-12 Portfolio-Level Summ
ary of Issues & Recomm
endations
Issue Raised in 2012
Process Evaluation?
Consequences Steps U
ndertaken to Address Additional Recom
mended Steps
Portfolio does not have m
echanisms to further-
incentivize comprehensive
projects
No
Lost savings opportunities. Failure to m
eet APSC com
prehensiveness guidelines.
None.
Develop a “bonus incentive” for projects that include m
ultiple m
easures at a single facility.
New
construction market is
not engaged in SourceGas program
s N
o
Lost savings opportunities. Failure to m
eet ASPC com
prehensiveness guidelines
None.
Engage the home builder
comm
unity in a manner that
mirrors the successful approach
with HVAC contractors.
Coordinate with SW
EPCO, AO
G, and CenterPoint to identify any interested hom
e builders that they have engaged that also serve SourceGas territory.
APSC FILED
Time: 3/26/2014 2:23:55 PM
: Recvd 3/26/2014 2:04:55 PM
: Docket 07-078-TF-D
oc. 185
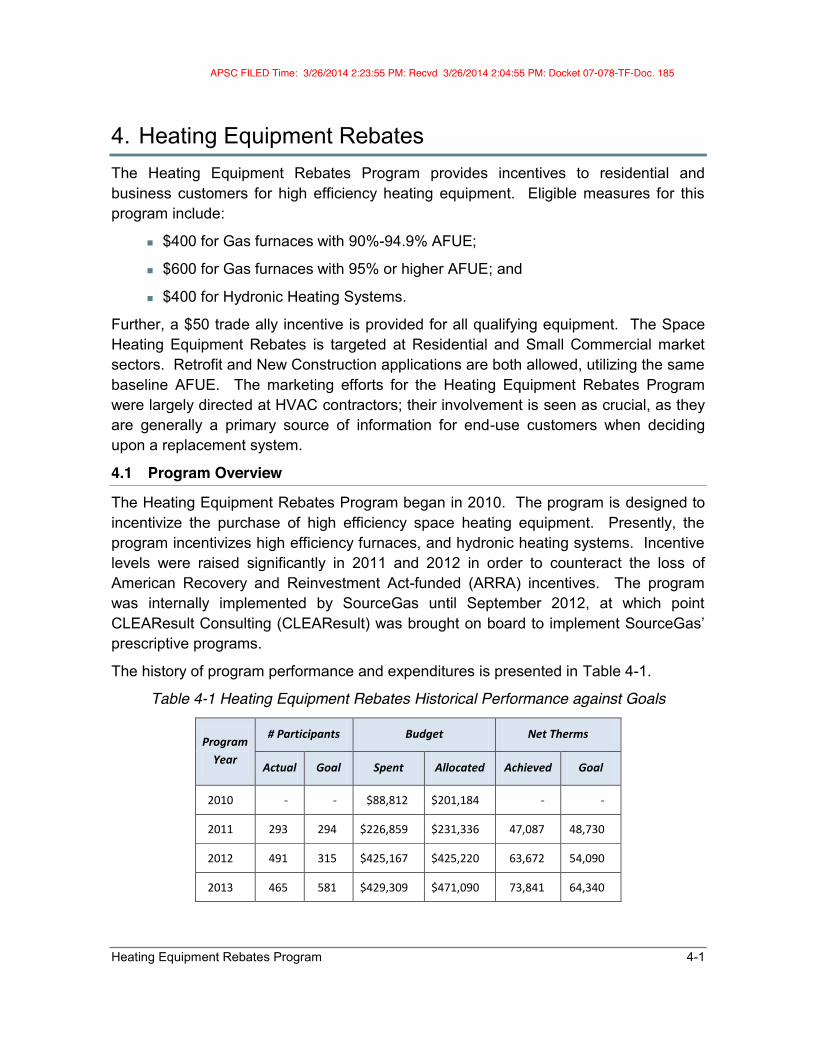
Heating Equipment Rebates Program 4-1
4. Heating Equipment Rebates The Heating Equipment Rebates Program provides incentives to residential and business customers for high efficiency heating equipment. Eligible measures for this program include:
$400 for Gas furnaces with 90%-94.9% AFUE;
$600 for Gas furnaces with 95% or higher AFUE; and
$400 for Hydronic Heating Systems.
Further, a $50 trade ally incentive is provided for all qualifying equipment. The Space Heating Equipment Rebates is targeted at Residential and Small Commercial market sectors. Retrofit and New Construction applications are both allowed, utilizing the same baseline AFUE. The marketing efforts for the Heating Equipment Rebates Program were largely directed at HVAC contractors; their involvement is seen as crucial, as they are generally a primary source of information for end-use customers when deciding upon a replacement system.
4.1 Program Overview
The Heating Equipment Rebates Program began in 2010. The program is designed to incentivize the purchase of high efficiency space heating equipment. Presently, the program incentivizes high efficiency furnaces, and hydronic heating systems. Incentive levels were raised significantly in 2011 and 2012 in order to counteract the loss of American Recovery and Reinvestment Act-funded (ARRA) incentives. The program was internally implemented by SourceGas until September 2012, at which point CLEAResult Consulting (CLEAResult) was brought on board to implement SourceGas’ prescriptive programs.
The history of program performance and expenditures is presented in Table 4-1.
Table 4-1 Heating Equipment Rebates Historical Performance against Goals
Program Year
# Participants Budget Net Therms
Actual Goal Spent Allocated Achieved Goal
2010 - - $88,812 $201,184 - -
2011 293 294 $226,859 $231,336 47,087 48,730
2012 491 315 $425,167 $425,220 63,672 54,090
2013 465 581 $429,309 $471,090 73,841 64,340
APSC FILED Time: 3/26/2014 2:23:55 PM: Recvd 3/26/2014 2:04:55 PM: Docket 07-078-TF-Doc. 185
2013 SourceGas DSM Portfolio Final Evaluation Report
Heating Equipment Rebates Program 4-2
4.1.1 Participation Summary 4.1.1.1 Residential Participation Summary
The 2013 Heating Equipment Rebates Program had a total of 465 processed rebates. The participation comprised:
369 residential rebates at 349 premises; and
96 commercial rebates at 31 premises.
At the equipment level, residential participation included:
38 furnaces with 90-94.99% AFUE;
330 furnaces with 95% AFUE or greater; and
1 Hydronic heating system.
90.8% of residential rebates issued were for retrofit projects. 9.2% were for new construction projects.
4.1.1.2 Commercial Participation Summary
Commercial participation comprised:
1. 79 furnaces with 95 or greater AFUE; and
2. 17 with AUFE of 90-94.99.
43.7% of commercial rebates were for retrofit projects. 56.3% were for new construction projects. Figure 4-1 summarizes the participation levels by facility type.
APSC FILED Time: 3/26/2014 2:23:55 PM: Recvd 3/26/2014 2:04:55 PM: Docket 07-078-TF-Doc. 185

2013 SourceGas DSM Portfolio Final Evaluation Report
Heating Equipment Rebates Program 4-3
Figure 4-1 Heating Equipment Rebates Commercial Participation by Facility Type
The bulk of commercial participation was through public schools, churches, and office facilities. Public schools and churches comprised most of the new construction projects, as several new, multi-building campuses were completed which required a large number of furnaces.
4.1.1.3 Participation Timing
Figure 4-2 summarizes the savings by month as determined by the date of rebate delivery. The two lines represent the total number of units installed in the specified month of 2013. As can be seen in the graph, there was a significant amount of summer-time installation of furnaces. This high level of summer installations is due to two factors:
1) As found in 2012, much of the participation is driven by customers needing replacing their air conditioner. The program trade allies use this opportunity to upsell residential customers on a cooling-heating package deal.
2) The summer cooling season is the high season for residential new construction.
The Evaluators examined the data for residential rebates from May 1st to September 30th, and found that 6.0% of these rebates were new construction. This is slightly lower than the overall percent of new construction rebates (9.2%).
2.1%
3.0%
6.6%
7.7%
2.4%
18.2%
18.0%
42.1%
1.0%
2.1%
3.1%
4.2%
5.2%
25.0%
28.1%
31.3%
0.0% 5.0% 10.0% 15.0% 20.0% 25.0% 30.0% 35.0% 40.0% 45.0%
Generic 24/7
Medical
Manufacturing
Retail
Restaurant
Office
Assembly/Worship
Education
n=96 % Projects % Savings
APSC FILED Time: 3/26/2014 2:23:55 PM: Recvd 3/26/2014 2:04:55 PM: Docket 07-078-TF-Doc. 185

2013 SourceGas DSM Portfolio Final Evaluation Report
Heating Equipment Rebates Program 4-4
Figure 4-2 Heating Equipment Rebates by Month
4.2 Heating Equipment Rebates Process Evaluation The Evaluators conducted a formal process evaluation of the Heating Equipment Rebates Program in 2012, and found that the program was successful in meeting participation, savings, and satisfaction goals. Table 4-2 and Table 4-3 summarize the Evaluators’ review of the Heating Equipment Rebates Program in comparison to TRM V3.0 Protocol C for timing and conditions of conducting a process evaluation.
Table 4-2 Determining Appropriate Timing to Conduct a Process Evaluation
Component Determination New and Innovative Components
No. The program is designed in a manner consistent with similar programs elsewhere and applies deemed savings values from the TRM.
No Previous Process Evaluation No. The program received a comprehensive process evaluation in 2012.
New Vendor or Contractor Mixed. Program implementation was taken over by CLEAResult late in 2012.
0
10
20
30
40
50
60
# R
eb
ate
s
Residential Rebates Commercial Rebates
APSC FILED Time: 3/26/2014 2:23:55 PM: Recvd 3/26/2014 2:04:55 PM: Docket 07-078-TF-Doc. 185

2013 SourceGas DSM Portfolio Final Evaluation Report
Heating Equipment Rebates Program 4-5
Table 4-3 Determining Appropriate Conditions to Conduct a Process Evaluation Component Determination
Are program impacts lower or slower than expected? No. The program exceeded savings goals in 2012.
Are the educational or informational goals not meeting program goals?
No. The programs have had successful consumer and contractor outreach & education.
Are the participation rates lower or slower than expected? No. The program met participant goals in 2012.
Are the program’s operational or management structure slow to get up and running or not meeting program administrative needs?
No. The 2012 process evaluation found that operational and management structure to be up to speed and efficient in administering the program.
Is the program’s cost-effectiveness less than expected?
No, the program’s cost-effectiveness was within expected boundaries.
Do participants report problems with the programs or low rates of satisfaction? No. 2012 participant surveys found high satisfaction levels.
Is the program producing the intended market effects?
Yes. Interviews with participating contractors in 2012 found significant market transformation occurring.
On this basis, the Evaluators concluded that process evaluation activities for 2013 would be limited. The 2012 process evaluation did not fully examine the new construction market, and as a result for 2013 researchable issues included:
Response of home builders to the program
Assessing levels of early replacement
Reviewing SourceGas’ response to 2012 recommendations
4.2.1 Data Collection Activities The process evaluation of Heating Equipment Rebates included the following activities:
Program Actor In-Depth Interviews. The Evaluators conducted in-depth interviews with a series of program actors. These interviews covered a range of topics, including marketing efforts, feedback on program delivery, an assessment of barriers to program implementation and success, and recommendations for program improvement. Program Actors interviewed include:
- SourceGas Program Staff. The Evaluators interviewed staff at SourceGas involved in the administration of the Heating Equipment Rebates Program. These interviews built upon interviews conducted in 2012, keeping apprised of SourceGas’ involvement as the program develops.
- Third Party Implementation Staff Interviews. The Evaluators conducted interviews with CLEAResult involved with the C&I Solutions Program. These interviews addressed development of the program over in 2013.
- Trade Ally Interviews. With the development of a trade ally network, the Evaluators sought feedback from active trade allies in order to address
APSC FILED Time: 3/26/2014 2:23:55 PM: Recvd 3/26/2014 2:04:55 PM: Docket 07-078-TF-Doc. 185

2013 SourceGas DSM Portfolio Final Evaluation Report
Heating Equipment Rebates Program 4-6
how they interact with the program, and to identify potential areas of program enhancement.
Participant Surveying. The Evaluators surveyed separate samples of residential and non-residential participants in the Heating Equipment Rebates Program. In addition to their use in developing free-ridership and spillover estimates, these surveys informed the process evaluation of the Heating Equipment Rebates Program. These surveys addressed issues including participant satisfaction with the program offerings, demographics and firmographics, and other contextual issues regarding the participation process. Further, the data from these surveys served to quantify the extent of early replacement.
Error! Reference source not found. summarizes the data collection for this process evaluation effort. This includes the titles, role, and sample sizes for data collection.
Table 4-4 SourceGas Heating Equipment Rebates Data Collection Summary
Target Component Activity N Role
SourceGas Program Staff
Manager of Energy Efficiency
Interview 1
Overall administration of SourceGas DSM programs. This manager is involved in the larger strategic decisions associated with the DSM portfolio, and is involved with the Heating Equipment Rebates Program and in the overall coordination of utility resources.
CLEAResult Staff Program Coordinator Interview 1
Handles day-to-day operations, including mass market outreach, application review, billing, and logistics
Program Participants
Residential Retrofit Survey 68
Residential retrofit respondents included retrofit and new construction participants that received incentives for high efficiency furnaces rated at 90 AFUE or higher.
Residential New Construction Survey 37
Residential new construction respondents included the occupants of new homes that installed qualifying space heating equipment.
HVAC Contractor Interviews Participating Interview 8 Participating HVAC contractors are the primary
drivers of retrofit participation. Builder Interviews Participating Interview 8 Participating builders drive the new construction
program participation.
4.2.2 Process Results & Findings This section will present the results and key findings from the data collection activities. These findings are based upon interviews with utility staff, implementation staff, surveys with participants, and thorough and in-depth literature review.
4.2.2.1 Response to Program Recommendations
Table 8-5 summarizes the status of issues and recommendations identified in the 2012 process evaluation.
APSC FILED Time: 3/26/2014 2:23:55 PM: Recvd 3/26/2014 2:04:55 PM: Docket 07-078-TF-Doc. 185
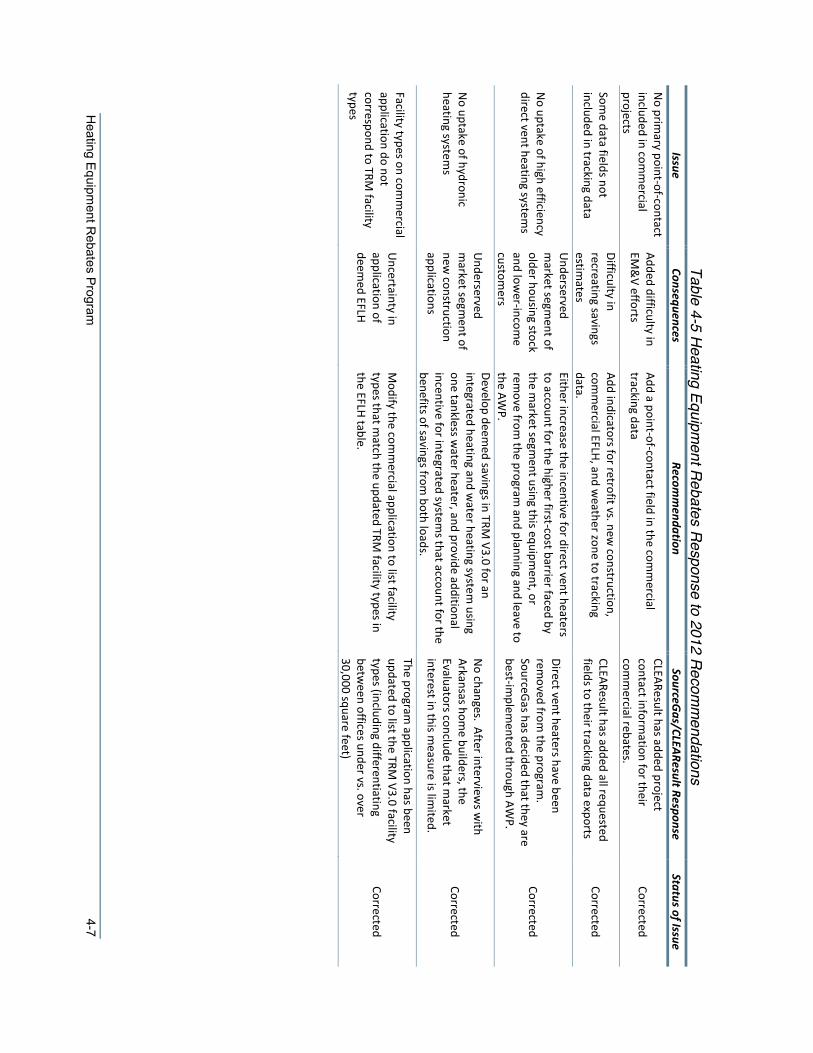
Heating Equipm
ent Rebates Program
4-7
Table 4-5 Heating Equipment Rebates Response to 2012 Recom
mendations
Issue Consequences
Recomm
endation SourceG
as/CLEAResult Response Status of Issue
No prim
ary point-of-contact included in com
mercial
projects
Added difficulty in EM
&V efforts
Add a point-of-contact field in the comm
ercial tracking data
CLEAResult has added project contact inform
ation for their com
mercial rebates.
Corrected
Some data fields not
included in tracking data
Difficulty in recreating savings estim
ates
Add indicators for retrofit vs. new construction,
comm
ercial EFLH, and weather zone to tracking
data.
CLEAResult has added all requested fields to their tracking data exports
Corrected
No uptake of high efficiency
direct vent heating systems
Underserved
market segm
ent of older housing stock and low
er-income
customers
Either increase the incentive for direct vent heaters to account for the higher first-cost barrier faced by the m
arket segment using this equipm
ent, or rem
ove from the program
and planning and leave to the AW
P.
Direct vent heaters have been rem
oved from the program
. SourceGas has decided that they are best-im
plemented through AW
P.
Corrected
No uptake of hydronic
heating systems
Underserved
market segm
ent of new
construction applications
Develop deemed savings in TRM
V3.0 for an integrated heating and w
ater heating system using
one tankless water heater, and provide additional
incentive for integrated systems that account for the
benefits of savings from both loads.
No changes. After interview
s with
Arkansas home builders, the
Evaluators conclude that market
interest in this measure is lim
ited.
Corrected
Facility types on comm
ercial application do not correspond to TRM
facility types
Uncertainty in
application of deem
ed EFLH
Modify the com
mercial application to list facility
types that match the updated TRM
facility types in the EFLH table.
The program application has been
updated to list the TRM V3.0 facility
types (including differentiating betw
een offices under vs. over 30,000 square feet)
Corrected
APSC FILED
Time: 3/26/2014 2:23:55 PM
: Recvd 3/26/2014 2:04:55 PM
: Docket 07-078-TF-D
oc. 185

2013 SourceGas DSM Portfolio Final Evaluation Report
Heating Equipment Rebates Program 4-8
4.2.2.2 Program Data Collection
The data requirements for residential furnaces increased with the change to TRM V3.0. This change occurred too late in the program year for the program to accommodate it in 2013. However, SourceGas and CLEAResult worked to revise their application form to collect the new data needed for TRM V3.0 residential furnace calculations, including:
Home vintage; and
Home square feet.
Figure 4-3 is an excerpt from the application form showing the new data fields used to collect data to support TRM V3.0 calculations starting 2014.
Figure 4-3 Excerpt from Residential Furnace Application – TRM V3.0 Data Fields
Further, the application form has added fields to capture early replacement. This includes:
Figure 4-4 Excerpt from Residential Furnace Application – Early Replacement Data Fields
SourceGas may want to consider removing the “required” portion of the age of replaced equipment. It is good to capture this information to help quantify early replacement savings, but the lack of this information should not serve as the basis for rejecting an application.
4.2.3 Residential Survey Response The Evaluators completed 68 surveys with residential program participants in the Heating Equipment Rebates Program. These surveys were to collect data for net-to-gross calculations and for process evaluation activities. Further, the Evaluators collected demographic information on the respondents during the survey. These were compared against non-participant residential demographics in order to address differences between participants and the general population. These are summarized in Figure 4-5 through Figure 4-7.
APSC FILED Time: 3/26/2014 2:23:55 PM: Recvd 3/26/2014 2:04:55 PM: Docket 07-078-TF-Doc. 185

2013 SourceGas DSM Portfolio Final Evaluation Report
Heating Equipment Rebates Program 4-9
Figure 4-5 Differences in Income between Participants and Non-Participants
Figure 4-6 Differences in Education between Participants and Non-Participants
13.2%
4.4%
14.7%
8.8%
16.2% 17.6%
25.0%
15.7% 13.0%
16.0%
12.0%
7.3% 10.3%
25.7%
0.0%
5.0%
10.0%
15.0%
20.0%
25.0%
30.0%
35.0%
40.0%
45.0%
50.0%
Less than$25k
$25k-$35k $36k-$50k $51k-$75k $76k-$100k Greaterthan $100k
Refused
Participants Non-Participants
20.6%
26.5% 29.4%
14.7%
8.8%
40.7%
19.0% 18.0%
12.3% 10.0%
0.0%
5.0%
10.0%
15.0%
20.0%
25.0%
30.0%
35.0%
40.0%
45.0%
50.0%
High School orLess
Associates /Some College
Four-YearCollege
Graduate /Professional
Refused
Participants Non-Participants
APSC FILED Time: 3/26/2014 2:23:55 PM: Recvd 3/26/2014 2:04:55 PM: Docket 07-078-TF-Doc. 185

2013 SourceGas DSM Portfolio Final Evaluation Report
Heating Equipment Rebates Program 4-10
Figure 4-7 Differences in Home Age between Participants and Non-Participants
From the demographic analysis, the Evaluators found that the differences in participant versus non-participant demographics on income and education level have lessened in the last program year. An increased number of middle-income customers participated in the Heating Equipment Rebates program in 2013.
4.2.3.1 Program Awareness
SourceGas’ marketing of the Heating Equipment Rebates Program is driven through multiple channels, including both customer-direct outreach and marketing through HVAC contractors. Sixty-eight percent of residential respondents surveyed indicated having learned of the program from an HVAC contractor. The second most-commonly indicated source of program awareness was word of mouth from friends and relatives (13.2%). No other source was indicated by more than 6% of respondents. The sources of awareness for the Heating Equipment Rebates Program are summarized in Table 4-6.
25.0% 27.9%
16.2% 17.6%
8.8%
4.4%
20.7% 18.3%
13.3% 16.0%
26.0%
5.7%
0.0%
5.0%
10.0%
15.0%
20.0%
25.0%
30.0%
35.0%
40.0%
45.0%
50.0%
Before 1970's 1970's 1980's 1990's 2000-present Don't know
Participants Non-Participants
APSC FILED Time: 3/26/2014 2:23:55 PM: Recvd 3/26/2014 2:04:55 PM: Docket 07-078-TF-Doc. 185
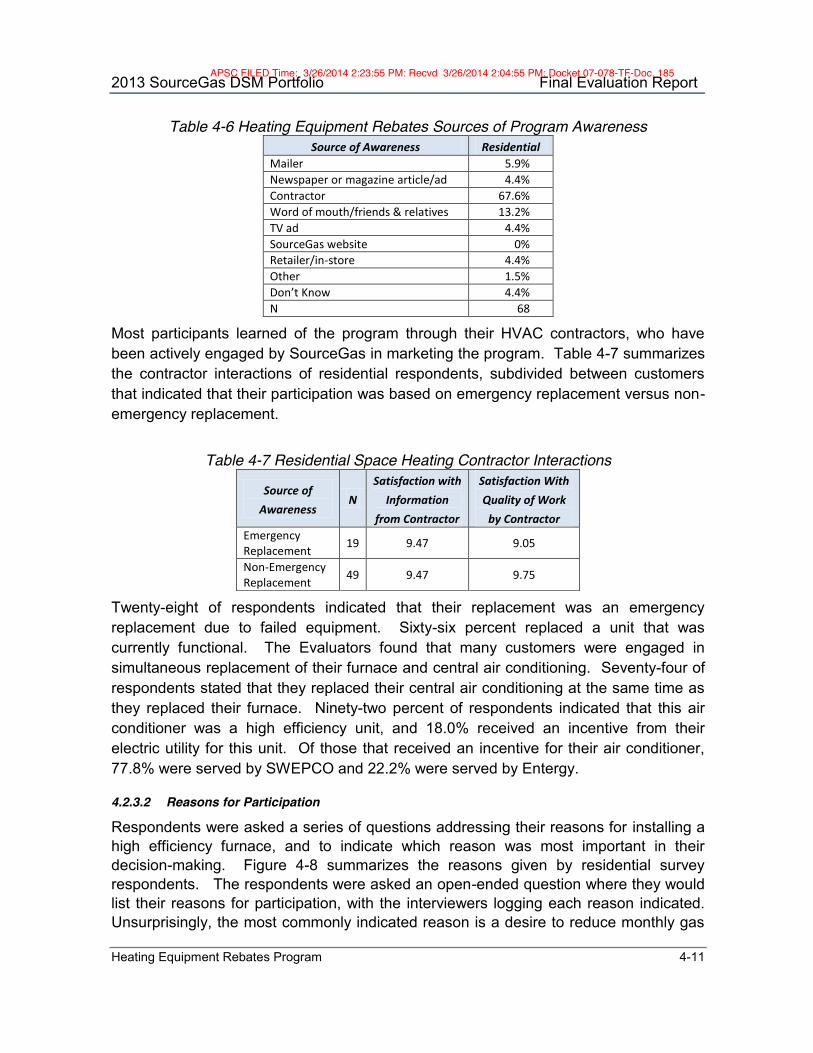
2013 SourceGas DSM Portfolio Final Evaluation Report
Heating Equipment Rebates Program 4-11
Table 4-6 Heating Equipment Rebates Sources of Program Awareness Source of Awareness Residential
Mailer 5.9% Newspaper or magazine article/ad 4.4% Contractor 67.6% Word of mouth/friends & relatives 13.2% TV ad 4.4% SourceGas website 0% Retailer/in-store 4.4% Other 1.5% Don’t Know 4.4% N 68
Most participants learned of the program through their HVAC contractors, who have been actively engaged by SourceGas in marketing the program. Table 4-7 summarizes the contractor interactions of residential respondents, subdivided between customers that indicated that their participation was based on emergency replacement versus non-emergency replacement.
Table 4-7 Residential Space Heating Contractor Interactions
Source of Awareness
N Satisfaction with
Information from Contractor
Satisfaction With Quality of Work
by Contractor Emergency Replacement 19 9.47 9.05
Non-Emergency Replacement 49 9.47 9.75
Twenty-eight of respondents indicated that their replacement was an emergency replacement due to failed equipment. Sixty-six percent replaced a unit that was currently functional. The Evaluators found that many customers were engaged in simultaneous replacement of their furnace and central air conditioning. Seventy-four of respondents stated that they replaced their central air conditioning at the same time as they replaced their furnace. Ninety-two percent of respondents indicated that this air conditioner was a high efficiency unit, and 18.0% received an incentive from their electric utility for this unit. Of those that received an incentive for their air conditioner, 77.8% were served by SWEPCO and 22.2% were served by Entergy.
4.2.3.2 Reasons for Participation
Respondents were asked a series of questions addressing their reasons for installing a high efficiency furnace, and to indicate which reason was most important in their decision-making. Figure 4-8 summarizes the reasons given by residential survey respondents. The respondents were asked an open-ended question where they would list their reasons for participation, with the interviewers logging each reason indicated. Unsurprisingly, the most commonly indicated reason is a desire to reduce monthly gas
APSC FILED Time: 3/26/2014 2:23:55 PM: Recvd 3/26/2014 2:04:55 PM: Docket 07-078-TF-Doc. 185

2013 SourceGas DSM Portfolio Final Evaluation Report
Heating Equipment Rebates Program 4-12
bills. Without prompting, 9.5% of respondents indicated the rebate as a reason for purchasing a high efficiency furnace, and 12.5% listed the recommendation from their contractor as the reason.
Figure 4-8 Residential Space Heating Reasons for Purchase of High Efficiency
Furnaces
4.2.3.3 Program Satisfaction
Participants were asked to rate their satisfaction on a scale of 1-10 on a range of items related to their program experience. Table 4-8 tabulates the satisfaction results.
55.9%
13.2%
13.2%
1.5%
14.7%
2.9%
2.9%
1.5%
5.9%
0.0% 10.0% 20.0% 30.0% 40.0% 50.0% 60.0%
Reduce gas bill
Contractor recommendation
Program rebate
Recommendation from friend /relative
Right thing to do
Good for the environment
Home remodel
Was getting an air conditioner
Other
n=68
APSC FILED Time: 3/26/2014 2:23:55 PM: Recvd 3/26/2014 2:04:55 PM: Docket 07-078-TF-Doc. 185

2013 SourceGas DSM Portfolio Final Evaluation Report
Heating Equipment Rebates Program 4-13
Table 4-8 Heating Equipment Rebates Residential Satisfaction Levels Element of Program Experience Mean
Score Don't Know
Information provided by your contractor 9.47 2.94%
The quality of installation work by your contractor 9.55 1.47%
The performance of the space heating equipment you had installed 9.69 1.47%
The savings on your monthly gas bill 8.43 27.94%
The effort required to apply for the rebate 9.29 2.94%
The wait-time to receive the rebate 8.09 4.41%
The service provided by SourceGas staff 8.83 13.24%
Information provided by SourceGas on how to reduce your gas bill 8.02 16.18%
Improvement in home comfort with the new space heating equipment 9.30 7.35%
The rebate amount 9.24 8.82%
Overall program experience 9.48 2.94%
Overall satisfaction with the Heating Equipment Rebates Program is high. Respondents indicated particularly high satisfaction with the information provided by their contractor, the level of service provided by their contractor, the performance of the equipment installed, and the program rebate amount. This is indicative of a healthy program in that the SourceGas contractor network does not require official registration as a trade ally; SourceGas has taken an “open tent” approach, allowing any licensed contractor to receive a trade ally incentive. This approach was taken with the intent that it would maximize participation, and the survey data collected indicates that this approach has not sacrificed any quality of service or of equipment for the end-users.
On the operational side, customers indicated high satisfaction levels with incentive amounts, effort to apply for a rebate, and service by SourceGas staff with mean scores of 9.24, 9.29, and 8.83 respectively.
4.2.4 Trade Ally Interviews The Evaluators interviewed eight participating HVAC contractors in the EM&V effort for the Heating Equipment Rebates Program. These Eight contractors interviewed accounted for 36.3% of 2013 furnace installations. The contractors were asked questions detailing their level of participation as well as what they perceive as the benefits of the program.
APSC FILED Time: 3/26/2014 2:23:55 PM: Recvd 3/26/2014 2:04:55 PM: Docket 07-078-TF-Doc. 185

2013 SourceGas DSM Portfolio Final Evaluation Report
Heating Equipment Rebates Program 4-14
4.2.4.1 Program Participation
Respondents were asked if the Heating Equipment Rebates Program helps them sell their products and services. Six of the eight interviewed contractors stated that it does. Responses included:
“When there is a rebate, then they are looking at the more efficient furnace because the purchase becomes more viable. It helps me upscale the whole package (air quality, programmable thermostats)” “Definitely helps us sell high efficiency”
Among those that stated that the program does not help, responses included:
“We have customers who don’t participate in the program. Not a big selling point for us” “We haven’t changed how we run our business”
Overall, these trade allies have found that the SourceGas incentive covers most of the incremental cost of high efficiency furnaces. The four interviewed contractors stated that the percent of their sales that are high efficiency units has increased dramatically. On average, the contractors indicated that one third of their sales were of high efficiency units prior to participating in the program, but that with program incentives this has gone up to over 80%.
4.2.4.2 Outreach, Marketing, and Customer Awareness
The trade allies were asked several questions about outreach and marketing from the perspective of their company, the utility, and the implementer as well as customer awareness of the program’s existence.
Trade allies were evenly split on their expectations of the extent of their participation in 2014. Some expected to be more active as they have found that as general awareness of SourceGas’ programs increases, their opportunities to upsell their customers increase. Others expressed a sentiment that they are already doing all they can to engage their customers, and that based on this, their participation level will be driven by market forces outside of their control.
Eighty-eight percent of trade allies interviewed stated that generally, their customers learn of the program from them. Only one trade ally indicated that their customers are usually aware of the program prior to contacting them.
When asked if the utility could do more to market the Heating Equipment Rebates Program, the respondents provided some feedback on their perception of what messaging is most convincing to their customers.
“I think the most effective is to put it in the simplest terms for the end user. If I’m talking to the customer about efficiency, I tell them dollar savings per
APSC FILED Time: 3/26/2014 2:23:55 PM: Recvd 3/26/2014 2:04:55 PM: Docket 07-078-TF-Doc. 185

2013 SourceGas DSM Portfolio Final Evaluation Report
Heating Equipment Rebates Program 4-15
month. I put a dollar value on it. I show them their savings compared to their current system. We also encourage them for other efficient equipment (programmable thermostats).” “Some it just showing the extended cost of operating the units. Showing them the savings over a period of time. Because of the program, the initial cost is not as great.”
When asked to identify the primary barriers to adoption of high efficiency furnaces, after mentioning cost most trade allies indicated general awareness of the extent of savings available by switching to a high efficiency unit. Given that much of the participation includes the replacement of functioning units, participants can see significant cost savings through the retrofit of their furnace.
4.2.4.3 Program Process Feedback
The respondents were also asked about feedback on elements of the program process including the application process and incentive amounts. Respondents were mostly satisfied with the participation process. However, one contractor stated that he was uncertain in the past as to whether the program was being continued. He had one customer ask about the program, and having not heard that the program was still going, he informed the customer that the program was cancelled. The customer found out that this was not the case, but this was more than 90 days after the installation. The contractor paid $500 out of pocket to the customer to apologize for his misinformation. Program staff should attempt to reassure their trade allies of the continuing of the program prior to the start of a new program year. A trade ally newsletter listing program requirements and rebates and assuring that the program will continue could help this. If this is done, it should be timed for December of the current program year, to give updated information that would take effect as of January 1st. Three respondents replied that the application process did not need any changes as they found it was simple and easy to fill out. One respondent that completed a large number of rebates indicated that they would prefer a shorter application.
4.2.4.4 Interactions with Staff and Training
The participating contractors were also asked to characterize their interactions with SourceGas staff. As with other components of their participation, responses were overwhelmingly positive.
“I always have easy and pleasant experience. I’ve never had any trouble.” “Very good. We have been very pleased with anything that we do with them. They make sure we’re up to date. No problems.” “We’ve mostly talked about the sizing and other information. Very helpful and informative.”
APSC FILED Time: 3/26/2014 2:23:55 PM: Recvd 3/26/2014 2:04:55 PM: Docket 07-078-TF-Doc. 185
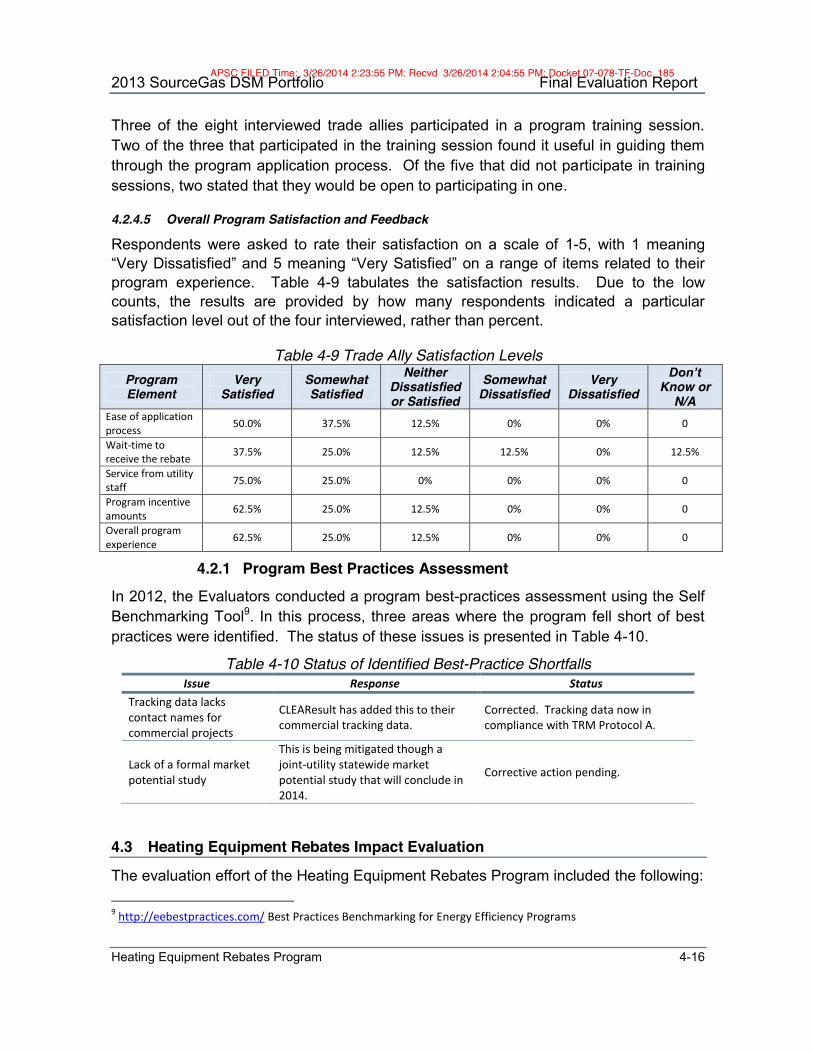
2013 SourceGas DSM Portfolio Final Evaluation Report
Heating Equipment Rebates Program 4-16
Three of the eight interviewed trade allies participated in a program training session. Two of the three that participated in the training session found it useful in guiding them through the program application process. Of the five that did not participate in training sessions, two stated that they would be open to participating in one.
4.2.4.5 Overall Program Satisfaction and Feedback
Respondents were asked to rate their satisfaction on a scale of 1-5, with 1 meaning “Very Dissatisfied” and 5 meaning “Very Satisfied” on a range of items related to their program experience. Table 4-9 tabulates the satisfaction results. Due to the low counts, the results are provided by how many respondents indicated a particular satisfaction level out of the four interviewed, rather than percent.
Table 4-9 Trade Ally Satisfaction Levels
Program Element
Very Satisfied
Somewhat Satisfied
Neither Dissatisfied or Satisfied
Somewhat Dissatisfied
Very Dissatisfied
Don’t Know or
N/A Ease of application process 50.0% 37.5% 12.5% 0% 0% 0
Wait-time to receive the rebate 37.5% 25.0% 12.5% 12.5% 0% 12.5%
Service from utility staff 75.0% 25.0% 0% 0% 0% 0
Program incentive amounts 62.5% 25.0% 12.5% 0% 0% 0
Overall program experience 62.5% 25.0% 12.5% 0% 0% 0
4.2.1 Program Best Practices Assessment In 2012, the Evaluators conducted a program best-practices assessment using the Self Benchmarking Tool9. In this process, three areas where the program fell short of best practices were identified. The status of these issues is presented in Table 4-10.
Table 4-10 Status of Identified Best-Practice Shortfalls Issue Response Status
Tracking data lacks contact names for commercial projects
CLEAResult has added this to their commercial tracking data.
Corrected. Tracking data now in compliance with TRM Protocol A.
Lack of a formal market potential study
This is being mitigated though a joint-utility statewide market potential study that will conclude in 2014.
Corrective action pending.
4.3 Heating Equipment Rebates Impact Evaluation
The evaluation effort of the Heating Equipment Rebates Program included the following: 9 http://eebestpractices.com/ Best Practices Benchmarking for Energy Efficiency Programs
APSC FILED Time: 3/26/2014 2:23:55 PM: Recvd 3/26/2014 2:04:55 PM: Docket 07-078-TF-Doc. 185

2013 SourceGas DSM Portfolio Final Evaluation Report
Heating Equipment Rebates Program 4-17
Desk Review of Residential Calculations. The Evaluators utilized TRM V3.0 values in assessing savings from residential furnaces. The updates to residential furnaces in TRM V3.0 required data that was not collected in the 2013 implementation effort (home square footage and vintage), and as a result it was necessary to use the available proxy value for square feet (BTU/30) and home vintage data from the participant survey.
Estimation of Early Replacement Rates. The TRM V3.0 added a mechanism for quantifying savings from early retirement of residential furnaces. The Evaluators captured the data needed for this as part of the survey process, applying survey-based averages to the retrofit population.
Commercial Verification. The Evaluators applied TRM V3.0 deemed savings parameters in assessing savings of the commercial component.
Free-Ridership Estimation. Free-Ridership Rates were developed for each of the two program components. They were developed using detailed participant surveys, addressing the decision-making process to participate in the program. Topics contributing to the free-ridership analysis included the magnitude of the incentive as a motivator, the extent to which the program educated customers about new energy-saving opportunities, timing of learning of the program relative to installation of the measures, and culminating in a determination of whether the participant would have installed the same or similar equipment within one year in the absence of the program. For the residential component, separate free-ridership rates were developed for retrofit, production home new construction, and custom home new construction projects.
Spillover Estimation. Spillover was addressed for the program participants. Participants were surveyed for free ridership and process evaluation, and over the course of that survey are asked a series of questions addressing whether the Program induced them to install other energy efficient equipment without program incentive. Additionally, the Evaluators asked these customers for an estimate of savings that they expect from these measures.
4.3.1 Residential Impact Evaluation 4.3.1.1 Energy Savings Calculations
The TRM V3.0 updated the deemed savings parameters for residential furnaces. However, the new procedures required the collection of home vintages, which was not part of SourceGas’ application. To accommodate this, the Evaluators applied the TRM V3.0 protocol for home square footage proxy sizing (BTU/30) and home vintage data from collected in the retrofit participant survey.
APSC FILED Time: 3/26/2014 2:23:55 PM: Recvd 3/26/2014 2:04:55 PM: Docket 07-078-TF-Doc. 185
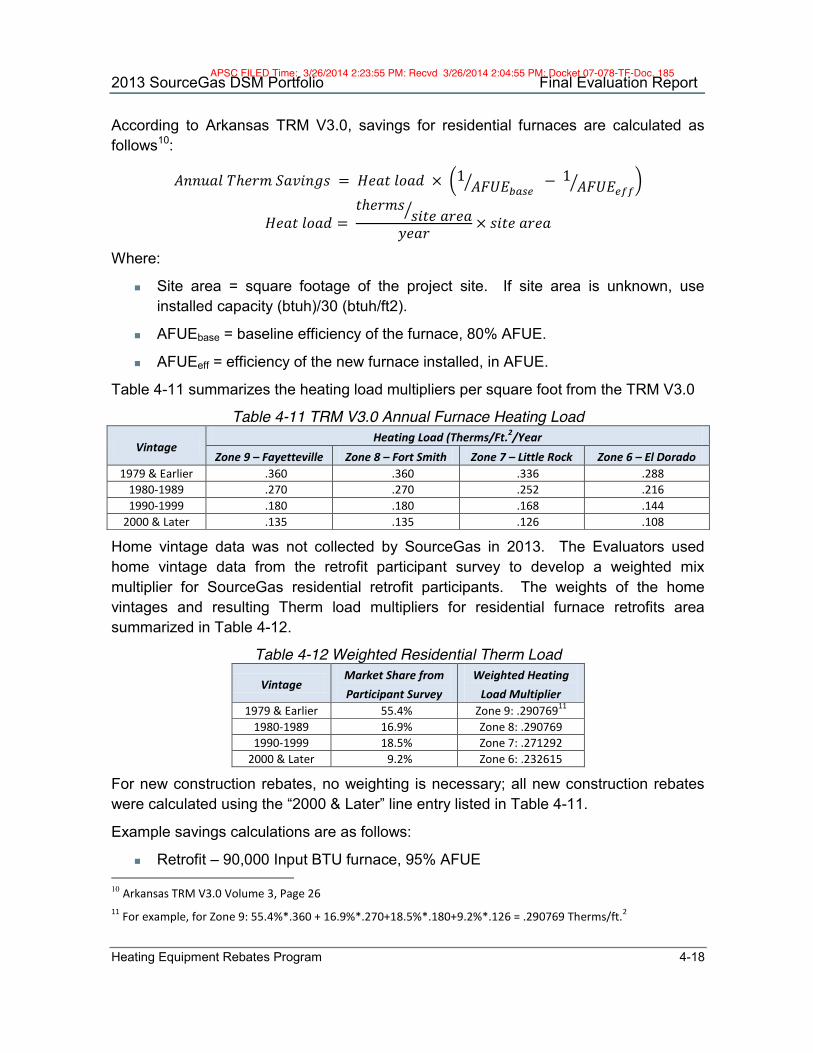
2013 SourceGas DSM Portfolio Final Evaluation Report
Heating Equipment Rebates Program 4-18
According to Arkansas TRM V3.0, savings for residential furnaces are calculated as follows10:
𝐴𝑛𝑛𝑢𝑎𝑙 𝑇ℎ𝑒𝑟𝑚 𝑆𝑎𝑣𝑖𝑛𝑔𝑠 = 𝐻𝑒𝑎𝑡 𝑙𝑜𝑎𝑑 × 1 𝐴𝐹𝑈𝐸 − 1 𝐴𝐹𝑈𝐸
𝐻𝑒𝑎𝑡 𝑙𝑜𝑎𝑑 = 𝑡ℎ𝑒𝑟𝑚𝑠 𝑠𝑖𝑡𝑒 𝑎𝑟𝑒𝑎
𝑦𝑒𝑎𝑟 × 𝑠𝑖𝑡𝑒 𝑎𝑟𝑒𝑎
Where:
Site area = square footage of the project site. If site area is unknown, use installed capacity (btuh)/30 (btuh/ft2).
AFUEbase = baseline efficiency of the furnace, 80% AFUE.
AFUEeff = efficiency of the new furnace installed, in AFUE.
Table 4-11 summarizes the heating load multipliers per square foot from the TRM V3.0
Table 4-11 TRM V3.0 Annual Furnace Heating Load
Vintage Heating Load (Therms/Ft.2/Year
Zone 9 – Fayetteville Zone 8 – Fort Smith Zone 7 – Little Rock Zone 6 – El Dorado 1979 & Earlier .360 .360 .336 .288
1980-1989 .270 .270 .252 .216 1990-1999 .180 .180 .168 .144
2000 & Later .135 .135 .126 .108
Home vintage data was not collected by SourceGas in 2013. The Evaluators used home vintage data from the retrofit participant survey to develop a weighted mix multiplier for SourceGas residential retrofit participants. The weights of the home vintages and resulting Therm load multipliers for residential furnace retrofits area summarized in Table 4-12.
Table 4-12 Weighted Residential Therm Load
Vintage Market Share from Participant Survey
Weighted Heating Load Multiplier
1979 & Earlier 55.4% Zone 9: .29076911 1980-1989 16.9% Zone 8: .290769 1990-1999 18.5% Zone 7: .271292
2000 & Later 9.2% Zone 6: .232615
For new construction rebates, no weighting is necessary; all new construction rebates were calculated using the “2000 & Later” line entry listed in Table 4-11.
Example savings calculations are as follows:
Retrofit – 90,000 Input BTU furnace, 95% AFUE 10 Arkansas TRM V3.0 Volume 3, Page 26 11 For example, for Zone 9: 55.4%*.360 + 16.9%*.270+18.5%*.180+9.2%*.126 = .290769 Therms/ft.2
APSC FILED Time: 3/26/2014 2:23:55 PM: Recvd 3/26/2014 2:04:55 PM: Docket 07-078-TF-Doc. 185

2013 SourceGas DSM Portfolio Final Evaluation Report
Heating Equipment Rebates Program 4-19
Output BTU = 90,000 x .95 = 85,500
Proxy Square Feet = 85,500 / 30 = 2,850
Location: Fayetteville, Zone 9.
𝑅𝑒𝑡𝑟𝑜𝑓𝑖𝑡 𝑇ℎ𝑒𝑟𝑚𝑠 𝑆𝑎𝑣𝑖𝑛𝑔𝑠 = 2,850𝑓𝑡. × .290769 𝑇ℎ𝑒𝑟𝑚𝑠𝑓𝑡. × 1. 80 −
1. 95 = 163.55 𝑇ℎ𝑒𝑟𝑚𝑠
The same furnace in a new construction project would save:
𝑁𝐶 𝑇ℎ𝑒𝑟𝑚𝑠 𝑆𝑎𝑣𝑖𝑛𝑔𝑠 = 2,850𝑓𝑡. × .135𝑇ℎ𝑒𝑟𝑚𝑠𝑓𝑡. × 1. 80 −
1. 95 = 75.94 𝑇ℎ𝑒𝑟𝑚𝑠
4.3.1.2 Impact of Early Replacement
The TRM V3.0 introduced a methodology for calculating the impact of early replacement. For residential furnace’s, there is a significant rate of early replacement due to the amount of participation drive by failed air conditioning units. The contractors have used that opportunity to upsell SourceGas residential customers to a package deal of a new air conditioner and furnace, using the program rebate.
For residential furnaces, early retirement AFUE is calculated by a degradation factor of a 78 AFUE unit. This is calculated as12:
𝐴𝐹𝑈𝐸 _ = (𝐵𝑎𝑠𝑒 𝐴𝐹𝑈𝐸) × (1 −𝑀)
(1) Where: 𝐵𝑎𝑠𝑒 𝐴𝐹𝑈𝐸 = efficiency of the existing equipment when new, 78% AFUE. 𝑀13 = maintenance factor, 0.01. 𝑎𝑔𝑒 = the age of the existing equipment, in years. Following this, lifetime savings are determined based on the Remaining Useful Life (RUL) of the old equipment. This is summarized in Table 4-1314.
12 Arkansas TRM V3.0 Volume 3, Page 27 13 Maintenance factor of 0.01 is the average maintenance factor for gas furnaces taken from the October 2010 National Renewable Energy publication “Building America House Simulation Protocols”, table 30.
14 AR TRM V3.0, Volume 2, Pg. 28
APSC FILED Time: 3/26/2014 2:23:55 PM: Recvd 3/26/2014 2:04:55 PM: Docket 07-078-TF-Doc. 185
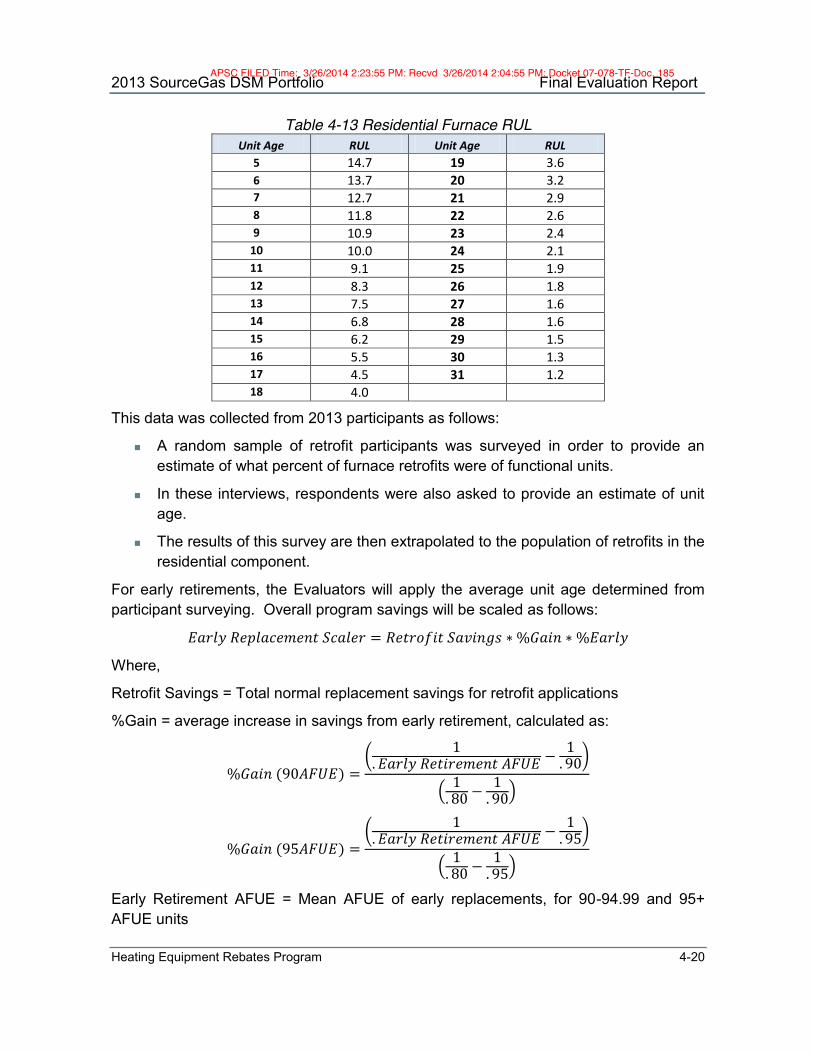
2013 SourceGas DSM Portfolio Final Evaluation Report
Heating Equipment Rebates Program 4-20
Table 4-13 Residential Furnace RUL Unit Age RUL Unit Age RUL
5 14.7 19 3.6 6 13.7 20 3.2 7 12.7 21 2.9 8 11.8 22 2.6 9 10.9 23 2.4
10 10.0 24 2.1 11 9.1 25 1.9 12 8.3 26 1.8 13 7.5 27 1.6 14 6.8 28 1.6 15 6.2 29 1.5 16 5.5 30 1.3 17 4.5 31 1.2 18 4.0
This data was collected from 2013 participants as follows:
A random sample of retrofit participants was surveyed in order to provide an estimate of what percent of furnace retrofits were of functional units.
In these interviews, respondents were also asked to provide an estimate of unit age.
The results of this survey are then extrapolated to the population of retrofits in the residential component.
For early retirements, the Evaluators will apply the average unit age determined from participant surveying. Overall program savings will be scaled as follows:
𝐸𝑎𝑟𝑙𝑦 𝑅𝑒𝑝𝑙𝑎𝑐𝑒𝑚𝑒𝑛𝑡 𝑆𝑐𝑎𝑙𝑒𝑟 = 𝑅𝑒𝑡𝑟𝑜𝑓𝑖𝑡 𝑆𝑎𝑣𝑖𝑛𝑔𝑠 ∗ %𝐺𝑎𝑖𝑛 ∗ %𝐸𝑎𝑟𝑙𝑦
Where,
Retrofit Savings = Total normal replacement savings for retrofit applications
%Gain = average increase in savings from early retirement, calculated as:
%𝐺𝑎𝑖𝑛 (90𝐴𝐹𝑈𝐸) =1
. 𝐸𝑎𝑟𝑙𝑦 𝑅𝑒𝑡𝑖𝑟𝑒𝑚𝑒𝑛𝑡 𝐴𝐹𝑈𝐸 − 1. 90
1. 80 −
1. 90
%𝐺𝑎𝑖𝑛 (95𝐴𝐹𝑈𝐸) =1
. 𝐸𝑎𝑟𝑙𝑦 𝑅𝑒𝑡𝑖𝑟𝑒𝑚𝑒𝑛𝑡 𝐴𝐹𝑈𝐸 − 1. 95
1. 80 −
1. 95
Early Retirement AFUE = Mean AFUE of early replacements, for 90-94.99 and 95+ AFUE units
APSC FILED Time: 3/26/2014 2:23:55 PM: Recvd 3/26/2014 2:04:55 PM: Docket 07-078-TF-Doc. 185

2013 SourceGas DSM Portfolio Final Evaluation Report
Heating Equipment Rebates Program 4-21
%Early = % of early replacements for 90-94.99 AFUE and 95+ AFUE units
Overall, ADM found that 66.2% of furnaces replaced were functioning units. When asked to identify the age of their replaced unit, most respondents did not know. As a result, the Evaluators do not have a SourceGas-specific age value to apply for early replacements. The survey completed for CenterPoint had a greater amount of responses (and a similar early-replacement rate, at 73.5%). The mean age of replaced units in the CenterPoint survey was:
17.26 for functioning units15
20.71 for failed units
Based on the degradation equation from TRM V3.0, this leads to an Early Retirement AFUE of:
𝐴𝐹𝑈𝐸 _ = (. 78) × (1 − .01) . = .656
The resulting scale factors for the two efficiency tiers are as follows:
%𝐺𝑎𝑖𝑛 (90𝐴𝐹𝑈𝐸) =1
. 656 −1. 90
1. 78 −
1. 90
= 241.768%
%𝐺𝑎𝑖𝑛 (95𝐴𝐹𝑈𝐸) =1
. 656 −1. 95
1. 78 −
1. 95
= 205.631%
Further, based on the values in Table 4-13, the RUL of the early replacement units is between 4.0 and 4.5 years. The Evaluators rounded this to 4.0 years, and used this as the lifetime for early replacement savings. For years 16-20 of the unit EUL, the normal replacement baseline applies.
These values were then applied on a weighted basis to the residential retrofit units using weights of 66.2% early replacement and 33.8% normal replacement.
𝑊𝑒𝑖𝑔ℎ𝑡𝑒𝑑 𝐺𝑎𝑖𝑛 (90𝐴𝐹𝑈𝐸) = 66.2% × 241.768% + 33.8% × 100% = 1.9385
𝑊𝑒𝑖𝑔ℎ𝑡𝑒𝑑 𝐺𝑎𝑖𝑛 (95𝐴𝐹𝑈𝐸) = 66.2% × 205.631% + 33.8% × 100% = 1.6993
15 In determining the average age of functioning units, the Evaluators excluded six high outliers; these units were
all over 30 years old and the Evaluators concluded that their inclusion in the Early Replacement population would be inappropriate.
APSC FILED Time: 3/26/2014 2:23:55 PM: Recvd 3/26/2014 2:04:55 PM: Docket 07-078-TF-Doc. 185

2013 SourceGas DSM Portfolio Final Evaluation Report
Heating Equipment Rebates Program 4-22
4.3.1.3 Residential Free-Ridership
Free-ridership estimates for residential participants in the Heating Equipment Rebates Program were developed through combined scoring of the survey respondents and of participating HVAC vendors. This section will detail the questions and answers from the participant survey that contributed to the participant response portion of the program free-rider scoring.
The contributing questions are divided into three subcategories:
Timing & Information Q-4 When did you decide to buy a high efficiency furnace? Was it…
Before or just when you started looking for a new furnace While getting information about furnaces but before deciding on a
contractor While deciding on a contractor After deciding on a contractor
Table 4-14 Timing of Decision to Purchase High Efficiency Relative to Timing of
Selection of Contractor Timing %
Before or just when you started looking for a new furnace 50.0%
While getting information about furnaces but before deciding on a contractor 20.6%
While deciding on a contractor 7.4% After deciding on a contractor 22.1%
n=68 Q-5 Did you know about SourceGas’ Heating Equipment Rebates Program…..
Before starting to replace your unit or did you, Learn about it while replacing the furnace
Thirty-one percent of respondents were aware of the program before starting to replace their unit. Sixty-nine percent learned of the program after deciding to replace their unit.
Importance of Rebate Q-7 Why did you decide to purchase a high efficiency furnace?
This question is open-ended, with the interviewers categorizing the answers given, and multiple answers allowed. Unprompted, 13.2% of respondents indicated the financial incentive as a reason for purchasing the high efficiency option.
APSC FILED Time: 3/26/2014 2:23:55 PM: Recvd 3/26/2014 2:04:55 PM: Docket 07-078-TF-Doc. 185

2013 SourceGas DSM Portfolio Final Evaluation Report
Heating Equipment Rebates Program 4-23
Q-10 How important was SourceGas’ rebate in your decision to buy the high efficiency space heating equipment?
When prompted to discuss the rebate, 38.2% of respondents indicated that the rebate was “very important” in their decision to purchase a high efficiency furnace. Twenty-five percent stated that the rebate was “somewhat important’, 16.2% stated “only slightly important”, and 10.3% indicated that it was “not important at all”.
Q-13 When deciding about the furnace, did you purchase a more efficient furnace than you would have because of the program rebate?
Forty-one percent responded “yes” to this question, and 55.4% responded “no”.
Q-16 Did the SourceGas rebate encourage you to install the equipment sooner than you would have? How much sooner?
Table 4-15 Effect of Rebate in Moving up Purchase Timing Installed Sooner?
% Respond
How Much Sooner? %
Yes 27.9% A year sooner 33.3% Two to three years sooner 33.3% Four to five years sooner 33.3%
No 67.6% n=3 Don’t Know 4.4%
n=68
Importance of Contractor The importance of information provided by the contractor contributes to free-ridership in that much of the participation in the Heating Equipment Rebates Program is driven by contractors that receive outreach from SourceGas instructing them about the program offerings. They in turn market the program to their customers. Contractor influence was factored into the survey respondents’ free-ridership score if the survey respondent had their unit installed by a trade ally that received training through the program. This was factored in on the basis of the participating vendor interviews, where it was indicated that the share of condensing furnaces with 95%+ AFUE installed by these vendors was increased markedly as a result of program participation.
When asked an open-ended question addressing their reason for purchasing a high efficiency furnace, 10.0% of respondents indicated that it was based on a recommendation from their contractor. Additionally, 55.0% of respondents indicated that they learned of the program from their contractor.
Q-8 In your decision to buy the high efficiency furnace, how important was information, advice, and / or recommendations from your contractor?
Eighty percent of respondents indicated that advice and recommendations from their contractor was “Very Important” in their decision to purchase a high efficiency furnace.
APSC FILED Time: 3/26/2014 2:23:55 PM: Recvd 3/26/2014 2:04:55 PM: Docket 07-078-TF-Doc. 185

2013 SourceGas DSM Portfolio Final Evaluation Report
Heating Equipment Rebates Program 4-24
Free-Rider Scoring Mechanism The above factors are combined in estimating free-ridership for each survey respondent. Their responses are then weighted by Therms savings for the respondent in determining the free-ridership rate for the commercial component. The scoring mechanism for commercial free ridership is presented in Figure 4-9.
Installed AC and furnace?
Importance of Contractor
Importance of Rebate
AC standard or
efficiency?
Rated vendor > 4?
Project advanced >1
year?
Rated rebate > 4?
Altered project?Installed by Trade Ally?
1.0 0 0.33 0 0.33 0 1
Sum of scores > 5?
NTGR = 1 NTGR = 0
Yes
Yes
Yes
Yes
NoNo
No
No
Yes No
No
Yes
Figure 4-9 Residential Space Heating Free-Ridership Diagram
The free-ridership rates for the Heating Equipment Rebates residential component are as follows:
Residential Retrofit: 17.6%
Residential New Construction (builder production homes): 8.3%
Residential New Construction (custom homes): 48.7%
Further, with SourceGas assigning the municipal housing authorities to the residential component, the Evaluators opted to apply the Home Builder NTGR to these
APSC FILED Time: 3/26/2014 2:23:55 PM: Recvd 3/26/2014 2:04:55 PM: Docket 07-078-TF-Doc. 185

2013 SourceGas DSM Portfolio Final Evaluation Report
Heating Equipment Rebates Program 4-25
participants. In addition, the Evaluators did not credit housing authorities with early replacement.
For residential retrofits, the Evaluators compared the findings of the participating survey with that of the program participant trade allies. Trade allies indicated on average that prior to their program participation, 20% of their sales had been of high efficiency equipment. With incentives, this had increased to 85%. Based off of this similarity to the participant survey results, we have opted not to add any adjustment to retrofit NTGR from the trade ally results.
4.3.1.4 Residential Participant Spillover
The residential participant survey and the homebuilder interviews addressed participant spillover. This was done through a battery of questions designed to:
1) Assess the behaviors taken by customers after their program participation where they installed energy efficient equipment; and
2) Get the respondent’s self-reported value for how important they felt information from SourceGas was in inducing this non-incentivized behavior.
None of the survey respondents in the retrofit component indicated any quantifiable spillover. Further, the interviewed builders indicated that they apply for rebates on all feasible energy efficiency improvements in their homes. As a result, the Evaluators concluded that the Heating Equipment Rebates program has no spillover.
4.3.2 Commercial Impact Evaluation Commercial impact evaluation was limited due to the small number of participants and savings. One commercial decision-maker was a municipal housing authority responsible for 154 rebates, but these were in a residential end-use. Due to the low number of commercial end-users, the Evaluators verified that savings were correctly calculated according to TRM V3.0 protocols and applied the 80% stipulate NTGR. Savings were calculated as follows16:
𝑇ℎ𝑒𝑟𝑚𝑠 𝑆𝑎𝑣𝑖𝑛𝑔𝑠 =𝐵𝑇𝑈 𝐶𝑎𝑝𝑎𝑐𝑖𝑡𝑦 ∗ 𝐸𝐹𝐿𝐻 ∗ 1
𝐸𝑓𝑓𝑖𝑐 − 1𝐸𝑓𝑓𝑖𝑐
100,000 𝑇ℎ𝑒𝑟𝑚𝑠/𝐵𝑇𝑈
The EFLH for a facility is a function of facility type and weather zone. The TRM V3.0 EFLH values are summarized in Table 4-16.
16 Arkansas TRM V3.0, Volume 2. Pg. 159-160
APSC FILED Time: 3/26/2014 2:23:55 PM: Recvd 3/26/2014 2:04:55 PM: Docket 07-078-TF-Doc. 185
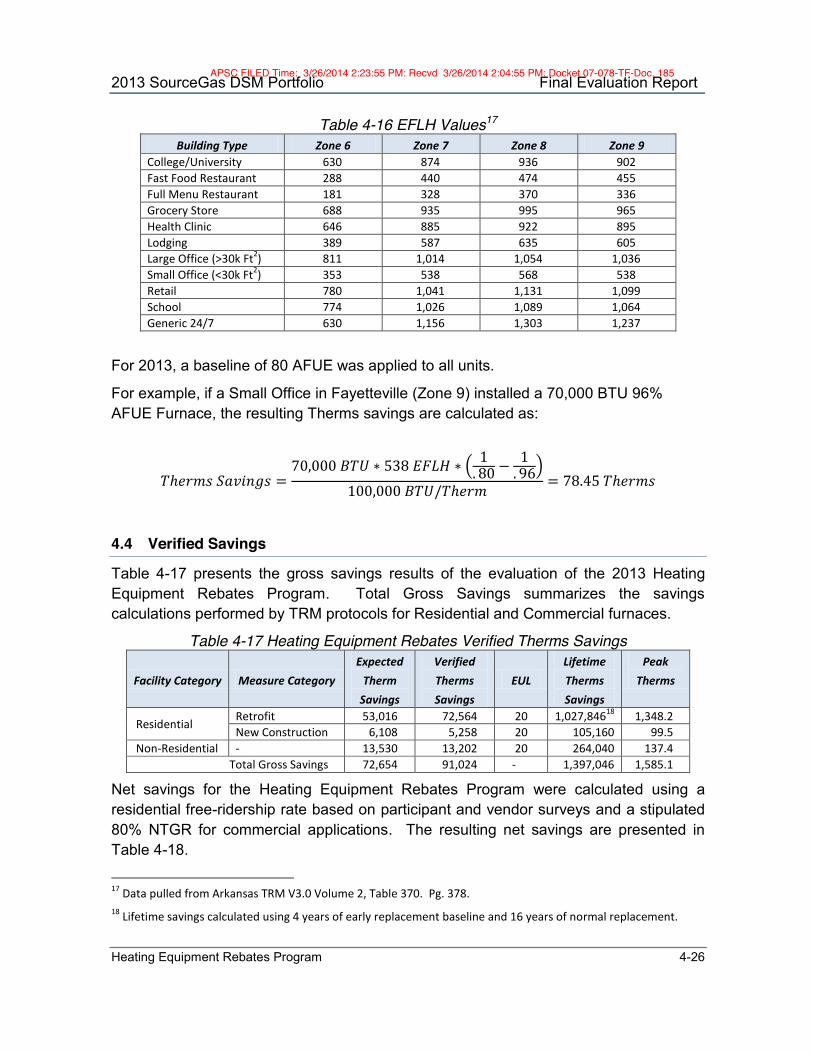
2013 SourceGas DSM Portfolio Final Evaluation Report
Heating Equipment Rebates Program 4-26
Table 4-16 EFLH Values17 Building Type Zone 6 Zone 7 Zone 8 Zone 9
College/University 630 874 936 902 Fast Food Restaurant 288 440 474 455 Full Menu Restaurant 181 328 370 336 Grocery Store 688 935 995 965 Health Clinic 646 885 922 895 Lodging 389 587 635 605 Large Office (>30k Ft2) 811 1,014 1,054 1,036 Small Office (<30k Ft2) 353 538 568 538 Retail 780 1,041 1,131 1,099 School 774 1,026 1,089 1,064 Generic 24/7 630 1,156 1,303 1,237
For 2013, a baseline of 80 AFUE was applied to all units.
For example, if a Small Office in Fayetteville (Zone 9) installed a 70,000 BTU 96% AFUE Furnace, the resulting Therms savings are calculated as:
𝑇ℎ𝑒𝑟𝑚𝑠 𝑆𝑎𝑣𝑖𝑛𝑔𝑠 =70,000 𝐵𝑇𝑈 ∗ 538 𝐸𝐹𝐿𝐻 ∗ 1
. 80 −1. 96
100,000 𝐵𝑇𝑈/𝑇ℎ𝑒𝑟𝑚 = 78.45 𝑇ℎ𝑒𝑟𝑚𝑠
4.4 Verified Savings
Table 4-17 presents the gross savings results of the evaluation of the 2013 Heating Equipment Rebates Program. Total Gross Savings summarizes the savings calculations performed by TRM protocols for Residential and Commercial furnaces.
Table 4-17 Heating Equipment Rebates Verified Therms Savings
Facility Category Measure Category Expected
Therm Savings
Verified Therms Savings
EUL Lifetime Therms Savings
Peak Therms
Residential Retrofit 53,016 72,564 20 1,027,84618 1,348.2 New Construction 6,108 5,258 20 105,160 99.5
Non-Residential - 13,530 13,202 20 264,040 137.4 Total Gross Savings 72,654 91,024 - 1,397,046 1,585.1
Net savings for the Heating Equipment Rebates Program were calculated using a residential free-ridership rate based on participant and vendor surveys and a stipulated 80% NTGR for commercial applications. The resulting net savings are presented in Table 4-18.
17 Data pulled from Arkansas TRM V3.0 Volume 2, Table 370. Pg. 378. 18 Lifetime savings calculated using 4 years of early replacement baseline and 16 years of normal replacement.
APSC FILED Time: 3/26/2014 2:23:55 PM: Recvd 3/26/2014 2:04:55 PM: Docket 07-078-TF-Doc. 185

2013 SourceGas DSM Portfolio Final Evaluation Report
Heating Equipment Rebates Program 4-27
Table 4-18 Heating Equipment Rebates Net Savings Summary
Facility Category Free-Ridership Rate Net Annual Savings Net
Realization Rate
EUL Net Lifetime
Therms Savings
Net Peak Therms Ex Ante Ex Post Ex Ante Ex Post
Res Retrofit 12.5% 16.6% 46,389 60,582 130.6% 20 858,12519 1,124.0 Res NC 12.5% 48.7% 5,345 2,697 50.5% 20 53,940 51.1 Non-Residential 20% 20% 10,824 10,562 97.6% 20 211,240 109.9 Overall: 20% 15.1% 62,558 73,841 118.0% 20 1,123,305 1,285.0
The residential free-rider rate is reflective of three components:
1. Participant self-reports on the impact of the program incentive;
2. The influence of the installing vendor on the decision to purchase the high efficiency unit; and
3. The impact of the program in educating and encouraging the specific vendor on installation of high efficiency furnaces.
4.5 Conclusions & Program Recommendations
4.5.1 Heating Equipment Rebates Conclusions The Evaluators have found that:
1. Satisfaction with the program overall is high. Satisfaction with the program operation includes customers’ interactions with SourceGas, satisfaction with wait times, savings realized from program participation, and ease of the application process. Satisfaction with the application and rebate process improved markedly after CLEAResult took those tasks over from EGIA.
2. Much of the residential participation was driven by the need to replace a central air conditioner. Seventy-four percent of all residential survey respondents indicated that they replaced an air conditioner at the same time as the furnace. 54.4% of these respondents lived in areas that were eligible for an incentive for a high efficiency air conditioner, though only 18.0% received an incentive for the air conditioner. For these respondents, the need to replace an air conditioner led to interactions with an HVAC contractor. SourceGas has engaged the HVAC contractor market to a significant degree, and these contractors took the opportunity utilize the program financial incentive to upsell the customer on a high efficiency furnace as part of a package deal for replacement of the heating and cooling systems. That most of these customers purchased standard efficiency air conditioning while purchasing a high efficiency furnace speaks to the efficacy of the program financial incentives and
19 Lifetime savings calculated using 4 years of early replacement baseline and 16 years of normal replacement.
APSC FILED Time: 3/26/2014 2:23:55 PM: Recvd 3/26/2014 2:04:55 PM: Docket 07-078-TF-Doc. 185
2013 SourceGas DSM Portfolio Final Evaluation Report
Heating Equipment Rebates Program 4-28
SourceGas’ engagement of the HVAC contractor market in inducing adoption of high efficiency space heating technology.
3. The trade ally network is providing successful outreach and service. SourceGas conducted multiple trade ally training sessions, instructing HVAC contractors as to the guidelines for participation (application process, equipment eligibility, etc.). These trade allies are actively marketing the program and have integrated the program offerings into their sales process. 10 vendors accounted for 53.1% of program incentives in 2013.
4. The program has not reached the home builder market. The Heating Equipment Rebates Program had no participation from home builders in 2013. In contrast, both CenterPoint and AOG had high levels of participation from their local builder community.
5. Program staff been largely responsive to evaluation recommendations. Most of the 2012 recommendations have been adopted or are still under consideration for adoption. This has been reflected improvements in tracking data and finalization of program design in terms of which equipment types to market through the program.
6. The Heating Equipment Rebates Program corresponds with industry best practices. The Evaluators found that the program corresponds with best practices in most areas, with the exceptions being a lack of adequate outreach with the home builder community.
4.6 Heating Equipment Rebates Program Recommendations
The Evaluators’ recommendations for the Heating Equipment Rebates Program are as follows:
1. Develop a bonus incentive for comprehensive retrofits. SourceGas could better-serve APSC comprehensiveness requirements by introducing a bonus incentive if a customer installs both a condensing furnace and a tankless water heater. This could potentially be limited to premium-efficiency levels (AFUE of 95+ and EF > .90 for furnaces and tankless water heaters, respectively).
The issues and recommendations are summarized in Table 4-19.
APSC FILED Time: 3/26/2014 2:23:55 PM: Recvd 3/26/2014 2:04:55 PM: Docket 07-078-TF-Doc. 185
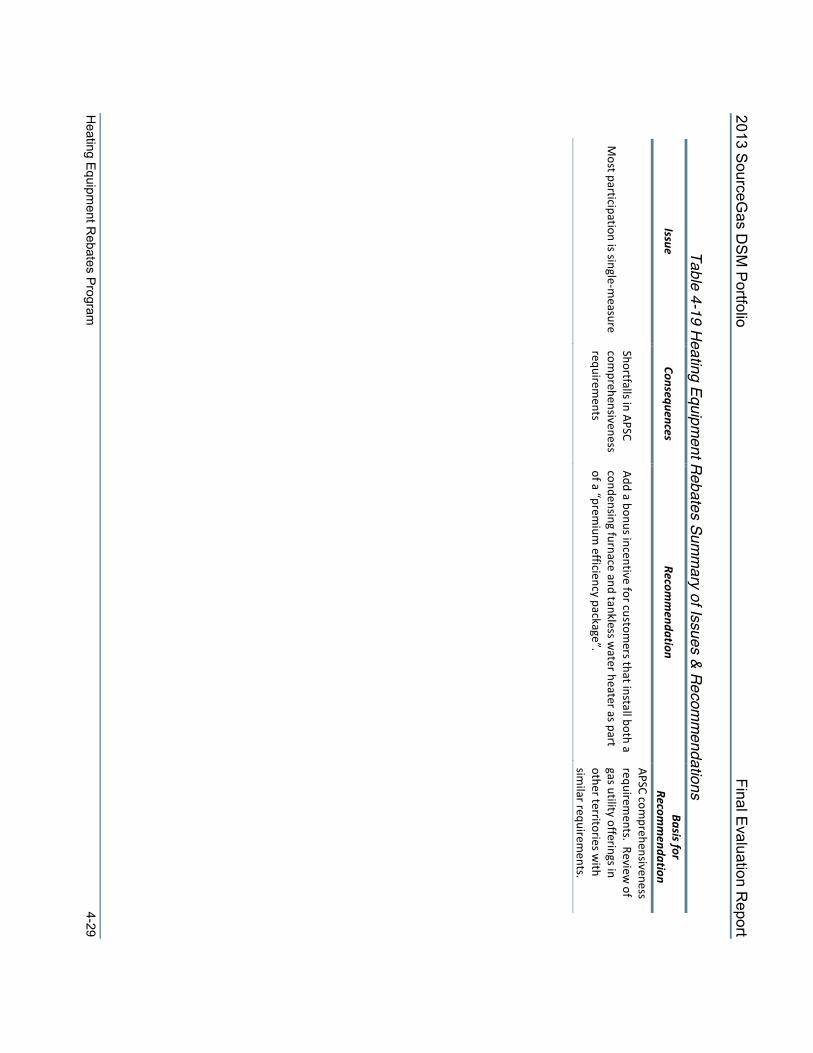
2013 SourceG
as DS
M P
ortfolio Final E
valuation Report
Heating Equipm
ent Rebates Program
4-29
Table 4-19 Heating Equipment Rebates Sum
mary of Issues & Recom
mendations
Issue Consequences
Recomm
endation Basis for
Recomm
endation
Most participation is single-m
easure Shortfalls in APSC com
prehensiveness requirem
ents
Add a bonus incentive for customers that install both a
condensing furnace and tankless water heater as part
of a “premium
efficiency package”.
APSC comprehensiveness
requirements. Review
of gas utility offerings in other territories w
ith sim
ilar requirements.
APSC FILED
Time: 3/26/2014 2:23:55 PM
: Recvd 3/26/2014 2:04:55 PM
: Docket 07-078-TF-D
oc. 185

Heating Equipment Rebates Program 5-1
5. Water Heating & Conservation - Equipment Rebates The Water Heating & Conservation Program has two distinct channels of operation: equipment rebates for high efficiency water heaters and mailer kits that include low flow showerheads and faucet aerators. This chapter addresses the equipment rebate component of the Water Heating & Conservation Program. For purposes of differentiation, this component will be referred to as Water Heating Equipment Rebates Program. Eligible measures for this program include:
$50 for storage tank water heaters with 40 gallons or greater capacity with an EF of .62 or greater;
$500 for tankless water heaters with an EF of .82 or greater; and
$500 for condensing tank water heaters with 90% or greater Thermal Efficiency.
The Water Heating Equipment Rebates Program is targeted at Residential and Small Commercial market sectors. Retrofit and New Construction applications are both allowed, utilizing the same baseline Energy Factors as determined through equipment capacity. The marketing efforts for the program were largely directed at plumbing contractors; their involvement is seen as crucial, as they are generally a primary source of information for end-use customers when deciding upon a replacement system.
5.1 Program Summary
The Water Heating Equipment Rebates Program began in 2010. Incentive levels were raised significantly in 2011 and 2012 in order to counteract the loss of American Recovery and Reinvestment Act-funded (ARRA) incentives. The history of program performance and expenditures is presented in Table 5-1. This table combines the results of Water Heating Equipment Rebates Program and Water Conservation Program, as these are components of one filed program (Water Heating & Conservation) which does not have goals separated between the two program components.
Table 5-1 Water Heating Equipment Rebates Program Historical Performance against Goals
Program Year
# Participants Budget Net Therms Actual Goal Spent Allocated Achieved Goal
2010 1,426 3,968- $87,688 $210,957 - -
2011 1,705 1,917 $63,581 $117,944 31,163 27,460
2012 493 1,986 $94,112 $129,310 39,091 28,450
2013 1,076 915 $129,054 $150,027 61,640 29,450
APSC FILED Time: 3/26/2014 2:23:55 PM: Recvd 3/26/2014 2:04:55 PM: Docket 07-078-TF-Doc. 185

2013 SourceGas DSM Portfolio Final Evaluation Report
Water Heating Equipment Rebates Program 5-2
5.2 Participation Summary 5.2.1.1 Residential Participation
The residential component had a total of 66 residential rebates at 64 premises. Of these, six were .62-.70 storage tank units, six were condensing storage tank models, and 54 were tankless units. Eighty-nine percent of 2013 residential participants were in retrofit applications, with 10.6% being new construction applications.
5.2.1.2 Commercial Participation
The commercial component had a total of 62 rebates at 20 premises. There was one condensing tank unit that was processed as a standard unit, due to having Therm Efficiency less than .90. Further, there were 24 condensing tank units with EF > .90, and 37 tankless units. No standard commercial storage tank units were rebated through the Water Heating Equipment Rebates Program in 2013. Fifty percent of rebated commercial units were in retrofit projects, and 50% were in new construction projects. Figure 5-1 summarizes non-residential participation by facility type.
Figure 5-1 Water Heating Equipment Rebates C&I Participation by Facility Type
5.2.1.3 Participant Timing
Figure 5-2 summarizes the total monthly participation in the 2013 Water Heating Equipment Rebates Program. The values in Error! Reference source not found. represent monthly unit rebates paid.
0.04%
0.82%
0.04%
31.87%
3.31%
9.82%
25.59%
11.94%
16.56%
1.61%
1.61%
3.23%
3.23%
4.84%
4.84%
6.45%
16.13%
58.06%
0.00% 20.00% 40.00% 60.00% 80.00%
Assembly/Worship
Retail
Office
Medical
Industrial
Municipal Building/Jail
Restaurant
Hospitality
Education
n=62 % Rebates % Savings
APSC FILED Time: 3/26/2014 2:23:55 PM: Recvd 3/26/2014 2:04:55 PM: Docket 07-078-TF-Doc. 185

2013 SourceGas DSM Portfolio Final Evaluation Report
Water Heating Equipment Rebates Program 5-3
Figure 5-2 Water Heating Equipment Rebates Monthly Rebate Totals
5.3 Water Heating Equipment Rebates Program Process Evaluation The Evaluators conducted a formal process evaluation of the Water Heating
Rebates Program in 2012, and found that the program was successful in meeting participation, savings, and satisfaction goals. Table 5-2 and
Table 5-3 summarize the Evaluators’ review of the Heating Equipment Rebates Program in comparison to TRM V3.0 Protocol C for timing and conditions of conducting a process evaluation.
Table 5-2 Determining Appropriate Timing to Conduct a Process Evaluation Component Determination
New and Innovative Components
No. The program is designed in a manner consistent with similar programs elsewhere and applies deemed savings values from the TRM.
No Previous Process Evaluation No. The program received a comprehensive process evaluation in 2012.
New Vendor or Contractor Mixed. Program implementation was taken over by CLEAResult in late 2012.
0
5
10
15
20
25
30
35
40
45
50
Tota
l Re
bat
es
n=128
APSC FILED Time: 3/26/2014 2:23:55 PM: Recvd 3/26/2014 2:04:55 PM: Docket 07-078-TF-Doc. 185
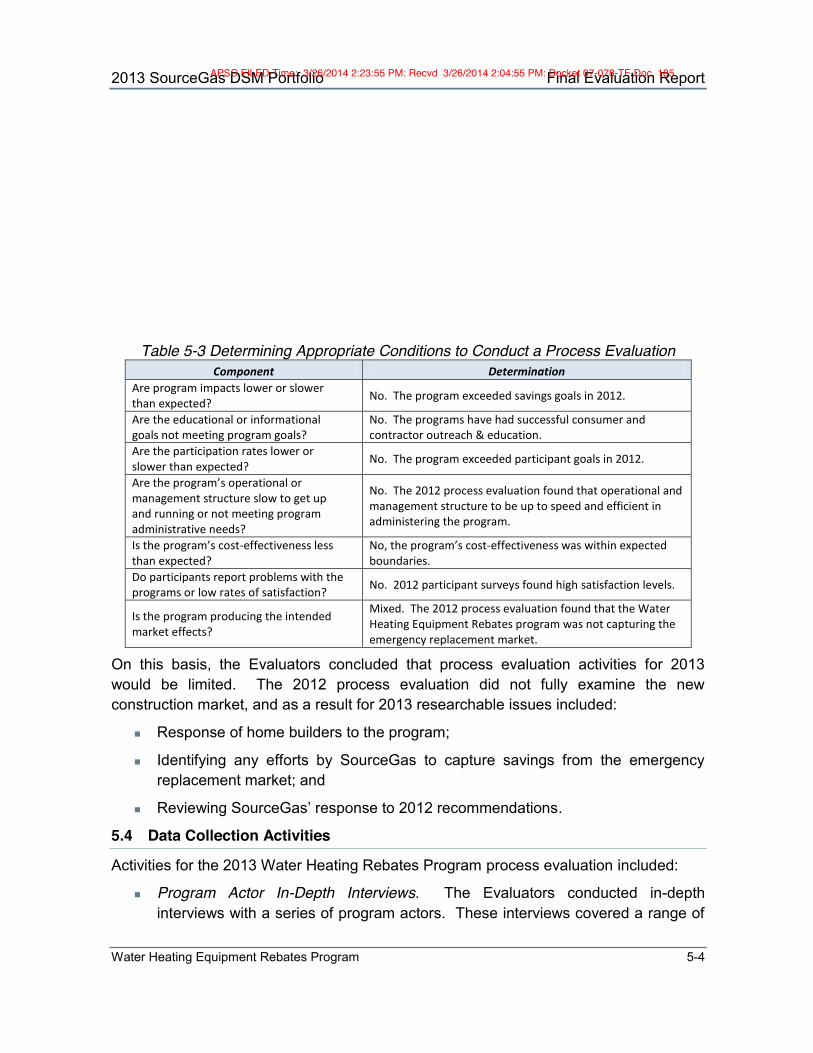
2013 SourceGas DSM Portfolio Final Evaluation Report
Water Heating Equipment Rebates Program 5-4
Table 5-3 Determining Appropriate Conditions to Conduct a Process Evaluation Component Determination
Are program impacts lower or slower than expected? No. The program exceeded savings goals in 2012.
Are the educational or informational goals not meeting program goals?
No. The programs have had successful consumer and contractor outreach & education.
Are the participation rates lower or slower than expected? No. The program exceeded participant goals in 2012.
Are the program’s operational or management structure slow to get up and running or not meeting program administrative needs?
No. The 2012 process evaluation found that operational and management structure to be up to speed and efficient in administering the program.
Is the program’s cost-effectiveness less than expected?
No, the program’s cost-effectiveness was within expected boundaries.
Do participants report problems with the programs or low rates of satisfaction? No. 2012 participant surveys found high satisfaction levels.
Is the program producing the intended market effects?
Mixed. The 2012 process evaluation found that the Water Heating Equipment Rebates program was not capturing the emergency replacement market.
On this basis, the Evaluators concluded that process evaluation activities for 2013 would be limited. The 2012 process evaluation did not fully examine the new construction market, and as a result for 2013 researchable issues included:
Response of home builders to the program;
Identifying any efforts by SourceGas to capture savings from the emergency replacement market; and
Reviewing SourceGas’ response to 2012 recommendations.
5.4 Data Collection Activities
Activities for the 2013 Water Heating Rebates Program process evaluation included:
Program Actor In-Depth Interviews. The Evaluators conducted in-depth interviews with a series of program actors. These interviews covered a range of
APSC FILED Time: 3/26/2014 2:23:55 PM: Recvd 3/26/2014 2:04:55 PM: Docket 07-078-TF-Doc. 185

2013 SourceGas DSM Portfolio Final Evaluation Report
Water Heating Equipment Rebates Program 5-5
topics, including marketing efforts, feedback on program delivery, an assessment of barriers to program implementation and success, and recommendations for program improvement. Program Actors interviewed include:
- SourceGas Program Staff. The Evaluators interviewed staff at SourceGas involved in the administration of the Water Heating Equipment Rebates Program. These interviews built upon interviews conducted in 2012, keeping apprised of SourceGas’ involvement as the program develops.
- Third Party Implementation Staff Interviews. The Evaluators conducted interviews with CLEAResult involved with the C&I Solutions Program. These interviews addressed the development of the program in 2013.
- Trade Ally Interviews. With the development of a trade ally network, the Evaluators sought feedback from active trade allies in order to address how they interact with the program, and to identify potential areas of program enhancement.
Participant Surveying. The Evaluators surveyed separate samples of residential and non-residential participants in the Water Heating Equipment Rebates Program. In addition to their use in developing free-ridership and spillover estimates, these surveys informed the process evaluation of the Water Heating Equipment Rebates Program. These surveys addressed issues including participant satisfaction with the program offerings and other contextual issues regarding the participation process.
Table 5-4 summarizes the data collection for this process evaluation effort. This includes the titles, role, and sample sizes for data collection.
Table 5-4 SourceGas Heating Equipment Rebates Data Collection Summary
Target Component Activity N Role
SourceGas Program Staff
Manager of Energy Efficiency
Interview 1
Overall administration of SourceGas DSM programs. This manager is involved in the larger strategic decisions associated with the DSM portfolio, and is involved with the Heating Equipment Rebates Program and in the overall coordination of utility resources.
CLEAResult Staff Program Coordinator Interview 1
Handles day-to-day operations, including mass market outreach, application review, billing, and logistics
Program Participants
Residential Retrofit Survey 24
Residential retrofit respondents included retrofit and new construction participants that received incentives for high efficiency furnaces rated at 90 AFUE or higher.
Residential New Construction Survey 37
Residential new construction respondents included the occupants of new homes that installed qualifying space heating equipment.
APSC FILED Time: 3/26/2014 2:23:55 PM: Recvd 3/26/2014 2:04:55 PM: Docket 07-078-TF-Doc. 185

2013 SourceGas DSM Portfolio Final Evaluation Report
Water Heating Equipment Rebates Program 5-6
Plumber Interviews Participating Interview 8 Participating plumbers are the primary drivers of
retrofit participation. Builder Interviews Participating Interview 8 Participating builders drive the new construction
program participation.
5.4.1 Process Evaluation Results & Findings
This section will present the results and key findings from the data collection activities. These findings are based upon interviews with utility staff, implementation staff, surveys with participants, and thorough and in-depth literature review.
5.5 Response to Program Recommendations
Table 5-5 summarizes the status of issues and recommendations identified in the 2012 process evaluation.
APSC FILED Time: 3/26/2014 2:23:55 PM: Recvd 3/26/2014 2:04:55 PM: Docket 07-078-TF-Doc. 185
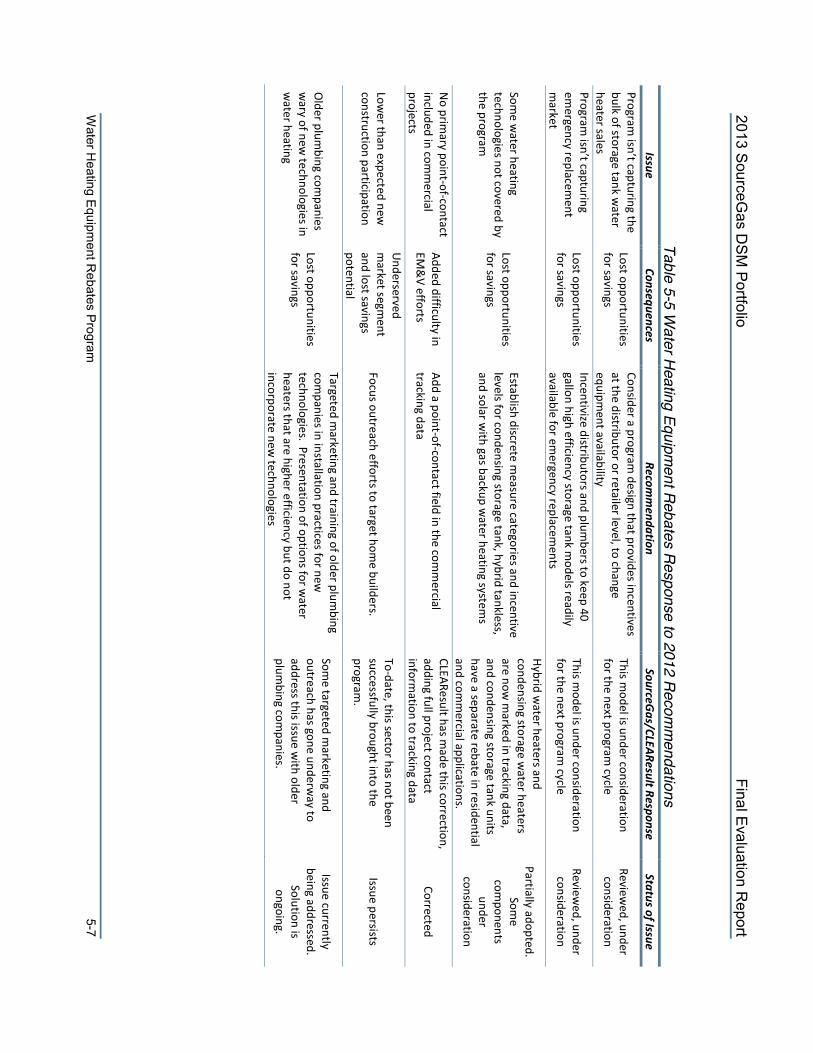
2013 SourceG
as DS
M P
ortfolio Final E
valuation Report
Water H
eating Equipm
ent Rebates Program
5-7
Table 5-5 W
ater Heating Equipment Rebates Response to 2012 Recom
mendations
Issue Consequences
Recomm
endation SourceG
as/CLEAResult Response Status of Issue
Program isn’t capturing the
bulk of storage tank water
heater sales
Lost opportunities for savings
Consider a program design that provides incentives
at the distributor or retailer level, to change equipm
ent availability
This model is under consideration
for the next program cycle
Reviewed, under
consideration
Program isn’t capturing
emergency replacem
ent m
arket
Lost opportunities for savings
Incentivize distributors and plumbers to keep 40
gallon high efficiency storage tank models readily
available for emergency replacem
ents
This model is under consideration
for the next program cycle
Reviewed, under
consideration
Some w
ater heating technologies not covered by the program
Lost opportunities for savings
Establish discrete measure categories and incentive
levels for condensing storage tank, hybrid tankless, and solar w
ith gas backup water heating system
s
Hybrid water heaters and
condensing storage water heaters
are now m
arked in tracking data, and condensing storage tank units have a separate rebate in residential and com
mercial applications.
Partially adopted. Som
e com
ponents under
consideration
No prim
ary point-of-contact included in com
mercial
projects
Added difficulty in EM
&V efforts
Add a point-of-contact field in the comm
ercial tracking data
CLEAResult has made this correction,
adding full project contact inform
ation to tracking data Corrected
Lower than expected new
construction participation
Underserved
market segm
ent and lost savings potential
Focus outreach efforts to target home builders.
To-date, this sector has not been successfully brought into the program
. Issue persists
Older plum
bing companies
wary of new
technologies in w
ater heating
Lost opportunities for savings
Targeted marketing and training of older plum
bing com
panies in installation practices for new
technologies. Presentation of options for water
heaters that are higher efficiency but do not incorporate new
technologies
Some targeted m
arketing and outreach has gone underw
ay to address this issue w
ith older plum
bing companies.
Issue currently being addressed.
Solution is ongoing.
APSC FILED
Time: 3/26/2014 2:23:55 PM
: Recvd 3/26/2014 2:04:55 PM
: Docket 07-078-TF-D
oc. 185
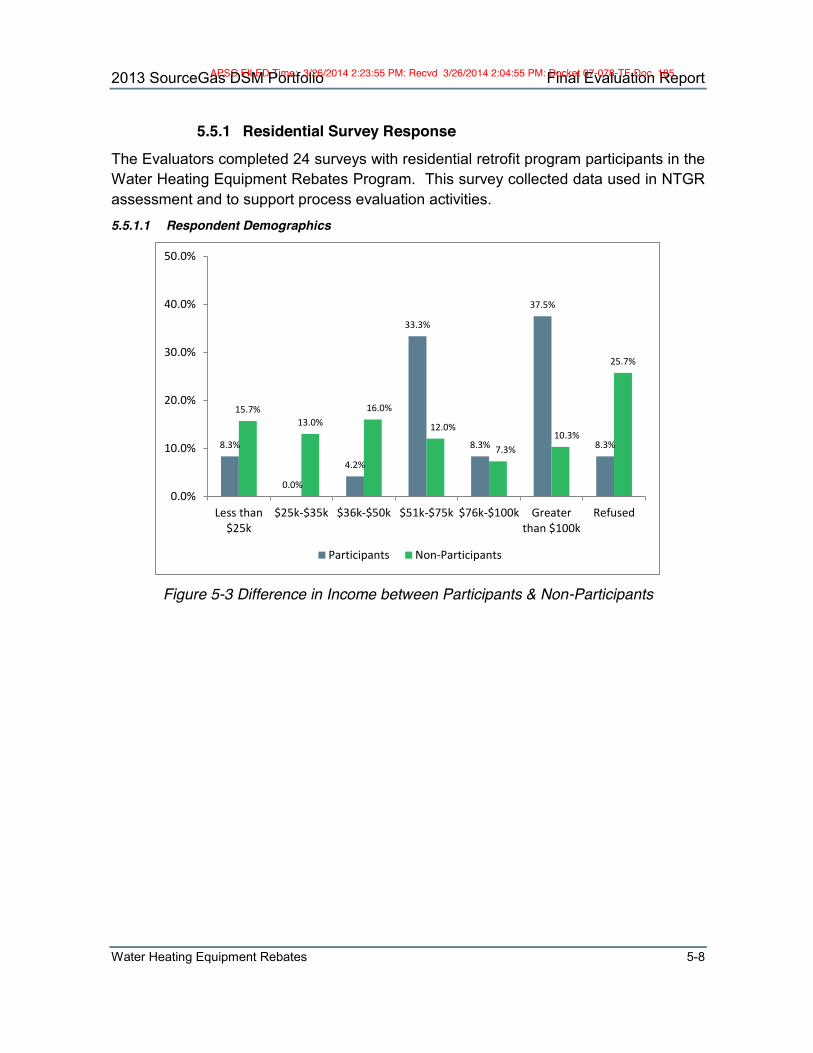
2013 SourceGas DSM Portfolio Final Evaluation Report
Water Heating Equipment Rebates 5-8
5.5.1 Residential Survey Response The Evaluators completed 24 surveys with residential retrofit program participants in the Water Heating Equipment Rebates Program. This survey collected data used in NTGR assessment and to support process evaluation activities.
5.5.1.1 Respondent Demographics
Figure 5-3 Difference in Income between Participants & Non-Participants
8.3%
0.0%
4.2%
33.3%
8.3%
37.5%
8.3%
15.7% 13.0%
16.0%
12.0%
7.3% 10.3%
25.7%
0.0%
10.0%
20.0%
30.0%
40.0%
50.0%
Less than$25k
$25k-$35k $36k-$50k $51k-$75k $76k-$100k Greaterthan $100k
Refused
Participants Non-Participants
APSC FILED Time: 3/26/2014 2:23:55 PM: Recvd 3/26/2014 2:04:55 PM: Docket 07-078-TF-Doc. 185

2013 SourceGas DSM Portfolio Final Evaluation Report
Water Heating Equipment Rebates 5-9
Figure 5-4 Difference in Education between Participants & Non-Participants
5.5.1.2 Program Awareness
SourceGas’ marketing of the Water Heating Equipment Rebates Program is driven through multiple channels, including both customer-direct outreach and marketing through plumbing contractors. Twenty-one percent of residential respondents surveyed indicated having learned of the program from a contractor. Other commonly indicated sources of program awareness included word of mouth from friends and relatives (20.83%), SourceGas bill inserts (12.5%), and from salesmen at equipment retailers (12.5%). The sources of awareness for the Water Heating Equipment Rebates Program are summarized in Table 5-6.
Table 5-6 Water Heating Equipment Rebates Program Sources of Program Awareness
Source of Awareness % Indicated Mailer 12.50% Contractor 20.83% Word of mouth/friends & relatives 20.83% TV Ad 8.33% Retailer 12.50% SourceGas website 4.17% Direct contact from SourceGas representative 12.5% Other 8.33% N 24
8.3%
25.0%
29.2%
33.3%
4.2%
40.7%
19.0% 18.0%
12.3% 10.0%
0.0%
10.0%
20.0%
30.0%
40.0%
50.0%
High School orLess
Associates /Some College
Four-YearCollege
Graduate /Professional
Refused
Participants Non-Participants
APSC FILED Time: 3/26/2014 2:23:55 PM: Recvd 3/26/2014 2:04:55 PM: Docket 07-078-TF-Doc. 185

2013 SourceGas DSM Portfolio Final Evaluation Report
Water Heating Equipment Rebates 5-10
Of the 78.4% that indicated having time to plan the replacement, 6.9% stated that they felt the water heater was close to failure. Thus, 72.9% of the total respondents indicated having replaced a water heater that was functional and not expected to soon fail.
5.5.1.3 Reasons for Participation
Respondents were asked a series of questions addressing their reasons for installing a high efficiency water heater, and to indicate which reason was most important in their decision-making. Figure 5-5 summarizes the reasons given by residential survey respondents. The respondents were asked an open-ended question where they would list their reasons for participation, with the interviewers logging each reason indicated. The most commonly indicated reason was wanting tankless water heating or endless hot water (29.17%), followed by reducing their gas bill (20.83%). Without prompting, 12.5% of respondents indicated the rebate as a reason for purchasing a high efficiency water heater.
Figure 5-5 Residential Water Heating Reasons for Purchase of High Efficiency
Equipment 5.5.1.4 Program Satisfaction
Participants were asked to rate their satisfaction on a scale of 1-10, with 1 meaning “Very Dissatisfied” and 10 meaning “Very Satisfied” on a range of items related to their program experience. Table 5-7 tabulates the satisfaction results.
12.50%
4.17%
4.17%
8.33%
8.33%
12.50%
16.67%
20.83%
29.17%
0.00% 10.00% 20.00% 30.00% 40.00% 50.00%
Other
Contractor recommendation
SourceGas recommendation
Right thing to do
Good for the environment
Program rebate
Save energy
Reduce gas bill
Wanted tankless/endless hot water
n=24
APSC FILED Time: 3/26/2014 2:23:55 PM: Recvd 3/26/2014 2:04:55 PM: Docket 07-078-TF-Doc. 185
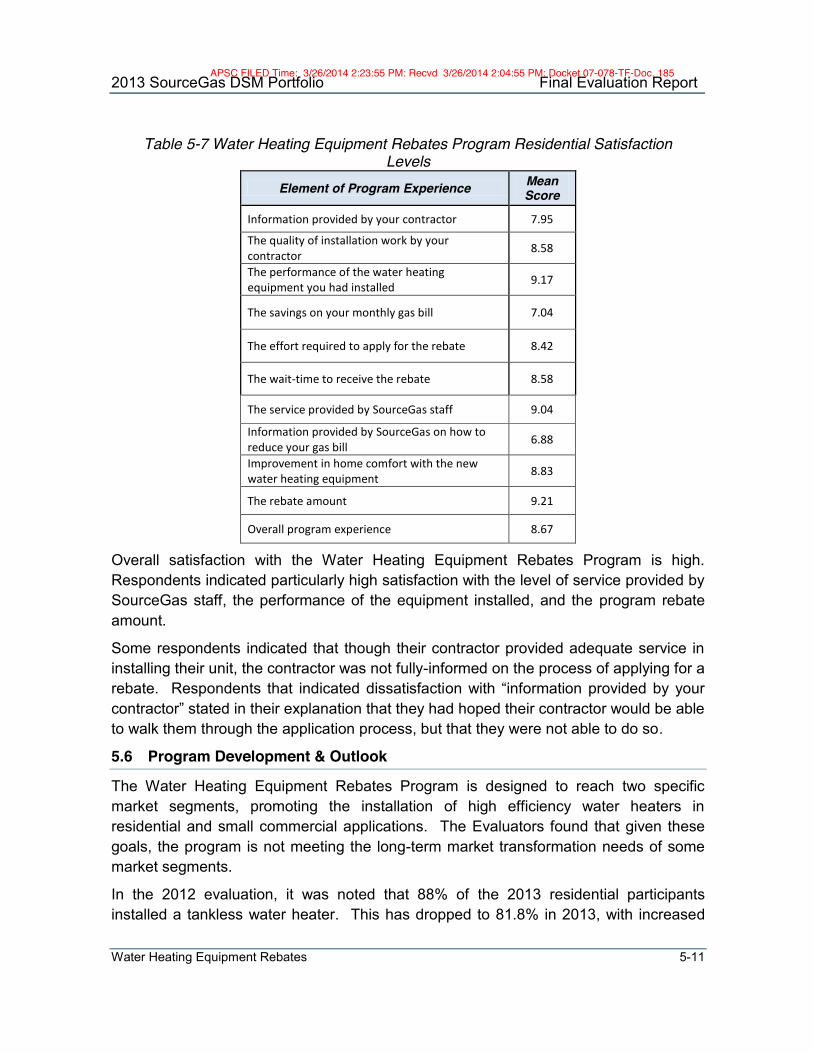
2013 SourceGas DSM Portfolio Final Evaluation Report
Water Heating Equipment Rebates 5-11
Table 5-7 Water Heating Equipment Rebates Program Residential Satisfaction
Levels Element of Program Experience Mean
Score
Information provided by your contractor 7.95
The quality of installation work by your contractor 8.58
The performance of the water heating equipment you had installed 9.17
The savings on your monthly gas bill 7.04
The effort required to apply for the rebate 8.42
The wait-time to receive the rebate 8.58
The service provided by SourceGas staff 9.04
Information provided by SourceGas on how to reduce your gas bill 6.88
Improvement in home comfort with the new water heating equipment 8.83
The rebate amount 9.21
Overall program experience 8.67
Overall satisfaction with the Water Heating Equipment Rebates Program is high. Respondents indicated particularly high satisfaction with the level of service provided by SourceGas staff, the performance of the equipment installed, and the program rebate amount.
Some respondents indicated that though their contractor provided adequate service in installing their unit, the contractor was not fully-informed on the process of applying for a rebate. Respondents that indicated dissatisfaction with “information provided by your contractor” stated in their explanation that they had hoped their contractor would be able to walk them through the application process, but that they were not able to do so.
5.6 Program Development & Outlook
The Water Heating Equipment Rebates Program is designed to reach two specific market segments, promoting the installation of high efficiency water heaters in residential and small commercial applications. The Evaluators found that given these goals, the program is not meeting the long-term market transformation needs of some market segments.
In the 2012 evaluation, it was noted that 88% of the 2013 residential participants installed a tankless water heater. This has dropped to 81.8% in 2013, with increased
APSC FILED Time: 3/26/2014 2:23:55 PM: Recvd 3/26/2014 2:04:55 PM: Docket 07-078-TF-Doc. 185

2013 SourceGas DSM Portfolio Final Evaluation Report
Water Heating Equipment Rebates 5-12
uptake of condensing storage tank units that has occurred due to SourceGas’ new $500 rebate for these units. This is a positive development in that it reflects the program being able to reach more homes; current estimates hold that 30% of homes cannot be cost-effectively retrofitted to a tankless unit20.
However, the program is still not capturing the emergency replacement market. In 2013, 87.5% of respondents indicated that they had time to plan their replacement. This conflicts with prior findings that indicated that roughly two thirds of water heater replacements are due to equipment failure21. This would imply that the program is being integrated into the decision-making of home remodels or larger-scale retrofits, but not capturing the emergency replacement market.
Further, the Water Heating Equipment Rebates program has not adequately engaged the home builder market. CenterPoint and AOG had 20-25% of their participation come from home builders in new construction applications. The Evaluators found that no home builders received incentives in the SourceGas tracking data.
5.7 Program Best Practices Assessment
In 2012, the Evaluators conducted a program best-practices assessment using the Self Benchmarking Tool22. In this process, three areas where the program fell short of best practices were identified. The status of these issues is presented in Table 5-8.
Table 5-8 Status of Identified Best-Practice Shortfalls Issue Response Status
Program does not provide incentives to trade allies
A $50 trade ally incentive has been added for tankless units Corrected.
Tracking data lacks contact names for commercial projects
CLEAResult has added this to their commercial tracking data.
Corrected. Tracking data now in compliance with TRM Protocol A.
Lack of a formal market potential study
This is being mitigated though a joint-utility statewide market potential study that will conclude in 2014.
Corrective action pending.
5.8 Water Heating Equipment Rebates Program Impact Evaluation
For the equipment rebates component, savings were calculated using methodologies detailed in Section 2.20 and 3.31 of the TRM Version 3.0. The impact evaluation effort of the Water Heating Equipment Rebates Program included the following:
20 Charles Adams. 2010. “Water Heater Rating Improvement Act of 2009: Senate Bill S. 2908” A.O. Smith.
Presented at ACEEE Water Heater Forum 2010 21 D&R International. 2009. Water Heater Market Profile 2009. US Department of Energy 22 http://eebestpractices.com/ Best Practices Benchmarking for Energy Efficiency Programs
APSC FILED Time: 3/26/2014 2:23:55 PM: Recvd 3/26/2014 2:04:55 PM: Docket 07-078-TF-Doc. 185
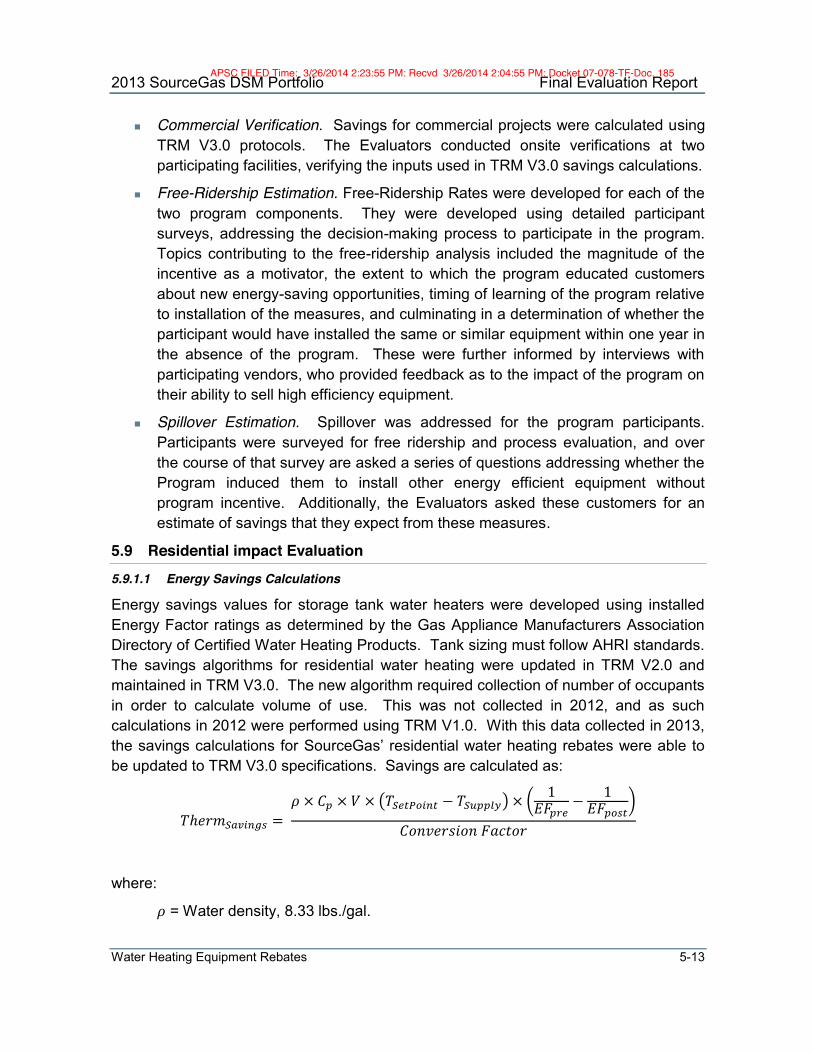
2013 SourceGas DSM Portfolio Final Evaluation Report
Water Heating Equipment Rebates 5-13
Commercial Verification. Savings for commercial projects were calculated using TRM V3.0 protocols. The Evaluators conducted onsite verifications at two participating facilities, verifying the inputs used in TRM V3.0 savings calculations.
Free-Ridership Estimation. Free-Ridership Rates were developed for each of the two program components. They were developed using detailed participant surveys, addressing the decision-making process to participate in the program. Topics contributing to the free-ridership analysis included the magnitude of the incentive as a motivator, the extent to which the program educated customers about new energy-saving opportunities, timing of learning of the program relative to installation of the measures, and culminating in a determination of whether the participant would have installed the same or similar equipment within one year in the absence of the program. These were further informed by interviews with participating vendors, who provided feedback as to the impact of the program on their ability to sell high efficiency equipment.
Spillover Estimation. Spillover was addressed for the program participants. Participants were surveyed for free ridership and process evaluation, and over the course of that survey are asked a series of questions addressing whether the Program induced them to install other energy efficient equipment without program incentive. Additionally, the Evaluators asked these customers for an estimate of savings that they expect from these measures.
5.9 Residential impact Evaluation 5.9.1.1 Energy Savings Calculations
Energy savings values for storage tank water heaters were developed using installed Energy Factor ratings as determined by the Gas Appliance Manufacturers Association Directory of Certified Water Heating Products. Tank sizing must follow AHRI standards. The savings algorithms for residential water heating were updated in TRM V2.0 and maintained in TRM V3.0. The new algorithm required collection of number of occupants in order to calculate volume of use. This was not collected in 2012, and as such calculations in 2012 were performed using TRM V1.0. With this data collected in 2013, the savings calculations for SourceGas’ residential water heating rebates were able to be updated to TRM V3.0 specifications. Savings are calculated as:
𝑇ℎ𝑒𝑟𝑚 = 𝜌 × 𝐶 × 𝑉 × 𝑇 − 𝑇 × 1
𝐸𝐹 − 1𝐸𝐹
𝐶𝑜𝑛𝑣𝑒𝑟𝑠𝑖𝑜𝑛 𝐹𝑎𝑐𝑡𝑜𝑟
where:
𝜌 = Water density, 8.33 lbs./gal.
APSC FILED Time: 3/26/2014 2:23:55 PM: Recvd 3/26/2014 2:04:55 PM: Docket 07-078-TF-Doc. 185

2013 SourceGas DSM Portfolio Final Evaluation Report
Water Heating Equipment Rebates 5-14
𝐶 = Specific heat of water, 1 BTU/lb·°F
𝑉 = Estimated annual hot water use (gal per year)
𝑇 = Water heater set point, if unavailable, use 120°F
𝑇 = Average supply water temperature
𝐸𝐹 = Baseline value
𝐸𝐹 = Energy Factor of new water heater
𝐶𝑜𝑛𝑣𝑒𝑟𝑠𝑖𝑜𝑛 𝐹𝑎𝑐𝑡𝑜𝑟 100,000 BTU = 1 Therm
Baseline energy factors are summarized in Table 5-9.
Table 5-9 Residential Water Heating Baseline Energy Factors Minimum Required Energy Factors by Size23
30 Gallon 40 Gallon 50 Gallon 75 Gallon 80 Gallon .61 .59 .58 .53 .52
Supply water temperatures are presented in Table 5-10.
Table 5-10 Residential Water Heating Baseline Energy Factors
Weather Zone Water Main Temperature
9 Fayetteville 65.6 8 Fort Smith 66.1 7 Little Rock 67.8 6 El Dorado 70.1
5.9.1.2 Residential Free-Ridership
Free-ridership estimates for residential participants in the Water Heating Equipment Rebates Program were developed through combined scoring of the survey respondents and of participating vendors. This section will detail the questions and answers from the participant survey that contributed to the participant response portion of the program free-rider scoring.
The contributing questions are divided into three subcategories:
23 10 CFR Part 430 Energy Conservation Program for Consumer Products: Energy Conservation Standards for Water
Heaters; Final Rule
http://www1.eere.energy.gov/buildings/appliance_standards/residential/pdfs/htgp_finalrule_fedreg.pdf
APSC FILED Time: 3/26/2014 2:23:55 PM: Recvd 3/26/2014 2:04:55 PM: Docket 07-078-TF-Doc. 185

2013 SourceGas DSM Portfolio Final Evaluation Report
Water Heating Equipment Rebates 5-15
Timing & Information Q-4 When did you decide to buy a high efficiency water heater? Was it…
Before or just when you started looking for a new water heater While getting information about water heaters but before deciding
on a contractor While deciding on a contractor After deciding on a contractor
Table 5-11 Timing of Decision to Purchase High Efficiency Water Heater Relative
to Timing of Selection of Contractor Timing %
Before or just when you started looking for a new water heater 75.0%
While getting information about water heaters but before deciding on a contractor 16.7%
While deciding on a contractor 8.3% After deciding on a contractor 0%
n=24
Q-5 Did you know about SourceGas Water Heating Equipment Rebates Program…..
Before starting to replace your unit or did you, Learn about it while replacing the water heater
Respondents’ answers to this question were evenly split at 50%.
Importance of Rebate Q-7 Why did you decide to purchase a high efficiency water heater?
This question is open-ended, with the interviewers categorizing the answers given, and multiple answers allowed. Unprompted, 1.5% of respondents indicated the financial incentive as a reason for purchasing the high efficiency option.
Q-10 How important was SourceGas’ rebate in your decision to buy the high efficiency water heating equipment?
When prompted to discuss the rebate, 37.5% of respondents indicated that the rebate was “very important” in their decision to purchase a high efficiency water heater. Twenty-nine percent stated that the rebate was “somewhat important’, 8.3% stated “only slightly important”, and 25.0% indicated that it was “not important at all”.
Q-12 When deciding about the water heater, did you purchase a more efficient water heater than you would have because of the program rebate?
Forty-six percent responded “yes” to this question, and 54.2% responded “no”.
APSC FILED Time: 3/26/2014 2:23:55 PM: Recvd 3/26/2014 2:04:55 PM: Docket 07-078-TF-Doc. 185
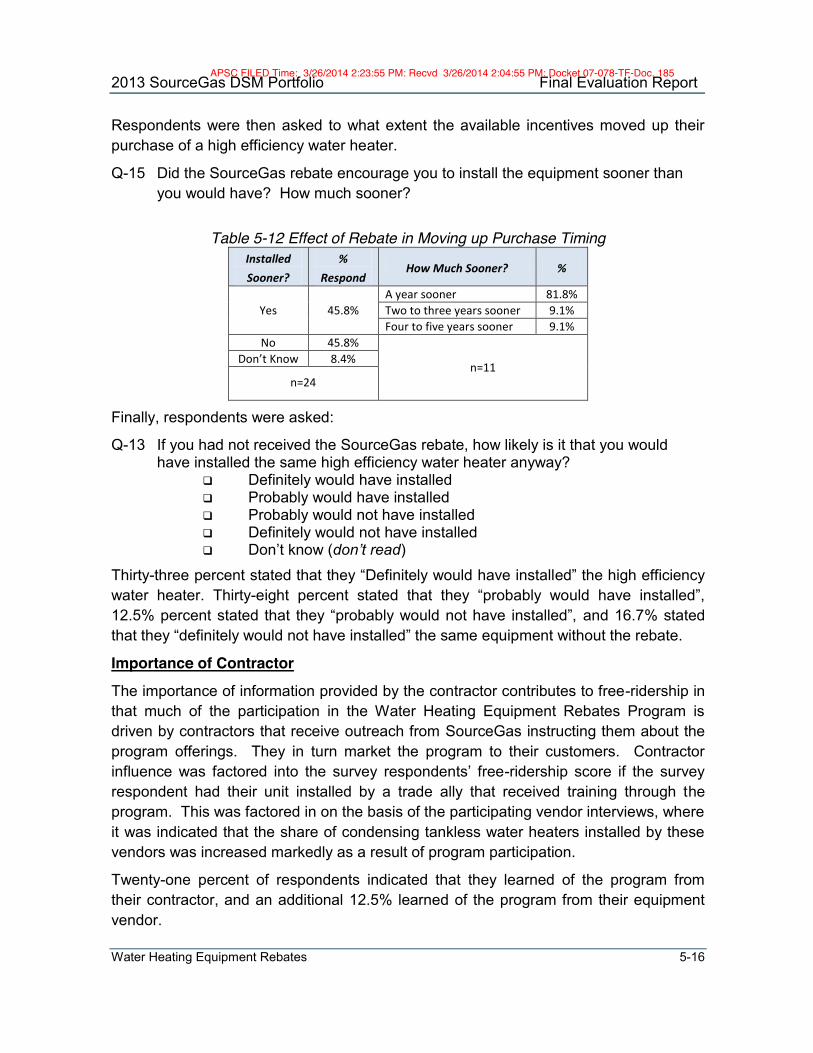
2013 SourceGas DSM Portfolio Final Evaluation Report
Water Heating Equipment Rebates 5-16
Respondents were then asked to what extent the available incentives moved up their purchase of a high efficiency water heater.
Q-15 Did the SourceGas rebate encourage you to install the equipment sooner than you would have? How much sooner?
Table 5-12 Effect of Rebate in Moving up Purchase Timing
Installed Sooner?
% Respond
How Much Sooner? %
Yes 45.8% A year sooner 81.8% Two to three years sooner 9.1% Four to five years sooner 9.1%
No 45.8%
n=11 Don’t Know 8.4%
n=24
Finally, respondents were asked:
Q-13 If you had not received the SourceGas rebate, how likely is it that you would have installed the same high efficiency water heater anyway?
Definitely would have installed Probably would have installed Probably would not have installed Definitely would not have installed Don’t know (don’t read)
Thirty-three percent stated that they “Definitely would have installed” the high efficiency water heater. Thirty-eight percent stated that they “probably would have installed”, 12.5% percent stated that they “probably would not have installed”, and 16.7% stated that they “definitely would not have installed” the same equipment without the rebate.
Importance of Contractor The importance of information provided by the contractor contributes to free-ridership in that much of the participation in the Water Heating Equipment Rebates Program is driven by contractors that receive outreach from SourceGas instructing them about the program offerings. They in turn market the program to their customers. Contractor influence was factored into the survey respondents’ free-ridership score if the survey respondent had their unit installed by a trade ally that received training through the program. This was factored in on the basis of the participating vendor interviews, where it was indicated that the share of condensing tankless water heaters installed by these vendors was increased markedly as a result of program participation.
Twenty-one percent of respondents indicated that they learned of the program from their contractor, and an additional 12.5% learned of the program from their equipment vendor.
APSC FILED Time: 3/26/2014 2:23:55 PM: Recvd 3/26/2014 2:04:55 PM: Docket 07-078-TF-Doc. 185

2013 SourceGas DSM Portfolio Final Evaluation Report
Water Heating Equipment Rebates 5-17
Q-8 In your decision to buy the high efficiency water heater, how important was information, advice, and / or recommendations from your contractor?
Forty-two percent of respondents indicated that advice and recommendations from their contractor was “Very Important” in their decision to purchase a high efficiency water heater.
Free-Rider Scoring Mechanism The above factors are combined in estimating free-ridership for each survey respondent. Their responses are then weighted by Therms savings for the respondent in determining the free-ridership rate for the commercial component. The scoring mechanism for commercial free ridership is presented in Figure 5-6.
Importance of Contractor
Importance of Rebate
Rated vendor > 4?
Rated rebate > 4?
Altered project?Installed by Trade Ally?
0.33 0 0.33 0 1
Sum of scores > 5?
NTGR = 1 NTGR = 0
Yes
Yes
NoNo
No
Yes No
Yes
Project advanced >1
year?
Figure 5-6 Residential Water Heating Free-Ridership Flowchart
APSC FILED Time: 3/26/2014 2:23:55 PM: Recvd 3/26/2014 2:04:55 PM: Docket 07-078-TF-Doc. 185

2013 SourceGas DSM Portfolio Final Evaluation Report
Water Heating Equipment Rebates 5-18
The free-ridership rates for the Water Heating Equipment Rebates residential component are as follows:
Residential Retrofit: 29.2%
Residential New Construction (builder production homes): 8.3%
Residential New Construction (custom homes): 48.7%
5.9.1.3 Participant Spillover
The residential participant survey addressed participant spillover. This was done through a battery of questions designed to:
1) Assess the behaviors taken by customers after their program participation where they installed energy efficient equipment; and
2) Get the respondent’s self-reported value for how important they felt information from SourceGas was in inducing this non-incentivized behavior.
After reviewing the survey data, the Evaluators found no instances of participant spillover in the Water Heating Equipment Rebates Program
5.9.2 Commercial Water Heating Impact Evaluation
Commercial water heater savings calculations incorporate more facility-specific information than the residential methodology. Therms savings for commercial water heaters are calculated as24:
𝑇ℎ𝑒𝑟𝑚𝑠 𝑆𝑎𝑣𝑖𝑛𝑔𝑠 =𝜌 ∗ 𝐶 ∗ 𝑉 ∗ 𝑇 − 𝑇 ∗ 1
𝐸𝐹 − 1𝐸𝐹 ∗ 𝐷𝑎𝑦𝑠/𝑌𝑒𝑎𝑟
100,000 𝐵𝑇𝑈/𝑇ℎ𝑒𝑟𝑚
Ρ = Water Density, 8.33 lbs/Gallon
CP = Specific Heat of Water, 1 BTU/Lb F
V = Average daily hot water use (gallons)
Tsetpoint = Water Heater setpoint, 140 deg F
Tsupply = Supply water temperature, 58 deg F
EFpre = Energy factor of existing water heater (.62 - .0019V)
EFpost = Energy factor of installed water heater
Days/Year = Days per year of operation
The required facility-specific inputs are volume and days/year. Volume can be calculated on the basis of square footage of the facility or from units served. Table 5-13
24 Arkansas TRM V3.0, Volume 2. Pg. 218-226
APSC FILED Time: 3/26/2014 2:23:55 PM: Recvd 3/26/2014 2:04:55 PM: Docket 07-078-TF-Doc. 185

2013 SourceGas DSM Portfolio Final Evaluation Report
Water Heating Equipment Rebates 5-19
presents the volume and days of usage values for a facility by square footage25. Table 5-14 presents the volume and days of usage values by unit produced or person served.
Table 5-13 Hot Water Requirements by Facility Size
Building Type Daily Demand (Gallons / Unit
/ Day) Unit
Units / 1,000 Sq. Feet
Applicable Days / Year
Gallons / 1,000 Sq. Feet / Day
Small Office 1 Person 2.3 250 2.3 Large Office 1 Person 2.3 250 2.3 Fast Food Rest. .7 Meal/Day 784.6 365 549.2 Sit-down Rest. 2.4 Meal/Day 340 365 816 Retail 2 Employee 1 365 2.0 Grocery 2 Employee 1.1 365 2.2 Warehouse 2 Employee .5 250 1.0 Elementary School .6 Person 9.5 200 5.7 Jr. High/High School 1.8 Person 9.5 200 17.1 Health 90 Patient 3.8 365 342. Motel 20 Unit (Room) 5 365 100.0 Hotel 14 Unit (Room) 2.2 365 30.8 Other 1 Employee .7 250 .7
Table 5-14 Hot Water Requirements by Unit or Person
Building Type Size Factor Average Daily Demand
Dormitories Men 13.1 Gal. per Man Women 12.3 Gal. per Woman
Hospitals Per Bed 90.0 Gal. per Patient
Hotels Single Room with Bath 50.0 Gal. per Unit Double Room with Bath 80.0 Gal. per Unit
Motels
# Units: Up to 20 20.0 Gal. per Unit 21 to 100 14.0 Gal. per Unit 101 and Up 10.0 Gal. per Unit
Restaurants Full Meal Type 2.4 Gal. per Meal Dive-in Snack Type 0.7 Gal. per Meal
Schools Elementary 0.6 Gal. Per Student Secondary and High School 1.8 Gal. Per Student
There were five participating facilities in the commercial component in 2013, totaling 33,584 Therms in expected savings. The Evaluators selected the two highest saving facilities, which accounted for 31,394 of the claimed savings. These two facilities had savings calculations redone based on facility-specific inputs determined through on-site verification. Further, the Evaluators reviewed savings calculations for the remaining participant facilities. It was found that these facilities used the incorrect baseline for
25 Ibid
APSC FILED Time: 3/26/2014 2:23:55 PM: Recvd 3/26/2014 2:04:55 PM: Docket 07-078-TF-Doc. 185

2013 SourceGas DSM Portfolio Final Evaluation Report
Water Heating Equipment Rebates 5-20
storage tank units of their size, and had savings revised accordingly. These factors combined in a resulting in 92.8% gross realization for the commercial component.
5.10 Verified Savings
Error! Reference source not found. presents the gross savings results of the evaluation of the 2013 Water Heating Equipment Rebates Program. Total Gross Savings summarizes the savings calculations performed by TRM protocols for Residential and Commercial water heaters.
Table 5-15 Water Heating Equipment Rebates Program Verified Therms Savings
Facility Category
Measure Category Expected
Therm Savings
Verified Therms Savings
EUL Lifetime Therms Savings
Peak Therms
Residential Storage Tank Water Heaters 252 248 11 2,728 .6 Tankless Water Heaters 3,231 3,229 20 64,580 7.7
Non-Residential
Storage Tank Water Heaters 32,773 33,339 15 500,070 93.4 Tankless Water Heaters 16,265 22,720 15 340,800 67.2
Total Gross Savings 52,521 59,536 - 908,178 168.9
Net savings for the Water Heating Equipment Rebates Program were calculated using a residential free-ridership rate based on participant and vendor surveys, a stipulated NTGR of 80% for commercial participants. The resulting net savings are presented in Error! Reference source not found..
Table 5-16 Water Heating Equipment Rebates Program Net Savings Summary
Facility Category Free-Ridership Rate Net Annual Savings Net
Realization Rate
Net Lifetime Therms Savings
Net Peak Therms Ex Ante Ex Post Ex Ante Ex Post
Residential Retrofit 25% 29.1% 2,413 2,238 92.7% 64,864 5.4 NC (Custom) 25% 48.7% 200 148 74.0% 1,518 .3 Non-Residential 20% 20.0% 39,230 44,847 114.3% 672,690 128.5 Overall: 20% 77.4% 41,843 47,233 112.8% 739,072 134.2
5.11 Conclusions & Recommendations
5.11.1 Conclusions Based on the Evaluator’s review of the Water Heating Equipment Rebates Program, we have concluded the following:
1. Satisfaction with the program overall is high. Overall satisfaction with the program was rated on average at 8.67 out of 10. Participant satisfaction with the quality of installation work and of the equipment performance was exceedingly high, with values of 8.58 and 9.17, respectively.
APSC FILED Time: 3/26/2014 2:23:55 PM: Recvd 3/26/2014 2:04:55 PM: Docket 07-078-TF-Doc. 185
2013 SourceGas DSM Portfolio Final Evaluation Report
Water Heating Equipment Rebates 5-21
2. Application processing times have been expedited. After taking over the rebate processing component from EGIA, the program’s incentive processing time has shortened 1-2 weeks, and participant satisfaction with rebate wait times has increased.
3. The trade ally network is providing successful outreach and service. SourceGas conducted multiple trade ally training sessions, instructing contractors as to the guidelines for participation (application process, equipment eligibility, etc.). These trade allies are actively marketing the program and have integrated the program offerings into their sales process.
4. The Water Heating Equipment Rebates Program for the most part corresponds with industry best practices. The Evaluators found that the program corresponds with best practices in most areas, and other areas are still in-progress (such as plans to refine goals to correspond to a market potential study). However, the tracking data lacked the fields needed to recreate energy savings calculations.
5. SourceGas efforts in contractor education have allowed for further market penetration of tankless water heaters. SourceGas engaged in multiple outreach and training efforts to promote the installation of tankless water heaters, overcoming concerns on the part of installing vendors surrounding the complexity of tankless installation.
6. There has been little participation from home builders. The Evaluators found that levels of participation by builders were much lower for SourceGas than for comparable programs implemented by CenterPoint and AOG.
7. Program staff been largely responsive to evaluation recommendations. Most of the 2012 recommendations have been adopted or are still under consideration for adoption. This has been reflected in adjustments to multifamily baseline calculations and the development of a formal post-inspection procedure.
8. The program has been more successful in incentivizing high efficiency storage tank units. Storage tank units account for 18.2% of residential program participation and 40.3% of non-residential participation in 2013. Most of these units were premium-efficiency condensing storage tank units, for which the program added a higher incentive.
9. The program is not capturing the emergency replacement market. Only 21.6% of residential participants indicated that their purchase was an emergency replacement, in conflict with larger studies that have indicated that typically two thirds of water heater replacements are emergency replacements. Thus it is likely that there is a large share of the emergency replacement market not captured by the program.
APSC FILED Time: 3/26/2014 2:23:55 PM: Recvd 3/26/2014 2:04:55 PM: Docket 07-078-TF-Doc. 185

2013 SourceGas DSM Portfolio Final Evaluation Report
Water Heating Equipment Rebates 5-22
5.11.2 Recommendations 1. Focus outreach on home builders. The SourceGas Water Heating Equipment
Rebates Program had little to no participation from home builders. This contrasts sharply with CenterPoint and AOG, for whom 20-25% of the residential participation was to home builders. These market actors need to be engaged, as the opportunity for savings from the homes built will be lost for 10-15 years if not brought into the program.
2. Track Standby Loss Rating for large commercial storage tank water heaters. The TRM V3.0 allows for savings to be claimed from the improvement in standby losses associated with large commercial storage tank water heaters (for which savings calculations are based on thermal efficiency rather than energy factor). Tracking this for the appropriate units would allow SourceGas to quantify and claim the savings from standby loss improvement.
3. Convert the thermal efficiency of residential condensing tank water heaters to an effective Energy Factor. There is existing literature to support these calculations, and they provide for an energy factor ranging from .70 to .85.
4. Add the calculation inputs to the tracking data. The Evaluators had to make supplementary requests for certain calculation inputs. Tracking data should include the inputs used to calculate savings according to TRM V3.0 methodologies, such as unit of production and associated volume of water use.
5. Develop a bonus incentive for comprehensive retrofits. SourceGas could better-serve APSC comprehensiveness requirements by introducing a bonus incentive if a customer installs both a condensing furnace and a tankless water heater. This could potentially be limited to premium-efficiency levels (AFUE of 95+ and EF > .90 for furnaces and tankless water heaters, respectively). Other options for inclusion into a comprehensive gas-saving package could include ceiling insulation or duct sealing.
These issues are summarized in
Table 5-17.
APSC FILED Time: 3/26/2014 2:23:55 PM: Recvd 3/26/2014 2:04:55 PM: Docket 07-078-TF-Doc. 185
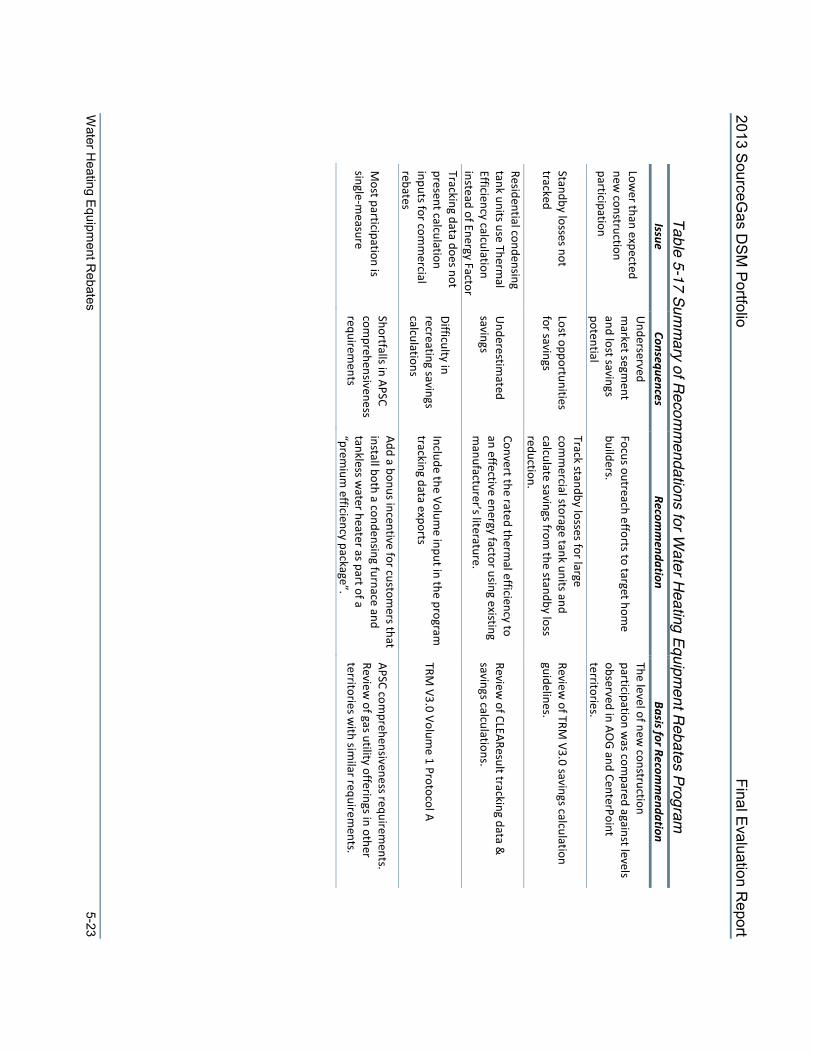
2013 SourceG
as DS
M P
ortfolio Final E
valuation Report
Water H
eating Equipm
ent Rebates
5-23
Table 5-17 Sum
mary of Recom
mendations for W
ater Heating Equipment Rebates Program
Issue
Consequences Recom
mendation
Basis for Recomm
endation
Lower than expected
new construction
participation
Underserved
market segm
ent and lost savings potential
Focus outreach efforts to target home
builders.
The level of new construction
participation was com
pared against levels observed in AO
G and CenterPoint territories.
Standby losses not tracked
Lost opportunities for savings
Track standby losses for large com
mercial storage tank units and
calculate savings from the standby loss
reduction.
Review of TRM
V3.0 savings calculation guidelines.
Residential condensing tank units use Therm
al Efficiency calculation instead of Energy Factor
Underestim
ated savings
Convert the rated thermal efficiency to
an effective energy factor using existing m
anufacturer’s literature.
Review of CLEAResult tracking data &
savings calculations.
Tracking data does not present calculation inputs for com
mercial
rebates
Difficulty in recreating savings calculations
Include the Volume input in the program
tracking data exports
TRM V3.0 Volum
e 1 Protocol A
Most participation is
single-measure
Shortfalls in APSC com
prehensiveness requirem
ents
Add a bonus incentive for customers that
install both a condensing furnace and tankless w
ater heater as part of a “prem
ium efficiency package”.
APSC comprehensiveness requirem
ents. Review
of gas utility offerings in other territories w
ith similar requirem
ents.
APSC FILED
Time: 3/26/2014 2:23:55 PM
: Recvd 3/26/2014 2:04:55 PM
: Docket 07-078-TF-D
oc. 185

Residential New Construction 6-1
6. Residential New Construction In reviewing the participant data for the Heating Equipment and Water Heating Equipment Rebates programs, the Evaluators discerned that there was in fact significant overlap in participation (both among owner-occupants and home builders). As such, it was decided that instead of separate analyses, the residential new construction components of the Heating Equipment and Water Heating Equipment Rebates programs would be combined into one analysis for purposes of determination of net savings estimates and process evaluation.
6.1 Residential New Construction Research Goals
In opting to research the residential new construction market within the SourceGas service territory, the Evaluators had the following research goals in mind:
Do the current program offerings capture the cost-effective gas savings available from the residential new construction market?
Are there other energy efficiency improvements that have been installed without incentives from SourceGas programs? Were these measures program-influenced?
Are there measures that would be installed in new homes within SourceGas service territory if rebates for these measures were available?
Have builders changed any of their model plans in response to the program?
6.2 Data Collection Activities
The subsections to follow detail the data collection activities associated with the Residential New Construction (RNC) evaluation.
6.2.1 Owner-Occupant Participant Surveys The Evaluators identified a large number of participation among custom home owner-occupants. Tracking data still identified these projects as new construction, and as a result the Evaluators were able to separate out these for a survey discrete from the main program surveys used for the Space Heating and Water Heating CIP. In order to provide more meaningful results, we have opted to aggregate the findings from the three Arkansas gas utilities into one dataset; the overall populations were quite small and as a result it would be more difficult to draw conclusions from one utilities’ list of available respondents. The survey sample included:
22 CenterPoint customers;
10 SourceGas customers; and
5 AOG customers.
APSC FILED Time: 3/26/2014 2:23:55 PM: Recvd 3/26/2014 2:04:55 PM: Docket 07-078-TF-Doc. 185
2013 SourceGas DSM Portfolio Final Evaluation Report
Residential New Construction 6-2
Issues covered in this survey included:
How custom home owner-occupants became involved with the program.
What influence did builders have in guiding their equipment selection.
What value did the customer place on the various components of an energy efficient home.
What other energy efficient options would the participant have potentially installed if programs were available.
Recommendations for program improvement.
6.2.2 Participant Builder Surveys The Evaluators identified 8 participating builders to address process evaluation issues in the new construction market. Four of these eight were based in AOG territory and the other four were based in CenterPoint territory.
Topics addressed in these interviews included:
The perceived value of the programs to builders;
Recommendations for program improvement;
Reasons for selection of standard versus high efficiency equipment;
Characterization of their interactions with utility staff;
Defining the processes for equipment specification for their homes;
Feedback on training sessions offered by their utility; and
Recommendations on how to market energy efficient homes.
6.3 Survey Findings 6.3.1 Marketing & Program Awareness
Respondents were asked to identify the channels through which they learned of their respective utility programs for space heating and water heating rebates. Figure 6-1 summarizes the sources of awareness as indicated by these respondents. Interviewees were allowed to provide more than one answer so the total of all respondents exceeds 100%.
APSC FILED Time: 3/26/2014 2:23:55 PM: Recvd 3/26/2014 2:04:55 PM: Docket 07-078-TF-Doc. 185
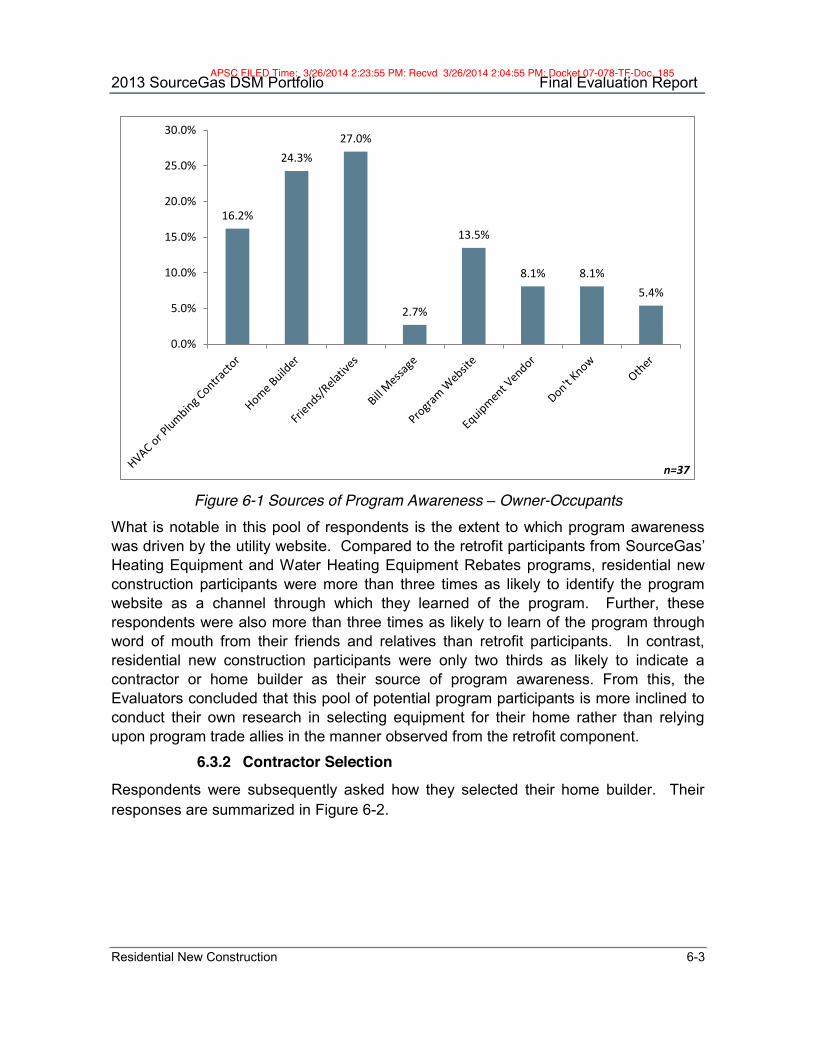
2013 SourceGas DSM Portfolio Final Evaluation Report
Residential New Construction 6-3
Figure 6-1 Sources of Program Awareness – Owner-Occupants
What is notable in this pool of respondents is the extent to which program awareness was driven by the utility website. Compared to the retrofit participants from SourceGas’ Heating Equipment and Water Heating Equipment Rebates programs, residential new construction participants were more than three times as likely to identify the program website as a channel through which they learned of the program. Further, these respondents were also more than three times as likely to learn of the program through word of mouth from their friends and relatives than retrofit participants. In contrast, residential new construction participants were only two thirds as likely to indicate a contractor or home builder as their source of program awareness. From this, the Evaluators concluded that this pool of potential program participants is more inclined to conduct their own research in selecting equipment for their home rather than relying upon program trade allies in the manner observed from the retrofit component.
6.3.2 Contractor Selection Respondents were subsequently asked how they selected their home builder. Their responses are summarized in Figure 6-2.
16.2%
24.3% 27.0%
2.7%
13.5%
8.1% 8.1% 5.4%
0.0%
5.0%
10.0%
15.0%
20.0%
25.0%
30.0%
n=37
APSC FILED Time: 3/26/2014 2:23:55 PM: Recvd 3/26/2014 2:04:55 PM: Docket 07-078-TF-Doc. 185

2013 SourceGas DSM Portfolio Final Evaluation Report
Residential New Construction 6-4
Figure 6-2 Selection Process for Home Builders
Most respondents selected a home builder that they knew through personal connection; 48.6% took a referral from a friend or relative, 24.3% knew their home builder they knew from prior work, and 10.8% were contractors themselves that performed the installation of the furnace and water heater as their home was built.
6.3.3 Selection of Energy Efficient Equipment Respondents were asked a battery of questions pertaining to their selection of energy efficient equipment options. First, respondents were asked to identify their reason for the specification of their high efficiency equipment. These reasons are summarized in Figure 6-3. What is notable in this figure is the extent to which respondents listed their purchase as being “good for the environment” as a reason for the selection of high efficiency equipment. At 18.9%, new construction participants indicated this reason significantly more often that retrofit participants (6.8%).
24.3%
48.6%
10.8%
5.4%
10.8%
n=37
Knew from prior work
Recommendation fromfriend/relative
Self-install
Competitive interviewprocess
Don't know
APSC FILED Time: 3/26/2014 2:23:55 PM: Recvd 3/26/2014 2:04:55 PM: Docket 07-078-TF-Doc. 185
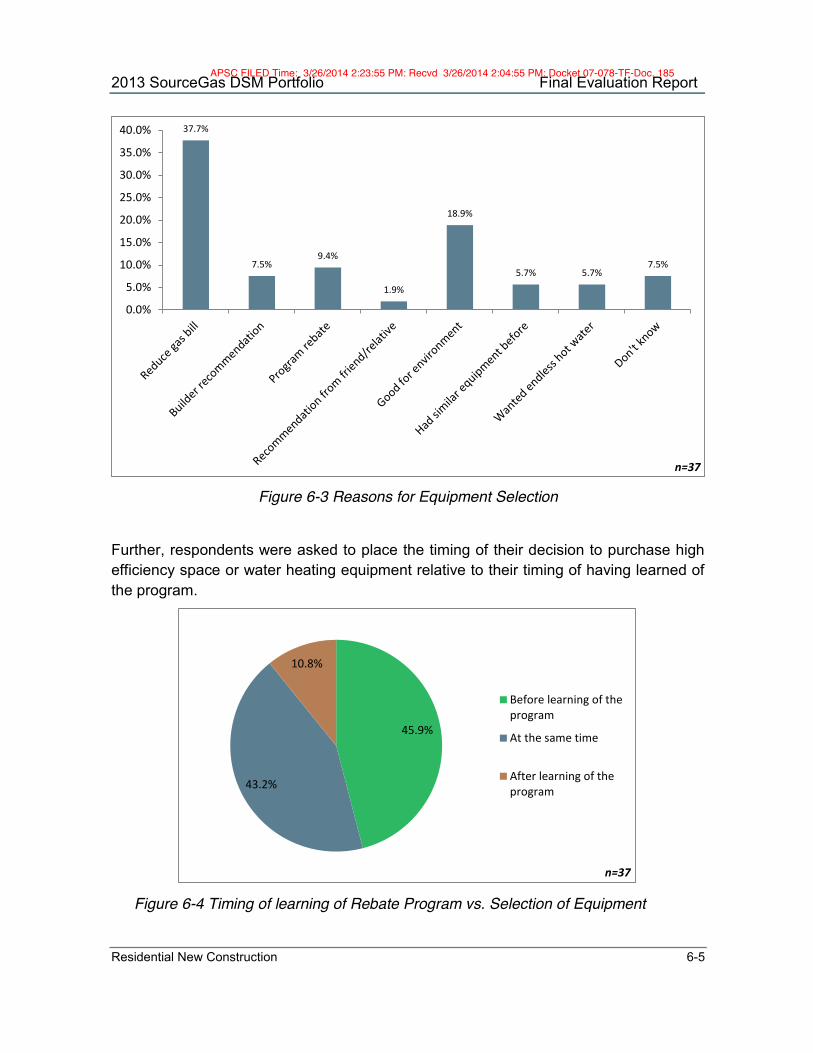
2013 SourceGas DSM Portfolio Final Evaluation Report
Residential New Construction 6-5
Figure 6-3 Reasons for Equipment Selection
Further, respondents were asked to place the timing of their decision to purchase high efficiency space or water heating equipment relative to their timing of having learned of the program.
Figure 6-4 Timing of learning of Rebate Program vs. Selection of Equipment
37.7%
7.5% 9.4%
1.9%
18.9%
5.7% 5.7% 7.5%
0.0%
5.0%
10.0%
15.0%
20.0%
25.0%
30.0%
35.0%
40.0%
n=37
45.9%
43.2%
10.8%
n=37
Before learning of theprogram
At the same time
After learning of theprogram
APSC FILED Time: 3/26/2014 2:23:55 PM: Recvd 3/26/2014 2:04:55 PM: Docket 07-078-TF-Doc. 185
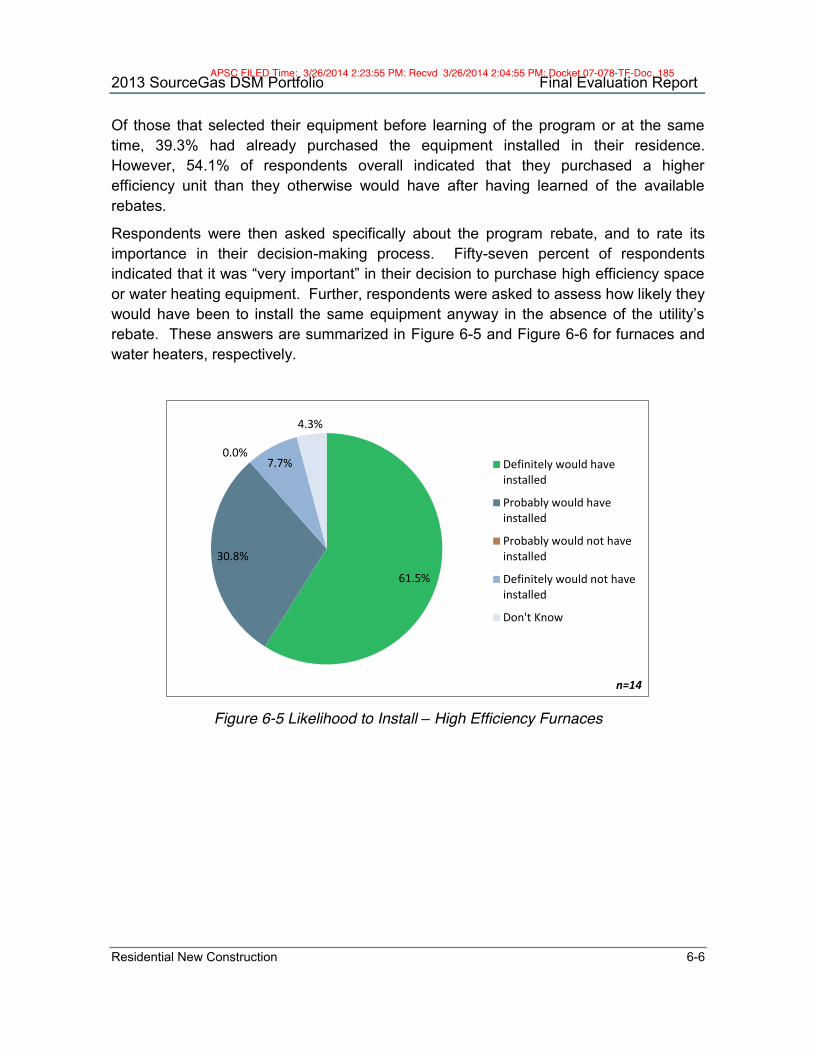
2013 SourceGas DSM Portfolio Final Evaluation Report
Residential New Construction 6-6
Of those that selected their equipment before learning of the program or at the same time, 39.3% had already purchased the equipment installed in their residence. However, 54.1% of respondents overall indicated that they purchased a higher efficiency unit than they otherwise would have after having learned of the available rebates.
Respondents were then asked specifically about the program rebate, and to rate its importance in their decision-making process. Fifty-seven percent of respondents indicated that it was “very important” in their decision to purchase high efficiency space or water heating equipment. Further, respondents were asked to assess how likely they would have been to install the same equipment anyway in the absence of the utility’s rebate. These answers are summarized in Figure 6-5 and Figure 6-6 for furnaces and water heaters, respectively.
Figure 6-5 Likelihood to Install – High Efficiency Furnaces
61.5%
30.8%
0.0% 7.7%
4.3%
n=14
Definitely would haveinstalled
Probably would haveinstalled
Probably would not haveinstalled
Definitely would not haveinstalled
Don't Know
APSC FILED Time: 3/26/2014 2:23:55 PM: Recvd 3/26/2014 2:04:55 PM: Docket 07-078-TF-Doc. 185

2013 SourceGas DSM Portfolio Final Evaluation Report
Residential New Construction 6-7
Figure 6-6 Likelihood to Install – High Efficiency Water Heaters
Most respondents indicated a high likelihood that they would have installed the same equipment without a program incentive. This corresponds with prior questions related to timing that would seem to indicate that the space and water heating programs are not reaching custom home builders early in their decision-making process.
Subsequently, respondents were asked what other energy efficient equipment or design features were installed in their new home, and to identify any other options that they would have considered if rebates were available. Their responses are summarized in Figure 6-7.
52.2% 47.8%
0.0% 0.0%
4.3%
n=23
Definitely would haveinstalled
Probably would haveinstalled
Probably would not haveinstalled
Definitely would not haveinstalled
Don't Know
APSC FILED Time: 3/26/2014 2:23:55 PM: Recvd 3/26/2014 2:04:55 PM: Docket 07-078-TF-Doc. 185
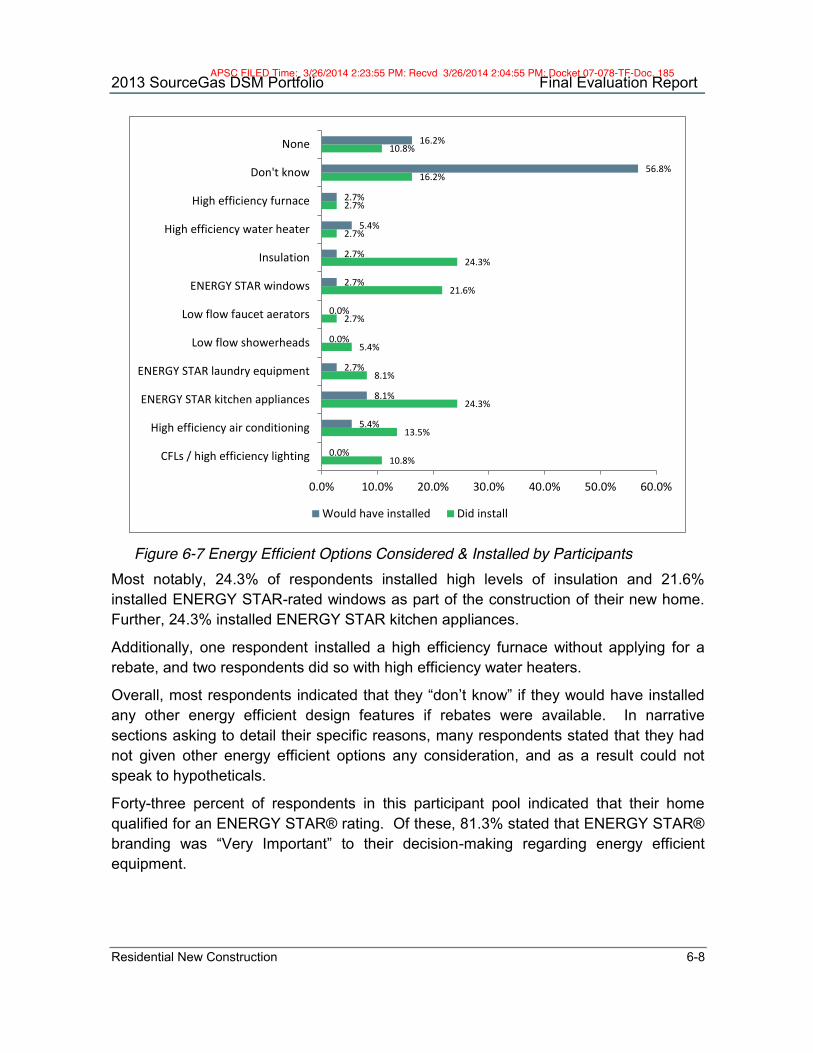
2013 SourceGas DSM Portfolio Final Evaluation Report
Residential New Construction 6-8
Figure 6-7 Energy Efficient Options Considered & Installed by Participants
Most notably, 24.3% of respondents installed high levels of insulation and 21.6% installed ENERGY STAR-rated windows as part of the construction of their new home. Further, 24.3% installed ENERGY STAR kitchen appliances.
Additionally, one respondent installed a high efficiency furnace without applying for a rebate, and two respondents did so with high efficiency water heaters.
Overall, most respondents indicated that they “don’t know” if they would have installed any other energy efficient design features if rebates were available. In narrative sections asking to detail their specific reasons, many respondents stated that they had not given other energy efficient options any consideration, and as a result could not speak to hypotheticals.
Forty-three percent of respondents in this participant pool indicated that their home qualified for an ENERGY STAR® rating. Of these, 81.3% stated that ENERGY STAR® branding was “Very Important” to their decision-making regarding energy efficient equipment.
10.8%
13.5%
24.3%
8.1%
5.4%
2.7%
21.6%
24.3%
2.7%
2.7%
16.2%
10.8%
0.0%
5.4%
8.1%
2.7%
0.0%
0.0%
2.7%
2.7%
5.4%
2.7%
56.8%
16.2%
0.0% 10.0% 20.0% 30.0% 40.0% 50.0% 60.0%
CFLs / high efficiency lighting
High efficiency air conditioning
ENERGY STAR kitchen appliances
ENERGY STAR laundry equipment
Low flow showerheads
Low flow faucet aerators
ENERGY STAR windows
Insulation
High efficiency water heater
High efficiency furnace
Don't know
None
Would have installed Did install
APSC FILED Time: 3/26/2014 2:23:55 PM: Recvd 3/26/2014 2:04:55 PM: Docket 07-078-TF-Doc. 185
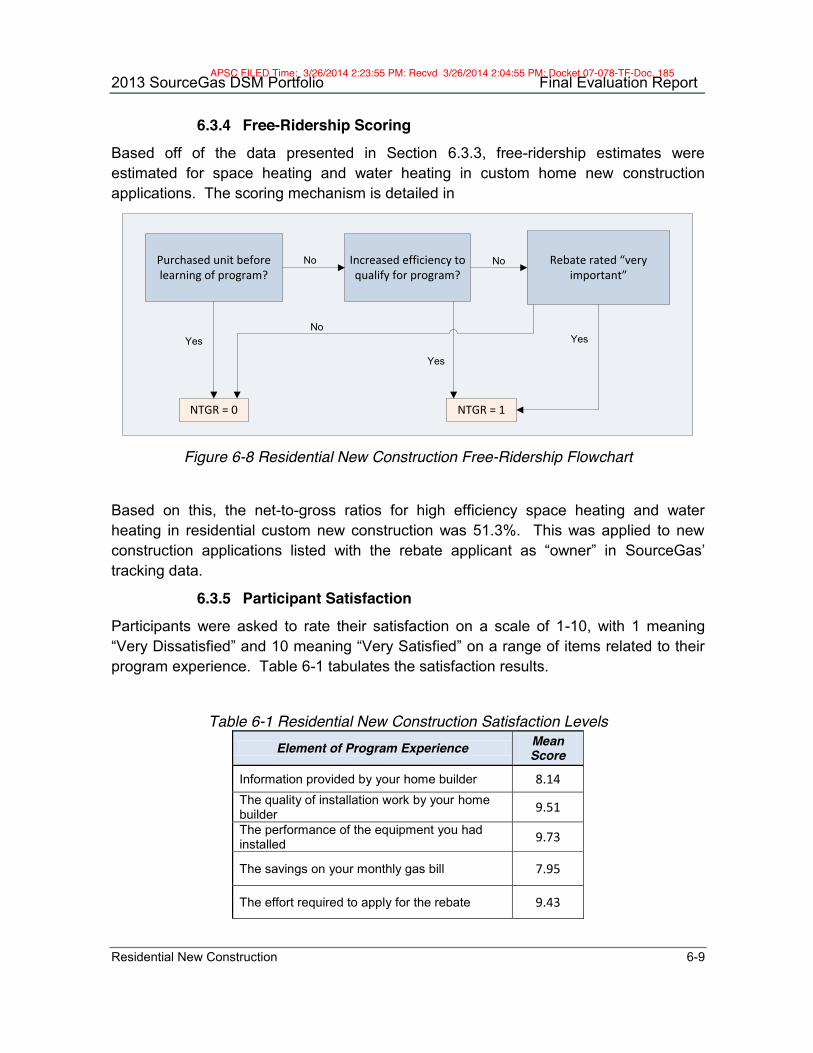
2013 SourceGas DSM Portfolio Final Evaluation Report
Residential New Construction 6-9
6.3.4 Free-Ridership Scoring Based off of the data presented in Section 6.3.3, free-ridership estimates were estimated for space heating and water heating in custom home new construction applications. The scoring mechanism is detailed in
Purchased unit before learning of program?
Rebate rated “very important”
Increased efficiency to qualify for program?
NTGR = 0 NTGR = 1
NoYes Yes
NoNo
Yes
Figure 6-8 Residential New Construction Free-Ridership Flowchart
Based on this, the net-to-gross ratios for high efficiency space heating and water heating in residential custom new construction was 51.3%. This was applied to new construction applications listed with the rebate applicant as “owner” in SourceGas’ tracking data.
6.3.5 Participant Satisfaction Participants were asked to rate their satisfaction on a scale of 1-10, with 1 meaning “Very Dissatisfied” and 10 meaning “Very Satisfied” on a range of items related to their program experience. Table 6-1 tabulates the satisfaction results.
Table 6-1 Residential New Construction Satisfaction Levels Element of Program Experience Mean
Score
Information provided by your home builder 8.14 The quality of installation work by your home builder 9.51
The performance of the equipment you had installed 9.73
The savings on your monthly gas bill 7.95
The effort required to apply for the rebate 9.43
APSC FILED Time: 3/26/2014 2:23:55 PM: Recvd 3/26/2014 2:04:55 PM: Docket 07-078-TF-Doc. 185

2013 SourceGas DSM Portfolio Final Evaluation Report
Residential New Construction 6-10
Element of Program Experience Mean Score
The wait-time to receive the rebate 8.81
The service provided by [utility] staff 9.49 Information provided by [utility] on how to reduce your gas bill 8.73
The comfort level of your new home 9.76
The rebate amount 9.59
Overall program experience 9.49
n=37
Overall satisfaction among residential new construction owner occupants is high. Respondents indicated particularly high satisfaction with the quality of installation work provided by their builder, the performance of the equipment installed, and the program rebate amount. Further, the effort needed to apply for the rebate and overall program satisfaction were both rated very high (greater than 9.40 out of 10). The lowest satisfaction score was for savings on the monthly bill (scored at 7.95 out of 10). Many of these respondents clarified that they did not know how to quantify this as the project was new construction and they did not feel that they had a good frame of reference as to what they saved as a result of installing high efficiency equipment.
6.4 Builder Feedback 6.4.1 Program Participation
Home builders that participated in the CenterPoint and AOG space heating and water heating programs were interviewed to provide feedback on their experience with energy efficiency programs. There has not been active home builder participation in SourceGas’ programs, and as such the Evaluators have incorporated feedback from CenterPoint and AOG home builders and incorporated it into this evaluation.
Home builders were asked to characterize their participation in utility-sponsored rebate programs for space heating and water heating equipment. Responses were mixed in terms of to what extent the builders have taken advantage of incentives for high efficiency furnaces versus tankless water heaters. Builders were more likely to indicate that the incentives for furnaces were sufficient to motivate them to install high efficiency units in their homes, whereas only three of the eight interviewed builders stated that the incentives are adequate to cover the cost of adding a tankless water heater.
The trade allies expect to be more active participants in the program next year, and plan to push the program to a further extent. Specifically, they said that they expect to grow
APSC FILED Time: 3/26/2014 2:23:55 PM: Recvd 3/26/2014 2:04:55 PM: Docket 07-078-TF-Doc. 185

2013 SourceGas DSM Portfolio Final Evaluation Report
Residential New Construction 6-11
through word-of-mouth, and because the program is available, they expect more customers will be taking advantage of the benefits.
6.4.1.1 Outreach, Marketing, and Customer Awareness
The builders were asked several questions about outreach and marketing from the perspective of their company, the utility, and the implementer as well as customer awareness of the program’s existence.
Only one of the eight interviewed builders produces homes that are labeled ENERGY STAR®. An additional three builders indicated that they used to build homes to ENERGY STAR®, but that they have been unable to keep up with the increased standards of ENERGY STAR®V3.0. As one builder stated,
“We used to do that to all of them a couple years ago, but we quit doing that. We’re building the same way, just not getting labeled as ‘energy star’ anymore”. Builders that do not produce ENERGY STAR® homes were asked if they do any other type of branding to mark their homes as energy efficient. They indicated that when they have included high efficiency equipment in the design, they mention the specific equipment in their marketing materials.
Seven of the eight builders indicated that first-cost was a significant barrier in the sale of homes with energy efficient equipment or design features. The one that indicated otherwise stated that because he focuses on high-end homes, he has a customer base that is more interested in quality than lowest-cost.
“It [the rebates] helps sell them. Rebates help overcome the costs of equipment. Price is a barrier that depends on what you’re building. What I build helps overcome that”. In general, the respondents indicated that energy efficiency is a tough sell in their respective markets. All interviewed builders stated that for their production homes, they are competing on first-cost with builders whom they would consider “lower-tier”, and that they face the greatest difficulty in convincing customers of the long-term benefits of energy efficient design in their homes. Builders indicated that they have greater luck with older purchasers whom have had a home before. This could be due to this group of customers having a longer perspective on how large utility bills can be in an inefficient home, compared against first-time buyers that may not have knowledge on the subject.
Largely, builders indicated that their customers are unaware of the annual cost savings of high efficiency equipment. This was a focal point of open-ended questions pertaining to what the builders think their utilities could do to support the sale of energy efficient homes.
”I think they could spend more time on promoting the builders who put in energy efficient equipment. You have to educate the public about building practices and the
APSC FILED Time: 3/26/2014 2:23:55 PM: Recvd 3/26/2014 2:04:55 PM: Docket 07-078-TF-Doc. 185

2013 SourceGas DSM Portfolio Final Evaluation Report
Residential New Construction 6-12
home builders who do that. You aren’t going to get people to retroactively put in energy efficient equipment. A lot of the efficient appliances need the whole home to be built for it rather than changing it after.” Further, builders were asked to identify how or to what extent energy efficient design features help them sell homes. Responses were mixed:
‘Well, that depends on the people. Everyone wants inexpensive bills. I’ve started putting in low-e windows. I put in insulation too. Some things I’m doing like sealing all the boards and light fixtures. As far as what I’m doing, it’s inexpensive. Most of the people I build houses for don’t want to pay the extra”. “Customers buying the houses don’t want to pay the difference. Most of the people around here don’t want to pay extra for anything”. The general consensus among builders was that their construction practices as they pertain to energy efficiency are responsive to their market’s interest level. They all stated that they would like to produce more efficient homes, but that their activity will be limited if they do not feel that their customer base will place value in improvements they make to their home models. The type of education and outreach needed for this purpose is likely too expensive to be supported solely by the space heating and water heating programs. Energy Efficiency Arkansas could serve this purpose, if EEA were to conduct more outreach in the real estate community.
Finally, builders were asked to gauge their interest in a whole-house efficiency program, where rebates are determined on home performance (such as by HERS rating). Respondents were generally worried about such a model. They were supportive of it if it could be used to capture and incentivize savings from certain lower-cost improvements such as insulation or improved air sealing, but the interviewed builders were largely not interested in moving to ENERGY STAR®-rated construction.
“The problem with that, we don’t have raters, and we don’t have people qualified to do it. I’m worried it would turn into the same thing as the Energy Star program. The appeal would wane with time. You want builders to continue programs. Educating the public is more important”.
6.4.1.2 Program Process Feedback
The respondents were also asked about feedback on elements of the program process including the application process and incentive amounts. Three respondents indicated some level of dissatisfaction with rebate amounts. All respondents indicated that the application process was simple and that they had had positive interactions with utility staff.
APSC FILED Time: 3/26/2014 2:23:55 PM: Recvd 3/26/2014 2:04:55 PM: Docket 07-078-TF-Doc. 185

2013 SourceGas DSM Portfolio Final Evaluation Report
Residential New Construction 6-13
6.4.1.3 Interactions with Staff and Training
Respondents were asked questions about the interactions with utility staff and asked to give any feedback on program training, if they had attended.
Two of the eight interviewed builders had attended training sessions related to space heating and water heating equipment. Of the six that had not participated, five stated that they would like to receive information on available training sessions and to participate. When asked what they would like to see out of a training session, areas of interest included:
Up-to-date practices on condensing furnace and tankless water heater installations;
Information on more advanced building techniques;
Additional information on what other programs they could potentially have their homes qualify for.
6.4.1.4 Additional Program Suggestions
Respondents were asked to identify energy efficiency improvements that they specifically would like to see covered by utility-sponsored programs. Their answers were very consistent in suggesting rebates for improved insulation levels and duct and air sealing. Though some level of these are all required by IECC 2006, there is still room for improvement and this could be potentially incentivized as a “new construction envelope improvement” package combining the three into a cost-effective measure.
6.4.1.5 Net-to-Gross
Home builders were asked to identify what percent of their homes had high efficiency furnaces or tankless water heaters prior to participating in the programs. Further, they were asked questions to identify their probability of installing similar equipment in the absence of available incentives. Findings included:
Most builders indicated a dramatic increase in the percent of their homes with high efficiency furnaces. The weighted-average increase was from 23% to 82% of their new homes having high efficiency furnaces.
The increase in market share was even larger for tankless water heaters. Five of the eight interviewed builders had never installed a tankless water heater in their homes until incentives became available.
Seven of the eight interviewed builders indicated that they “probably would not have installed” or “definitely would not have installed” high efficiency furnaces or tankless water heaters in the absence of program incentives26. One of the eight
26 Builders were asked this question separately for each measure.
APSC FILED Time: 3/26/2014 2:23:55 PM: Recvd 3/26/2014 2:04:55 PM: Docket 07-078-TF-Doc. 185

2013 SourceGas DSM Portfolio Final Evaluation Report
Residential New Construction 6-14
interviewed builders stated that they “definitely would have installed” the same equipment. This was the same builder that had stated prior that their homes used to qualify for ENERGY STAR® until the V3.0 revision.
Each builder was then assigned a score of 0 or 1 for NTGR. Their responses were then weighted by the number of rebates each builder had in 2013, resulting in a NTGR of 91.7% for production homes. This was applied to new construction applications listed with the rebate applicant as “builder” in SourceGas’ tracking data.
6.5 Recommendations
Based off of our interviews with participating builders and surveys with custom home owner-occupants, the Evaluators recommend the following:
Develop a measure package for an improved building envelope. There was high interest indicated for rebates for insulation, air sealing, and duct sealing. This could be a measure package for new home builders, if SourceGas does not want to start a whole-house new construction program.
Encourage customer education in the home buyer market through EEA. SourceGas should work to leverage EEA activities in providing education through channels that reach the home buyer market, in order to identify the cost savings possible through purchase of an efficient home. With Arkansas’s relatively low cost of living and housing prices, this could be a sizable number relative to mortgage cost.
Improve builder outreach and training. Only 25% of interviewed builders participated in a training session. Of the four builders that had had participated in AOG programs, one of the four had participated in training. Home builders indicated strong interest in training sessions that could provide more knowledge on advanced building techniques.
Do not incentivize energy efficient windows. Based on our home builder interviews, it was found that low-e windows are already widely implemented and would have high free-ridership.
APSC FILED Time: 3/26/2014 2:23:55 PM: Recvd 3/26/2014 2:04:55 PM: Docket 07-078-TF-Doc. 185

C&I Solutions 7-1
7. Commercial and Industrial (C&I) Solutions Program The C&I Solutions program is directed at developing and incenting custom energy efficiency projects for which deemed values are not applicable or feasible. It is implemented by CLEAResult Consulting on behalf of SourceGas. CLEAResult handles program administration, marketing and outreach, direct install of water conservation measures, and technical review of custom efficiency projects. Program participants are provided:
(1) No-cost direct installation of low flow faucet aerators, showerheads, and pre-rinse spray valves (PRSVs), if they have gas water heating;
(2) Prescriptive incentives for commercial boilers and controls (formerly rebated through the C&I Boiler Equipment Rebates Program); and
(3) $.80 per Therm for custom projects.
7.1 C&I Solutions Program Overview
The C&I Solutions Program has $1,370,925 in budget allocated for 2013. The C&I Solutions program’s historical performance is summarized in Table 7-1.
Table 7-1 C&I Solutions Program Historical Performance against Goals Program
Year # Participants Budget Net Therms Actual Goal Spent Allocated Achieved Goal
2011 404 790 $486,284 $637,926 500,906 451,808
2012 51827 773 $836,388 $1,012,822 560,574 536,810
2013 417 723 $1,382,015 $1,410,997 954,191 805,150
The C&I Solutions Program participants fall into one of four categories:
Direct install;
Prescriptive boiler rebates;
Custom audit recipients28; and
Closed custom projects.
These participants are detailed in the subsections to follow.
27 This tally is the number of accounts that participated in the C&I Solutions Program. When sampling for Direct
Install, the Evaluators aggregated by premise. Some premises had multiple account numbers, and as a result, the population size listed later in the Direct Install component for sampling purposes is smaller than this tally.
28 The Evaluators tally audit recipients but do not count them towards SourceGas’ participation goal.
APSC FILED Time: 3/26/2014 2:23:55 PM: Recvd 3/26/2014 2:04:55 PM: Docket 07-078-TF-Doc. 185

2013 SourceGas DSM Portfolio Final Evaluation Report
C&I Solutions 7-2
7.1.1.1 Direct Install Participation Summary
In 2013, there were direct install projects completed at 401 unique premises. The summary of participation by facility type and the relative share of program Therms savings are summarized in Figure 7-1.
Figure 7-1 SourceGas Direct Install Participation Summary
Hotel/Motel comprises the bulk of participation from direct installation projects. Other significant contributors included medical, casual dining, and office facilities.
Figure 7-2 summarizes the timing of direct install savings, listing the volume of Therms savings by month. This chart is reflective of the amount of annual savings from projects installed in each month.
0.1%
4.6%
12.6%
18.4%
0.2%
26.4%
2.5%
1.9%
7.0%
3.4%
2.8%
14.4%
5.7%
0.7%
7.2%
14.7%
13.2%
0.2%
17.7%
3.2%
5.2%
6.0%
3.7%
1.2%
20.0%
6.7%
0.0% 5.0% 10.0% 15.0% 20.0% 25.0% 30.0%
Warehouse
Retail / Service
Office
Medical
Industrial
Hotel / Motel
Grocery
Fast Food
Education / K-12
Daycare / Shelter
College / University
Casual Dining
Assembly / Worship
n=401 % Facilities % Savings
APSC FILED Time: 3/26/2014 2:23:55 PM: Recvd 3/26/2014 2:04:55 PM: Docket 07-078-TF-Doc. 185

2013 SourceGas DSM Portfolio Final Evaluation Report
C&I Solutions 7-3
Figure 7-2 C&I Solutions Direct Install Monthly Therms Savings
Program installations and savings were spread throughout 2013. This contrasts with 2012, in which direct install activities had to be ramped up in the fourth quarter to account for low participation in the custom component. SourceGas indicated that the increased direct install activity year-round was due to the goal increase from 2012 to 2013.
7.1.1.2 Completed Audits Participation Summary
The C&I Solutions Program is largely driven by on-site audits providing recommendations for custom projects. CLEAResult conducts an on-site audit, from which an audit report is developed that provides a high-level summary of potential energy efficiency improvements and their expected savings. After reviewing the program tracking data, the Evaluators found that audits were conducted at 34 facilities. Figure 7-3 summarizes the quantity of measure recommendations and installations by category, and Figure 7-4 summarizes these measures by recommended versus installed Therms.
-
5,000
10,000
15,000
20,000
25,000
30,000
35,000
40,000
45,000
50,000
APSC FILED Time: 3/26/2014 2:23:55 PM: Recvd 3/26/2014 2:04:55 PM: Docket 07-078-TF-Doc. 185

2013 SourceGas DSM Portfolio Final Evaluation Report
C&I Solutions 7-4
Figure 7-3 Summary of Measures Recommended & Installed
Figure 7-4 Summary of Therms Recommended & Installed
1
1
0
2
1
2
0
2
2
1
1
1
2
2
3
3
12
12
12
13
0 2 4 6 8 10 12 14
Regenerative Thermal Oxidizer
Infrared Heating
Process Boiler Replacement
HVAC Controls
Steam Leak Repair
Steam Trap Replacement
Heat Recovery
Process Improvement
Insulation
Boiler Controls
n=61 Amount Recommended Amount Installed
157,283
10,293
-
122,932
46,572
324,748
-
142,901
6,781
27,510
157,283
10,293
1,947
122,932
71,691
328,114
361,351
1,294,986
91,601
273,027
Regenerative Thermal Oxidizer
Infrared Heating
Process Boiler Replacement
HVAC Controls
Steam Leak Repair
Steam Trap Replacement
Heat Recovery
Process Improvement
Insulation
Boiler Controls
Recommended Therms Installed Therms
APSC FILED Time: 3/26/2014 2:23:55 PM: Recvd 3/26/2014 2:04:55 PM: Docket 07-078-TF-Doc. 185
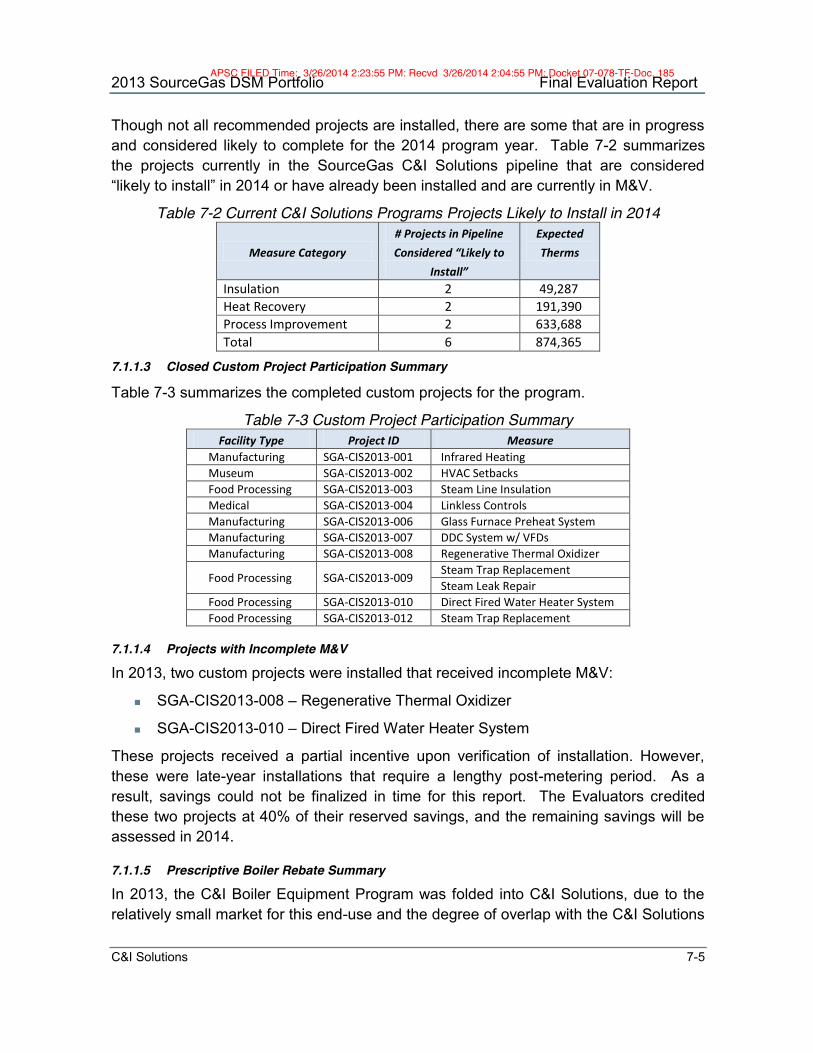
2013 SourceGas DSM Portfolio Final Evaluation Report
C&I Solutions 7-5
Though not all recommended projects are installed, there are some that are in progress and considered likely to complete for the 2014 program year. Table 7-2 summarizes the projects currently in the SourceGas C&I Solutions pipeline that are considered “likely to install” in 2014 or have already been installed and are currently in M&V.
Table 7-2 Current C&I Solutions Programs Projects Likely to Install in 2014
Measure Category # Projects in Pipeline Considered “Likely to
Install”
Expected Therms
Insulation 2 49,287 Heat Recovery 2 191,390 Process Improvement 2 633,688 Total 6 874,365
7.1.1.3 Closed Custom Project Participation Summary
Table 7-3 summarizes the completed custom projects for the program.
Table 7-3 Custom Project Participation Summary Facility Type Project ID Measure
Manufacturing SGA-CIS2013-001 Infrared Heating Museum SGA-CIS2013-002 HVAC Setbacks Food Processing SGA-CIS2013-003 Steam Line Insulation Medical SGA-CIS2013-004 Linkless Controls Manufacturing SGA-CIS2013-006 Glass Furnace Preheat System Manufacturing SGA-CIS2013-007 DDC System w/ VFDs Manufacturing SGA-CIS2013-008 Regenerative Thermal Oxidizer
Food Processing SGA-CIS2013-009 Steam Trap Replacement Steam Leak Repair
Food Processing SGA-CIS2013-010 Direct Fired Water Heater System Food Processing SGA-CIS2013-012 Steam Trap Replacement
7.1.1.4 Projects with Incomplete M&V
In 2013, two custom projects were installed that received incomplete M&V:
SGA-CIS2013-008 – Regenerative Thermal Oxidizer
SGA-CIS2013-010 – Direct Fired Water Heater System
These projects received a partial incentive upon verification of installation. However, these were late-year installations that require a lengthy post-metering period. As a result, savings could not be finalized in time for this report. The Evaluators credited these two projects at 40% of their reserved savings, and the remaining savings will be assessed in 2014.
7.1.1.5 Prescriptive Boiler Rebate Summary
In 2013, the C&I Boiler Equipment Program was folded into C&I Solutions, due to the relatively small market for this end-use and the degree of overlap with the C&I Solutions
APSC FILED Time: 3/26/2014 2:23:55 PM: Recvd 3/26/2014 2:04:55 PM: Docket 07-078-TF-Doc. 185

2013 SourceGas DSM Portfolio Final Evaluation Report
C&I Solutions 7-6
target market. In 2013, there were six rebates prescriptive boilers at four premises. This included:
Two boilers at a retail facility;
Three boilers at two educational facilities; and
One boiler at a religious facility.
7.2 C&I Solutions Process Evaluation
The Evaluators conducted a formal process evaluation of the C&I Solutions Program in 2012, and found that the program was successful in meeting participation, savings, and satisfaction goals. Table 7-4 and Table 7-5 summarize the Evaluators’ review of the C&I Solutions Program in comparison to TRM V3.0 Protocol C for timing and conditions of conducting a process evaluation.
Table 7-4 Determining Appropriate Timing to Conduct a Process Evaluation Component Determination
New and Innovative Components
Yes. The program has added several measure initiatives to enhance participation. Further, a trade ally network was developed.
No Previous Process Evaluation No. The program received a comprehensive process evaluation in 2012.
New Vendor or Contractor No. The program has been implemented by CLEAResult since 2011.
Table 7-5 Determining Appropriate Conditions to Conduct a Process Evaluation
Component Determination Are program impacts lower or slower than expected? No. The program met savings goals in 2012.
Are the educational or informational goals not meeting program goals?
As of 2012, the program had not adequately engaged regional trade allies. This was assessed in 2013 and found to be significantly improved.
Are the participation rates lower or slower than expected? No. The program met participant goals in 2012.
Are the program’s operational or management structure slow to get up and running or not meeting program administrative needs?
No. The 2012 process evaluation found that operational and management structure to be up to speed and efficient in administering the program.
Is the program’s cost-effectiveness less than expected?
No, the program’s cost-effectiveness vastly exceeded expectations.
Do participants report problems with the programs or low rates of satisfaction?
No. 2012 participant surveys found exceedingly high satisfaction levels.
Is the program producing the intended market effects?
Uncertain. At the time of the last evaluation, trade allies had not been engaged.
The 2013 process evaluation was focused on key issues identified in 2012. Issues addressed by the 2013 process evaluation included:
APSC FILED Time: 3/26/2014 2:23:55 PM: Recvd 3/26/2014 2:04:55 PM: Docket 07-078-TF-Doc. 185

2013 SourceGas DSM Portfolio Final Evaluation Report
C&I Solutions 7-7
Have program staff reviewed 2012 recommendations? To what extend have these recommendations been adopted, and how has this impacted the program?
Has the CIS program developed a trade ally network? This was lacking in 2012, and served to hamper project and program development.
What program enhancements has CLEAResult put in place? What initiatives have been undertaken to broaden the scope of the program?
Has the program succeeded in shifting participation away from direct install and towards custom projects?
7.3 Data Collection Activities
The process evaluation of the C&I Solutions Program included the following data collection activities:
Program Actor In-Depth Interviews. The Evaluators conducted in-depth interviews with a series of program actors. These interviews covered a range of topics, including marketing efforts, feedback on program delivery, an assessment of barriers to program implementation and success, and recommendations for program improvement. Program Actors interviewed include:
- SourceGas Program Staff. The Evaluators interviewed staff at SourceGas involved in the administration of the C&I Solutions Program. These interviews built upon interviews conducted in 2012, keeping apprised of SourceGas’ involvement as the C&I Solutions Program develops.
- Third Party Implementation Staff Interviews. The Evaluators conducted interviews with CLEAResult involved with the C&I Solutions Program. These interviews addressed the development of the program over the 2013 program year as well as CLEAResult’s perspective on a variety of implementation issues, including conversion of audits to completed projects and the process flow for direct install and custom projects.
- Trade Ally Interviews. With the development of a trade ally network, the Evaluators sought feedback from active trade allies in order to address how they interact with the program, and to identify potential areas of program enhancement.
Program Marketing Materials Review. CLEAResult began use of case studies based upon closed projects to enhance marketing. The Evaluators reviewed the case studies provided, as this was a new outreach mechanism for the program.
Review of Program Quality Control Procedures. The Evaluators reviewed the QC procedures in place for the C&I Solutions Program. This included review of pre- and post-installation inspection procedures, the M&V procedures in place by
APSC FILED Time: 3/26/2014 2:23:55 PM: Recvd 3/26/2014 2:04:55 PM: Docket 07-078-TF-Doc. 185

2013 SourceGas DSM Portfolio Final Evaluation Report
C&I Solutions 7-8
SourceGas and CLEAResult, and identification of any issues or gaps in the program QC process.
Participant Surveying. A census of custom participants and a sample of direct install participants were surveyed for this evaluation effort. These surveys included net-to-gross and process issues. The surveys provided valuable data for this process evaluation effort, providing participant feedback as to their program participation, recommendations for program improvement, and insight into the decision-making process.
Partial-Participant Interviewing. Partial Participants (those that receive an audit report but do not install a project through the program) were interviewed to capture their perspective on the program. These interviews included their perception of the value of the C&I Solutions Program’s auditing services, their reasons for not installing a project through the program, the likelihood of future program participation, and whether they installed any recommended measures without having applied for a program incentive.
Table 7-6 summarizes the data collection for this process evaluation effort. This includes the titles, role, sample sizes, timeframe of data collection.
APSC FILED Time: 3/26/2014 2:23:55 PM: Recvd 3/26/2014 2:04:55 PM: Docket 07-078-TF-Doc. 185

2013 SourceGas DSM Portfolio Final Evaluation Report
C&I Solutions 7-9
Table 7-6 SourceGas C&I Solutions Data Collection Summary Target Component Activity N Role
SourceGas Program Staff
Manager, Energy Efficiency Interview 1
Overall administration of SourceGas DSM programs. This manager is involved in the larger strategic decisions associated with the DSM portfolio, and is involved with the C&I Solutions Program in the overall coordination of utility resources.
CLEAResult Staff
Senior Program Manager Interview 1
The Senior Program Manager oversees the program implementation for CenterPoint, SourceGas, and AOG, handling cross-cutting issues as well as the largest projects associated with each of the three utilities’ programs.
Program Coordinator Interview 1
The Program Coordinator handles day-to-day operations, including tracking of outreach and implementation activities, payments for direct installation, and interfacing with Evaluation staff.
Program Participants
Custom Participants Survey 11
Custom participants received a semi-structured interview at the beginning of a project and a structured survey at the close. The Evaluators interviewed a census of participants
Direct Install Participants Survey 52 52 direct install participant decision-makers were
interviewed to discuss their participation process.
Partial Participants Interview 17
A sample of 11 audit recipients that are considered “cold leads” by CLEAResult were interviewed to discuss their participation process and to attempt to identify any spillover. Due to limited population sizes, this sample of 11 includes audit recipients from CenterPoint, SourceGas, and AOG.
Marketing & Outreach
Marketing Materials
Case Study Review
- The Evaluators reviewed the case studies developed from 2012 participants that were used in 2013 marketing.
7.3.1 Process Results & Findings
This section will present the results and key findings from the data collection activities. These findings are based upon interviews with utility staff, implementation staff, surveys with participants, and thorough and in-depth literature review.
7.3.1.1 Response to Program Recommendations
Table 7-7 summarizes the status of issues and recommendations identified in the 2012 process evaluation.
APSC FILED Time: 3/26/2014 2:23:55 PM: Recvd 3/26/2014 2:04:55 PM: Docket 07-078-TF-Doc. 185

2013 SourceG
as DS
M P
ortfolio Final E
valuation Report
C&I Solutions
7-10
Table 7-7 C&I Solutions Response to 2012 Recomm
endations Issue
Consequences Recom
mendation
SourceGas/CLEAResult Response
Status of Issue
Limited DI options
Reduced savings opportunities
Add low flow
showerheads as a perm
anent com
ponent of CIS. Research viability of other DI m
easures, including steam
traps.
Low flow
showerheads for com
mercial
applications were added to the program
. Steam
trap trade allies were recruited and
a targeted marketing effort w
as successfully conducted.
Recomm
endations adopted
Post-installation M&
V procedures being lengthier than necessary
Excess wait-tim
es for incentives. U
nnecessarily burdensom
e data collection
Continue the ongoing effort in providing feedback for developm
ent of M&
V procedures for custom
projects that shorten the M&
V process w
hile maintaining rigor.
Post-installation M&
V procedures have been significantly shortened for all project types w
here doing so is feasible.
Recomm
endations adopted
Direct Install databases lacking sufficient project data.
Repeated data requests to SourceGas and CLEAResult, m
ore costly Evaluation
Add unique project identification numbers.
Add project points of contact.
CLEAResult has added all requested data fields.
Issue corrected
Program is not used by
trade allies
Outreach focused
on efforts by SourceGas and CLEAResult staff
Work to develop trade allies to im
plement
popular measures such as linkless controls or
steam line insulation.
The program has recruited trade allies for
boiler controls, insulation, steam trap
replacement, and kitchen ventilation.
Other m
easure categories may w
arrant new
trade allies in the future, but progress on this issue has been significant.
Recomm
endations adopted
Issue corrected
Formalize a process by
which CIS can collect
prescriptive incentives from
program referrals and vice
versa
Misallocation of
outcomes relative
to expenditures
Track referrals from C&
I Solutions to prescriptive program
s, and assign the savings credit to C&
I Solutions.
With CLEAResult im
plementing both the
prescriptive and custom program
s, this is not necessary.
Recomm
endation review
ed &
rejected
Direct Install databases lacking peak Therm
s calculations
Failure to adhere w
ith ASPC reporting requirem
ent
Add peak Therms calculations as per TRM
V3.0 guidelines.
This has been added to DI tracking. Issue corrected
Tracking data is inconsistent across three AR gas utilities
Added oversight &
evaluation costs
Impose standard facility and m
easure names in
savings calculators, built by one project team
and disseminated to the other AR utilities.
The three gas utility DI databases have been reconciled to have consistent structure.
Issue corrected
APSC FILED
Time: 3/26/2014 2:23:55 PM
: Recvd 3/26/2014 2:04:55 PM
: Docket 07-078-TF-D
oc. 185

2013 SourceGas DSM Portfolio Final Evaluation Report
C&I Solutions 7-11
7.3.1.2 Program Theory & Design
The C&I Solutions Program was designed to provide outreach in hard-to-reach sectors of the C&I markets. The main bullets below list program activities and their expected outcomes as determined through the 2012 process evaluation. The secondary bullets indicate new program enhancements.
Direct installation of water saving measures. The C&I Solutions program provides no-cost direct installation of low flow faucet aerators and pre-rinse spray valves. These measures have a high return of savings relative to their cost and as such can be provided free-of-charge and remain cost-effective. The provided savings are unlikely to occur absent the program; generally, if a respondent does not already have the equipment in place, the direct install activities induce an action that was not planned. It is also the intention that these activities will serve as an introductory teaser to energy efficiency for the recipients, and that they will then be further interested in participating in the custom component of the program.
- Addition of low flow showerheads. CLEAResult added low flow showerheads to the program in August 2013. These were successfully implemented in commercial and hospitality facilities.
Energy audits to large customers. These audits are conducted by CLEAResult staff, providing recommendations for energy efficiency improvements and an audit report. These audits are intended to generate the bulk of the program savings, yielding high-return non-standard projects.
- Audits for medium-sized customers. The program has at this point reached out to the “Tier I” customers within SourceGas territory (defined as the highest tier of users that have not opted out). 2013 saw expanded outreach to medium-sized facilities with gas-saving opportunities.
Incentives for custom measures. The C&I Solutions program provides $.80 per Therm for verified savings from custom projects. These projects may be driven by a program-funded audit, generated by a trade ally, or be customer-directed.
Referral to SourceGas prescriptive programs. There are instances where the CLEAResult audit identifies energy savings opportunities that qualify for a prescriptive incentive. In these instances, the project is referred to prescriptive rebate programs for processing, and the savings are not credited to the C&I Solutions program.
APSC FILED Time: 3/26/2014 2:23:55 PM: Recvd 3/26/2014 2:04:55 PM: Docket 07-078-TF-Doc. 185

2013 SourceGas DSM Portfolio Final Evaluation Report
C&I Solutions 7-12
7.3.1.3 Program Administration
The C&I Solutions program is overseen by the Manager of Energy Efficiency at SourceGas. This manager’s responsibilities primarily include interfacing with CLEAResult, who directly implements the program. Other activities by this manager include providing updated customer lists to CLEAResult to better facilitate their implementation, review of custom applications, and at times assisting CLEAResult in customer interactions.
For CLEAResult, the program overall is led by the Senior Program Manager, who oversees the implementation of the C&I Solutions Program for all three AR natural gas utilities. This manager handles high-level issues across the programs, including regulatory compliance and reporting, as well as some level of intervention on the larger projects.
Much of the day-to-day activity is handled by the Program Coordinator. The Program Coordinator reviews direct-install and audit activity, handles billing and administration with SourceGas, and coordinates with the Evaluators in facilitating EM&V activities.
Direct install and audit activities are run by Energy Engineers and Field Engineers. These engineers oversee crews that perform direct installation and conduct the energy audits. Additionally, their responsibilities include development of the audit report and recommendations, and following up with the customer to gauge interest in completing a project.
7.3.1.4 Program Implementation and Delivery
Throughout the program year, CLEAResult would provide the Evaluators with updates regarding their pipeline of custom projects. The Evaluators were provided with monthly updates, listing the full scope of facility audits, expected savings with associated recommended measures, and what stage the project was in. These stages are:
Pipeline. Projects listed as Pipeline are in the first phase of involvement in the Commercial & Industrial Solutions Program. These participants are customers that have discussed the possibility of a facility audit and indicated interest to CLEAResult. These facilities will receive a Pre-Inspection at a later date.
Pre-Inspected. Projects listed as Pre-Inspected are in the phase where CLEAResult has completed a facility audit. During these audits, CLEAResult conducts a comprehensive review of the facility’s systems and operational practices. On this basis, CLEAResult then formulates initial recommendations for energy efficiency improvements. These are discussed with facility staff during the audit in order to address the feasibility of recommended measures.
Pre-Installation Calculation. At this phase, CLEAResult is compiling high-level data needed to provide an initial estimate of energy savings. This step of the
APSC FILED Time: 3/26/2014 2:23:55 PM: Recvd 3/26/2014 2:04:55 PM: Docket 07-078-TF-Doc. 185

2013 SourceGas DSM Portfolio Final Evaluation Report
C&I Solutions 7-13
process compiles the information collected in the site audit, which are then used in the development of an Audit Report.
Audit Report Complete. In this phase, feasible measures from the Pre-Inspection are compiled into a formal audit report, providing the participant with further detail as to the scope of the project, initial savings estimates, associated incentives, expected project costs, and the payback period of the measure. Additionally, should the measure provide operational benefits to the facility (such as improved comfort or product reliability), these are included as well to provide the customer with a full scope of the benefits of the project.
Project Agreement. At this point, the customer has informed CLEAResult and SourceGas that they intend to install a program-recommended measure. When this occurs, CLEAResult then involves the evaluators. CLEAResult provides the evaluators with an M&V plan for the facility, detailing the project scope and proposed data collection and analysis. The evaluators’ engineering staff then reviews the M&V plan and makes recommendations for any changes needed. If this revises the savings amount, the reserved incentive amount in the application is revised. A project agreement is then signed, in which the reserved incentive amount is detailed and reflects edits made by the evaluators.
Post-Inspection. This phase marks the completion of post-inspection for an installed measure. CLEAResult has, at this point, post-inspected a measure and revised savings accordingly if the installed project differs from the proposed project. At this point, 60% of the reserved incentive is paid to the customer.
M&V. M&V marks the phase when post-installation data is collected for an installed project to allow for calculation of a final savings estimate, from which the remaining incentive to the customer is determined. There are some measures that do not require post-retrofit data; for such measures, the M&V phase is short and requires completion of calculations based upon inputs verified during the Post-Inspection. For facilities that require post-installation data, the data collection period can range from 30 days to 6 months.
Complete. Facilities marked as Complete have received their full incentive. As stated prior, 40% of the reserved funds for the incentive are available to pay the remaining incentive amount owed to the customer. If the verified savings are below the Project Agreement savings, the customer’s incentive is reduced accordingly, so as to keep incentive levels at $.80/Therm. If the verified savings are higher than the Project Agreement amount, CLEAResult and SourceGas determine if there are available incentive funds left for the program year. If the program has remaining funds, the customer receives a total incentive higher than
APSC FILED Time: 3/26/2014 2:23:55 PM: Recvd 3/26/2014 2:04:55 PM: Docket 07-078-TF-Doc. 185

2013 SourceGas DSM Portfolio Final Evaluation Report
C&I Solutions 7-14
the initial agreement. If no remaining funds are available, the customer’s incentive is capped at the Project Agreement amount.
The process flow for the C&I Solutions Program is displayed in Figure 7-5.
APSC FILED Time: 3/26/2014 2:23:55 PM: Recvd 3/26/2014 2:04:55 PM: Docket 07-078-TF-Doc. 185

2013 SourceG
as DS
M P
ortfolio Final E
valuation Report
C&I Solutions
7-15
SourceGas
CLEAResult
C&I Solutions
Pay remaining
incentive based on M
&V results
Project installed
Incentive reserved
Prescriptive C&I
programs
Eligible for prescriptive incentive?
Prescriptive projects
identified?
Custom projects
identified?
Direct install identified?
Agrees to audit?
Large C&I
Customers
ESCOs &
Engineering
firms
Small C&
I Custom
ers
Audit report com
pleted
Project agreem
ent signed
M&
V plan drafted
M&
V plans review
ed by ADM
Conduct M&
V
Lengthy M&
V required?
Pay 40% of
incentive
Project closed as prescriptive
incentive
Direct install m
easures im
plemented
M&
V project, then pay in full
Yes
No
Implem
ents
Refers to
Markets to
Marketing and O
utreach
Provides Custom
er List
Implem
ents
Figure 7-5 C&I Solutions Process Flow
APSC FILED
Time: 3/26/2014 2:23:55 PM
: Recvd 3/26/2014 2:04:55 PM
: Docket 07-078-TF-D
oc. 185

2013 SourceGas DSM Portfolio Final Evaluation Report
C&I Solutions 7-16
7.3.1.5 Program Marketing & Outreach Efforts
The C&I Solutions Program added several new channels for program marketing. The Evaluators reviewed these channels to assess strengths and weaknesses of these efforts.
7.3.1.5.1 Project Case Studies
Figure 7-6 presents a regenerative thermal oxidizer case study and Figure 7-7 presents a molten aluminum well cover case study.
Figure 7-6 Thermal Oxidizer Case Study
APSC FILED Time: 3/26/2014 2:23:55 PM: Recvd 3/26/2014 2:04:55 PM: Docket 07-078-TF-Doc. 185

2013 SourceGas DSM Portfolio Final Evaluation Report
C&I Solutions 7-17
Figure 7-7 Molten Aluminum Pump Well Cover Case Study
The case studies offer succinct examples of closed projects for common measures from the custom channel. The impacts (in consumption, savings, and financial incentive) are identified in bold, eye-catching font. The case studies correspond to best practices for the fostering of peer-to-peer marketing in the large industrial sector. However, at this point there are measures that have not been implemented in the SourceGas program
APSC FILED Time: 3/26/2014 2:23:55 PM: Recvd 3/26/2014 2:04:55 PM: Docket 07-078-TF-Doc. 185

2013 SourceGas DSM Portfolio Final Evaluation Report
C&I Solutions 7-18
that could be marketed using case studies from the other Arkansas gas utilities. The natural gas utilities in Arkansas have a mutual agreement to allow CLEAResult to use case studies from their program in the other utilities’ programs, but the SourceGas program would be better-served by developing more case studies from within their program.
From the existing pool of SourceGas customers, the program could develop case studies for:
Steam trap replacement
Infrared heating
Further, from the pool of custom projects completed for CenterPoint elsewhere in Arkansas, case studies could be found for:
Combustion air preheating
HVAC controls
7.3.1.6 Prescriptive Marketing Materials
The Evaluators were sent copies of marketing collateral used by program implementation staff. A two-sided postcard was sent to end-users likely to have a boiler system.
APSC FILED Time: 3/26/2014 2:23:55 PM: Recvd 3/26/2014 2:04:55 PM: Docket 07-078-TF-Doc. 185

2013 SourceGas DSM Portfolio Final Evaluation Report
C&I Solutions 7-19
The postcards provided examples of boilers and boiler components eligible for program rebates. The postcard could be potentially improved, however, by including the rebate amounts for each of the four items listed.
7.3.1.7 Audit Report Review
The Evaluators reviewed the audit reports provided to custom program participants. The audit reports include a brief description of facility operations along with a summary table of measures recommended. An example summary table is provided in Figure 7-8.
Figure 7-8 Sample Measure Recommendation Table
Following this, individual measures are described in greater detail. The summary table is effective in that it incorporates the incentive into the payback and Internal Rate of Return (IRR) calculations. Further, the cost savings estimates are based on individual customers’ costs per CCF (which will vary depending upon each participant’s’ transportation agreement).
APSC FILED Time: 3/26/2014 2:23:55 PM: Recvd 3/26/2014 2:04:55 PM: Docket 07-078-TF-Doc. 185

2013 SourceGas DSM Portfolio Final Evaluation Report
C&I Solutions 7-20
One shortfall the Evaluators found in the audit reports, however, was in the cost estimates for replacement on equipment failure (such as replacement of a failed or failing steam boiler serving a process load). For some projects, CLEAResult did apply incremental cost in the audit report assumptions. However, the Evaluators found instances where full project cost was listed when the identified energy efficiency measure constituted Normal Replacement (or replacement on burnout). For these projects, the Projected Project Cost field was populated with a total project cost, resulting in payback period estimates exceeding 20 years. For projects that encompass replacement of failed equipment, CLEAResult should populate this field with incremental cost instead. This provides a more realistic estimate of the return on investment for the extra expense of high efficiency equipment.
Following this, a summary of the facility’s consumption and cost profile is provided, including a graphical reorientation of the facility’s base and space heating load. Figure 7-9 presents a sample consumption profile from a C&I Solutions audit report.
Figure 7-9 Sample Audit Report Consumption Profile
APSC FILED Time: 3/26/2014 2:23:55 PM: Recvd 3/26/2014 2:04:55 PM: Docket 07-078-TF-Doc. 185

2013 SourceGas DSM Portfolio Final Evaluation Report
C&I Solutions 7-21
In 2012, the Evaluators found that the Disaggregated Usage graphs often presented an unrealistic picture of the base load versus space heating load breakout. In 2013, the analysis used to separate these loads was improved significantly. Program staff attributed this to refinement in their calculation process, by which the formula used to break out loads would be informed by more contextual data from the facility, rather than a fixed set of formulas and assumptions in the analysis spreadsheet.
7.3.2 Direct Install Survey Response The Evaluators surveyed 52 respondents from the direct install component. The survey sample for the direct install component is summarized in Figure 7-10, represented in terms of percent of the survey population.
Figure 7-10 C&I Solutions Direct Install Sample Summary
7.3.2.1 C&I Decision-Making Processes
Respondents are first asked about how they learned about the CIS program. A majority of respondents learned about the program through SourceGas staff or CIS Program representatives (86.5%). Figure 7-11 shows a breakdown of the responses.
0.0%
5.0%
10.0%
15.0%
20.0%
25.0%
30.0%
n=52 % Respondents % Participants % Savings
APSC FILED Time: 3/26/2014 2:23:55 PM: Recvd 3/26/2014 2:04:55 PM: Docket 07-078-TF-Doc. 185
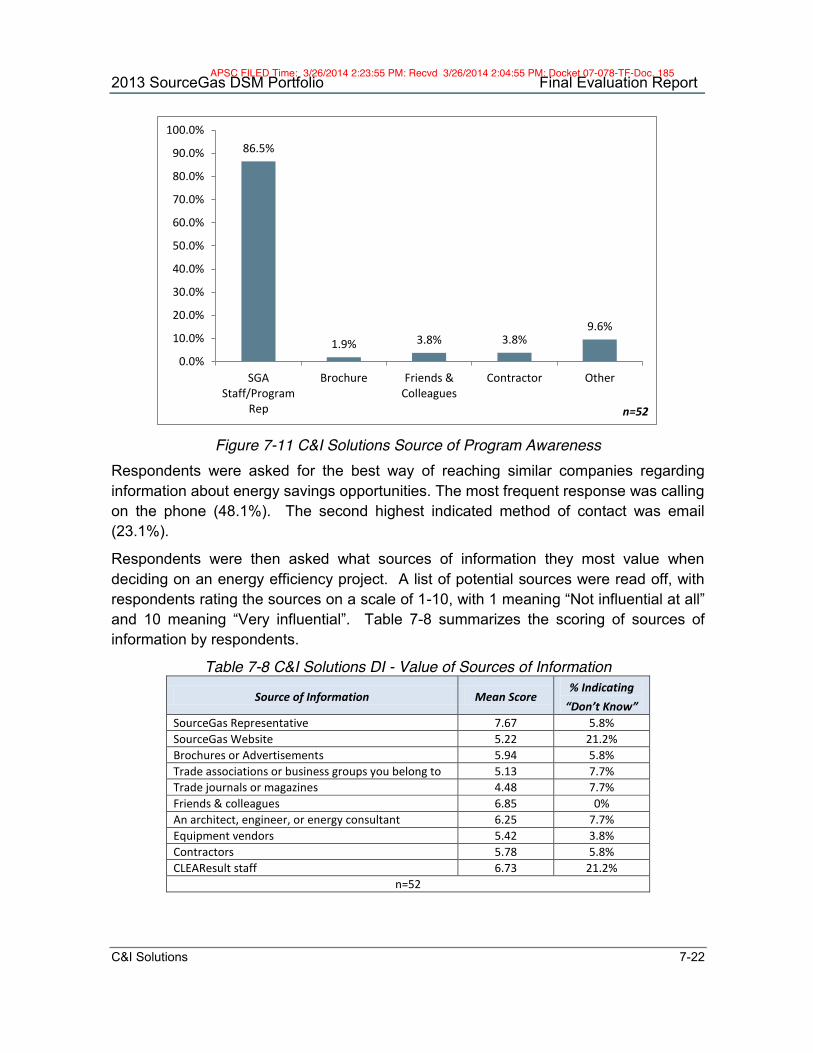
2013 SourceGas DSM Portfolio Final Evaluation Report
C&I Solutions 7-22
Figure 7-11 C&I Solutions Source of Program Awareness
Respondents were asked for the best way of reaching similar companies regarding information about energy savings opportunities. The most frequent response was calling on the phone (48.1%). The second highest indicated method of contact was email (23.1%).
Respondents were then asked what sources of information they most value when deciding on an energy efficiency project. A list of potential sources were read off, with respondents rating the sources on a scale of 1-10, with 1 meaning “Not influential at all” and 10 meaning “Very influential”. Table 7-8 summarizes the scoring of sources of information by respondents.
Table 7-8 C&I Solutions DI - Value of Sources of Information
Source of Information Mean Score % Indicating “Don’t Know”
SourceGas Representative 7.67 5.8% SourceGas Website 5.22 21.2% Brochures or Advertisements 5.94 5.8% Trade associations or business groups you belong to 5.13 7.7% Trade journals or magazines 4.48 7.7% Friends & colleagues 6.85 0% An architect, engineer, or energy consultant 6.25 7.7% Equipment vendors 5.42 3.8% Contractors 5.78 5.8% CLEAResult staff 6.73 21.2%
n=52
86.5%
1.9% 3.8% 3.8% 9.6%
0.0%
10.0%
20.0%
30.0%
40.0%
50.0%
60.0%
70.0%
80.0%
90.0%
100.0%
SGAStaff/Program
Rep
Brochure Friends &Colleagues
Contractor Other
n=52
APSC FILED Time: 3/26/2014 2:23:55 PM: Recvd 3/26/2014 2:04:55 PM: Docket 07-078-TF-Doc. 185

2013 SourceGas DSM Portfolio Final Evaluation Report
C&I Solutions 7-23
Highest value was placed on information received by SourceGas staff, who is a primary marketer of the program, with a mean score of 7.67. The low score for CLEAResult staff is likely indicative of respondents confounding CLEAResult staff with SourceGas staff. Other sources of information presented were not valued as highly, with most respondents indicating preference sources that generate one-on-one contact rather than requiring background research of third-party sources of information.
7.3.2.2 Energy Efficiency Potential
Respondents were asked several questions regarding the equipment that used the highest amount of natural gas, organizational energy efficiency policies, decision-making processes, and awareness of energy efficiency programs offered by the electric and gas utilities.
The highest natural gas using equipment in the facility was space heating/furnace and the second highest using equipment was the water heater. Figure 7-12 shows a breakdown of the natural gas using equipment at the respondent’s facility.
Figure 7-12 Summary of Natural Gas Loads
7.3.2.3 Program Satisfaction
Participants were asked to rate their satisfaction on a scale of 1-10, with 1 meaning “Very Dissatisfied” and 10 meaning “Very Satisfied” on a range of items related to their program experience. Table 7-9 tabulates the satisfaction results.
1.9%
1.9%
5.8%
23.1%
32.7%
15.4%
0.0%
3.8%
3.8%
19.2%
46.2%
26.9%
0.0% 10.0% 20.0% 30.0% 40.0% 50.0%
Industrial Process
Boiler
Laundry Equipment
Food Service Equipment
Water Heater
Space Heating/Furance
n=52 Highest Load Second Highest Load
APSC FILED Time: 3/26/2014 2:23:55 PM: Recvd 3/26/2014 2:04:55 PM: Docket 07-078-TF-Doc. 185

2013 SourceGas DSM Portfolio Final Evaluation Report
C&I Solutions 7-24
Table 7-9 C&I Solutions Direct Install Satisfaction Levels Element of Program Experience Mean
Score Don't Know
The performance of the equipment installed 8.43 1.9%
Energy savings from equipment 8.10 2.2%
The effort required for the application process 8.80 11.5%
Information provided by installing contractor 8.47 1.9%
Information provided by SourceGas Account Representative 7.55 15.4%
Information and/or Opportunity Report provided by CLEAResult 7.95 28.8%
Overall program experience 8.34 3.8%
Overall satisfaction with the C&I Solutions Direct Install program is very high. Respondents indicated markedly high satisfaction levels with all factors. Many of the decision-makers do not directly observe their gas bill, and for smaller participants, the difference in use may be hard to discern from regular fluctuations associated with larger gas-using equipment (such as a furnace).
On the operational side, customers indicated high satisfaction levels with information provided by CLEAResult, performance of equipment installed, and the application process, with mean scores of 7.95, 8.43, and 8.80, respectively.
Some respondents did rate specific elements with low scores of 1 and 2. The respondents were asked to explain why they were not satisfied with those elements. Those that were dissatisfied with the performance of the equipment said they had issues with the water pressure (“sprays your face” and “not enough pressure”). When it came to the energy savings from the equipment, one respondent said that because the water pressure was low, they saw no difference in savings. Another respondent said that because it “didn’t work,” their overall program experience was very low.
The respondents were asked for any comments or suggestions about SourceGas energy efficiency programs or programs specific to commercial facilities. Some negative responses included that there was no difference in savings, and that they were displeased with the water pressure. However there were several positive comments including the professional demeanor of the workers, a good experience overall, and to pass on any future information about the energy efficiency programs.
7.3.3 Custom Project Survey Response The Evaluators conducted interviews with the 10 decision-makers responsible for the completed custom projects in the C&I Solutions program in 2013. Given the small number of interviews, reporting data in terms of percent response by question does not
APSC FILED Time: 3/26/2014 2:23:55 PM: Recvd 3/26/2014 2:04:55 PM: Docket 07-078-TF-Doc. 185
2013 SourceGas DSM Portfolio Final Evaluation Report
C&I Solutions 7-25
adequately present the participant response to the program. The Evaluators opted to present the results in terms of individual case studies, rather than aggregated survey responses.
SGA-CIS2013-001: The participant is a manufacturing facility that received an audit through the C&I Solutions Program. In this audit, several failed infrared heaters as well as additional forced air heaters that were near failure were identified, and a recommendation was put in place for the options available to replace this equipment. These recommendations were ignored at the time, but in winter 2012 the heating units failed, and the facility was left with insufficient space heating to maintain winter time production.
The participant needed to rapidly assembly bids to replace this equipment, and in the Evaluators’ interview it was found that strict cost criteria were enforced for this project as it was to come from their maintenance budget. There was not the time for the facility staff to make a capital request to their corporate office. The cost of the condensing infrared heaters would have exceeded what the participant had available without program incentives.
After the completion of this project, this participant later went on to have faucet aerators installed throughout their facility through the C&I Solutions Program.
SGA-CIS-2013-002: This respondent was a museum that received an audit from the C&I Solutions Program. During the audit, it was found that there was a significant amount of off-hour use due to a lack of calibration of the demand control ventilation and space heating system. The facility has two zones:
Gallery zones, containing artwork; and
Non-gallery zones, which do not contain artwork.
The gallery zones need constant operation of the HVAC system to maintain tight temperature and relative humidity parameters. The project specified in the audit was to adjust the setback and DCV in the non-gallery zones. The Evaluators found that the facility staff would not have recalibrated the controls on their non-gallery areas without the assistance from the program.
This project was in the end verified at 0% gross realization. However, it was found that following the completion of the project, facility management staff were still concerned that the changes to the non-gallery zones could somehow affect the gallery zones, and they responded by undoing most of the updates to the non-gallery zones. When reviewing the available data, the Evaluators could not discern savings with any reasonable confidence level and, therefore, no savings were credited for this project. This participant received faucet aerators through the C&I Solutions Program in 2012, and those measures were retained.
APSC FILED Time: 3/26/2014 2:23:55 PM: Recvd 3/26/2014 2:04:55 PM: Docket 07-078-TF-Doc. 185
2013 SourceGas DSM Portfolio Final Evaluation Report
C&I Solutions 7-26
SGA-CIS2013-003: The participant is a food processing plant that received an audit through the C&I Solutions Program. In this audit, program staff identified uninsulated steam lines. The system had operated with uninsulated steam lines for several decades prior to this audit. Facility staff indicated that they were aware that uninsulated steam lines waste energy, but it had not been on their mind to take care of it as it was not interfering with production.
SGA-CIS-2013-004: This participant is a medical facility that received audit from the C&I Solutions Program. In this audit, it was found that the facility’s primary boiler was operating only at mid-loading through most of the year, and as a result would be a viable candidate for linkless controls. In the interview with the facility representative, it was found that they did not have this project in mind until having the opportunity identified through the program audit, and that it would not have passed their criteria of three-year payback without program incentives.
This facility also received installation of faucet aerators and pre-rinse spray valves in 2012, as well installation of showerheads in 2013.
SGA-CIS2013-006: The participant is a manufacturing facility that approached the program with a concept for a redesign of glass furnaces used in their manufacturing process. The redesigned furnaces improved the surface area within the furnaces, allowing for a greater amount of product to be processed in each batch while at the same time reducing the length of time per batch.
The facility representative indicated that their parent company in Japan is very supportive of energy efficiency, though they do have financial criteria that projects must meet (minimum two year payback). Further, there were concerns surrounding this project as it was not known whether the furnace redesign would compromise product quality. The respondent stated that with the available rebate funding, they were able to pilot-test a first furnace and assess the resulting product quality. When it was found that the redesign did not affect product quality, they were able to obtain approval to retrofit a total of 12 furnaces in 2013 (the prototype plus 11 others), with an additional 24 furnaces to be retrofitted in 2014.
SGA-CIS2013-007: The participant is a manufacturing facility that approached the program with a project that would add DDC controls and VFDs to their HVAC system. The system was designed by an outside mechanical contractor. There were multiple versions of this system designed to meet different price points, which the respondent presented to the Evaluators in advance of the interview. The respondent stated that their parent company has imposed a one-year payback criterion for capital projects, and that this project was of sufficient cost to require central corporate approval. The project was jointly incentivized by the SourceGas and Entergy programs, as it saved both fuels. They indicated that without incentives, they would have gone with the lesser of the two
APSC FILED Time: 3/26/2014 2:23:55 PM: Recvd 3/26/2014 2:04:55 PM: Docket 07-078-TF-Doc. 185

2013 SourceGas DSM Portfolio Final Evaluation Report
C&I Solutions 7-27
designs proposed, with the alternate system being significantly less comprehensive in controlling the HVAC systems for the facility. The Evaluators reviewed this alternate system and found that the savings from this system would be less than half of what the new system could achieve, and on that basis, the project was granted 100% NTGR.
SGA-CIS2013-008: The participant is a manufacturing facility received an audit through the C&I Solutions Program. In this audit, it was found that the facility could attain significant savings through the replacement of an old thermal oxidizer with a newer, more efficient regenerative thermal oxidizer. The replaced thermal oxidizer was functioning, and the facility is on a reduced operating schedule due to low production quotas, so there were no plans in place for energy efficiency improvements. However, the rebate was sufficient to allow for this project to go forward without requiring corporate approval, which facility staff indicated would not have been given due to them being on a four-day per week operating schedule.
SGA-CIS2013-009: The participant is a food processing plant that received an audit through the C&I Solutions Program. The audit focused on development of savings estimates based on the large number of failed open steam traps and leaking steam lines in the facility, providing estimates of steam loss based on plume length for leaks, and an accepted industry standard approach for traps. Program staff facilitated an introduction between the participant and a trade ally for a more comprehensive steam trap survey. The facility manager had been at the plant for more than five years, and the identified failed steam traps had been failed that entire time. The respondent further indicated that after this experience in the program, they are establishing an annual steam trap survey process with their internal staff.
SGA-CIS2013-010: The participant is a food processing plant that received an audit through the C&I Solutions Program. They did not go forward with any measures recommended in the audit. However, several months after the audit, facility staff reached out to CLEAResult to assess whether a project could be eligible if it were part of a plant expansion. The facility was adding production capacity, and needed a larger water heating system to provide hot water for sterilization and production processes. There were numerous equipment configurations that could meet the capacity they needed. The facility contact indicated that a project of this scale (greater than $100,000 cost) would need approval from their VP of engineering, various finance departments and, eventually, the company board of directors. In total, the project would need to obtain financial approval from eight different signatories within the company. He was pessimistic that a direct fired hot water system would be approved on that basis, and without the incentive it was considered a marginal project from a financial standpoint. The project was approved and was evaluated as a new construction project, using an 80% baseline (minimum code for water heaters) rather than the efficiency of the existing water heater (it was still operational, but undersized and inefficient).
APSC FILED Time: 3/26/2014 2:23:55 PM: Recvd 3/26/2014 2:04:55 PM: Docket 07-078-TF-Doc. 185

2013 SourceGas DSM Portfolio Final Evaluation Report
C&I Solutions 7-28
SGA-CIS2013-012: The participant is a food processing plant that received an audit through the C&I Solutions Program. Several high-return opportunities were identified in the audit, including steam trap replacement, repair of steam leaks, and the repair of broken economizers that have been inoperable since 2010. The company was in the process of a bankruptcy re-organization and, as a result, was unable to obtain approval for any capital expenditures. The customer decided to proceed with the steam trap replacement project. The project was first submitted to the customer’s corporate board, with a listed payback of less than three months without a rebate, and as fully-paid by the program with a rebate. This was rejected by their corporate office on the basis of a lack of capital available to pay the upfront project cost, even if this would be reimbursed four to six weeks later with a program rebate. Program staff identified a trade ally that was willing to install the project without immediate customer payment, and the rebate was assigned to the trade ally to pay their cost a few weeks after installation. The rate of savings relative to the modest project cost was sufficiently high that there was little risk of the trade ally not being paid in full for this project.
7.3.1 C&I Partial-Participant Survey Response As part of the Commercial and Industrial Solutions Program evaluation, the evaluators conducted a survey with partial participant customers. Partial participants were defined as commercial customers who applied for and received a facility audit, but did not proceed to receive rebates for the energy efficiency improvements that were recommended during the audit. ADM conducted surveys with 17 partial participants, all of whom had received at least one energy efficiency recommendation through the facility audit. The pool of available partial participants to speak with was small, so the 17 participants represents an aggregation of AOG, SourceGas, and CenterPoint partial participants. However, three partial participants indicated that they had or were planning to opt out of the program, and one partial participant was going to have the audit re-done. Since very few questions were answered after they had responded that they would not participate, some of their responses will be excluded from this narrative. The objective of this partial participant survey was to gain insight into partial participant decision making and identify any participation barriers that may prevent these customers from completing energy efficiency projects through the program. Additionally, the survey sought to determine whether these customers had proceeded with the recommended energy efficiency improvements outside of the program rather than applying for available rebates.
7.3.1.1 Motivations & Awareness
In order to gain insight into their decision making and perspective on energy efficiency, respondents were asked what motivated them to initially participate in the Commercial and Industrial Solutions Program. Customers provided a range of responses, and the most common responses were that they were aware of the incentive/rebate programs
APSC FILED Time: 3/26/2014 2:23:55 PM: Recvd 3/26/2014 2:04:55 PM: Docket 07-078-TF-Doc. 185

2013 SourceGas DSM Portfolio Final Evaluation Report
C&I Solutions 7-29
and that they were looking for energy savings and ideas. Four respondents were interested in reducing their costs. Four respondents mentioned that they were contacted either by the utility or CLEAResult, providing information about the program and offering to perform the initial audit. Specific partial participant comments related to initial motivations include:
“We are always looking to be more efficient and reduce costs.” “We have sustainability goals for the organization and the facility. We have to go after any energy savings possible. The audit helped us develop our sustainability plan.” “We went through a steam efficiency course through [the utility] and learned more about the program while we were there.”
These results suggest that while some partial participants were very aware of the program, and the primary motivations for these customers was to identify options for energy efficiency in order to reduce the facility’s utility bills.
When asked whether they had previously been aware of the energy efficiency improvement opportunities that were identified during the facility audit and recommended, eight of the 13 respondents reported that they had already been aware of some of the options available for reducing energy use, whereas five were unaware. Six of these eight respondents explained that while they had been aware of the general approaches to saving energy and of some available rebates, such as improving boiler efficiency or system upgrades, but they did not know the specific steps needed to make these improvements until they participated in the Commercial and Industrial Solutions Program audit. Four of these respondents also indicated that CLEAResult had contacted them and told them more about the program. These results suggest that while the majority of respondents were aware of and interested in specific energy saving improvements, the audit was an informative tool in partial participants’ understanding of the specific actions they would need to take to most effectively reduce their energy loads.
7.3.1.2 Implementation of Recommended Improvements
In order to determine partial participants’ actions since the facility audits were performed, respondents were asked whether they had implemented any of the energy efficiency recommendations that had resulted from the inspection process. Four of the partial participant respondents indicated that they had proceeded with implementing the recommended improvements.
When asked why they had not implemented these improvements through the incentive program, two of the respondents explained that they had only partially implemented the recommendation since they prioritized the money their organization had available for
APSC FILED Time: 3/26/2014 2:23:55 PM: Recvd 3/26/2014 2:04:55 PM: Docket 07-078-TF-Doc. 185

2013 SourceGas DSM Portfolio Final Evaluation Report
C&I Solutions 7-30
smaller improvements. For example, these two respondents who received a recommendation for insulation have installed it in the most critical areas, but the other, more expensive recommendations have become lower priorities. Both respondents stated that they may continue to implement the full scope of recommended improvements in the future, but that there are currently no structured plans to do so. One respondent indicated that had installed other energy-saving opportunities that were discussed at the time of the audit, but did not install the main recommendation of a system upgrade due to financial reasons. Another respondent reported that they had signed an agreement with an outside organization for an audit and performance contract, which they believed made them ineligible for the program rebates.
These findings indicate that while some partial participants may have implemented minor recommendations or partial energy efficiency projects, they have chosen not to proceed with any recommended improvements that would qualify for program rebates and/or do not have the capital funding to proceed with larger projects. It is possible that some of these partial participants may fully proceed with the recommended projects in the future; if and when this occurs, the resultant savings would be attributable to the Commercial and Industrial Solutions Program.
The remaining nine respondents were asked why they had not proceeded with implementing any of the recommendations they received during the facility audit. These respondents provided a wide range of responses, but the most common statement was that the lack of funding for the initial cost of the energy efficiency improvements was the main barrier in the implementation process, whether from the organization or the utility program. Another issue raised was the lack of time to pursue the project, whether that was time management outside of their daily workload or filling out paperwork for the program. Respondents reported that while the available incentives would be useful in partially offsetting the costs of the recommended projects, current or anticipated lack of funds prevented the facility from moving forward with projects at this time.
Three of the respondents also explained that the recommendations were not a priority at the moment at their facility due other hardships. For example, two respondents stated that their facility had recently experienced a fire and that current capital would be prioritized for the most critical areas first before directing money towards energy efficiency upgrades. One respondent stated that it would be too expensive to implement the recommendations and would not be cost effective due to the nature of the production. Two other respondents replied that they were the only person working on energy efficiency and that it was hard to manage their time. Examples of individual comments include:
“It is way too expensive. We haven’t made any changes. It would be tremendously expensive and [we] would have to totally retool parts of the plant.”
APSC FILED Time: 3/26/2014 2:23:55 PM: Recvd 3/26/2014 2:04:55 PM: Docket 07-078-TF-Doc. 185

2013 SourceGas DSM Portfolio Final Evaluation Report
C&I Solutions 7-31
“We are currently in a due diligence situation so there is no money for any improvements at this time. The measures were discussed, but [we are] currently running at a loss…[It] was considered, but it is no longer a priority.” “I am the only person working on this…I get caught up with my workload that I forget about this stuff. I wish I had more time to work on it, but I don’t.”
Another six respondents reported that they are still considering implementing the recommended improvements, but are currently prioritizing other projects or do not have the money to pursue the recommendations at this time. These customers stated that they would have to wait for funding to be available before moving forward with the audit recommendations.
Partial participants were then asked how likely they would be to implement the recommended measures in the future, as shown in Table 7-10. The majority of respondents stated that they were somewhat unlikely to proceed with the recommended improvements in the near future, and some of the respondents reported that they were likely to do so. When asked how long it would be before the improvements could be made, half of all of the respondents who reported it was somewhat or very likely to implement the efficiency improvements stated that the projects may occur within one year. The other half of the respondents indicated that the timing of implementation is uncertain, and that it may either be more than one year to two years before the project(s) can be completed. Those respondents that had opted out were placed in the “very unlikely” response.
Table 7-10 Likelihood to Implement Recommended Measures
How likely are you to implement
[EQUIPMENT/MEASURE] in the future?
Response (N = 17)
Very likely 12%
Somewhat likely 23%
Neither likely nor unlikely 6%
Somewhat unlikely 17%
Very unlikely 41%
These findings indicate that partial participants are fairly unlikely to proceed with the recommended improvements. Three of these participants have chosen to opt out of the program, four respondents indicated that it would be too expensive to pursue any or all
APSC FILED Time: 3/26/2014 2:23:55 PM: Recvd 3/26/2014 2:04:55 PM: Docket 07-078-TF-Doc. 185
2013 SourceGas DSM Portfolio Final Evaluation Report
C&I Solutions 7-32
of the recommendations, and one respondent was ineligible for the rebates. However, six respondents were still interested in implementing the recommendations in the next year, dependent on availability of capital funding for projects.
Of those that responded to the question of viability, five partial participant respondents reported that at least one of the audit recommendations was a viable energy saving improvement for their facility. Two respondents explained that while the recommended measures would save some energy over time, it would not be enough to justify the equipment costs.
7.3.1.3 Participation Barriers and Overall Program Experience
In order to identify any remaining barriers to participation or opportunities for program modifications, partial participants were asked what, if anything, could have enabled them to proceed with the recommended energy efficiency improvements. The majority of respondents restated that cost had been the main barrier, and a secondary statement was an issue with time. Some respondents also reported that because they had been contacted by CLEAResult or the utility later in their fiscal year, funding was no longer available in their budget to pursue the recommendations. Two respondents stated that even though they have corporate goals to reduce energy and water consumption, it was difficult to get approval based on payback times or the type of material used. Specific comments related to these participation barriers include:
“We could not move forward due to financial/capital deficiencies. We plan on pursuing [the recommendations] in 2014 and hope to have the money available then.” “It’s a time and money issue.” “We got contacted late in the year and so we don’t have any capital project funding left.”
Of those three respondents who had chosen to opt out of the program, their responses varied. For example, one respondent said that the audit did not produce a high savings potential and chose not to pursue participation any further. Another respondent replied that the audit was too limited and that it did not offer any real solutions that would justify cost effectiveness. The last respondent chose not to elaborate on their reasons to opt out.
When asked whether there is anything that CLEAResult or the utility could have done to enable the customer to proceed with the recommended projects, respondents generally stated that their reasons for not proceeding with the recommendations were internally-based rather than related to the utility or implementation contractor. A few of the respondents mentioned some specific actions that CLEAResult or utility staff could have taken in order to enable project implementation. For example, one respondent had
APSC FILED Time: 3/26/2014 2:23:55 PM: Recvd 3/26/2014 2:04:55 PM: Docket 07-078-TF-Doc. 185
2013 SourceGas DSM Portfolio Final Evaluation Report
C&I Solutions 7-33
expressed more follow up or continued contact as a reminder. Other suggestions included more aggressive marketing, a “big picture”, whole package document, and some would have liked to been contacted earlier in the year to secure funding for projects. Additionally, several respondents stated that CLEAResult staff had been very helpful during the audit process, and that the audit and overall program had been very informative. Individual comments include:
“[CLEAResult] did a lot of good things for us. They are really great. I can’t say enough good things about them.” “[CLEAResult staff] was excellent. They gave good information and they tried their best. I was pretty convinced by the end of the audit. They helped with the rebates for the hot water heaters.” “[CLEAResult was] really good to work with. Maybe could have been contacted a few months earlier to help.”
Additionally, respondents provided further commentary regarding their program experiences. These comments were very positive and complimentary in nature, and indicate that partial participants highly value the information and recommendations they received through the facility audit. After the survey was completed, a few respondents mentioned that they planned to contact CLEAResult or their utility to follow-up on the audit process and gain further information regarding how to proceed with the recommended improvements.
The general partial participant survey findings suggest that there are some customers that are somewhat likely to implement their recommended energy efficiency improvements in the future. A majority of the respondents were very pleased with the staff, the audits, and the overall program. As these respondents generally indicated that the facility audits were useful and informative, and that they may not have known which projects to implement if they had not participated in the program, the energy savings resulting from these future projects would likely be attributable to the Commercial and Industrial Solutions Program.
7.3.2 C&I Solutions Trade Ally Response As part of the Commercial and Industrial Solutions Program evaluation, the evaluators conducted a survey with participating and non-participating trade allies. Participating trade allies were defined as those commercial contractors who attended a utility energy efficiency program training session and applied for rebates for the energy efficiency improvements. Non-participating trade allies were defined as those attending a utility energy efficiency program training session, but had not applied for any program rebates. ADM conducted surveys with four participating and one non-participating trade ally. The pool of available trade allies to speak with was small, so this five represents an
APSC FILED Time: 3/26/2014 2:23:55 PM: Recvd 3/26/2014 2:04:55 PM: Docket 07-078-TF-Doc. 185

2013 SourceGas DSM Portfolio Final Evaluation Report
C&I Solutions 7-34
aggregation of AOG, SourceGas, and CenterPoint trade allies. The objective of this trade ally survey was to gain insight into their marketing, strategies, and decision making of these respondents, and to identify any participation barriers that may prevent them from successfully.
7.3.2.1 Trade Ally Background Information
The participant trade allies included:
Two boiler contractors
One insulation contractor
One infrared heating systems vendor
The non-participant trade ally was a boiler contractor. The non-participant contractor indicated that in the past year, they had submitted nearly 30 proposals that included program rebates from the C&I Solutions Program or from the commercial boiler rebate programs, but that none of those proposals closed. The number of projects these trade allies pursue annually ranged from three to 100 projects. One respondent even remarked that, “ideally, all projects would go through the program”.
7.3.2.2 Program participation
Respondents were asked if they had noticed any recent trends and if the Commercial and Industrial Solutions program had affected the types of equipment and service choices for customers. Responses included:
“[Picking] higher equipment and materials.” “[I] find the most efficient possible [equipment is chosen to] get the rebate. [There is] more of a tendency to misapply equipment, meaning they are paying for efficiency, but not using it for the most efficient purposes.” “[I see] positive impact to choose more efficient equipment.” “Maybe a little, but maybe a time when it does affect selection [of equipment] to qualify for the program.”
Overall, these trade allies have observed a trend towards customers that are selecting more efficient equipment to install, but perhaps, some customers are not operating the equipment to its full potential.
The trade allies expect to be more active participants in the program next year, and plan to push the program to a further extent. Specifically, they said that they expect to grow through word-of-mouth, and because the program is available, they expect more customers will be taking advantage of the benefits.
Respondents described several barriers to participation in the program. These barriers included upfront costs, the time and effort needed for projects that may not be seen as
APSC FILED Time: 3/26/2014 2:23:55 PM: Recvd 3/26/2014 2:04:55 PM: Docket 07-078-TF-Doc. 185

2013 SourceGas DSM Portfolio Final Evaluation Report
C&I Solutions 7-35
necessary for core business operations, and customers selecting equipment that does not qualify for the program. One trade ally remarked that many of the systems they deal with are “inherently inefficient”. An example given by this trade ally was brewing equipment. From a program standpoint, equipment such as a brewing process would be a viable target, in that it is a large consumer of natural gas. This may warrant some training of program trade allies to pursue projects on processes such as brewing, in that these processes are not subject to efficiency codes and standards (except insomuch as individual components such as a boiler may have a code requirement).
7.3.2.3 Outreach, Marketing, and Customer Awareness
The trade allies were asked several questions about outreach and marketing from the perspective of their company, the utility, and the implementer as well as customer awareness of the program’s existence.
In general, the respondents indicated that customers were generally aware of the existence of the program prior to contacting the trade ally for products or services. In one case, it was brought to the customer’s attention. Respondents were asked if they actively marketed the program to their customers. Three indicated doing so. Specifically, they reached out to their customers through emails and phone calls. One said that the company has a newsletter, which may periodically highlight a project (including comments about the program). They added that the comments were very general, but aimed at trying to pique interest of other customers. In order to reach out to other potential customers, they scheduled outreach times based on a sales database that tracked the life cycle of their equipment.
The trade allies stated that customers find them through CLEAResult representatives and other potential customers were made up of their existing customers (such as customers that have maintenance contracts with a boiler service vendor). One trade ally mentioned that they do not actively find people specifically for participation in the program. Customer awareness seems to be high according to the respondents because they are usually contacted by CLEAResult first and then the customer contacts the trade ally. One respondent did say that they were the ones who brought the customers’ attention to the program.
One question specifically asked if the program helped sell services and products to customers. The response was generally positive:
“Without the opportunity to participate, we wouldn’t be able to make the sale.” “[It] helps offset the increased costs of energy efficient equipment and assists the customer with getting that equipment.” “The incentives help sell the program. The payback is 100%.”
APSC FILED Time: 3/26/2014 2:23:55 PM: Recvd 3/26/2014 2:04:55 PM: Docket 07-078-TF-Doc. 185
2013 SourceGas DSM Portfolio Final Evaluation Report
C&I Solutions 7-36
The general response has been that the C&I Solutions Program is helping the trade allies generate new business.
When asked if the utility could do more to market the C&I Solutions program, the respondents were unsure as to the type of marketing the utility does for the program. Some thought that it was CLEAResult who did a majority of the marketing for the program and were unsure of how customers were being targeted. One respondent said that they had not seen any bill inserts or ads about the program so they were unsure as to what was being done. In general, these trade allies were unsure of the types of marketing the utility and the implementer were focusing on to promote the program. With the extent that these trade allies are used in closing projects through the C&I Solutions Program, they should (where feasible) be kept in the loop on program marketing activities, to ensure that their messaging is consistent with the messaging put out by CLEAResult or the appropriate sponsoring gas utility.
7.3.2.4 Program Process Feedback
The respondents were also asked about feedback on elements of the program process including the application process and incentive amounts. Two respondents replied that the application process did not need any changes as they found it was simple and easy to fill out. One respondent said that notification earlier in the year would be preferred. One respondent complained that it took too long and too much time because the program does not directly benefit the contactor since the customer is the one who receives the rebate.
Most respondents said that incentive amounts were enough, but also reasoned that for it was only enough for specific equipment. Respondents expanded on this element:
“A lot of customers struggle with upfront costs. The prioritization of money [goes towards] mechanical and HVAC [systems].” “For new equipment, it is enough. For the burner retrofit, it isn’t, since it’s the most expensive piece on the boiler. It could be a barrier. A higher rebate is not the determinant because it’s based on code or labor or service [too].”
Respondents seemed to lean positively about the adequacy of incentive levels.
7.3.2.5 Interactions with Staff and Training
Respondents were asked questions about the interactions with utility and CLEAResult staff and asked to give any feedback on program training, if they had attended.
Two respondents had spoken to staff at CenterPoint, two spoke to SourceGas, and one spoke with AOG. They described their interactions as good experiences, acknowledging that they were very good to work with, nice people, and very helpful. Even though the contact was somewhat limited, the trade allies felt it was a good experience. One noted
APSC FILED Time: 3/26/2014 2:23:55 PM: Recvd 3/26/2014 2:04:55 PM: Docket 07-078-TF-Doc. 185

2013 SourceGas DSM Portfolio Final Evaluation Report
C&I Solutions 7-37
that while speaking with CenterPoint program staff, they felt that the staff seemed more intimately involved and more active in promoting and marketing, while other utilities allowed CLEAResult to the take a more active role in these aspects. The respondents’ interaction with the CLEAResult staff has also been very positive. Respondents described the staff as nice, well-intended, and a desire to do well and promote the program. Only two respondents recall any program training, where they specifically had a one-on-one session with a utility staff person to talk about the program. One respondent said that they received a lot of literature that is still used as reference. None of the respondents said that any follow up training was necessary.
7.3.2.6 Additional Program Suggestions
Those respondents that indicated that they were boiler contractors were asked a separate set of questions about boiler tune-up services and interest in an incentive program for tune-up services. Three respondents said that they are regularly involved in tune-up services and that they would be very interested in participating in an incentive program for tune-up work.
7.3.2.7 Overall Program Satisfaction and Feedback
Respondents were asked to rate their satisfaction on a scale of 1-5, with 1 meaning “Very Dissatisfied” and 5 meaning “Very Satisfied” on a range of items related to their program experience. Table 7-11 tabulates the satisfaction results.
Table 7-11 Trade Ally Satisfaction Levels Program Element
Very Dissatisfied
Somewhat Dissatisfied
Neither Dissatisfied or Satisfied
Somewhat Satisfied
Very Satisfied
Don’t Know or N/A
Ease of application process 0 1 0 0 3 0
Incentive Levels 0 1 0 3 0 0 Technical assistance from CLEAResult 0 1 0 3 1 0
Service from utility staff 0 0 1 0 1 3
Range of Measures Covered in Program 0 0 1 1 3 0
Overall, the satisfaction with the program is very high. There were several reasons for dissatisfaction which included a lack of incentives for the contractor, the lack of information regarding rebates, and wanting to know more about how CLEAResult contacted potential customers
7.3.3 Program Development & Outlook The C&I Solutions Program is designed to reach SourceGas’ large C&I customers by identifying and incentivizing custom measure opportunities. In 2012, the evaluators warned that the program warranted more patience in that the types of projects pursued
APSC FILED Time: 3/26/2014 2:23:55 PM: Recvd 3/26/2014 2:04:55 PM: Docket 07-078-TF-Doc. 185

2013 SourceGas DSM Portfolio Final Evaluation Report
C&I Solutions 7-38
by the program have longer development horizons than is typical of most non-residential retrofits. Capital constraints among industrial customers, sensitivity to interfering with key productive systems, and competition for time and funding from electric projects have all provided barriers to participation, which take time to overcome. Efforts put forth in 2012 turned into several projects in 2013, and the amount of savings from the custom component has increased significantly relative to 2012.
7.4 C&I Solutions Impact Evaluation The impact evaluation of the C&I Solutions Program included the following:
Custom Project M&V. The Evaluators conducted project-specific M&V on a census of custom projects completed through the C&I Solutions program. Each project included an M&V plan and a project-specific report. The reports are provided in Appendix A.
Free-Ridership Estimation. A free-ridership rate for DI participants was estimated through participant surveying. Respondents were asked a series of questions related to their past experience with the appropriate measures, whether they had ever installed similar equipment at the participating premise or at other premises within their organization, and whether they knew of the potential savings from the DI measures prior to participating. Given the types of measures covered by the DI component, the free-ridership rate is essentially focused on to what extent participating organizations had policies in place to install such equipment anyway. If such policies were not in place, then the installation of the equipment is generally considered to be program-induced.
Participant Spillover. Spillover was addressed for two customer classes: Participants and Partial Participants. Participants were surveyed for free ridership and process evaluation, and over the course of that survey are asked a series of questions addressing whether the C&I Solutions Program induced them to install other energy efficient equipment without program incentive. Additionally, the Evaluators asked these customers for an estimate of savings that they expect from these measures. This was supplemented with Partial Participant Surveying. Partial Participants are defined as those which received a facility audit and measure recommendations (with associated savings estimates). Samples of these participants were interviewed, and over the course of these interviews were asked if they installed any measures recommended through the program without having signed a Project Application or receiving an incentive.
Partial Participant Spillover. The Evaluators define Partial Participants as those that received a facility audit but did not complete any projects through the C&I Solutions Program. Further, they must be considered “cold leads” by CLEAResult; there are many participants who receive an audit that have not
APSC FILED Time: 3/26/2014 2:23:55 PM: Recvd 3/26/2014 2:04:55 PM: Docket 07-078-TF-Doc. 185

2013 SourceGas DSM Portfolio Final Evaluation Report
C&I Solutions 7-39
installed measures, but are still in regular contact with CLEAResult. Such participants were not contacted for this interview effort in that the Evaluators did not want to interfere with what are considered by implementation staff to be ongoing projects. The “cold leads” interviewed were asked a variety of questions regarding their reason for not following through with any of the recommended measures. Additionally, they were asked if they did in fact install any of the recommended measures from their audit without having participated. If the customer indicated having learned of the measure from their audit, the installation was then credited to the program as spillover
7.4.1.1 Direct Install Energy Savings Calculations
The TRM Version 3.0 includes commercial faucet aerators, low flow showerheads and pre-rinse spray valves, and the evaluation of the C&I Solutions program incorporated these deemed values. They are detailed in the subsections to follow.
Faucet Aerators CLEAResult provided DI faucet aerators to a wide range of facility types. Deemed savings calculations for these aerators were based upon:
Rated flow of installed aerators;
Usage by facility type; and
Water temperature setting by facility type.
Savings are calculated as follows29:
𝐴𝑛𝑛𝑢𝑎𝑙 𝑇ℎ𝑒𝑟𝑚𝑠 = [(𝐹 ∗ 𝑈 ) − (𝐹 ∗ 𝑈 ) ∗ 𝐷𝑎𝑦𝑠 ∗ (𝑇 − 𝑇 ) ∗ 𝐶 ∗ 𝐶 /𝐸𝑓𝑓 ] 𝑃𝑒𝑎𝑘 𝑇ℎ𝑒𝑟𝑚𝑠 = 𝑃 ∗ [(𝐹 ∗ 𝑈 ) − (𝐹 ∗ 𝑈 ) ∗ (𝑇 − 𝑇 ) ∗ 𝐶 ∗ 𝐶 /𝐸𝑓𝑓 ]
The inputs for this equation are defined in Table 7-12.
29 Arkansas TRM V3.0, Volume 2. Pg. 260-263
APSC FILED Time: 3/26/2014 2:23:55 PM: Recvd 3/26/2014 2:04:55 PM: Docket 07-078-TF-Doc. 185

2013 SourceGas DSM Portfolio Final Evaluation Report
C&I Solutions 7-40
Table 7-12 DI Aerator Savings Calculation Parameters Parameter Description Value
FB Baseline Flow Rate (GPM) 2.2 FP Post Flow Rate (GPM) ≤ 1.5
Days
Annual operating days for the facility30 Prison 365 Hospital, Nursing Home 365 Dormitory 274 Multifamily 365 Lodging 365 Commercial 250 School 200
TC Average supply (cold) water temperature (deg F)
Zone 9: 65.6 Zone 8: 66.1 Zone 7: 67.8 Zone 6: 70.1
TH Average mixed hot water temperature (deg F) 105
UB
Baseline water Usage Duration Prison 30 min/day/unit Hospital, Nursing Home 3 min/day/unit Dormitory 30 min/day/unit Multifamily 3 min/day/unit Lodging 3 min/day/unit Commercial 30 min/day/unit School 30 min/day/unit
UP Post Water Usage Duration (assumed) = UB CH Unit Conversion: 8.33 BTU/Gallons/deg F 8.33 CG Unit Conversion: 1 Therm/100,000 BTU 1/100,00 EffG Efficiency of Gas Water Heater .8
P
Hourly Peak Demand as a percent of Daily Demand for the following applications
Prison .04 Hospital, Nursing Home .03 Dormitory .04 Multifamily .03 Lodging .02 Commercial .08 School .05
These values translate into per-faucet savings values by facility type, detailed in Table 7-13 and Table 7-14 for 1.0 and 0.5 GPM aerators, respectively31.
30 For facilities that operate year round: conservatively assume operating days of 360/year;
For schools open weekdays except summer: 360 x (5/7) x (9/12) = 193
For dormitories with few occupants in the summer: 360 x (9/12) = 270
For normal commercial buildings: 360 x (5/7) = 257 31 Table values interpolated based on data in Arkansas TRM V3.0, Volume 2. Pg. 260-263
APSC FILED Time: 3/26/2014 2:23:55 PM: Recvd 3/26/2014 2:04:55 PM: Docket 07-078-TF-Doc. 185

2013 SourceGas DSM Portfolio Final Evaluation Report
C&I Solutions 7-41
Table 7-13 1.0 GPM Commercial Aerator Savings
Facility Type Savings Fayetteville
(Zone 9) Fort Smith
(Zone 8) Little Rock
(Zone 7) El Dorado (Zone 6)
Prison Annual 53.91 53.22 50.90 47.75 Peak .0059 .0058 .0056 .0052
Hospital / Nursing Home
Annual 5.35 5.32 5.09 4.78 Peak .0004 .0004 .0004 .0004
Dormitory Annual 40.47 39.95 38.21 35.85 Peak .0059 .0058 .0056 .0052
Multifamily Annual 5.35 5.32 5.09 4.78 Peak .0004 .0004 .0004 .0004
Lodging Annual 5.35 5.32 5.09 4.78 Peak .0003 .0003 .0003 .0003
Commercial Annual 36.92 3645 34.86 32.71 Peak .0118 .0117 .0112 .0105
School Annual 29.54 29.16 27.89 26.16 Peak .0074 .0073 .0070 .0065
Table 7-14 0.5 GPM Commercial Aerator Savings
Facility Type Savings Fayetteville
(Zone 9) Fort Smith
(Zone 8) Little Rock
(Zone 7) El Dorado (Zone 6)
Prison Annual 76.37 75.40 72.10 67.65 Peak .0084 .0083 .0079 .0074
Hospital / Nursing Home
Annual 7.64 7.54 7.21 6.76 Peak .0006 .0006 .0006 .0006
Dormitory Annual 57.33 56.60 54.13 50.78 Peak .0084 .0083 .0079 .0074
Multifamily Annual 7.64 7.54 7.21 6.76 Peak .0006 .0006 .0006 .0006
Lodging Annual 7.64 7.54 7.21 6.76 Peak .0004 .0004 .0004 .0004
Commercial Annual 52.31 51.64 49.39 46.33 Peak .0167 .0165 .0158 .0148
School Annual 41.85 41.31 39.51 37.07 Peak .0105 .0103 .0099 .0093
Direct Install Pre-Rinse Spray Valves
Low-flow pre-rinse spray valves PRSVs were also direct-installed at a wide range of facility types with food service applications. The savings per unit for these were calculated as follows32:
𝐴𝑛𝑛𝑢𝑎𝑙 𝑇ℎ𝑒𝑟𝑚𝑠 = [(𝐹 ∗ 𝑈 ) − (𝐹 ∗ 𝑈 )] ∗ 𝐷𝑎𝑦𝑠 ∗ (𝑇 − 𝑇 ) ∗ 𝐶 ∗ 𝐶 𝐸𝑓𝑓⁄
𝑃𝑒𝑎𝑘 𝑇ℎ𝑒𝑟𝑚𝑠 = 𝑃 ∗ [(𝐹 ∗ 𝑈 ) − (𝐹 ∗ 𝑈 )] ∗ (𝑇 − 𝑇 ) ∗ 𝐶 ∗ 𝐶 𝐸𝑓𝑓⁄
Table 7-15 presents the definition of these parameters33. 32 Arkansas TRM V3.0, Volume 2. Pg. 367-370
APSC FILED Time: 3/26/2014 2:23:55 PM: Recvd 3/26/2014 2:04:55 PM: Docket 07-078-TF-Doc. 185
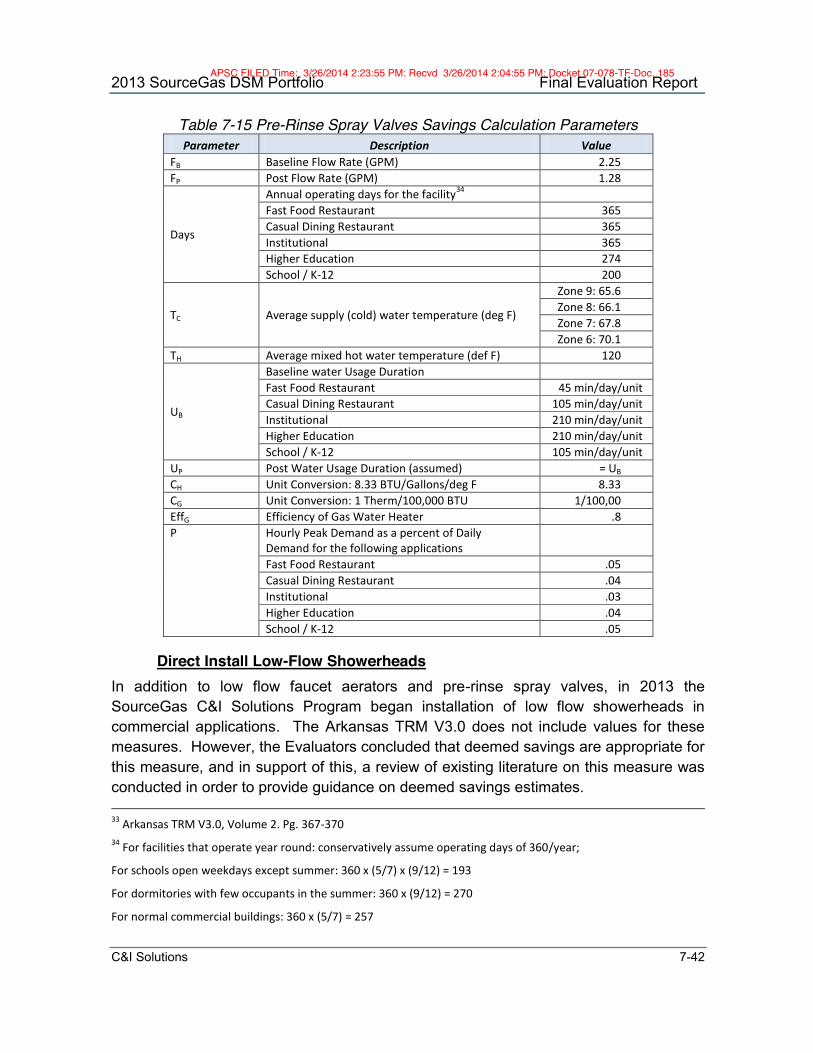
2013 SourceGas DSM Portfolio Final Evaluation Report
C&I Solutions 7-42
Table 7-15 Pre-Rinse Spray Valves Savings Calculation Parameters Parameter Description Value
FB Baseline Flow Rate (GPM) 2.25 FP Post Flow Rate (GPM) 1.28
Days
Annual operating days for the facility34 Fast Food Restaurant 365 Casual Dining Restaurant 365 Institutional 365 Higher Education 274 School / K-12 200
TC Average supply (cold) water temperature (deg F)
Zone 9: 65.6 Zone 8: 66.1 Zone 7: 67.8 Zone 6: 70.1
TH Average mixed hot water temperature (def F) 120
UB
Baseline water Usage Duration Fast Food Restaurant 45 min/day/unit Casual Dining Restaurant 105 min/day/unit Institutional 210 min/day/unit Higher Education 210 min/day/unit School / K-12 105 min/day/unit
UP Post Water Usage Duration (assumed) = UB CH Unit Conversion: 8.33 BTU/Gallons/deg F 8.33 CG Unit Conversion: 1 Therm/100,000 BTU 1/100,00 EffG Efficiency of Gas Water Heater .8 P Hourly Peak Demand as a percent of Daily
Demand for the following applications
Fast Food Restaurant .05 Casual Dining Restaurant .04 Institutional .03 Higher Education .04 School / K-12 .05
Direct Install Low-Flow Showerheads In addition to low flow faucet aerators and pre-rinse spray valves, in 2013 the SourceGas C&I Solutions Program began installation of low flow showerheads in commercial applications. The Arkansas TRM V3.0 does not include values for these measures. However, the Evaluators concluded that deemed savings are appropriate for this measure, and in support of this, a review of existing literature on this measure was conducted in order to provide guidance on deemed savings estimates. 33 Arkansas TRM V3.0, Volume 2. Pg. 367-370 34 For facilities that operate year round: conservatively assume operating days of 360/year;
For schools open weekdays except summer: 360 x (5/7) x (9/12) = 193
For dormitories with few occupants in the summer: 360 x (9/12) = 270
For normal commercial buildings: 360 x (5/7) = 257
APSC FILED Time: 3/26/2014 2:23:55 PM: Recvd 3/26/2014 2:04:55 PM: Docket 07-078-TF-Doc. 185

2013 SourceGas DSM Portfolio Final Evaluation Report
C&I Solutions 7-43
In providing estimates of use for deemed savings parameters, the Evaluators used values from existing deemed documentation for faucet aerators where feasible (such as days of operation and ground water temperature). Values for daily use showerhead were found from the Northwest Regional Technical Forum for the following facility types:
Hospitality
Commercial
Medical
Values for facility types other than these were not readily available. As a result, for 2013 CLEAResult limited their implementation of this measure to the three facility types listed above.
Table 7-16 DI Commercial Showerhead Savings Calculation Parameters Parameter Description Value
FB Baseline Flow Rate (GPM) 2.5 FP Post Flow Rate (GPM) 1.5 or 2.0
Days
Annual operating days for the facility35 Hospital, Nursing Home 365 Lodging 365 Commercial 250
TC Average supply (cold) water temperature (deg F)
Zone 9: 65.6 Zone 8: 66.1 Zone 7: 67.8 Zone 6: 70.1
TH Average mixed hot water temperature (deg F)36 104.3
UB
Baseline water Usage Duration37 Hospital, Nursing Home 6.92 min/day/unit Lodging 9.61 min/day/unit Commercial 7.58 min/day/unit
UP Post Water Usage Duration (assumed) = UB CH Unit Conversion: 8.33 BTU/Gallons/deg F 8.33 CG Unit Conversion: 1 Therm/100,000 BTU 1/100,00 EffG Efficiency of Gas Water Heater .8
P
Hourly Peak Demand as a percent of Daily Demand for the following applications38
Hospital, Nursing Home .03 Lodging .02 Commercial .08
35 Values for days annually taken from AR TRM V3.0 values for faucet aerators 36 Assumed same mixed water temperature as residential showerheads. AR TRM V3.0 Volume 2, Page 104 37 Northwest Regional Technical Forum Commercial Showerhead Savings Workbook V3.0. Updated July 28th, 2013 38 Assumed same peak ratio as commercial faucet aerators
APSC FILED Time: 3/26/2014 2:23:55 PM: Recvd 3/26/2014 2:04:55 PM: Docket 07-078-TF-Doc. 185

2013 SourceGas DSM Portfolio Final Evaluation Report
C&I Solutions 7-44
The resulting unit energy savings for commercial showerheads applied by the Evaluators are summarized in Table 7-17.
Table 7-17 1.5 GPM Commercial Showerhead Savings
Facility Type Savings Fayetteville
(Zone 9) Fort Smith
(Zone 8) Little Rock
(Zone 7) El Dorado (Zone 6)
Hospital / Nursing Home
Annual 10.18 10.05 9.60 8.99 Peak .0008 .0008 .0008 .0007
Lodging Annual 14.13 13.95 13.33 12.49 Peak .0012 .0011 .0011 .0010
Commercial Annual 7.64 7.54 7.20 6.75 Peak .0009 .0009 .0009 .0008
7.4.1.2 Direct-Install Free-Ridership Methodology
The methodology for DI Free-Ridership was focused on the participants’ past experiences with the appropriate equipment and whether they had organizational policies in place to install such equipment. Respondents were asked:
DI-1 Prior to participating in the C&I Solutions Program, had you ever installed any low-flow faucet aerators, showerheads, or pre rinse spray valves at company facilities?
Faucet Aerators
Spray Valves
Low Flow Showerheads
None
Don’t Know
Twenty-nine percent of respondents indicated that at some point in the past they had installed low flow aerators, showerheads or spray valves at their facility.
DI-2 Prior to participating in the C&I Solutions Program, were you aware of the energy savings available from low flow faucet aerators or spray valves?
Faucet Aerators
Spray Valves
Low Flow Showerheads
None
Don’t Know
The respondents that indicated past installation of low flow devices also stated that they were aware of the savings potential from such equipment.
DI-3 If the C&I Solutions program did not provide faucet aerators, how likely would you have been to install this equipment anyway? Would you say… [READ, STOP
APSC FILED Time: 3/26/2014 2:23:55 PM: Recvd 3/26/2014 2:04:55 PM: Docket 07-078-TF-Doc. 185

2013 SourceGas DSM Portfolio Final Evaluation Report
C&I Solutions 7-45
WHEN ANSWER INDICATED] Definitely would have installed Probably would have installed Probably would not have installed Definitely would not have installed Don't know [DON’T READ]
Four percent stated that they “definitely would have installed”, 21.2% stated that they “probably would have installed”. 46.2% indicated that they “probably would not have installed”, and 26.9% stated that they “definitely would not have installed” the low flow equipment. Two percent responded that they “don’t know” if they would have installed low flow devices without the program.
The answers from these questions are then compiled in determining the free-rider score for this measure at this facility. In accordance with TRM guidelines, respondents are scored either as a 0 or a 1 in free-ridership, with this value determined by whether the respondent would have installed the same equipment within one year in the absence of the program. Figure 7-13 summarizes the scoring procedure for Direct Install free-ridership.
Purchased unit before learning of program?
Rebate rated “very important”
Increased efficiency to qualify for program?
NTGR = 0 NTGR = 1
NoYes Yes
NoNo
Yes
Figure 7-13 C&I Solutions Direct Install Free-Ridership Diagram
The NTGR for the DI component was then weighted by the Therms represented by the facility. This resulted in a weighted average NTGR of 93.1% for the direct install component.
7.4.2 Prescriptive Boiler Impact Evaluation To validate savings for the Prescriptive Boiler component, the Evaluators conducted a documentation review of each of the nine rebated boilers to verify inputs. In addition, due to the large amount of expected savings from one of the prescriptive projects (21,570 expected Therms, out of 38,037 overall for this component), one post inspection was conducted.
APSC FILED Time: 3/26/2014 2:23:55 PM: Recvd 3/26/2014 2:04:55 PM: Docket 07-078-TF-Doc. 185

2013 SourceGas DSM Portfolio Final Evaluation Report
C&I Solutions 7-46
Therms savings calculations for commercial boilers require facility type, weather zone, and baseline efficiency. Baseline efficiency for boilers is detailed in Table 7-1839.
Table 7-18 Commercial Boiler Minimum Efficiency Levels
Project Type Size Category Subcategory Minimum Efficiency
Replace-on-Burnout
< 300,000 BTUh Hot Water 82% AFUE Steam 80% AFUE
>300,000 BTUh and < 2,500,000 BTUh
Hot Water 80% Et Steam 79% Et
>2,500,000 BTUh Hot Water 82% Ec
Steam 79% Et
Early Retirement
< 300,000 BTUh Hot Water 80% AFUE
Steam 75% AFUE >300,000 BTUh and <
2,500,000 BTUh Hot Water 75% Et
Steam 75% Et
>2,500,000 BTUh Hot Water 80% Ec
Steam 80% Et
Savings for commercial boilers are calculated as40:
𝑇ℎ𝑒𝑟𝑚𝑠 𝑆𝑎𝑣𝑖𝑛𝑔𝑠 =𝐵𝑇𝑈 𝐶𝑎𝑝𝑎𝑐𝑖𝑡𝑦 ∗ 𝐸𝐹𝐿𝐻 ∗ 1
𝐸𝑓𝑓𝑖𝑐 − 1𝐸𝑓𝑓𝑖𝑐
100,000 𝑇ℎ𝑒𝑟𝑚𝑠/𝐵𝑇𝑈
The EFLH for a facility is a function of facility type and weather zone. The EFLH values from TRM V3.0 are summarized in Table 7-19.
Table 7-19 Commercial EFLH Values Building Type Zone 6 Zone 7 Zone 8 Zone 9
College/University 630 874 936 902 Fast Food Restaurant 288 440 474 455 Full Menu Restaurant 181 328 370 336 Grocery Store 688 935 995 965 Health Clinic 646 885 922 895 Lodging 389 587 635 605 Large Office (>30k Ft2) 811 1,014 1,054 1,036 Small Office (<30k Ft2) 353 538 568 538 Retail 780 1,041 1,131 1,099 School 774 1,026 1,089 1,064 Generic 24/7 630 1,156 1,303 1,237
For example, if a Grocery Store in Fayetteville (Zone 9) installed a 800,000 BTU 96% efficient steam boiler that was a replacement on burnout, The resulting Therms savings are calculated as: 39 Arkansas TRM V3.0, Volume 2. Pg. 151-158 40 Ibid
APSC FILED Time: 3/26/2014 2:23:55 PM: Recvd 3/26/2014 2:04:55 PM: Docket 07-078-TF-Doc. 185
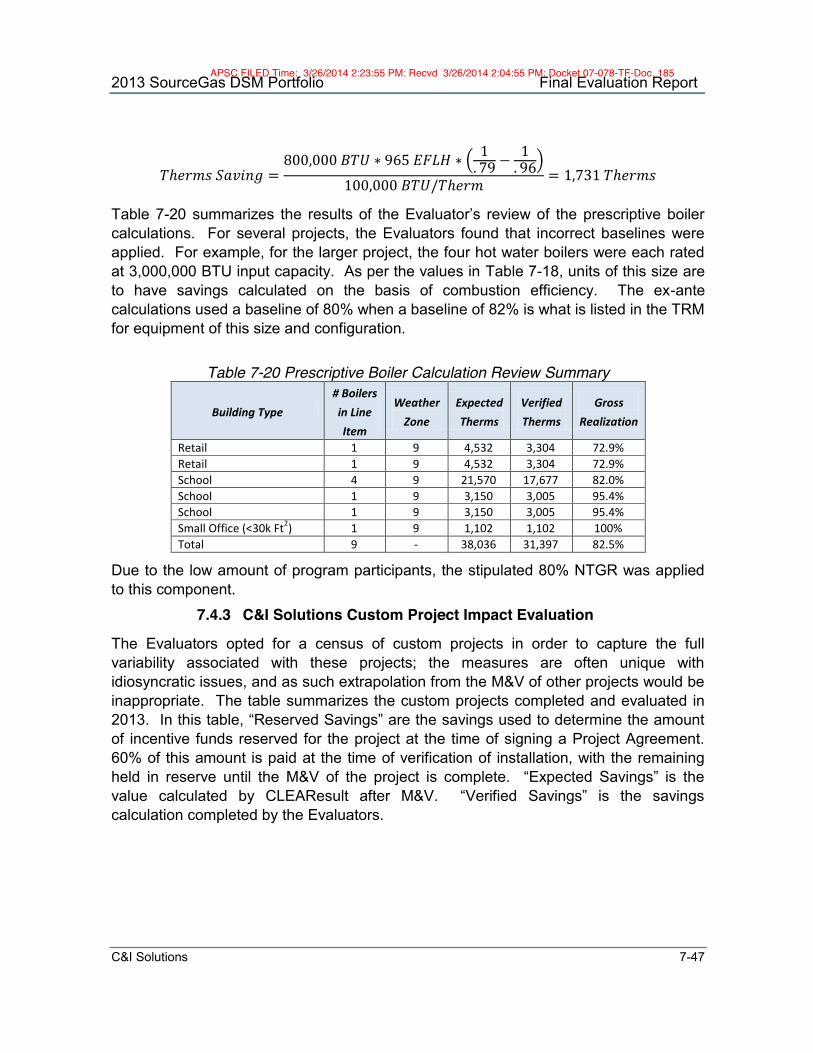
2013 SourceGas DSM Portfolio Final Evaluation Report
C&I Solutions 7-47
𝑇ℎ𝑒𝑟𝑚𝑠 𝑆𝑎𝑣𝑖𝑛𝑔 =800,000 𝐵𝑇𝑈 ∗ 965 𝐸𝐹𝐿𝐻 ∗ 1
. 79 −1. 96
100,000 𝐵𝑇𝑈/𝑇ℎ𝑒𝑟𝑚 = 1,731 𝑇ℎ𝑒𝑟𝑚𝑠
Table 7-20 summarizes the results of the Evaluator’s review of the prescriptive boiler calculations. For several projects, the Evaluators found that incorrect baselines were applied. For example, for the larger project, the four hot water boilers were each rated at 3,000,000 BTU input capacity. As per the values in Table 7-18, units of this size are to have savings calculated on the basis of combustion efficiency. The ex-ante calculations used a baseline of 80% when a baseline of 82% is what is listed in the TRM for equipment of this size and configuration.
Table 7-20 Prescriptive Boiler Calculation Review Summary
Building Type # Boilers in Line Item
Weather Zone
Expected Therms
Verified Therms
Gross Realization
Retail 1 9 4,532 3,304 72.9% Retail 1 9 4,532 3,304 72.9% School 4 9 21,570 17,677 82.0% School 1 9 3,150 3,005 95.4% School 1 9 3,150 3,005 95.4% Small Office (<30k Ft2) 1 9 1,102 1,102 100% Total 9 - 38,036 31,397 82.5%
Due to the low amount of program participants, the stipulated 80% NTGR was applied to this component.
7.4.3 C&I Solutions Custom Project Impact Evaluation
The Evaluators opted for a census of custom projects in order to capture the full variability associated with these projects; the measures are often unique with idiosyncratic issues, and as such extrapolation from the M&V of other projects would be inappropriate. The table summarizes the custom projects completed and evaluated in 2013. In this table, “Reserved Savings” are the savings used to determine the amount of incentive funds reserved for the project at the time of signing a Project Agreement. 60% of this amount is paid at the time of verification of installation, with the remaining held in reserve until the M&V of the project is complete. “Expected Savings” is the value calculated by CLEAResult after M&V. “Verified Savings” is the savings calculation completed by the Evaluators.
APSC FILED Time: 3/26/2014 2:23:55 PM: Recvd 3/26/2014 2:04:55 PM: Docket 07-078-TF-Doc. 185
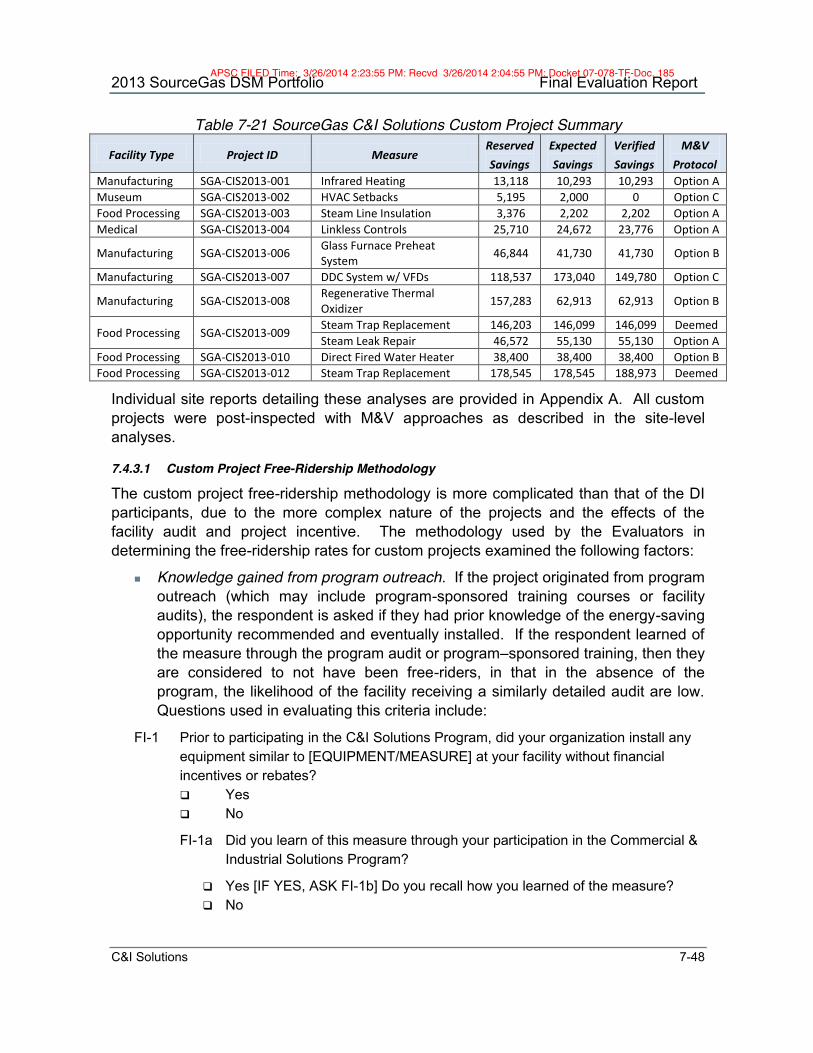
2013 SourceGas DSM Portfolio Final Evaluation Report
C&I Solutions 7-48
Table 7-21 SourceGas C&I Solutions Custom Project Summary
Facility Type Project ID Measure Reserved Savings
Expected Savings
Verified Savings
M&V Protocol
Manufacturing SGA-CIS2013-001 Infrared Heating 13,118 10,293 10,293 Option A Museum SGA-CIS2013-002 HVAC Setbacks 5,195 2,000 0 Option C Food Processing SGA-CIS2013-003 Steam Line Insulation 3,376 2,202 2,202 Option A Medical SGA-CIS2013-004 Linkless Controls 25,710 24,672 23,776 Option A
Manufacturing SGA-CIS2013-006 Glass Furnace Preheat System 46,844 41,730 41,730 Option B
Manufacturing SGA-CIS2013-007 DDC System w/ VFDs 118,537 173,040 149,780 Option C
Manufacturing SGA-CIS2013-008 Regenerative Thermal Oxidizer 157,283 62,913 62,913 Option B
Food Processing SGA-CIS2013-009 Steam Trap Replacement 146,203 146,099 146,099 Deemed Steam Leak Repair 46,572 55,130 55,130 Option A
Food Processing SGA-CIS2013-010 Direct Fired Water Heater 38,400 38,400 38,400 Option B Food Processing SGA-CIS2013-012 Steam Trap Replacement 178,545 178,545 188,973 Deemed
Individual site reports detailing these analyses are provided in Appendix A. All custom projects were post-inspected with M&V approaches as described in the site-level analyses.
7.4.3.1 Custom Project Free-Ridership Methodology
The custom project free-ridership methodology is more complicated than that of the DI participants, due to the more complex nature of the projects and the effects of the facility audit and project incentive. The methodology used by the Evaluators in determining the free-ridership rates for custom projects examined the following factors:
Knowledge gained from program outreach. If the project originated from program outreach (which may include program-sponsored training courses or facility audits), the respondent is asked if they had prior knowledge of the energy-saving opportunity recommended and eventually installed. If the respondent learned of the measure through the program audit or program–sponsored training, then they are considered to not have been free-riders, in that in the absence of the program, the likelihood of the facility receiving a similarly detailed audit are low. Questions used in evaluating this criteria include:
FI-1 Prior to participating in the C&I Solutions Program, did your organization install any equipment similar to [EQUIPMENT/MEASURE] at your facility without financial incentives or rebates? Yes No
FI-1a Did you learn of this measure through your participation in the Commercial & Industrial Solutions Program?
Yes [IF YES, ASK FI-1b] Do you recall how you learned of the measure? No
APSC FILED Time: 3/26/2014 2:23:55 PM: Recvd 3/26/2014 2:04:55 PM: Docket 07-078-TF-Doc. 185

2013 SourceGas DSM Portfolio Final Evaluation Report
C&I Solutions 7-49
Prior plans for a similar measure. This component is examined in instances where the respondent knew of the measure prior to receiving and technical assistance through the C&I Solutions Program. Respondents are asked a series of questions related to whether they had plans for installing this equipment prior to having learned of the available financial incentives from the C&I Solutions program. Questions used in this component include:
FI-1 Prior to participating in the C&I Solutions Program, did your organization install any equipment similar to [EQUIPMENT/MEASURE] at your facility without financial incentives or rebates? Yes No
FI-2 Did you have plans to install the [EQUIPMENT/MEASURE] that was upgrades through C&I Solutions before participating in the program? Yes No If Yes: FI-2a Would you have gone ahead with this planned installation without the program rebates? Yes No
FI-2b Would this installation have included the same equipment without the program rebates? Yes No
Analysis of measure payback. Respondents are asked to indicate what their require payback period is for energy efficiency improvements. This value is compared against the measure payback with and without the program incentive. If the financial incentive brings the project from over the threshold to under the threshold, then the project is considered to have been sufficiently influenced by the program incentive. This includes the following questions:
DM-5 Does your organization require a specific payback period in order to implement energy efficiency improvements?
Yes [ASK DM-5A] No [SKIP TO DM-6] Don't know [DON’T READ]
DM-5a What payback length of time do you normally require in order to consider an energy investment cost effective? Years
Don't know
APSC FILED Time: 3/26/2014 2:23:55 PM: Recvd 3/26/2014 2:04:55 PM: Docket 07-078-TF-Doc. 185

2013 SourceGas DSM Portfolio Final Evaluation Report
C&I Solutions 7-50
The stated payback requirement by the respondent is then compared against the payback of the recommended project with and without the program incentive.
Modification of the project. Respondents are asked a series of questions addressing whether they modified the project as a result of their program participation. This includes changes in equipment quantity and/or efficiency level (where appropriate for the measure) and a change in project timing. Questions used to analyze this component include:
FI-5 If the C&I Solutions Program were not available, would you have installed the… Same quantity of energy efficient equipment, A lower quantity, or No energy efficient equipment at all?
[IF FI-5 = “Lower Quantity”]: FI-5a: By percentage, how much lower?
FI-6 If the C&I Solutions program were not available, would you have installed … The same equipment with the same efficiency level, The same equipment with a lower energy efficiency level, but still above minimum code, or standard efficiency equipment?
[IF FI-6 = “Lower efficiency level, but still above minimum code”]: FI-6a: By percentage, how much lower?
FI-7 Did the C&I Solutions rebate allow you to install [EQUIPMENT/MESURE] sooner than you otherwise would have? Yes Ð IF YES: FI-7a When would you otherwise have installed the equipment? (READ IF NEEDED) In less than 6 months later In 6-12 months later In 1-2 years later In 3-5 years later In more than 5 years later No, did not affect timing of purchase and installation
These results are then applied in the manner displayed in the following figure.
APSC FILED Time: 3/26/2014 2:23:55 PM: Recvd 3/26/2014 2:04:55 PM: Docket 07-078-TF-Doc. 185

2013 SourceGas DSM Portfolio Final Evaluation Report
C&I Solutions 7-51
Did respondent learn of measure from
program technical assistance?
Did incentive move project below payback
threshold?
Was project planned before applying for
program?
Was installation in progress when respondent
learned of program?
NTGR = 1
Moved up timeline at least one year?
Changed efficiency and/or quantity?
Project Modification Series:
Efficiency/Quantity changed affect savings by >50%? NTGR = 0
No
No
No
No
NoYes
Yes
Yes
Yes
Yes
No or unknown
Yes
YesNo
Figure 7-14 C&I Solutions Custom Project Free-Ridership Diagram
The resulting NTGRs by project are presented in Table 7-22.
Table 7-22 SourceGas C&I Solutions Custom Project Free-Ridership Results
Facility Type Project ID Measure Gross
Savings Net-to-
Gross Ratio Manufacturing SGA-CIS2013-001 Infrared Heating 10,293 100% Museum SGA-CIS2013-002 HVAC Setbacks 0 100% Food Processing SGA-CIS2013-003 Steam Line Insulation 2,202 100% Medical SGA-CIS2013-004 Linkless Controls 23,776 100% Manufacturing SGA-CIS2013-006 Glass Furnace Preheat System 41,730 100% Manufacturing SGA-CIS2013-007 DDC System w/ VFDs 149,780 100% Manufacturing SGA-CIS2013-008 Regenerative Thermal Oxidizer 62,913 100%
Food Processing SGA-CIS2013-009 Steam Trap Replacement 146,099 100% Steam Leak Repair 55,130 100%
Food Processing SGA-CIS2013-010 Direct Fired Water Heater 38,400 100% Food Processing SGA-CIS2013-012 Steam Trap Replacement 188,973 100%
Overall Gross Savings: 719,296 100% Overall Net Savings: 719,296 100%
Given the small number of participants, the free-rider assessments were a series of case studies as opposed to an extrapolated survey. The individual free-rider assessments are contained within the survey narrative responses detailed in Section 7.3.3.
APSC FILED Time: 3/26/2014 2:23:55 PM: Recvd 3/26/2014 2:04:55 PM: Docket 07-078-TF-Doc. 185

2013 SourceGas DSM Portfolio Final Evaluation Report
C&I Solutions 7-52
7.4.3.2 Participant Spillover
Participant spillover is defined as savings from program participants that was not incentivized by the SourceGas programs. During participant surveying, both DI and Custom participants are asked questions addressing whether their participation had led to the installation of equipment that was not rebated by SourceGas. The estimated savings from these projects are tallied and added to the program savings as Participant Spillover.
OS-3 Has your organization’s participation in the C&I Solutions Program led you to buy any energy efficient equipment for which you did not apply for a financial incentive? Yes
Ð If Yes: OS-3a What type of equipment? ___________________________________
No
Don’t know [DON’T READ]
The Evaluators did not identify any participant spillover.
7.4.3.3 Partial-Participant Spillover
Partial-participant spillover are savings resulting from projects that were recommended to recipients of audits through the C&I Solutions program that were completed without filing for program incentives. Respondents are asked:
Have you since implemented any of the recommendations from your facility audit?
a. If Yes: Why didn’t you install these measures through the available incentive program?
It is then clarified as to whether the respondent installed the project as specified in the audit or made modifications to the project. This is combined in providing an estimate of non-incentivized savings, which constitutes the Partial Participant Spillover.
One project was identified as having been driven by the audit and then installed by the customer without an incentive. One interviewed industrial customer installed insulation recommended in the audit. They indicated that the project was small enough that they did not want to bother with the project application and review process. On this basis, the C&I Solutions Program was credited with 1,392 Therms of partial-participant spillover.
7.4.3.4 Overall Program NTGR
The overall program NTGR for the C&I Solutions Program is defined as:
𝑃𝑟𝑜𝑔𝑟𝑎𝑚 𝑁𝑇𝐺𝑅 = 𝑁𝑒𝑡 𝐷𝐼 𝑆𝑎𝑣𝑖𝑛𝑔𝑠 + 𝑁𝑒𝑡 𝐶𝑢𝑠𝑡𝑜𝑚 𝑆𝑎𝑠𝑣𝑖𝑛𝑔𝑠 + 𝑃𝑎𝑟𝑡𝑖𝑐𝑝𝑎𝑛𝑡 𝑆𝑝𝑖𝑙𝑙𝑜𝑣𝑒𝑟 + 𝑃𝑎𝑟𝑡𝑖𝑎𝑙𝑃𝑎𝑟𝑡𝑖𝑐𝑖𝑝𝑎𝑛𝑡 𝑆𝑝𝑖𝑙𝑙𝑜𝑣𝑒𝑟𝐺𝑟𝑜𝑠𝑠 𝐷𝐼 𝑆𝑎𝑣𝑖𝑛𝑔𝑠 + 𝐺𝑟𝑜𝑠𝑠 𝐶𝑢𝑠𝑡𝑜𝑚 𝑆𝑎𝑣𝑖𝑛𝑔𝑠
APSC FILED Time: 3/26/2014 2:23:55 PM: Recvd 3/26/2014 2:04:55 PM: Docket 07-078-TF-Doc. 185

2013 SourceGas DSM Portfolio Final Evaluation Report
C&I Solutions 7-53
Based on this, the C&I Solutions Program NTGR is 97.9%.
7.5 Verified Savings
Table 7-23 presents the gross savings results of the evaluation of the 2013 C&I Solutions Program. Total Gross Savings summarizes the savings calculations performed by TRM protocols for direct install measures as well as the project-specific M&V of custom measures.
Table 7-23 C&I Solutions Verified Therms Savings
Measure Category
Measure Expected Therms Savings
Verified Therms Savings
EUL Lifetime Therms Savings
Peak Therms
Direct Install
Faucet Aerators 148,747 148,683 10 1,486,827 585.8 Pre Rinse Spray Valves 33,792 33,792 5 168,962 96.9 Showerheads 42,845 41,354 10 413,537 2.3
Prescriptive Boilers 38,036 31,397 20 627,940 596.5 Custom Varies 735,545 719,296 Varies 6,878,567 4,868.8
Total Gross Savings 998,965 974,522 - 9,575,833 6,150.3
Net savings for the C&I Solutions Program were calculated using survey data of direct install and custom participants. The resulting net savings are presented in Table 7-24.
Table 7-24 C&I Solutions Net Savings Summary
Measure Category Free-Ridership Rate Net Annual Savings Net
Realization Rate
Net Lifetime Therms Savings
Net Peak Therms Ex Ante Ex Post Ex Ante Ex Post
Direct Install 1.63% 6.90% 221,710 208,385 94.0% 1,384,236 637.7 Prescriptive 20% 20% 30,429 25,118 82.5% 502,352 477.2 Custom 0% 0% 735,024 714,493 97.9% 6,878,567 4,868.9 Spillover 0% 0% 0 1,392 NA 27,840 3.8 Overall: 98.82% 97.90% 987,163 954,191 96.7% 8,792,995 5,987.6
7.6 Conclusions & Recommendations
7.6.1 Conclusions The Evaluators have found that:
1. Satisfaction with the program operation is very high. All but two direct-install respondents indicated high satisfaction with the program. For custom projects, all interview respondents indicated high satisfaction.
2. The trade ally network is growing. In 2013, the C&I Solutions Program saw the first round of heavy trade ally participation. All projects installed through C&I Solutions in 2013 were done through program trade allies that have attended CLEAResult training sessions. Several of these trade allies have been
APSC FILED Time: 3/26/2014 2:23:55 PM: Recvd 3/26/2014 2:04:55 PM: Docket 07-078-TF-Doc. 185

2013 SourceGas DSM Portfolio Final Evaluation Report
C&I Solutions 7-54
responsible for multiple projects. There are still some underserved measures, but the network of trade allies has significantly expanded and improved relative to past program years.
3. Tracking for the C&I Solutions program has been markedly improved. The 2012 evaluation included multiple recommendations for improvements to tracking data, including the addition of project IDs, points of contact, and enforcement of consistency in measure names. All tracking data recommendations have been successfully adopted.
4. The addition of steam traps has provided significant program savings. CLEAResult began heavily marketing steam trap replacement in 2013, and this has resulted in a significant amount of Therms savings across all three Arkansas natural gas utilities. For SourceGas, steam trap replacement constituted over 30% of the custom component savings for C&I Solutions.
7.6.2 Recommendations The Evaluators’ recommendations for the C&I Solutions Program are as follows:
1. Expand the types of case studies. There are case studies in place for multiple measure categories across the three Arkansas natural gas utilities. Due to the low volume of projects for some measures, obtaining case studies is often problematic. However, CLEAResult should research viable case studies for infrared heating and combustion air preheating measures. Further, CLEAResult should replace their current linkless controls case study, as the project used is the lowest-performing example of this measure, with an atypically long payback period.
2. Develop co-branded marketing collateral for top-performing trade allies. A small number of trade allies are responsible for the majority of projects across the three Arkansas gas utilities. SourceGas should consider developing co-branded marketing materials for trade allies that have turned in consistent, reliable projects in order to enhance their marketing of the program.
3. Keep trade allies apprised of larger utility marketing efforts. Program trade allies indicated being largely unaware of what CLEAResult and SourceGas do to market the C&I Solutions Program, and as a result their marketing message could potentially conflict with that of SourceGas or CLEAResult. Program staff should endeavor to keep active program trade allies apprised of new marketing efforts (including message type and targeted sector) so that they can better-coordinate their business development activities.
4. Consider bonus incentives for multiple measure installations. CLEAResult audit reports often make multiple recommendations for energy efficiency
APSC FILED Time: 3/26/2014 2:23:55 PM: Recvd 3/26/2014 2:04:55 PM: Docket 07-078-TF-Doc. 185

2013 SourceGas DSM Portfolio Final Evaluation Report
C&I Solutions 7-55
improvements at participating customers’ facilities. Typically, participants that are interested in multiple measures will prioritize them and perform one at a time. SourceGas should consider an approach where participants can obtain an extra incentive for simultaneous installation of multiple recommended measures. The program’s cost per Therm is among the lowest in the SourceGas portfolio and as such this cost could be absorbed while remaining within cost-effectiveness expectations.
5. Use incremental cost in audit recommendations that encompass replacement of failed or failing equipment. Audit report recommendations use full measure cost in both addressing measure payback and establishing a cap for the program incentive. If a project is using a normal replacement baseline, it is more appropriate to apply incremental cost. This would provide a more realistic assessment of the return on investment for the energy efficient option (since the customer has to purchase something) and would set the maximum possible rebate to an appropriate level.
The issues and recommendations are summarized in Table 7-25.
APSC FILED Time: 3/26/2014 2:23:55 PM: Recvd 3/26/2014 2:04:55 PM: Docket 07-078-TF-Doc. 185
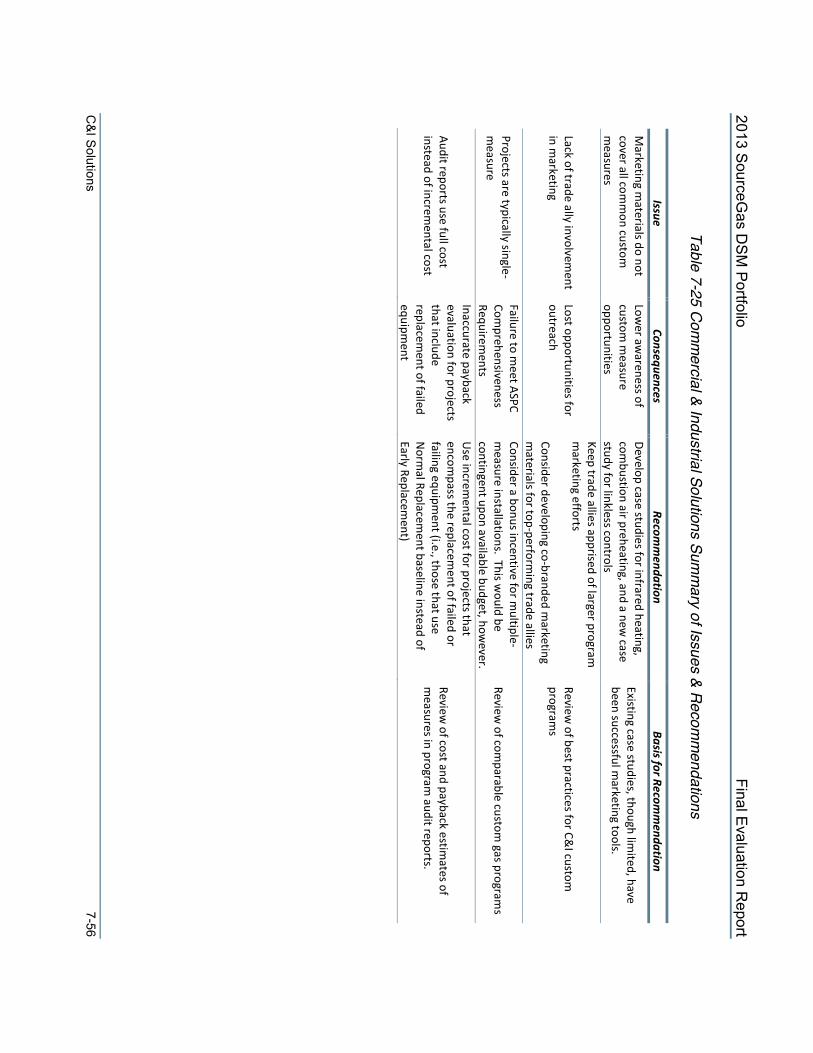
2013 SourceG
as DS
M P
ortfolio Final E
valuation Report
C&I Solutions
7-56
Table 7-25 Comm
ercial & Industrial Solutions Summ
ary of Issues & Recomm
endations
Issue
Consequences Recom
mendation
Basis for Recomm
endation M
arketing materials do not
cover all comm
on custom
measures
Lower aw
areness of custom
measure
opportunities
Develop case studies for infrared heating, com
bustion air preheating, and a new case
study for linkless controls
Existing case studies, though limited, have
been successful marketing tools.
Lack of trade ally involvement
in marketing
Lost opportunities for outreach
Keep trade allies apprised of larger program
marketing efforts
Consider developing co-branded marketing
materials for top-perform
ing trade allies
Review of best practices for C&
I custom
programs
Projects are typically single-m
easure
Failure to meet ASPC
Comprehensiveness
Requirements
Consider a bonus incentive for multiple-
measure installations. This w
ould be contingent upon available budget, how
ever. Review
of comparable custom
gas programs
Audit reports use full cost instead of increm
ental cost
Inaccurate payback evaluation for projects that include replacem
ent of failed equipm
ent
Use increm
ental cost for projects that encom
pass the replacement of failed or
failing equipment (i.e., those that use
Norm
al Replacement baseline instead of
Early Replacement)
Review of cost and payback estim
ates of m
easures in program audit reports.
APSC FILED
Time: 3/26/2014 2:23:55 PM
: Recvd 3/26/2014 2:04:55 PM
: Docket 07-078-TF-D
oc. 185
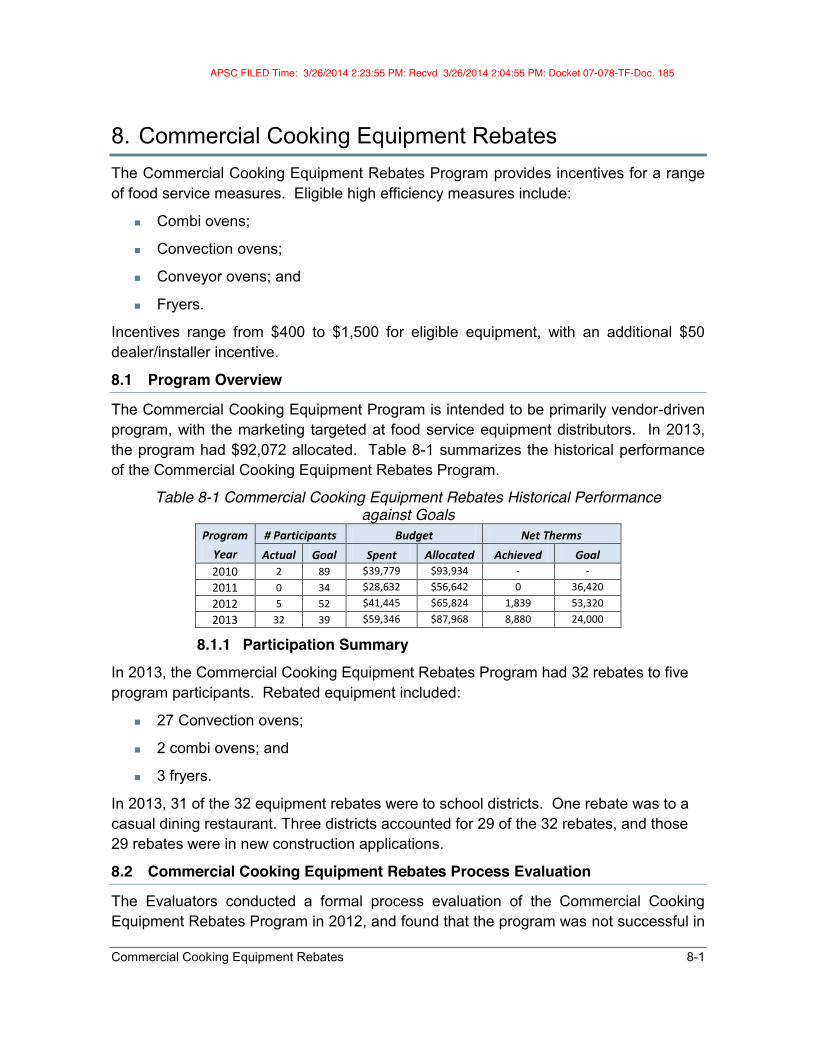
Commercial Cooking Equipment Rebates 8-1
8. Commercial Cooking Equipment Rebates The Commercial Cooking Equipment Rebates Program provides incentives for a range of food service measures. Eligible high efficiency measures include:
Combi ovens;
Convection ovens;
Conveyor ovens; and
Fryers.
Incentives range from $400 to $1,500 for eligible equipment, with an additional $50 dealer/installer incentive.
8.1 Program Overview
The Commercial Cooking Equipment Program is intended to be primarily vendor-driven program, with the marketing targeted at food service equipment distributors. In 2013, the program had $92,072 allocated. Table 8-1 summarizes the historical performance of the Commercial Cooking Equipment Rebates Program.
Table 8-1 Commercial Cooking Equipment Rebates Historical Performance against Goals
Program Year
# Participants Budget Net Therms Actual Goal Spent Allocated Achieved Goal
2010 2 89 $39,779 $93,934 - - 2011 0 34 $28,632 $56,642 0 36,420 2012 5 52 $41,445 $65,824 1,839 53,320 2013 32 39 $59,346 $87,968 8,880 24,000
8.1.1 Participation Summary In 2013, the Commercial Cooking Equipment Rebates Program had 32 rebates to five program participants. Rebated equipment included:
27 Convection ovens;
2 combi ovens; and
3 fryers.
In 2013, 31 of the 32 equipment rebates were to school districts. One rebate was to a casual dining restaurant. Three districts accounted for 29 of the 32 rebates, and those 29 rebates were in new construction applications.
8.2 Commercial Cooking Equipment Rebates Process Evaluation
The Evaluators conducted a formal process evaluation of the Commercial Cooking Equipment Rebates Program in 2012, and found that the program was not successful in
APSC FILED Time: 3/26/2014 2:23:55 PM: Recvd 3/26/2014 2:04:55 PM: Docket 07-078-TF-Doc. 185

2013 SourceGas DSM Portfolio Final Evaluation Report
Commercial Cooking Equipment Rebates 8-2
meeting participation, savings, and satisfaction goals. Table 8-2 and Table 8-3 summarize the Evaluators’ review of the Commercial Cooking Equipment Rebates Program in comparison to TRM V3.0 Protocol C for timing and conditions of conducting a process evaluation.
Table 8-2 Determining Appropriate Timing to Conduct a Process Evaluation Component Determination
New and Innovative Components
No. The program is designed in a manner consistent with similar programs elsewhere and applies deemed savings values from the TRM.
No Previous Process Evaluation No. The program received a comprehensive process evaluation in 2012.
New Vendor or Contractor Partial. The program was moved from internal implementation to being implemented by CLEAResult in November 2012.
Table 8-3 Determining Appropriate Conditions to Conduct a Process Evaluation Component Determination
Are program impacts lower or slower than expected?
Yes. To-date, the program has fallen short of participant and savings goals each year.
Are the educational or informational goals not meeting program goals?
Mixed. The program has engaged some trade allies, but this progress has not been enough to service program goals
Are the participation rates lower or slower than expected?
Participant and savings goals were revised downward in 2013. That being said, the program still fell short of the newly revised goals.
Are the program’s operational or management structure slow to get up and running or not meeting program administrative needs?
No. The 2012 process evaluation found that operational and management structure to be up to speed and efficient in administering the program.
Is the program’s cost-effectiveness less than expected?
Yes. Due to lower participation and savings levels, the program’s cost-effectiveness has suffered as well.
Do participants report problems with the programs or low rates of satisfaction?
No. Participant surveys have found high satisfaction levels.
Is the program producing the intended market effects? No. The program has not yet engaged the restaurant sector.
.
8.2.1 Data Collection Activities The process evaluation of the Commercial Cooking Equipment Rebates Program included the following data collection activities:
Program Actor In-Depth Interviews. The Evaluators conducted in-depth interviews program implementation staff. These interviews covered a range of topics, including marketing efforts, feedback on program delivery, an assessment of barriers to program implementation and success, and recommendations for program improvement. Program Actors interviewed include:
APSC FILED Time: 3/26/2014 2:23:55 PM: Recvd 3/26/2014 2:04:55 PM: Docket 07-078-TF-Doc. 185

2013 SourceGas DSM Portfolio Final Evaluation Report
Commercial Cooking Equipment Rebates 8-3
- SourceGas Program Staff. The Evaluators interviewed staff at SourceGas involved in the administration of the program. These interviews built upon interviews conducted during the 2012 Process Evaluation, in which the Evaluators collected initial background information on program history and implementation. These interviews captured any operational changes on SourceGas’ side, as well as informing the Evaluators as to any new developments in the program.
- CLEAResult Program Staff. The Evaluators conducted interviews with CLEAResult staff to obtain a preliminary assessment of their intended approach to implementing the program.
Program Marketing Materials Review. The Evaluators collected marketing materials used by the Commercial Cooking Equipment Rebates Program. This included customer mailers, audit reports, and a review of the SourceGas program website. This was compared against marketing materials from successful programs run in other territories in informing marketing improvements.
Participant Surveys. The Evaluators conducted surveys with three school districts that were responsible for 29 of the 32 program rebates.
Table 8-4 summarizes the data collection for this process evaluation effort. This includes the titles, role, sample sizes, timeframe of data collection.
Table 8-4 Commercial Cooking Equipment Rebates Data Collection Summary Target Component Activity N Role
SourceGas Program Staff
Manager – Energy Efficiency Programs Interview 1
Overall administration of SGA DSM programs. This manager is involved in the larger strategic decisions associated with the DSM portfolio, and is involved with the Commercial Cooking Equipment Rebates Program in the overall coordination of utility resources.
CLEAResult Program Staff
Energy Engineer Interview 1
The Energy Engineer oversees technical aspects of the program, including review of equipment offerings and savings calculations. The Energy Engineer also engages in outreach to commercial customers.
Program Coordinator Interview 1
The program coordinator handles day-to-day administration, including scheduling of quality control inspections, application review, and marketing and outreach.
Participant Interviews
Program Participants Interview 3
The Evaluators interviewed three participants that were responsible for 29 of the 32 program rebates.
Marketing & Outreach Marketing Materials Literature
Review -
The full scope of paper and electronic marketing materials used in implementation for the Commercial Cooking Equipment Rebates Program was reviewed by the Evaluators.
APSC FILED Time: 3/26/2014 2:23:55 PM: Recvd 3/26/2014 2:04:55 PM: Docket 07-078-TF-Doc. 185

2013 SourceGas DSM Portfolio Final Evaluation Report
Commercial Cooking Equipment Rebates 8-4
8.2.2 Process Results & Findings
This section will present the results and key findings from the data collection activities. These findings are based upon interviews with utility staff, implementation staff, surveys with participants, and a thorough and in-depth literature review.
8.2.2.1 Response to Program Recommendations
Table 8-5 summarizes the status of issues and recommendations identified in the 2012 process evaluation.
APSC FILED Time: 3/26/2014 2:23:55 PM: Recvd 3/26/2014 2:04:55 PM: Docket 07-078-TF-Doc. 185

2013 SourceG
as DS
M P
ortfolio Final E
valuation Report
Com
mercial C
ooking Equipm
ent Rebates Program
8-5
Table 8-5 Comm
ercial Cooking Equipment Response to 2012 Recom
mendations
Issue Consequences
Recomm
endation SourceG
as/CLEAResult Response
Status of Issue
Program does not fully
utilize ENERGY SAR®
branding
Lack of national brand support and lost opportunity to tie program
into EPA m
arketing
Incorporate ENERGY STAR® logo into program
m
arketing materials
This was not included in
program m
arketing efforts
Recomm
endation review
ed &
rejected
Program does not cover
full list of FSTC-approved m
easures
Lost opportunities for savings
Incorporate steam cookers, griddles, and
dishwashers into the program
This is being considered for program
expansion in the next cycle.
Recomm
endation under
consideration Program
misses
opportunities for behavioral change savings
Lost opportunities for savings
Provide existing EPA materials on O
&M
of equipm
ent along with program
marketing
materials
This was not included in
program m
arketing efforts
Recomm
endation review
ed &
rejected Lack of participation from
corporate chain restaurants
Large segment not served
by the program
Increased outreach to this sector. Program
staff did not engage in targeted m
arketing for this sector in 20133.
Issue persists
Program savings goals do
not correspond to participant goals
Inconsistent measurem
ent of program
performance,
increased difficulty in planning and forecasting
Either reduce the savings goal to be in line with the
participant goal, or increase the participant goal and budget to be in line w
ith the savings goal
Program participant and savings
goals have been adjusted to an appropriate level
Issue corrected
Program does not
advertise water &
sewer
bill savings associated with
high efficiency options
Lost marketing
opportunity U
ndersold program
benefits
Add estimates of annual w
ater cost savings for com
bi ovens. Add sim
ilar metrics for steam
cookers and dishw
ashers if they are incorporated into the program
Across all of their programs,
marketing m
aterials have begun including w
ater and sewer
savings.
Recomm
endation adopted
Incentives do not always
align with m
easure increm
ental costs and/or savings
Lower uptake of higher-
cost measures
Develop tiered incentive structure, increasing incentives for > 28 pan com
bi ovens and double sized rack ovens. Develop sim
ilar guidelines for steam cookers and
dishwashers if they are added to the program
, with
higher incentives for steam cookers w
ith 5 or more
pans and tank conveyor dishwashers
The program increased
incentives for all rack ovens and com
bi ovens, and decreased the incentives for fryers and convection ovens.
Issue partially-addressed.
APSC FILED
Time: 3/26/2014 2:23:55 PM
: Recvd 3/26/2014 2:04:55 PM
: Docket 07-078-TF-D
oc. 185

2013 SourceGas DSM Portfolio Final Evaluation Report
Commercial Cooking Equipment Rebates Program 8-6
8.2.3 Participant Interview Response The Evaluators interviewed three participating school districts to support the process evaluation of the Commercial Cooking Equipment Rebates Program. These three school districts were responsible for 29 of the 32 rebates processed in 2013, including:
26 convection ovens; and
3 fryers.
Respondents were asked to identify the causes of their participation and provide feedback on this process. The district representatives indicated that they were motivated to participate by the need to purchase equipment in their new construction projects. All 29 rebates by these participating districts were in new construction projects at four different schools.
The district representatives characterized their interactions with SourceGas and CLEAResult staff as positive, and they had participated in multiple SourceGas programs. Each of the three districts interviewed had received rebates for furnaces, water heaters, and boilers, as well as direct-install measures from C&I Solutions in addition to their participation in the Commercial Cooking Equipment Rebates Program.
The district representatives presented a mixed picture in terms of who they rely upon for information on energy efficient equipment. Two of the three indicated that they reply primarily on information from equipment vendors that submit bids for their projects. The other school district indicated that they do not rely on information from vendors at all in those decisions, and that they attempt to self-install new equipment with in-house staff where possible.
The vendors used for the installation of the equipment at the participating districts were all based in the Little Rock metro area. In interviews with program staff, the Evaluators found that the staff that operates CenterPoint’s Commercial Food Service CIP provided referrals and facilitated contact between their established trade ally network and SourceGas program staff. This has assisted in providing experienced vendors to service the SourceGas program.
When asked to rate their satisfaction with the program, the school district representatives were highly positive. They characterized the experience as a helpful one, and stated that they intend to participate in SourceGas programs wherever feasible as they replace equipment or build new schools. One of the school districts had since agreed to allow their project to be used as a program case study.
APSC FILED Time: 3/26/2014 2:23:55 PM: Recvd 3/26/2014 2:04:55 PM: Docket 07-078-TF-Doc. 185

2013 SourceGas DSM Portfolio Final Evaluation Report
Commercial Cooking Equipment Rebates 8-7
Figure 8-1 SourceGas Prescriptive Commercial Case Study
APSC FILED Time: 3/26/2014 2:23:55 PM: Recvd 3/26/2014 2:04:55 PM: Docket 07-078-TF-Doc. 185
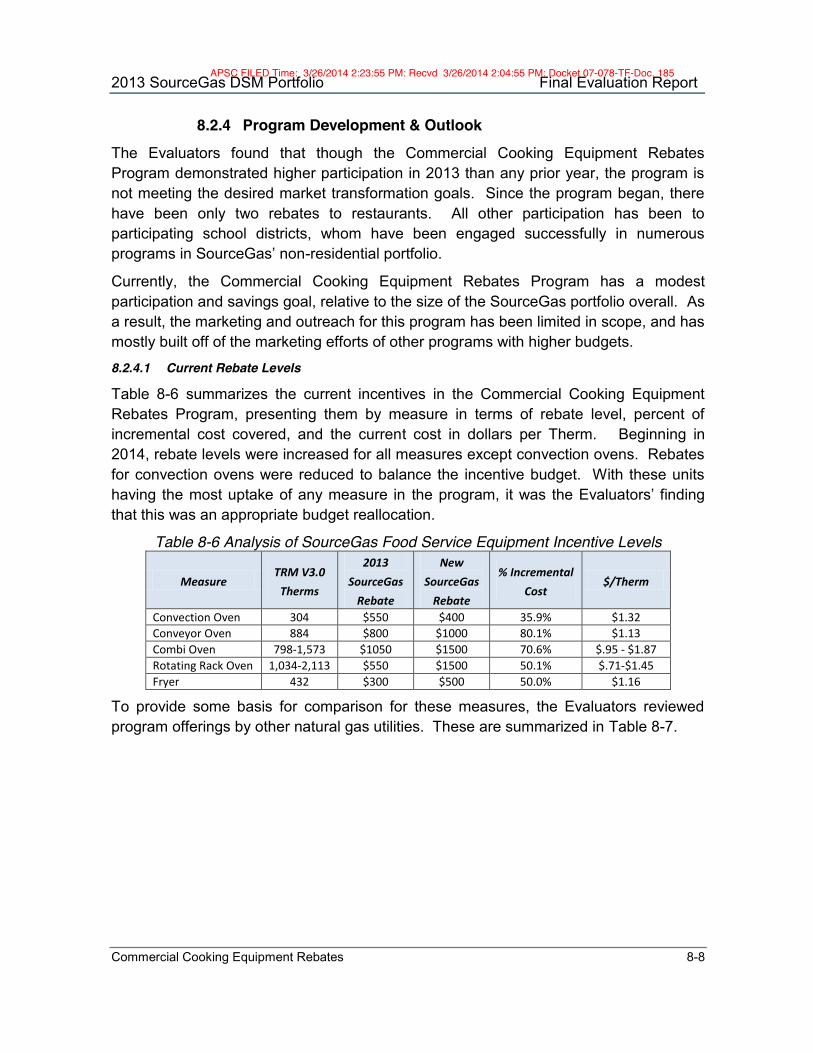
2013 SourceGas DSM Portfolio Final Evaluation Report
Commercial Cooking Equipment Rebates 8-8
8.2.4 Program Development & Outlook The Evaluators found that though the Commercial Cooking Equipment Rebates Program demonstrated higher participation in 2013 than any prior year, the program is not meeting the desired market transformation goals. Since the program began, there have been only two rebates to restaurants. All other participation has been to participating school districts, whom have been engaged successfully in numerous programs in SourceGas’ non-residential portfolio.
Currently, the Commercial Cooking Equipment Rebates Program has a modest participation and savings goal, relative to the size of the SourceGas portfolio overall. As a result, the marketing and outreach for this program has been limited in scope, and has mostly built off of the marketing efforts of other programs with higher budgets.
8.2.4.1 Current Rebate Levels
Table 8-6 summarizes the current incentives in the Commercial Cooking Equipment Rebates Program, presenting them by measure in terms of rebate level, percent of incremental cost covered, and the current cost in dollars per Therm. Beginning in 2014, rebate levels were increased for all measures except convection ovens. Rebates for convection ovens were reduced to balance the incentive budget. With these units having the most uptake of any measure in the program, it was the Evaluators’ finding that this was an appropriate budget reallocation.
Table 8-6 Analysis of SourceGas Food Service Equipment Incentive Levels
Measure TRM V3.0
Therms
2013 SourceGas
Rebate
New SourceGas
Rebate
% Incremental Cost
$/Therm
Convection Oven 304 $550 $400 35.9% $1.32 Conveyor Oven 884 $800 $1000 80.1% $1.13 Combi Oven 798-1,573 $1050 $1500 70.6% $.95 - $1.87 Rotating Rack Oven 1,034-2,113 $550 $1500 50.1% $.71-$1.45 Fryer 432 $300 $500 50.0% $1.16
To provide some basis for comparison for these measures, the Evaluators reviewed program offerings by other natural gas utilities. These are summarized in Table 8-7.
APSC FILED Time: 3/26/2014 2:23:55 PM: Recvd 3/26/2014 2:04:55 PM: Docket 07-078-TF-Doc. 185
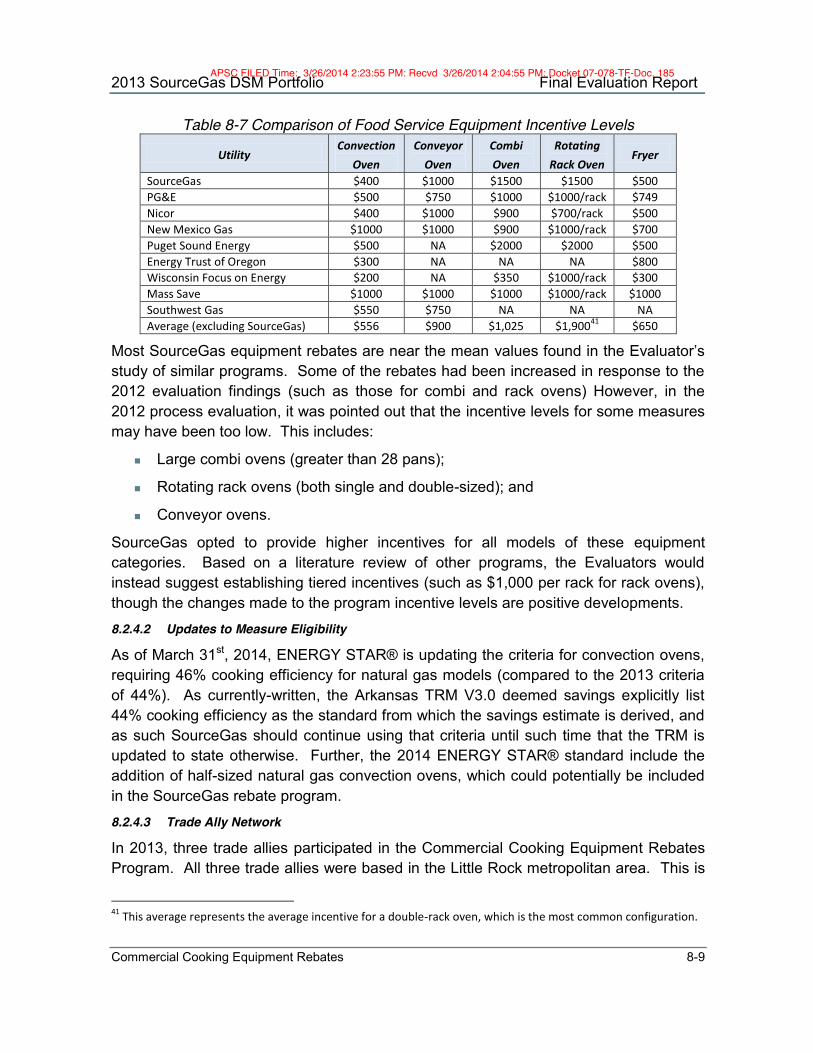
2013 SourceGas DSM Portfolio Final Evaluation Report
Commercial Cooking Equipment Rebates 8-9
Table 8-7 Comparison of Food Service Equipment Incentive Levels
Utility Convection
Oven Conveyor
Oven Combi Oven
Rotating Rack Oven
Fryer
SourceGas $400 $1000 $1500 $1500 $500 PG&E $500 $750 $1000 $1000/rack $749 Nicor $400 $1000 $900 $700/rack $500 New Mexico Gas $1000 $1000 $900 $1000/rack $700 Puget Sound Energy $500 NA $2000 $2000 $500 Energy Trust of Oregon $300 NA NA NA $800 Wisconsin Focus on Energy $200 NA $350 $1000/rack $300 Mass Save $1000 $1000 $1000 $1000/rack $1000 Southwest Gas $550 $750 NA NA NA Average (excluding SourceGas) $556 $900 $1,025 $1,90041 $650
Most SourceGas equipment rebates are near the mean values found in the Evaluator’s study of similar programs. Some of the rebates had been increased in response to the 2012 evaluation findings (such as those for combi and rack ovens) However, in the 2012 process evaluation, it was pointed out that the incentive levels for some measures may have been too low. This includes:
Large combi ovens (greater than 28 pans);
Rotating rack ovens (both single and double-sized); and
Conveyor ovens.
SourceGas opted to provide higher incentives for all models of these equipment categories. Based on a literature review of other programs, the Evaluators would instead suggest establishing tiered incentives (such as $1,000 per rack for rack ovens), though the changes made to the program incentive levels are positive developments.
8.2.4.2 Updates to Measure Eligibility
As of March 31st, 2014, ENERGY STAR® is updating the criteria for convection ovens, requiring 46% cooking efficiency for natural gas models (compared to the 2013 criteria of 44%). As currently-written, the Arkansas TRM V3.0 deemed savings explicitly list 44% cooking efficiency as the standard from which the savings estimate is derived, and as such SourceGas should continue using that criteria until such time that the TRM is updated to state otherwise. Further, the 2014 ENERGY STAR® standard include the addition of half-sized natural gas convection ovens, which could potentially be included in the SourceGas rebate program.
8.2.4.3 Trade Ally Network
In 2013, three trade allies participated in the Commercial Cooking Equipment Rebates Program. All three trade allies were based in the Little Rock metropolitan area. This is
41 This average represents the average incentive for a double-rack oven, which is the most common configuration.
APSC FILED Time: 3/26/2014 2:23:55 PM: Recvd 3/26/2014 2:04:55 PM: Docket 07-078-TF-Doc. 185

2013 SourceGas DSM Portfolio Final Evaluation Report
Commercial Cooking Equipment Rebates 8-10
to some degree expected, as more vendors are concentrated in that portion of the state. However, there are vendors in Northwest and Northeast Arkansas that could be engaged in the program. SourceGas staff has indicated that in early 2014, they began seeing activity from one local vendor in Springdale, and outreach to these vendors should continue. The Evaluators conducted research of active food service equipment vendors and found several that sell the types of equipment rebated in the Commercial Cooking Equipment Rebates program. The success of the program is reliant upon the local market being engaged in the sale of high efficiency equipment; with all active trade allies being based in the Little Rock metro, food service end-users in SourceGas territory may not be reached by the program unless they put their procurement out to bid. This corresponds with the 2013 participating pool in being almost entirely driven by public school districts.
8.3 Commercial Cooking Equipment Rebates Program Impact Evaluation
Due to the limited participation, the impact evaluation was constrained to:
1. Documentation review to ensure savings were calculated according to TRM V3.0 protocols; and
2. Application of the stipulated 80% NTGR.
8.3.1 Verified Savings Table 8-8 presents the gross savings results of the evaluation of the 2013 Commercial Cooking Equipment Rebates Program. Total Gross Savings summarizes the savings calculations performed by TRM protocols for each measure category.
Table 8-8 Commercial Cooking Equipment Rebates Program Verified Therms Savings
Measure Category Expected Therms Savings
Verified Therms Savings
Gross Realization
Rate EUL
Lifetime Therms Savings
Peak Therms
Convection Oven 8,208 8,208 100% 12 98,496 4.4 Combi Oven 1,596 1,596 100% 12 19,152 22.5 Fryer 1,296 1,296 100% 12 15,552 3.5 Total Gross Savings 11,100 11,100 100% - 133,200 30.4
Net savings for the Commercial Cooking Equipment Rebates Program were calculated using deemed protocols and the stipulated 80% NTGR. The resulting net savings are presented in Table 8-9
Table 8-9 Commercial Cooking Equipment Rebates Net Savings Summary Free-Ridership Rate Net Annual Savings Net
Realization Rate
Net Lifetime Therms Savings
Net Peak Therms Ex Ante Ex Post Ex Ante Ex Post
20% 20% 8,880 8,880 100% 106,560 24.3
APSC FILED Time: 3/26/2014 2:23:55 PM: Recvd 3/26/2014 2:04:55 PM: Docket 07-078-TF-Doc. 185

2013 SourceGas DSM Portfolio Final Evaluation Report
Commercial Cooking Equipment Rebates 8-11
8.4 Conclusions & Recommendations 8.4.1 Conclusions
Based on the Evaluator’s review of the Commercial Cooking Equipment Rebates the Evaluators have concluded the following:
1. The program does not have local participating trade allies. All participating trade allies are based in the Little Rock metro area and are referrals from the CenterPoint Commercial Food Service CIP. The program has not engaged any vendors based in SourceGas territory.
2. The program participant goals are not in line with savings goals. The participant goals and savings goals are set such that each unit would have to save roughly 1,300 Therms, exceeding the deemed savings for TRM V3.0 food service measures. Either savings or participant goals need to be adjusted to align with the expected savings from TRM V3.0 values.
8.4.2 Recommendations 1. Add FSTC-approved measures from TRM V3.0 to the program. The TRM
V3.0 includes dishwashers, griddles, and steam cookers. These measures have been tested by the FSTC and can provide reliable savings. Further, for steam cookers in particular, interest in the equipment has been expressed by both participants and vendors.
2. Keep 44% efficient convection ovens in the program until instructed otherwise by a TRM update. The current deemed savings values for convection ovens in the Arkansas TRM V3.0 are based off of 44% cooking efficiency. ENERGY STAR® V2.1 will increase the minimum qualifying efficiency to 46%, effective March 31st, 2014. Until such time that the Arkansas TRM mandates a higher minimum efficiency, SourceGas should continue to incentivize 44% efficient convection ovens.
3. Work towards the addition of half sized gas convection ovens into the Arkansas TRM. The new ENERGY STAR® guidelines include for the first time a standard for half-sized natural gas convection ovens. As these models are tested by the FSTC, they should be allowed into the Arkansas TRM and into SourceGas’ Commercial Cooking Equipment Rebates Program.
4. Established tiered incentives for combi and rack ovens. The Evaluators reviewed the incentives offered by measure category in terms of percent of incremental cost and cost per Therm. Combi ovens greater than 28 pans and double rack ovens both have markedly high incremental costs and savings, and having the incentive to increase for units this size would be appropriate. If SourceGas were to add steam cookers and dishwashers to the program, tiered incentives would be applicable for these equipment categories as well.
APSC FILED Time: 3/26/2014 2:23:55 PM: Recvd 3/26/2014 2:04:55 PM: Docket 07-078-TF-Doc. 185
2013 SourceGas DSM Portfolio Final Evaluation Report
Commercial Cooking Equipment Rebates 8-12
5. Focus on enrollment of trade allies based in SourceGas territory. The participating trade allies are all based in the Little Rock metro area, and as a result a fair amount of the SourceGas market is not participating in the program. The Evaluators found multiple vendors in northwest and northeast Arkansas that sell qualifying equipment, and reaching these vendors should be a top priority for 2014.
These issues and recommendations are summarized in Table 8-10.
APSC FILED Time: 3/26/2014 2:23:55 PM: Recvd 3/26/2014 2:04:55 PM: Docket 07-078-TF-Doc. 185

2013 SourceG
as DS
M P
ortfolio Final E
valuation Report
Com
mercial C
ooking Equipm
ent Rebates
8-13
Table 8-10 Summ
ary of Recomm
endations for Comm
ercial Cooking Equipment Rebates Program
Issue
Consequences Recom
mendation
Basis for Recomm
endation
Program does not fully utilize
ENERGY SAR® branding
Lack of national brand support and lost opportunity to tie program
into EPA m
arketing
Incorporate ENERGY STAR® logo into
program m
arketing materials
Program best-practices as set out
by the EE Best Practices Self-Benchm
arking Tool
Program does not cover full list
of FSTC-approved measures
Lost opportunities for savings
Incorporate steam cookers, griddles, and
dishwashers into the program
Review
of program offerings by
PG&E, SCE, &
SoCal Gas
Program m
isses opportunities for behavioral change savings
Lost opportunities for savings
Provide existing EPA materials on O
&M
of equipm
ent along with program
marketing
materials
Process evaluation of FSTC education offerings
Lack of participation from
corporate chain restaurants Large segm
ent not served by the program
Allow third-party rebate sign-over and
engage in outreach to rebate consultancies to inform
them of the program
change
Review of client listings and prior
interviews of rebate consultancies
discussing their participation process in DSM
programs
Program savings goals do not
correspond to participant goals
Inconsistent measurem
ent of program
performance,
increased difficulty in planning and forecasting
Either reduce the savings goal to be in line w
ith the participant goal, or increase the participant goal and budget to be in line w
ith the savings goal
Calculation of per-unit savings by TRM
V3.0 guidelines Com
parison of TRM V1.0 to V3.0
per-unit savings
Program does not advertise
water &
sewer bill savings
associated with high efficiency
options
Lost marketing
opportunity U
ndersold program
benefits
Add estimates of annual w
ater cost savings for com
bi ovens. Add sim
ilar metrics for steam
cookers and dishw
ashers if they are incorporated into the program
ENERGY STAR® CFS Program
Best Practices guidelines
Incentives do not always align
with m
easure incremental costs
and/or savings
Lower uptake of higher-
cost measures
Develop tiered incentive structure, increasing incentives for > 28 pan com
bi ovens and double sized rack ovens. Develop sim
ilar guidelines for steam
cookers and dishwashers if they are added
to the program, w
ith higher incentives for steam
cookers with 5 or m
ore pans and tank conveyor dishw
ashers
Calculation of $/Therm of current
incentive structure against TRM
V3.0 savings guidelines Secondary research of m
easure increm
ental cost estimates
APSC FILED
Time: 3/26/2014 2:23:55 PM
: Recvd 3/26/2014 2:04:55 PM
: Docket 07-078-TF-D
oc. 185

Home Energy Reports 9-1
9. Home Energy Reports The Home Energy Reports Program is an educational program run by Opower, a third party implementer for SourceGas. The program provides educational materials to a sample of SourceGas’ residential customers, in which their usage is compared against similar households. The program is designed to encourage behavioral change and program participation on the part of the recipients of the Home Energy Report.
9.1 Program Overview
The Home Energy Reports Program has $190,115 in budget allocated for 2013. Table 9-1 summarizes the Home Energy Reports historical performance against goals.
Table 9-1 Home Energy Reports Program Historical Performance against Goals Program
Year # Participants Budget Net Therms
Actual Goal Spent Allocated Achieved Goal 2011 25,000 25,000 $131,840 $135,587 22,430 70,390 2012 25,000 25,000 $190,885 $187,585 254,48 262,350 2013 25,000 25,000 $194,940 $190,115 438,534 307,140
9.2 Participation Summary
The Home Energy Reports Program began in October 2011. The program is designed to generate quantifiable behavioral savings that cannot be feasibly attained through standard DSM efforts. The program implementer, Opower, asserts that their program differs from standard energy conservation marketing efforts in that it provides unique reports to each customer, comparing their gas bills against those of similar-sized homes in their neighborhood. The comparison against their neighbors is intended to have a jarring effect; when informed that their usage is above average, the program theory would assert that they are then driven to engage in conservation behaviors. In 2013, there was a population of 25,221 report recipients.
9.3 Home Energy Reports Process Evaluation
At the time of EM&V plan development, the Evaluators were informed by SourceGas that the Home Energy Reports Program would be cancelled beginning with the 2014 program year. As a result, it was decided at the time of EM&V plan development to omit process evaluation activities.
SourceGas program staff indicated multiple reasons for program cancellation. In 2012, the program failed cost-effectiveness testing, with a TRC score less than 1.00. Further, SourceGas indicated that they faced difficulties in communicating with Opower due to several changes in the program manager role. This corresponds with the experience of the Evaluators in that it was observed that management responsibilities for the SourceGas Home Energy Reports Program changed hands three times since program
APSC FILED Time: 3/26/2014 2:23:55 PM: Recvd 3/26/2014 2:04:55 PM: Docket 07-078-TF-Doc. 185
2013 SourceGas DSM Portfolio Final Evaluation Report
Home Energy Reports 9-2
inception in 2011. It was the experience of the Evaluators that data requests were not filled in a timely manner, and that neither the Evaluators nor the SourceGas program staff were kept apprised of changes in managerial assignment at Opower until either had contacted Opower for information.
Based on these two factors, SourceGas staff have indicated a preference for programs that produce retrofits, and have reassigned budget in their portfolio towards the new Home Energy Savings Program to encourage residential weatherization improvements as a replacement to the Home Energy Reports Program.
9.4 Home Energy Reports Impact Evaluation
The impact evaluation effort of the Home Energy Reports Program included the following:
Validity Testing of Comparison Group. The Evaluators conducted statistical significance testing of the recipient and control group for observations prior to the delivery of the first reports. This was done to ensure that the control group provided a valid basis for comparison.
Billing Regression Analysis with Experimental Design. The Evaluators conducted billing analysis of the recipient and non-recipient group, encompassing a period of one year before receiving their first Home Energy Report and through December 2012. This methodology is analytically rigorous and has the advantage of inherently accounting for free-ridership and spillover; the results of the difference-in-difference estimate between the two groups provides a net savings estimate.
Double-Counting Correction. After totaling the savings derived through billing-analysis, the Evaluators cross-checked the recipient and non-recipient populations against SourceGas’ overall participant pool. The Double Counted Savings was calculated as the difference Other Program Savings of the Recipient Group minus that of the Non-Recipient Group. This ensures that savings for the SourceGas DSM portfolio are not double-counted.
9.4.1 Control Group Validity Testing The Evaluators tested the two waves of the Home Energy Reports program independently to ensure validity of the comparison. Tests were performed on monthly consumption for the pre-delivery period. Table 9-2 summarizes the statistical validity testing.
APSC FILED Time: 3/26/2014 2:23:55 PM: Recvd 3/26/2014 2:04:55 PM: Docket 07-078-TF-Doc. 185

2013 SourceGas DSM Portfolio Final Evaluation Report
Home Energy Reports 9-3
Table 9-2 Control Group Statistical Validity Testing
Observation Recipient Group
Consumption Control Group Consumption Difference PR > T
Mean SE Mean SE January 2010 241.30 .5436 241.27 .6153 .0366 .964 February 2010 192.71 .4253 192.14 .4769 .5617 .381 March 2010 156.39 .3681 156.53 .4158 -.1298 .815 April 2010 81.69 .2417 81.51 .1645 .182 .599 May 2010 34.76 .1784 34.56 .1887 .2043 .431 June 2010 20.68 .1280 20.61 .1497 .0724 .713 July 2010 18.42 .1063 18.35 .141 .0725 .657 August 2010 15.24 .0855 15.15 .0961 .0963 .454 September 2010 18.20 .1249 18.17 .1481 .0308 .873 October 2010 23.42 .1338 23.44 .1467 -.0128 .949 November 2010 54.26 .1795 53.91 .2017 .3491 .196 December 2010 137.99 .3862 137.26 .4349 .7391 .208 January 2011 215.85 .4520 215.74 .5109 .122 .856 February 2011 198.60 .4196 198.52 .4730 -.4559 .471 March 2011 115.15 .2689 115.57 .3016 -.4164 .303 April 2011 86.68 .2172 86.74 .2428 -.0534 .870 May 2011 47.24 .1652 47.20 .1922 .0434 .864 June 2011 25.94 .1516 26.09 .1884 -.1483 .540 July 2011 18.21 .1078 18.02 .1146 .1944 .217 August 2011 14.21 .0806 14.10 .0918 .1108 .365 September 2011 19.59 .1340 19.44 .1440 .1588 .419 October 2011 24.76 .1414 24.55 .1499 .2189 .288 November 2011 60.26 .2146 59.83 .2336 .4381 .167
From these tests, the Evaluators confirmed that the two groups are statistically valid for comparison. No observations had P-values lower than .05, and as such the comparisons are valid at the 95% confidence level.
9.4.2 Savings Calculation Methodologies Savings from the Home Energy Reports program are calculated as a “Difference-in-Difference”, defined as:
𝑆𝑎𝑣𝑖𝑛𝑔𝑠 = 𝑇ℎ𝑒𝑟𝑚𝑠 − 𝑇ℎ𝑒𝑟𝑚𝑠 − 𝑇ℎ𝑒𝑟𝑚𝑠 − 𝑇ℎ𝑒𝑟𝑚𝑠
Through this, the differences after delivery of the reports are calculated for the participant and non-participant groups, capturing the impact of naturally occurring changes in consumption of those that do not receive the report. The baseline and post Therms values are estimated through regression modeling, with the basic model defined as:
𝑇ℎ𝑒𝑟𝑚𝑠/𝐷𝑎𝑦 =∝ + 𝛼 𝑃𝑜𝑠𝑡 + 𝛼 𝑇𝑟𝑒𝑎𝑡𝑚𝑒𝑛𝑡 + 𝛼 𝑇𝑟𝑒𝑎𝑡𝑚𝑒𝑛𝑡 ∗ 𝑃𝑜𝑠𝑡 + 𝛽 𝐻𝐷𝐷+ 𝛽 𝑇𝑟𝑒𝑎𝑡𝑚𝑒𝑛𝑡 ∗ 𝐻𝐷𝐷 + 𝛽 𝑃𝑜𝑠𝑡 ∗ 𝐻𝐷𝐷 + 𝛽 𝑃𝑜𝑠𝑡 ∗ 𝑇𝑟𝑒𝑎𝑡𝑚𝑒𝑛𝑡 ∗ 𝐻𝐷𝐷
APSC FILED Time: 3/26/2014 2:23:55 PM: Recvd 3/26/2014 2:04:55 PM: Docket 07-078-TF-Doc. 185

2013 SourceGas DSM Portfolio Final Evaluation Report
Home Energy Reports 9-4
In this model, the savings associated with the program are calculated using the following variables:
α3Treatment*Post, β3Post*Treatment*HDD
9.4.3 Home Energy Report Peak Savings To estimate peak Therms, the Evaluators split savings into two categories:
Weather Sensitive; and
Non-Weather Sensitive
From this used the ratio of peak to annual Therms for residential furnaces and water heaters for weather-sensitive and non-weather sensitive (respectively) from the TRM V3.0. These multipliers are defined in Table 9-3.
Table 9-3 Home Energy Reports Peak-to-Annual Multipliers Savings Type Zone 6 Zone 7 Zone 8 Zone 9
Weather- Sensitive42 .015 .016 .015 .019 Non-Weather-Sensitive43 .0024 .0024 .0024 .0024
9.4.4 Home Energy Report Net Savings The HER program uses a randomized control trial, comparing recipients to non-recipients. As a result, the savings estimates from the model are net savings estimates, and no further deduction of free-ridership is taken.
9.5 Model Output Results
Error! Reference source not found. provides the model coefficients for the regression of customer billing data in the analysis of the Home Energy Reports program. As stated prior, parameters that include Treatment are used in estimating savings.
Table 9-4 Home Energy Reports Model Coefficients
Parameter Definition Estimate Standard
Error T-Value
Intercept Constant .2174874 .0039952 54.44 Post Observation occurs after November 2011 .001491 .0028712 .52 Post_Treatment Post * Treatment -.0013768 .0037853 -.36 HDD Heating Degree Days, using 65 degree base .2024947 .0005353 378.3 Treatment_HDD Treatment * HDD -.0000724 .000715 -.10 Post_HDD Post * HDD -.006964 .0002939 -23.69 Post_Treatment_HDD Post * Treatment * HDD -.0037867 .0003946 -9.60
R-Square: .8028
42 Multipliers from Arkansas TRM V3.0 Volume 2, Page 29. Table 14: Gas Furnace Peak Heating Ratio 43 Multipliers from Arkansas TRM V3.0 Volume 2, Page 88. Equation 39: Peak Day Therm Savings – Gas Tankless
Water Heater Replacement
APSC FILED Time: 3/26/2014 2:23:55 PM: Recvd 3/26/2014 2:04:55 PM: Docket 07-078-TF-Doc. 185

2013 SourceGas DSM Portfolio Final Evaluation Report
Home Energy Reports 9-5
These values were applied to all months 2013 months. The resulting calculations are presented in Table 9-5.
Table 9-5 Home Energy Reports Savings Summary
Month
HDD Monthly Weather-Sensitive Savings
Monthly Non-Weather Sensitive Savings
Zone 6 Zone 7 Zone 8 Zone 9
Total Recipients 0 262 7,050 17,909 January 612 670 698 837 76,061 1,076 February 511 567 596 747 67,132 972 March 450 511 501 676 59,725 1,076 April 232 229 250 372 32,129 1,042 May 90 73 92 173 14,261 1,076 June 2 2 4 24 1,736 1,042 July 4 0 1 10 705 1,076 August 4 1 1 9 638 1,076 September 16 10 12 44 3,314 1,042 October 160 154 180 294 24,896 1,076 November 496 487 492 623 55,867 1,042 December 682 720 835 979 89,398 1,076 Total: 3259 3424 3662 4788 425,862 12,672
Annual Therms 438,534 Peak Therms 9,291.18
The 95% confidence interval for this savings estimate is +/- 77,647 Therms.
Savings are significantly higher in 2013 than 2012. The Evaluators attribute this to two factors:
1) Opower has indicated that it is not uncommon for the effects of the reports to increase over the first several years of implementation; and
2) 2013 had a significantly colder winter than observed in 2012; there were over 30% more HDD in 2013 than observed in 2012.
9.5.1 Double Counting Analysis In TRM V2.0, Protocol J specified double-counting as the difference in savings for all recipients versus all control group members. In the 2012, the Evaluators found that this specification overlooked issues of having a larger recipient group than control group. Based on these findings, Protocol J was updated in the Arkansas TRM V3.0 to detail a per-customer methodology that accounts for programs where the recipient and non-recipient group have different sizes.
If a program has more recipients than non-recipients in the analysis, then taking the straight sum of savings from other-program-participation would dramatically inflate the double-counting effect. The Evaluators addressed this with IEM staff and they concurred that is more appropriate to evaluate double counting on the basis of the
APSC FILED Time: 3/26/2014 2:23:55 PM: Recvd 3/26/2014 2:04:55 PM: Docket 07-078-TF-Doc. 185

2013 SourceGas DSM Portfolio Final Evaluation Report
Home Energy Reports 9-6
difference in per-participant savings. When comparing all of the other-program-participation, the Evaluators found:
- .056262 Therms per participant for the recipient group; and
- .077439 Therms per participant for the control group.
Control group households were more active participants in SourceGas programs than recipient group households. As a result, no double count penalty was applied. In 2012, there was a significant amount of extra program participation among the recipient group in SourceGas’ Water Conservation Program due to the inclusion of the program in a late-year Home Energy Report. This was not done in 2013 and as a result savings in the Water Conservation Program were similar among both groups.
9.5.2 Verified Savings With the model output results and double count analysis, the Home Energy Reports Program has:
438,534 annual Therms savings; and
9,291.18 peak Therms.
Opower had submitted expected savings of 363,230. The Evaluators’ value differs significantly, and it is likely due to Opower’s practice of excluding weather variables in their modeling.
9.6 Conclusions & Recommendations
9.6.1 Conclusions 1. The Home Energy Reports Program observed much higher savings in 2013
due largely to the heavier winter. With 2013 HDD being over 30% higher than 2012, the savings from the Home Energy Reports Program scaled significantly.
2. With SourceGas’ available budget, the decision to prioritize weatherization over behavioral programs is appropriate. The budget from Home Energy Reports is largely being shifted to the new Home Energy Savings Program. It is the Evaluators’ finding that the Home Energy Savings Program better-contributes to APSC Comprehensiveness Goals.
9.6.2 Recommendations The Evaluator’s recommendations for the Home Energy Reports Program are as follows:
1. Support a 2014 impact evaluation. Though the program is discontinued, savings could still continue due to the impact of over two years of reports. Evaluating these savings will require the collection of billing data from
APSC FILED Time: 3/26/2014 2:23:55 PM: Recvd 3/26/2014 2:04:55 PM: Docket 07-078-TF-Doc. 185

2013 SourceGas DSM Portfolio Final Evaluation Report
Home Energy Reports 9-7
SourceGas. The impacts of the program should still be credited in 2014 as they are derived from SourceGas program expenditures.
APSC FILED Time: 3/26/2014 2:23:55 PM: Recvd 3/26/2014 2:04:55 PM: Docket 07-078-TF-Doc. 185

Water Heating & Conservation – Low Flow Kits 10-1
10. Water Heating & Conservation – Low Flow Kits The Water Heating & Conservation program combines prescriptive equipment incentives and low flow mailer kits. This chapter will encompass the EM&V of the mailer kit component, which will be referred to as the Water Conservation Program.
The Water Conservation Program provides no-cost mailer kits to SourceGas residential customers. The program was taken over by EFI in 2013, and EFI’s program allowed for kit customization. EFH kits contain:
Up to three 1.5 gallons per minute (GPM) low flow showerheads, in a chrome finish;
Up to three 1.0 GPM bathroom aerators; and
One 1.5 GPM kitchen aerator.
Prior to this, the program was administered by Niagra Water Conservation. The Niagara kit included:
One 1.5 GPM showerhead;
One 1.5 GPM kitchen aerator (with a shut-off valve); and
Two 1.0 GPM bathroom aerators.
In 2013, the Water Conservation Program provided kits to 948 residential customers. 850 were delivered by EFI and 98 were legacy kits from Niagara.
10.1 Program Background The Water Conservation Program began in 2010. The program is designed to provide no-cost kits containing low flow showerheads and faucet aerators to SourceGas residential customers. These kits are then self-installed. The program has been markedly popular among SourceGas customers, exceeding participation goals in 2010 and 2011.
10.1.1 Water Conservation Program Participation Summary In 2013, SourceGas distributed 948 kits to their residential customers. 850 kits were delivered by EFI. After EFI took over the program, they assembled three kit configurations. They are:
Kit One: one showerhead, one kitchen aerator, one bathroom aerator;
Kit Two: Two showerheads, one kitchen aerator, two bathroom aerators; and
Kit Three: Three showerheads, one kitchen aerator, three bathroom aerators.
APSC FILED Time: 3/26/2014 2:23:55 PM: Recvd 3/26/2014 2:04:55 PM: Docket 07-078-TF-Doc. 185
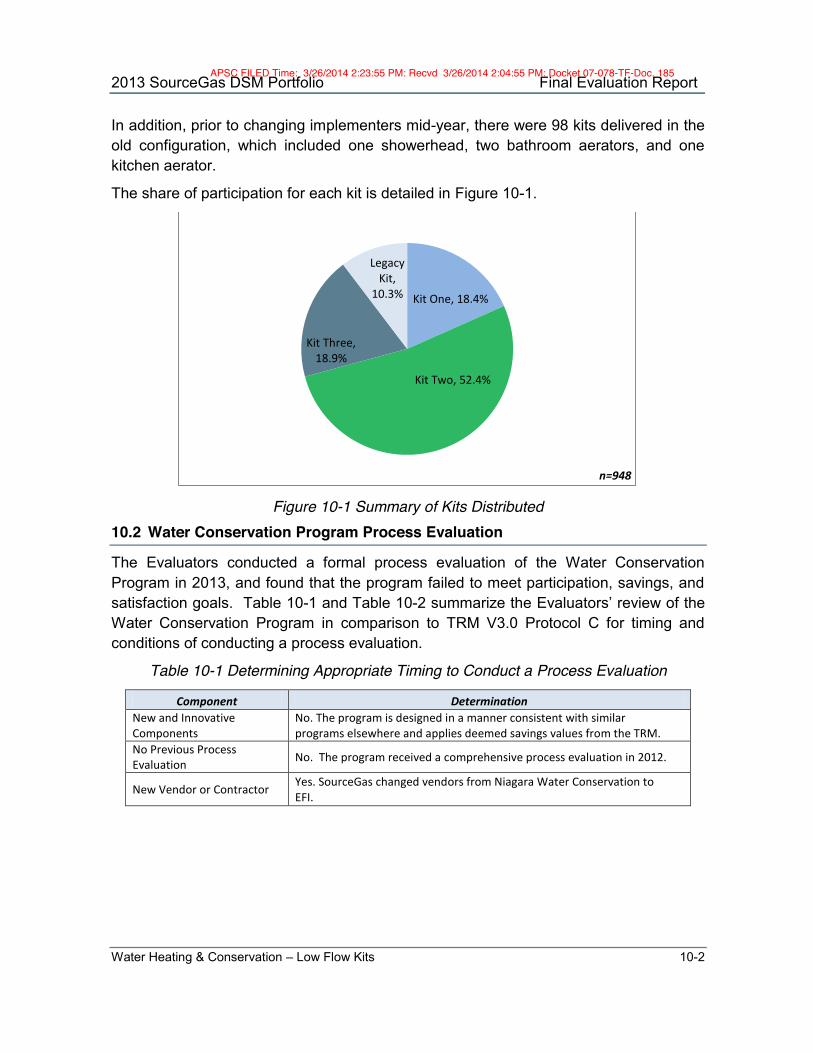
2013 SourceGas DSM Portfolio Final Evaluation Report
Water Heating & Conservation – Low Flow Kits 10-2
In addition, prior to changing implementers mid-year, there were 98 kits delivered in the old configuration, which included one showerhead, two bathroom aerators, and one kitchen aerator.
The share of participation for each kit is detailed in Figure 10-1.
Figure 10-1 Summary of Kits Distributed
10.2 Water Conservation Program Process Evaluation
The Evaluators conducted a formal process evaluation of the Water Conservation Program in 2013, and found that the program failed to meet participation, savings, and satisfaction goals. Table 10-1 and Table 10-2 summarize the Evaluators’ review of the Water Conservation Program in comparison to TRM V3.0 Protocol C for timing and conditions of conducting a process evaluation.
Table 10-1 Determining Appropriate Timing to Conduct a Process Evaluation
Component Determination New and Innovative Components
No. The program is designed in a manner consistent with similar programs elsewhere and applies deemed savings values from the TRM.
No Previous Process Evaluation No. The program received a comprehensive process evaluation in 2012.
New Vendor or Contractor Yes. SourceGas changed vendors from Niagara Water Conservation to EFI.
Kit One, 18.4%
Kit Two, 52.4%
Kit Three, 18.9%
Legacy Kit,
10.3%
n=948
APSC FILED Time: 3/26/2014 2:23:55 PM: Recvd 3/26/2014 2:04:55 PM: Docket 07-078-TF-Doc. 185

2013 SourceGas DSM Portfolio Final Evaluation Report
Water Heating & Conservation – Low Flow Kits 10-3
Table 10-2 Determining Appropriate Conditions to Conduct a Process Evaluation Component Determination
Are program impacts lower or slower than expected?
Yes. The program failed to reach savings goals in 2012, though goals were reached in 2013.
Are the educational or informational goals not meeting program goals?
Yes. The program did not provide the outreach needed in 2012. It was found that this changed in 2013 with the new implementer.
Are the participation rates lower or slower than expected?
No. The program fell short participant goals in 2012, though goals were met in 2013.
Are the program’s operational or management structure slow to get up and running or not meeting program administrative needs?
Mixed. SourceGas has adequate staffing to support the program but in 2012 the prior implementation contractor did not adequately manage the program.
Is the program’s cost-effectiveness less than expected? No, the program’s cost-effectiveness is within expectations.
Do participants report problems with the programs or low rates of satisfaction?
No. 2012 participant surveys found adequate satisfaction levels.
Is the program producing the intended market effects?
Mixed. The program is generating transactions and installations that would not occur otherwise., but the prior implementer did not reach the scale of participation needed
On this basis, the Evaluators concluded that process evaluation activities for 2013 would include an assessment of whether the new implementer has been able to adequately scale the program, whether recommendations made in 2012 have been implemented, and how the program operation has changed with the new implementation team.
10.3 Data Collection Activities
The process evaluation of the Water Conservation Program included the following data collection activities:
SourceGas Program Staff Interviews. The Evaluators interviewed staff at SourceGas involved in the administration of the Water Conservation Program. These interviews built upon interviews conducted during the 2012 Process Evaluation, in which the Evaluators collected initial background information on program history and implementation. These interviews captured any operational changes on SourceGas’ side, as well as informing the Evaluators as to any new developments in the program.
Program Marketing Materials Review. The Evaluators collected marketing materials used by the Water Conservation Program. This included customer mailers and a review of the SourceGas program website. This was compared against marketing materials from successful programs run in other territories in informing marketing improvements.
APSC FILED Time: 3/26/2014 2:23:55 PM: Recvd 3/26/2014 2:04:55 PM: Docket 07-078-TF-Doc. 185

2013 SourceGas DSM Portfolio Final Evaluation Report
Water Heating & Conservation – Low Flow Kits 10-4
Review of Program Quality Control Procedures. The Evaluators reviewed the QC procedures in place for the Water Conservation Program. This included review of processes in place to verify eligibility, along with the invoice review processes in place by SourceGas.
Participant Surveying. The Evaluators surveyed a sample of 100 participants in the Water Conservation Program. In addition to their use in providing impact parameters and developing free-ridership and spillover estimates, these surveys informed the process evaluation of the Water Conservation Program. These surveys addressed issues including participant satisfaction with the program offerings, demographics, and other contextual issues regarding the participation process.
Table 10-3 summarizes the data collection for this process evaluation effort. This includes the titles, role, sample sizes, timeframe of data collection.
Table 10-3 Water Conservation Program Data Collection Summary Target Component Activity N Role
SourceGas Program Staff
Manager – Energy Efficiency Programs Interview 1
Overall administration of SGA DSM programs. This manager is involved in the larger strategic decisions associated with the DSM portfolio, and is involved with the Water Conservation Program in the overall coordination of utility resources.
Program Participants Residential Survey 100
This captured a sample of participants to develop estimates of installation and electric water heating rates.
Marketing & Outreach Marketing Materials Literature
Review -
The full scope of paper and electronic marketing materials used in implementation for the program was reviewed by the Evaluators.
10.4 Process Evaluation Results & Findings
This section will present the results and key findings from the data collection activities. These findings are based upon interviews with utility staff, implementation staff, surveys with participants, and thorough and in-depth literature review.
10.4.1.1 Response to Program Recommendations
Table 10-4 summarizes the status of issues and recommendations identified in the 2012 process evaluation.
APSC FILED Time: 3/26/2014 2:23:55 PM: Recvd 3/26/2014 2:04:55 PM: Docket 07-078-TF-Doc. 185
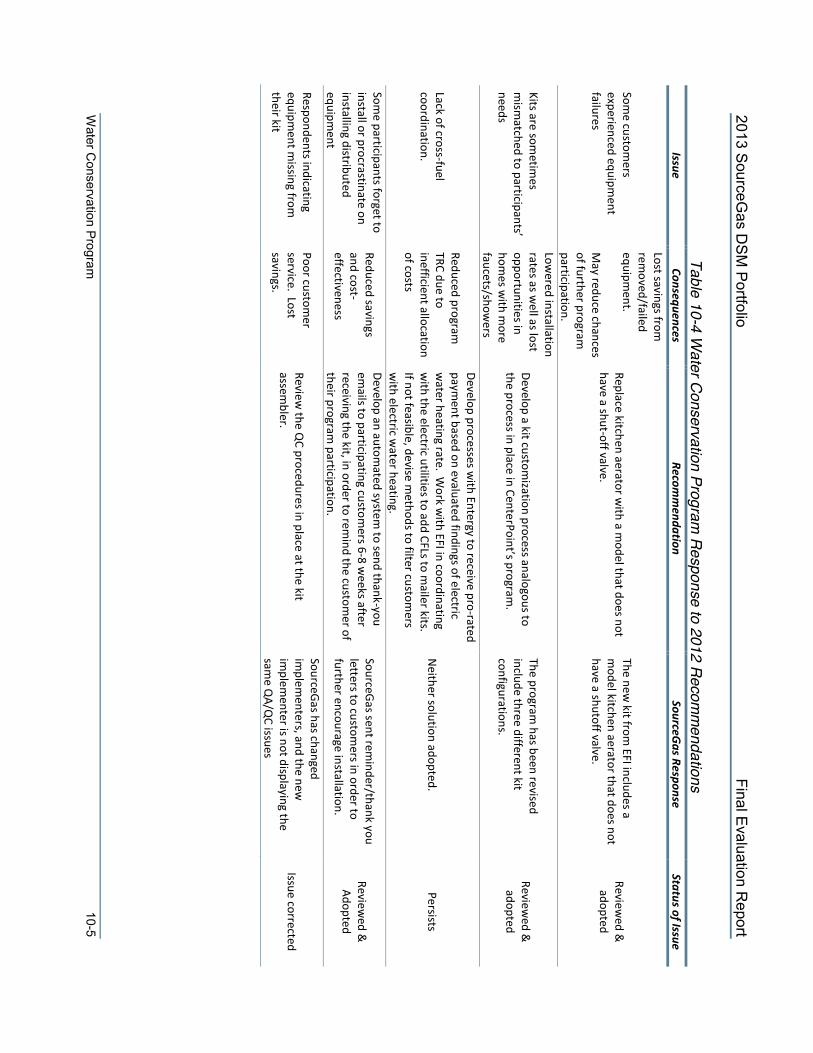
2013 SourceG
as DS
M P
ortfolio Final E
valuation Report
Water C
onservation Program
10-5
Table 10-4 Water Conservation Program
Response to 2012 Recomm
endations Issue
Consequences Recom
mendation
SourceGas Response
Status of Issue
Some custom
ers experienced equipm
ent failures
Lost savings from
removed/failed
equipment.
May reduce chances
of further program
participation.
Replace kitchen aerator with a m
odel that does not have a shut-off valve.
The new kit from
EFI includes a m
odel kitchen aerator that does not have a shutoff valve.
Reviewed &
adopted
Kits are sometim
es mism
atched to participants’ needs
Lowered installation
rates as well as lost
opportunities in hom
es with m
ore faucets/show
ers
Develop a kit customization process analogous to
the process in place in CenterPoint’s program.
The program has been revised
include three different kit configurations.
Reviewed &
adopted
Lack of cross-fuel coordination.
Reduced program
TRC due to inefficient allocation of costs
Develop processes with Entergy to receive pro-rated
payment based on evaluated findings of electric
water heating rate. W
ork with EFI in coordinating
with the electric utilities to add CFLs to m
ailer kits. If not feasible, devise m
ethods to filter customers
with electric w
ater heating.
Neither solution adopted.
Persists
Some participants forget to
install or procrastinate on installing distributed equipm
ent
Reduced savings and cost-effectiveness
Develop an automated system
to send thank-you em
ails to participating customers 6-8 w
eeks after receiving the kit, in order to rem
ind the customer of
their program participation.
SourceGas sent reminder/thank you
letters to customers in order to
further encourage installation.
Reviewed &
Adopted
Respondents indicating equipm
ent missing from
their kit
Poor customer
service. Lost savings.
Review the Q
C procedures in place at the kit assem
bler.
SourceGas has changed im
plementers, and the new
im
plementer is not displaying the
same Q
A/QC issues
Issue corrected
APSC FILED
Time: 3/26/2014 2:23:55 PM
: Recvd 3/26/2014 2:04:55 PM
: Docket 07-078-TF-D
oc. 185

2013 SourceGas DSM Portfolio Final Evaluation Report
Water Conservation Program 10-6
10.4.2 Participant Survey Response The Evaluators completed 100 surveys with residential program participants in the Water Conservation Program. The survey addressed a variety of impact and process-related issues, including program awareness, reasons for participation, free-ridership and spillover, and program satisfaction. Further, the Evaluators collected demographic information on the respondents during the survey. The respondent demographics are summarized in Figure 10-2 and Figure 10-3
Figure 10-2 Differences in Income between Participants and Non-Participants
30.0%
18.0% 16.0% 16.0%
3.0%
6.0%
11.0%
15.7% 13.0%
16.0%
12.0%
7.3%
10.3%
22.7%
0.0%
5.0%
10.0%
15.0%
20.0%
25.0%
30.0%
35.0%
Less than$25k
$25k-$35k $36k-$50k $51k-$75k $76k-$100k Greaterthan $100k
Refused
Participants Non-Participants
APSC FILED Time: 3/26/2014 2:23:55 PM: Recvd 3/26/2014 2:04:55 PM: Docket 07-078-TF-Doc. 185

2013 SourceGas DSM Portfolio Final Evaluation Report
Water Conservation Program 10-7
Figure 10-3 Differences in Education between Participants and Non-Participants
From survey responses, the Evaluators found that 85% of participants own the residence that received the kit. In 2012, the mix of customers that participated in SourceGas’ Water Conservation Program differed sharply from those in CenterPoint’s or AOG’s similar programs. The SourceGas Program did not have the high share of lower-income participants observed in the CenterPoint and AOG programs. As seen in Figure 10-2, the mix of 2013 participants is skewed more towards the lower income segment, with SourceGas’ program now reaching the expected audience of participants.
10.4.2.1 Program Awareness
SourceGas’ marketing of the Water Conservation Program is driven primarily through mailed out BRC cards. The prior implementation contractor marketed the program solely online, and it was found that this was not reaching the target market. Ninety-one percent of survey respondents indicated having learned of the program from a SourceGas bill insert or mailer brochure. The sources of awareness for the Water Conservation Program are summarized in Table 10-5.
45.0%
28.0%
11.0% 12.0%
4.0%
40.7%
19.0% 18.0%
12.3% 10.0%
0.0%
5.0%
10.0%
15.0%
20.0%
25.0%
30.0%
35.0%
40.0%
45.0%
50.0%
High School orLess
Associate's /Some College
Four-YearCollege
Graduate /Professional
Refused
Participants Non-Participants
APSC FILED Time: 3/26/2014 2:23:55 PM: Recvd 3/26/2014 2:04:55 PM: Docket 07-078-TF-Doc. 185

2013 SourceGas DSM Portfolio Final Evaluation Report
Water Conservation Program 10-8
Table 10-5 Water Conservation Program Sources of Program Awareness
Source of Awareness %
Indicated SourceGas mailer 91.0% Newspaper/magazine ad 1.0% Word of mouth/friends & relatives 1.0% TV ad 1.0% SourceGas website 1.0% Don’t know 5.0% n 100
10.4.2.2 Reasons for Participation
Respondents were asked a series of questions addressing their reasons for participating in the program. Figure 10-4 summarizes the reasons given by residential survey respondents. The respondents were asked an open-ended question where they would list their reasons for participation, with the interviewers logging each reason indicated. The most common reasons indicated were saving on the gas bill, because participation is good for the environment, and saving money on the electric bill. Items listed under “other” initially included the “To try the program” and “To conserve water”, but enough respondents indicated these answers that the Evaluators opted to recode these entries.
Figure 10-4 Water Conservation Program Reasons for Participating
Don't know
Other
SourceGas recommendation
Save water
Curious about the equipment
Provided free of charge
Good for the environment
Save on gas bill
Save on electric bill
n=100
APSC FILED Time: 3/26/2014 2:23:55 PM: Recvd 3/26/2014 2:04:55 PM: Docket 07-078-TF-Doc. 185

2013 SourceGas DSM Portfolio Final Evaluation Report
Water Conservation Program 10-9
10.4.2.3 Measure Use & Retention
Respondents were also asked questions related to their use of the items received in the kit. This included collection of data for installation rate and reasons for lack of installation.
Low Flow Showerheads Respondents were also asked questions related to their use of the items received in the kit. This included collection of data for installation rate and reasons for lack of installation.
Low Flow Showerheads Error! Reference source not found. summarizes the installation rate for low flow showerheads. The installation rates are presented subdivided by the quantity of showerheads received by the customer. The tallies in Table 10-6 exclude customers that indicate that they “don’t know” the number of showerheads they installed.
Table 10-6 Low Flow Showerhead Installation Rate # Showerheads
Received Customer
Count Total
Distributed Amount Installed
Installation Rate
1-3 100 201 124 61.7%
Respondents were then asked two separate questions:
1) What were the reasons for not installing the showerhead at all?
2) What were the reasons for removing a showerhead after installation? Responses to these questions are summarized in Figure 10-5.
Figure 10-5 Reasons for Not Installing Low Flow Showerheads
5.6%
2.8%
13.9%
2.8%
2.8%
5.6%
13.9%
52.8%
0.0% 10.0% 20.0% 30.0% 40.0% 50.0% 60.0%
Don't know
Other
Waiting for someone to help install
Didn't have the tools to install it
Didn't know how to install it
Tried one and did not like it
Had more than I needed
Haven't gotten around to it
n=36
APSC FILED Time: 3/26/2014 2:23:55 PM: Recvd 3/26/2014 2:04:55 PM: Docket 07-078-TF-Doc. 185

2013 SourceGas DSM Portfolio Final Evaluation Report
Water Conservation Program 10-10
Faucet Aerators Fifty-eight percent of respondents installed the kitchen aerator included in the kit. Of the bathroom aerators distributed with each kit, a total of 51.9% were installed.
As with low flow showerheads, customers that received faucet aerators were asked their reasons for not installing and for removing installed aerators. These are summarized in Figure 10-6.
Figure 10-6 Reasons for Not Installing Faucet Aerators
10.4.2.4 Satisfaction with Equipment
Further, the Evaluators asked participants to rate their satisfaction with the equipment included in the kit. The satisfaction scores by component are presented in Table 10-7.
7.5%
5.7%
3.8%
1.9%
7.5%
3.8%
26.4%
43.4%
9.1%
4.5%
4.5%
4.5%
2.3%
2.3%
29.5%
43.2%
0.0% 10.0% 20.0% 30.0% 40.0% 50.0%
Other
Waiting for someone to help install
Didn't have the tools to install it
Didn't know how to install it
Tried one and did not like it
Had more than I needed
Didn’t fit
Haven't gotten around to it
Kitchen Aerator Bathroom Aerator
APSC FILED Time: 3/26/2014 2:23:55 PM: Recvd 3/26/2014 2:04:55 PM: Docket 07-078-TF-Doc. 185

2013 SourceGas DSM Portfolio Final Evaluation Report
Water Conservation Program 10-11
Table 10-7 Satisfaction Levels with Kit Equipment Element of Program
Experience Low Flow
Showerheads Kitchen Aerators
Bathroom Aerators
Appearance of the equipment 9.06 8.98 9.50
Amount of flow 8.22 8.53 8.52
Ability to adjust the spray 8.50 8.52 8.85
Ease of Installation 9.62 9.48 9.55
The way it works compared to the old one 8.29 8.66 8.63
N 70 57 56
10.4.2.5 Issues in Measure Installation & Retention
What is most telling in Figure 10-5 is the extent to which lack of installation is attributed to lack of follow-through on the part of the respondents. Overall, 55.6% of respondents that did not install all of their showerheads and 43.3% that did not install aerators indicated that they either “Don’t Know” why they have not or that they just “Haven’t gotten around to it”. However, installation rates are increased in 2013 when compared to 2012. SourceGas did begin sending reminder and thank you emails to their program participants, but there were no paper mailings so not all participants received this message. Overall, the changes made in program delivery appear to have worked to improve measure retention.
10.4.2.6 Free-Ridership
Free-ridership estimates for residential participants in the Water Conservation Program were developed through scoring of the survey respondents. This section will detail the questions and answers from the participant survey that contributed to the participant response portion of the program free-rider scoring.
The contributing questions are divided into three subcategories:
Inducement to Install: Q-9 [If Q-2a > 0 else Q-10] Would you have installed the low flow showerheads
without the kit? Yes [ASK Q-9a] No [SKIP TO Q-10]
Q-9a How soon would you have installed the low flow showerheads?
Less than 6 months 6-12 months 1-2 years More than 2 years
APSC FILED Time: 3/26/2014 2:23:55 PM: Recvd 3/26/2014 2:04:55 PM: Docket 07-078-TF-Doc. 185
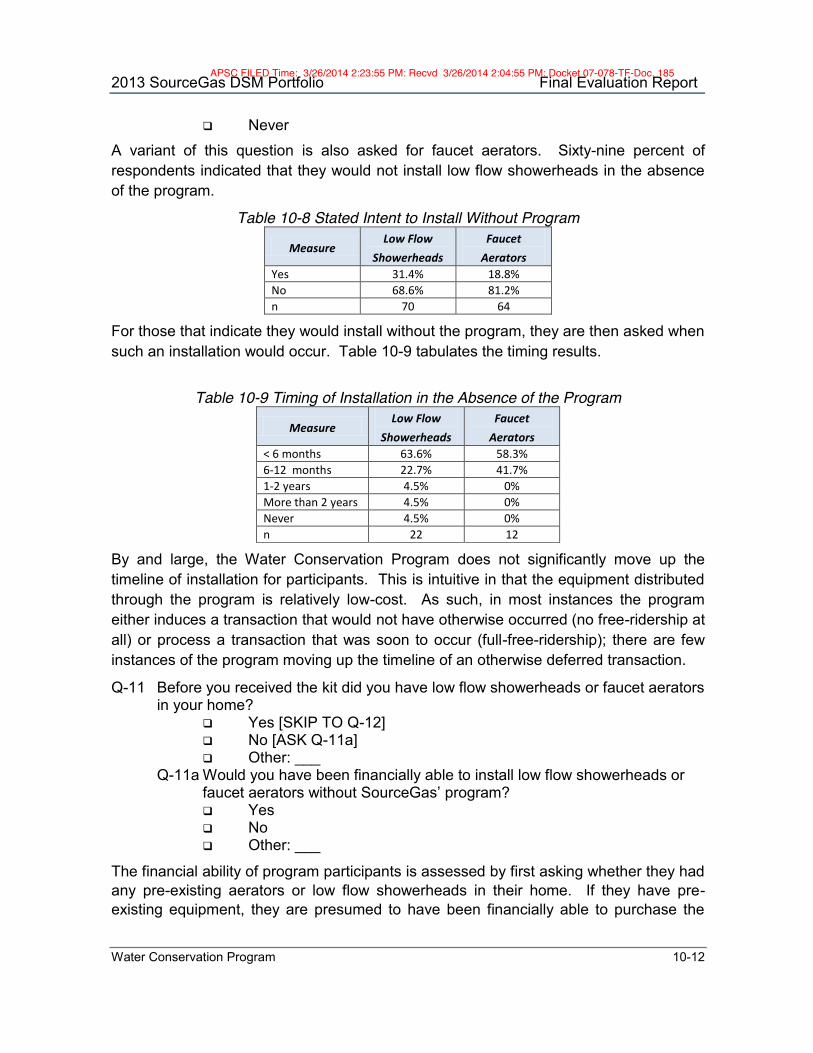
2013 SourceGas DSM Portfolio Final Evaluation Report
Water Conservation Program 10-12
Never A variant of this question is also asked for faucet aerators. Sixty-nine percent of respondents indicated that they would not install low flow showerheads in the absence of the program.
Table 10-8 Stated Intent to Install Without Program
Measure Low Flow
Showerheads Faucet
Aerators Yes 31.4% 18.8% No 68.6% 81.2% n 70 64
For those that indicate they would install without the program, they are then asked when such an installation would occur. Table 10-9 tabulates the timing results.
Table 10-9 Timing of Installation in the Absence of the Program
Measure Low Flow
Showerheads Faucet
Aerators < 6 months 63.6% 58.3% 6-12 months 22.7% 41.7% 1-2 years 4.5% 0% More than 2 years 4.5% 0% Never 4.5% 0% n 22 12
By and large, the Water Conservation Program does not significantly move up the timeline of installation for participants. This is intuitive in that the equipment distributed through the program is relatively low-cost. As such, in most instances the program either induces a transaction that would not have otherwise occurred (no free-ridership at all) or process a transaction that was soon to occur (full-free-ridership); there are few instances of the program moving up the timeline of an otherwise deferred transaction.
Q-11 Before you received the kit did you have low flow showerheads or faucet aerators in your home?
Yes [SKIP TO Q-12] No [ASK Q-11a] Other: ___
Q-11a Would you have been financially able to install low flow showerheads or faucet aerators without SourceGas’ program? Yes No Other: ___
The financial ability of program participants is assessed by first asking whether they had any pre-existing aerators or low flow showerheads in their home. If they have pre-existing equipment, they are presumed to have been financially able to purchase the
APSC FILED Time: 3/26/2014 2:23:55 PM: Recvd 3/26/2014 2:04:55 PM: Docket 07-078-TF-Doc. 185

2013 SourceGas DSM Portfolio Final Evaluation Report
Water Conservation Program 10-13
program equipment. If they do not have pre-existing equipment, they are then asked if they would have been able to do so. Twenty-four percent of participants already had some low flow equipment in their home. Of those that had no pre-existing equipment, 38.2% indicated that they would have been financially able to purchase the low flow equipment without the program. Fifty-three percent indicated that they would not have been and 9.2% stated that they “don’t know” if they would have been financially able.
The results of these questions are combined in determining a free-rider score for each survey respondent. Based upon their answers, the respondent is scored with 100% or 0% net-to-gross. The mean value of all respondents is then propagated to the program as a whole. The scoring framework is presented in the figure below:
Is the participant financially able to
purchase equipment without the program?
Did the participant indicate that the program induced the showerhead
and faucet aerator?
Did the participant ever install low flow
aerators or showerheads before?
NTGR = 1 NTGR = 0Yes
Yes No
No
No
No
Figure 10-7 Low Flow Kit Free-Rider Scoring
Based on this scoring, the water conservation kit has a free-ridership score of 89.0% for low flow showerheads and 94.0% for faucet aerators.
10.4.2.7 Participant Spillover
The residential participant survey addressed participant spillover. This was done through a battery of questions designed to:
1) Assess the behaviors taken by customers after their program participation where they installed energy efficient equipment; and
2) Get the respondent’s self-reported value for how important they felt information from SourceGas was in inducing this non-incentivized behavior.
No quantifiable spillover was identified.
10.4.2.8 Program Satisfaction
Participants were asked to rate their satisfaction on a scale of 1-10, with 1 meaning “Very Dissatisfied” and 10 meaning “Very Satisfied” on a range of items related to their program experience. Table 10-10 tabulates the satisfaction results.
APSC FILED Time: 3/26/2014 2:23:55 PM: Recvd 3/26/2014 2:04:55 PM: Docket 07-078-TF-Doc. 185

2013 SourceGas DSM Portfolio Final Evaluation Report
Water Conservation Program 10-14
Table 10-10 Water Conservation Program Satisfaction Levels Element of Program
Experience Mean Score
% Don’t Know
Wait time to receive the low flow showerheads and aerators 8.75 5.0%
The effort required for the program application process 9.19 6.0%
Savings on your monthly bill 7.32 29.0%
Customer service from SourceGas staff 8.98 6.0%
Overall program experience 9.04 3.0%
n=100
Overall satisfaction with the Water Conservation Program is high. Respondents indicated particularly high satisfaction with the service provided by SourceGas staff and the ease of the application process. Most notably, satisfaction was significantly improved on the wait time to receive the kit.
Savings on monthly bills received the lowest satisfaction score of any element of program experience, with a mean score of 7.32. However 29.0% of respondents indicated that they “don’t know” how satisfied they are with the savings they’ve observed from using low flow showerheads and faucet aerators,. Savings from equipment such as low flow showerheads and faucet aerators are highly cost-effective, but the individual savings observed by a participant may not be readily visible in their bills; the savings are low relatively to overall household usage, particularly if the customer has gas appliances.
10.5 Water Conservation Kits Impact Evaluation
The impact evaluation effort of the Water Conservation Program included:
Telephone Verification. The Evaluators conducted telephone surveys with 100 program participants to establish impact evaluation parameters, including installation rates and water heater fuel type.
Free-Ridership Estimation. Free-Ridership Rates were developed using detailed participant surveys, addressing the decision-making process to participate in the program. Topics contributing to the free-ridership analysis included evaluating the extent to which the program educated customers about new energy-saving opportunities and whether they had ever installed similar equipment, culminating in a determination of whether the participant would have installed the same or similar equipment within one year in the absence of the program.
Spillover Estimation. Spillover was addressed for the program participants. Participants were surveyed for free ridership and process evaluation, and over the course of that survey are asked a series of questions addressing whether the
APSC FILED Time: 3/26/2014 2:23:55 PM: Recvd 3/26/2014 2:04:55 PM: Docket 07-078-TF-Doc. 185

2013 SourceGas DSM Portfolio Final Evaluation Report
Water Conservation Program 10-15
program induced them to install other energy efficient equipment without program incentive. Additionally, the Evaluators asked these customers for an estimate of savings that they expect from these measures
10.6 Energy Savings Calculations
Savings from low flow showerheads are calculated by the following process:
First, the Evaluators total the per-unit savings as determined by TRM V3.0 algorithms which incorporate weather-zone specific ground water temperatures, and an assumed mixed water temperature of 104.3 deg. F for low flow showerheads and 103 deg. F for faucet aerators.
Based on survey results, the TRM V3.0 algorithm was updated to reflect the number of occupants and number of total showers in the residences of program participants.
Further, based upon the survey results, these values are scaled down by the verified In-Service Rate. This is the percent of distributed equipment installed. This is determined separately for each item in the kit (showerheads, kitchen aerators, and bathroom aerators).
The Evaluators then parse out the savings on the basis of the percent of electric vs. gas water heating as determined through the participant surveys. This serves to provide a weighted average value of energy savings based upon the electric and natural gas savings algorithms for each measure as indicated in TRM V3.0.
10.7 Unit Energy Savings
10.7.1.1 Faucet Aerators
Savings from faucet aerators are based upon TRM V3.0 values. Savings for Faucet Aerators are calculated as follows44:
𝐸𝑛𝑒𝑟𝑔𝑦 𝑆𝑎𝑣𝑖𝑛𝑔𝑠 = 𝜌 × 𝐶 × 𝑉 × 𝑇 − 𝑇 × 1
𝐸𝐹𝐶𝑜𝑛𝑣𝑒𝑟𝑠𝑖𝑜𝑛 𝐹𝑎𝑐𝑡𝑜𝑟
Where:
𝜌 = Water density, 8.33 lbs./gal.
𝐶 = Specific heat of water, 1 BTU/lb·°F
𝑉 = DHW gallons saved / yr. / faucet
𝑉 = gallons of hot water saved per year per faucet = 533 × (2.2 − 𝑔𝑝𝑚) where gpm is the flow rate of the new aerator. This formula is a linear extrapolation of values in Table 10-11.
44 Arkansas TRM V3.0, Volume 2. Pg. 94-99
APSC FILED Time: 3/26/2014 2:23:55 PM: Recvd 3/26/2014 2:04:55 PM: Docket 07-078-TF-Doc. 185

2013 SourceGas DSM Portfolio Final Evaluation Report
Water Conservation Program 10-16
𝑇 = Mixed water temperature (default value 103°F)
𝑇 = Average supply water temperature (Water Main Temperature from Table 10-12)
𝐸𝐹 = Recovery efficiency of water heater, excluding standby losses (.98 electric / 0.78 Gas).
𝐶𝑜𝑛𝑣𝑒𝑟𝑠𝑖𝑜𝑛 𝐹𝑎𝑐𝑡𝑜𝑟 = 3,412 BTU/kWh for electric water heating or 100,000 BTU/Therm for gas water heating
Table 10-11 Faucet Aerator Volume of Use
Parameter Value Faucet use gallons/person/day (baseline) 9.7 Faucet use gallons/person/day (1.5 GPM) 8.2 Faucet use gallons/person/day (1.0 GPM) 7.2 Occupants per home 2.69 Faucets per home 3.86 Gal./yr./faucet (Baseline) 2,467 Gal./yr./faucet (1.5 GPM) 2,094 Gal./yr./faucet (1.0 GPM) 1,828 Mixed Water Temperature 103 deg. F DHW gallons saved/yr./faucet for 1.5 GPM (V) 373 DHW gallons saved/yr./faucet for 1.5 GPM (V) 639
Table 10-12 Water Main Temperatures by Weather Zone
Fayetteville (Zone 9)
Fort Smith (Zone 8)
Little Rock (Zone 7)
El Dorado (Zone 6)
65.6 °F 66.1 °F 67.8 °F 70.1 °F
The resulting savings per unit are summarized in Table 10-13.
Table 10-13 Residential Aerator Gas Savings Values
Measure Savings Fayetteville
(Zone 9) Fort Smith
(Zone 8) Little Rock
(Zone 7) El Dorado (Zone 6)
1.5 GPM Aerator
Annual 1.52 1.50 1.43 1.34 Peak .0046 .0045 .0043 .0040
1.0 GPM Aerator
Annual 2.61 2.57 2.45 2.30 Peak .0078 .0077 .0074 .0069
APSC FILED Time: 3/26/2014 2:23:55 PM: Recvd 3/26/2014 2:04:55 PM: Docket 07-078-TF-Doc. 185
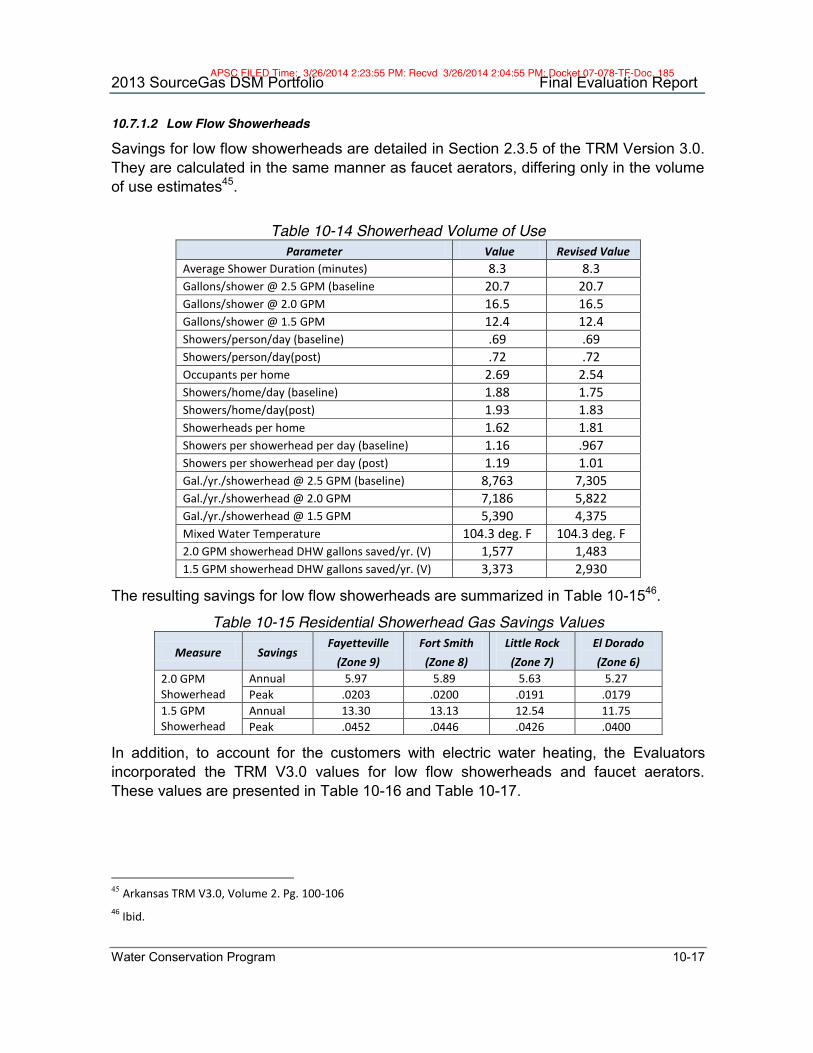
2013 SourceGas DSM Portfolio Final Evaluation Report
Water Conservation Program 10-17
10.7.1.2 Low Flow Showerheads
Savings for low flow showerheads are detailed in Section 2.3.5 of the TRM Version 3.0. They are calculated in the same manner as faucet aerators, differing only in the volume of use estimates45.
Table 10-14 Showerhead Volume of Use
Parameter Value Revised Value Average Shower Duration (minutes) 8.3 8.3 Gallons/shower @ 2.5 GPM (baseline 20.7 20.7 Gallons/shower @ 2.0 GPM 16.5 16.5 Gallons/shower @ 1.5 GPM 12.4 12.4 Showers/person/day (baseline) .69 .69 Showers/person/day(post) .72 .72 Occupants per home 2.69 2.54 Showers/home/day (baseline) 1.88 1.75 Showers/home/day(post) 1.93 1.83 Showerheads per home 1.62 1.81 Showers per showerhead per day (baseline) 1.16 .967 Showers per showerhead per day (post) 1.19 1.01 Gal./yr./showerhead @ 2.5 GPM (baseline) 8,763 7,305 Gal./yr./showerhead @ 2.0 GPM 7,186 5,822 Gal./yr./showerhead @ 1.5 GPM 5,390 4,375 Mixed Water Temperature 104.3 deg. F 104.3 deg. F 2.0 GPM showerhead DHW gallons saved/yr. (V) 1,577 1,483 1.5 GPM showerhead DHW gallons saved/yr. (V) 3,373 2,930
The resulting savings for low flow showerheads are summarized in Table 10-1546.
Table 10-15 Residential Showerhead Gas Savings Values
Measure Savings Fayetteville
(Zone 9) Fort Smith
(Zone 8) Little Rock
(Zone 7) El Dorado (Zone 6)
2.0 GPM Showerhead
Annual 5.97 5.89 5.63 5.27 Peak .0203 .0200 .0191 .0179
1.5 GPM Showerhead
Annual 13.30 13.13 12.54 11.75 Peak .0452 .0446 .0426 .0400
In addition, to account for the customers with electric water heating, the Evaluators incorporated the TRM V3.0 values for low flow showerheads and faucet aerators. These values are presented in Table 10-16 and Table 10-17.
45 Arkansas TRM V3.0, Volume 2. Pg. 100-106 46 Ibid.
APSC FILED Time: 3/26/2014 2:23:55 PM: Recvd 3/26/2014 2:04:55 PM: Docket 07-078-TF-Doc. 185
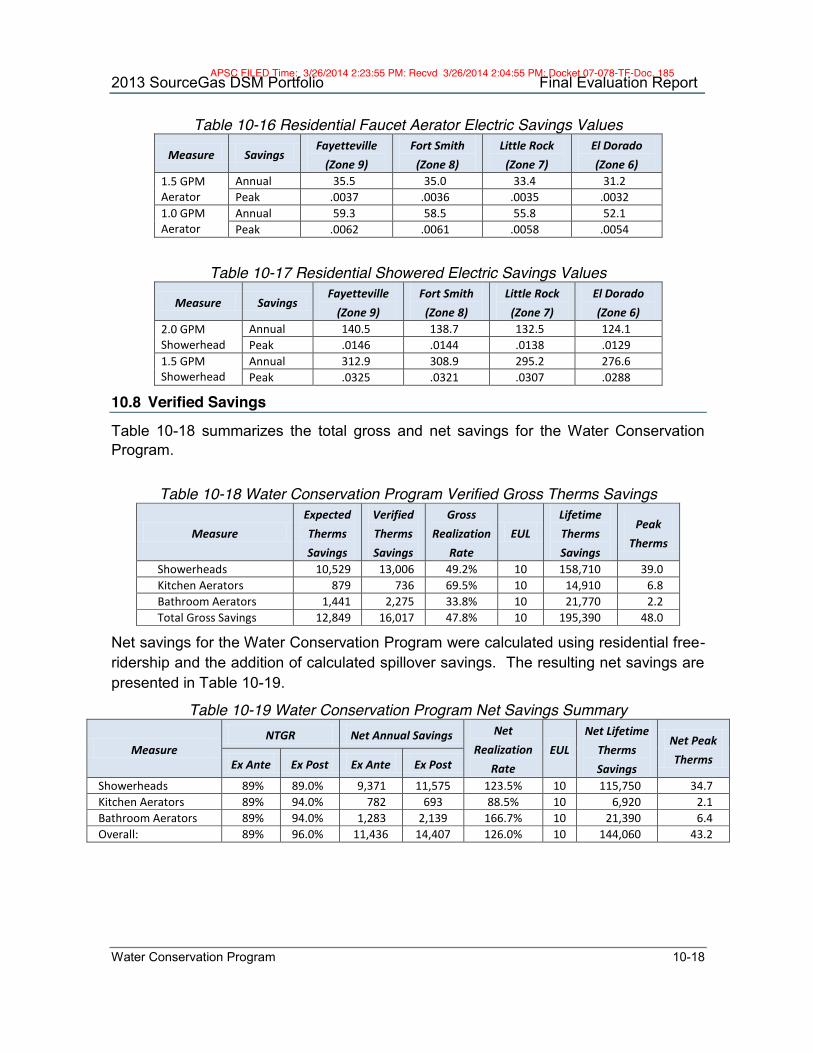
2013 SourceGas DSM Portfolio Final Evaluation Report
Water Conservation Program 10-18
Table 10-16 Residential Faucet Aerator Electric Savings Values
Measure Savings Fayetteville
(Zone 9) Fort Smith
(Zone 8) Little Rock
(Zone 7) El Dorado (Zone 6)
1.5 GPM Aerator
Annual 35.5 35.0 33.4 31.2 Peak .0037 .0036 .0035 .0032
1.0 GPM Aerator
Annual 59.3 58.5 55.8 52.1 Peak .0062 .0061 .0058 .0054
Table 10-17 Residential Showered Electric Savings Values
Measure Savings Fayetteville
(Zone 9) Fort Smith
(Zone 8) Little Rock
(Zone 7) El Dorado (Zone 6)
2.0 GPM Showerhead
Annual 140.5 138.7 132.5 124.1 Peak .0146 .0144 .0138 .0129
1.5 GPM Showerhead
Annual 312.9 308.9 295.2 276.6 Peak .0325 .0321 .0307 .0288
10.8 Verified Savings
Table 10-18 summarizes the total gross and net savings for the Water Conservation Program.
Table 10-18 Water Conservation Program Verified Gross Therms Savings
Measure Expected Therms Savings
Verified Therms Savings
Gross Realization
Rate EUL
Lifetime Therms Savings
Peak Therms
Showerheads 10,529 13,006 49.2% 10 158,710 39.0 Kitchen Aerators 879 736 69.5% 10 14,910 6.8 Bathroom Aerators 1,441 2,275 33.8% 10 21,770 2.2 Total Gross Savings 12,849 16,017 47.8% 10 195,390 48.0
Net savings for the Water Conservation Program were calculated using residential free-ridership and the addition of calculated spillover savings. The resulting net savings are presented in Table 10-19.
Table 10-19 Water Conservation Program Net Savings Summary
Measure NTGR Net Annual Savings Net
Realization Rate
EUL Net Lifetime
Therms Savings
Net Peak Therms Ex Ante Ex Post Ex Ante Ex Post
Showerheads 89% 89.0% 9,371 11,575 123.5% 10 115,750 34.7 Kitchen Aerators 89% 94.0% 782 693 88.5% 10 6,920 2.1 Bathroom Aerators 89% 94.0% 1,283 2,139 166.7% 10 21,390 6.4 Overall: 89% 96.0% 11,436 14,407 126.0% 10 144,060 43.2
APSC FILED Time: 3/26/2014 2:23:55 PM: Recvd 3/26/2014 2:04:55 PM: Docket 07-078-TF-Doc. 185

2013 SourceGas DSM Portfolio Final Evaluation Report
Water Conservation Program 10-19
10.9 Conclusions & Program Recommendations
10.9.1 Conclusions
The Evaluators have found that:
1. Satisfaction with the program operation is very high. Satisfaction with the program operation includes customers’ interactions with SourceGas, satisfaction with wait times, savings realized from program participation, and ease of the application process. Participants found the process to be very straightforward, with most participants facing little difficulty in completing the documentation needed to participate.
2. Kit customization has increased program savings. Though the in-service rate for showerheads declined from 2012, most participants received multiple showerheads, resulting in increased savings per-participant overall.
3. Kit processing times have been expedited. The new program implementer has reduced kit turnaround time by an average of 1-2 weeks, and higher participating satisfaction has been noted.
4. Most instances of participants failing to install are seemingly the result of procrastination or inertia. Sixty percent of respondents that did not install all showerheads that they received and 55.4% of those that did not install all faucet aerators they received indicated that either “haven’t gotten around to it” or “don’t know” why they have not yet installed the equipment.
5. The change in marketing approach has reached the target demographic. In 2012, SourceGas limited application to online-only for most of the program year. This does not capture a large share of the types of participants seen in other similar programs run in Arkansas. In 2013, mailer marketing and paper applications were added, and this reached the lower income segment of the market that is typically observed participating in these programs.
6. The Water Conservation Program is largely inducing transactions that would not occur outside of the program. The free-ridership rate for this program is markedly low. The program is inducing transactions that would not occur otherwise. There are few instances of deferred free-ridership; largely, participants indicate that in the absence of the program, they would not have installed low flow equipment at all, as opposed to delaying or deferring installation. This is intuitive given the relatively low cost of the equipment included in the kits.
10.9.2 Recommendations
The Evaluators’ recommendations for the Water Conservation Program are as follows:
APSC FILED Time: 3/26/2014 2:23:55 PM: Recvd 3/26/2014 2:04:55 PM: Docket 07-078-TF-Doc. 185

2013 SourceGas DSM Portfolio Final Evaluation Report
Water Conservation Program 10-20
1. Instruct EFI to scale up participation. Based on findings from the evaluation of AOG’s program, the Evaluators conclude that the SourceGas program can be scaled significantly.
2. Develop a cross-fuel agreement with SWEPCO. SourceGas has the most overlap with SWEPCO out of any of the electric utilities. They should examine the possibility of joint program implementation for the mailer kits. In this framework, SWEPCO could take credit for the kWh and kW savings from the program and pay a pro-rated share of costs to SourceGas. Further, this would allow for the expansion of the kits to include low-cost electric savings measures (CFLs, smart strips, etc.), allowing for greater cost-effectiveness of the program. Barring this, SourceGas could instead attempt to filter electric water heating customers in the application process.
The issues and recommendations are summarized in Table 10-20.
APSC FILED Time: 3/26/2014 2:23:55 PM: Recvd 3/26/2014 2:04:55 PM: Docket 07-078-TF-Doc. 185

2013 SourceG
as DS
M P
ortfolio Final E
valuation Report
Water C
onservation Kits
10-21
Table 10-20 Water Conservation Kits Sum
mary of Issues & Recom
mendations
Issue Consequences
Recomm
endation Basis for Recom
mendation
Low participation
volume
Lost opportunities for savings. Instruct EFI to scale up participation.
Review of participation rates
for AOG, w
hich has a smaller
territory but higher annual participation.
Lack of cross-fuel coordination.
Reduced program TRC due to
inefficient allocation of costs
Develop processes with SW
EPCO to receive
pro-rated payment based on evaluated
findings of electric water heating rate.
Work w
ith program im
plementation staff in
coordinating with the electric utilities to add
CFLs to mailer kits.
Interviews w
ith various im
plementation contractors
indicating this as a comm
on practice.
APSC FILED
Time: 3/26/2014 2:23:55 PM
: Recvd 3/26/2014 2:04:55 PM
: Docket 07-078-TF-D
oc. 185

Recommendations for TRM Updates 11-1
11. Recommendations for TRM Updates Based on the EM&V efforts of the 2013 SourceGas DSM portfolio, the Evaluators recommend the following additions and updates to the TRM.
11.1 TRM Additions
In the update to TRM V4.0, new measures that are appropriate for addition to Volume 2 include:
Commercial Low Flow Showerheads. These have been added to the direct install component of the C&I Solutions Program. The Evaluators conducted a review of a white paper provided by program implementation staff and found the numbers to be reasonably supported. However, it would be to the benefit of all parties if these values could be codified in the next TRM update (for reference, please review pages 7-40 through 7-42 of this report). Facility categories currently covered under the Northwest Regional Technical Forum deemed savings guidelines include47:
- Hospitality
- Medical
- Commercial (employee shower)
- K-12 School
- Commercial (customer use, excluding fitness center)
- Fitness Center
Half-Sized Gas Convection Ovens. The most recent update to ENERGY STAR® includes test values for half-sized natural gas convection ovens. This is a viable addition to the list of food service measures (especially since parameters are already in place for half-sized electric convection ovens).
11.2 TRM Amendments
In the update to TRM V4.0, the Evaluators recommend the following amendments:
Add an EFLH for Assembly/Worship facilities. Religious facilities have shown significant participation in commercial space heating programs across all three Arkansas natural gas utilities. To-date, the utilities have applied the Small Office EFLH, due to this being the lowest-use facility type (other than restaurants, which have low heating EFLH due to high internal load).
47 http://rtf.nwcouncil.org/measures/measure.asp?id=103
APSC FILED Time: 3/26/2014 2:23:55 PM: Recvd 3/26/2014 2:04:55 PM: Docket 07-078-TF-Doc. 185

2013 SourceGas DSM Portfolio Final Evaluation Report
Recommendations for TRM Updates 11-2
Sections affected: - 3.1.2 Boiler Cut-Out Control
- 3.1.3 Boiler or Furnace Vent Damper
- 3.1.4 Boiler Reset Control
- 3.1.5 Boiler Tune-Up
- 3.1.6 Burner Replacement for Commercial Boilers
- 3.1.8 Commercial Boilers
- 3.1.9 Commercial Furnaces
- Table 363: Equivalent Full-Load Heating Hours
Add a procedure for residential condensing storage tank water heaters. The Arkansas natural gas utilities are having success in condensing storage tank units, which are a viable option for homes that cannot be retrofitted with a tankless unit. These units are typically rated by Thermal Efficiency rather than Energy Factor. For consistency and comparability with other water heater measures included in the TRM V3.0, the Evaluators recommend that in the next update a procedure be included to convert Thermal Efficiency to Energy Factor as a function of efficiency rating and tank size. This was completed in our analysis of 2013 residential water heating programs for all Arkansas natural gas utilities, and typically it was found that these units had an effective EF of .78. Sections affected:
- 2.3.1 Water Heater Replacements Correct errors for Steam Trap Replacement. The Evaluators found errors in
the Steam Trap Replacement measure in TRM V3.0. Needed changes include: - Replacing Equivalent Full Load Hours with Hours of Pressurization in
Equation 96 and Equation 97. - Correcting Table 191 to impose an assumed leakage de-rating. Steam
traps rarely fail in the full open position; therefore, Table 191 overstates the impact of a failed open trap for a given orifice size.
- Include language allowing for custom hours of operation (e.g., system pressurized hours), in a manner similar to the update to the Commercial Boiler section.
Sections affected: - 3.1.17 Steam Trap Replacement
APSC FILED Time: 3/26/2014 2:23:55 PM: Recvd 3/26/2014 2:04:55 PM: Docket 07-078-TF-Doc. 185
Appendix A: Site Reports 12-1
12. Appendix A: Site Reports This appendix contains the individual site reports for C&I Solutions.
APSC FILED Time: 3/26/2014 2:23:55 PM: Recvd 3/26/2014 2:04:55 PM: Docket 07-078-TF-Doc. 185

2013 SourceGas DSM Portfolio Final Evaluation Report
Appendix A: Site Reports 12-2
Program C&I Solutions
Project ID SGA-CIS2013-001
Project Background
The participant is a manufacturing facility that received incentives from SourceGas for installing condensing radiant heaters in the facility’s shipping and receiving area. The condensing infrared heaters are controlled by slider thermostats. The existing system included:
(1) 2,640,00 Btu/hr gas-fired convection unit heater (1) 400,000 Btu/hr gas-fired convection unit heater (1) 360,000 Btu/hr CoRayVac IR heater
In addition, the baseline system included two non-operating heaters:
(1) 2,640,000 Btu/hr gas-fired unit heater (broken for over three years) (1) 400,000 Btu/hr gas-fired unit heater (broken since 2011)
Baseline Specification The baseline was calculated using data from the 2011-2012 heating season, after the 400,000 Btu/hr gas-fired unit heater failed. Billing data for the facility was obtained and correlated to HDD values for Springdale, AR. This data is summarized in the table below.
Year Month Ccf # Days HDD HDD/Day Ccf/Day 2011 October 38,990 31 251.4 8.11 1,257.74 2011 November 40,150 30 444.8 14.83 1,338.33 2011 December 49,280 31 759.8 253.54 1,589.68 2012 January 49,540 31 708.4 22.85 1,598.06 2012 February 47,110 29 597.4 20.60 1,624.48 2012 March 41,840 31 243.4 7.85 1,349.68
The correlation between HDD/Day and Ccf/Day for the baseline condition is summarized in the figure below.
APSC FILED Time: 3/26/2014 2:23:55 PM: Recvd 3/26/2014 2:04:55 PM: Docket 07-078-TF-Doc. 185
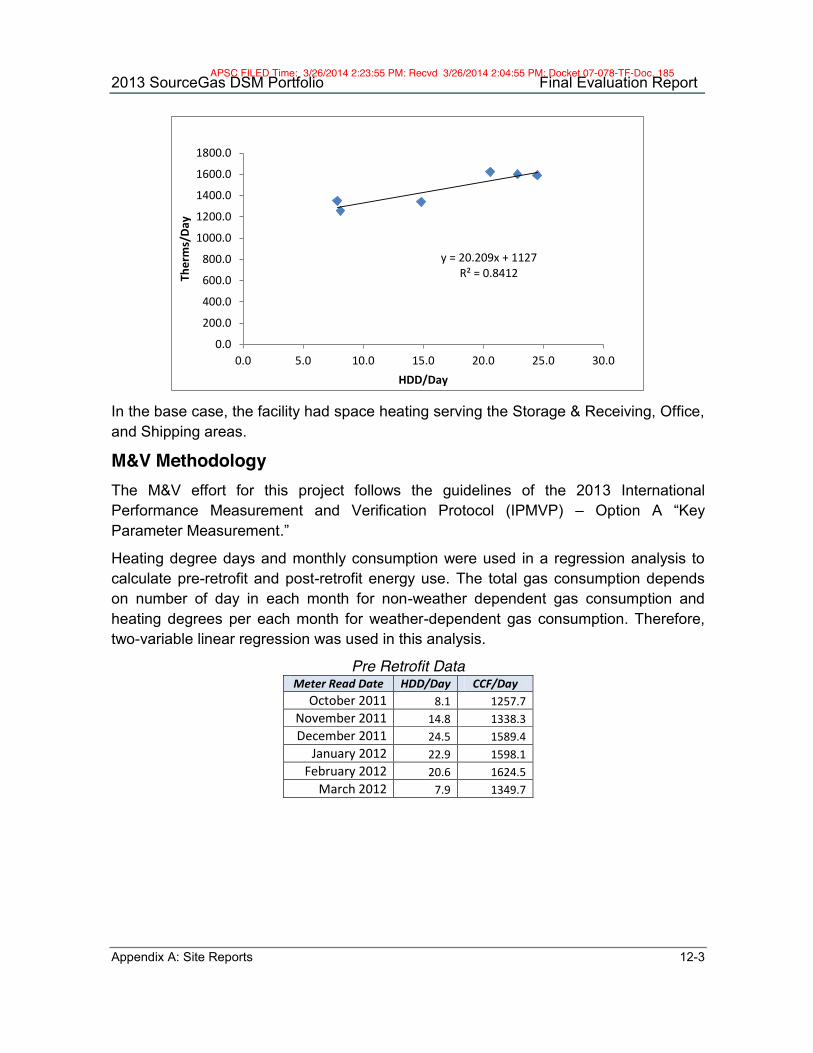
2013 SourceGas DSM Portfolio Final Evaluation Report
Appendix A: Site Reports 12-3
In the base case, the facility had space heating serving the Storage & Receiving, Office, and Shipping areas. M&V Methodology The M&V effort for this project follows the guidelines of the 2013 International Performance Measurement and Verification Protocol (IPMVP) – Option A “Key Parameter Measurement.”
Heating degree days and monthly consumption were used in a regression analysis to calculate pre-retrofit and post-retrofit energy use. The total gas consumption depends on number of day in each month for non-weather dependent gas consumption and heating degrees per each month for weather-dependent gas consumption. Therefore, two-variable linear regression was used in this analysis.
Pre Retrofit Data Meter Read Date HDD/Day CCF/Day
October 2011 8.1 1257.7 November 2011 14.8 1338.3 December 2011 24.5 1589.4
January 2012 22.9 1598.1 February 2012 20.6 1624.5
March 2012 7.9 1349.7
y = 20.209x + 1127 R² = 0.8412
0.0
200.0
400.0
600.0
800.0
1000.0
1200.0
1400.0
1600.0
1800.0
0.0 5.0 10.0 15.0 20.0 25.0 30.0
The
rms/
Day
HDD/Day
APSC FILED Time: 3/26/2014 2:23:55 PM: Recvd 3/26/2014 2:04:55 PM: Docket 07-078-TF-Doc. 185

2013 SourceGas DSM Portfolio Final Evaluation Report
Appendix A: Site Reports 12-4
Post Retrofit Data Meter Read Date HDD/Day CCF/Day
3/1/2013 35.4 401.74 3/2/2013 35.4 363.28 3/3/2013 24.7 289.96 3/4/2013 11.9 118.44 3/5/2013 26.5 292.25 3/6/2013 29.8 308.41 3/7/2013 16.1 216.59 3/8/2013 12.1 174.12 3/9/2013 6.9 66.4
3/10/2013 20.4 202.28 3/11/2013 30.1 218.8 3/12/2013 20.9 159.18 3/13/2013 25.6 191.66
Pre and post retrofit regression values are displayed in the table below. Savings Values
m1 m2 HDD TMY3 Pre-Retrofit 20.209 1,127 3,764.46 Post-Retrofit 9.392 17.302
The baseline model is translated to an annual consumption value as follows:
1) The pre-retrofit coefficient for HDD (20.209) is multiplied by Springdale HDD to obtain total BTU of heating load:
20.209 x 3,764.46 x 100,000 BTU/Therm = 7,534,961,057 (differences attributable to rounding of coefficients)
2) This is divided by the capacity of the buildings pre-retrofit heating system to obtain baseline EFLH
7,534,961,057 / 5,250,000 = 1435.23 EFLH
3) Baseline Therms = 1435.23 * Shipping Area Capacity (3,400,000 BTU) / 100,000 = 48,798 Therms
Post retrofit consumption is calculated as follows:
1) Number of heating season days is identified based on facility staff interviews (182 annually).
2) Extrapolation of the post-retrofit model to annual consumption is:
.9392 x 3,764.46 HDD + 17.302 x 182 = 38,505 Therms
Annual Savings = 48,798 Baseline Therms – 38,505 Post-Retrofit Therms =
10,293 Therms
APSC FILED Time: 3/26/2014 2:23:55 PM: Recvd 3/26/2014 2:04:55 PM: Docket 07-078-TF-Doc. 185

2013 SourceGas DSM Portfolio Final Evaluation Report
Appendix A: Site Reports 12-5
Measure Life The EUL of this measure is 20 years. Source: DEER 2008
Savings Results The resulting values from the equations above and subsequent Therm savings are presented in the table below.
Expected
Savings (Therm) Realized Savings
(Therm) Realization Rate
10,293 10,293 100%
Uncertainty The Evaluators conducted a propagation of uncertainty analysis for this project. The parameters and their uncertainty are summarized in the table below.
Parameter Uncertainty Sigma Model Error +/- 14.18% 5,286
The errors were propagated as follows:
𝑃𝑟𝑜𝑝𝑜𝑔𝑎𝑡𝑒𝑑 𝐸𝑟𝑟𝑜𝑟 = (𝜎 ) = 5,286
With this propagated error, the savings estimate for this project as overall uncertainty of:
𝑈𝑛𝑐𝑒𝑟𝑡𝑎𝑖𝑛𝑡𝑦 = 5,28610,293 = 51.3%
Measure Cost, Incentive, & Payback The Evaluators reviewed the invoices associated with this project and verified an incremental cost of $14,400. Measure payback is summarized in the table below.
Annual Therms Savings
Cost per Therm
Annual Energy Cost
Savings
Incremental Cost
Base Incentive
Adjusted Incentive
Payback W/Incentive
Payback W/o
Incentive 10,293 $.53 $5,455 $14,400 $8,234 $8,234 1.14 Years 2.63 Years
APSC FILED Time: 3/26/2014 2:23:55 PM: Recvd 3/26/2014 2:04:55 PM: Docket 07-078-TF-Doc. 185

2013 SourceGas DSM Portfolio Final Evaluation Report
Appendix A: Site Reports 12-6
Project Number SGA-CIS2013-003 Program C&I Solutions
Project Background The participant is a food processing plant that received incentives from SourceGas for installing 1.0” fiberglass pipe insulation on 64.5’ of steam lines and nine steam and condensate valves as well as one feedwater tank. The scope of the project was verified through review of invoices and on-site inspection. The project scope is detailed in the tables below.
Bare Pipes Insulated Pipe Length Pipe Diameter Temperature (°F)
.5’ 1” 221.5 64’ 2” 170.1
Cylindrical Tanks Insulated
Section Diameter Length Surface Area Temperature (°F) Feedwater Tank 3.50’ 8.00’ 107.21 ft.2 175.0
Valves Insulated
Total Equivalent Length of Valves
Valve Line Size (inches) Temperature (°F)
2.5’ 1.0” 221.5 24.0’ 2.0” 170.1
The steam and hot water pipes insulated at the facility provide steam for manufacturing processes. The lines are located indoors in a facility kept at an average ambient temperature of 75°F. To verify surface temperatures, ADM staff took temperature measurements at insulated areas of pipe, scheduled for installation as part of a planned second phase of insulation. The tested pipes were served by the same boiler and set to the same steam pressure. Based upon the production schedule provided by the facility, the Evaluators determined annual operation of 8,760 hours per year.
M&V Methodology The M&V effort for this project follows the guidelines of the 2012 International Performance Measurement and Verification Protocol (IPMVP) – Option A “Retrofit Isolation: Key Parameter Measurement.”
During the site visit, ADM staff verified installation of the insulation, as well as pipe diameter and lengths associated with each diameter of pipe. Heat loss in the pre- and post- conditions were calculated as follows:
APSC FILED Time: 3/26/2014 2:23:55 PM: Recvd 3/26/2014 2:04:55 PM: Docket 07-078-TF-Doc. 185

2013 SourceGas DSM Portfolio Final Evaluation Report
Appendix A: Site Reports 12-7
Heat Loss (Pre-Retrofit)
𝑄 = 2𝜋𝐿(𝑇 − 𝑇 )1
𝑟𝑏 × ℎ𝑏
Where,
L = Length of pipe
To = Ambient air temperature (75°F)
Ti = Surface temperature of the pipe. The pipes are thin walled so the surface temperature is assumed to be the same as the temperature of steam.
rb = Outer radius of pipe
hb = Air film values derived from ASHREA 2009 23.17 Table 15
Heat Loss (Post-Retrofit)
𝑄 = 2𝜋𝐿(𝑇 − 𝑇 )1𝑙𝑛 𝑟𝑐
𝑟𝑏𝑘 𝑖𝑛𝑠𝑢𝑙𝑎𝑡𝑖𝑜𝑛 +
1𝑟𝑐 × ℎ𝑐
Where,
rc = Outside radius of the insulation
k insulation = thermal conductivity of insulation
hc = Air film value
Data Collection Procedures Data used in calculating savings with this project were collected as follows:
Length & diameter of pipe: physical inspection where visible and review of building schematics where not visible.
Ambient air temperature: facility setpoint Boiler efficiency: average of measurements at varying firing rates taken
with a Portable Combustion Analyzer (found to be 82%) Surface temperature of pipes: collected with an infrared temperature
thermometer. Air film values: derived from ASHREA 2009 23.17 Table 15 Annual operating hours of steam system: derived from facility interviews to
determine factory schedule
Calculated Savings:
APSC FILED Time: 3/26/2014 2:23:55 PM: Recvd 3/26/2014 2:04:55 PM: Docket 07-078-TF-Doc. 185

2013 SourceGas DSM Portfolio Final Evaluation Report
Appendix A: Site Reports 12-8
𝑇ℎ𝑒𝑟𝑚𝑠 𝑆𝑎𝑣𝑖𝑛𝑔𝑠 = 𝑄 − 𝑄 × 𝐻𝑜𝑢𝑟𝑠 𝑜𝑓 𝑂𝑝𝑒𝑟𝑎𝑡𝑖𝑜𝑛 𝐸𝑓𝑓𝑖𝑐𝑖𝑒𝑛𝑐𝑦⁄ 100,000𝐵𝑇𝑈 𝑇ℎ𝑒𝑟𝑚⁄
Measure Life The EUL of this measure is 20 years.
Source: California DEER 2008
Savings Results The resulting Q values from the equation above and subsequent Therms savings are presented in the table below.
Insulated Pipe Savings
Pipe Length Pipe Diameter Qpre Qpost Therms Savings .5’ 1” 131.5 23.26 3.73 64’ 2” 129.5 21.58 475.77
Insulated Cylindrical Tank Savings Section Surface
Area Qpre Qpost Therms Savings
Feedwater Tank 107.21 ft.2 196.2 14.02 1,345.37
Insulated Valves Savings Total Equivalent Length of Valves
Valve Line Size (inches) Qpre Qpost
Therms Savings
2.5’ 1.0” 131.5 23.26 18.64 24.0’ 2.0” 129.6 21.6 178.55
Overall, this leads to savings of:
2,022 Annual Therms 5.54 Peak Therms (annual divided by 365) 40,441 Lifetime Therms
Uncertainty The Evaluators conducted a propagation of uncertainty analysis for this project. The parameters and their uncertainty are summarized in the table below.
APSC FILED Time: 3/26/2014 2:23:55 PM: Recvd 3/26/2014 2:04:55 PM: Docket 07-078-TF-Doc. 185

2013 SourceGas DSM Portfolio Final Evaluation Report
Appendix A: Site Reports 12-9
Uncertainty Parameters Parameter Value Uncertainty Sigma
Hours of Operation 8,760 0% 0 Steam Temperature Mixed +/- 5 deg. F 101
Ambient Temperature 82 +/- 5 deg. F 61 Boiler Efficiency 85% +/- 3% 151
The errors were then propagated as follows:
𝑃𝑟𝑜𝑝𝑜𝑔𝑎𝑡𝑒𝑑 𝐸𝑟𝑟𝑜𝑟 = (𝜎 ) + (𝜎 ) + (𝜎 .) + 𝜎 . = 191.6
With this propagated error, the savings estimate for this project as overall uncertainty of:
𝑈𝑛𝑐𝑒𝑟𝑡𝑎𝑖𝑛𝑡𝑦 = 191.62,022 = 9.5%
Measure Cost, Incentive, & Payback The Evaluators reviewed the invoices associated with this project and verified an incremental cost of $1,433. Measure payback is summarized in the table below.
Annual Therms Savings
Cost per Therm
Annual Energy Cost
Savings
Incremental Cost
Base Incentive
Adjusted Incentive
Payback W/Incentive
Payback W/o
Incentive 2,022 $.501 $1,013.02 $1,433 $1,617.60 $1,433 0.0 Years 1.41 Years
APSC FILED Time: 3/26/2014 2:23:55 PM: Recvd 3/26/2014 2:04:55 PM: Docket 07-078-TF-Doc. 185

2013 SourceGas DSM Portfolio Final Evaluation Report
Appendix A: Site Reports 12-10
Program C&I Solutions
Project ID SGA-CIS2013-004
Project Background The participant is a large hospital that received incentives from SourceGas for installing linkless controls and new burners on their primary two boilers. This project originated from a facility audit performed by CLEAResult in April 2012. This audit listed the following recommendations:
ECM #1: Linkless controls & burner retrofit on the primary and secondary boilers.
The facility is served by two 10.5 MMBtu/hr boilers, with one 5.23 MMBtu/hr boiler serving as a redundant back-up in case of failure of the primary unit (as required under Arkansas state law). The boilers are responsible for space heating, domestic hot water, as well as for providing steam for sterilization processes, and are responsible for all gas consumption at the facility. The facility has a third boiler which is used when Boiler #1 or Boiler #2 is being serviced. Boiler #3 accounts for 10% of the consumption between March and May. The facility operates 24/7, 365 days per year.
Baseline The facility was operating with obsolete controls. However, the boilers were fully functional with the preexisting controls and burners. As such, this project is defined as “Early Replacement”, with the baseline defined by the measured efficiency of the pre-retrofit system. The baseline combustion efficiency measurements were taken by the CLEAResult. The Evaluators examined the combustion efficiency test records to ensure accurate baseline characterization by CLEAResult.
M&V Methodology The M&V effort for this project follows the guidelines of the 2013 International Performance Measurement and Verification Protocol (IPMVP) – Option A “Key Parameter Measurement.”
The Evaluators approach to estimating savings for this project was as follows:
Facility bills were collected for a one-year pre-retrofit period. This data was obtained in a data request to SourceGas.
The portion of the bills attributable to the boiler was set at 94%, with the monthly bills scaled to this value.
Therms/day over each billing period was regressed against Heating Degree Days. Heating Degree Days were pulled from www.degreedays.net, which aggregated data
APSC FILED Time: 3/26/2014 2:23:55 PM: Recvd 3/26/2014 2:04:55 PM: Docket 07-078-TF-Doc. 185

2013 SourceGas DSM Portfolio Final Evaluation Report
Appendix A: Site Reports 12-11
from www.wunderground.com. Weather data was recorded at Northwest Arkansas Airport (station ID: KJBR).
From this regression, typical year baseload was estimated by multiplying the model intercept term by the number of days per month.
The evaluators then calculated typical year HDD based on a TMY3 dataset for Fayetteville AR.
Typical-year space heating Therms were calculated by applying monthly HDD from the TMY3 dataset and multiplying this by the coefficient for HDD from the regression model as well as the number of days per month. This was summed with monthly baseload to provide monthly estimates of typical-year baseline consumption.
An average monthly firing rate was estimated by calculating the average MMBTU/hr divided by the boiler’s rated capacity.
Based on this firing rate, pre- and post-retrofit combustion efficiency values for low, medium, and high fire were applied on a month-by-month basis as appropriate, with the difference between this value and typical year baseline consumption being the annual savings.
Facility Regression Model
The table below contains the facility’s billed use, boiler Therm consumption per day, and HDD over the examined billing period.
Facility Billing & Weather Data Billing Start Date N Days HDD Billed Use Boiler Use Boiler
Therms/Day 1/1/11 31 981 77,279 77,279 2,493 2/1/11 28 723 65,667 65,667 2,345 3/1/11 31 486 57,173 51,456 1,660 4/1/11 30 204 47,787 43,008 1,434 5/1/11 31 158 43,102 38,792 1,251 6/1/11 30 0 43,591 43,591 1,453 7/1/11 31 0 44,792 44,792 1,445 8/1/11 31 0 44,827 44,827 1,446 9/1/11 30 121 45,053 45,053 1,502
10/1/11 31 251 53,775 53,775 1,735 11/1/11 30 445 62,916 62,916 2,097 12/1/11 31 760 75,399 75,399 2,432
The Evaluators then conducted the regression of Therms/Day against HDD. This is demonstrated in the scatterplot below.
APSC FILED Time: 3/26/2014 2:23:55 PM: Recvd 3/26/2014 2:04:55 PM: Docket 07-078-TF-Doc. 185
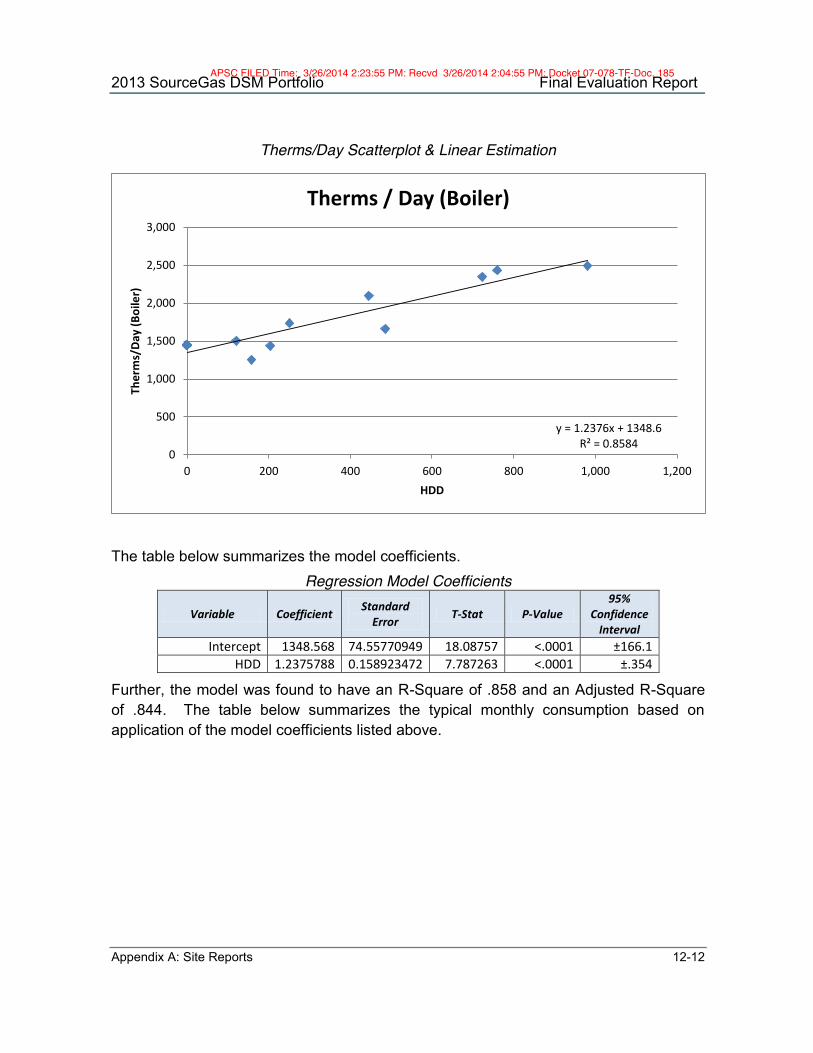
2013 SourceGas DSM Portfolio Final Evaluation Report
Appendix A: Site Reports 12-12
Therms/Day Scatterplot & Linear Estimation
The table below summarizes the model coefficients. Regression Model Coefficients
Variable Coefficient Standard Error T-Stat P-Value
95% Confidence
Interval Intercept 1348.568 74.55770949 18.08757 <.0001 ±166.1
HDD 1.2375788 0.158923472 7.787263 <.0001 ±.354
Further, the model was found to have an R-Square of .858 and an Adjusted R-Square of .844. The table below summarizes the typical monthly consumption based on application of the model coefficients listed above.
y = 1.2376x + 1348.6 R² = 0.8584
0
500
1,000
1,500
2,000
2,500
3,000
0 200 400 600 800 1,000 1,200
The
rms/
Day
(B
oile
r)
HDD
Therms / Day (Boiler)
APSC FILED Time: 3/26/2014 2:23:55 PM: Recvd 3/26/2014 2:04:55 PM: Docket 07-078-TF-Doc. 185

2013 SourceGas DSM Portfolio Final Evaluation Report
Appendix A: Site Reports 12-13
Regression Model TMY Extrapolation
Month N Days TMY3 HDD Baseload TMY HVAC
Load
Baseline Consumption
Boiler#1
Baseline Consumption
Boiler#2 January 31 956.1 42,510 36,309 39,409 39,409 February 28 685.2 38,396 25,449 31,922 31,922 March 31 506.8 42,510 20,937 31,723 31,723 April 30 209.9 41,138 10,545 25,842 25,842 May 31 111.9 42,510 3,464 22,987 22,987 June 30 38.8 41,138 264 20,701 20,701 July 31 2.9 42,510 - 21,255 21,255 August 31 0.5 42,510 39 21,274 21,274 September 30 73.9 41,138 1,845 21,492 21,492 October 31 266.6 42,510 11,091 26,800 26,800 November 30 522.6 41,138 21,166 31,152 31,152 December 31 827.2 42,510 34,208 38,359 38,359
Boiler Combustion Efficiency
Pre- and post-retrofit combustion efficiency tests were taken at Low, Medium, and High Fire. The combustion efficiency tests were performed by the installing contractor (who also provides the facility’s boiler maintenance services). The combustion analyzer readings were provided to the Evaluators, and are listed in the table below.
Combustion Efficiency Test Results
Measurement Pre-
Retrofit Boiler #1
Post-Retrofit
Boiler #1
Pre-Retrofit
Boiler #2
Post-Retrofit
Boiler #2 Low Fire 80.8% 83.6% 80.5% 83.9% Medium Fire 81.1% 83.9% 81.5% 84.2% High Fire 81.1% 83.7% 81.5% 84.2%
These values were applied on a month-by-month basis based on average MMBTU/hr divided by boiler capacity. The month was then identified as a Low Fire, Medium Fire, or High Fire month with the following criteria:
High Fire: > 70% Medium Fire >40%, ≤ 70% Low Fire: ≤ 40%
APSC FILED Time: 3/26/2014 2:23:55 PM: Recvd 3/26/2014 2:04:55 PM: Docket 07-078-TF-Doc. 185
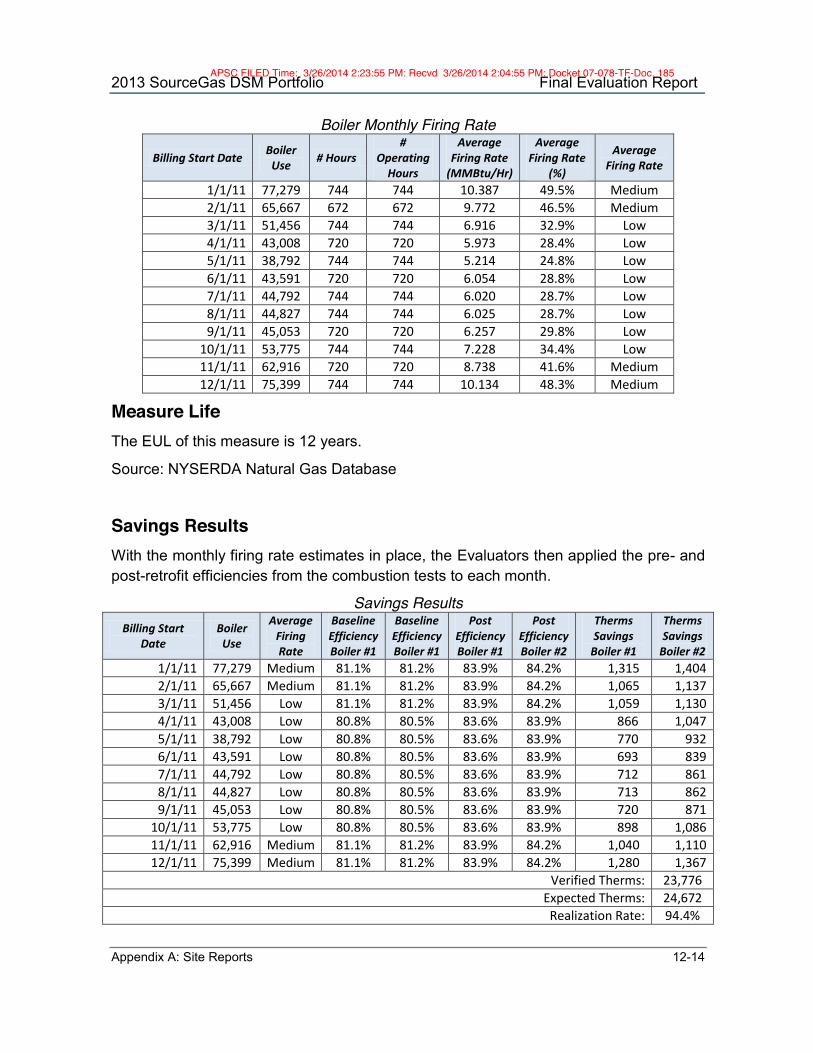
2013 SourceGas DSM Portfolio Final Evaluation Report
Appendix A: Site Reports 12-14
Boiler Monthly Firing Rate
Billing Start Date Boiler Use # Hours
# Operating
Hours
Average Firing Rate
(MMBtu/Hr)
Average Firing Rate
(%)
Average Firing Rate
1/1/11 77,279 744 744 10.387 49.5% Medium 2/1/11 65,667 672 672 9.772 46.5% Medium 3/1/11 51,456 744 744 6.916 32.9% Low 4/1/11 43,008 720 720 5.973 28.4% Low 5/1/11 38,792 744 744 5.214 24.8% Low 6/1/11 43,591 720 720 6.054 28.8% Low 7/1/11 44,792 744 744 6.020 28.7% Low 8/1/11 44,827 744 744 6.025 28.7% Low 9/1/11 45,053 720 720 6.257 29.8% Low
10/1/11 53,775 744 744 7.228 34.4% Low 11/1/11 62,916 720 720 8.738 41.6% Medium 12/1/11 75,399 744 744 10.134 48.3% Medium
Measure Life The EUL of this measure is 12 years.
Source: NYSERDA Natural Gas Database
Savings Results With the monthly firing rate estimates in place, the Evaluators then applied the pre- and post-retrofit efficiencies from the combustion tests to each month.
Savings Results Billing Start
Date Boiler Use
Average Firing Rate
Baseline Efficiency Boiler #1
Baseline Efficiency Boiler #1
Post Efficiency Boiler #1
Post Efficiency Boiler #2
Therms Savings
Boiler #1
Therms Savings
Boiler #2 1/1/11 77,279 Medium 81.1% 81.2% 83.9% 84.2% 1,315 1,404 2/1/11 65,667 Medium 81.1% 81.2% 83.9% 84.2% 1,065 1,137 3/1/11 51,456 Low 81.1% 81.2% 83.9% 84.2% 1,059 1,130 4/1/11 43,008 Low 80.8% 80.5% 83.6% 83.9% 866 1,047 5/1/11 38,792 Low 80.8% 80.5% 83.6% 83.9% 770 932 6/1/11 43,591 Low 80.8% 80.5% 83.6% 83.9% 693 839 7/1/11 44,792 Low 80.8% 80.5% 83.6% 83.9% 712 861 8/1/11 44,827 Low 80.8% 80.5% 83.6% 83.9% 713 862 9/1/11 45,053 Low 80.8% 80.5% 83.6% 83.9% 720 871
10/1/11 53,775 Low 80.8% 80.5% 83.6% 83.9% 898 1,086 11/1/11 62,916 Medium 81.1% 81.2% 83.9% 84.2% 1,040 1,110 12/1/11 75,399 Medium 81.1% 81.2% 83.9% 84.2% 1,280 1,367
Verified Therms: 23,776 Expected Therms: 24,672 Realization Rate: 94.4%
APSC FILED Time: 3/26/2014 2:23:55 PM: Recvd 3/26/2014 2:04:55 PM: Docket 07-078-TF-Doc. 185

2013 SourceGas DSM Portfolio Final Evaluation Report
Appendix A: Site Reports 12-15
Savings differed from ex ante calculations for two reasons:
1. CLEAResult initially applied combustion efficiencies based on readings of %oxygen, stack temperature, and boiler room temperature. This estimates had a wider difference in baseline and post-retrofit efficiency. The evaluators opted instead to use the direct combustion efficiency % readings from the boiler tests. This reduced savings from initial estimates.
2. CLEAResult did not weather-normalize their savings estimates. The analysis provided by CLEAResult was based on actual 2012 weather and was not normalized to TMY3 weather. The evaluators did so, and this increased savings. This impact was not as great in magnitude as the revision in applied efficiencies however, so overall savings decreased from ex ante estimates.
Uncertainty The Evaluators conducted a propagation of uncertainty analysis for this project. The parameters and their uncertainty are summarized in the table below.
Uncertainty Parameters Parameter Value Uncertainty Sigma
Annual HDD 4,166 ± 10% 577 Boiler Efficiency 84.2% +/- 3% 5,719
The errors were propagated as follows:
𝑷𝒓𝒐𝒑𝒐𝒈𝒂𝒕𝒆𝒅 𝑬𝒓𝒓𝒐𝒓 = (𝝈𝑯𝑫𝑫)𝟐 + 𝝈𝑬𝒇𝒇𝒊𝒄𝒊𝒆𝒏𝒄𝒚𝟐 = 𝟓, 𝟕𝟒𝟖
With this propagated error, the savings estimate for this project as overall uncertainty of:
𝑼𝒏𝒄𝒆𝒓𝒕𝒂𝒊𝒏𝒕𝒚 = 𝟓, 𝟕𝟒𝟖𝟐𝟑, 𝟕𝟕𝟔 = 𝟐𝟒. 𝟐%
Measure Cost, Incentive, & Payback The Evaluators reviewed the invoices associated with this project and verified an incremental cost of $76,904. Measure payback is summarized in the table below.
Annual Therms Savings
Cost per Therm
Annual Energy Cost
Savings
Incremental Cost
Base Incentive
Adjusted Incentive
Payback W/Incentive
Payback W/o
Incentive 23,776 $.60 $14,265.60 $76,904 $19,020.80 $19,020.80 4.05 years 5.40 years
APSC FILED Time: 3/26/2014 2:23:55 PM: Recvd 3/26/2014 2:04:55 PM: Docket 07-078-TF-Doc. 185

2013 SourceGas DSM Portfolio Final Evaluation Report
Appendix A: Site Reports 12-16
Program C&I Solutions
Project ID SGA-CIS2013-005
Project Background The participant is an industrial facility that received incentives from SourceGas for improvements to a series of glass melting furnaces used in a manufacturing process.
The facility uses 36 furnaces for melting glass in the spinning process of their operation. Glass is melted in the furnace and then feeds through a 304-hole bushing liner, producing fibers of molten glass that are spun and sprayed with resin to produce fibers that are eventually used in the final product.
The centerline of the glass feed to the centerline of the bushing was increased from 14.75” to 18.75” giving 27% more heating area and reducing processing time. By increasing this length to 18.75”, the number of holes can be increased to 380 within virtually the same surface area that previously contained 304 holes; thus, the bushing size is essentially the same. This is intended to increase the throughput of the furnaces, thereby increasing production efficiency.
Other improvements made as part of this project include replacing furnace liners, updating gas and furnace controls, and installation of gas meters for monitoring furnace consumption.
These improvements are also intended to reduce the amount of time the glass has to remain in the furnace, which reduces the amount of Therms per pound of glass.
This was Phase I of this facility’s furnace retrofit, with 12 furnaces upgraded. The furnaces are wired to a control system in groups of six, and as such the installation of this improvement is being phased in by each controlled group (with this phase constituting Group A and Group B). All furnaces were verified as identical in the baseline configuration.
Baseline In the baseline condition, there were not in-line gas meters in place. There were ports through which gas consumption could be metered with a diaphragm gas meter. A sampling plan was developed by the Evaluators to meet 80% confidence and 20% precision and as carried out by CLEAResult, through which five glass furnaces received pre-installation metering using an American Meter AL425. Each of the five furnaces selected for baseline metering had daily consumption and production data collected for seven to eight days.
APSC FILED Time: 3/26/2014 2:23:55 PM: Recvd 3/26/2014 2:04:55 PM: Docket 07-078-TF-Doc. 185

2013 SourceGas DSM Portfolio Final Evaluation Report
Appendix A: Site Reports 12-17
M&V Methodology The M&V effort for this project follows the guidelines of the 2013 International Performance Measurement and Verification Protocol (IPMVP) – Option B “Retrofit Isolation”.
The Evaluators approach to estimating savings for this project was as follows:
After the baseline monitoring period was completed, average Therms/lb. for each fiberglass spinning furnace was calculated.
The coefficient of variation was then calculated. The normal distribution value was obtained, using an 80% confidence level. The required sample was then calculated as:
𝑆𝑎𝑚𝑝𝑙𝑒 = ∗
Where z = standard normal distribution, CV = coefficient of variation, and RP = required precision.
Average Therms/lb. was found for the baseline and post condition (6.34 and 4.84 Therms/lb., respectively).
This difference was then extrapolated to the annual production of all 12 retrofitted furnaces.
One of the five sample points was unavailable for post-metering due to an equipment breakdown. However, based on assessment of the CV of the remaining four, the sample of four sufficed for pre-post analysis.
Baseline Metering Results
26-Jul 714 33 690 162127-Jul 742 91 752 1578 24.47 5800 869 6.67 35.528-Jul 725 147 700 1626 23.72 5600 878 6.38 37.029-Jul 752 208 620 1601 24.45 6100 1006 6.06 41.130-Jul 815 268 647 1554 24.38 6000 954 6.29 39.131-Jul 705 324 670 1581 22.83 5600 884 6.33 38.71-Aug 800 383 683 1582 24.92 5900 898 6.57 36.02-Aug 750 442 661 1560 23.83 5900 921 6.41 38.6Avgs 24.09 5843 915.7 6.39 38.0
Start Hopper Weight
(lbs)
End Hopper Weight
(lbs)
Drum
2
Time (military)
Date Gas (cfx100)Glass
Thruput (lbs/hr)
(cf/lb)
Delta Glass
Weight (lbs)
Delta Gas (cf)Delta
Time (hrs)
APSC FILED Time: 3/26/2014 2:23:55 PM: Recvd 3/26/2014 2:04:55 PM: Docket 07-078-TF-Doc. 185

2013 SourceGas DSM Portfolio Final Evaluation Report
Appendix A: Site Reports 12-18
These five metered furnaces had average consumption of 6.34 CF /lb. of glass produced and 38.47 lbs. produced per hour.
26-Jul 715 3408 1110 160227-Jul 724 3468 610 1577 24.15 6000 992 6.05 41.128-Jul 824 3529 577 1622 25 6100 1000 6.10 40.029-Jul 716 3583 718 1528 22.87 5400 904 5.97 39.530-Jul 913 3646 546 1553 25.95 6300 982 6.42 37.831-Jul 739 3704 574 1575 22.43 5800 979 5.92 43.61-Aug 755 3763 634 1627 24.27 5900 941 6.27 38.82-Aug 814 3819 689 1610 24.32 5600 938 5.97 38.6Avgs 24.14 5871 962.3 6.10 39.9
Delta Time (hrs)
Delta Gas (cf)
Delta Glass
Weight (lbs)
(cf/lb)Glass
Thruput (lbs/hr)
DateTime
(military)Gas (cfx100)
End Hopper Weight
(lbs)
Start Hopper Weight
(lbs)
Drum
3
26-Jul 717 37 1076 160727-Jul 731 99 641 1549 24.23 6200 966 6.42 39.928-Jul 828 161 611 1563 24.95 6200 938 6.61 37.629-Jul 709 218 616 1569 22.68 5700 947 6.02 41.830-Jul 900 283 483 1568 25.85 6500 1086 5.99 42.031-Jul 749 341 620 1583 22.82 5800 948 6.12 41.51-Aug 800 398 710 1565 24.18 5700 873 6.53 36.12-Aug 816 459 729 1572 24.27 6100 836 7.30 34.4Avgs 24.14 6029 942.0 6.43 39.0
Delta Time (hrs)
Delta Gas (cf)
Delta Glass
Weight (lbs)
(cf/lb)Glass
Thruput (lbs/hr)
DateTime
(military)Gas (cfx100)
End Hopper Weight
(lbs)
Start Hopper Weight
(lbs)
Drum
7
12-Sep 750 2679 748 159913-Sep 1000 2740 668 1575 26.17 6100 931 6.55 35.614-Sep 755 2792 802 1546 21.92 5200 773 6.73 35.315-Sep 840 2852 673 1575 24.75 6000 873 6.87 35.316-Sep 735 2906 790 1623 22.92 5400 785 6.88 34.217-Sep 820 2965 778 1555 24.75 5900 845 6.98 34.118-Sep 817 3020 710 1570 23.95 5500 845 6.51 35.319-Sep 740 3081 761 1540 23.38 6100 809 7.54 34.620-Sep 945 3146 616 1544 26.08 6500 924 7.03 35.4
Avgs 24.24 5838 848.1 6.89 35.0
Delta Time (hrs)
Delta Gas (cf)
Delta Glass
Weight (lbs)
(cf/lb)Glass
Thruput (lbs/hr)
DateTime
(military)Gas (cfx100)
End Hopper Weight
(lbs)
Start Hopper Weight
(lbs)
Drum
8
13-Sep 800 2633 1203 154414-Sep 804 2690 546 1641 24.07 5700 998 5.71 41.515-Sep 740 2749 649 1630 23.6 5900 992 5.95 42.016-Sep 922 2807 608 1583 25.7 5800 1022 5.68 39.817-Sep 852 2863 645 1541 23.5 5600 938 5.97 39.918-Sep 735 2918 686 1568 22.72 5500 855 6.43 37.619-Sep 742 2974 560 1568 24.12 5600 1008 5.56 41.8
Avgs 23.95 5683 968.8 5.88 40.4
Delta Time (hrs)
Delta Gas (cf)
Delta Glass
Weight (lbs)
(cf/lb)Glass
Thruput (lbs/hr)
DateTime
(military)Gas (cfx100)
End Hopper Weight
(lbs)
Start Hopper Weight
(lbs)
Drum
33
APSC FILED Time: 3/26/2014 2:23:55 PM: Recvd 3/26/2014 2:04:55 PM: Docket 07-078-TF-Doc. 185

2013 SourceGas DSM Portfolio Final Evaluation Report
Appendix A: Site Reports 12-19
Post Metering Results
10-Dec 725 2272 552 157211-Dec 757 2318 509 1532 24.53 4600 1063 4.33 43.312-Dec 810 2364 459 1527 24.22 4600 1073 4.29 44.313-Dec 730 2407 520 1595 23.33 4300 1007 4.27 43.214-Dec 715 2450 513 1529 23.75 4300 1082 3.97 45.615-Dec 731 2498 531 1555 24.27 4800 998 4.81 41.116-Dec 755 2543 426 1527 24.4 4500 1129 3.99 46.317-Dec 802 2587 497 1561 24.12 4400 1030 4.27 42.7Avgs 24.09 4500 1054.6 4.28 43.8
Glass Thruput (lbs/hr)
Start Hopper Weight
(lbs)
Delta Time (hrs)
Delta Gas (cf)
Delta Glass
Weight (lbs)
(cf/lb)
Drum
2
DateTime
(military)Gas
(cfx100)
End Hopper Weight
(lbs)
10-Dec 725 6847 530 151211-Dec 803 6902 409 1524 24.63 5500 1103 4.99 44.812-Dec 810 6957 422 1539 24.12 5500 1102 4.99 45.713-Dec 735 7009 513 1575 23.42 5200 1026 5.07 43.814-Dec 725 7061 528 1537 23.83 5200 1047 4.97 43.915-Dec 735 7114 468 1548 24.17 5300 1069 4.96 44.216-Dec 800 7168 426 1555 24.42 5400 1122 4.81 45.917-Dec 815 7220 524 1551 24.25 5200 1031 5.04 42.5Avgs 24.12 5329 1071.4 4.98 44.4
DateTime
(military)Gas
(cfx100)
End Hopper Weight
(lbs)
Start Hopper Weight
(lbs)
Delta Time (hrs)
Delta Gas (cf)
Delta Glass
Weight (lbs)
(cf/lb)Glass
Thruput (lbs/hr)
Drum
3
3-Jan 724 3177 616 15804-Jan 820 3232 528 1570 24.93 5500 1052 5.23 42.25-Jan 745 3284 610 1590 23.42 5200 960 5.42 41.06-Jan 745 3339 506 1575 24 5500 1084 5.07 45.27-Jan 905 3396 542 1585 25.33 5700 1033 5.52 40.8
11-Jan 805 3596 555 1539 24.3312-Jan 800 3648 549 1510 23.92 5200 990 5.25 41.413-Jan 820 3701 428 1622 24.33 5300 1082 4.90 44.514-Jan 915 3755 538 1510 24.92 5400 1084 4.98 43.515-Jan 730 3804 479 1575 22.25 4900 1031 4.75 46.3Avgs 24.14 5338 1039.5 5.14 43.1
Delta Time (hrs)
Delta Gas (cf)
Delta Glass
Weight (lbs)
(cf/lb)Glass
Thruput (lbs/hr)
DateTime
(military)Gas
(cfx100)
End Hopper Weight
(lbs)
Start Hopper Weight
(lbs)
Drum
7
APSC FILED Time: 3/26/2014 2:23:55 PM: Recvd 3/26/2014 2:04:55 PM: Docket 07-078-TF-Doc. 185
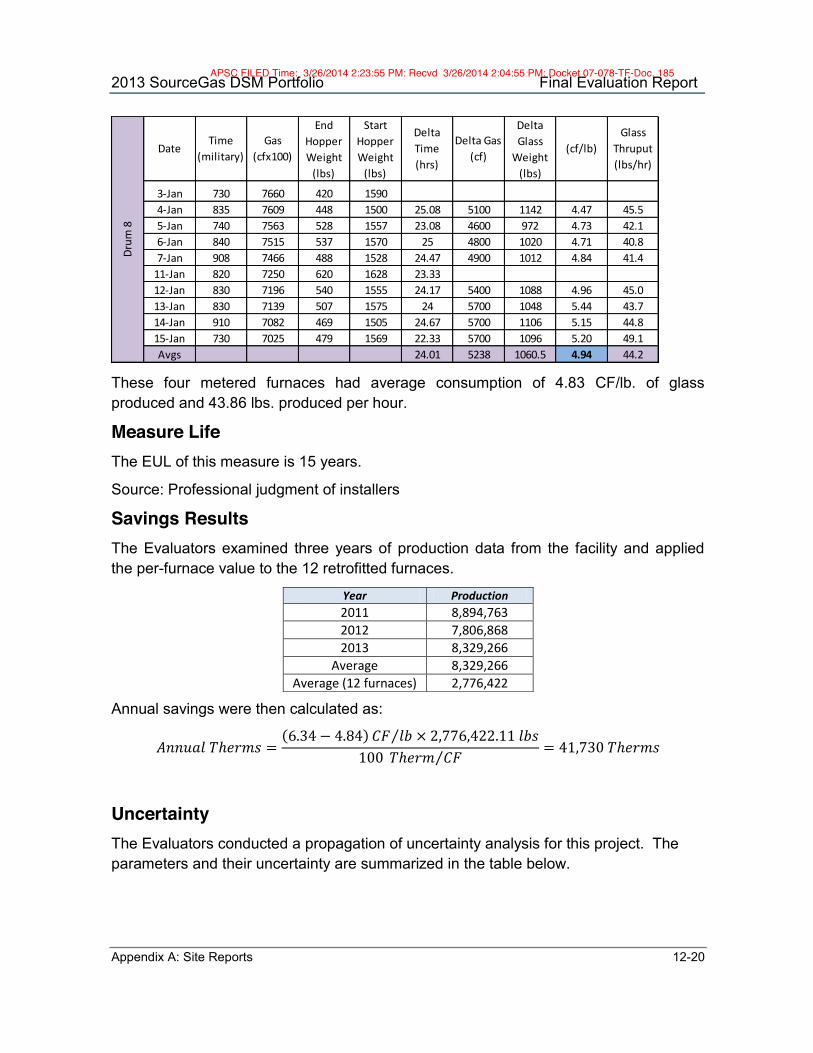
2013 SourceGas DSM Portfolio Final Evaluation Report
Appendix A: Site Reports 12-20
These four metered furnaces had average consumption of 4.83 CF/lb. of glass produced and 43.86 lbs. produced per hour.
Measure Life The EUL of this measure is 15 years.
Source: Professional judgment of installers
Savings Results The Evaluators examined three years of production data from the facility and applied the per-furnace value to the 12 retrofitted furnaces.
Year Production 2011 8,894,763 2012 7,806,868 2013 8,329,266
Average 8,329,266 Average (12 furnaces) 2,776,422
Annual savings were then calculated as:
𝐴𝑛𝑛𝑢𝑎𝑙 𝑇ℎ𝑒𝑟𝑚𝑠 = (6.34 − 4.84) 𝐶𝐹 𝑙𝑏⁄ × 2,776,422.11 𝑙𝑏𝑠100 𝑇ℎ𝑒𝑟𝑚 𝐶𝐹⁄ = 41,730 𝑇ℎ𝑒𝑟𝑚𝑠
Uncertainty The Evaluators conducted a propagation of uncertainty analysis for this project. The parameters and their uncertainty are summarized in the table below.
3-Jan 730 7660 420 15904-Jan 835 7609 448 1500 25.08 5100 1142 4.47 45.55-Jan 740 7563 528 1557 23.08 4600 972 4.73 42.16-Jan 840 7515 537 1570 25 4800 1020 4.71 40.87-Jan 908 7466 488 1528 24.47 4900 1012 4.84 41.4
11-Jan 820 7250 620 1628 23.3312-Jan 830 7196 540 1555 24.17 5400 1088 4.96 45.013-Jan 830 7139 507 1575 24 5700 1048 5.44 43.714-Jan 910 7082 469 1505 24.67 5700 1106 5.15 44.815-Jan 730 7025 479 1569 22.33 5700 1096 5.20 49.1Avgs 24.01 5238 1060.5 4.94 44.2
Delta Time (hrs)
Delta Gas (cf)
Delta Glass
Weight (lbs)
(cf/lb)Glass
Thruput (lbs/hr)
DateTime
(military)Gas
(cfx100)
End Hopper Weight
(lbs)
Start Hopper Weight
(lbs)
Drum
8
APSC FILED Time: 3/26/2014 2:23:55 PM: Recvd 3/26/2014 2:04:55 PM: Docket 07-078-TF-Doc. 185

2013 SourceGas DSM Portfolio Final Evaluation Report
Appendix A: Site Reports 12-21
Uncertainty Parameters Parameter Value Uncertainty Sigma
Annual Production 8,329,266 ± 6.01% 2,509 Baseline CF/lb. 6.34 ± 2.95% 5,503
Post CF/lb. 4.84 ± 4.66% 6,256
Uncertainty in annual production was based on the three-year history used in the analysis. The Evaluators found:
Mean of 8,329,266 lbs. Standard deviation of 565,267 lbs. CV of .0655
Based on this, the 95% confidence interval (with associated Z score of 1.85) for hours of operation was calculated as:
𝐻𝑜𝑢𝑟𝑠 𝐶𝑜𝑛𝑓𝑖𝑑𝑒𝑛𝑐𝑒 𝐼𝑛𝑡𝑒𝑟𝑣𝑎𝑙 = √12 − 3√12 × 3 ∗ .0655 ∗ 1.85 = 6.01%
The errors were propagated as follows:
𝑃𝑟𝑜𝑝𝑜𝑔𝑎𝑡𝑒𝑑 𝐸𝑟𝑟𝑜𝑟 = 𝜎 + (𝜎 ) (𝜎 ) = 8,701
With this propagated error, the savings estimate for this project as overall uncertainty of:
𝑈𝑛𝑐𝑒𝑟𝑡𝑎𝑖𝑛𝑡𝑦 = 8,70141,730 = 20.9%
Measure Cost, Incentive, & Payback The Evaluators reviewed the invoices associated with this project and verified an incremental cost of $55,933. Measure payback is summarized in the table below.
Annual Therms Savings
Cost per Therm
Annual Energy Cost
Savings
Incremental Cost
Base Incentive
Adjusted Incentive
Payback W/Incentive
Payback W/o
Incentive 41,730 $.52 $21,699.60 $55,933 $33,384 $33,384 1.04 years 2.57 years
APSC FILED Time: 3/26/2014 2:23:55 PM: Recvd 3/26/2014 2:04:55 PM: Docket 07-078-TF-Doc. 185

2013 SourceGas DSM Portfolio Final Evaluation Report
Appendix A: Site Reports 12-22
Program C&I Solutions
Project ID SGA-CIS2013-005
Project Background The participant is a manufacturing facility that received incentives from SourceGas for installing DDC controls on HVAC equipment. The scope of this project included:
Automatic monitoring and control of all replacement air units (RAUs) and variable frequency drives (VFDs).
Automatic monitoring of all trigger switches. Automatic control of zone control dampers. Automatic monitoring and control of Exhaust Fans and VFDs. Automatic monitoring and control of Grinding Booth fans and VFDs. Automatic monitoring and control of Resin Room and Resin temperature. Automatic monitoring and control of three large Air Compressors and dryer. Automatic monitoring and control of total building pressures (+/-). Automatic monitoring and control of Finish Room and Mold Prep Area roof top
unit.
In addition, the participant installed VFD drives on six (6) make-up air units (MAUs) and twenty (20) exhaust fans. The project also included three (3) new VFD drive MAUs with turndown capabilities. These units replaced five (5) existing MAUs that did not have turndown capabilities.
The new controls are designed to monitor room occupancy and ensure volatile organic compound (VOC) levels are maintained at or below permissible concentrations. The new VFDs are calibrated to reduce outside make-up air volumes whenever possible, therefore reducing the total amount of outside air that needs to be heated for production/ process ventilation. In addition, the project also included introduction of zone-by-zone temperature t-backs that are programmed into the controls based on work schedules. Lastly, the new MAUs are rated with burner efficiencies and turn-down capabilities.
The facility’s gas usage was found to be driven solely by HVAC and DHW loads, as natural gas is not used in the manufacturing process.
Baseline The facility was operating with obsolete controls. However, HVAC system was fully functional in terms of maintaining VOC levels and proper space heating temperatures. As such, this project is defined as “Early Replacement”, with the baseline defined by the measured efficiency of the pre-retrofit system.
APSC FILED Time: 3/26/2014 2:23:55 PM: Recvd 3/26/2014 2:04:55 PM: Docket 07-078-TF-Doc. 185

2013 SourceGas DSM Portfolio Final Evaluation Report
Appendix A: Site Reports 12-23
M&V Methodology The M&V effort for this project follows the guidelines of the 2013 International Performance Measurement and Verification Protocol (IPMVP) – Option C “Whole Facility”.
The Evaluators approach to estimating savings for this project was as follows:
Facility bills were collected for a 19-month pre-retrofit period. This data was obtained in a data request to SourceGas.
Therms/day over each billing period was regressed against Heating Degree Days. Heating Degree Days were pulled from www.degreedays.net, which aggregated data from www.wunderground.com. Weather data was recorded at Harrison Bonne County Airport (station ID KHRO).
From this regression, typical year baseload was estimated by multiplying the model Intercept term by the number of days per month.
The Evaluators then calculated typical year HDD based on a TMY3 dataset for Harrison AR.
Typical-year space heating Therms were calculated by applying monthly HDD from the TMY3 dataset and multiplying this by the coefficient for HDD from the regression model as well as the number of days per month. This was summed with monthly baseload to provide monthly estimates of typical-year baseline consumption.
Baseline Regression Model
The table below contains the facility’s billed use and HDD over the examined billing period.
Facility Billing & Weather Data Billing Start Date N Days HDD Billed Use CCF/Day HDD/Day
9/30/2011 31 398 42,990 1386.8 12.84 10/31/2011 30 627 50,770 1692.3 20.90 11/30/2011 31 922 52,750 1701.6 29.75 12/31/2011 31 901 70,480 2273.5 29.05 1/31/2012 29 786 61,530 2121.7 27.12 2/29/2012 31 362 31,100 1003.2 11.67 3/31/2012 30 295 25,100 836.7 9.82 4/30/2012 31 185 13,400 432.3 5.97 5/31/2012 30 6 7,450 248.3 0.21 6/30/2012 31 41 770 24.8 1.32 7/31/2012 31 138 3,880 125.2 4.46 8/31/2012 30 437 15,390 513.0 14.58 9/30/2012 31 680 42,120 1358.7 21.92 10/31/2012 30 816 56,580 1886.0 27.19
APSC FILED Time: 3/26/2014 2:23:55 PM: Recvd 3/26/2014 2:04:55 PM: Docket 07-078-TF-Doc. 185

2013 SourceGas DSM Portfolio Final Evaluation Report
Appendix A: Site Reports 12-24
11/30/2012 31 981 57,970 1870.0 31.64 12/31/2012 31 1,017 83,090 2680.3 32.79 1/31/2013 28 749 68,020 2429.3 26.76 2/28/2013 31 486 65,040 2098.1 15.68 3/31/2013 30 429 39,220 1307.3 14.25
The table below summarizes the model coefficients
Baseline Regression Model Coefficients
Variable Coefficient Standard Error T-Stat P-Value
95% Confidence
Interval Intercept 183.08 104.82 1.746 .098746 ±221.15 HDD/Day 70.107 5.21 13.44 <.0001 ±10.99
The model had an Adjusted R Square of .90.
Post Regression Model
To shorten the post-retrofit M&V period, the post model was developed using daily weather and consumption data. 37 days of data were collected. The use of the HVAC system is heavily driven by occupancy (especially in the post-retrofit condition with the new controls), and as such the post-retrofit model specification included the following additional variables:
WorkDay: a dummy variable that is 1 on days when the plant was open and 0 on days where it is not open.
HDD-WorkDay: and interactive term between the daily HDD read and the WorkDay dummy variable.
Post Regression Model Coefficients
Variable Coefficient Standard Error T-Stat P-Value
95% Confidence
Interval HDD 25.252 1.686 14.97 <.0001 ±3.426
WorkDay 379.13 196.008 1.93 .061 ±398.33 HDD-WorkDay 17.947 5.915 3.03 .004 ±12.020
The model had an Adjusted R Square of .967
The facility has an average of 247 work days. The schedule is Monday-Friday, with an average of 14 holiday shutdowns annually (including an extended shutdown between Christmas and New Year’s Day).
TMY HDD was split between work days and non-work days under the assumption that HDD is evenly distributed between the two day types (due to shutdowns being on weekends).
APSC FILED Time: 3/26/2014 2:23:55 PM: Recvd 3/26/2014 2:04:55 PM: Docket 07-078-TF-Doc. 185

2013 SourceGas DSM Portfolio Final Evaluation Report
Appendix A: Site Reports 12-25
The WorkDay variable was used in place of an intercept; the only baseload gas equipment in the plant is the DHW system, which is not used on non-production days.
Measure Life The EUL of this measure is 15 years.
Source: California DEER
Savings Results The following data were used in calculating baseline consumption:
Days: 365 (multiplied by the intercept) HDD: 5,398.77
Used in the baseline regression model, baseline consumption is 445,322 Therms annually.
The following data were used in calculating baseline consumption:
Days: 365 (multiplied by the intercept) HDD: 5,398.77 Work Days: 247 HDD on Work Days: 3653.41
Used in the baseline regression model, baseline consumption is 295,542 Therms annually.
Annual savings are:
445,321 – 295,542 = 149,780 Therms
Initially, CLEAResult had calculated savings of 173,040 Therms. The Evaluators found that their model was not accurately characterizing the post condition, in that it used the daily production level as a model input when the facility’s production processes do not use gas. The production level is highly correlated with occupancy, but it is the occupancy dummy variable that more accurately captures the drivers of HVAC use in the facility.
As a result, this project had gross realization of 86.6%.
Uncertainty The Evaluators conducted a propagation of uncertainty analysis for this project. The parameters and their uncertainty are summarized in the table below.
Uncertainty Parameters Parameter Value Uncertainty Sigma
Annual HDD 5398.77 ± 10% 17,659 Work Days 247 ± 5% 8,380
APSC FILED Time: 3/26/2014 2:23:55 PM: Recvd 3/26/2014 2:04:55 PM: Docket 07-078-TF-Doc. 185

2013 SourceGas DSM Portfolio Final Evaluation Report
Appendix A: Site Reports 12-26
The errors were propagated as follows:
𝑃𝑟𝑜𝑝𝑜𝑔𝑎𝑡𝑒𝑑 𝐸𝑟𝑟𝑜𝑟 = (𝜎 ) + 𝜎 = 19,546
With this propagated error, the savings estimate for this project as overall uncertainty of:
𝑈𝑛𝑐𝑒𝑟𝑡𝑎𝑖𝑛𝑡𝑦 = 19,546149,780 = 13.1%
Measure Cost, Incentive, & Payback The Evaluators reviewed the invoices associated with this project and verified an incremental cost of $495,045. Measure payback is summarized in the table below.
It should be noted that this project also received an incentive from Entergy for its associated electric savings and thus payback cannot be fully analyzed.
Annual Therms Savings
Cost per Therm
Annual Energy Cost
Savings
Incremental Cost
Base Incentive
Adjusted Incentive
Payback W/Incentive
Payback W/o
Incentive 149,780 $.54 $80,881.20 $495,045 $94,829.60 $94,829.60 4.94 years 6.12 years
APSC FILED Time: 3/26/2014 2:23:55 PM: Recvd 3/26/2014 2:04:55 PM: Docket 07-078-TF-Doc. 185

2013 SourceGas DSM Portfolio Final Evaluation Report
Appendix A: Site Reports 12-27
Project Number SGA-CIS2013-009 Program C&I Solutions
Project Background The participant is a food processing facility that received incentives from
SourceGas for ECM#1: replacement of 25 failed open steam traps
ECM#2: repairing 26 steam leaks
Steam traps were treated as partially-deemed, in accordance with TRM V3.0 protocols. The Evaluators found it necessary to supplant the steam leak discharge table in the TRM as it was vastly overstating savings. The TRM table does not de-rate the orifice size, and assumes 100% open leakage.
To account for this, the Evaluators applied the Armstrong Steam Leak calculator, which incorporates orifice size, line size, inlet pressure, and outlet pressure. Further, it accounts for whether it is a coil (or process) load, or a drip leg (or tracer) load being served by the steam trap. The table below contains a summary of the traps replaced, as well as the leakage rates used by the Evaluators and what the discharge rates would have been if the Evaluators applied the TRM V3.0 table.
Steam leak repair savings were calculated in a similar manner, with the added review of assessing leak rates via plume length.
APSC FILED Time: 3/26/2014 2:23:55 PM: Recvd 3/26/2014 2:04:55 PM: Docket 07-078-TF-Doc. 185

2013 SourceGas DSM Portfolio Final Evaluation Report
Appendix A: Site Reports 12-28
Summary of Steam Traps Replaced Line Size (inches)
Orifice Size
(inches)
Inlet Pressure
(PSIG)
Outlet Pressure
(PSIG)
TRM Discharge
Rate
Applied Discharge
Rate .5” 5/64 90 10 12.8 17 .5” 5/32 90 0 75.3 44 .75” 1/8 90 0 48.2 44 .75” 1/8 90 0 48.2 44 .75” 1/8 90 0 48.2 44 .5” 5/64 90 10 12.8 11 1” 15/64 90 10 162 154
.375” 3/16 90 0 108.6 98 .75” 1/8 90 10 48.2 28 .75” 7/64 90 10 23.9 21 .5” 5/64 90 10 12.8 17 .5” 3/32 90 0 23.9 25 .75” 1/8 90 10 48.2 44 .75” 7/64 90 10 23.9 33 .75” 3/16 90 10 108.6 98 .75” 1/8 90 0 48.2 44 .75” 3/16 90 10 108.6 98 .75” 3/16 90 10 108.6 63 .5” 5/32 90 0 48.2 68 .5” 5/32 90 0 48.2 44 .5” 5/32 90 0 48.2 11 .75” 7/64 90 0 23.9 33 .75” 3/16 90 10 108.6 98 1” 15/64 90 10 192.6 154 .75” 1/8 90 0 48.2 44
The leaks repaired as part of ECM #2 are summarized in the table below. Plume lengths were all rounded down to the nearest linear foot due to measurement uncertainty.
APSC FILED Time: 3/26/2014 2:23:55 PM: Recvd 3/26/2014 2:04:55 PM: Docket 07-078-TF-Doc. 185

2013 SourceGas DSM Portfolio Final Evaluation Report
Appendix A: Site Reports 12-29
Summary of Steam Leaks Repaired Leak
Location Plume
Length (ft) Trap 504 2 Trap 505 2 Trap 510 1 Trap 519 1 Trap 519 2 Trap 520 1 Trap 520 1 Trap 520 2 Trap 522 1 Trap 524 2 Trap 530 1 Trap 536 2 Trap 537 1 Trap 540 4 Trap 541 4 Trap 543 2 Trap 544 2 Trap 547 1 Trap 548 1 Trap 551 2 Trap 561 2 Trap 569 4 Trap 570 1 Trap 577 3 Trap 578 1 Trap 580 1
M&V Methodology ECM #1: Steam Trap Replacement Savings were calculated by adopting the procedure specified in Section 3.1.17 of the Arkansas TRM V3.0. In this, steam trap savings are calculated as:
𝑇ℎ𝑒𝑟𝑚 = 𝑆𝑡𝑒𝑎𝑚 𝑇𝑟𝑎𝑝 𝐷𝑖𝑠𝑐ℎ𝑎𝑟𝑔𝑒 𝑅𝑎𝑡𝑒 × 𝐸𝐹𝐿𝐻 × ℎ𝐸𝑐 × 𝑇ℎ𝑒𝑟𝑚 𝐶𝑜𝑛𝑣𝑒𝑟𝑠𝑖𝑜𝑛 𝐹𝑎𝑐𝑡𝑜𝑟
Where:
𝑆𝑡𝑒𝑎𝑚 𝑇𝑟𝑎𝑝 𝐷𝑖𝑠𝑐ℎ𝑎𝑟𝑔𝑒 𝑅𝑎𝑡𝑒 = Steam loss in lb/hr.
𝐸𝐹𝐿𝐻 = Equivalent full-load hours for heating from Error! Reference source not found..
ℎ = Latent heat of evaporation in Btu/lb from steam tables.
APSC FILED Time: 3/26/2014 2:23:55 PM: Recvd 3/26/2014 2:04:55 PM: Docket 07-078-TF-Doc. 185

2013 SourceGas DSM Portfolio Final Evaluation Report
Appendix A: Site Reports 12-30
BaseEc Combustion efficiency for boiler, if unavailable estimate efficiency to 70%
𝑇ℎ𝑒𝑟𝑚 𝐶𝑜𝑛𝑣𝑒𝑟𝑠𝑖𝑜𝑛 𝐹𝑎𝑐𝑡𝑜𝑟 = 100,000BTU/Therm (assumed)
The Evaluators updated this formula as follows:
1) EFLH was replaced with hours of system pressurization. Steam traps are in operation whenever the system is pressurized; EFLH is a different metric, in totaling hours at full boiler load, and is not appropriate for this calculation.
2) Combustion efficiency was measured on-site as 79.05%. This was used in place of the 70% default value, lowering savings.
3) Steam discharge rates were replaced by rates from the Armstrong Steam Trap calculator. This resulted in a 28.6% reduction in the discharge rate used in savings calculations.
Data Collection Procedures Data used in calculating savings with this project were collected as follows:
Visual and photographic verification of installed steam traps. Boiler efficiency: average of measurements at varying firing rates taken
with a Portable Combustion Analyzer (found to be 79%) Hours of system pressurization: determined to be 8,760 based on an
interview with the plant manager
Calculated Savings: Using the above parameters, calculated savings were as follows:
Annual Therms: 146,099 Peak Therms: 400.27 Lifetime Therms: 730,495
Measure Life The EUL of this measure is 5 years. Source: NYSERDA Natural Gas Database
APSC FILED Time: 3/26/2014 2:23:55 PM: Recvd 3/26/2014 2:04:55 PM: Docket 07-078-TF-Doc. 185

2013 SourceGas DSM Portfolio Final Evaluation Report
Appendix A: Site Reports 12-31
ECM #2: Steam Leak Repair Steam leak repair was evaluated in a manner similar to the steam trap replacement measure. Leakage rates were assessed based on plume length in a manner identified by G.G. Rajan (“Energy Savings in Steam Systems”, Cochin, India) as follows:
𝑳𝒆𝒂𝒌 𝑹𝒂𝒕𝒆 𝒍𝒃𝒔𝒉𝒓 = 𝟓. 𝟔𝟔𝟏 × 𝒆𝒙𝒑[𝟎. 𝟓𝟔𝟐 × 𝑷𝒍𝒖𝒎𝒆 𝑳𝒆𝒏𝒈𝒕𝒉(𝒇𝒕)]
This method yields similar results as the methods established by the Council of Industrial Boiler Owners (CIBO Energy Efficiency Handbook, Burke, VA, 1997) and Asian Productivity Organization (Training Manual on Energy Efficiency for Small and Medium Enterprises, Tokyo, 2010). From this, heat loss was calculated as follows:
𝑯𝒆𝒂 𝑳𝒐𝒔𝒔 = 𝑳𝒆𝒂𝒌 𝑹𝒂𝒕𝒆 𝒍𝒃𝒔𝒉𝒓 × 𝑺𝒕𝒆𝒂𝒎 𝑬𝒏𝒕𝒉𝒂𝒍𝒑𝒚 𝑩𝒕𝒖𝒍𝒃 − 𝑭𝑾𝑬𝒏𝒕𝒉𝒂𝒍𝒑𝒚 (𝑩𝒕𝒖𝑳𝒃 )
Where,
Steam Enthalpy = 2025.52 Btu/lb (hg of steam at 90 PSIG – hf of feedwater at 195 deg. F)
MW Enthalpy = 33.7 Btu/lb. (65.6 deg. F MW water)
Description # Leaks Leak Rate Btu/h Lost Annual Therms
1 ft. Plume Leaks 12 9.9 10,187 13,546 2 ft. Plume Leaks 10 17.4 17,877 19,809 3 ft. Plume Leaks 1 30.6 31,370 3,476 4 ft. Plume Leaks 3 53.7 55,049 18,299
This provides total savings of:
Annual Therms: 55,130 Peak Therms: 151.04 Lifetime Therms: 275,650
Measure life for steam trap replacement was applied to steam leak repairs (EUL of five years).
APSC FILED Time: 3/26/2014 2:23:55 PM: Recvd 3/26/2014 2:04:55 PM: Docket 07-078-TF-Doc. 185

2013 SourceGas DSM Portfolio Final Evaluation Report
Appendix A: Site Reports 12-32
Uncertainty The Evaluators conducted a propagation of uncertainty analysis for this project. The parameters and their uncertainty are summarized in the table below.
Parameter Value Uncertainty Sigma Hours of Operation 8,760 0% 0
Discharge Rate 1,605 +/- 20% 40,246 Boiler Efficiency 79% +/- 3% 4,009
The errors were then propagated as follows:
𝑃𝑟𝑜𝑝𝑜𝑔𝑎𝑡𝑒𝑑 𝐸𝑟𝑟𝑜𝑟 = (𝜎 ) + 𝜎 + 𝜎 . = 40,444
With this propagated error, the savings estimate for this project as overall uncertainty of:
𝑈𝑛𝑐𝑒𝑟𝑡𝑎𝑖𝑛𝑡𝑦 = 40,444201,229 = 20.0%
Measure Cost, Incentive, & Payback The Evaluators reviewed the invoices associated with this project and verified an incremental cost of $51,303. Measure payback is summarized in the table below.
Annual Therms Savings
Cost per Therm
Annual Energy Cost
Savings
Incremental Cost
Base Incentive
Adjusted Incentive
Payback W/Incentive
Payback W/o
Incentive 201,229 $.562 $113,090.70 $51,303 $160,983 $51,303 0.0 Years .45 Years
APSC FILED Time: 3/26/2014 2:23:55 PM: Recvd 3/26/2014 2:04:55 PM: Docket 07-078-TF-Doc. 185

2013 SourceGas DSM Portfolio Final Evaluation Report
Appendix A: Site Reports 12-33
Project Number SGA-CIS2013-009 Program C&I Solutions
Project Background The participant is a food processing facility that received incentives from SourceGas for replacement of six steam traps:
Steam traps were treated as partially-deemed, in accordance with TRM V3.0 protocols. The Evaluators found it necessary to supplant the steam leak discharge table in the TRM as it was vastly overstating savings. The TRM table does not de-rate the orifice size, and assumes 100% open leakage.
To account for this, the Evaluators applied the Armstrong Steam Leak calculator, which incorporates orifice size, line size, inlet pressure, and outlet pressure. Further, it accounts for whether it is a coil (or process) load, or a drip leg (or tracer) load being served by the steam trap. The table below contains a summary of the traps replaced, as well as the leakage rates used by the Evaluators and what the discharge rates would have been if the Evaluators applied the TRM V3.0 table.
Summary of Steam Traps Replaced
Line Size (inches)
Orifice Size
(inches)
Inlet Pressure
(PSIG)
Outlet Pressure
(PSIG)
TRM Discharge
Rate
Applied Discharge
Rate 2” 1/2 110 0 917.6 534
.75” 3/16 110 0 105.5 99 2” 1/2 110 0 917.6 534 .75” 3/16 110 0 105.3 99 .75” 3/16 110 0 105.3 99 2” 1/2 110 0 17.6 534
M&V Methodology Savings were calculated by adopting the procedure specified in Section 3.1.17 of the Arkansas TRM V3.0. In this, steam trap savings are calculated as:
𝑇ℎ𝑒𝑟𝑚 = 𝑆𝑡𝑒𝑎𝑚 𝑇𝑟𝑎𝑝 𝐷𝑖𝑠𝑐ℎ𝑎𝑟𝑔𝑒 𝑅𝑎𝑡𝑒 × 𝐸𝐹𝐿𝐻 × ℎ𝐸𝑐 × 𝑇ℎ𝑒𝑟𝑚 𝐶𝑜𝑛𝑣𝑒𝑟𝑠𝑖𝑜𝑛 𝐹𝑎𝑐𝑡𝑜𝑟
(2)
Where:
𝑆𝑡𝑒𝑎𝑚 𝑇𝑟𝑎𝑝 𝐷𝑖𝑠𝑐ℎ𝑎𝑟𝑔𝑒 𝑅𝑎𝑡𝑒 = Steam loss in lb/hr.
APSC FILED Time: 3/26/2014 2:23:55 PM: Recvd 3/26/2014 2:04:55 PM: Docket 07-078-TF-Doc. 185

2013 SourceGas DSM Portfolio Final Evaluation Report
Appendix A: Site Reports 12-34
𝐸𝐹𝐿𝐻 = Equivalent full-load hours for heating from Error! Reference source not found..
ℎ = Latent heat of evaporation in Btu/lb from steam tables.
BaseEc Combustion efficiency for boiler, if unavailable estimate efficiency to 70%
𝑇ℎ𝑒𝑟𝑚 𝐶𝑜𝑛𝑣𝑒𝑟𝑠𝑖𝑜𝑛 𝐹𝑎𝑐𝑡𝑜𝑟 = 100,000BTU/Therm (assumed)
The Evaluators updated this formula as follows:
1) EFLH was replaced with hours of system pressurization. Steam traps are in operation whenever the system is pressurized; EFLH is a different metric, in totaling hours at full boiler load, and is not appropriate for this calculation.
2) Combustion efficiency was measured on-site as 84.0%. This was used in place of the 70% default value, lowering savings.
3) Steam discharge rates were replaced by rates from the Armstrong Steam Trap calculator. This resulted in a 38.1% reduction in the discharge rate used in savings calculations.
Data Collection Procedures Data used in calculating savings with this project were collected as follows:
Visual and photographic verification of installed steam traps. Boiler efficiency: average of measurements at varying firing rates taken
with a Portable Combustion Analyzer (found to be 84.0%) Hours of system pressurization: determined to be 8,760 based on an
interview with the plant manager
Calculated Savings: Using the above parameters, calculated savings were as follows:
Annual Therms: 188,973 Peak Therms: 517.73 Lifetime Therms: 944,864
Measure Life The EUL of this measure is 5 years. Source: NYSERDA Natural Gas Database
APSC FILED Time: 3/26/2014 2:23:55 PM: Recvd 3/26/2014 2:04:55 PM: Docket 07-078-TF-Doc. 185

2013 SourceGas DSM Portfolio Final Evaluation Report
Appendix A: Site Reports 12-35
Uncertainty The Evaluators conducted a propagation of uncertainty analysis for this project. The parameters and their uncertainty are summarized in the table below.
Uncertainty Parameters Parameter Value Uncertainty Sigma
Hours of Operation 8,760 0% 0 Discharge Rate 1,605 +/- 20% 37,794 Boiler Efficiency .84 +/- 3% 6,516
The errors were then propagated as follows:
𝑷𝒓𝒐𝒑𝒐𝒈𝒂𝒕𝒆𝒅 𝑬𝒓𝒓𝒐𝒓 = (𝝈𝒉𝒐𝒖𝒓𝒔)𝟐 + 𝝈𝒅𝒊𝒔𝒄𝒉𝒂𝒓𝒈𝒆𝟐 + 𝝈𝒆𝒇𝒇𝒊𝒄.
𝟐 = 38,352
With this propagated error, the savings estimate for this project as overall uncertainty of:
𝑈𝑛𝑐𝑒𝑟𝑡𝑎𝑖𝑛𝑡𝑦 = 38,352188,973 = 20.3%
Measure Cost, Incentive, & Payback The Evaluators reviewed the invoices associated with this project and verified an incremental cost of $15,191. Measure payback is summarized in the table below.
Annual Therms Savings
Cost per Therm
Annual Energy Cost
Savings
Incremental Cost
Base Incentive
Adjusted Incentive
Payback W/Incentive
Payback W/o
Incentive 188,973 $.562 $106,202.82 $15,191 $151,178 $15,191 0.0 Years .14 Years
APSC FILED Time: 3/26/2014 2:23:55 PM: Recvd 3/26/2014 2:04:55 PM: Docket 07-078-TF-Doc. 185