ap42 section: 6.5 phthalic anhydride title: correspondence ... · 210 million pounds of phthalic...
TRANSCRIPT

AP42 Section: 6.5 Phthalic Anhydride
Title: D. Beauregard
Correspondence dated 1992 from Aristech Chemical Corporation to

CONTACT M b
HESSAGE:
a 1
~

."."- Ai- .U fD at- Iwd iecl. nem hlch *). la
I for t the :In@
:oat- lam- ~ are most
dad T.8 11- Wb% ad- [email protected] the d e c b w u ahout 1.4 parent.
Earnln#s before taxea dropped from 11aS.S milllon ln 1000 0 a negauvc (1O.d mullon. Poor pedonnrncc d tha automdive and C O M ~ N C U ~ industrls* kv b- for the company, impacted de# a d arn- lngi and a charge of over 1100 mullon h c o n a d o n wlth the mmpuny's long term re- structuring prosram wan reapooslble for puhng earnings Inlo the mlnw column Dr. Steln deellned additloall comment on
the plan l o purehaas Mob11 Chemical Com- pany's polystyrene main bualncsa (CMq 1/ 20/02, pg.8). noting t b t thedeal h 8 entered
ConNnued on Page 28
I Exitina PPS Keeps 'Ryton'
t In- dur" :o Its s the any, Drld. :om- : r e
e n In the US market: Phlllip8, Hoechat Celanese CorporaUoo and CE Plaaticr Only PNlllp~harproductIoncapPhlliti~lnineUS.
Speculation among indutry aMlyBb indl- caten that h y e r was elther looklng to. strengthen It8 posltlon h the PP8 market or get aut of It altogether. In fact, untll Bayer
COntInw WI Pape 40
F o l b m wile capacity rallonnl. hUoa the phthuc lnduarp la now atmula# th4 lmportutec of get- t& pofiloblUty back up to reinvwt~ ment lev&. At me. accord&# to pro- ducera, I8 the Industry's ability to be a ateady aupplla tollowlDg an eventual re- bound In demnnd or an unforeaean pro- duction outage.
Currently, producllon ia chnractcrlzed an "comfortably m ~ . " However. the movw of end m r k U following an upUck In the economy w expected brlretcb Ulelndlurtry's ProdUction cnpaclty. Industry prOkdOM &ow the need for MW eapaclty by 1994.05.
Although offeet aomewbat by the reces- aloa, BASF Corporation'r cloilng of Ita. Kcerny, N.J., and Cornwall. Ontarlo, phthalic facllltiea lait year tlghtaned the markat.
"Roductlon reliability Ls certainly an la- tue;' tapp producer, a w q that string of mainlrnPace turaaroundr last year also tlebtened avallshillty and forced production to n a r cap.clty.
"In the long term, there will he a need for mors cnpPcIly." he 8ayn.
Plan8 for new caprclty do exist, however. BASF, for example. expects 10 move two reactora at ita Kesmy locallon to SterUng Chemicals Inc.'s Taras Clty, rex., locntloe Other pmdvcsrr with l ~ i ipaif ic plaw re- port that when demand plelu up. the n d for
increued caprclly could be c o m a tn (be phontambydeboUlmsUrU.
~elndMIpb~uppikdbgMstahC%6m~ t c a l ~ p o r a ~ , Enon-comppn9. u p p e n Induarla hc., Stapu~cOmplm~. PI well PI BAW and Starhg.
DownWneln lhePAladmtrylPstseardld. however, keep production ram Ilrm.
According to Nelson Ockerhloom of Phlladelphia.based PCIK)ckablmm 0 Ca.. toward the end of lad year productbn wan puahed LO nearly 90 r t of capaclty, or beyondwhltbcotu: edanmfortableop- eratlng margln.
"One more plant ahutdowo and there wouldhave hem a Ihortlgc"hcuy8. "It can be argued tbat Ian fa11 an avlllahillty c r l u almoat developed."
But most agree tbrt an h c m w In cape- ity could only follow a m ~ a s t k u n g of mar- pula.
"Mar@ Improvement U a mtut t! the in. dairy IE to get cloaer LO rdnvatment eco. nomica. ' ~ y a a produca. ad- that even wlch a r u c c d u l InciWW., adequate return8 will still be "a aay'n away."
In a move ta I n c n ~ a PA profltohiuty. EMF announced a lent-Per-pound prlce increaw effectlve April 1. Other producers. because of eontract reuraInlr. are expcnea to follow the move May 1.
"The goal II 10 get a little more proflrabil. i ty In the buslnera." saya I producer. "A mar-
ContlnuedonPage12 ,
INSIDECMR I I -
AdV-1 Index. .................... 44 maouwuwBr*ia....... ........... 4a C h m n l u l ~ ..................... 50 chnnh.IPllcea ....................... an ChmlaIPmtw ...................... 4a ClrrJlkdAdVuUaunWU ............. U DE.Cummr .......................... 7 D 8 m r g m m ~ m m I ................. 24 Fmmd4lNswmoln... ................ 17 Job..- ........................ 4a MI.(lnglClbnda.. .................. @
0 .I -.._- ..-_".dl

_ _
. . . . . '! :. : ... . . . .,. ,

ot * W u a t m w P W w ....................... LML 'M'JW LQ'L)z
Z M L 'U v.4 9o'w mL'O2-w W'U) Md L 'LZ 'JW WSLL.
'LBBL ul P-pacd )oMumb wpuomo6-a w ui
- o v l P M = n W l SJlwSJo OP- Wl
....................... ....................... ......................
xaani wiivmuv

1 , ’ L
ARISTECi-Mii April 10, 1992
Mr.Colin Campbell Pacific Environmental Services 3708 Mayfair SI., Suite 202 Durham, N.C. 27707
Dear Mr. Campbell:
Enclosed are results of testing performed on Aristech Chemical Corporation - Pasadena Plant’s phthalic anhy- dride scrubber stacks. The plant has two fixed-bed tubular reactors with each having associated switch con- densers and thermal incinerator/scrubber systems. This unit has an annual nameplate production capacity of 210 million pounds of phthalic anhydride. Start-up 01 the unit occurred in mid - 1983.
The Texas Air Control Board Operating Permits required that the scrubber stacks be tested to insure COmpli- ance with VOC and CO emissions rates listed in the permit. There were no requirements to test lor SUlfUr diox- ide emissions since it has never been introduced into the process. The permit listed all organic compounds as VOC’s rather than particulates as indicated in AP-42 Table 5.12-1. Method 25-A lor VOC detection was used in all the enclosed test results except for the testing done on October 1, 1987. During this test. a modified sam- pling and analysis method was used for VOC detection. This was a Ireezeltrap method which resembles the EPA method lor particulate determination. Particulate testing was included in the March 26, 1987 and October 1. 1987 sampling per €PA methodology.
Testing to date, includes sampling of Loth scrubber stacks lor VOC and CO on April 30 and May 1, 1985. Re- sults of this test showed VOC levels above permitted limits. Sampling on November 11 and 12. 1985 was for VOC only and results were well within the permit limits. Adjustments had been made to the operation of the in- cineratodscrubber system prior to the November sampling. The sampling done on March 1, 1987 was only done on one scrubber stack. The purpose was to test emissions lrom the incinerator, only. For this test the liq- uid level in the scrubber was kept below the inlet line from the incinerator and it was basically used as a stack. Because a significant increase in stack temperature occurred, the October 1 test utilized a lreeze/trap sampling procedure to test lor VOC levels. Again, only one scrubber stack was sampled. During the first test run. the in- cinerator tripped and the scrubber was quickly placed back in service. This explains the decrease in stack emissions from runs 2 through 4. Run 1 was not reported because one 01 the tubes collecting the samples was broken during sampling. Analysis from this test shows that the main constituent being emitted is maleic acid. Operation of the incinerator without the scrubber has not been pursued. The TACB Operating Permit CUrrenlly requires scrubber operation at all times that the incinerator is in operation.
The enclosed package lists physical conditions from each test as well as results and methodologies utilized
Sincerely,
./-
Environmental Coordinator
RAS:pr ;+rnt&mwa,”ce A ,.,TP.
32-92

Table 5.12-1. EMISSION FACTORS FOR PHTHALI EMISSION FACTOR RATING: I
%miculate cornism of phthalic anhydride, maleic anhydride. and benzoic r i d .
$ m i o r 6 ChanQc with catdyst age. V a l w rhorrn corresponds to mlatiy.ly fresh catalyst. Can ba 19 to 25 Ibl ton 19.5 t o 13 WMTI fa agedcatalwt.
I ~ C u l l t r Conrisu of phthalic anhydride and maleic anhydride.
Process
p , ~ t , o n ot O - i v l m b
ualn p r ~ ~ n s strramc uncontrolled Wivrubbcr and thermal'
iwi*e,ator Wltherrnll incinerator wimincrator with
stearn generator
Rnreatment Uncontrolled Wiscwbber and thermal
tncinerator Withermal incinerator
c,c~dlac~on Uncontrolled W I I C N ~ ~ and thermal
umneiator W i t h r m a l incinerator
h e m o n 01 naphthaleneb
U m POCCII strcamc Uncontrolled Wlthrrmal Incinerator Wlscrubber
Rttaatment Uncontiolled Whhirmal iwinerator Wivrubber
Olmllation Uncontrolled W/lhermal incinnalor Wircrubber
!
Panic< Ib/lon -
i 3 8 d
6 7
7
13 l
0.5 0.7
8wJ
4 4
569.i 11 0.6
5h 1
1 0 . 1
389 8 0.4
c - g1MT -
69d
3 4
4
6.41
0.3 0.4
45d
2 2
289.i 6 0.3 . 2:5h 0.5
<0.1
199 4 0.2 -
so - b/ton
9.4e
9.4 9.4
9.4
0
0 0
0
0 0
0 0 0
0 0 0
0 0 0 -
- glMT - 4.7e
4.7 4.7
4.7
0
0 0
0
0 0
0 0 0
0 0 0
0 0 0 -
ANHYDRIDE^,^
H - blton -
0
. o 0
0
0
0 0
2.4
<O.l 0.1
0 0 0
0 0 0
10 2 0.1
- :gWT - 0
0 0
0
0
0 0
1.2
:0.1 co.1
0 0 0
0 0 0
5 1
co.1
C - IWton -
301
12 15
15
0
0 0
0
0 0
100
100 m
0 0 0
0 0 0
151
6 8
8
0
0 0
0
0 0
50 10 50
0 0 0
0 0 0 I
I -

co


TABLE 2.2
PHTHALIC A N H Y D R I D E PLANT SCRUBBER NO. 1
PHYSICAL DATA SUMMARY
R U N 7 .,. U n i t 1 - Parameter
Date
T i m e
Sampling t i m e
Net sample volume
Meter temper a t u r e
Condensate c o l l e c t e d
Moisture c o n t e n t
Molecular w e i g h t
4-30-85
1017-1117
m i n u t e s 60
c u f t 34.822
OF 89
gm 100.5
VOl % 12.4
gm/gm m o l e 27.608 (Ac tua l )
Stack temper a t u r e
Stack p r e s s u r e i n Hg
P i t o t t u b e c o r r e c t i o n ---
OF
f a c t o r
Dry g a s meter c o r r e c t i o n f a c t o r
Stack d i a m e t e r
Average s t a c k
Volumetric s t a c k g a s
Volumetric s t a c k g a s
Volumetric dry s t a c k
v e l o c i t y
flow r a t e
flow r a t e
gas f low r a t e
---
i n
f t /sec
ACFM
SCFM
DSCFM
126
29.94
0.843
1.000
74
39.9
71,502
64,618
56,606
4-30-85
1200-1300
60
34.533
90
109.2
13.4
27.505
130
29.94
0.843
1.000
74
39.5
70,785
63,562
55,045
4-30-85
1327-1427
60
35.050
93
111.1
13.5
27.515
130
29.94
0.843
1.000
74
39.9
71,502
64,031
55,386

TABLE 2.3
PHTHALIC A N H Y D R I D E PLANT SCRUBBER N O . 2
PHYSICAL DATA SUMMARY
R U N u n i t 1 2 .) - Paramete r
Date
T i m e
Sampling t i m e
Net s a m p l e volume
Meter temperature
Condensa te c o l l e c t e d
M o i s t u r e c o n t e n t
Molecular w e i g h t ( A c t u a l )
Stack temper a t u r e
Stack pressure
P i t o t t u b e c o r r e c t i o n f a c t o r
Dry g a s meter c o r r e c t i o n f a c t o r
S tack d i a m e t e r
Average s t a c k
V o l u m e t r i c s t ack g a s
Vo lumet r i c s t a c k g a s
Vo lumet r i c dry s t a c k
v e l o c i t y
flow r a t e
f low ra te
g a s flow ra te
5-1-85
1003-1103
m i n u t e s 60
c u f t 34.411
OF 92
9 m 114.5
VOl % 14.0
gm/gm mole 27.440
OF
i n Hg
---
---
i n
f t/sec
ACFM
SCFM
DSCPM
129
29.92
0.843
1.005
74
52.4
93,902
04,177
72 I 392
5-1-85
1125-1225
60
34.218
101
111.5
14.0
27.471
129
29.92
0.843
1.005
74
52.6
94,260
84,498
72 I 668
a
5-1-85
1237-1337
60
34.283
96
108.1
12.0
27.688
121
29.92
0.843
1.005
14
52.2
93,543
a5,oio
74 I 809
NUS CORPORATIOP

TABLE 2 . 1
EMISSION RATE DATA SUMMARY
Source Name
PA P l a n t Scrubber NO. 1
PA P l a n t Scrubber No. 2
2-EH Vacuum Vent
TACB Emission I Maximum A l l o w a b l e
Pa Kame t er Rate 2 E m i s s i o n Rate
voc 5 . 7 l b s / h r 0,;: >
co 2 . 8 l b s / h r J , ‘ -
voc 6 . 2 l b s / h r
co 3 . 2 l b s / h r I - I
voc 0 . 0 4 l b s / h r
16 S t r i p p e r Vent voc 0 . 3 0 7 l b s / h r
coz
4 . 6 l b s / h r
9 3 . 3 l b s / h r
4 . 6 l b s / h r
9 3 . 3 l b s / h r
4 . 2 l b s / h r
5 . 4 l b s / h r
p/h’ S CORPORATION

S E C T I O N 4 . 0 - Sampling and A n a l y t i c a l P r o c e d u r e s
S tack g a s v e l o c i t y and v o l u m e t r i c f l o w r a t e o f t h e two s c r u b b e r s t a c k s i n t h e PA p l a n t were d e t e r m i n e d by EPA Methods 1 and 2. EPA Method 1 - " S a m p l e a n d V e l o c i t y T r a v e r s e s f o r S t a t i o n a r y Sources" was f o l l o w e d i n l o c a t i n g t h e s a m p l i n g s i tes , and deter- mining t h e number of s a m p l i n g p o i n t s . S i x t e e n s a m p l e p o i n t s were used f o r t h e v e l o c i t y t r a v e r s e , and a p o i n t a p p r o x i m a t e l y o n e meter f rom t h e s t a c k w a l l was used t o ex t r ac t s a m p l e s f o r moi s - t u r e , m o l e c u l a r w e i g h t , CO and VOC d e t e r m i n a t i o n s . EPA Method 2 - " D e t e r m i n a t i o n o f S t a c k Gas V e l o c i t y and V o l u m e t r i c Flow Rate" was f o l l o w e d i n d e t e r m i n i n g t h e s t a c k g a s v o l u m e t r i c f l o w rate. An S - type p i t o t t u b e ( t e n f e e t i n l e n g t h ) e q u i p p e d w i t h a t y p e K t h e r m o c o u p l e was used to m o n i t o r t h e v e l o c i t y and f l u e g a s tempe- r a t u r e . V e l o c i t y head p r e s s u r e was m e a s u r e d u s i n g t h e p i t o t t u b e and an i n c l i n e d manometer hav ing a f u l l r a n g e o f 0 t o 5 i n c h e s o f H2O.
Actua l v o l u m e t r i c f l o w ra tes f o r t h e vacuum and s t r i p p e r v e n t s i n t h e 2 - e t h y l h e x a n o l p l a n t were s u p p l i e d b y TENN-USS Chemical .
For e a c h s i t e t h e m o l e c u l a r w e i g h t o f t h e s t a c k g a s was de te r - mined u s i n g a n O r s a t a n a l y z e r a c c o r d i n g t o t h e p r o c e d u r e s g i v e n i n E P A R e f e r e n c e Method 3 , "Gas A n a l y s i s for C a r b o n D i o x i d e , Oxygen, E x c e s s A i r , a n d Dry M o l e c u l a r Weigh t " . O r s a t S a m p l e s were c o l l e c t e d o v e r a p e r i o d of a p p r o x i m a t e l y o n e hour f o r t h e s c r u b b e r s t a c k and t e n m i n u t e s f o r e a c h ven t . Samples were drawn d i r e c t l y t h r o u g h a t e f l o n l i n e d d i a p h r a g m pump and i n t o a 5 -p ly C a l i b r a t e d I n s t r u m e n t s s a m p l e bag u s i n g t h e s i n g l e p o i n t , i n t e - g r a t e d s a m p l e p r o c e d u r e i n EPA Method 3 .
Upon c o m p l e t i o n o f t h e O r s a t a n a l y s i s t h e O r s a t b a g w a s t h e n a n a l y z e d f o r c a r b o n monoxide u s i n g a Beckman i n f r a r e d a n a l y z e r (Model No. 864-11 I.R. Ana lyze r ; S e r i a l No. R A P I D 9935) a c c o r d i n g t o CFR-40, E P A Method 1 0 , " D e t e r m i n a t i o n o f C a r b o n M o n o x i d e Emiss ions from S t a t i o n a r y Sources" .
A t e a c h s i te EPA R e f e r e n c e Method 4 , " D e t e r m i n a t i o n o f Moisture C o n t e n t i n S t a c k Gases" was f o l l o w e d i n d e t e r m i n i n g t h e amount O f m o i s t u r e i n t h e s t a c k g a s . I n t h i s m e t h o d , t h e v o l u m e o f m o i s t u r e condensed is measured t o t h e n e a r e s t m i l l i l i t e r ( m l ) . T h e i n c r e a s e i n w e i g h t o f t h e s i l i c a g e l was d e t e r m i n e d by we igh ing t h e s i l i c a g e l t o t h e n e a r e s t 0.5 gram ( g ) . The w e i g h t of t h e m o i s t u r e f o u n d i n t h e s i l i c a g e l was t h e n c o n v e r t e d t o m l by d i v i d i n g t h e d e n s i t y of water (1 g / m l ) .
The i m p i n g e r water and c o l l e c t e d c o n d e n s a t e f rom t h e vacuum and t h e s t r i p p e r v e n t s on t h e 2-EH p l a n t were t r a n s f e r r e d t o amber c o l o r e d b o r o s i l i c a t e g l a s s s a m p l e b o t t l e s w i t h t e f l o n l i n e d caps . The s a m p l e s f rom e a c h test run were t h e n c o m p o s i t e d and a n a l y z e d f o r b u t a n o l , 2 - e t h y l h e x a n o l , n - b u t y r a l d e h y d e , i s o b u t y r a l d e h y d e r a n d e t h y l p r o p y l a c r o l e i n v i a l i q u ' i d i n j e c t i o n g a s ch romatography .
I
I 14 NUS CORPORATION

Leak c h e c k s were c o n d u c t e d in a c c o r d a n c e w i t h p r o c e d u r e s d e s c r i b e d i n EPA M e t h o d s 2 , 3 a n d 4 . The p i t o t t u b e , p i t o t l ines , and O r s a t l i n e s were l e a k c h e c k e d a t f o u r i n c h e s of H20, p r i o r ' t o and a t t h e c o n c l u s i o n o f e a c h test. The Method 4 t r a i n was a l s o l e a k c h e c k e d p r i o r t o a n d a t t h e c o n c l u s i o n o f e a c h tes t .
V o l a t i l e O r g a n i c Compounds
EPA Method 25A 4 0 CFR P a r t 6 0 - " D e t e r m i n a t i o n o f T o t a l Gaseous O r g a n i c C o n c e n t r a t i o n Using a F l a m e I o n i z a t i o n A n a l y z e r " p r o c e d u r e s were used a s a g u i d e i n s a m p l i n g f o r V o l a t i l e O r g a n i c Compound (VOC) emissions.
T h e g a s s a m p l e was drawn t h r o u g h a h e a t e d t e f l o n l i n e b y a t e f l o n l i n e d d i aphragm pump l o c a t e d in a TECO Model 800 sample c o n d i - t i o n e r . From t h e s a m p l e c o n d i t i o n e r , t h e s a m p l e f l o w w a s d i r e c t e d t o a n A I D Model 5 1 1 GC/FID. Samples were a n a l y z e d f o r VOC ( less m e t h a n e ) a s n - h e p t a n e f o r t h e t w o s c r u b b e r s i n t h e p h t h a l i c a n h y d r i d e p l a n t a n d t h e s t r i p p e r v e n t i n t h e 2 - e t h y l hexanol p l a n t and a s n-hexane i n t h e vacuum v e n t of t h e 2 - e t h y l hexanol p l a n t .
NUS CORPORATION

.
TABLE 2.2
PHTHALIC ANHYDRIDE PLANT SCRUBBER NO. 1
PHYSICAL DATA SUMMARY
Parameter
Date
Time
Sampling time
Net sample volume
Meter temperature
Condensate collected
Moisture content
Molecular weight (Actual)
Stack temperature
Stack pressure
Unit -
minutes
cu ft
OF
9m
VOl %
. RUN 3 -.
11-12-85
1256-1326
30
21.386
81.8
213.4
14.5
- -
gm/gm mole 21.426
OF
in Hg
Pitot tube correction --- factor
Dry gas meter ---
Stack diameter in
correction factor
Average stack velocity
ft/sec
Volumetric stack gas ACFM flow rate
Volumetric stack gas SCFM
Volumetric dry stack DSCFM
flow rate
gas flow rate
128.6
30.16
0.853
1.018
14
36.0
64511
58333
49875
4
L
11-12-85
1405-1435
30
21.221
82.1
219.9
14.5
21.414
128.6
30.1.6
0.853
1.018
14
31.1
66482
60116
51399
11-12-85
1533-1553
30
21.801
03.1
229.1
14.5
21.429
128.8
30.16
0.853
1.018
14
38.4
68812
62281
53182
NUS CORPORATION

Parameter
Date
Time
TABLE 2.3
PHTHALIC ANHYDRIDE PLANT SCRUBBER NO. 2
PHYSICAL DATA SUMMARY
Sampling t-.ne
Net sample volume
Meter temperature
Condensate collected
Moisture content
Molecular weight (Actual )
Stack temperature
Stack pressure
Unit -
minutes
cu ft
OF
9m
VOl %
RUN 1 -2
11-13-85
1020-1050
30
20.043
81.7
57.6
11.9
gm/gm mole 27.712
OF
in Hg
Pitot tube correction --- factor
Dry gas meter ---
Stack diameter in
correction factor
Average stack velocity
f t/sec
Volumetric stack gas ACFM flow rate
Volumetric stack gas SCFM
Volumetric dry stack DSCFM
flow rate
gas flow rate
128.8
30.20
0.853
1.018
74
39.3
70425
63744
56158
5
11-13-85
1131-1201
30
22.051
83.5
82.9
14.5
27.436
128.7
30.20
0.853
1.818
74
39.2
70245
63592
54371
11-13-85
1242-1312
30
21.101
84.5
76.3
14.6
27.418
128.8
30.20
0.853
1.018
74
39.2
70245
63581
54298
NUS CORPORATION

TABLE 2.1
VOC, AND ORSAT DATA SUMMARY
PA Plant Scrubber No. 1 voc
ppmv lb/hr (as hexane) - coz (VOl $ 1 ~ i m e Run - Date - -
1300- 3 2.0 ’ 1 11-12-85 1320
1410- 1. 0.7 2 11-12-85 1430
AVG. EMISSION RATE 1.4*
2.6
3.0
2.6
PA plant scrubber NO. 2 voc
ppmv lb/hr Time (as hexane) co -2 (VOl%) - Date - - Run
2 1.5 2.6 1 11-13-85 1030- 1050
2 1.5 2 . 1 2 11-13-85 1140- 1200
3 11-13-85 1250- 2 1.5 2.6 1310 -
1.5’ AVG. EMISSION RATE
‘TACB Maximum Allowable Emission Rate: 4.6 lb/hr
-2 0 (VOlS)
15.2
15.0
15.3
-2 0 (VOl%)
15.2
15.1
15.3
3
////2/H- N U S CORPORATION

SECTION 4 . 0 - Sampling and Analytical Procedures Stack gas velocity and volumetric flow rate of the two scrubber stacks in the PA plant were determined by EPA Methods 1 and 2. EPA Method 1 - "Sample and Velocity Traverses for Stationary Sources" was followed in locating the sampling sites, and deter- mining the number of sampling points. Sixteen sample points were used for the velocity traverse, and a point approximately one meter from the stack wall was used to extract samples for mois- ture, molecular weight and VOC determinations. EPA Method 2 - "Determination of Stack Gas Velocity and Volumetric Flow Rate" was followed in determining the stack gas volumetric flow rate. An S-type pitot tube (ten feet in length) equipped with a type K thermocouple was used to monitor the velocity and flue gas tempe- rature. Velocity head pressure was measured using the pitot tube and an inclined manometer having a full range of 0 to 5 inches of H20.
For each site the molecular weight of the stack gas was deter- mined using an Orsat analyzer according to the procedures given in EPA Reference Method 3 , "Gas Analysis for Carbon Dioxide, Oxygen, Excess Air, and Dry Molecular Weight". Orsat samples were collected over a period of approximately twenty minutes for the scrubber stacks. Samples were drawn directly through a teflon lined diaphragm pump and into a 5-ply Calibrated Instruments sample bag using the single point, integrated sample procedure in EPA Method 3.
At each site EPA Reference Method 4 , "Determination of Moisture Content in Stack Gases" was followed in determining the amount of moisture in the stack gas. In this method, the volume of moisture condensed is measured to the nearest milliliter (ml). The increase in weight of the silica gel was determined by weighing the silica gel to the nearest 0.5 gram (9). The weight of the moisture found in the silica gel was then converted to ml by dividing the density of water (1 g/ml).
Leak checks were conducted in accordance with procedures described in EPA Methods 2 , 3 and 4. The pitot tube, pitot lines, and Orsat lines were leak checked at four inches of H20. prior to and at the conclusion of each test. The Method 4 train was also leak checked prior to and at the conclusion of each test.
Volatile Organic Compounds
EPA Method 25A 40 CFR Part 60 - "Determination of Total Gaseous Organic Concentration Using a Flame Ionization Analyzer" procedures were used as a guide in sampling for Volatile Organic Compound (VOC) emissions.
a NUS CORPORATION

The g a s s a m p l e was drawn t h r o u g h a Perma-Pure d r y e r by a diaphragm pump. T h e sample f l o w was d i r e c t e d t o an A I D Model 511 GC/FID. Samples were a n a l y z e d f o r VOC ( less methane and e t h a n e ) a s hexane f o r t h e two s c r u b b e r s i n t h e p h t h a l i c anhydr ide p l a n t .
9 NUS CORPORATION
A
c
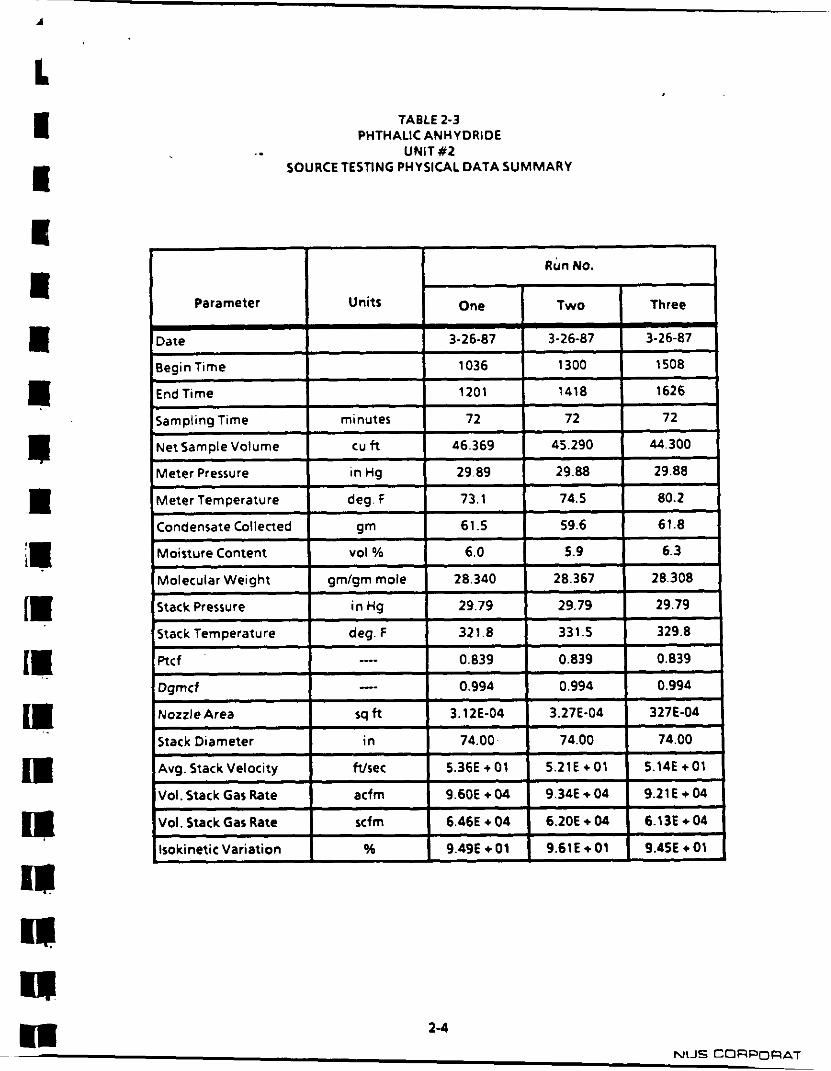
Run No.
Parameter Units One Two Three I I
TABLE 2-3 PHTHALIC ANHYDRIDE
SOURCE TESTlNG PHYSICAL DATA SUMMARY .. UNlT#Z
Avg. Stack Velocity
VoI. Stack Gas Rate
Vol. Stack Gas Rate
5.36E + 01 5.21€+01 5.14E +01 Wsec
9.34E + 04 9.21€+04 acfm 9.60E + 04
scfm 6.46E + 04 6.20E + 04 6.13E + 04
I --.- 9eginTirne 1036 1300 1508
Fnrl Time 1201 1418 1626 I
~~~~ ~
Isokinetic Variation % 9.49€+01 I 9.61€+01 I 9.45E + 01 I

TABLE 2-1 SCRUBBER STACK EMISSIONS
._ PARTICULATE DATA SUMMARY
3-26-87
3-26-87
I Total Emissions I (Ibr/hr) I Date I Time I Run#
1300- 1418 2 2.36
1508- 1626 3 1.71
I I t 3-26-87 I 1036 - 1202 I 1 I 1.76 I I
2-2

TABLE 2-4 VOC D A T A S U M M A R Y
(VOC AS PROPANE)
47 1.0
49 1 .o 3-26-87 1
3-26-87 2
3-26-87 3 45 1 .o
..
1.19
1.2'
1.6'
1 I
* It appears that retrainment of VOC'r may be occuring beyond the scrubber inlet sample location. Emission rates at the scrubber stack are higher than VOC rates at the scrubber inlet.
2-5 m h l l IS CORPORATIC

II 10
Date
.-
Inlet to Scrubber Inlet Stack
(ppmv) (ppmv) (ppmv) Run # Incinerator
TABLE 2-5 CARBON MONOXIDE
DATA SUMMARY
3-26-87
3-26-87
CO Concentrations (mrnv) I
2 502 1 17 14 I I I 3 5031 20 19
I I I I
3-26-87 I 1 I 5060 I 8 I 14 I
CO Rates (Ibslhr)
Stack Inlet to Scrubber Inlet
(Ibslhr) Run #
I I I I
3-26-87 1 1 I 1340 I 2.1 I 3.7 I 3-26-87 2 1280 4.3 3.6 I I I I 3-26-87 3 1260 5.0 4.8 I I I I
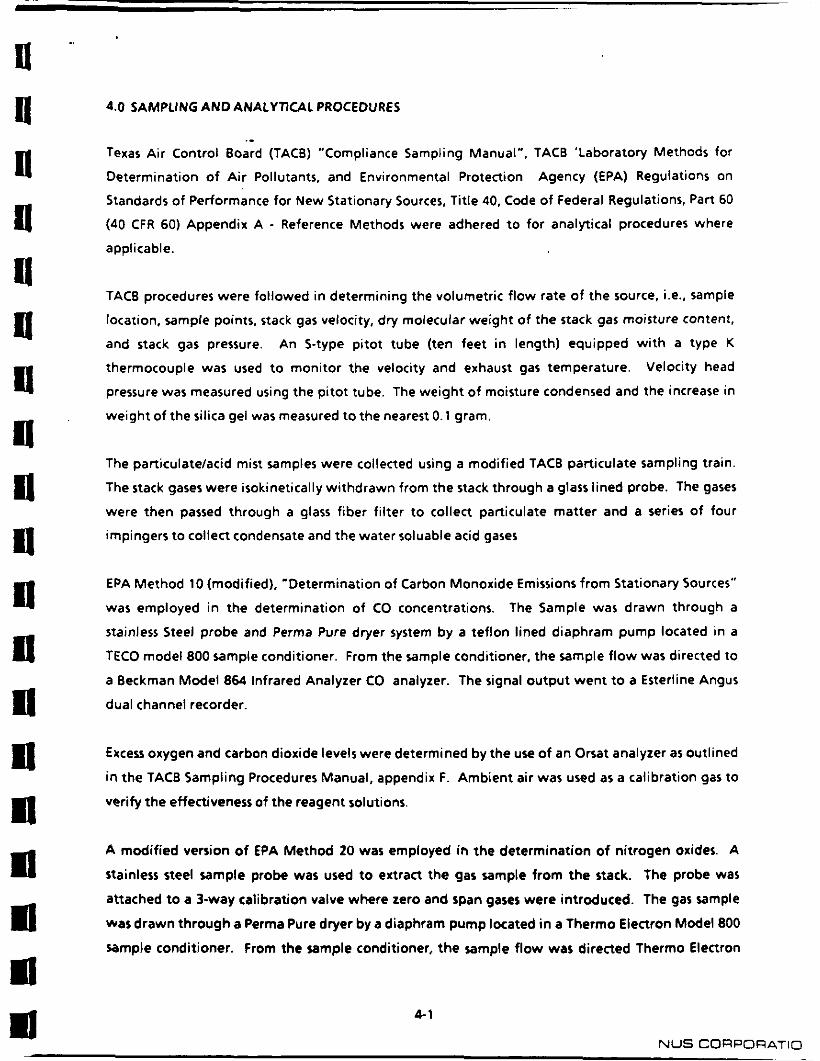
4.0 SAMPLING ANDANALYKAL PROCEDURES
._ Texas Air Control Board (TACB) "Compliance Sampling Manual", TACB 'Laboratory Methods for
Determination of Air Pollutants, and Environmental Protection Agency (EPA) Regulations on
Standards of Performance for New Stationary Sources, Title 40, Code of Federal Regulations, Part 60
(40 CFR 60) Appendix A - Reference Methods were adhered t o for analyrical procedures where
applicable.
TACB procedures were followed in determining the volumetric flow rate of the source, i.e.. sample
location, sample points. stack gas velocity, dry molecular weight of the stack gas moisture Content.
and stack gas pressure. An 5-type pitot tube (ten feet in length) equipped with a type K
thermocouple was used t o monitor the velocity and exhaust gas temperature. Velocity head
pressure was measured using the pitot tube, The weight of moisture condensed and the increase in
weight of the silica gel was measured to the nearest 0.1 gram.
The particulatelacid mist samples were collected using a modified TACB particulate sampling train.
The stack gases were isokinetically withdrawn from the stack through a glass lined probe. The gases
were then passed through a glass fiber filter t o collect particulate matter and a series of four
impingers to collect condensate and the water soluable acid gases
EPA Method 10 (modified), 'Determination of Carbon Monoxide Emissions from Stationary Sources"
was employed in the determination of CO concentrations. The Sample was drawn through a
stainless Steel probe and Perma Pure dryer system by a teflon lined diaphram pump located in a
T K O model 800 sample conditioner. From the sample conditioner, the sample flow was directed to
a Beckman Model 864 Infrared Analyzer CO analyzer. The signal output went t o a Esterline Angus
dual channel recorder.
Excess oxygen and carbon dioxide levels were determined by the use of an Orsat analyzer as outlined
in the TACB Sampling Procedures Manual, appendix F. Ambient air was used as a calibration gas to
verify the effectiveness of the reagent solutions.
A modified version of €PA Method 20 was employed in the determination of nitrogen oxides. A
stainless steel sample probe was used to extract the gas sample from the stack. The probe was
attached t o a 3-way calibration valve where zero and span gases were introduced. The gas sample
was drawn through a Perma Pure dryer by a diaphram pump located in a Thermo Electron Model 800
sample conditioner. From the sample conditioner, the sample f low was directed Thermo Electron
4- 1
NUS CQRPORATID

Model 10 nitrogen oxides analyzer. The signal output went to a dual channel recorder. Calibration
procedures were consirtent with those specified in EPA Method 20. Certified calibration gases were
used for the nitrogen oxides analyzer.
EPA Method 25A. “Determination of Total Gaseous Organic Concentration Using a Flame Ionization
Analyzer” procedures were followed for sampling for Volatile Organic Compound (VOC) emissions.
The samples were analyzed on an AID 51 1 GUFID for VOC as propane less methane. The signal
output was recorded by a Spectra Physics SP Model 4270 Integrator.
Copiesof the field and analytical data and calculations are in the appendices of this report.
I h a 0 II
U m
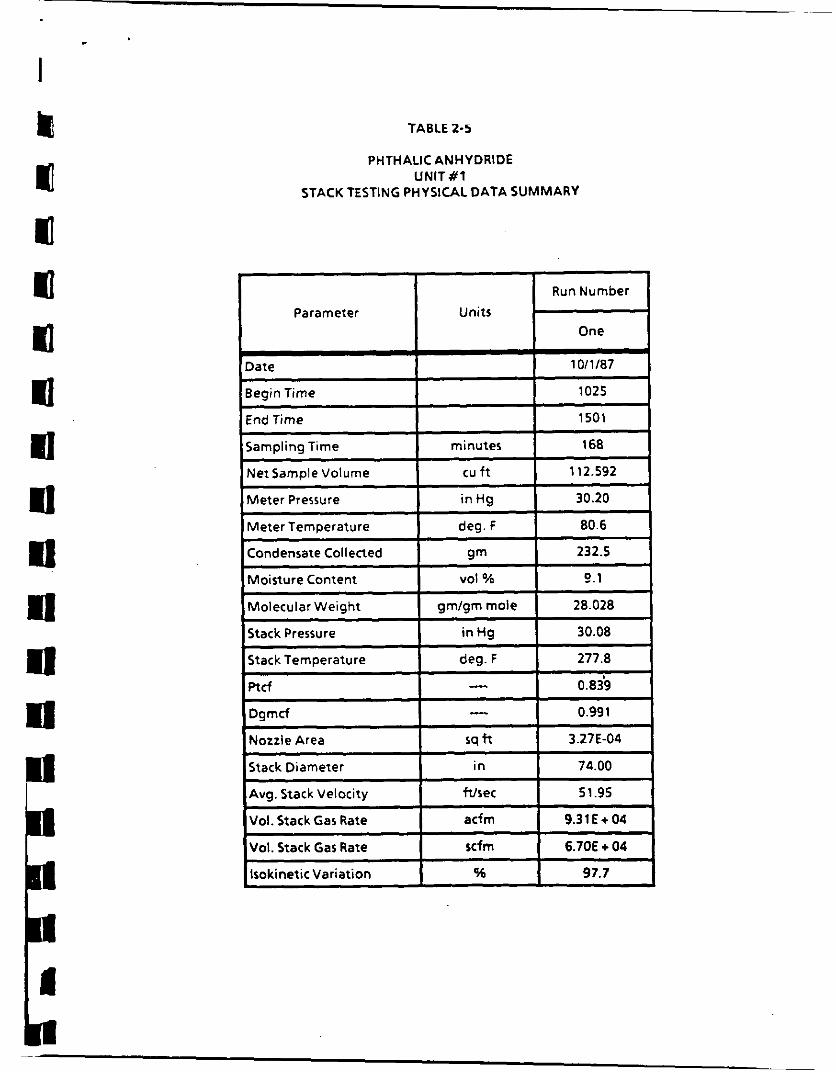
c D g m d - 0.991
Nozzle Area sq 3.27E-04
Stack Diameter i n 74.00
Avg. Stack Velocity Wsec 51.95
Vol. Stack Gas Rate acfm 9.31E + 04
Vol. Stack Gas Rate scfm 6.70E + 04
lrokinetic Variation % 97.7 >
El U
Il n
TABLE 2-5
PHTHALIC ANHYDRIDE UNlT# l
STACK TESTING PHYSICAL DATA SUMMARY

I L
TABLE 2-1
PHTHALIC ANHYDRIDE UNIT#l
PARTICULATE EMISSIONS DATA SUMMARY
Note: Sampling was interrupted between 1054 - 1233 because of a process unit upset condition. During this time, the probe was removed from the stack and no sampling was performed.
n
n n n

I I
s li ! ll U II I)
0 U Q Q R R a n n ‘I I n

E n m 3
0
f d E
f
W 5
Q W
._ c n .-
m C
3 .- L
n c 0
U C
.- e .-
E c
!i 3
C 3
c .-
"7 n
" W
: m .+. 0
.. W 0 z c

TABLE 2-4
Stack Gas Date Run No. Time concentration
(ppmv)
PHTHALIC ANHYDRIDE UNIT #1
CARBON MONOXIDE EMISSIONS DATA SUMMARY
Stack Emissions (Ibdhr)
10-1-87 1 1029 1054 I I 35.0 9.03 I
~~
10-1-87 2 1231 40.7 1301
10-1-87 3 1340 37.3 1410
Note: Sampling was interrupted between 1054 - 1233 because of a process unit upset condition During this time, the probe was removed from the stack and no sampling was performed.
10.63
9.57

0 U II Q 11 II II 0 4 Q U 4 4 4 4 al
1 a
a
4.0 SAMPLING AN0 ANALYTICAL PROCEDURES
Texas Air Control Board (TACB) "Compliance Sampling Manual", TACB 'Laboratory Methods for
Determination of Air Pollutants, and Environmental Protection Agency (€PA) Regulations on
Standards of Performance for New Stationary Sources, Title 40, Code of Federal Regulations, Part 60
(40 CFR 60) Appendix A - Reference Methods were adhered t o for sampling and analytical
procedures where applicable.
TACB procedures were followed in determining the volumetric flow rate of the source, i.e., sample
location, sample points, stack gas velocity, dry molecular weight of the stack gas moisture content,
and stack gas pressure. An 5-type pi tot tube (ten feet in length) equipped w i th a type K
thermocouple was used t o monitor the velocity and exhaust gas temperature. Velocity head
pressure was measured using the pitot tube. The weight of moisture condensed and the increase in
weight of the silica gel was measured t o the nearest 0.1 gram.
The particulatelacid mist samples were collected using a modified TACB particulate sampling train.
The stack gases were isokinetically withdrawn from the stack through a glass lined probe. The gases
were then passed through a glass fiber filter to collect particulate matter and a series of four
impingers to collect condensate and the water soluble acid gases.
EPA Method 10 (modified), *Determination of Carbon Monoxide Emissions from Stationary SOUrCeS"
was employed in the determination of CO concentrations. Samples were drawn through a stainless
steel probe whose tip was located at the centroid of the stack, using a teflon lined diaphram pump
into Tedlar sample bags. The sample gases were later transponed t o NUS laboratory facility in
Houston. There the stack gases were analyzed using a Beckman Model 864 Infrared Analyzer. The
signal output went t o a Esterline Angus dual channel recorder. The analyzer was calibrated using
National Bureau of Standards (NBS) traceable calibration gases. Excess oxygen and carbon dioxide
levels were determined by the use of an Orsat analyzer as outlined in the TACB Sampling Procedures
Manual, Appendix F. Ambient air was used as a calibration gas t o verify the effectiveness of the
reagent solutions.
Organidacid gas samples were collected simultaneously at three sample locations by the use of
miniature impicger sampling trains. Triplicate samples were obtained at each location. The flue
gases were drawn out of the centroid of the stack using stainless steel probes and heated sample line
4-1

"
E
L
r il
n n 3 n
maintained at 350°F. A t the Heat Recouperator Inlet and the Scrubber Inlet, flue gases were
obtained from existing heat traced sampling connections.
Before sampling for organidacid gases a t the three sample locations, flue gases were purged
through each of the sample lines for approximately 10 minutes. The purge gases were discharged
into water baths t o prevent dispersion of these gases into the ambient air. After purging.
connections were made between the heated sample lines and the impinger trains and the
connecting glassware was allowed t o equilabrate to flue gas temperatures before commencement
of sampling. The flue gases were then passed through a series of miniature impingers.
fl 0 a U R 11 0 0 D
n 1
The first impinger contained a straight (non-tapered)tube t o prevent ice formation and blockage of
the sample train. The following three impingers were equipped with tapered tubes to optimize
organic absorption in the acetone. The first impinger was dry (empty) and the remaining three were
each charged with 15 ml of acetone. The entire impinger assembly was immersed in an acetoneldry
ice bath and maintained at sub-rero temperatures. A calibrated Gilian sample pump equipped with
a rotometer was utilized t o draw the flue gases through the sample train. Rotometer readings were
taken every five minutes to insure accurate flow data was obtained.
Sample runs were approximately 30 minutes in duration a t sample rates of approximately 0.75 Umin.
lmpinger freezing occurred at the Heat Regrouper Inlet. which reduced the effective sampling time
and consequent sample volume. The connecting tubing between the fourth impinger and the
sample pump was sufficiently long t o allow the gases exiting from the fourth impinger t o equilibrate
to ambient temperatures (approximately 80°F).
Upon completion of sampling, samples were carefully poured into designated 40 ml VOA sample
bottles: The contents of lmpinger # 1 and #2 were combined into one VOA bottle and the contents
of lmpinger #3 and #4 were combined into a second VOA bottle for each sample run. Each impinger
was also carefully rinsed with acetone and the rinseate added t o the appropriate VOA bottle. Each
VOA bottle was brought up to volume and the bottle was capped and stored on dry ice for transport
t o the laboratory. Prior to sampling each VOA bottle had been calibrated t o determine i t s true
volume. These true volumes were used in determining the mass of organidacid gases caught. The
VOA bottles containing the contents of lmpingers # 1 and #2 were analyzed separately from the
VOA bottles containing the contents of lmpingers #3 and #4 t o determine if sample break through
had occurred..
4-2 In

I
In the laboratory, samples were reduced in volume in the ratio 10: 1 t o produce a detection limit (DL)
of 1 mglL. Organic concentrations of maleic and phthalic anhydrides were determined by Gas
Chromatography using a Flame Ionization Detector (GUFID). Organic acid concentrations, (Maleic,
Phthalic, Benzoic, o-Toluic and Citraconic Acids from the organidacid flue gas sampling trains and
Maleic and Phthalic Acid Mists from the particulate sampling train), were determined using High
Pressure Liquid Chromatography (HPLC).
b- 3
-4 7 8
EPA-600/2-77-188 September 1977 Environmental Protection Technology Series
CONTENTS
V vii
..I -.J
Figures Tables
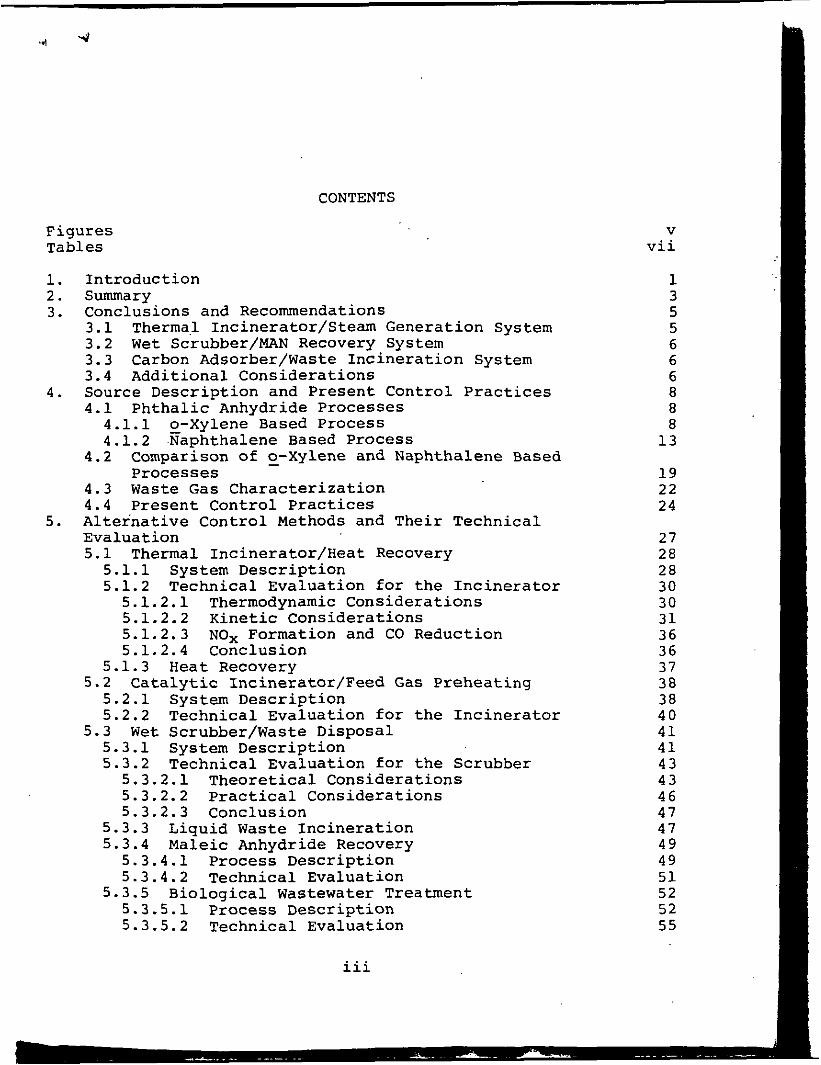
1. Introduction 2. Summary 3. Conclusions and Recommendations
3.1 Thermal Incinerator/Steam Generation System 3.2 Wet Scrubber/MAN Recovery System 3.3 Carbon Adsorber/Waste Incineration System 3.4 Additional Considerations
4.1 Phthalic Anhydride Processes 4.1.1 o-Xylene Based Process 4.1.2 raphthalene Based Process
4.2 Comparison of o-Xylene - and Naphthalene Based
4.3 Waste Gas Characterization 4.4 Present Control Practices
Evaluation 5.1 Thermal Incinerator/Heat Recovery
4. Source Description and Present Control Practices
Processes
5. Alternative Control Methods and Their Technical
5.1.1 System Description 5.1.2 Technical Evaluation for the Incinerator
5.1.2.1 Thermodynamic Considerations 5.1.2.2 Kinetic Considerations 5.1.2.3 NO, Formation and CO Reduction 5.1.2.4 Conclusion
5.2 Catalytic Incinerator/Feed Gas Preheating 5.1.3 Heat Recovery
5.2.1 System Description 5.2.2 Technical Evaluation for the Incinerator
5.3.1 System Description 5.3.2 Technical Evaluation for the Scrubber
5.3 Wet Scrubber/Waste Disposal
5.3.2.1 Theoretical Considerations 5.3.2.2 Practical Considerations 5.3.2.3 Conclusion
5.3.3 Liquid Waste Incineration 5.3.4 Maleic Anhydride Recovery
5.3.4.1 Process Description 5.3.4.2 Technical Evaluation
5.3.5 Biological Wastewater Treatment 5.3.5.1 Process Description 5.3.5.2 Technical Evaluation
iii
1 3 5 5 6 6 6 8 8 8
13
19 22 24
27 28 28 30 30 31 36 36 37 38 38 40 41 41 43 43 46 47 47 49 49 51 52 52 55

CONTENTS (continued)
5 . 4 Carbon Adsorber/Waste Incineration 56 5 . 4 . 1 System Description 56 5 . 4 . 2 Technical Evaluation 6 0 5 . 4 . 3 Conclusion 61
5 . 5 Condensation/Fiber Bed Filtration 61 5 . 6 CHAUNY Process (Process Modification) 6 2 5.6.1 Process Description 6 2 5 . 6 . 2 Technical Evaluation 6 4
5 . 7 Summary of the Technical Evaluation 6 5 6. Economic Evaluation and Energy Requirements 67
6.1 Economic Evaluation 6 9 6 . 2 Energy Requirements 7 0
Demonstration Programs 7 2 7 . 1 Selection of Most Feasible Systems, 7 2
7 . Most Feasible Alternatives and Recommended
7 . 2 Recommended Demonstration Programs 77 7 . 2 . 1 Thermal Incinerator/Steam Generation 77
7 . 2 . 1 . 1 Increase of Operating Temperature 77 7 . 2 . 1 . 2 Development of Improved Incinerator 79
7 . 2 . 1 . 2 . 1 Measurement of Temperature Distribution 7 9
7 . 2 . 1 . 2 . 2 Selection of burner and Mixing Devices 7 9
7 . 2 . 1 . 2 . 3 Full-scale Demonstration 7 9 7 . 2 . 2 Wet Scrubber/MAN Recovery 80
7 . 2 . 2 . 1 Pilot-Scale Testing of Improved Scrubber 80 7 . 2 . 2 . 2 Full-scale Demonstration of Scrubber EO
7 . 2 . 3 Carbon Adsorber/Waste Incineration EO 7 . 2 . 3 . 1 Laboratory-Scale Testing of Carbon Process E O 7 . 2 . 3 . 2 Full-scale Operation of the System 81
References 8 2 Appendices
A. Material Balance for Existing, Improved, and New Control Systems 8 5
B. Cost Model and Economic Assumptions 9 2 C. Detailed Estimates of 'Capital, Capitalized and
Operating Costs 9 5
iv

-_ Arirteth ChemVai Corporofion M10 Gronr Street Pintburgh. PA 15230-0250 A121 433.2747 Telex: 6503608865 Answer Bock: 6503608865MCI UW
ARlSTECHlllllll March 25, 1992
Mr. Dennis Beauregard Emission Inventory Branch (MD-14) Technical Support Division U.S. Environmental Protection Agency Office of Air Quality Planning and Standards Research Triangle Park, NC 27711
Dear Mr. Beauregard:
I have been asked to respond to your letter to our Mr. Ron O'Toole dated February 19, 1992. Aristech Chemical Corporation would be pleased to participate in the current update of the AP-42 phthalic anhydride industry profile.
Your specific technical questions regarding our process may be addressed to: Mr. Rex Shuff, Environmental Coordinator
Aristech Chemical Pasadena Plant P.O. Box 600 Pasadena, TX 77501
Your specific questions relating to commercial matters may be addressed to me 600 Grant Street, Pittsburgh, Pennsylvania 15219.
We look forward to your inquiries.
Sincerely, /Y
Senior Environmental Systems Consultant
cc: R. O'Toole R. Shuff

ARlSTECHlllllll
April 10, 1992
Arirtech Chemical Cormmiion Arirtech Chemical Corpoioiion 600 Grant Sired Pitsburgh, PA 15230-0250 41 2/433-2747 lelex: 6503608865 Answer Back: 6503608865MCI U W I 600 Grant Sired Pitsburgh, PA 15230-0250 41 2/433-2747 lelex: 6503608865 Answer Back: 6503608865MCI U W I
Mr. Dennis Beauregard Emission Inventory Branch (MD-14) Technical Support Division U . S . Environmental Protection Agency Office of Air Quality Planning and Standards Research Triangle Park, NC 27711
Dear Mr. Beauregard:
In further response to your letter dated February 19, 1992, Aristech Chemical Corporation is pleased to provide the enclosed commercial information on the phthalic anhydride industry for your update of AP-42.
We believe future growth in phthalic production will mirror GNP growth and will be orthoxylene based, as naphthalene is difficult to handle and generally produces more environmental emissions.
Though we have studied maleic recovery, we believe it to be prohibitively costly, and the recovered material would be of substandard quality.
The four attached graphs address the other questions posed in your letter. to Mr. Colin Campbell under separate cover.
Thank you for the opportunity to be of service. Do not hesitate to contact me should you desire clarification.
The technical data requested is being sent directly
Richard A. Harris Senior Environmental Systems Consultant
enclosures(4)
cc: R. Shuff
I
I
i
i

., ,
m


.

t U I- C/) 3
r L
i
I P
L. , . .
T
"4 . .
I.,
I - - I I I I
I CL