tr-159 bioassay of phthalic anhydride for possible ... · groups of 50 rats of each sex were...
TRANSCRIPT

T National Cancer Institute
-H I CARCINOGENESIS
Technical Report Series = NO. 159 £ 1979
I
O
D m
BIOASSAY OF
OFFICIAL NTP FILE COPY
DO NOT REMOVE FROM THIS OFFICE
PHTHALIC ANHYDRIDE
FOR POSSIBLE CARCINOGENICITY
CAS No. 85-44-9
NCI-CG-TR-159
z o 6 o H 30
Ul CO
U.S. DEPARTMENT OF HEALTH, EDUCATION, AND WELFARE Public Health Service National Institutes of Health
(O>g CO


BIOASSAY OF
PHTHALIC ANHYDRIDE
FOR POSSIBLE CARCINOGENICITY
Carcinogenesis Testing Program Division of Cancer Cause and Prevention
National Cancer Institute National Institutes of Health Bethesda, Maryland 20014
U.S. DEPARTMENT OF HEALTH, EDUCATION, AND WELFARE Public Health Service
National Institutes of Health
DHEW Publication No. (NIH) 79-1715

ii

BIOASSAY OF PHTHALIC ANHYDRIDE
FOR POSSIBLE CARCINOGENICITY
Carcinogenesis Testing Program Division of Cancer Cause and Prevention
National Cancer Institute National Institutes of Health
FOREWORD; This report presents the results of the bioassay of phthalic anhydride conducted for the Carcinogenesis Testing Program, Division of Cancer Cause and Prevention, National Cancer Institute (NCI), National Institutes of Health, Bethesda, Maryland. This is one of a series of experiments designed to determine whether selected chemicals have the capacity to produce cancer in animals. Negative results, in which the test animals do not have a greater incidence of cancer than control animals, do not necessarily mean that the test chemical is not a carcinogen, inasmuch as the experiments are conducted under a limited set of circumstances. Positive results demonstrate that the test chemical is carcinogenic for animals under the conditions of the test and indicate that exposure to the chemical is a potential risk to man. The actual determination of the risk to man from chemicals found to be carcinogenic in animals requires a wider analysis.
CONTRIBUTORS: This bioassay of phthalic anhydride was conducted by the NCI Frederick Cancer Research Center (FCRC) (1), Frederick, Maryland, operated for NCI (2) by Litton Bionetics, Inc.
The manager of the bioassay at FCRC was Dr. B. Ulland, the toxicologist was Dr. E. Gordon, and Drs. R. Cardy and D. Creasia compiled the data. Ms. S. Toms was responsible for management of data, Mr. D. Cameron for management of histopathology, Mr. L. Callahan for management of the computer branch, and Mr. R. Cypher for the management of the facilities. Mr. A. Butler performed the computer services. The histopathology of early deaths was performed by Drs. B. Ulland, R. Schueler, R. Ball, and R. Cardy. The lesions of the rats and mice were reviewed by Dr. D. G. Fairchild (D? and the diagnoses included in this report represent his interpretations.
Animal pathology tables and survival tables were compiled at EG&G Mason Research Institute (3). Statistical analyses were
ill

performed by Dr. J. R. Joiner (4) and Ms. P. L. Yong (4), using methods selected for the bioassay program by Dr. J. J. Gart (5). The chemicals used in this bioassay were analyzed at FCRC by Dr. W. Zielinsky (1). The chemical analyses were reviewed and approved by Dr. W. Lijinski (1).
This report was prepared by Tracer Jitco (4) under the direction of NCI. Those responsible for the report at Tracer Jitco were Dr. C. R. Angel, Acting Director of the Bioassay Program; Dr. S. S. Olin, Deputy Director for Science; Dr. J. F. Robens, toxicologist; Dr. R. L. Schueler, pathologist; Dr. G. L. Miller, Ms. L. A. Waitz, Ms. M. S. King, and Mr. W. D. Reichardt, bioscience writers; and Dr. E. W. Gunberg, technical editor, assisted by Ms. Y. E. Presley.
The following scientists at NCI (2) were responsible for evaluating the bioassay experiment, interpreting the results, and reporting the findings: Dr. Kenneth C. Chu, Dr. Cipriano Cueto, Jr., Dr. J. Fielding Douglas, Dr. Richard A. Griesemer, Dr. Thomas E. Hamm, Dr. William V. Hartwell, Dr. Morton H. Levitt, Dr. Harry A. Milman, Dr. Thomas W. Orme, Dr. Sherman F. Stinson, Dr. Jerrold M. Ward, and Dr. Carrie E. Whitmire.
(1) Frederick Cancer Research Center, P.O. Box B, Frederick, Maryland.
(2) Carcinogenesis Testing Program, Division of Cancer Cause and Prevention, National Cancer Institute, National Institutes of Health, Bethesda, Maryland.
(3) EG&G Mason Research Institute, 1530 East Jefferson Street, Rockville, Maryland.
(4) Tracer Jitco, Inc., 1776 East Jefferson Street, Rockville, Maryland.
(5) Mathematical Statistics and Applied Mathematics Section, Biometry Branch, Field Studies and Statistics, Division of Cancer Cause and Prevention, National Cancer Institute, National Institutes of Health, Bethesda, Maryland.
iv

SUMMARY
A bioassay of phthalic anhydride for possible carcinogenicity was conducted by administering the test chemical in feed to F344 rats and B6C3F1 mice.
Groups of 50 rats of each sex were administered phthalic anhydride at one of two doses, either 7,500 or 15,000 ppm, for 105 weeks. Matched controls consisted of 20 untreated rats of each sex. All surviving rats were killed at the end of the period of administration of the test chemical.
Groups of 50 mice of each sex were administered the test chemical at one of two doses, initially either 25,000 or 50,000 ppm, for 32 weeks. Because of excessive depressions in the amount of body weight gained in the dosed groups, the doses for the males were then reduced to 12,500 and 25,000 ppm, respectively, and the doses for the females were reduced to 6,250 and 12,500 ppm. Administration of the test chemical at the lowered doses was continued for 72 weeks. The time-weighted average doses for the males were either 16,346 or 32,692 ppm, and those for the females were either 12,019 or 24,038 ppm. Matched controls consisted of 20 untreated mice of each sex. All surviving mice were killed at the end of the period of administration of the test chemical.
Mean body weights of the high-dose male rats and of the low- and high-dose mice of each sex were lower than those of the corresponding controls; mean body weights of the low-dose male rats and of both the low- and high-dose female rats were essentially unaffected by administration of the test chemical. Depressions in the amount of body weight gained in the male and female mice were dose related throughout the bioassay. Survivals of the rats and mice were not affected by administration of the test chemical.
No tumors occurred in the rats or mice of either sex at incidences that could be clearly related to the administration of the test chemical.
It is concluded that under the conditions of this bioassay, phthalic anhydride was not carcinogenic for F344 rats or B6C3F1 mice of either sex.
v

vi
TABLE OF CONTENTS
Page
I. Introduction 1
II. Materials and Methods 5
A. Chemical 5 B. Dietary Preparation 5 C. Animals 6 D. Animal Maintenance 7 E. Subchronic Studies 9 F. Chronic Studies 12 G. Clinical and Pathologic Examinations 12 H. Data Recording and Statistical Analyses 15
III. Resul ts - Rats 21
A. Body Weights and Clinical Signs (Rats) 21 B. Survival (Rats) 21 C. Pathology (Rats) 24 D. Statistical Analyses of Results (Rats) 25
IV. Results - Mice 29
A. Body Weights and Clinical Signs (Mice) 29 B. Survival (Mice) .' 29 C. Pathology (Mice) 32 D. Statistical Analyses of Results (Mice) 33
V. Discussion 35
VI. Bibliography 37
APPENDIXES
Appendix A Summary of the Incidence of Neoplasms in Rats Administered Phthalic Anhydride in the Diet 39
Table Al Summary of the Incidence of Neoplasms in Male Rats Administered Phthalic Anhydride in the Diet 41
vii

Page
Table A2 Summary of the Incidence of Neoplasms in Female Rats Administered Phthalic Anhydride in the Diet 45
Appendix B Summary of the Incidence of Neoplasms in Mice Administered Phthalic Anhydride in the Diet .. 49
Table Bl Summary of the Incidence of Neoplasms in Male Mice Administered Phthalic Anhydride in the Diet 51
Table B2 Summary of the Incidence of Neoplasms in Female Mice Administered Phthalic Anhydride in the Diet 54
Appendix C Summary of the Incidence of Nonneoplastic Lesions in Rats Administered Phthalic Anhydride in the Diet 59
Table Cl Summary of the Incidence of Nonneoplastic Lesions in Male Rats Administered Phthalic Anhydride in the Diet 61
Table C2 Summary of the Incidence of Nonneoplastic Lesions in Female Rats Administered Phthalic Anhydride in the Diet 68
Appendix D Summary of the Incidence of Nonneoplastic Lesions in Mice Administered Phthalic Anhydride in the Diet 75
Table Dl Summary of the Incidence of Nonneoplastic Lesions in Male Mice Administered Phthalic Anhydride in the Diet 77
Table D2 Summary of the Incidence of Nonneoplastic Lesions in Female Mice Administered Phthalic Anhydride in the Diet 81
Appendix E Analyses of the Incidence of Primary Tumors in Rats Administered Phthalic Anhydride in the Diet 87
viii
Page
Table El Analyses of the Incidence of Primary Tumors in Male Rats Administered Phthalic Anhydride in the Diet 89
Table E2 Analyses of the Incidence of Primary Tumors in Female Rats Administered Phthalic Anhydride in the Diet 94
Appendix F Analyses of the Incidence of Primary Tumors in Mice Administered Phthalic Anhydride in the Diet 99
Table Fl Analyses of the Incidence of Primary Tumors in Male Mice Administered Phthalic Anhydride in the Diet 101
Table F2 Analyses of the Incidence of Primary Tumors in Female Mice Administered Phthalic Anhydride in the Diet 104
TABLES
Table 1 Phthalic Anhydride Subchronic Feeding Studies in Rats and Mice 10
Table 2 Phthalic Anhydride Chronic Feeding Studies in Rats 13
Table 3 Phthalic Anhydride Chronic Feeding Studies in Mice 14
FIGURES
Figure 1 Growth Curves for Rats Administered Phthalic Anhydride in the Diet 22
Figure 2 Survival Curves for Rats Administered Phthalic Anhydride in the Diet 23
Figure 3 Growth Curves for Mice Administered Phthalic Anhydride in the Diet 30
IX

Page
Figure 4 Survival Curves for Mice Administered Phthalic Anhydride in the Diet 31
x

I. INTRODUCTION
Phthalic anhydride (CAS
85-44-9; NCI C03601) is an
important chemical intermediate
in the plastics industry. From
it are derived numerous
Phthalic anhydride phthalate esters that function
as plasticizers in synthetic
resins (Knuth, 1973; Noller, 1966). Phthalic anhydride itself is
f used as a monomer for synthetic resins such as glyptal, the alkyd
resins, and the polyester resins (Noller, 1966). Phthalic
anhydride is a precursor of anthraquinone, phthalein, rhodamine,
phthalocyanine, fluorescein, and xanthene dyes (Towle et al.,
1968; Noller, 1966). Reaction of phthalic anhydride with ammonia
yields phthalimide, a useful reagent in the synthesis of primary
amines, the agricultural fungicide phaltan, and thalidomide
(Noller, 1966). Other reactions yield phenolphthalein, benzoic
acid, phthalylsulfathiazole (an intestinal antimicrobial agent),
and terephthalic acid (Towle et al., 1968; Noller, 1966).
The oral cn of phthalic anhydride for rats (strains not
specified) has been reported as 800-1,600 mg/kg body weight
(Fassett, 1964) and as 4,020 mg/kg body weight (NIOSH, 1976); the
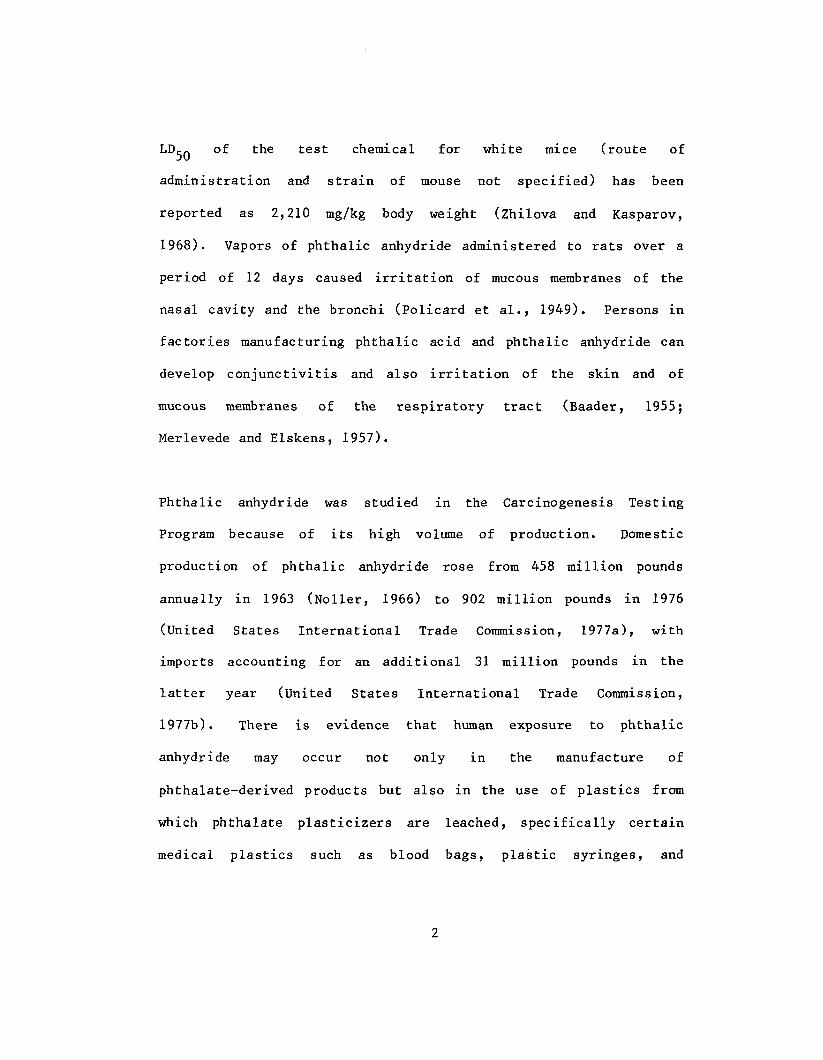
LDc0 of the test chemical for white mice (route of
administration and strain of mouse not specified) has been
reported as 2,210 mg/kg body weight (Zhilova and Kasparov,
1968). Vapors of phthalic anhydride administered to rats over a
period of 12 days caused irritation of mucous membranes of the
nasal cavity and the bronchi (Policard et al., 1949). Persons in
factories manufacturing phthalic acid and phthalic anhydride can
develop conjunctivitis and also irritation of the skin and of
mucous membranes of the respiratory tract (Baader, 1955;
Merlevede and Elskens, 1957).
Phthalic anhydride was studied in the Carcinogenesis Testing
Program because of its high volume of production. Domestic
production of phthalic anhydride rose from 458 million pounds
annually in 1963 (Noller, 1966) to 902 million pounds in 1976
(United States International Trade Commission, 1977a), with
imports accounting for an additional 31 million pounds in the
latter year (United States International Trade Commission,
1977b). There is evidence that human exposure to phthalic
anhydride may occur not only in the manufacture of
phthalate-derived products but also in the use of plastics from
which phthalate plasticizers are leached, specifically certain
medical plastics such as blood bags, plastic syringes, and

plastic tubing (Guess et al., 1967). Furthermore, some phthalate
esters have been identified as environmental pollutants (Giam et
al., 1978).


II. MATERIALS AND METHODS
A. Chemical
Phthalic anhydride was obtained from Koppers Co. as a white,
granular solid. The material had a melting point of 131 C
(literature: 130.8 C). Elemental analysis showed 64.8% carbon,
2.7% hydrogen, and 0.0% nitrogen (theoretical: 64.9%, 2 .7%, and
0.0%). Its infrared spectrum was consistent with its chemical
structure, and identical with that of an authentic standard. The
purity of the material was estimated by high-pressure liquid
chromatography to be 98.8%, with one impurity.
B. Dietary Preparation
Test diets containing phthalic anhydride were prepared fresh every
1 to 1-1/2 weeks in 6- to 12-kg batches at appropriate doses. A
known weight of the chemical was first mixed with an equal weight
of autoe laved Wayne® Sterilizable Lab Meal with 4% fat (Allied
Mills, Inc., Chicago, 111.) using a mortar and pestle. The mixing
was continued with second and third additions of feed, and final
mixing was performed with the remaining quantity of feed for a

minimum of 15 minutes in a Patterson-Kelly twin-shell blender. The
diets were routinely stored at 5 C until used. Analyses by the
Frederick Cancer Research Center indicated that when phthalic
anhydride was mixed with Lab Meal at a concentration of 15,000 ppm
and stored at room temperature for 2 weeks, the loss was 2 .59%
(372 ppm) per day.
C. Animals
Male and female F344 rats and B6C3F1 mice were obtained through
contracts of the Division of Cancer Treatment, National Cancer
Institute, from the NCI Frederick Cancer Research Center animal
farm, Frederick, Maryland as 4-week-old weanlings, all within 3
days of the same age. The animals were housed within the test
facility for 2 weeks and then were assigned four rats to a cage
and five mice to a cage on a weight basis for a given species and
sex. For use in the chronic study, the male rats were required to
weigh 90 to 105 g, averaging at least 100 g; the female rats, 80
to 95 g, averaging at least 90 g; the male mice, 18 to 22 g, aver
aging at least 19.5 g; and the female mice 17 to 21 g, averaging
at least 18.5 g. Individual animals were identified by ear punch.

D. Animal Maintenance
The animals were housed in polycarbonate cages (Lab Products,
Inc., Garfield, N.J.), 19 x 10-1/2 x 8 inches for the rats and
11-1/2 x 7-1/2 x 5 inches for the mice. The cages were suspended
from aluminum racks (Scientific Cages, Inc., Bryan, Tex.) and
were covered by nonwoven polyester-fiber 12-mil-thick filter
paper (Hoeltge, Inc., Cincinnati, Ohio). The bedding used was
Absorb-dri hardwood chips (Northeastern Products, Inc.,
Warrenburg, N.Y.). The feed supplied was presterilized Wayne
Sterilizable Lab Meal provided ad libitum in suspended stainless
steel hoppers and replenished at least three times per week.
Water, acidified to pH 2.5, was supplied ad libitum from glass
bottles. Sipper tubes (Lab Products, Inc.) were suspended
through the tops of the cages.
The contaminated bedding was disposed of through an enclosed
vacuum line that led to a holding tank from which the bedding was
fed periodically into an incinerator. The cages were sanitized
twice per week and the feed hoppers twice per month at 82 to
88 C in a tunnel-type cagewasher (industrial Washing Corp.,
Mataway, N.J.), using the detergents, Clout (Pharmacal
Research Laboratories, Greenwich, Conn.) or Oxford D'Chlor
(Oxford Chemicals, Atlanta, Ga.).
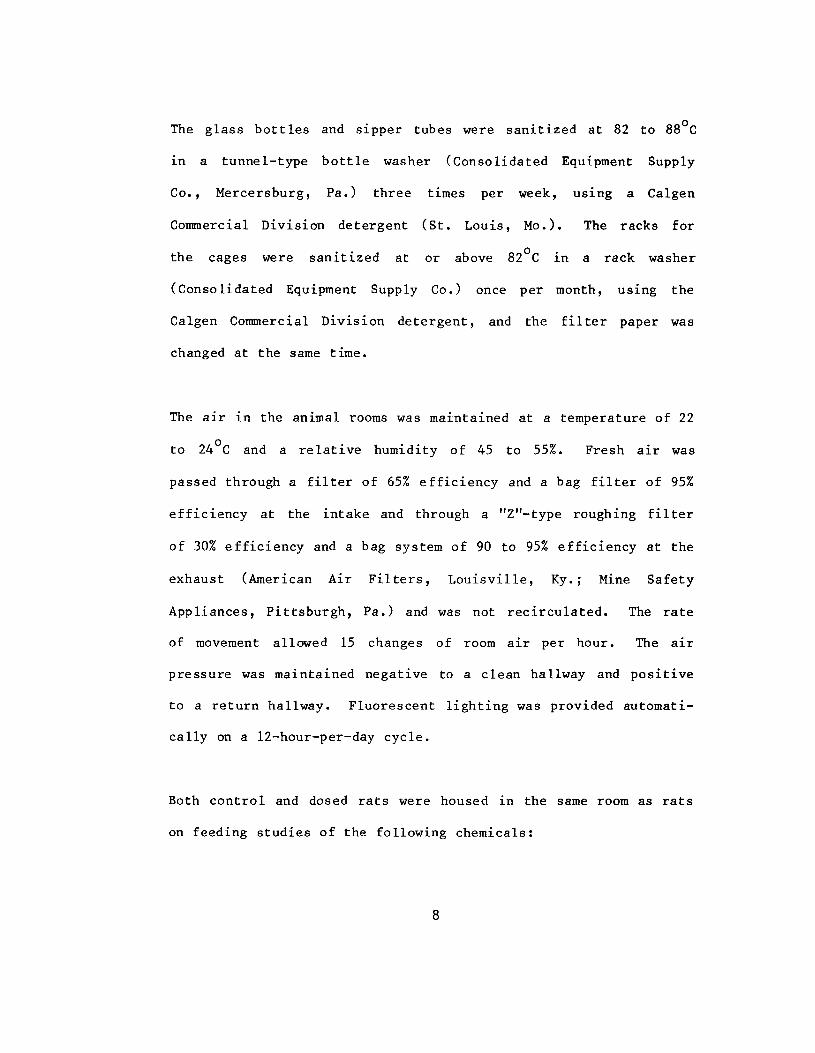
The glass bottles and sipper tubes were sanitized at 82 to 88 C
in a tunnel-type bottle washer (Consolidated Equipment Supply
Co., Mercersburg, Pa.) three times per week, using a Calgen
Commercial Division detergent (St. Louis, Mo.). The racks for
the cages were sanitized at or above 82 C in a rack washer
(Consolidated Equipment Supply Co.) once per month, using the
Calgen Commercial Division detergent, and the filter paper was
changed at the same time.
The air in the animal rooms was maintained at a temperature of 22
to 24 C and a relative humidity of 45 to 55%. Fresh air was
passed through a filter of 65% efficiency and a bag filter of 95%
efficiency at the intake and through a "Z"-type roughing filter
of 30% efficiency and a bag system of 90 to 95% efficiency at the
exhaust (American Air Filters, Louisville, Ky.; Mine Safety
Appliances, Pittsburgh, Pa.) and was not recirculated. The rate
of movement allowed 15 changes of room air per hour. The air
pressure was maintained negative to a clean hallway and positive
to a return hallway. Fluorescent lighting was provided automati
cally on a 12-hour-per-day cycle.
Both control and dosed rats were housed in the same room as rats
on feeding studies of the following chemicals:
(CAS 95-80-7) 2,4-diaminotoluene (CAS 95-53-4) o-toluidine hydrochloride
Both control and dosed mice were housed in the same room as mice
on feeding studies of the following chemicals:
(CAS 103-33-3) azobenzene (CAS 72-56-0) p,p'-ethyl-DDD (CAS 20941-65-5) ethyl tellurac (CAS 298-00-0) methyl parathion (CAS 51-03-6) piperonyl butoxide (CAS 88-06-2) 2,4,6-trichlorophenol (CAS 128-66-5) C. I. vat yellow 4
E. Subchronic Studies *
Subchronic feeding studies were conducted to estimate the maximum
tolerated doses (MTD's) of phthalic anhydride, on the basis of
which two concentrations (hereinafter referred to as "low" and
"high" doses) were selected for administration in the chronic
studies. Groups of five rats and five mice of each sex were
administered feed containing phthalic anhydride at one of several
doses, and groups of five control animals of each species and sex
were administered basal diet only. The period of administration
of the test chemical was 7 weeks, followed by 1 week of further
observation. Each animal was weighed twice per week. Table 1
shows the doses used and the mean body weights of dosed animals
at week 7 expressed as percentages of the mean weights of the
controls; no animals died during the Subchronic tests.
9

Table 1. Phthalic Anhydride Subchronic Feeding Studies in Rats and Mice
Mean Weight at Week 7 as Percent of Control Dose (ppm) Male Female
RATS
6,200 90 95 12,500 95 93 25,000 92 91 50,000 74 76
MICE
6,200 114 100 12,500 113 99 25 ,'000 111 101 50,000 104 99
10
At the end of the Subchronic studies, all animals were killed
using C0? inhalation and necropsied. The lowest dose at which
histopathologic findings were observed in male and female rats
was 25,000 ppm. At this dose, trace amounts of centrilobular
cytoplasmic vacuolation were seen in the livers of four males;
however, tissues were essentially normal in both males and
females at 50,000 ppm. Tissues were essentially normal also in
male and female mice at 50,000 ppm.
Ten percent depression in body weight was taken as the major
criterion for the estimation of MTD's. The doses required to
produce this response were determined by the following procedure:
first, least squares regressions of mean body weights versus days )
on study were used to estimate mean body weights of each of the
dosed groups at day 49. Next, probits of the percent weights of
the dosed groups at day 49 relative to weights of corresponding
control groups were plotted against the logarithms of the doses,
and least squares regressions fitted to the data were used to
estimate the doses required to induce 10% depression in weight.
Based on these data, the low and high doses for the chronic
studies using male and female rats were set at 7,500 and 15,000
ppm. For mice, the low dose was set at 25,000 and the high dose
at 50,000 ppm, the maximum amount allowed for use in the
Carcinogenesis Testing Program.
11
F. Chronic Studies
The test groups, doses administered, and durations of the chronic
feeding studies are shown in tables 2 and 3. Because of exces
sive depression of the amount of body weight gained in the dosed
mice, doses for the low- and high-dose groups were reduced after
week 32 as indicated.
G. Clinical and Pathologic Examinations
All animals were checked twice daily for deaths. Observations
for sick, tumor-bearing, and moribund animals were recorded daily.
Clinical examination and palpation for masses were performed each
month, and the animals were weighed at least once per month.
Moribund animals and animals that survived to the end of the
bioassay were killed using C0_ and necropsied. Necropsies were
also performed on all animals found dead, unless precluded by
autolysis or severe cannibalization.
The pathologic evaluation consisted of gross- and microscopic
examination of major tissues, major organs, and all gross
lesions. The tissues were preserved in 10% neutral buffered
formalin, embedded in paraffin, sectioned, and stained with
12

Table 2. Phthalic Anhydride Chronic Feeding Studies in Rats
Phthalic Sex and Initial Anhydride Time on Test No. of in Diet(b) Study Group Animals(a) (ppm) (weeks)
Male
Matched-Control 20 0 105
Low-Dose 50 7,500 105
High -Dose 50 15,000 105
Female
Matched -Control 20 0 105
Low-Dose 50 7,500 105
High-Dose 50 15,000 105
(a) All animals were 6 weeks of age when placed on study.
(b) Test and control diets were provided ad libitum 7 days per week.
13

Table 3. Phthalic Anhydride Chronic Feeding Studies in Mice
Phthalic Sex and Initial Anhydride T ime on Time-Weighted Test No. of in Diet(b) Study Average Dose(c) Group Animals (a) (ppm) (weeks) (ppm)
Male
Matched-Control 20 0 104
Low-Dose 50 25,000 32 12,500 72 16,346
High-Dose 50 50,000 32 25,000 72 32,692
Female
Matched-Control 20 0 104
Low-Dose 50 25,000 32 12,019 6,250 72
High-Dose 50 50,000 32 12,500 72 24,038
(a) All animals were 6 weeks of age when placed on study.
(b) Test and control diets were provided ad 1ibiturn 7 days per week.
(c) Time-weighted average dose = z(dose in ppm x no. of weeks at that dose) £(no.of weeks receiving each dose)
14

hematoxylin and eosin. The following tissues were examined
microscopically: skin, lungs and bronchi, trachea, bone marrow
(femur), spleen, lymph nodes (mesenteric and submandibular),
thymus, heart, salivary glands (parotid, sublingual, and
submaxillary), liver, pancreas, esophagus, stomach (glandular and
nonglandular), small and large intestines, kidney, urinary
bladder, pituitary, adrenal, thyroid, parathyroid, pancreatic
islets, testis, prostate, mammary gland, uterus, ovary, brain
(cerebrum and cerebellum), and all tissue masses. Peripheral
blood smears also were made for all animals, whenever possible.
A few tissues from some animals were not examined, particularly
from those animals that may have died early, been missing, or
been in advanced states of cannibalization or autolysis. Thus,
the number of animals from which particular organs or tissues
were examined microscopically varies and does not necessarily
represent the number of animals that were placed on study in each
group.
H. Data Recording and Statistical Analyses
Pertinent data on this experiment have been recorded in an
automatic data processing system, the Carcinogenesis Bioassay
15

Data System (Linhart et al., 1974). The data elements include
descriptive information on the chemicals, animals, experimental
design, clinical observations, survival, body weight, and
individual pathologic results, as recommended by the
International Union Against Cancer (Berenblum, 1969). Data
tables were generated for verification of data transcription and
for statistical review.
These data were analyzed using the appropriate statistical
techniques described in this section. Those analyses of the
experimental results that bear on the possibility of
carcinogenicity are discussed in the statistical narrative
sections.
Probabilities of survival were estimated by the product-limit
procedure of Kaplan and Meier (1958) and are presented in this
report in the form of graphs. Animals were statistically
censored as of the time that they died of other than natural
causes or were found to be missing; animals dying from natural
causes were not statistically censored. Statistical analyses for
a possible dose-related effect on survival used the method of Cox
(1972) for testing two groups for equality and Tarone's (1975)
extensions of Cox methods for testing for a dose-related trend.
One-tailed P values have been reported for all tests except the
16

departure from linearity test, which is only reported when its
two-tailed P value is less than 0.05.
The incidence of neoplastic or nonneoplastic lesions has been
given as the ratio of the number of animals bearing such lesions
at a specific anatomic site (numerator) to the number of animals
in which that site is examined (denominator). In most instances,
the denominators included only those animals for which that site
was examined histologically. However, when macroscopic
examination was required to detect lesions prior to histologic
sampling (e.g., skin or mammary tumors), or when lesions could
have appeared at multiple sites (e.g. , lymphomas), the
denominators consist of the numbers of animals necropsied. The
purpose of the statistical analyses of tumor incidence is to
determine whether animals receiving the test chemical developed a
significantly higher proportion of tumors than did the control
animals. As a part of these analyses, the one-tailed Fisher
exact test (Cox, 1970) was used to compare the tumor incidence of
a control group with that of a group of dosed animals at each
dose level. When results for a number of dosed groups (k) are
compared simultaneously with those for a control group, a
correction to ensure an overall significance level of 0.05 may be
made. The Bonferroni inequality (Miller, 1966) requires that the
P value for any comparison be less than or equal to 0.05/k. In
17

cases where this correction was used, it is discussed in the
narrative section. It is not, however, presented in the tables,
where the Fisher exact P values are shown.
The Cochran-Armitage test for linear trend in proportions, with
continuity correction (Armitage, 1971), was also used. Under the
assumption of a linear trend, this test determines if the slope
of the dose-response curve is different from zero at the one-
tailed 0.05 level of significance. Unless otherwise noted, the
direction of the significant trend is a positive dose relation
ship. This method also provides a two-tailed test of departure
from linear trend.
A time-adjusted analysis was applied when numerous early deaths
resulted from causes that were not associated with the formation
of tumors. In this analysis, deaths that occurred before the
first tumor was observed were excluded by basing the statistical
tests on animals that survived at least 52 weeks, unless a tumor
was found at the anatomic site of interest before week 52. When
such an early tumor was found, comparisons were based exclusively
on animals that survived at least as long as the animal in which
the first tumor was found. Once this reduced set of data was
obtained, the standard procedures for analyses of the incidence
18
of tumors (Fisher exact tests, Cochran-Armitage tests, etc.) were
followed.
When appropriate, life-table methods were used to analyze the
incidence of tumors. Curves of the proportions surviving without
an observed tumor were computed as in Saffiotti et al. (1972).
The week during which an animal died naturally or was sacrificed
was entered as the time point of tumor observation. Cox's methods
of comparing these curves were used for two groups; Tarone's
extension to testing for linear trend was used for three groups.
The statistical tests for the incidence of tumors which used
life-table methods were one-tailed and, unless otherwise noted,
in the direction of a positive dose relationship. Significant
departures from linearity (P less than 0.05, two-tailed test)
were also noted.
The approximate 95 percent confidence interval for the relative
risk of each dosed group compared with its control was calculated
from the exact interval on the odds ratio (Gart, 1971). The
relative risk is defined as pf/p where p is the true
binomial probability of the incidence of a specific type of tumor
in a dosed group of animals and p is the true probability of
the spontaneous incidence of the same type of tumor in a control
group. The hypothesis of equality between the true proportion of
19

a specific tumor in a dosed group and the proportion in a control
group corresponds to a relative risk of unity. Values in excess
of unity represent the condition of a larger proportion in the
dosed group than in the control.
The lower and upper limits of the confidence interval of the
relative risk have been included in the tables of statistical
analyses. The interpretation of the limits is that in
approximately 95% of a large number of identical experiments, the
true ratio of the risk in a dosed group of animals to that in a
control group would be within the interval calculated from the
experiment. When the lower limit of the confidence interval is
greater than one, it can be inferred that a statistically
significant result (P less than 0.025 one-tailed test when the
control incidence is not zero, P less than 0.050 when the control
incidence is zero) has occurred. When the lower limit is less
than unity, but the upper limit is a greater than unity, the
lower limit indicates the absence of a significant result while
the upper limit indicates that there is a theoretical possibility
of the induction of tumors by the test chemical, which could not
be detected under the conditions of this test.
20
III. RESULTS - RATS
A. Body Weights and Clinical Signs (Rats)
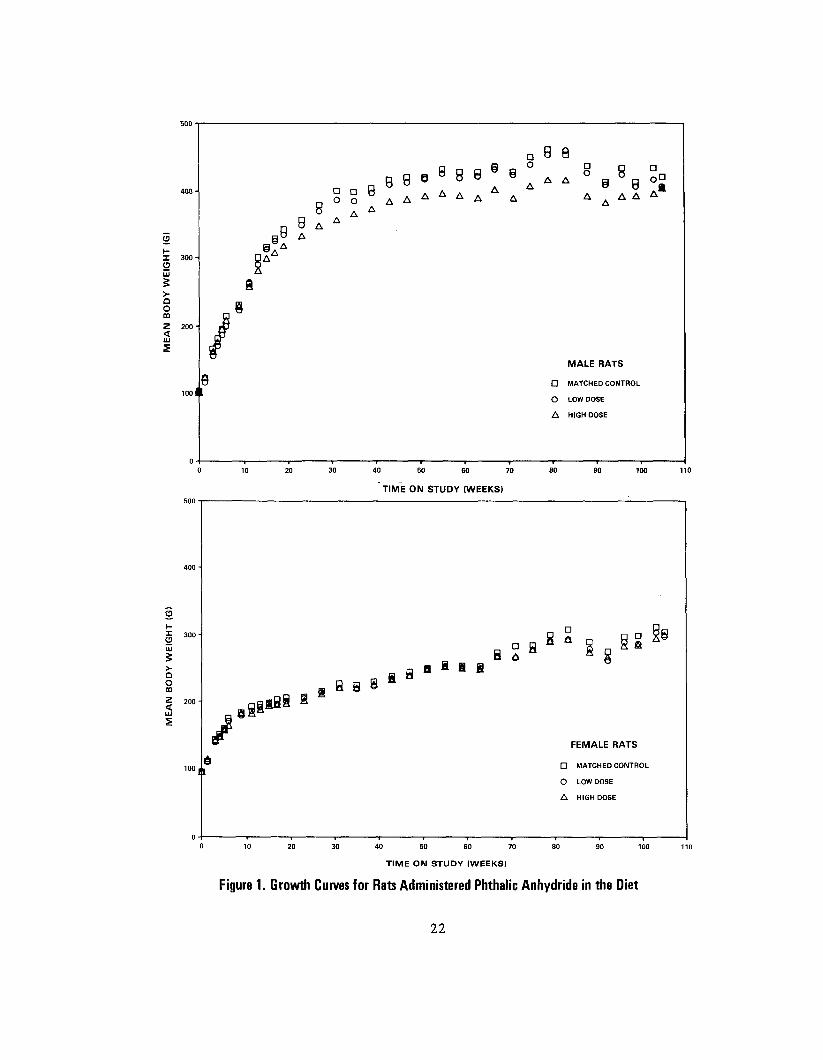
The mean body weights of the high-dose male rats were lower than
those of the corresponding controls from week 13 to the end of
the bioassay; mean body weights of the low-dose males and both
the low- and high-dose females were essentially unaffected by
administration of the test chemical (figure 1). Arched back,
rough hair coat, ulceration, and corneal opacity occurred only in
dosed groups, but at low incidences. Wasting and tissue masses
were common to the dosed and control groups. Fluctuation in the
growth curves may be due to mortality; as the size of a group
diminishes, the mean body weight may be subject to variation.
B. Survival (Rats)
The Kaplan and Meier curves estimating the probabilities of
survival for male and female rats administered phthalic anhydride
in the diet at the doses of this bioassay, together with those of
the matched controls, are shown in figure 2. The result of the
Tarone test for dose-related trend in mortality is not significant
21
D 9 8
8 « B 5 8 @ i ° A
A A A A A
O
Io u!
300
^ Q O m z 200
e 1001 I
D
O
A
MALE RATS
MATCHED CONTROL
LOW DOSE
HIGH DOSE
40 50 60 70
TIME ON STUDY (WEEKS)
S3 UI
D ffl
> a B o m B 8 8
ilBi
FEMALE RATS
D MATCHED CONTROL
O LOW DOSE
A HIGH DOSE
TIME ON STUDY (WEEKS)
Figure 1. Growth Curves for Rats Administered Phthalic Anhydride in the Diet
22

^
0.90 •
0.80
_! 0.70 •
U_ 0
0.50
t
5 CO o ccp^
000
0.90
_l °'7° "
< >
<f>
U.
>
^Jto „,..
PR
OB
A
3 O
C
J
W
{
3 O
c
MALE RA1 •s
c] MATCHED CO
CD LOW DOSiE
^ HIGH DOSE
fee" -••-••-• •-••-..
FEMALE RX vrs
3 MATCH ED CO
CD LOW DOSE
1 HIGH DOSE
A-"" < 3o, )Gj
A-..;
|
45 60 75
TIME ON STUDY (WEEKS)
4 •••OrV"""* |^^f *
"rW&JW
Foi
TIME ON STUDY (WEEKS)
Figure 2. Survival Curves for Rats Administered Phthalic Anhydride in the Diet
23

in either sex. In male rats, an indicated departure from linear
trend (P = 0.037) is observed, due to the earlier mortality of
the control group when compared with that of either the high- or
low-dose group. The results of the Cox test applied to any two
of the three groups show no statistically significant difference
between groups of any pair.
In male rats, 36/50 (72%) of the high-dose group, 44/50 (88%) of
the low-dose group, and 14/20 (70%) of the control group lived to
the end of the bioassay. In females, 41/50 (82%) of the
high-dose group, 42/50 (84%) of the low-dose group, and 17/20
(85%) of the control group lived to the end of the bioassay.
Sufficient numbers of rats of each sex were at risk for the
development of late-appearing tumors.
C. Pathology (Rats)
Histopathologic findings on neoplasms in rats are summarized in
Appendix A, tables Al and A2; findings on nonneoplastic lesions
are summarized in Appendix C, tables Cl and C2.
24

By inspection, there appeared to be no difference between the
dosed and control groups in frequency or distribution of
neoplasms, except for malignant lymphoma in the female rats. The
incidence of malignant lymphoma in the control females was 1/20;
in low-dose females, 11/50; in high-dose females, 4/50. Due to
the high and fluctuating incidence of this type of malignant
lymphoma in control F344 rats, the apparent differences in
incidences of the tumor in the dosed and control groups were not
considered to be compound related.
Severe chronic inflammatory, degenerative, or proliferative
lesions frequently seen in aged rats occurred with approximately
equal frequency and severity in the dosed and control groups of
animals.
Based on the histopathologic examination, there was no conclusive
evidence for the carcinogenicity of phthalic anhydride in F344
rats under the conditions of this bioassay.
D. Statistical Analyses of Results (Rats)
Tables El and E2 in Appendix E contain the statistical analyses
of the incidences of those primary tumors that occurred in at
25

least two animals of one group and at an incidence of at least 5%
in one or more than one group.
In female rats, the result of the Cochran-Armitage test for
positive dose-related trend in the incidence of alveolar/
bronchiolar adenomas is significant (P = 0.020), but the results
of the Fisher exact test are not significant. The results of the
statistical tests on the incidences of alveolar/bronchiolar
carcinomas and of alveolar/bronchiolar adenomas or carcinomas are
not significant. In male rats, the results of the statistical
tests on the incidences of lung tumors are not significant.
A departure from linear trend (P = 0.019) is found in the
incidence of lymphoma in female rats, due to the relatively large
proportion of 11/50 (22%) in the low-dose group compared with
4/50 (8%) in the high-dose group and 1/20 (5%) in the control
group. The results of the Fisher exact test are not
significant. Current historical records at this laboratory
indicate an incidence of lymphoma in female rats of 14/285
(4.9%), and, although the majority of the control groups had
incidences of less than 5%, one control grout) was observed to
have an incidence as high as 4/20 (20%). Since the results of
the Fisher exact test were not significant and since the
historical data concerning lymphoma indicates the possibility of
26

an occasional high spontaneous rate of lymphoma, the evidence of
association of the lymphomas in the dosed group of female rats
with the chemical is questionable.
A significant dose-related trend (P = 0.037) in the negative
direction is observed in the incidence of pheochromocytomas of
the adrenal in male rats.
In each of the 95% confidence intervals for relative risk, shown
in the tables, one is included; this indicates the absence of
significant positive results. It should also be noted that each
of the intervals has an upper limit greater than one, indicating
the theoretical possibility of the induction of tumors by
phthalic anhydride, which could not be detected under the
conditions of this test.
27

28

IV. RESULTS - MICE
A. Body Weights and Clinical Signs (Mice)
Mean body weights of dosed male and female mice were lower than
those of corresponding controls throughout the bioassay, and
depressions in the amount of body weight gained were dose related
(figure 3). Tissue masses were observed at low incidences and
were common to the dosed and control groups. Fluctuation in the
growth curves may be due to mortality; as the size of a group
diminishes, the mean body weight may be subject to variation.
B. Survival (Mice)
The Kaplan and Meier curves estimating the probabilities of
survival for male and female mice administered phthalic anhydride
in the diet at the doses of this bioassay, together with those of
the matched controls, are shown in figure 4. The result of the
Tarone test for dose-related trend in mortality is not
significant in either sex.
j In male mice, 47/50 (94%) of the high-dose group, 37/50 (74%) of
29

O GO O O
g >.Q O m
30 nB8°AA
HQ5A
00
DO
A
o A
A
A AA . AA AA
5 20- i
MALE MICE
D MATCHED CONTROL
O LOW DOSE
A HIGH DOSE
10 20 30 40 50 60 70 90 100
TIME ON STUDY (WEEKS)
O % O 00
A :oDocP AA
o of °°aP
<
FEMALE MICE
D MATCHED CONTROL
O LOW DOSE
A HIGH DOSE
10 20 30 10 60 70 80 90 100 110
TIME ON STUDY (WEEKS)
Figure 3. Growth Curves for Mice Administered Phthalic Anhydride in the Diet
30
110

PR
OB
AB
ILIT
Y O
F S
UR
VIV
AL
PR
OB
AB
ILIT
Y O
F S
UR
VIV
AL
CD1
*»
>
O D
C
O
im
1I!
c i
CA
—**
O >
a.
5" »
•I
CO
-n
CD
ffi
n.
\^r
CD
D
S

the low-dose group, and 17/20 (85%) of the control group survived
to the end of the bioassay. In females, 40/50 (80%) of the
high-dose group, 45/50 (90%) of the low-dose group, and 16/20
(80%) of the control group survived to the end of the bioassay.
Sufficient numbers of mice of each sex were at risk for the
development of late-appearing tumors.
C. Pathology (Mice)
Histopathologic findings on neoplasms in mice are summarized in
Appendix B, tables Bl and B2; findings on nonneoplastic lesions
are summarized in Appendix D, tables Dl and D2.
Several chronic inflammatory, degenerative, or proliferative
lesions frequently seen in aged laboratory mice occurred with
approximately equal frequency and severity in the dosed and
control groups of animals.
Based on the histopathologic examinations, the nature, incidence,
or severity of the lesions observed provided no clear evidence of
carcinogenic effect of the phthalic anhydride on B6C3F1 mice
under the conditions of this bioassay.
32
D. Statistical Analyses of Results (Mice)
Tables Fl and F2 in Appendix F contain the statistical analyses
of the incidences of those primary tumors that occurred in at
least two animals of one group and at an incidence of at least 5%
in one or more than one group.
The results of the Cochran-Armitage test for positive dose-
related trend in incidences of tumors and those of the Fisher
exact test comparing the incidence of tumors in the control group
with that in each dosed group in the positive direction are not
significant in either sex.
In male mice negative results are observed in the incidence of
alveolar/bronchiolar carcinomas. A significant dose-related
trend in the negative direction (P = 0.025) is also observed in
the incidence of adenomas of the thyroid in the female mice.
In each of the 95% confidence intervals for relative risk, shown
in the tables, the value of one or less than one is included;
this indicates the absence of significant positive results. It
should also be noted that each of the intervals (except for that
of the incidence of alveolar/bronchiolar carcinomas of the lung
in low-dose male mice) has an upper limit greater than one,
33

indicating the theoretical possibility of the induction of tumors
by phthalic anhydride, which could not be detected under the
conditions of this test.
34

V. DISCUSSION
Mean body weights of the high-dose male rats and of the low- and
high-dose mice of each sex were lower than those of the
corresponding controls; mean body weights of the low-dose male
rats and of both the low- and high-dose female rats were
essentially unaffected by administration of the test chemical.
Depressions in the amount of body weight gained in the male and
female mice were dose related throughout the bioassay. Other
clinical signs were common to dosed and control groups of the
rats and mice or occurred only at low incidences. Survivals of
the rats and mice were not affected by administration of the test
chemical. Assays of the dosed feed mixtures indicated that they
may have been unstable under the conditions of use.
In the female rats, alveolar/bronchiolar adenomas occurred at
incidences that were dose related in the positive direction (P =
0.020), but, in direct comparisons, were not significantly higher
in either of the dosed groups than in the control group (controls
0/20, low-dose 0/50, high-dose 5/50). Neither these adenomas in
the high-dose female rats nor any tumors in the dosed groups of
male rats or male or female mice can be clearly related to
administration of the test chemical.
35

It is concluded that under the conditions of this bioassay,
phthalic anhydride was not carcinogenic for F344 rats or B6C3F1
mice of either sex.
36
VI. BIBLIOGRAPHY
Armitage, P., Statistical Methods in Medical Research, John Wiley & Sons, Inc., New York, 1971, pp. 362-365.
Baader, E. W., Erbrankungen durch Phthalsaure und ihre Verbindungen. Arch. Gewerbepathol. Gewerbehyg. L3:419-453, 1955.
Berenblum, I., ed., Carcinogenicity Testing! A Report o£ the Panel on Careinogenicity of_ the Cancer Research Commission of the UICC, Vol. 2_. International Union Against Cancer, Geneva, 1969.
Cox, D.R., Regression models and life tables. J_. R. Statist. Soc. B 34_:187-220, 1972.
Cox, D. R., Analysis £f_ Binary Data, Methuen & Co., Ltd. London, 1970, pp. 48-52.
Fassett, D. W., Organic acids, anhydrides, lactones, acid halides and amides, thioacids. In: Patty, F. A., ed., Industrial Hygiene and Toxicology, Vol. II, Interscience Publishers, New York, 1963T p. 1824-1825.
Gart, J. J., The comparison of proportions: a review of significance tests, confidence limits and adjustments for stratification. Rev. Int. Stat. Inst. 39:148-169, 1971.
Giam, C. S., Chan, H. S., Neff, G. S., and Atlas, E. L., Phthalate ester plasticizers: a new class of marine pollutant. Science 199:419-421, 1978.
Guess, W. L., Jacob, J., and Autian, J., A study of polyvinyl chloride - blood bag assemblies. Drug Intelligence 1^:120-121,125-127, 1967.
Kaplan, E. L. and Meier, P., Nonparametric estimation from incomplete observations. J_. Am. Statist. Assoc. 5_3_:457-481, 1958.
Knuth, C. J., Plasticizers. In: Encyclopedia £f_ Chemistry, Hampel, C. A. and Hawley, G. G., eds., Van Nostrand Reinhold Co., New York, 1973, pp. 863-865.
Linhart, M. S., Cooper, J. A., Martin, R. L., Page, N. P., and Peters, J. A., Carcinogenesis bioassay data system. Comp. and Biomed. Res. 7:230-248, 1974.
37
Merlevede, E. and Elskens, J., Les intoxications dues a 1" anhydride phtalique, 1' anhydride maleique et aux phtalates. Arch. Bel. Med. Soc. 1M10):445-457, 1957.
Miller, R. G., Jr., Simultaneous Statistical Inference, McGraw-Hill Book Co., New York, 1966, pp. 6-10.
National Institute for Occupational Safety and Health, Suspected Carcinogens - A Subfile of the Registry of Toxic Effectsof Chemical Substances, National Institute for Occupational Safety and Health, Cincinnati, Ohio, 1976, p. 136.
Noller, C. R., Aromatic carboxylic acids and their derivatives. In: Chemistry of Organic Compounds, W. B. Saunders Co., Philadelphia, 196T", pp. 602-605.
Policard, A., Gauthier, G., Hugonnier, R., and Roche, L., L'Intoxication par I1anhydride phtalique. Arch. Mai. Profess. 10:1, 1949.
Saffiotti, U., Montesano, R., Sellakumar, A. R., Cefis, F., and Kaufman, D. G., Respiratory tract carcinogenesis in hamsters induced by different numbers of administrations of benzo(a) pyrene and ferric oxide. Cancer Res. 32/1073 -1081, 1972.
Tarone, R. E., Tests for trend in life table analysis. Biometrika 62; 679-682, 1975.
Towle, P. H., Baldwin, R. H., and Meyer, D. H., Phthalic acids and other benzenepolycarboxylic acids. In: Kirk-Othmer Encyclopedia of Chemical Technology, Vol. 15, Mark, H. P., McKetta, J. J,, Jr., Othmer, D. F., eds., John Wiley & Sons, Inc., New York, 1968, pp. 444-487.
United States International Trade Commission, Synthetic Organic Chemicals - United States Production and Sales,1976,USITC Publication 833, United States International Trade Commission, Washington, B.C., 1977a.
United States International Trade Commission, Imports of Benezoid Chemicals and Products, 1976. USITC Publication 8"28,United States International Trade Commission, Washington, D.C., 1977b.
Zhilova, N. A. and Kasparov, A. A., Phthalic anhydride and N-nitrosodiphenylamine (Vulcalent A). Chem. Abstr. 71:280, 1969.
38

APPENDIX A
SUMMARY OF THE INCIDENCE OF NEOPLASMS IN
RATS ADMINISTERED PHTHALIC ANHYDRIDE IN THE DIET
39

40

TABLE A1.
SUMMARY OF THE INCIDENCE OF NEOPLASMS IN MALE RATS ADMINISTERED PHTHALIC ANHYDRIDE IN THE DIET
MATCHED CONTROL LOW DOSE HIGH DOSE
ANIHAIS INITIALLY IN STUDY 20 50 50 ANIBA1S KiCECESIEC 20 50 50 ANIBJLS EXAMINED HISTOPATHOIOGICALLY 20 50 50
IHIEGUHENIABY SYSTEM
*SOBCUT TISSUE (20) (50) (50) EASAL-CBIL CABCINOMA 1 (2%) TBICHCEEIIHELIOHA 2 (H%) fIBBCSABCCMA 1 (5S) 1 (2%) IIECKA 2 (H%) HEHA-NGICMA 1 (2%) 8EUBILEHCMA, MALIGNANT 1 (2%)
BESFIBATCEY SYSTEM
#tUNG (20) (50) (50) CMBCIKCMA, NOS, METASTATIC 1 (2%) SCU»MOUS CELL CARCINOMA 1 (2») AlViCLAB/EfiONCHIOLAB ADiHOMA 1 (5X) 1 (8%) 1 (2%)
HEHATOFCIETIC SYSTEM
*HUITIPIE CBGANS (20) (50) (50)
HALIGNAKT LYKPHCHA, NOS 4 (20*) 10 (20%) 12 (24%) BALIG.LYBEHGMA, HISTIOCYTIC TYPE 1 (2*)
KYEICKONCCYTIC L£UKEMIA 1 (5%) KCNOCYTIC LEUKEMIA 1 (2%)
*BLCCD (20) (50) (50) IEUKE«IA,NCS 1 (2«> 1 (2%)
RCNCCYTIC LiiUKEHIS 1 (2X)
*ECNE MAEEOW (20) (49) (49) EHAEDOBYCSAECCHA, HETASTATIC 1 (255)
C I B C U I A 1 C E Y S Y S 1 I M
I H E A R T (20) (50) (50)
B t i A E D O M Y C S A B C C H A
* N U f B E B CF A N I M A L S fc i lTH TISSUE E X A M I N E D MICROSCOPICALLY * N U K E E B O F A N I M A L S N E C E O P S I E D
41

TABLE A1. MALE RATS: NEOPLASMS (CONTINUED)
MATCHED CONTROL LOWD OSE HIGH DOSE
DIGESTIVE SYSTEM
*LIVEB (20) (50) (49) NEOPLASTIC NODULE 1 (5%) HEPATCCELLUL-AS CARCINOMA 2 (4%)
*DUCDENUM (20) (50) (48) AEENOCAHCINCMA, 80S 1 (2%)
UEINAEY SYSTIE
NCNE
ENBCCFINE SYSTEM
tPITUITAEY (20) (49) (49) CAECINCMA,NCS 2 (4%) ADENCKA, NOS 5 (25%) 13 (27%) 12 (24%)
tADBENAL (20) (48) (49) COETICAI CARCINOMA 1 (2%) FHEOCHEOMCCYTOMA 6 (30%) 8 (17%) 5 (10%)
tTKYBOID (20) (50) (48) AEENCCAECINOKA, NCS 1 (2%) C-CELL AEENCMA 3 (15X) 3 3 (6%)
#PABATHYBOIE (17) (43) (43) AEENOMA, SOS 1 (2%)
IPANCBEATIC ISLETS (20) (50) (49) ISLET-CELL ADENOMA 2 (4%)
REPECEUCTIVE SYSTEM
*MAMMABY GLAND (20) (50) (50) PIBBCMA 4 (8%) 1 (2%) LIPOSAECOMA 1 (2%) EIBECAEEKCMA 1 (2%)
*PEEPUTIAL GIAND (20) (50) (50) CABCINCHA.NOS 1 J2%1_
t SOfiEEB CF ANIMALS WITH TISSUE EXAHINED HICKOSCCPICAL1-Y * NDHEEE OF ANIMALS NECBCFSIiD
42

TABLE A1. MALE RATS: NEOPLASMS (CONTINUED)
MATCHED CONTROL LOW DOSE HIGH DOSE
AEENCCABCINOBA, NOS 1 (2%)
mSTIS (20) (50) (48) INTEBSTITIAI-CE1L 1UBOE 13 (65%) 40 (SOS) 35 (73X)
*EPIDIDYHIS 120) (50) (50) 1IPOHA 2 (tX)
NIBVCUS SYSTEM
IEBAIN (20) (49) (49) CABCISOBA, NCS, IHYASIVE 1 (2X)
SPECIAL SEliSE CBGANS
*EYE (20) (50) (50) SQOAMCUS CEIL CARCINOMA 1 (5%)
BUSCUICSKEIITAL SYSTEM
*SKUII (20) (50) (50) CSTEOSAfiCOMA 1 (2X)
BODY CAVI1IES
*PEBITOKECH (20) (50) (50) SAECCHA, NOS 1 (2%)
*1UNICA VAGINALIS (20) (50) (50) KISCTHELICHA, NOS 1 (5X)
All C1HIE SYSTEMS
*BDL1IP1E CBGANS (20) (50) (50) fIBECSABCCHA 1_I2X1_
t NDKBEB CF ANIMALS «I1H TISSUE EXAMINED BICHOSCOPICALLY * NDBEEE CF ANIMA1S NECEOESI2D
43

TABLE A1. MALE RATS: NEOPLASMS (CONTINUED)
ANIMAL DISPOSITION SUMMARY
AKIBAIS IKITIALLY IK STUDY NATUBAL DEATHS MORIBUND SACEIFICE SCHEDULED SACBIFICE ACCIDENTALLY KILLED TERMINAL SACBIFICE ANIMAL MISSING
INCLUDES AUTCLYZED ANIMALS
IOMOB SUMMABY
MATCHED CONTROL
20 3 3
TCTAL ANIKAIS WI1H ESIMAfiY IUHOES* 19TOTAL PEIMAHY TUMCBS 37
TOTAL ANIMALS HITH BENIGN TUMORS 18TOTAL BENIGN TUflCBS
TOTAL ANIMALS WITH MALIGNANT TOMCBSTOTAL MALIGNANT TUMOBS
TOTAL ANIMALS KITH SECONDARY TUMOBStTOTAL SECONDAHY TUMOBS
TOTAL ANIHALS HITH TUMOBS UNCEBTAINBENIGN OB MALIGNANT
TCTAL UNCEETAIN TUHOHS
TOTAL AKIflALS BITH TUMOBS UNCEBTAINPBIMABY OB METASTATIC
TCTAL ONC-EfiTAIN TUflOBS
28
7 7
2 2
LOW DOSE HIGH DOSE
50 50 9 5
44 36
47 101
45 77
20 24
46 84
43 63
21 21
3 3
* PBIMABY 3UMOBS: ALL TUMORS EXCEPT SECONDABY TOMOBS f SECCNDABY TUMOBS: HE1ASTATIC TUMOBS OB TUHORS INVASIVE INTO AN ADJACENT OBGAN
44

T TABLE A2.
SUMMARY OF THE INCIDENCE OF NEOPLASMS IN FEMALE RATS ADMINISTERED PHTHALIC ANHYDRIDE IN THE DIET
MATCHED CONTROL LOW DOSE HIGH DOSE
ANIHAIS INITIALLY IN STDDY 20 50 50 ANIHJIS KECBCESIEE 20 50 50 ASIHAIS EXAMINED HISTOfATHOICGICALLY 20 50 50
IHTEGUBEN7ABY SYSTEM
*SKIN (20) (50) (50) 1BICHOEPITHELIOHA 1 (5X)
*SUECOT aiSSUE (20) (50) (50) SQUAUOUS CELL CARCINOMA 1 (2%) BHAEDOHYOSABCOHA 1 (2%) CSTECSAECCBA 1 (5X)
HISFIBATCBY SYSTEH
*1DNG (20) (50) (50) A1VECLAE/EBOKCHIOIAE ADENOMA 5 (10%) A1VECLAE/BEONCHICLAE CARCINOMA 1 (5%) 3 (6%) 1 (2%) COBTICJL CABCINOMA, HETASTATIC 1 (2X)
HIMA1CPCIE11C SYSTEM
*BUL1IPLE CBGANS (20) (50) (50) MALIGNANT LYMPHOBA, NOS 1 (5X) 10 (20X) 4 (8%)
*HEBIASTINAL L.NODE (20) (50f (50) MALIGNANT LYEPRORA, NOS 1 (2%)
CIBCUIA1CEY SYSTEM
NCKE
DIGESTIVE SYS1EM
fLIVEB (20) (50) (50) HIPAIOCEILULAB CAECINCHA 1 (2X1
• NUBBEB CP ANIMALS 8ITH TISSUE EXAMINED HICBOSCOPICALLY * MOHEEB OF ANIMALS KECEOPSIED
45
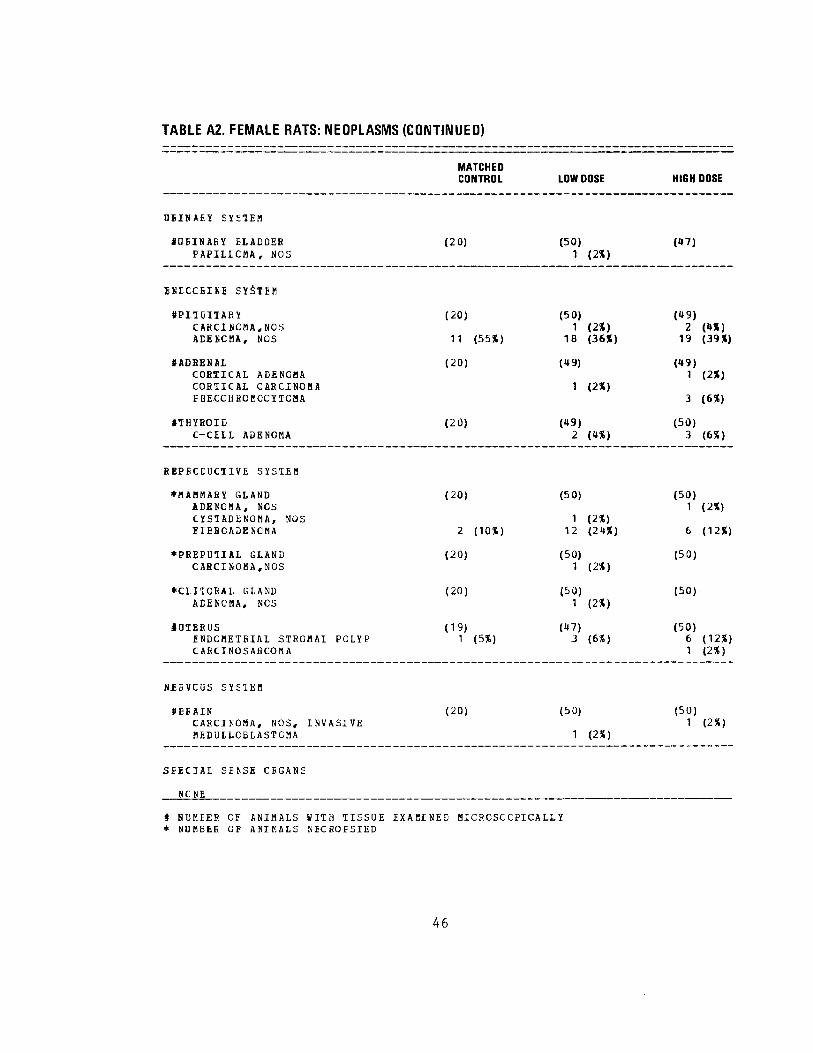
TABLE A2. FEMALE RATS: NEOPLASMS (CONTINUED)
MATCHED CONTROL LOW DOSE
(20) (50) 1 (2%)
(20) (50) 1 (2%)
11 (55%) 18 (36%)
(20) (49)
1 (2%)
(20) (49) 2 (4%)
(20) (50)
2 (10%) 12 (24%)
(20) (50) 1 (2%)
(20) (50) 1 (2%)
(19) (47) POLYP 1 (5%) 3 (6%)
(20) (50)
HIGH DOSE
DSINAEY SYSTEM
*OEINAEY ELAEDEB PAPI1LCMA, NOS
ENECCEINI SYSTEH
tPHOITAEY CAKCINC«A,NOS AEEKCKA, NOS
fACBENAL COBTICAL ADENOHA COBTICAL CABCINOBJ EHECCHBCKCCYTCHA
ITHYBOID C-CELL ADENOMA
BEPECCUCTIVE SYSTEM
*MAHMABY GLAND ADENOMA, NCS CYSTADENOBA, NOS FIBBCADENCMA
*PBEPUIIAL GLAND CABCINOKA,NCS
*CLIIOBAL GLAND ACENCHA, NCS
J01EBUS ENDCBETEIAL STROMALCAECINOSABCOMA
8£EVCUS SYSTEM
tEEAIN
(47)
(49) 219
(49) 1
3
(50) 3
(50) 1
6
(50)
(50)
(50) 61
(50) 1CARCINOMA, NOS, INVASIVE
MIDULLCBLASTCMA 1 (2%)
SPECIAL SENSE CBGANS
NCNE
f NUKEEB OF JNIMALS HITH TISSUE EXAEINED HICRCSCCPICAL1Y * NUBBEE OF ANIMALS NECBOFSIED
(4%) (39%)
(2%)
(6%)
(6%)
(2%)
(12%)
(12%) (2%)
(2%)
46

TABLE A2. FEMALE RATS: NEOPLASMS (CONTINUED)
MATCHED CONTROL LOW DOSE HIGH DOSE
M U S C U I C S K E I E I A I S Y S I E K
N C K E
B C E Y C A V I T I E S
N O N E
A L L C T H E K S Y S T E M S
N C N I
A N I M A L D I S P O S I T I O N S U P f l A E Y
A N I K A L S I N I T I A L L Y IK S T U D Y 20 50 50 N A T U B A L D £ A T H 5 > 2 6 2 M C E I E U N D SACHIFICE 1 2 7 S C H E E U L E C SACfi lFICE A C C I D E N T A L L Y K I L L E D T E R M I N A L S A C B I F I C E 17 42 41 A K I K A L K I S S I N G
31 I N C L D D E S A U T C L Y Z E D A N I M A L S
# N U B B E E C F A N I M A L S W I T H T I S S U E E X A M I N E D HICBOSCOPICALLY * N U M E E B O F A N I M A I S N E C E O F S I E D
47

TABLE A2. FEMALE RATS: NEOPLASMS (CONTINUED)
MATCHED CONTROL LOW DOSE HIGH DOSE
T U H O B S O B B A B Y
TC1AL A K J H A I S HUH EEIBABY 1UHOES* 13 37 36 TCTAL P B I B A B Y TUBOtS 18 58 53
TOTAL A N I H A I S KITH B E N I G N TDHCBS 12 27 32 TOTAL E E S I G N TUHOJ5S 15 38 44
TOTAL A N I M A L S HUH M A L I G N A N T TDHOES 3 16 8 ICT6L M A L I G N A N T TDHOES 3 20 9
TOTAL ANIBA1S ilTH SECONDARY TDHCES* 1 1 1CTAL SECONDAHY TOHOBS 1 1
TOTAL AKZHALS NITH TOHOBS UNCEBTAINBEN1GN OB HALIGNANT TCTAI UNCEBTAIN IUHOHS
TOTAL ANIHALS HUH TUHOBS UNCEBTAINP£IBAEY CB OGTASTATIC TOTAL UNCERTAIN TUHORS
* PBIHARY 10HOBS: AIL TOHOBS EXCEPT SBCONDABY TUHORS t SECCNDABY TUMORS: ME1ASTATIC TUBOBS OB TDHOBS INVASIVE INTO AN ADJACENT OBGAN
48

APPENDIX B
SUMMARY OF THE INCIDENCE OF NEOPLASMS IN
MICE ADIMINISTERED PHTHALIC ANHYDRIDE IN THE DIET
49

50
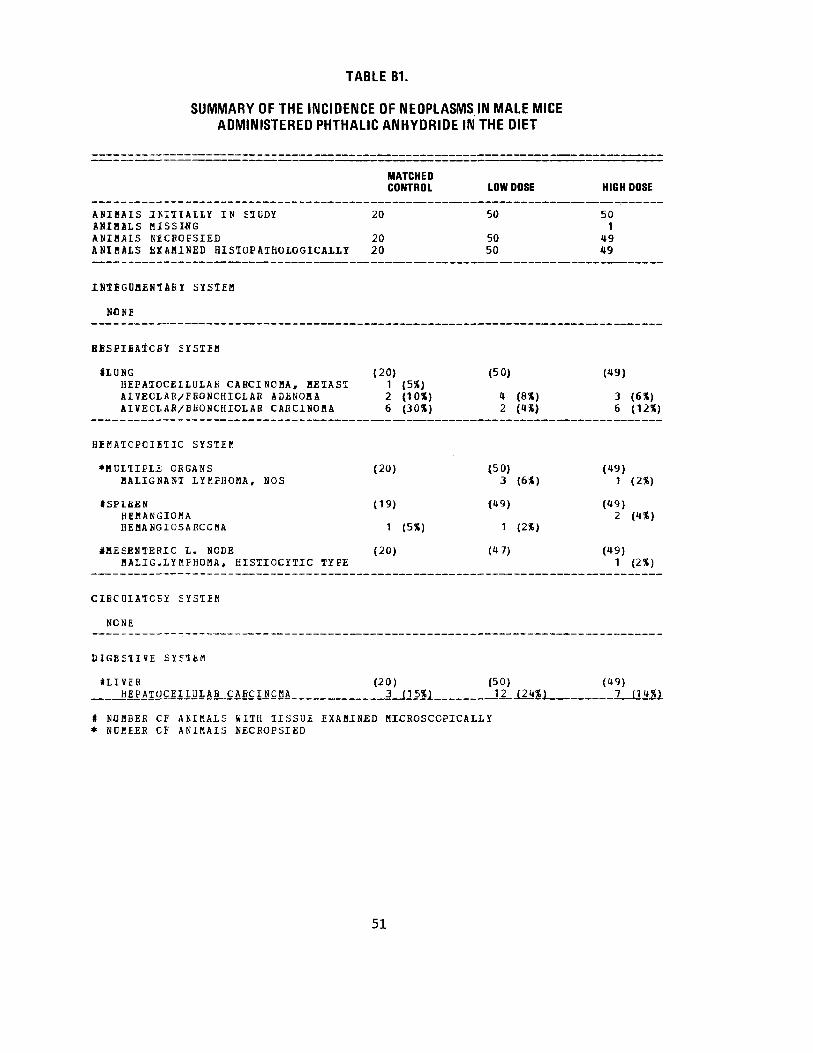
TABLE B1.
SUMMARY OF THE INCIDENCE OF NEOPLASMS IN MALE MICE ADMINISTERED PHTHALIC ANHYDRIDE IN THE DIET
MATCHED CONTROL LOW DOSE HIGH DOSE
ARIBA1S INITIALLY IN STUDY 20 50 50 SNIHJLS BISSMG 1 ANIBAIS NfeCBCESIED 20 50 49 ABIBilS EXAMINED HISTOPATHOLOGICAIL! 20 50 49
INTBGUHEN-IABY SYSTEM
NONE
HESEIBAlCBY SYSTIB
*LUNG (20) (50) (49) HEPATOCELLULAB CABCINOHA. BEIAST 1 (5%) AIVECLfiE/EBOSCHICLAE ADENOHA 2 (10S) 4 (8%) 3 (6%) A1VECLAB/BEONCHIOLAB CABCINOHA 6 (30%) 2 (HI) 6 (12X)
HEMATCPOIETIC SYSTEM
*nULTIELE ORGANS (20) (50) (49) BALIGNANT LYKPHOBA, MOS 3 (6X) 1 (2%)
«SPL£EN (19) (49) - ( 4 9 ) H E H A N G I O M A 2 (4%) H E B A N G I O S A B C C M A 1 (5X) 1 (2%)
iBEEENTEBIC L. NODE (20) (47) (49) B A L I G . L Y H F H O B A , HISTIOCYTIC TYPE 1 (2%)
CIBCDIAICFY SYSTEM
NCNE
DIGESTIVE SYSTEM
*LIV£B (20) (50) (49) HEPATOCEIIUIAB CABCINCHA 3 (15%) 12 (24%) 7 (14%)
# NUBBEfi CF ASIBALS VilTH TISSUE EXABINED BICROSCOPICALLY * NDKEEB CF AN1HAIS NECBOPSIED
51
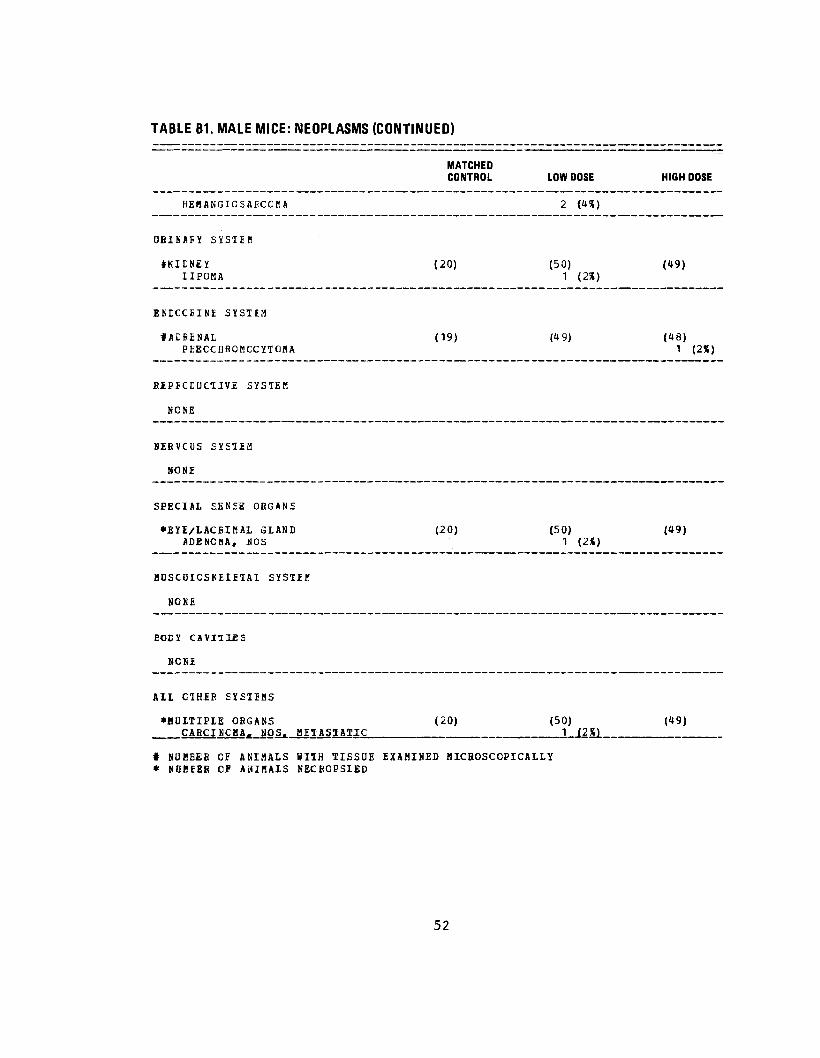
TABLE B1. MALE MICE: NEOPLASMS (CONTINUED)
MATCHED CONTROL LOW DOSE HIGH DOSE
H E f l A N G I C S A B C C M A 2 (4%)
O B I K A B Y S Y S T E K
* K I E N E Y (20) (50) (49) I IPOHA 1 (2%)
E K E C C S I N I S Y S T E M
fACBENAL (19) (49) (48) PEECCH80MCCYTOMA 1 (2X)
EiPICEUClIV£ SYSTEM
NONE
HBBVCUS SYS1IB
NONE
SPECIAL SENS2 OBGANS
*EYE/LACBIMAI GLAND (20) (50) (49) ADENOMA, BOS 1 (2X)
MUSCDICSKEIEIAI SYS1EK
NONE
BODY CAVITIES
HCNi
AIL C1HEE SYS1EBS
*HUITIPLE OBGANS (20) (50) (49) CABCINCBA, NOS^HEl ASIATIC
* NUBBEB CF ANIMALS HIIH TISSUE EXAMINED BICBOSCOPICALLY * NOHEEB OF ABIHALS NECBOPSIED
52
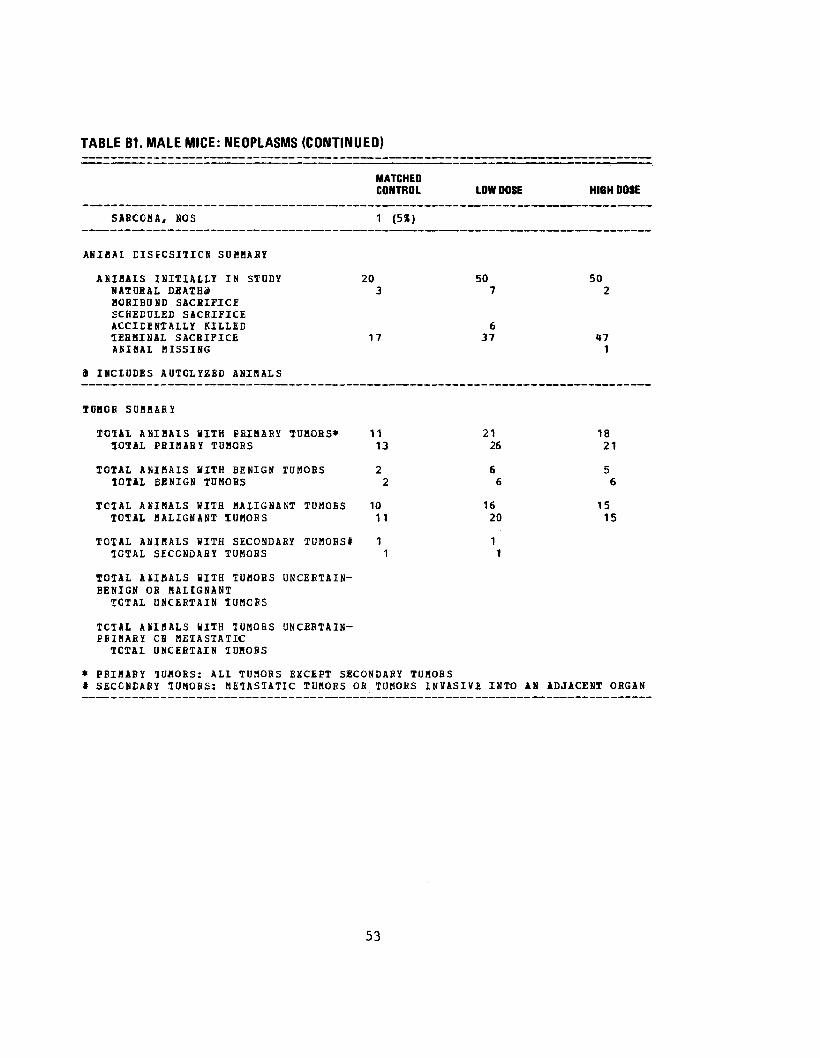
TABLE 81. MALE MICE: NEOPLASMS (CONTINUED)
MATCHED CONTROL LOW DOSE HIGH DOSE
S A B C O H A , NO5
A N I B A I EISECSITICK S U f l H A B Y
A S I B A L S INITIALLY IN STUDY 20 50 50 N A T U R A L DiATHi HOBIBDND SACBIFICE SCHEDULED SACBIFICE ACCIEENTAILY KILLED 6 1EBHINAL SACRIFICE 17 37 47 AKIBAL MISSING 1
a INCLUDES ADTOLYZEC ANIHALS
TOHOB SCHHABi
TOTAL ANIHAIS HITH ERIHABY TUHOBS* 11 21 18 50TA1 FBIHABX TUHOBS 13 26 21
TOTAL ANIHAIS KITH BENIGN TUMOBS 2 6 5 TOTAL BBNI6N TUHOBS 2 6 6
TC1AL ASIBALS WITH BAIIGNANT TUHOBS 10 16 15 TOTAL MALIGNANT 1UMOES 11 20 15
TOTAL ANIHALS WITH SECONDARY TUMOBSt 1 1 TOTAL SfCCNDABY TUHOBS 1 1
TOTAL AKIBALS WITH TUMOBS UNCEETAINBENIGN OB MALIGNANT
TOTAL UNCEBTAIN 1UBCBS
TOTAL ANIHALS WITH 1UHOBS UNCEBTAINPBIBABY CB HE1ASTA1IC TOTAL UNCEBTAIN TUHOBS
* PBIHABY 1U«OBS: ALI TUHORS EXCEPT SECONDARY TUHOBS f SECCNCABY 1UMOBS: HETASTATIC TUHOBS OB TOHORS INVASIVE INTO AN ADJACENT ORGAN
53

TABLE B2.
SUMMARY OF THE INCIDENCE OF NEOPLASMS IN FEMALE MICE ADMINISTERED PHTHALIC ANHYDRIDE IN THE DIET
A N I M A L S I M T I A L L Y I N £1UDY A N I M A L S M I S S I N G A N I M A L S N E C B C F S I E C A N I H A L S E X A M I N E D H I S T O P A T H O L O G I C A L L Y
I N l i G C H I N I A f i Y S Y S I E M
*SUBCU1 TISSUE N E D B I L E M C M A , M A L I G N A N T
B E S E I F A T C B Y S Y S T E M
t t iUNG A I V E C L A B / E B C N C H I O I A B A D E N O M A A I V E C L A B / E B O N C H I O L A B C A E C I N O M A C S T E C S A E C C M A , M E I A S T A T I C
H E B A T C P C I H T 1 C SYS1EH
*HUL1IPIE O E G A N S M A L I G N A N T L Y M P H C K A , N O S M A L I G . L Y M P H O M A , HISTICCYTIC T Y P E PLASMA-CELL 1QHOE
*BLCCD L E U K E M I A , NOS
*HEflATOPOIETIC SYSTEM H A L I G l i A N T L Y B F H O M A , N O S
ISPLEEN H E H A N G I O M A H E M A N G I C S A B C O M A
IHESBNTEEIC L. NODE M A L I G N A N T L Y H P H O M A , N C S H S L I G . L Y M P H O M A , HISTIOCYTIC 1YPE
*LI VEE B A L I G . L Y E E H O M A , HISTIOCJTIC TYPE
MATCHED CONTROL LOW DOSE
20 50 1
20 49 20 U9
(20) (49) 1 (5X)
(20) (49) 3 (6%)
1 (5«) 3 (6X)
(20) (49) 1 (5%) 3 (6%) 1 (5X) 2 ( 4 X )
(20) (49)
(20) (49) 1 (2%)
(20) (48)
1 (5X)
(19) (49) 1 (5X)
1 (2«)
(20) (48) 1 12%}
HIGH DOSE
50 1
48 48
(48)
(48) 1 (2») 1 (2%) 1 ( 2 % )
(48) 4 (8%) 3 (6%) 1 (2%)
(48) 2 (4%)
(48)
(48) 1 (2%) 1 (295)
(47)
(48)
* NUBEEB CF ANIMALS HUH TISSUE EXAHINED MICBOSCOPICALLY * NUMEEB OF ANIMALS NECEOPSIED
54

TABLE B2. FEMALE MICE: NEOPLASMS (CONTINUED)
MATCHEP CONTROL LOW DOSE HIGH DOSE
(20) (49) (48) BALIG.LYBPHOHA, HISTIOCYTIC 1YPE 2 (4X)
•KIDNEY (19) (48) (48) BALIG.LYBPHOBA, HISTIOCYIIC TYPE 1 (2X)
(18) (42) (37) HA1IGNANT IYBPHOBA, NCS 1 (2X)
CIBCDIATCEY SYSTEB
NONE
DIGISlIlli SYSTEfi
*IIVER (20; (48) (48) HiPATOCEIlULAH CAECINCBA 1 (5S) 1 (2%)
*CECUB (20) (49) (48) LEIOHYCSAECOMA 1 (2%)
OBINABY SYSTIB
NCNE
ENDOCBINE SYSTEM
#PITUITABY (19) (46) (41) ADiSCMA, NOS 1 (2%)
ITJiYBOID (19) (48) (46) ACENOBA, NOS 2 (11X)
REPBCEOCTIV1 SYS3EM
*MABBAEY GLAND (20) (49) (48) AEENCCABCINOMA, NOS 2 (4X)
#UTEBUS (19) (48) (46) EAPIHABY CYSTAEENCCAECINOMA^NOS 1 (2*1
* NDCBEE CF AKIMALS KI1H 1ISSOE EXAMINED BICBOSCOPICALLY * NUHEEE CF ANIMAIS NECBOPSIED
55

TABLE 82. FEMALE MICE: NEOPLASMS (CONTINUED)
MATCHED CONTROL LOW DOSE HIGH DOSE
E N D O M E t B I A L S1RCHAI PCIYE 1 (5X)
• O V A B Y (18) (48) (47) P A P I L L A R Y C Y S T A D E K C H A , NOS 1 (2%) 1ERA1CMA, NOS 1 (2%)
N t B V C U S S Y S 5 E H
S C N E
SPECIAL S£^Sf C 8 G A N S
*EYI/LACBIHAL G L A N D (20) (US) (48) A E E N C M A , NOS 1 (2%) F A P I L L A B Y A D E N O C A B C I N O B A 1 (2%)
aUSCDIOSKELElAL S Y S T E K
*BCNE (20) (49) (48) CSTEOSABCGHA 1 (2%)
BCEY CAVITIES
*AEBCMINAL CAVITY (20) (49) (48) CSTECSAECCHA, ISVISIV£ 1 (2%)
ALL CTHBE SY2TEKS
*HUL1IPLE CBGANS (20) (49) (48) SABCOHA, NCS 1 (5X)
ANIHAL DISPOSITION SUHHABY
ANIMALS INITIALLY IK STUDY 20 50 50 NATDBAL DEATH3 4 4 8 MCEIBUNE SACRIFICE SCHEBDLED SACRIFICE ACCIEENTALLY KILLED 1 TERMINAL SACRIFICE 16 45 40 AfilHAI HISSING 1 1
9 INCLUDES ACTOLYZEC ANIHAtS
* SOMBER OF ANIMALS HUH TISSOE EXAMINED MICROSCOPICALLY * NOHEER OF ANIMALS KECHOPSIBD
56

TABLE B2. FEMALE MICE: NEOPLASMS (CONTINUED)
TOKC8 SDHHABY
TCTAI ANIBALS HUB PBIHAHY TUHCBS*TOTAL PBI'HABY TOBOBS
TOTAL ANIHAIS BITH BENIGN TOHOBSICTAL BEKIGN TOHOBS
TOTAL ANIMALS WITH HALIGHANT TOMOBS10TA1 HALIGBANT TOHOBS
MATCHED CONTROL LOW DOSE HIGH DOSE
10 21 17 11 2H 19
3 4 3 3 5 3
7 16 14 8 18 15
TOTAL ANIHALS HUH SBCONDABY TOBOBS* TOTAL SECONDABX TOHOBS
1 2
TOTAL AKIHJLS HITH TOHOBS ONCEBTAIHEENIGN OB MAIIGNANT
TOTAL ONCEBTAIN TUHOBS 1 1
1 1
TOT8L ANIHSLS HITH TOHOBS ONCEBTAIN^ PBI8ABY CB MSTASTATIC
TOTAL UNCEBTAIN TOHOBS
* PBIBABY TOHOBS: ALL TOHCBS EXCEPT SECONDABY TUH08S * SECONDARY TUMOBS: HE5ASTATIC TOHOBS OB TOHOBS INVASIVE INTO AH ADJACENT OBGAN
57

58
APPENDIX C
SUMMARY OF THE INCIDENCE OF NONNEOPLASTIC LESIONS
IN RATS ADMINISTERED PHTHALIC ANHYDRIDE IN THE DIET
59

09
T TABLE C1.
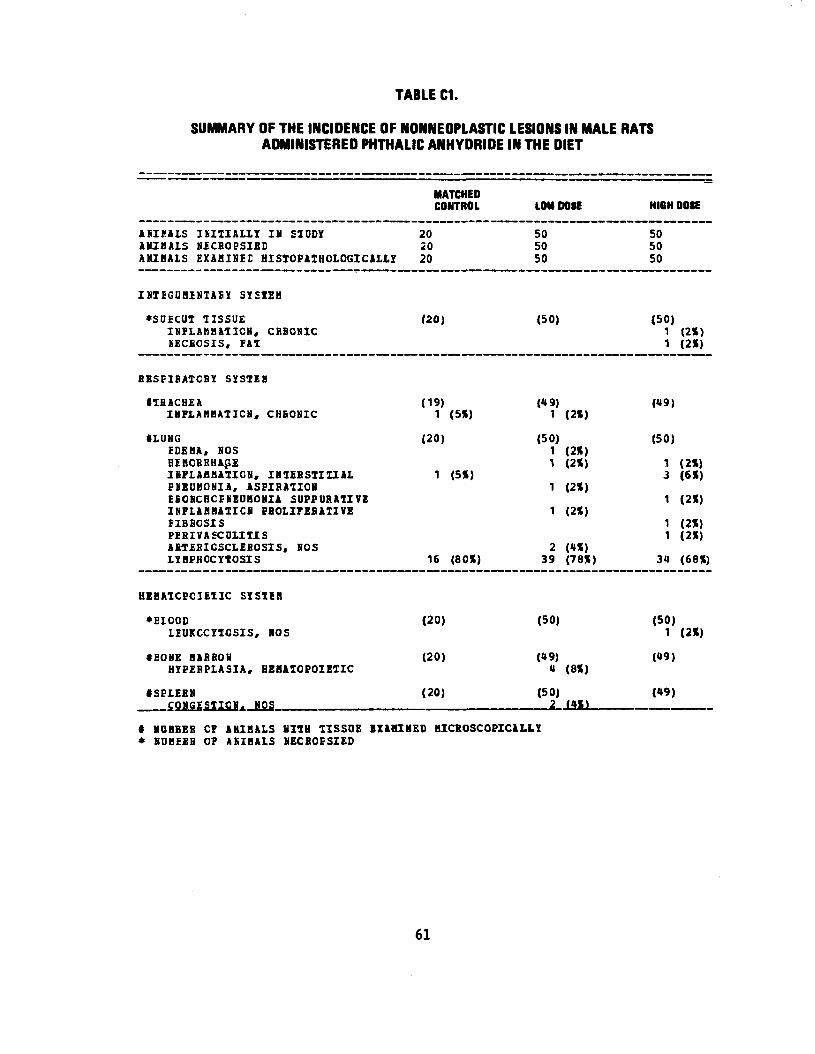
SUMMARY OF THE INCIDENCE OF NONNEOPLASTIC LESIONS IN MALE RATS ADMINISTERED PHTHALIC ANHYDRIDE IN THE DIET
A SI«A IS IhlTIALlY IN SIUDY ANIHA1S NECBOPSIEB ANIBAIS EXAMINEE HISTOPATHOLOGICAL1Y
IKTIGUBIMTAEY SYSIZB
*SU5CUT TISSUE INJPLAHHATICN, CBBONIC KBCBCSIS, FAT
BESFIBATCBY SYSTEH
•IB ACHEA INFLAHHATICN, CHEONIC
tXUNG IDEBA, NOS HEMCBBHAGE ISFLAHHATICN, IN1EBSTIII AL PKEUMONIA, ASPIBA7ION EBCBCHCf KEOHONIA SDPPDRATIVE INFLAHHA1ICS EBOLIFEBATIVB FIBBCSIS PEBIVASCOLITIS ABTiBICSCLEBOSIS, NOS tYHPHCCYtOSIS
HIHATCPCIE1IC SXSIEB
*EIOOD LIUKCCYIOSIS, HOS
«BONE HABBOH HYPEBPLASIA, HEH&IGPOIEIIC
•SPIEEN CONGESIICH. NOS
MATCHED CONTROL
, .,
LOM DOSE
_
HIGH DOSE
20 20 20
505050
50 50 50
(20) (50) (50) 1 (2X) 1 (2X)
(19) 1 (5X)
(49)1 (2X) (49)
(20)
1 (5X)
16 (SOX)
(50)1 (2X) 1 (2X)
1 (2X)
1 (2X)
2 (4X) 39 (7SX)
(50)
1 (2X) 3 (6X)
1 (2X)
1 (2X) 1 (2X)
34 (68X)
(20) (50) (50) 1 (2X)
(20) (49)4 (8X) (49)
(20) (50)2 (4X) (49)
« NOBBEB CF AHIHALS KITH 1ISSOE IXAHINED HICBOSCOPICALLY * NDBEEB OF AKIHAIS NECBOESIED
61
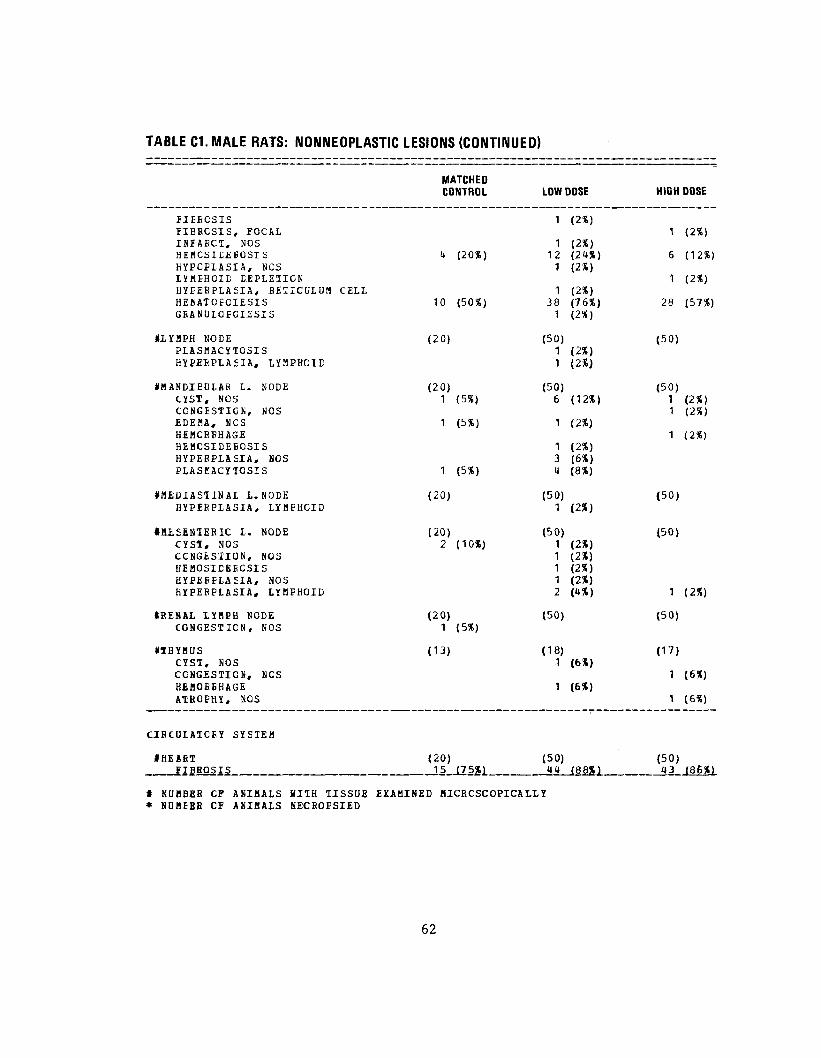
TABLE C1. MALE RATS: NONNEOPLASTIC LESIONS (CONTINUED)
~~ '" : ~™—=:
MATCHED CONTROL LOW DOSE HIGH DOSE
IIEBCSIS fIBBCSIS, FOCAL ISFAECT. NOS HEBCSICEBOSIS KYPCP1ASIA, NCS LYMEHGIE DEPLETION HYPEBPLASIA, B£TICULUM CELL HEHATOECIESIS GBANULCECIiSIS
i*
10
(20%)
(50%)
1
1121
1381
(2X)
(2%) (24%) (2»)
(2X) (76%) (2%)
1
6
1
28
(2»)
(12%)
(2%)
(57%)
I1YHPH NODE PLASMACYTGSIS HYPEBPLAEIA, LYMPHOID
(20) (50) 11 (2%) (2X)
(50)
IHANDIEULAR I. NODE CYST, NOS CONGESTION, NOS EDEBA, NCS HEMCBEHAGE HiHCSIDEBOSIS HYPEBPLASIA, NOS PIASt ACYTOSIS
(20) 1
1
1
(5%)
(5X)
(5X)
(50) 6 (12%)
1 (2%)
1 (2%) 3 (6%) H (8%)
(50) 11
1
(2%) (2%)
(2%)
SMEDIASTINAl L. NODE BYPEEPIASIA, LYMPHCID
(20) (50) 1 (2%)
(50)
*fliS£NlEEIC I. NODE CYSI, NOS CCNGiSlION, NOS HEMOSIEEECSIS HYPEEPIA£IA, NOS HYPEEPLASIA, 1YHPHOID
(20) 2 (10%)
(50) 11112
(2%) (2%) (2%) (2%) (4%)
(50)
1 (2%)
IEENAL LYMPH NODE CONGESTION, NOS
(20) 1 (5X)
(50) (50)
•IHYHUS CYST, NOS CONGESTION, NCS HEBOEEHAGE ATBOPHY, NCS
(13) (18) 1
1
(6«)
(6%)
(17)
1
1
(6%)
(6%)
CIECUIATCEY SYSTEM
tHEABT JIBROSIS
(20) 15 (75X)
(50) 44 (88S)
(50) 43 {86jil
* NUHBEB CF ANIHALS WITH TISSUE EXAHINED HICROSCOPICALLY * KOBEEB CP ANIHAIS BECROPSIED
62

TABLE C1. MALE RATS: NONNEOPLASTIC LESIONS (CONTINUED) "' ' ~~ •̂ -~• "*—^
MATCHED CONTROL LOW DOSE HIGH DOSE
IIEBOSIS, FOCAL 1 (2X)
fHEAHT/ATRIUM (20) (50) (50) THfiOMBCSIS, NOS 1 (2X)
*HYCCABDIUH (20) (50) (50) FIBROSIS 1 (2X)
*PUIHONAEY ABTEBY (20) (50) (50) HYPEBTBCEHY, NOS 1 <SX) 3 (6X) 5 (10X)
DIGESTIVE SYSTIfl
•SALIVJBY GLAND (19) (50) (50) INFLAMMATION, NOS 1 (2X) INFLAMMATION, CHBONIC 3 (6X) 1 (2X)
ILIVEB (20) (50) (49) CHOLANGICFIBEOSIS 114 (70%) 42 (84X) 39 (80X) NICBCSIS, NOS 1 (2X) KECBCSIS, FOCAL 2 (4X) BETAHCBEHCSIS FATTY 5 (25X) 10 (20X) 7 (14X) LIPOIDCSIS 1 (5X) 1 (2X) 1 (2X) BASOPHI1IC CYTO CHANGE 5 (25%) 20 (40X) 21 (43X) FCCAI CELLULAB CHANGE 1 (2X) CLEAR-CELL CHANGE 1 (2X) ANGIECTASIS 1 (5%) BEMATCECIISIS 1 (2X)
•HEPATIC CAPSULE (20) (50) (49) BUPTOBE • 1 (2X) JIBHCSIS, FCCAL 1 <2X)
ILJVEB/CENTBILOBULAB (20) (50) (49) KECBOSIS, FOCAL 1 (5%)
*BIL£ DDCT (20) (50) (49) HYPEEPLASIA, NOS 1 (5%) 3 (6X) 1 (2X)
#PANCBEAS (20) (50) (49) CYSTIC DUCTS 1 (2X) INFLAMMATION, CHECNIC 1 (5%) 1 (2%) ISFLAMHATION, CHEONIC FOCAL 1 (5%) FIBECSIS 4 (20X) 2 (4X) 2_(4X1_
# NOBBEE CF AMIMALS HITH TISSUE EXAMINED HICEOSCCPICALLY * NURE.EE CF AKIHALS NECBOPSIED
63

TABLE C1. MALE RATS: NONNEOPLASTIC LESIONS (CONTINUED)
MATCHED CONTROL LOW DOSE
EEBliB-IEfilllS 1 (5X) 2 (4X) ATBCPHY, NOS 4 (20X) 2 («X)
ISTOBACH (20) (50) CIST, NOS HEHATOB1, CBGANIZ5E DICER, DCS 1 <5X) HHfHCCYTIC IHFIAHHATOHY INFILTB IIBBOSIS «» (8X) IYHEHCCY1CSIS 1 (2X)
*GAS1EIC HUCOSA (20) (50) HINEBALIZATICN
IGAS1RIC SUEMUCOSA (20) (50) JIBBOSIS
•SHALL IH1ESTINE (20) (50) EIVERTICOiUH 1 (2X) CYST, NCS 1 (2X) INFLAH0ATICN, CHflONIC FOCAL 1 (5X)
•COLON (19) (50) BIBATOEIASIS
DfilNAEY SYSIJB
IKIINEY CAST, NOS
(20) 15 (75X)
(50) 45 (90X)
HYDECNEEHEOSIS 1 (2X) BEBCFBHAGE INFLAHHATICN, Cuov>NIC 16 (SOX) 45 (90X) KEEHEOEA1HY 2 (4X) HEHOSICfECSIS 1 (2X) A1BCEHY, NOS 1 (5X)
iKIDHEY/GLODEBOLOS (20) (50) IJLATATICS, NCS 1 (5X)
«KIEN£Y/IDBDIE (20) (50) HINEBAII2ATICN EILATATICN, NOS 1 (5X) KEPHBCSIS, NCS AIHCPHYiJOS
I NUHEEE CF ANIMALS WI1H TISSUE EXAMINED BICBOSCOPICAtLY * NODEEB OF ANIMALS NECBOFSIED
HIGH DOSE
2 (4X)
(49) 1 (2X) 1 (2X)
1 (2X) 2 (4X) 1
(49) 1
(49) 1
(48)
(48) 1
(49) 37
1381
(49)
(49) 1
11
(2X)
(2X)
(2X)
(2X)
(76X)
(2X) (78X) (2X)
(2X)
(2%) (2X1
64

TABLE C1. MALE RATS: NONNEOPLASTIC LESIONS (CONTINUED)
MATCHED CONTROL LOW DOSE
*U. E L A D D E E / B U C C S A (20) (48) H Y P E E P L A S I A , NOS 1 (2X)
E N E C C f i l N E SYSTEM
*PI3UITAEY (20) (49) CYST, SOS 1 (5») 5 (10X)
I A D H E N A L (20) (48) ISFAECT, NOS 1 (2%) H E T A H C B P H O S I S F A T T Y 1 (5X) 2 (US) H Y F E B T F C E H Y , FOCAL
1ADBENAL COB1EX (20) (48) HYPEBTBCPHY, NOS 1 (2XJ H Y E E B I B O E H Y , FOCAL
#ADBINAL M E D U L L A (20) (48) H Y P E K T B C E H Y , N O S HYEEBTBOFHY, FOCAL H Y P E B P L A S I A , NOS 1 (5X) 4 (8X)
•THYBOID (20) (50) H Y P E H P L A S I A , C-CE1L 3 (15X) 5 (10%)
I P A B A T H Y E C I D (17) (43) CYS1. NOS
•FAKCBEA1IC ISLETS (20) (50) H Y P E B P L A S I A , NOS 2 (4X) HYPEBELASIA, FOCAL
B*PECEUCTIV£ SYSTEE
* H A M H A E Y GLAND (20) (50) DILATATION/CUCTS 5 (25X) 12 (24X)
*PB£PDTIAL G L A N D (20) (50) CYST, NOS 1 (2X)
tPBOSTATE (20) (48) CALCULUS, NCS
i N U B B E B CF A N I M A L S HUH TISSUE E X A M I N E D HICBOSCOPICAILY * N U M E E B OF A N I M A L S NECBOFSIED
HIGH DOSE
(48)
(49) 3 (6%)
(49)
2 (4») 4 (8%)
(49) 1 (2X) 1 (2X)
(49) 8 (16X) 1 (2%)
(48) 10 (21X)
(43) 1 (2X)
(49)
1 (2X)
(50) 12 (24%)
(50)
(45) 2 (4X)
65

TABLE C1. MALE RATS: NONNEOPLASTIC LESIONS (CONTINUED)
INFLAflHAlION. SUPPDBATIV£ ABSCESS, NOS IMPtABBATICN, CHBONIC IKF1ABBA1ICN, CHEONIC SUPPUBATIV FIBBCSIS HYEEBFLASIA, FOCAL
*SEHINAL VESICLE INFLAMMATION, SUPPUBA1IVE
tTESHS 8EHOBBHAGE IKFABCT, NOS ATBCPHY, NOS
*JSPIDIDYMIS INFLAHMATICN, CHBONIC
NIBVCUS SYSTEM
iEBAIN HEMCBBHAGE IKFLAMKATICN, FOCAL SECBOSIS, NOS
SPECIAL SE1>SE CBGANS
NCNE
BUSCGICSKEIMAL £YS1EB
*ABECMINAL HUSCLIHEMORRHAGE
EODS CAVITIES
*PEBI1CNEUMHEMCBFHAGE
*ME£ENTEBYPEBIAB1E BITIS
MATCHED CONTROL LOW DOSE HIGH OOSE
2 (IX) 1 (2X) 1 (2X)
1 (5X) 1 (5X)
1 (2X) 1 (5%)
(20) (50) (50) 1 (5X)
(20) (50) (48) 1 (2X)
1 (2X) 3 (6X) 2 (IX)
(20) (50) (50) 1 (2X)
(20) (49) (49) 2 (*X)
1 (2X) 2 (4X)
(20) (50) (50) 1 (2%)
(20) (50) (50) 1 (2X)
(20) (50) (50)
t NUKBEB OF ASIBALS HI-IH TISSUE EXAMINED BICBOSCOPICALLY * HUHEEB CF ANIMALS NECBCPSIED
66
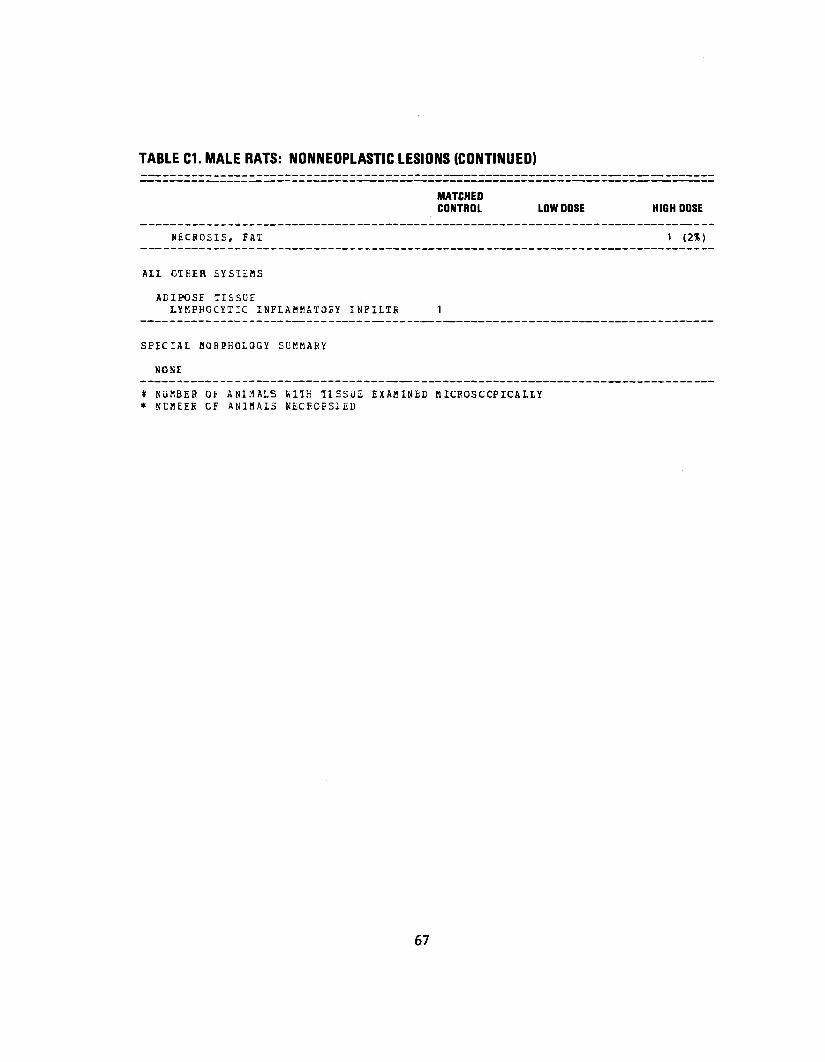
TABLE C1. MALE RATS: NONNEOPLASTIC LESIONS (CONTINUED)
MATCHED CONTROL LOW DOSE HIGH DOSE
N E C R O S I S , F A 1 1 (2%)
ALL C1HER SYSILHS
ADIPOSE TISSUE LYHPHOCXTIC INFLAHHATOBY INFILTB
SPECIAL MORPHOLOGY SUKBARY
NONE
* NUKBEB 01 ANIMALS KITK TISSUE EXAEINtD BICEOSCCPICALLY * NtKEEK CF ANIMALS NECROES1ED
67
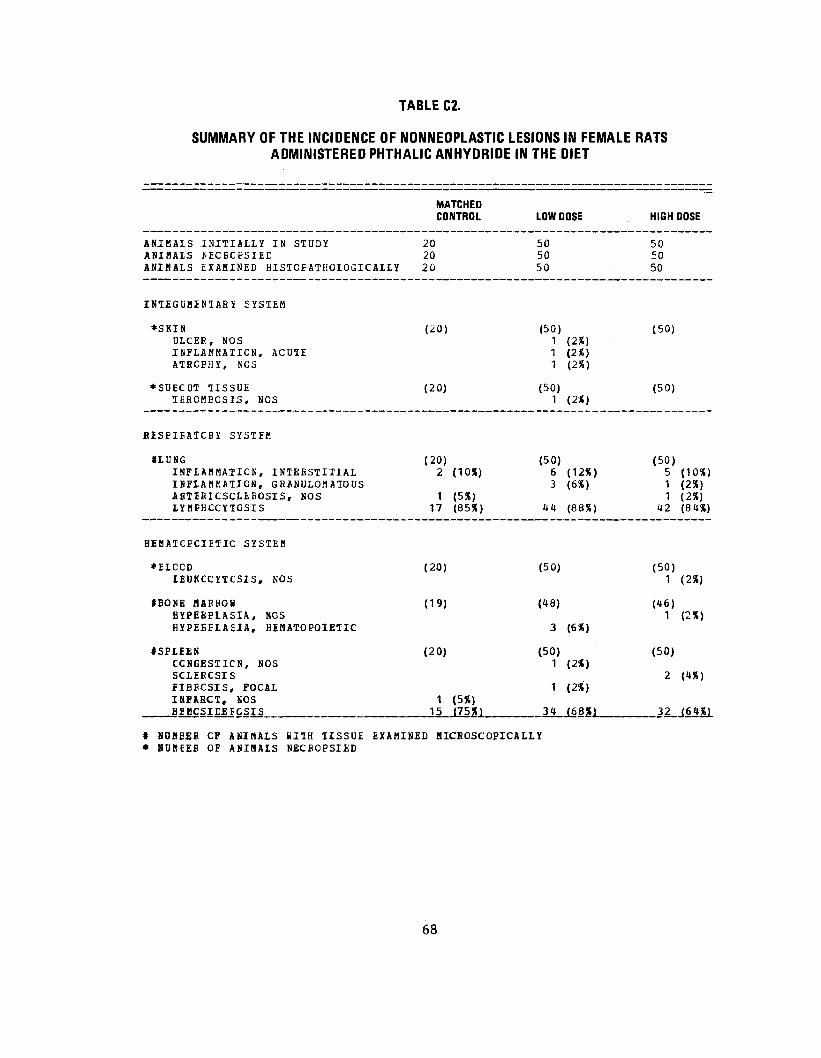
TABLE C2.
SUMMARY OF THE INCIDENCE OF NONNEOPLASTIC LESIONS IN FEMALE RATS ADMINISTERED PHTHALIC ANHYDRIDE IN THE DIET
MATCHED CONTROL LOW DOSE HIGH DOSE
ANIMALS INITIALLY IN STUDYANIMALS KECECPSIEEANIMALS EXAMINED HISICEATHCLOGICAILY
20 20
20
50 50 50
50 SO 50
INTIGliMINlARY SYS1EM
*SKISOLCEE, NOSINFLAMMATION, ACUTEATBCPHY, NCS
(20) (50) 1 (2%)
1 (2%) 1 (2%)
(50)
*SUECDT TISSUETHROMBOSIS, NOS
(20) (50) 1 (2%)
(50)
BESPIEATCBY SYSTEM
*LUNGINFLAMMATION, INTEBSTITIALINFLAMMATION, GRiNULOKATOUSABTEBICSCLEBCSIS, NOSIYMPHCCYTOSIS
(20) 2 (10X)
1 (5%) 17 (85S)
(50) 6 (12%)
3 (6%)
1U (88%)
(50) 5 (10%) 1 (2%) 1 (2%)
42 (84%)
HIMATCPCIITIC SYSTEM
*ELCCD IEUKCCYTCSIS, NOS
(20) (50) (50) 1 (2%)
IBONE HARSOB BYPEfiPIASIA, NOS HYPESFLAEIA, HEflATOPOIETIC
(19) (U8)
3 (6«)
(H6) 1 (2%)
•SPLEEN CCNGESTICS, NOS SCLEBCSIS FIBECSIS, FOCAL INFAECT, NOS HFJCSIEBJCSIS
(20)
1 (5X)
(50) 1 (2*)
1 (2*)
(50)
2 (4%)
32_J64«i
t NOBEfB CF ANIMALS KITH TISSUE EXAMINED HICBOSCOPICALLY * HDMEEB OF ANIHALS NECBOPSIED
68

TABLE C2. FEMALE RATS: NONNEOPLASTIC LESIONS (CONTINUED)
BYPEBPLASIA, HlflitOPOIETIC HYPEBPLiSIA, BETICULUfl CELL HEH1TOPOIESIS
*LYHPH NODE CONGESTION, NOS PLASMACYIOSIS HYPERPLASIA, LYHEHOID
tHJNDIBULAH L. NOD£ CIST, NOS HYP2BPLASIA, NOS BYPERPLASIA, BI1ICULUH CELL HYPEBPLASIA, LYflFHOID
tflEDIASTINAL L. NODE CONGESTION, NOS HYPEBPLASIA, RETICUIUB CELL
JHESENTERIC L. NODE CYST, NOS CONGESTION, NOS ISJIA8HATION, GBANOLOB ATOUS HYPEBPLASIA, RETXCULUH CELL
•IHYHOS ATROPHY, NOS
CIRCDLATCBY SYS1IB
tHIABl FIBEOSIS IYBEHCCY1CSIS
IHEART/A1BIOH TBECMBCSIS. NOS
*BYOCABEIUM INFLAMMATION, NOS
*AB1ERY INFLAKMA1ICN, NOS
*PULHONABY AB1EBY HYPEBIROEHY. NOS
MATCHED CONTROL
16 (SOX)
(20)
(20)
1 (5X)
(20)
(20) 1 (5X)
1 (5X) 1 (5X)
(9)
(20) 13 (65X)
(20)1 (5X)
(20)
(20)
(20) 1 (5XJ
LOW DOSE
1 <2X)
39 (78X)
(50)
1 (2X) 1 (2%)
(50) 1 (2%)
1 (2X)
(50) 3 (6X) 1 (2X)
(50)
1 (2X)
(29)
(50). 34 (68X) 1 (2X)
(50)
(50)
(50) 1 (2X)
(50)
HIGH DOSE
1 (2X) 45 (90 X)
(50) 2 (*X)
(50)
1 (2X) 1 (2X)
(50)
(50)
(20) 1 (5X)
(50) 40 (80X)
(50)
(50) 1 (2X)
(50)
(50)
* NUBBEB CF ANIBALS WI1H TISSUE EXAMINED BICBOSCOPICALLY * NUHEEB OF ANIMALS NtCBOESIED
69
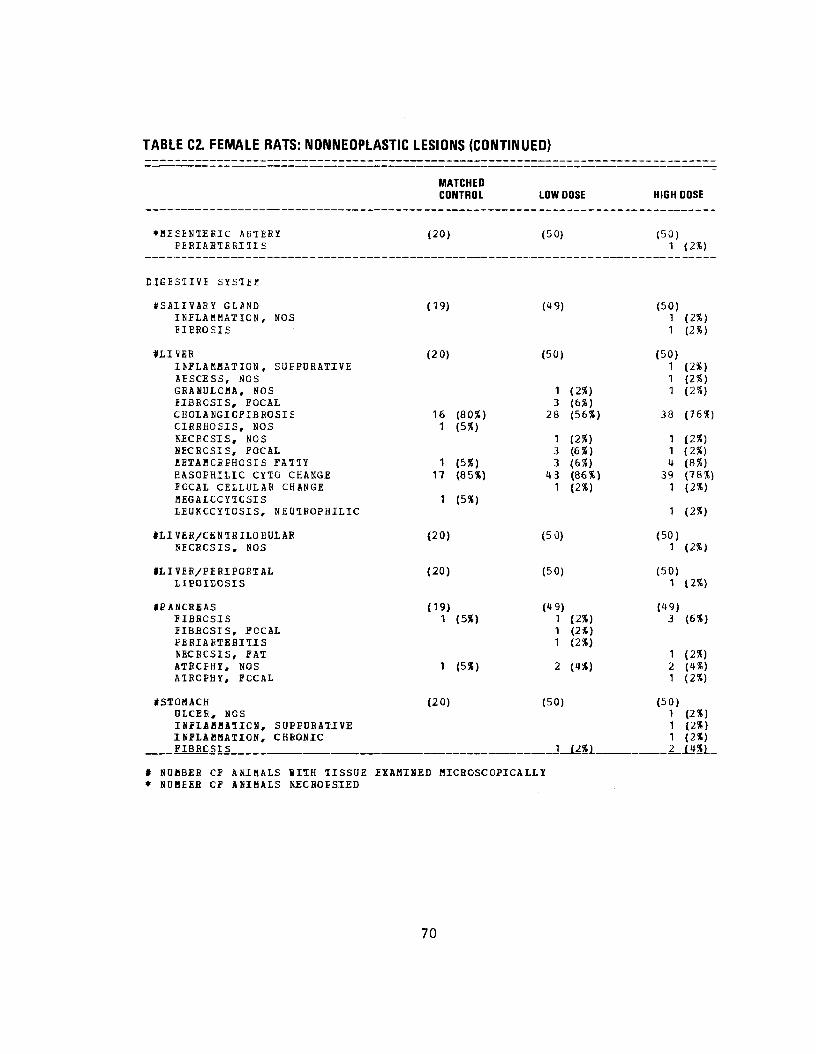
TABLE C2. FEMALE RATS: NONNEOPLASTIC LESIONS (CONTINUED)
*H£SENT£BIC ABTEHX PE8IABTEBI1IS
DIGES1IV! SYSTEE
t S A U V A B Y G L S N D INFLAMMATION, NOS EIEBOSIS
OFLAHHATIGN, SUPPORATIVE SESC£SS, NOS GEANULCMA, NOS MBBCSIS, FOCAL CHOLANGICFIBBGSIS CIBBHOSIS, NOS KECECSIS, NOS SECBCSIS, FOCAL KETAHCBEHQSIS FAT1Y BASOPHILIC CYTO CHANG£ FCCAL CEILULAB CHANGE MEGALCCY1CSIS IEUKCCY10SIS, NEU1EOPHILIC
fLIVEfi/CENTBILOEUIAE SECHCSIS, NOS
iLI-VEE/PEBIPOBTAL IIPCIEOSIS
tPANCHEAS FIBBOSIS JIBBCSIS, FCCAL EEBIABTEBI1IS KECBCSIS, FAT ATBCEHY, NOS A1BCFHY, FCCAL
IS10MACH OLCEE, NCS INFLABHAIICN, SUPFOBATIVE IHFLABHATJON, CHBONIC FIBBCSIS _______
MATCHED CONTROL LOW DOSE HIGH DOSE
(20) (50) (50) 1 (2%)
(19) (49) (50) 1 (2%) 1 (2X)
(20) (50) (50) 1 (2X) 1 <2X)
1 (2%) 1 (2X) 3 (6»)
16 (80S) 28 (56%) 38 (765?) 1 (5X)
1 (2*) 1 (2X) 3 (6%) 1 (2%)
117 (5X) (85*)
3 (658) 43 (86S)
4 (8%) 39 (76%)
1 (2%) 1 (2X) 1 (5%)
1 <2X)
(20) (50) (50) 1 (2%)
(20) (50) (50) 1 (2%)
(19) (49) (49) 1 (5%) 1 (2%) 3 (6X)
1 (2*) 1 (2X)
1 (2%) 1 (5*) 2 (4*)
1 (2X)
(20) (50) (50) 1 (2%) 1 (2%) 1 (2X)
t NUflBEB CF ANIMALS SI1H TISSUE EXAMINED MICROSCOPICALLY * NUBEEH CF ANIMALS RECBOESIED
70

TABLE C2. FEMALE RATS: NONNEOPLASTIC LESIONS (CONTINUED)
MATCHED CONTROL LOW DOSE HIGH DOSE
HYPEBPLASIA, EEIIHEIIAL 1 (2X) LYHEHCCYTGSIS 2 (4X)
ILABGE INtESlINE (20) (49) («9) NEMATODIASIS 1 (2X)
ICOION (20) (49) (49) KJHATODIA5IS 1 (2X) 1 <2X)
UBIKABX SYSTEB
IKIENEY (20) (50) (50) CAST, NOS 10 (SOX) 19 (38X) 16 (32X) HYDBCNEPbBOSIS 1 (2X) CONGESTION, NOS 1 (2X) INFLAMMATION, INTEBSTIIIAL 1 <5X) INFLAMMATION, CHEONIC 14 (70X) 42 (84%) 40 (SOX) SC1EBCSIS 1 (2X) HEHOSIEEBOSIS 1 (5X) 1 (2X) 1 (2X)
tKIDNEY/EELVIS (20) (50) (50) CALCULUS, NOS 1 (2%)
tfOBINARY BLADDER (20) (50) (47) HEMOBBHAGE 1 (2X) HYPEBPLASIA, AEENCMATOUS 1 (2%)
• iNECCBINE SYS1EK
tPiaOIIABY (20) (50) (49) CYST, NOS 5 (25X) 22 (44X) 12 (24X) CCNGES'IICN, NCS 2 <4X) HEMCEBHAGIC CYST 2 (10X) 2 (4%) 1 (2X) INFLAMWA1ICN, OSSIFYING 1 (2%) AKGIECIASIS 1 (2»)
4ADBENAL (20) (49) (49) CONGESTION, NOS 1 (2%) HEMCBBHAGIC CYS7 1 (5») 1 (2*) KETAHCBPHCSIS PATTY 3 (15%) 2 (4X) 1 (2X) PIGMENTATION, NOS 1 (2X) flYPEBTBCEHY, NOS 2 (10S)
#ACBENAL COBTEX (20) (49) (49) BETABCBPHOSIS FATTY 1 (2X1
* NOEBEB CF ANIMALS WI1H TISSUE EXAMINED MICROSCOPICALLY * NUHEEB CF ANIMALS NECROPSIED
71

TABLE C2. FEMALE RATS: NONNEOPLASTIC LESIONS (CONTINUED) ______— ———— —— _- — - ___— —— —— — --• -^--L-L -——• •"" '— .
MATCHED CONTROL LOW DOSE HIGH DOSE
HYPEBTBOPHY, DOS 2 (4%) 2 (4«) HYPEBTBOEHY, FOCAL 1 (5X) 1 (2X) HYPESPLASIA, NOS 1 (2S)
•ADRENAL MEDULLA (20) (49) (49) HYPEBPLASIA, NOS 1 (2X)
*THYBOID (20) (09) (50) UITIMOEBANCHIAI CYSI 1 (2X) fOLLICULAB CYST, NOS 1 (2K) INFLAMMATION, CHBONIC FOCAL 1 (2%) HYPEEPLASIA, C-CELL 1 (5«) 9 (18%) 6 (12X)
IPANCBEA7IC ISLETS (19) <"9) (49) HYPEBPLASIA, NOS 1 (2»)
BEPECIUCTIVI SYSTEM
*MAMHABY GLAND (20) (50) (50) EILATATICN/DUCTS 13 (658) 33 (66X) 24 (48S) GALACTCCELE 1 (5X) 4 (8%) 1 (2*) INFLAM8ATICN, GBANULOH ATOOS 1 (2%) FIBSOSIS 1 (2») HYPEBPLASIA, NOS 1 (2%) HYPEBPLASIA, FOCAL 1 (5X) HYPEBPLASIA, CYSTIC 1 (2%)
tUlEBUS (19) (47) (50) HAHABTCHA 1 (2X) CILATA1ICS, NCS 1 (2X) KECBCSIS, NOS 1 (5%)
•UTEBOS/ENDOMETBIOB (19) (47) (50) DILATATION, NCS 1 (2X) 1 (2X) CIS1, NOS 1 (2X) HYPEBPLASIA, EPITHELIAL 1 (2X)
IENDOHETBIAL GLAND (19) (47) (50) DILATATION, NOS 3 (16X)
tOVAEY (19) (47) (50) CYST, NOS 1 (5X) 3 (6X) 1 (2X) INFLAMMATION, CHBONIC 1 (5X) HYPCPIASIA, NCS 1 (2X)
t NUHBEE CF ANIMALS KITH TISSUE EXAMINED MICROSCOPICALLY * NUflEEB OF ANIHALS NECBOPSIED
72

TABLE C2. FEMALE RATS: NONNEOPLASTIC LESIONS (CONTINUED)
MATCHED CONTROL LOW DOSE HIGH DOSE
ATBCPHY, NOS 1 (2%)
N E R V C U S SYSIEfl
iLJlEBAL V£N1BIC1E (20) (50) (50) D I L A T A T I O N , NOS 1 (5X)
*EBAIN (20) (50) (50) HINEBAIIZATICN 1 (2%) II1ATATICN, NOS 1 (2X) H1TDBCCEEHAI.OS, NCS 1 (2X) 1 (2%)
SPECIA1 S£KSE OBGANS
*EYE (20) (50) (50) FIBBCSIS 1 (2X)
*EYE/CCENEA (20) (50) (50) BUETUfiB 1 (2S)
HDSCOIOEKHElAi SYS1ER
*SKULL (20) (50) (50) EXOSIOSIS 1 (2%)
BCBV CAVI3IIS
*PiBICAP,riDH (20) (50) (50) INFLAOMATION, FIERINOUS 1 (2%)
All CTKEfi SYSTEMS
NONE
SEECIAI KCBEHCLCGY SUBBABY
KC LESICN BEPCEIEE . 1
* NUHBEE OF AKIMALS WITH TISSUE EXAMINED HJCBOSCOPICAILY * NUMEEB CF ASIHALS NECBOPSIED
73

74
APPENDIX D
SUMMARY OF THE INCIDENCE OF NONNEOPLASTIC LESIONS
IN MICE ADMINISTERED PHTHALIC ANHYDRIDE IN THE DIET
75

76

TABLE 01.
SUMMARY OF THE INCIDENCE OF NONNEOPLASTIC LESIONS IN MALE MICE ADMINISTERED PHTHALIC ANHYDRIDE IN THE DIET
MATCHED CONTROL
—————
LOW OOSE
——
HIGH DOSE
ANieAIS IKI-UAILY IN STUDYANIMALS KISSING ANIBALS KECECPSIEDASTHALS EXAMINED HI STCPATHOLOGICA1LY
20
20 20
50
50 50
50 1
49 49
ISTEGOHENIAKY SYSTEM
*SKO (20) (50) (49) AIKOPHY, NOS 1 (2«)
*SDECU1 TISSUE (20) (50) (49) AESCESS. NOS 1 (2«)
BESEIBATCBY SYSTEH
• TBKHEA (20) (» 8) (45) HEBOBBHAGE 1 (2%)
• LONG (20) (50) (49) EEBOBEHAGE 2 (4S) 1 (2*) EBONCHOENEUMONIA, NOS 1 (5X) IYBEHCCY1IC INFLABBATOaY INFILTB 1 (2%) INFIAHHATICN, INTEESTITIAL 1 (5%) mFLAKHAHON PBOLIFEB JlIVjB 1 (2X) ALVEOIAB MACKCEHAGES 1 (2X) LYHFHCCY10SIS 6 (30%) 19 (38%) 30 (61%)
HIBATCPCII1IC SYS1EK
*ELCCD (20) (50) (49) lEUKOCYlCSiS, NOS 1 (2X)
tBONE MAE ROM (20) (49) (49) BYPEBPLASIA, HEHATOPOIETIC 1 12%)
ISPLEEN (19) (49) (49) CONGESTION, NOS 1 (2%) HJPEBPLASIA^ LYHEHOID 2 (4%)
• NUBBEB CF AMIBALS HIIH TISSUE JEXAHINED BICBOSCOPICAI1Y * NUBEEB OF ARIBALS NECBOPSIED
77
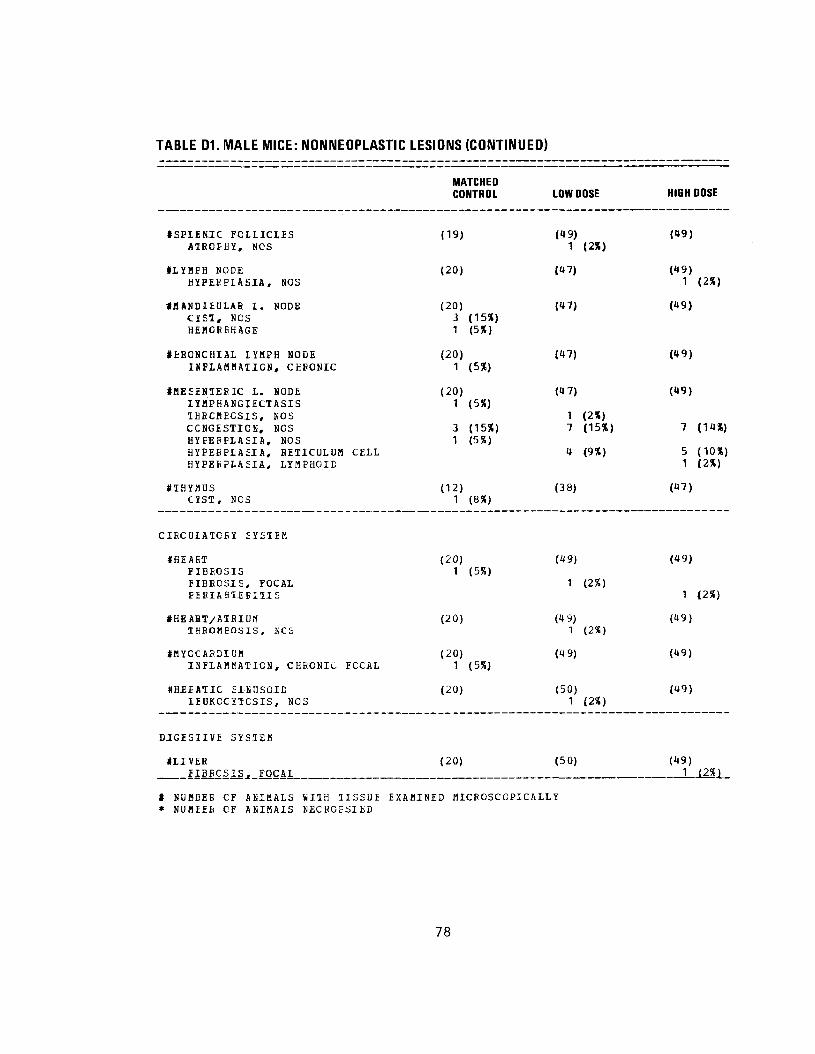
TABLE 01. MALE MICE: NONNEOPLASTIC LESIONS (CONTINUED)
MATCHED CONTROL LOW DOSE HIGH DOSE
tSPIENIC FOLLICLES (19) (49) (49) JHROEHY. NCS 1 (2X)
ILYHEH NODE (20) (47) (49) HYPEBPLASIA, NOS 1 12%)
1HAND1EOLAB L. NODE (20) (47) (49) CYSI, NCS 3 (15X) HEMC8EHAGE 1 (5*)
ttBONCHIAL LYMPH NODE (20) (47) (49) INFLAMMATION, CHECNIC 1 (5%)
JMESEKTEFIC L. NODE (20) (47) (49) IYMPHANGIECTASIS 1 (5%) 1HRCHECSIS, NOS 1 (2S) CCNGESTICN, NCS 3 (15X) 7 (15X) 7 (14*) HYEEEPLASIA, NOS 1 <5X) HYPEBPIASIA, HETICULUM CELL 4 (9%) 5 (10%) HYPEEPLASIA, LYMPHOID 1 (2-X)
S1HYMUS (12) (38) (47) CYST, NCS 1 (8%)
CIECOIA1CEY SYSTEM
IHEABT (20) (49) (49) FIBEOSIS 1 (5%) FIBHCSIS, FOCAL 1 (2%) EEK.IAB1EBIIIS 1 (2%)
#HEAHT/ATEIUfl (20) (49) (49) THBOKEOSIS, NCS 1 (2X)
IMYCCAEDIUM (20) (49) (49) INFLAMMATION, CHRONIC FCCAL 1 (5%)
#HE£ATIC SINUSOID (20) (50) (49) IEOKCCYTCSIS, NOS 1 (2*)
DJGISIIVE SYS1EK
ILIVEB (20) (50) (49) FIBECSIS. FOCAL 1 (2%)
t NUBBEE CF ANIMALS VillH 1ISSUE EXAMINED MICEOSCOPICALLY * NUMEE6 CF ANIMAIS NECBOPSIED
78

TABLE D1. MALE MICE: NONNEOPLASTIC LESIONS (CONTINUED)
MATCHED CONTROL LOW DOSE
NECECSIS, FOCAL 2 (10%) 2 (4%) ISF4BCT, NC5 1 (2%) KETAMCBEHCSIS FA1IY 5 (25%) 3 (6%) LIPOIDCSI3 6 (12%) REGALCCYTOSIS 1 (22) HYPEBPLASIA, NOLULAB 1 15%) ANGIEC1ASIS i (5%) 1 (2*)
tEIIE DUCT (20) (50) INFIAKHATICN, CHBCNIC 1 (5%) 7 (14%)
*PANCB£AS (20) (49) FIBFCSIS
*S1CHACH (19) (48) INFIAHBATICN, NOS 1 (2%) INFLAMMATION, FOCAL 3 (6»)
•SHALL INTESTINE (20) (47) ULCEE, NOS GBANUIAIICN, TISSUE
iCOICN (20) (48) EOLYF
URINABY SYS1IP
4KJEKEY CAS1, SOS IHFLAWKATICN, CHBONIC AHYLOICCSIS IYMPHCCYTCSIS
(20) 19 (5%) (45%)
(50)
221
15
(44%) (2%) (30%)
ENECCBIKE SYSTEM
IADBENAL (19) (49) AMYLOIDCSIS 1 (2%) HYPEBTBCEHY, FOCAI 1 (2%)
*ADEENAL COETEX (19) (49) AlRCPbY, NOS 23 (4VS) HYPEBTBCEHY, NCS HYfEBTBOEHY, FOCAL .
t NUKBEE CF AKIHALS KI1H 1ISSUE EXAMINED HICBOSCOPICALLY * NUHEEB CF ANIMAIS NECBOPSIED
HIGH DOSE
1
3
(49) 17
(47) 1
(49)
(49) 11
(49) 1
(49)
J
37
(48)
(48) 4011
(2%)
(6%)
(35%)
(2%)
(2%) (2%)
(2%)
(6%)
(76%)
(83%) (2%) (2%)
79

TABLE D1. MALE MICE: NONNEOPLASTIC LESIONS (CONTINUED)
BEPBCDUC1IVE SYSTfM
*EPIEIDYMISINFLAMMATION, CHRONIC
NEBVCUS SYSTEM
*EBAINCONGESTION, NOSHEHOBBHAGE
IBBAIN/THALAMUSMINERALIZATION
SPECIAL SISSI OBGANE
NONE
HOSC1JIOSKEIE1AL SXS1EH
NONE
BCEK CAVI1IIS
*HESIN3EBXWINEBALIZATIONJECBCSIS. FAT
ALL C1HIE SYSTEMS
*HUI1IP1E OBGANSLYBEhCCYTOSIS
SPECIAI KCEEBCICGY SUKPABY
NC LESION BEPOBTEDANIBAL KISSING/NC NECBOPSY
MATCHED CONTROL LOW DOSE HIGH DOSE
(20) (50) (49) 1 (5%)
(19) (50) (49) 1 (2%)
1 (5%) 1 (2%)
(19) (50) (49) 18 (36X) 23 (4755)
(20) (50) (49) 1 (5%) 2 (10%)
(20) (50) (49) 2 (<*%)
2 2 1
* NUREEB CF ANIMALS WI1H TISSUE EXAMINED MICBOSCOPICALLY * NDHEEB CF ANIMALS NECBOFSIED
80

TABLE D2.
SUMMARY OF THE INCIDENCE OF NONNEOPLASTIC LESIONS IN FEMALE MICE ADMINISTERED PHTHALIC ANHYDRIDE IN THE DIET
MATCHED CONTROL LOW DOSE HIGH DOSE
ANIHA1S INITIALLY IN STUDY 20 50 50 A N I M A L S MISSING 1 1 ANIHAIS NECBOPSIED 20 49 48 AHIBAIS E X A M I N E D HISTOPATHOIOGICALLY 20 49 48
INTEGDBENTAEY SYS3IM
NONB
BESPI8ATCRY SYSTEM
4IONG (20) (49) (48) INFLAMMATION, INTEESTITIAL 2 (4%) LYHPHCCYTOSIS 2 (10%) 32 (65%) 34 (71%)
HEBAtCPCIETIC SYS1EB
*EIOCD (20) (49) (48) IEOKCCYTCSIS, NEUTEOPHILIC 1 (5%) 1 (2%)
tSPIEEN (20) (48) (48) HXPEBPLASIA, IYMPHOID 1 (2%) HEBATOECIESIS 1 (5%)
iLYHPH NODE (19) (49) (47) KYPEEPLASIA, NOS 1 (5%) HXPEBPLASIA, IYHPHOID 1 (2%)
IflANDIEOLAR L. NODE (19) (49) (47) HSPEBPLASIA, NOS 1 (5%) HYPEBPLASIA. LYHPHCID 1 (2X)
IBESENIEEIC L. NODE (19) (47) LYHPHANGIECTASIS 3 (6%) CCNGESTICK, NOS 2 (11%) 1 (2%) 3 (6%) EDEBA, NOS 1 (2%) HEMOERHAGE 1 (2%) ISF1ABBATICN, CHBONIC 1 J2S1
t HOBBES OF ANIHALS WITH TISSUE EXABINED MICROSCOPICALLY * NOMBEB CF ANIMA1S NECEOPSIED
81

TABLE 02. FEMALE MICE: NONNEOPLASTIC LESIONS (CONTINUED)
MATCHED CONTROL LOW DOSE HIGH DOSE
HYPEEELASIA, NOS 1 (2X) HYPEBP1ASIA, BITICULUfl CELL 9 (18X) HYEEKPLASIA, LYMEHOID 1 (2X)
CIBCCIATCEY SY3ZEB
1HEAHT (19) (.8, (47) BINEBALIZATICN 1 (5X)
EIGJSIIVI SYSIEK
•LIVES (20) (48) (48) ISMPHCCYTIC INFLABKATCBY INFILT5 1 (2X) I.ECBCSIS, NOS 1 (2X) NECBOSIS, FCCAL 1 (5X) tETAKCEEHCSIS FATTY 1 (2X) LEUKCCYTC3IS, NOS 1 (2X) GBANULCECIESIS 1 (2X)
tLIVEE/CiNTBILOEULAR (20) (48) (48) IIPOIECSI5 1 (2S)
JtEItE EUCT (20) (48) EILATATION. NCS 1 (5X) 1 (2X) INFLABKAIICN. CEEONIC 10 (SOX) 30 (63X) 36 (75X)
*PANCBEAS (18) (49) (47) INFLAMMATION, NOS 1 (2X) INFLABBATICN, CHBCNIC 1 (2*) IIEECSIS 1 (2*) 1 (2S) FIBECSIS, FCCAL 1 (2X) AlBCtHY, NCS 1 (2X) A1BCEHY, FCCAL 1 (2X)
*S1CHACH (20) (49) (48) INFIAHMATICN, ACUTE FCCAL 1 (5X)
*DUCDENUM (20) (49) ECLYE 1 (2%)
UBIKJBY SYS1EK
*KIENEY (19) (48) (48) I Y B P J C C Y I I C _ I M I A K K A T C B Y _ I N F I L T B LJ2SI.
* NUBEEB CF ANIMALS kllH 1ISSUE EXAMINED HICBOSCOPICALLY * NUKEEE CF ANIMALS NZCEOESIED
82
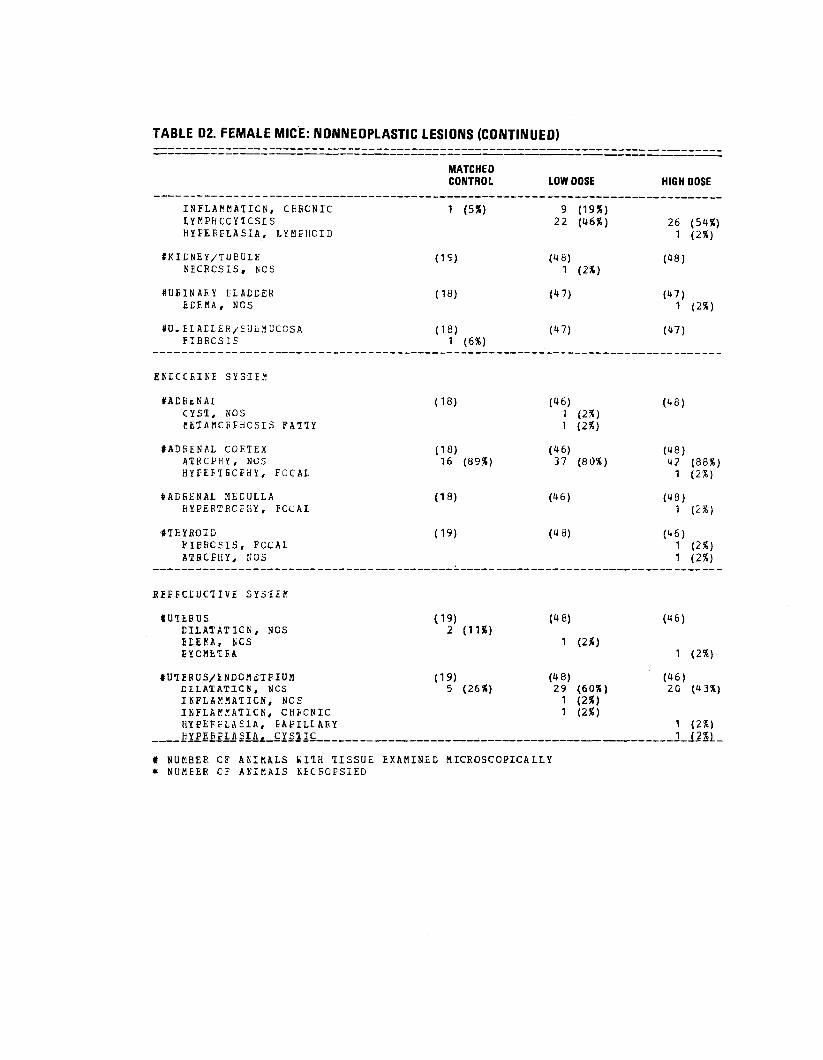
TABLE D2. FEMALE MICE: NONNEOPLASTIC LESIONS (CONTINUED)
INFLAMMATION, CKECNIC LYMPHCCY1CSIS HYFEEFLASIA, LYMFHCID
*KICNEY/TUEULE NECECSIS, NCS
#UBINAEY ELADDER ECEMA, NCS
*0. ELAELiR/SUbHUCCSA FIBECSIS
EKrCCBIKH SYSTEM
lADRtNAL CYS1, NOS f!ETAMCREHCSIS FAT1Y
IADEENAL COETEX ATRCPHY, NCS HYEEFTBCEHY, FOCAI
tADEENAL MEDULLA HYPEETECEHY, FCCA1
#TKYfiOID FIEECSIS, FCCAL A1BCEHY, NOS
fiEEEClUCTIVE SYS'IEH
IU1EEUS DILATATION, NOS BE£KA, KCS EYCHtTEA
fU-IEBUS/iNDCMiJTFIOM EILATATICN, NCS IKFLAKMATICN, NOS INFLAMMATION, CHi-CNIC HYPEFFLASIA, FAPILLAEY HYPEF.FLA£IAt CYSTIC
* N U K B E E CF A M M A L S h i aH TISSUE* N U M E E K C F A K I K A 1 S K E C E O F S I E D
MATCHED CONTROL LOW DOSE
1 (5%) 9 (19%) 22 (46%)
(IS) (48) 1 (2%)
(18) (47)
(18) (47) 1 (6%)
(18) (46) 1 (2%) 1 (2%)
(18) (46) 16 (89%) 37 (80%)
(18) (46)
(19) (48)
(19) (48) 2 (11X)
1 (2X)
(19) (48) 5 (26%) 29 (60%)
1 (2%) 1 (2«)
E X A H I N I C M.ICEOSCCPICALLY
HIGH DOSE
26 (54%) 1 (2%)
(48)
(47) 1 (2%)
(47)
(46)
(48) 42 (88%) 1 (2%)
(48) 1 (2%)
(46) 1 (2X) 1 (2%)
(46)
1 (2%)
(46) 20 (43%)
1 (2%) 1 (2%)
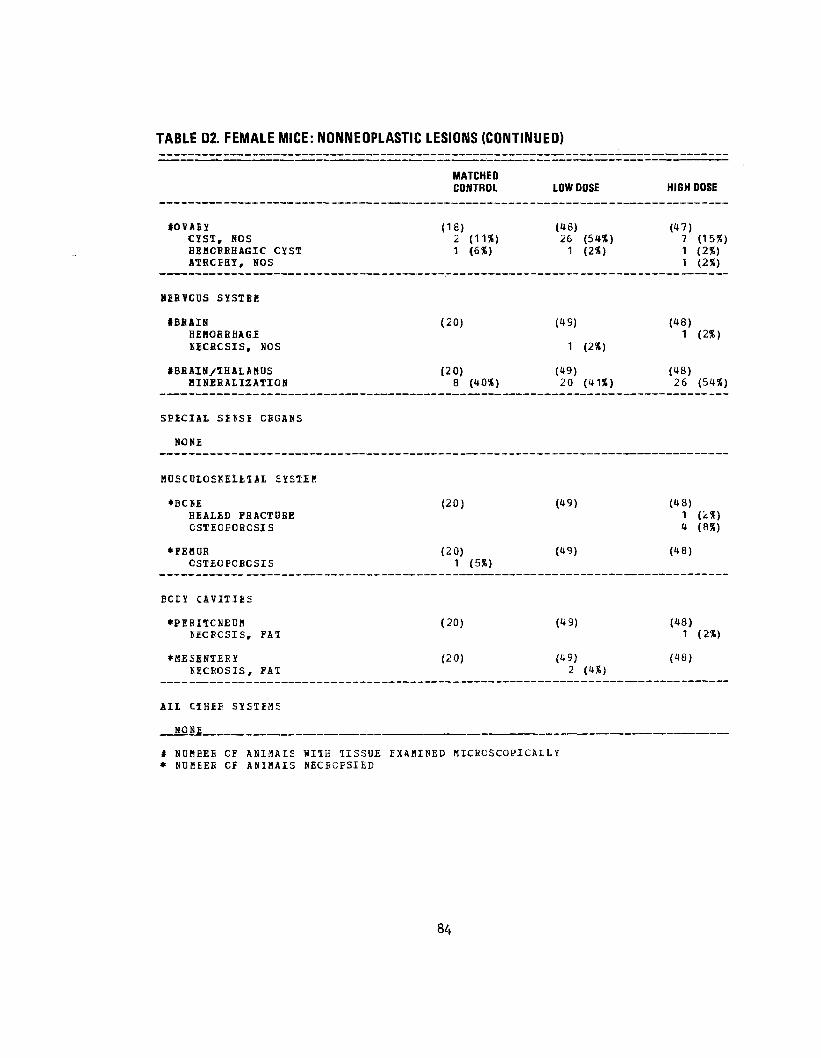
TABLE D2. FEMALE MICE: NONNEOPLASTIC LESIONS (CONTINUED)
»OVAEYCIST, NOSHBHCBBHAGIC CYSTATRCEHY, NOS
NSBVCOS SYS1BB
IBBAINHEHOKBHAGEKICBCSIS, NOS
IBBfllN/IHALAMUSHISEKALIZATI08
SPICIAI S£tlS£ CEGANS
NONE
MDSCUIOSKELEliL SYS1IK
*BC»EHEALED FHACTUBECSTECPOBCSIS
*FEHOBCSTEOPCBCSIS
ECEY CAVJTIBS
*PEEI1CNEOMKECFCSIS, FAT
*ME££NTEEYKECBOSIS, FAT
ALL CfHEE SYS1EHS
NONE
I NUHEEB CF ANIMAIS HI1H TISSUE* NDKEEB CF ANIMALS NECECESIED
MATCHED CONTROL LOW DOSE HIGH DOSE
(18) (48) (47) 2 (11%) 26 (54%) 7 (15%) 1 (6%) 1 (2%) 1 (2%)
1 (2%)
(20) (49) (48) 1 (2%)
1 (2«)
(20) (49) (48) 8 (40%) 20 (41%) 26 (54%)
(20) (49) (48) 1 (2%) 4 (8%)
(20) (49) (48) 1 (5%)
(20) (49) (48) 1 (2%)
(20) (49) (48) 2 (4X)
EXAMINED MICBOSCOPICAILY
84

TABLE 02. FEMALE MICE: NONNEOPLASTIC LESIONS (CONTINUED)
MATCHED CONTROL LOW DOSE HIGH DOSE
SPECIAL KCEFKCLCGY SUKHAEY
ANIMAL HISSIKG/NC NECfiOESYNECECESY EEBF/NO HISTC PEBFCBMEBAUTC/NECEOESY/HIS10 P.EHFAUTC1YSIS/NO NECKCFSY
1 1
2 1
I NUSEEE OF ANIKAIS WITH TISSUE IXABINED MICEOSCOPICALLY * NCBEEE OF ANIKA1S NECEOfSIED
85

86

APPENDIX E
ANALYSES OF THE INCIDENCE OF PRIMARY TUMORS
IN RATS ADMINISTERED PHTHALIC ANHYDRIDE IN THE DIET
87

88

00
Table El. Analyses of the Incidence of Primary Tumors in Male Rats Administered Phthalic Anhydride in the Diet (a)
Matched Low Topography: Morphology Control Dose
Lung: Alveolar /Bronchiolar Adenoma (b) 1/20 (5) 4/50 (8)
P Values (c,d) N.S. N.S.
Relative Risk (f) 1.600 Lower Limit 0.175 Upper Limit 77.169
Weeks to First Observed Tumor 105 105
Hematopoietic System: Leukemias (b) 1/20 (5) 1/50 (2)
P Values (c,d) N.S. N.S.
Relative Risk (f) 0.400 Lower Limit 0.005 Upper Limit 30.802
Weeks to First Observed Tumor 83 105
High Dose
1/50 (2)
N.S.
0.400 0.005 30.802
105
3/50 (6)
N.S.
1.200 0.106 61.724
79
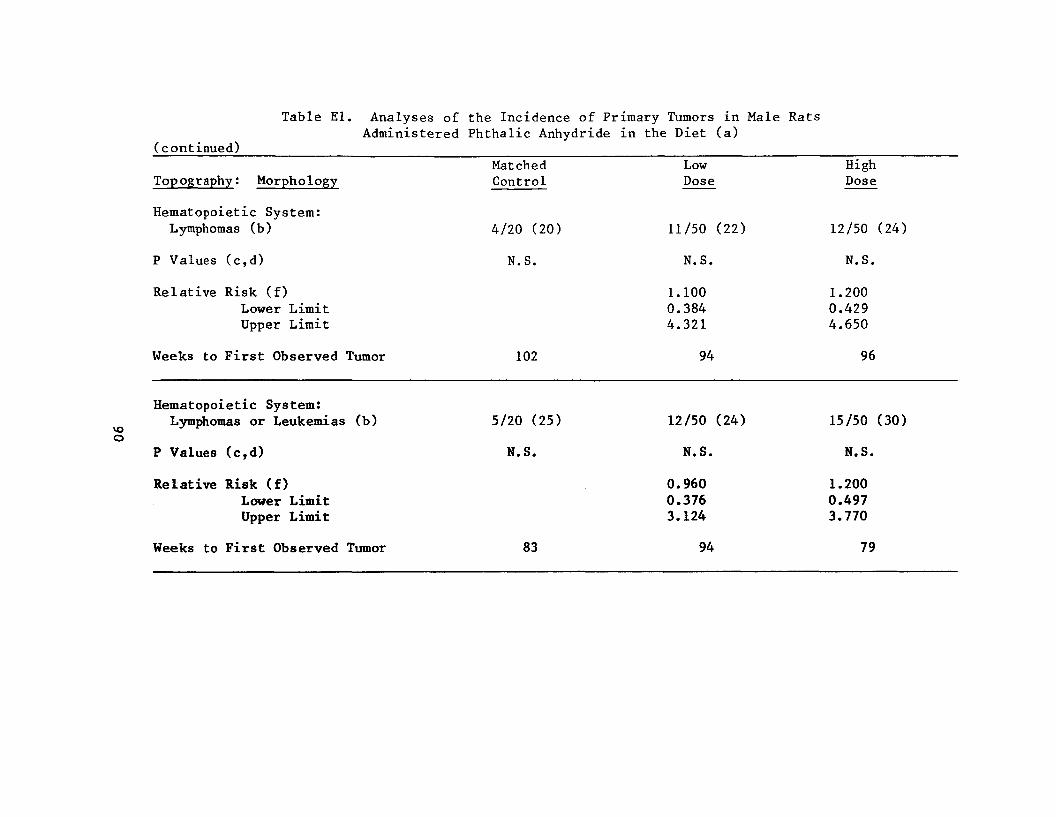
(continued)
Topography;
Table El.
Morphology
Analyses of the Incidence of Primary Tumors in Male Rats Administered Phthalic Anhydride in the Diet (a)
Matched Control
Low Dose
High Dose
Hematopoietic System: Lymphomas (b) 4/20 (20) 11/50 (22) 12/50 (24)
P Values (c ,d) N.S. N.S. N.S.
Relative Risk (f) Lower Limit Upper Limit
1.100 0.384 4.321
1.200 0.429 4.650
Weeks to First Observed Tumor 102 94 96
vo O
Hematopoietic System: Lymphomas or Leukemias
P Values (c,d)
(b) 5/20 (25)
N.S.
12/50
N.S.
(24) 15/50
N.S.
(30)
Relative Risk (f) Lower Limit Upper Limit
0.960 0.376 3.124
1.200 0.497 3.770
Weeks to First Observed Tumor 83 94 79

Table El. Analyses of the Incidence of Primary Tumors in Male Rats Administered Phthalic Anhydride in the Diet (a)
(continued)
Topography: Morphology MatchedControl
Low Dose
High Dose
Pituitary: Adenoma, NOS (b) 5/20 (25) 13/49 (27) 12/49 (24)
P Values (c,d) N.S. N.S. N.S.
Relative Risk (f) Lower Limit Upper Limit
1.061 0.425 3.404
0.980 0.384 3.184
Weeks to First Observed Tumor 83 96 84
Adrenal: Pheochromocy toma (b) 6/20 (30) 8/48 (17) 5/49 (10)
P Values (c,d) P = 0.037 (N) N.S. N.S.
Relative Risk (f) 0.556 0.340 Lower Limit 0.202 0.096 Upper Limit 1.734 1.205
Weeks to First Observed Tumor 89 94 96

Table El. Analyses of the Incidence of Primary Tumors in Male Rats Administered Phthalic Anhydride in the Diet (a)
(continued)
Tomography: Morphology
Thyroid: C-cell Adenoma (b)
P Values (c,d)
Relative Risk (f) Lower Limit Upper Limit
Weeks to First Observed Tumor
Mammary Gland: Fibroma (b)
P Values (c,d)
Relative Risk (f) Lower Limit Upper Limit
Weeks to First Observed Tumor
Matched Low High Control Dose Dose
3/20 (15) 3/50 (6) 3/48 (6)
N.S. N.S. N.S.
0.400 0.417 0.060 0.062 2.802 2.915
105 105 105
0/20 (0) 4/50 (8) 1/50 (2)
N.S. N.S. N.S.
Infinite Infinite 0.386 0.022 Infinite Infinite
105 105
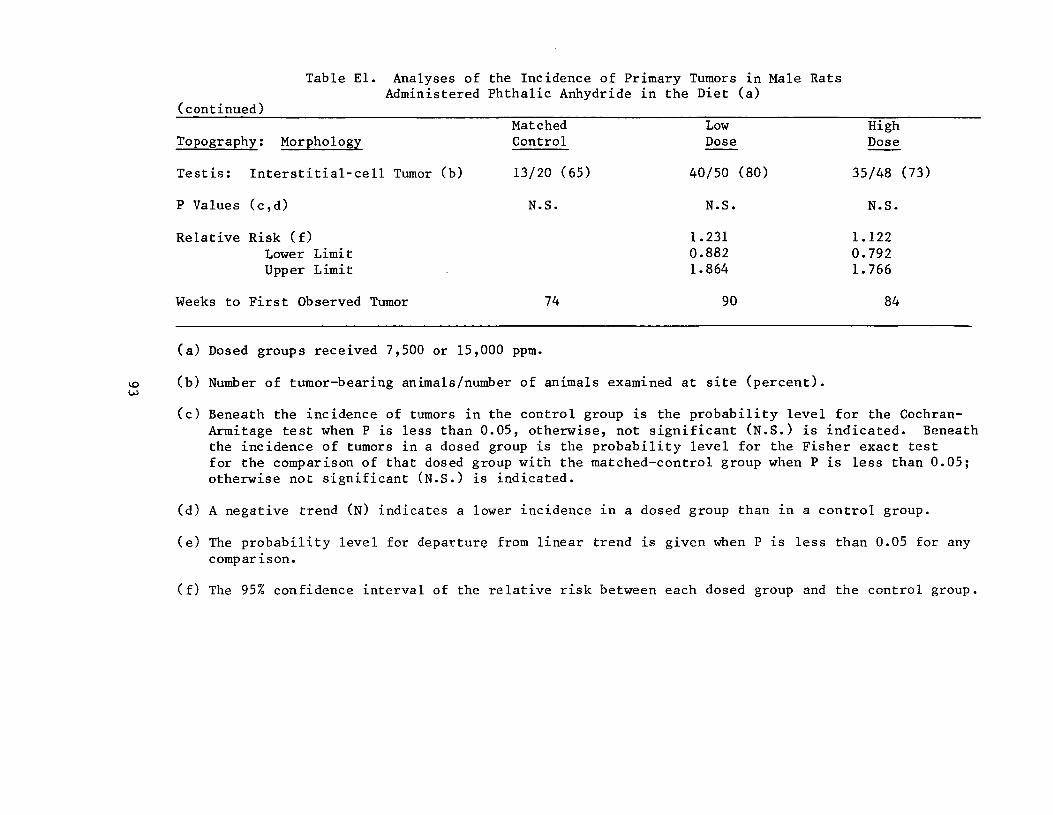
Table El. Analyses of the Incidence of Primary Tumors in Male Rats Administered Phthalic Anhydride in the Diet (a)
(continued) Matched Low High
Topography: Morphology Control Dose Dose
Testis: Interstitial-cell Tumor (b) 13/20 (65) 40/50 (80) 35/48 (73)
P Values (c,d) N.S. N.S. N.S.
Relative Risk (f) 1.231 1.122 Lower Limit 0.882 0.792 Upper Limit 1.864 1.766
Weeks to First Observed Tumor 74 90 84
(a) Dosed groups received 7,500 or 15,000 ppm.
>£> (b) Number of tumor-bearing animals/number of animals examined at site (percent).
(c) Beneath the incidence of tumors in the control group is the probability level for the Cochran-Armitage test when P is less than 0.05, otherwise, not significant (N.S.) is indicated. Beneath the incidence of tumors in a dosed group is the probability level for the Fisher exact test for the comparison of that dosed group with the matched-control group when P is less than 0.05; otherwise not significant (N.S.) is indicated.
(d) A negative trend (N) indicates a lower incidence in a dosed group than in a control group.
(e) The probability level for departure from linear trend is given when P is less than 0.05 for any comparison.
(f) The 95% confidence interval of the relative risk between each dosed group and the control group.

Table E2. Analyses of the Incidence of Primary Tumors in Female Rats Administered Phthalic Anhydride in the Diet (a)
Topography: Morphology
Lung: Alveolar/Bronchiolar Adenoma (b)
P Values (c,d)
Relative Risk (f) Lower Limit Upper Limit
Weeks to First Observed Tumor
Lung: Alveolar/Bronchiolar Carcinoma (b)
P Values (c,d)
Relative Risk (f) Lower Limit Upper Limit
Weeks to First Observed Tumor
Matched Control
0/20 (0)
P = 0.020
—
1/20 (5)
N.S.
105
Low Dose
0/50 (0)
.
— — —
—
3/50 (6)
N.S.
1.200 0.106 61.724
101
High Dose
5/50 (10)
N.S.
Infinite 0.525 Infinite
105
1/50 (2)
N.S.
0.400 0.005 30.802
102

Table E2. Analyses of the Incidence of Primary Tumors in Female Rats Administered Phthalic Anhydride in the Diet (a)
(continued) Matched Low High
Topography; Morphology Control Dose Dose
Lung: Alveolar /Bronchiolar Carcinoma or Adenoma (b) 1/20 (5) 3/50 (6) 6/50 (12)
P Values (c,d) N.S. N.S. N.S.
Relative Risk (f) 1.200 2.400 Lower Limit 0.106 0.175 Upper Limit 61.724 108.021
Weeks to First Observed Tumor 105 101 102
Hematopoietic System:
vo Lymphomas (b) 1/20 (5) 11/50 (22) 4/50 (8) in
P Values (c,d) N.S. N.S. N.S.
Departure from Linear Trend (e) P=0.019
Relative Risk (f) 4.400 1.600 Lower Limit 0.722 0.175 Upper Limit 184.752 77.169
Weeks to First Observed Tumor 101 105 102

Table E2. Analyses of the Incidence of Primary Tumors in Female Rats Administered Phthalic Anhydride in the Diet (a)
(continued)
Topography ; Morphology
Pituitary: Adenoma, NOS (b)
P Values (c,d)
Relative Risk (f) Lower Limit Upper Limit
Weeks to First Observed Tumor
Adrenal: Pheochromocytoma (b)
VO P Values (c,d)
Relative Risk (f) Lower Limit Upper Limit
Weeks to First Observed Tumor
Matched Low High Control Dose Dose
11/20 (55) 18/50 (36) 19/49 (39)
N.S. N.S. N.S.
0.655 0.705 0.385 0.419 1.280 1.363
81 101 16
0/20 (0) 0/49 (0) 3/49 (6)
N.S. — N.S.
Infinite
— 0.255 Infinite
94

Table E2. Analyses of the Incidence of Primary Tumors in Female Rats Administered Phthalic Anhydride in the Diet (a)
(continued)
Topography: Morphology
Thyroid: C-cell Adenoma (b)
P Values (c,d)
Relative Risk (f) Lower Limit Upper Limit
Weeks to First Observed Tumor
Mammary Gland: Fibroadenoma (b)
\o P Values (c,d)
Relative Risk (f) Lower Limit Upper Limit
Weeks to First Observed Tumor
Matched Control
0/20 (0)
N.S.
2/20 (10)
N.S.
105
Low Dose
2/49 (4)
N.S.
Infinite 0.125 Infinite
105
12/50 (24)
N.S.
2.400 0.614 20.902
101
High Dose
3/50 (6)
N.S.
Infinite 0.250 Infinite
94
6/50 (12)
N.S.
1.200 0.243 11.574
74
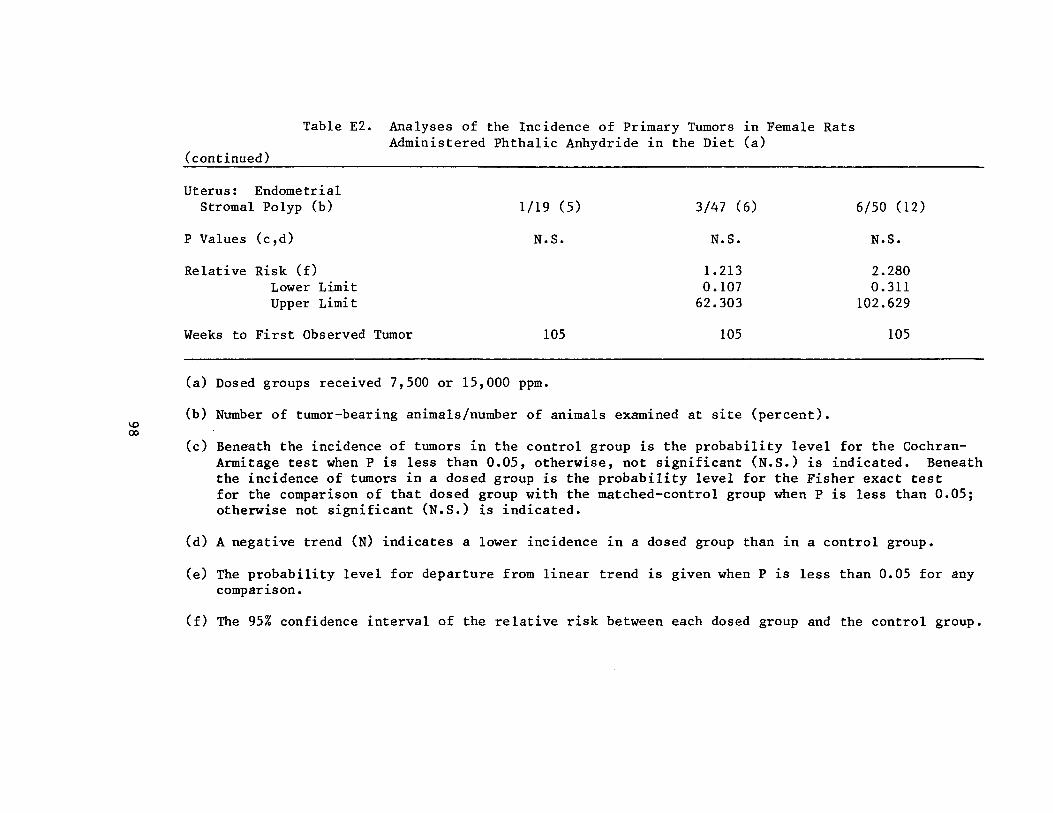
Table E2. Analyses of the Incidence of Primary Tumors in Female Rats Administered Phthalic Anhydride in the Diet (a)
(continued)
Uterus: Endometrial Strotnal Polyp (b) 1/19 (5) 3/47 (6) 6/50 (12)
P Values (c,d) N.S. N.S. N.S.
Relative Risk (f) 1.213 2.280 Lower Limit 0.107 0.311 Upper Limit 62.303 102.629
Weeks to First Observed Tumor 105 105 105
(a) Dosed groups received 7,500 or 15,000 ppm.
(b) Number of tumor-bearing animals/number of animals examined at site (percent). oo
(c) Beneath the incidence of tumors in the control group is the probability level for the Cochran-Armitage test when P is less than 0.05, otherwise, not significant (N.S.) is indicated. Beneath the incidence of tumors in a dosed group is the probability level for the Fisher exact test for the comparison of that dosed group with the matched-control group when P is less than 0.05; otherwise not significant (N.S.) is indicated.
(d) A negative trend (N) indicates a lower incidence in a dosed group than in a control group.
(e) The probability level for departure from linear trend is given when P is less than 0.05 for any comparison.
(f) The 95% confidence interval of the relative risk between each dosed group and the control group.

APPENDIX F
ANALYSES OF THE INCIDENCE OF PRIMARY TUMORS
IN MICE ADMINISTERED PHTHALIC ANHYDRIDE IN THE DIET
99

100

Table Fl. Analyses of the Incidence of Primary Tumors in Male Mice Administered Phthalic Anhydride in the Diet (a)
Topography: MorphologyMatched
Control Low Dose
High Dose
Lung: Alveolar/Bronchiolar Carcinoma (b) 6/20 (30) 2/50 (4) 6/49 (12)
P Values (c,d) N.S. P = 0.005 (N) N.S.
Departure from Linear Trend (e) P = 0.007
Relative Risk (f) Lower Limit Upper Limit
0.133 0.015 0.681
0.408 0.129 1.372
Weeks to First Observed Tumor 100 97 104
Lung: Alveolar/Bronchiolar Carcinoma or Adenoma (b) 7/20 (35) 6/50 (12) 9/49 (18)
P Values (c,d) N.S. P = 0.032 (N) N.S.
Relative Risk (f) 0.343 0.525 Lower Limit 0.114 0.211 Upper Limi t 1.061 1.464
Weeks to First Observed Tumor 89 97 104
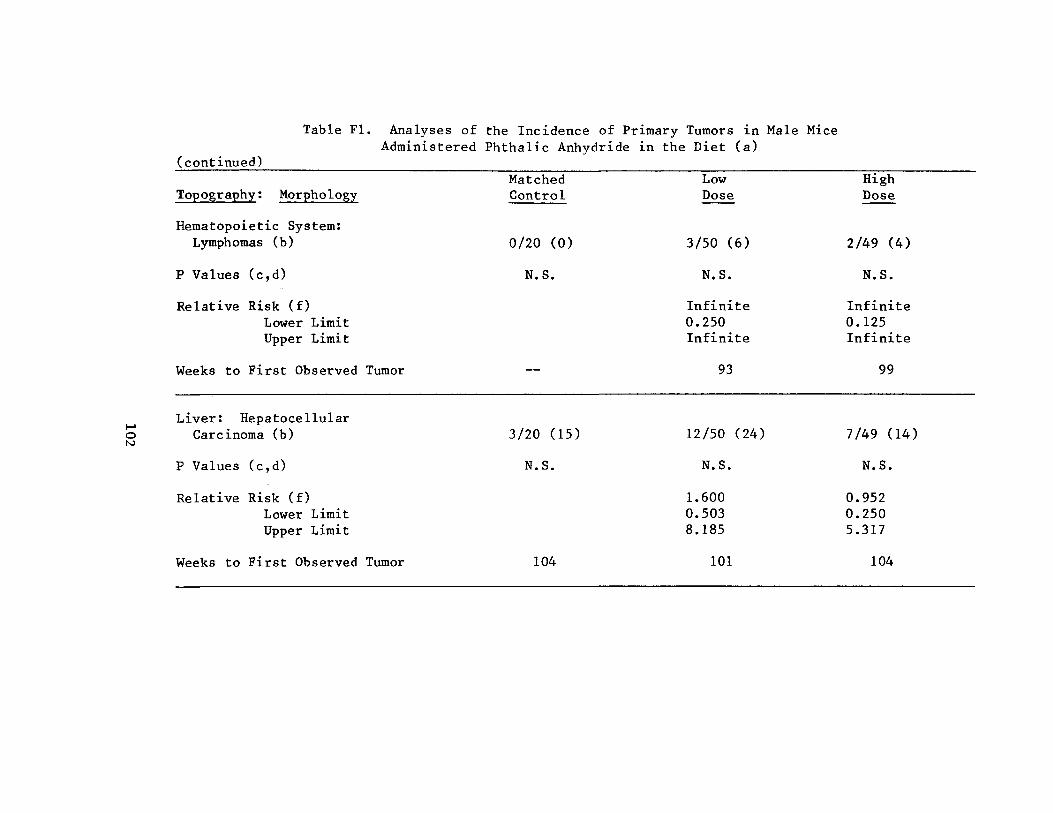
Table Fl. Analyses of the Incidence of Primary Tumors in Male Mice Administered Phthalic Anhydride in the Diet (a)
(continued) Matched Low
Topography: Morphology Control Dose
Hematopoietic System: Lymph omas (b) 0/20 (0) 3/50 (6)
P Values (c,d) N.S. N.S.
Relative Risk (f) Infinite Lower Limit 0.250 Upper Limit Infinite
Weeks to First Observed Tumor — 93
Liver: Hepatocellular o Carcinoma (b) 3/20 (15) 12/50 (24) NJ
P Values (c,d) N.S. N.S.
Relative Risk (f) 1.600 Lower Limit 0.503 Upper Limit 8.185
Weeks to First Observed Tumor 104 101
High Dose
2/49 (4)
N.S.
Infinite 0.125 Infinite
99
7/49 (14)
N.S.
0.952 0.250 5.317
104
Table Fl. Analyses of the Incidence of Primary Tumors in Male Mice Administered Phthalic Anhydride in the Diet (a)
(continued)
(a) Dosed groups received time-weighted average doses of 16,346 or 32,692 ppm.
(b) Number of tumor-bearing animals/number of animals examined at site (percent).
(c) Beneath the incidence of tumors in the control group is the probability level for the Cochran-Armitage test when P is less than 0.05, otherwise, not significant (N.S.) is indicated. Beneath the incidence of tumors in a dosed group is the probability level for the Fisher exact test for the comparison of that dosed group with the matched-control group when P is less than 0.05; otherwise not significant (N.S.) is indicated.
(d) A negative trend (N) indicates a lower incidence in a dosed group than in a control group.
(e) The probability level for departure from linear trend is given when P is less than 0.05 for any comparison.
(f) The 95% confidence interval of the relative risk between each dosed group and the control group.

Table F2. Analyses of the Incidence of Primary Tumors in Female Mice Administered Phthalic Anhydride in the Diet (a)
Topography: Morphology
Lung: Alveolar/Bronchiolar Carcinoma (b)
P Values (c,d)
Relative Risk (f) Lower Limit Upper Limit
Weeks to First Observed Tumor
Lung: Alveolar/Bronchiolar Carcinoma or Adenoma (b)
P Values (c,d)
Relative Risk (f) Lower Limit Upper Limit
Weeks to First Observed Tumor
Matched Low Control Dose
1/20 (5) 3/49 (6)
N.S. N.S.
1.224 0.108 62.958
99 44
1/20 (5) 6/49 (12)
N.S. N.S.
2.449 0.332
110.166
99 44
High Dose
1/48 (2)
N.S.
0.417 0.006 32.058
104
2/48 (4)
N.S.
0.833 0.047 48.155
104

Table F2. Analyses of the Incidence of Primary Tumors in Female Mice Administered Phthalic Anhydride in the Diet (a)
(continued) Matched Low High
Topography: Morphology Control Dose Dose
Hematopoietic System: Lymphomas (b) 3/20 (5) 11/49 (22) 8/48 (17)
P Values (c,d) N.S. N.S. N.S.
Relative Risk (f) 1.497 1.111 Lower Limit 0.460 0.308 Upper Limit 7.741 6.043
Weeks to First Observed Tumor 104 90 71
Hematopoietic System: Lymphomas or Leukemias (b) 3/20 (15) 11/49 (22) 9/48 (19) o
Ul
P Values (c,d) N.S. N.S. N.S.
Relative Risk (f) 1.497 1.250 Lower Limit 0.460 0.361 Upper Limit 7.741 6.662
Weeks to First Observed Tumor 104 90 71

Table F2. Analyses of the Incidence of Primary Tumors in Female Mice Administered Phthalic Anhydride in the Diet (a)
(continued) Matched Low High
Topography: Morphology Control Dose Dose
Thyroid: Adenoma, NOS (b) 2/19 (11) 0/48 (0) 0/46 (0)
P Values (c,d) P = 0.025 (N) N.S. N.S.
Departure from Linear Trend (e) P = 0.043
Relative Risk (f) 0.000 0.000 Lower Limit 0.000 0.000 Upper Limit 1.329 1.386
Weeks to First Observed Tumor 104 — —
(a) Dosed groups received time-weighted average doses of 12,019 or 24,038 ppm.
(b) Number of tumor-bearing animals/number of animals examined at site (percent).
(c) Beneath the incidence of tumors in the control group is the probability level for the Cochran-Armitage test when P is less than 0.05, otherwise, not significant (N.S.) is indicated. Beneath the incidence of tumors in a dosed group is the probability level for the Fisher exact test for the comparison of that dosed group with the matched-control group when P is less than 0.05; otherwise not significant (N.S.) is indicated.
(d) A negative trend (N) indicates a lower incidence in a dosed group than in a control group.
(e) The probability level for departure from linear trend is given when P is less than 0.05 for any comparison.
(f) The 95% confidence interval of the relative risk between each dosed group and the control group.
Review of the Bioassay of Phthalic Anhydride* for Carcinogenicity by the Data Evaluation/Risk Assessment Subgroup of the Clearinghouse on Environmental Carcinogens
December 13, 1978
The Clearinghouse on Environmental Carcinogens was established in May, 1976, in compliance with DREW Committee Regulations and the Provisions of the Federal Advisory Committee Act. The purpose of the Clearinghouse is to advise the Director of the National Cancer Institute on the Institute's bioassay program to identify and evaluate chemical carcinogens in the environment to which humans may be exposed. The members of the Clearinghouse have been drawn from academia, industry, organized labor, public interest groups, and State health officials. Members have been selected on the basis of their experience in carcinogenesis or related fields and, collectively, provide expertise in chemistry, biochemistry, biostatistics, toxicology, pathology, and epidemiology. Representatives of various Governmental agencies participate as ad hoc members. The Data Evaluation/Risk Assessment Subgroup of the Clearinghouse is charged with the responsibility of providing a peer review of reports prepared on NCI-sponsored bioassays of chemicals studied for carcinogenicity. It is in this context that the below critique is given on the bioassay of Phthalic Anhydride.
The reviewer for the report on the bioassay of Phthalic Anhydride agreed with the conclusion that the compound was not carcinogenic under the conditions of test. After a brief description of the experimental design, he said that both the dose levels tested and the animal survival were adequate. There was no objection to the reviewer's motion that the report on the bioassay of Phthalic Anhydride be accepted as written.
Clearinghouse Members Present:
Arnold L. Brown (Chairman), University of Wisconsin Medical School Joseph Highland, Environmental Defense Fund William Lijinsky, Frederick Cancer Research Center Henry Pitot, University of Wisconsin Medical Center Verne A. Ray, Pfizer Medical Research Laboratory Verald K. Rowe, Dow Chemical USA Michael Shimkin, University of California at San Diego Louise Strong, University of Texas Health Sciences Center Kenneth Wilcox, Michigan State Health Department
Subsequent to this review, changes may have been made in the bioassay report either as a result of the review or other reasons. Thus, certain comments and criticisms reflected in the review may no longer be appropriate.
107
JJ.U.S. GOVERNMENT P R I N T I N G OFFICE: 1979-281-217/3012


DHEW Publication No. (NIH) 79-1715