annual survey 2014 - home page | e-mfp survey... · annual survey 2014 e ... – position paper no...
TRANSCRIPT

Prepared by Gabriela Erice & Daniel Rozas, e-MFP, in collaboration with the e-MFP Action Group of Investors in Tier 2/3 MFIs
ANNUAL SURVEY 2014 e-MFP Action Group of Investors in Tier 2/3 MFIs

Introduction
• Group of investors working together to further support and develop partner tier 2/3 MFIs
• Established in 2011
• Website
• Publications – Position Paper No 1 Supporting smaller MFIs to advance financial inclusion, July 2012
Presents the results of the 1st Action Group Survey on the investments of the AG members in Tier 2&3 MFIs
– Discussion Paper No 1 Working towards a common consensus on the definition of Tiers in microfinance, April 2013
Established a definition and criteria for Tiers
– Position Paper No 2 Results of the survey conducted among the Action Group members according to the definition of tiers in microfinance, November 2013
Presents the results of the 2nd Action Group Survey on the investments of the AG members in Tier 2&3 MFIs
3rd Action Group Survey
• Participants: ADA/LMDF, Luxembourg; Alterfin, Belgium; Babyloan, France; Etimos, Italy; Fefisol, France; Grameen Crédit Agricole Microfinance Foundation, France; KIVA, USA; Norwegian Microfinance Initiative, Norway; ResponsAbility, Switzerland; SIDI, France; TripleJump, The Netherlands.
• The Survey presents the results of the consolidated analysis of the portfolios of the participants by tier, type of investment and geographical location and the trends for years 2012-2013.
• Portfolio data: 31/12/2013
e-MFP Action Group of Investors in Tier 2/3MFIs
2

Introduction Tier Criteria
(Discussion Paper No 1)
Tier 1 Tier 2 Tier 3
Size Assets > USD 50 M Assets USD 5M – USD 50M Assets < USD 5M
Sustainability
RoA > 0 during 2 out of 3 last years AND all RoA > -5%
Positive RoA in 1 out of last 3 years and other >-5% OR positive trend in RoA and all >-5%
No requirement
Transparency Regulated financial institution OR rated financial institution
Audited financial statements for at least 3 years
No requirement
3

Survey data 2011-2013
2011 (Position Paper No 1)
2012 (Position Paper No 2)
2013
Funders 8 11 11
No. of Investments
332 465 505
No. of Countries 73 76 94
Tier 2&3 Portfolio (EUR)
99,77 M 365,79 M 403,67 M
4

Key findings • The investments in Tier 2/3 MFIs represent 23% of the total microfinance portfolio
(404 M EUR out of 1,734 M EUR) & 58% of the total number of investments (505 out of 871 investments)
• Average investment in Tier 2/3 MFIs is 0.79 M EUR (1.09 M EUR in Tier 2 MFIs & 0.31 M EUR in Tier 3 MFIs)
• Concentration of investments by volume:
o Eastern Europe & Central Asia receives almost 50% (191 M EUR) of Tier 2/3 MFIs investments, Latin America & the Caribbean gets 25% (103 M EUR)
o The top 10 worldwide countries receive more than 50% (210 M EUR) of the total amount invested in Tier 2/3 MFIs
• Debt is the main instrument used:
o More than 90% of the amount of investments is invested through debt instruments for both Tier 2/3 MFIs (390 M EUR)
o Except for South Asia, where 30% of the total investments is invested through equity, in all other regions debt represents more than 90% of the investments
5

Key findings
6
• Concentration trend (sample of 10 investors providing data for both 2012 & 2013): o The total amount of investment in Tier 2/3 MFIs has increased (+6.7%) while the number of
investments has decreased (-5.2%), resulting in an increase of +12.6% of the average investment size
o In all regions the number of investments in Tier 2/3 MFIs has decreased except for MENA where it hasn’t changed and Sub-Saharan Africa where it has increased
• Sub-Saharan Africa continues to be relevant to the Survey participants: o 2nd region receiving most number of investments in Tier 2/3 MFIs (30% - 139, after Latin America
& The Caribbean which receive almost 40% - 186)
o 3rd region in volume of investments in Tier 2/3 MFIs (16%, 67 M EUR)
o 1st region by number of investments (40% - 75 out of 188) and volume of investments (40%, 24 M EUR out of 58 M EUR) in Tier 3 MFIs
o Only region where both the total number of investments and the amount of investment in Tier 2/3 MFIs has increased*: 21.8%, from 87 to 106 & 24.2%, from 49 M EUR to 61 M EUR
• Technical Assistance o 5 out of the 11 investors offered 44 Technical Assistance (TA) programmes
o The investments with TA amount to 8.7% of the total number of investments and 5.3% of the total amount of investment.
o The average of the investments with TA is 0.48M EUR and the main target for TA is in Governance and Risk Management
*Note: this results of the sample of 10 investors providing data for both 2012 & 2013

Breakdown by Tier
AVERAGE INVESTMENTS (Million EUR)
Tier 1 3.63
Tier 2 1.09
Tier 3 0.31
Tier 2/3 0.79
No. of Investments
Total Investment (Million EUR)
Tier 1 366 1,330.03 Tier 2 317 345.52 Tier 3 188 58.15 Tier 2/3 505 403.67
7
22%
3%
36%
20%
42%
77%
No. of Investments Total Investments
Tier 1
Tier 2
Tier 3

Geographical breakdown Tier 2/3 MFIs
28%
8%
16%
37%
6% 2%
4%
16%
4%
47%
25%
3% 0%
3%
SSA EAP EECA LAC MENA OECD SA
No. of Investments (%) Total Investments (%)
64
22
65
130
20
3 13
75
20 16
56
8 6 7
SSA EAP EECA LAC MENA OECD SA
No. of Investments
Tier 2 Tier 3
42,2
14,3
177,6
89,5
10,9 0,8
10,2 24,3
2,9 13,1 13,2
2,7 0,3 1,6
SSA EAP EECA LAC MENA OECD SA
Total Investment (Million EUR)
Tier 2 Tier 3 8
For the regions legend, please check slide no. 9

Geographical breakdown (II)
9
No. of Investments Region Tier 2 Tier 3
Sub-Saharan Africa SSA 20.2% 39.9% East Asia & Pacific EAP 6.9% 10.6% Eastern Europe & Central Asia EECA 20.5% 8.5% Latin America & The Caribbean LAC 41.0% 29.8% Middle East & North Africa MENA 6.3% 4.3% OECD OECD 0.9% 3.2% South Asia SA 4.1% 3.7%
Total Investment Region Tier 2 Tier 3
Sub-Saharan Africa SSA 12.2% 41.8%
East Asia & Pacific EAP 4.1% 5.0%
Eastern Europe & Central Asia EECA 51.4% 22.5%
Latin America & The Caribbean LAC 25.9% 22.7% Middle East & North Africa MENA 3.1% 4.7%
OECD OECD 0.2% 0.6%
South Asia SA 3.0% 2.8%
For the values, please check the graphs in slide 8

Type of Investment
97,2% 92,3%
2,6% 6,9%
0,2% 0,8%
Tier 2 Tier 3
By Tier Total Investment
Debt
Equity
Guarantee
93% 97% 100% 96% 97% 100%
69%
6% 3% 4% 3%
29%
1% 1% 2%
SSA EAP EECA LAC MENA OECD SA
Per Region Total Investment in Tier 2/3 MFIs
Debt Equity Guarantee
10 For the regions legend, please check slide no. 9

TOP 10 Countries, Tier 2/3 MFIs
Kosovo 9%
Tajikistan 8%
Romania 7%
Montenegro 5%
Azerbaijan 4%
Armenia 4%
Peru 4%
Nicaragua 4% Ecuador
4%
Bolivia 3%
Rest (84 countries)
48%
Total Investment received
Peru 6%
Nicaragua 4%
Ecuador 4%
El Salvador 4%
Senegal 4%
Guatemala 3%
Bolivia 3%
Tajikistan 3%
Honduras 3%
Cambodia 3%
Rest (84 countries)
63%
Total No. of Investments received
11

TOP 10 Countries by Tier
Nigeria 7%
Kosovo 6% Tajikistan
5%
Azerbaijan 5% Nicaragua
4%
Montenegro 4%
Kenya 4%
Honduras 3% Peru
3% Senegal 3%
Rest (60 countries)
56%
Total Investment received
Kosovo 9%
Tajikistan 9% Romania
9%
Montenegro 5%
Armenia 5%
Peru 4%
Azerbaijan 4%
Ecuador 4%
Nicaragua 4% Bolivia
3%
Rest (58 countries)
44%
Total Investment received
Peru 7%
Nicaragua 5% Ecuador
5%
El Salvador 5%
Tajikistan 4%
Bolivia 4%
Senegal 4%
Mexico 4%
Guatemala 3% Philippines
3%
Rest (58 countries)
56%
No. of Investments received Cambodia
5% Peru 5%
Togo 4%
Nicaragua 3% Senegal
3% Burkina Faso
3% Sierra Leone 3%
Ecuador 3%
United States 3%
Honduras 3%
Rest (60 countries)
65%
No. of Investments received
TIER 2 MFIs TIER 3 MFIs
12

Co-Investments
• Analysis based on the data provided by 10 investors who reported the names of the MFIs funded.
• The sample comprises 419
investments in 315 Tier 2/3 MFIs
117
33
16
124
18 7
1 Investor 2 Co-Investors > 2 Co-Investors
Breakdown by No. of Co-Investors (No. of MFIs)
Tier 2 Tier 3
78% 83%
60% 69% 67%
100%
65% 78%
67% 83%
91% 100%
11% 10%
20% 15%
29% 24%
20% 25%
17% 9% 11% 7%
20% 15% 5% 11%
2% 8%
T2 T3 T2 T3 T2 T3 T2 T3 T2 T3 T2 T3
SSA EAP EECA LAC MENA SA
Breakdown per Region (No. of MFIs)
> 2 Co-Investors
2 Co-Investors
1 Investor
13
For the regions legend, please check slide no. 9

Trends by Tier 2012-2013
312
47
331
52
Tier 2 Tier 3
Total Investment (Million EUR)
2012 2013
10.2%
6.2%
262
141
256
126
Tier 2 Tier 3
Total No. of Investments
2012 2013
2.3%
-10.6%
Analysis based on the data provided by 10 investors who have participated in both Surveys
Tier 2/3 MFIs 2012 2013 Change (%)
Total Investment (Million EUR) 359.14M 383.07M 6.7%
No. of Investments 403 382 -5.2%
Average Investment (EUR) 0.89M 1.00M 12.6%
2012 2013 2012 2013 14

Trends by Region 2012-2013 Tier 2/3 MFIs
87
39
77
170
16 14
106
29
69
150
16 12
SSA EAP EECA LAC MENA SA
Total No. of Investments
2012 2013
-25.6%
-10.4%
-11.8%
-14.3% 49,4
24,2
133,7 132,8
11,5 7,5
61,3
15,1
187,3
97,4
11,4 10,6
SSA EAP EECA LAC MENA SA
Total Investment (Million EUR)
2012 2013
24.2%
-26.7%
-1% 41.5%
21.8%
-37.6%
40.1%
15
For the regions legend, please check slide no. 9

Trends by Countries 2012-2013
TIER 2&3 MFIs
2013 2012
1 Kosovo 9.0% 1 Ecuador 6.9%
2 Tajikistan 8.6% 2 Russia 5.6%
3 Romania 7.9% 3 Tajikistan 5.0%
4 Montenegro 5.5% 4 Mexico 4.9%
5 Azerbaijan 4.3% 5 Peru 4.6%
6 Peru 4.0% 6 Bolivia 4.4%
7 Armenia 4.0% 7 Cambodia 4.2%
8 Ecuador 3.8% 8 Georgia 3.8%
9 Nicaragua 3.8% 9 Armenia 3.6%
10 Bolivia 2.8% 10 Nicaragua 3.4%
Rest (68 countries) 46.2% Rest (62 countries) 53.6%
TIER 2 MFIs
2013 2012
1 Kosovo 9.4% 1 Ecuador 7.4% 2 Romania 9.2% 2 Russia 6.2%
3 Tajikistan 9.1% 3 Mexico 5.4%
4 Montenegro 5.7% 4 Peru 5.1%
5 Armenia 4.6% 5 Tajikistan 4.8%
6 Peru 4.3% 6 Bolivia 4.6%
7 Azerbaijan 4.2% 7 Georgia 4.4%
8 Ecuador 4.0% 8 Cambodia 4.1%
9 Nicaragua 3.7% 9 Armenia 3.9%
10 Georgia 3.0% 10 Nicaragua 3.5%
Rest (51 countries) 42.9% Rest (49 countries) 50.7%
TIER 3 MFIs
2013 2012
1 2
Nigeria 7.3% 1 Tajikistan 6.7%
Kosovo 6.6% 2 Kosovo 6.5%
3 Tajikistan 5.9% 3 El Salvador 5.4%
4 Azerbaijan 5.4% 4 Nigeria 5.4%
5 Montenegro 4.5% 5 Cambodia 5.2%
6 Nicaragua 4.2% 6 Argentina 4.3%
7 Honduras 3.9% 7 Azerbaijan 4.3%
8 Tanzania 3.1% 8 Ecuador 3.7%
9 Cambodia 3.0% 9 Uganda 3.7%
10 Senegal 2.9% 10 Costa Rica 3.5%
Rest (42 countries) 53.1% Rest (40 countries) 51.2%
Total Investment received (%)
16

TIER 2&3 MFIs
2013 2012
1 Kosovo 34.56 1 Ecuador 24.78
2 Tajikistan 33.05 2 Russia 20.18
3 Romania 30.37 3 Tajikistan 18.00
4 Montenegro 21.17 4 Mexico 17.69
5 Azerbaijan 16.60 5 Peru 16.41
6 Peru 15.37 6 Bolivia 15.73
7 Armenia 15.32 7 Cambodia 15.14
8 Ecuador 14.44 8 Georgia 13.60
9 Nicaragua 14.40 9 Armenia 12.77
10 Bolivia 10.64 10 Nicaragua 12.15
Rest (68 countries) 177.14 Rest (62 countries) 192.58
TIER 2 MFIs
2013 2012
1 Kosovo 31.17 1 Ecuador 23.02 2 Romania 30.37 2 Russia 19.25
3 Tajikistan 30.00 3 Mexico 16.97
4 Montenegro 18.82 4 Peru 15.78
5 Armenia 15.32 5 Tajikistan 14.85
6 Peru 14.17 6 Bolivia 14.27
7 Azerbaijan 13.79 7 Georgia 13.6
8 Ecuador 13.39 8 Cambodia 12.71
9 Nicaragua 12.21 9 Armenia 12.31
10 Georgia 10.05 10 Nicaragua 10.92
Rest (51 countries) 142.04 Rest (49 countries) 158.38
TIER 3 MFIs
2013 2012
1 2
Nigeria 3.78 1 Tajikistan 3.15
Kosovo 3.39 2 Kosovo 3.05
3 Tajikistan 3.05 3 El Salvador 2.54
4 Azerbaijan 2.81 4 Nigeria 2.53
5 Montenegro 2.35 5 Cambodia 2.43
6 Nicaragua 2.19 6 Argentina 2.03
7 Honduras 2.00 7 Azerbaijan 2.02
8 Tanzania 1.61 8 Ecuador 1.75
9 Cambodia 1.54 9 Uganda 1.74
10 Senegal 1.51 10 Costa Rica 1.66
Rest (42 countries) 27.49 Rest (40 countries) 24.07
Total Investment received (Million EUR)
17
Trends by Countries 2012-2013

Technical Assistance
Tier 2 Tier 3 TOTAL
No. of Investments with TA 28 16 44
Total Investment with TA 16.99M 4.29M 21.28M
Average Investment with TA 0.61M 0.27M 0.48M
59%
15%
13%
8%
5%
% of Total Investment with TA
71% 11%
10%
5%
3%
% of Total No. of Investments with TA
Governance & riskmanagement
Other
Staff Development /Training
MIS & IT
Product development
Technical Assistance Purpose
5 investors out of 11 reported providing Technical Assistance
18
8,8%
4,9%
8,5%
7,4%
Share of No. of Inv. Share of Total Inv.
Investments with TA
Tier 2 Tier 3

Survey Methodology
• Participants – 7 AG members have contributed to the three Surveys for the three
years in a row (although in 2011 one of them didn’t report the amount of investments)
– 3 new members contributed data for 2012 and again for 2013 – There is 1 new contributor for 2013, while one of the members who
contributed for 2011 never contributed again, and another member only contributed for 2012
• Changes to previous Surveys methodology – Use of No of Investments instead of No of MFIs: 1 investor doesn’t
provide the names of MFIs, thus, calculating co-investments and therefore the unique number of MFIs is limited to a subsample of 10 survey contributors
– Survey regions: for the first time the Survey includes investments in Tier 2/3 MFIs in OECD countries (for 2013 this region only refers to one country – US)
19
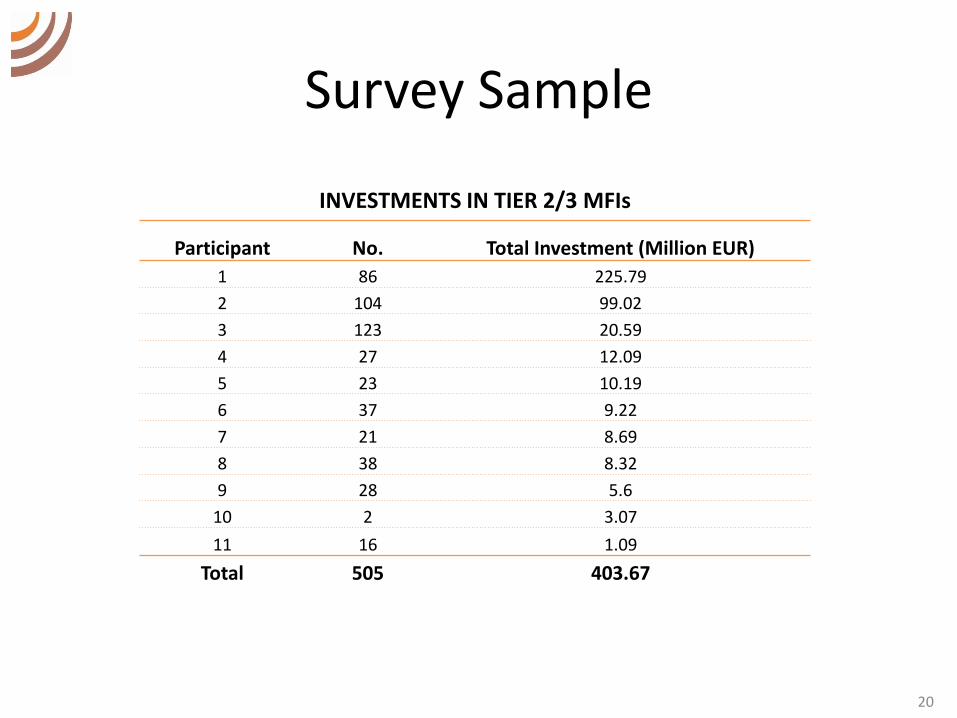
Survey Sample
20
INVESTMENTS IN TIER 2/3 MFIs
Participant No. Total Investment (Million EUR)
1 86 225.79
2 104 99.02
3 123 20.59
4 27 12.09
5 23 10.19
6 37 9.22
7 21 8.69
8 38 8.32
9 28 5.6
10 2 3.07
11 16 1.09
Total 505 403.67

Survey Participants
21

22
39 rue Glesener
L-1631 Luxembourg
Tel: + 352 26271382
www.e-mfp.eu
With the support of