annual report 2013 · this performance also continues our legacy ... & senior credit analyst...
TRANSCRIPT

CITIZENS HOLDING COMPANY521 Main Street, Philadelphia, MS 39350 601.656.4692 www.thecitizensbankphila.com
ANNUAL REPORT2013
CB_Cover_2013_v1.indd 1-2 3/5/14 10:55 AM

CB_Cover_2013_v1.indd 3-4 3/5/14 10:55 AM

LETTER TO THE STOCKHOLDERS
1
For fiscal year 2013, The Citizens Bank increased Net Income by 5.4%, while deposits rose 1.9%. Our
Total Loans increased 6.3%, testament to our commitment of meeting the financial needs of families and
business owners across our market area. In our role as a true community bank, that investment ripples
through communities to enhance the quality of life we share. This performance also continues our legacy
of strong, consistent stockholder returns and was accomplished in a less-than-perfect national economy.
Your Board and management team believe that our fiscal strength and stability sits at the heart of our
mission. Without financial stability, our prominence is diminished and our role diluted. The principles of
strength and soundness are the result of the pursuit of integrity in our actions, our plans and our daily
performance. I am proud of the leadership your Board has provided, the diligence of our management
team in working to foster an environment of respect and service-driven banking to our customers, and
to our employees for sharing a common thread of dedication to excellence as we help those customers
reach their financial goals. Truly, ours is a team approach that shares common values; values that drive
our decisions each and every day.
The Citizens Bank was selected as a Top 200 Community Bank in the United States by the American
Banker magazine. While we appreciate the continuing recognition, we will not rest on our laurels as 2014
unfolds and in the years ahead. Our brand of banking and the management model we have created
works well.
Personal service is, and will remain, the signature of The Citizens Bank. With that being said, we
recognize the need to introduce convenient, safe technologies to enhance our customers’ banking
experience. During 2013 we unveiled a new Online Banking system, a more responsive website and
Mobile Deposit Capture, which allows customers with smart devices the capability to scan and make
non-cash deposits 24/7, from wherever they have internet access.
As always, I appreciate your support in the continuing success of this great company.
Sincerely,
Greg McKee
President & CEO
I am pleased to announce that The
Citizens Bank enjoyed a successful
and profitable year. By virtually
any standard, your bank achieved
significant success while we continue
to embrace timeless values of true
community banking in our service to
customers and communities.
CB_Inside_2013_v1.indd 1 3/5/14 10:53 AM

Front row seated:A. T. Williams, Greg McKee President & CEO, Herbert A. King Board Chairman, Don L. Kilgore
Back row standing: Dr. Craig Dungan, Terrell E. Winstead, Daniel Adams Mars, Don L. Fulton, David A. King, David P. Webb
OUR BOARD OF DIRECTORS
32
CB_Inside_2013_v1.indd 2-3 3/5/14 10:53 AM

Front row seated:A. T. Williams, Greg McKee President & CEO, Herbert A. King Board Chairman, Don L. Kilgore
Back row standing: Dr. Craig Dungan, Terrell E. Winstead, Daniel Adams Mars, Don L. Fulton, David A. King, David P. Webb
OUR BOARD OF DIRECTORS
32
CB_Inside_2013_v1.indd 2-3 3/5/14 10:53 AM

For over 100 years, we have been a strong, solid community bank with a legacy of integrity and commitment to our customers, bank family, stockholders and communities.
Front Row: Stacy Arnold, Vicki Brown, Gayle Sharp, Jean Fulton, Jackie Hester, Erdis Chaney, Liz Owen
Back Row:Ray Stone, Robert Smith, Greg McKee, Ledale Reynolds, Mark Taylor
54
OUR CORPORATE MANAGEMENT TEAM
WE CONTINUE TO DEMONSTRATE THAT COMMITMENT TO YOU:
• OUR COMMUNITIES, by investing our time, talents and financial resources.
• OUR CUSTOMERS, by offering innovative quality products and outstanding service that meet your business and personal needs.
• OUR BANK FAMILY, by fostering a positive, productive work environment, while making financial provisions that enhance your economic well-being.
• OUR STOCKHOLDERS, by consistently providing you with an optimum return on your investments.
The Citizens Bank —
“OUR FAMILY EMBRACING YOUR FAMILY SINCE 1908.”
OUR VISION
CB_Inside_2013_v1.indd 4-5 3/5/14 10:54 AM

Bank Officers Greg McKee President & CEO
Robert T. Smith Sr. Vice President & CFO
Mark Taylor Vice President & COO
Erdis Chaney Vice President & Sr. Deposit Officer
Ledale Reynolds Vice President & CIO
Ray Stone Vice President & Sr. Credit Officer
Randy Cheatham Vice President
Jackie Hester Vice President & Marketing Officer
Jean Fulton Vice President & Internal Auditor
Darrel Bates Vice President
Michael Chandler Vice President
Archie Anderson Vice President & Branch Manager
Gayle Sharp Vice President & Loan Operations Officer
Mark Majure Vice President
Bob Posey Vice President
Vicki Brown Vice President & BSA Officer
Stacy Arnold Vice President & Compliance Officer
Josh Sullivan Vice President & Senior Credit Analyst
Carolyn K. McKee Assistant Vice President
Beth Branning Assistant Vice President
Sommer Vick Assistant Vice President
Mitch Peden Assistant Vice President & Information Services Manager
Mark Flake Assistant Vice President & Network Services Manager
Liz Owen Assistant Vice President HR & Chief Risk Officer
Ashley Peebles Assistant Vice President & Customer Service Manager
Scott Lewis Assistant Vice President & Information Security Officer
Pat Stokes Assistant Cashier
Greg Jackson Accounting Officer
Tammy Pope Accounting Officer
Deborah Ladd Item Processing Officer
Linda Goforth Electronic Banking Officer
Patti Rickles ACH Officer
Westside BranchTommy Jackson Assistant Vice President
Eastside BranchBrad Copeland Vice President
Carthage Branch Mike Brooks President
Billy Cook Vice President
Sue Fisher Assistant Cashier
Sebastopol BranchConnie Comans President
Union BranchRobert C. Palmer, Jr. President
Marianne Strickland Assistant Cashier
Dekalb & Scooba BranchReginald Moore Assistant Vice President
Jan White Branch Operations Officer
Kosciusko BranchSteve Potts Vice President
Meridian Eastgate BranchCharles Young Regional Commercial Lender
Vikki Gunter Assistant Vice President
Meridian Broadmoor BranchJustin Branstetter Assistant Vice President
Annette Brooks Assistant Cashier
Forest BranchRichard Latham Vice President
Dymple Winstead Assistant Vice President
Decatur BranchCamp Keith Vice President & Sr. Consumer Credit Officer
Louisville BranchBruce Lee President
Marion Gardner Assistant Cashier
Lynn Graham Branch Operations Officer
Collinsville BranchMike Shelby Vice President
Starkville BranchStan Acy Regional Commercial Lender
Rhonda Edmonson Assistant Cashier
Charles Byrd Assistant Cashier & Appraisal Review Specialist
Hattiesburg BranchTravis Moore Regional President South Mississippi
Blake Walker President Hattiesburg
Biloxi Cedar Lake BranchBrandon Sherwood President Gulf Coast Region
Sharon Pollina Assistant Vice President
Mortgage Loan DepartmentDavid Blair Kosciusko Branch Vice President
Tammy Warren Biloxi Lemoyne Branch Assistant Vice President
Charlene DeWeese Philadelphia Annex Assistant Cashier & Mortgage Loan Officer
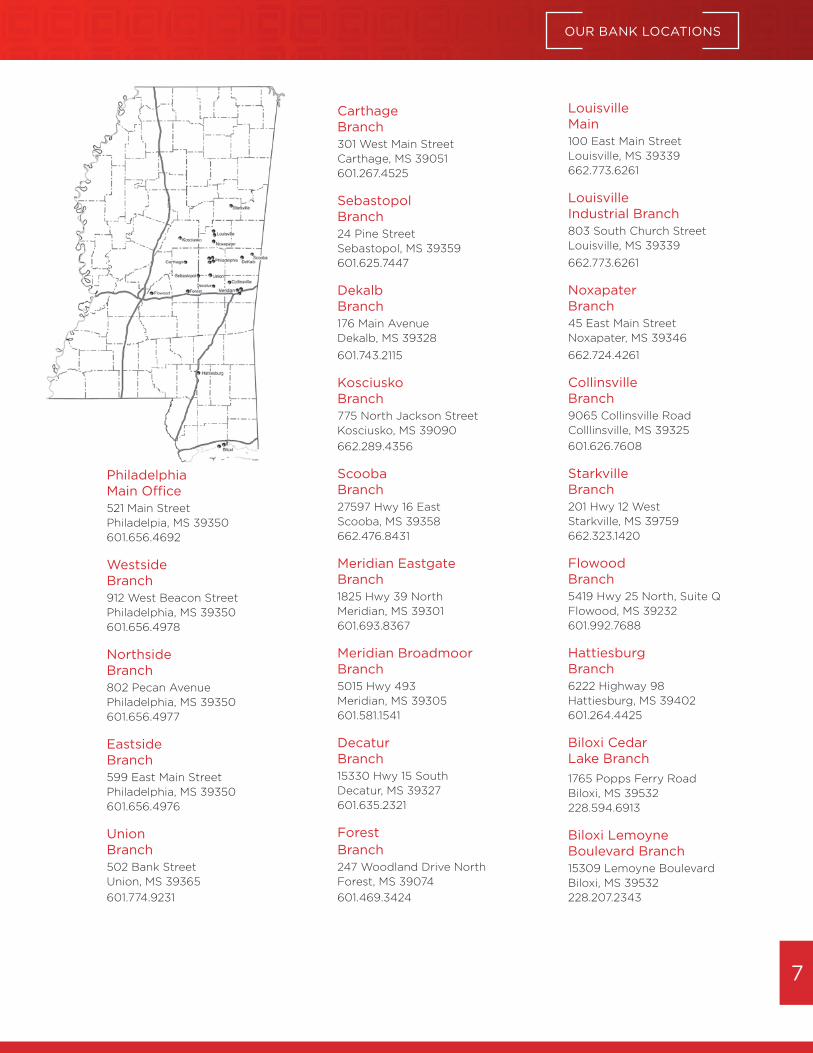
Philadelphia Main Office521 Main Street Philadelpia, MS 39350 601.656.4692
Westside Branch912 West Beacon Street Philadelphia, MS 39350 601.656.4978
Northside Branch802 Pecan Avenue Philadelphia, MS 39350 601.656.4977
Eastside Branch599 East Main Street Philadelphia, MS 39350 601.656.4976
Union Branch502 Bank Street Union, MS 39365
601.774.9231
Carthage Branch301 West Main Street Carthage, MS 39051 601.267.4525
Sebastopol Branch24 Pine Street Sebastopol, MS 39359 601.625.7447
Dekalb Branch176 Main Avenue Dekalb, MS 39328
601.743.2115
Kosciusko Branch775 North Jackson Street Kosciusko, MS 39090
662.289.4356
Scooba Branch27597 Hwy 16 East Scooba, MS 39358 662.476.8431
Meridian Eastgate Branch1825 Hwy 39 North Meridian, MS 39301 601.693.8367
Meridian Broadmoor Branch5015 Hwy 493 Meridian, MS 39305 601.581.1541
Decatur Branch15330 Hwy 15 South Decatur, MS 39327 601.635.2321
Forest Branch247 Woodland Drive North Forest, MS 39074
601.469.3424
Louisville Main 100 East Main Street Louisville, MS 39339 662.773.6261
Louisville Industrial Branch803 South Church Street Louisville, MS 39339
662.773.6261
Noxapater Branch45 East Main Street Noxapater, MS 39346
662.724.4261
Collinsville Branch9065 Collinsville Road Colllinsville, MS 39325
601.626.7608
Starkville Branch201 Hwy 12 West Starkville, MS 39759 662.323.1420
Flowood Branch5419 Hwy 25 North, Suite Q Flowood, MS 39232 601.992.7688
Hattiesburg Branch6222 Highway 98 Hattiesburg, MS 39402 601.264.4425
Biloxi Cedar Lake Branch
1765 Popps Ferry Road Biloxi, MS 39532 228.594.6913
Biloxi Lemoyne Boulevard Branch15309 Lemoyne Boulevard Biloxi, MS 39532 228.207.2343
OUR BANK LOCATIONS
76
OUR BANK OFFICERS
CB_Inside_2013_v1.indd 6-7 3/5/14 10:54 AM
Bank Officers Greg McKee President & CEO
Robert T. Smith Sr. Vice President & CFO
Mark Taylor Vice President & COO
Erdis Chaney Vice President & Sr. Deposit Officer
Ledale Reynolds Vice President & CIO
Ray Stone Vice President & Sr. Credit Officer
Randy Cheatham Vice President
Jackie Hester Vice President & Marketing Officer
Jean Fulton Vice President & Internal Auditor
Darrel Bates Vice President
Michael Chandler Vice President
Archie Anderson Vice President & Branch Manager
Gayle Sharp Vice President & Loan Operations Officer
Mark Majure Vice President
Bob Posey Vice President
Vicki Brown Vice President & BSA Officer
Stacy Arnold Vice President & Compliance Officer
Josh Sullivan Vice President & Senior Credit Analyst
Carolyn K. McKee Assistant Vice President
Beth Branning Assistant Vice President
Sommer Vick Assistant Vice President
Mitch Peden Assistant Vice President & Information Services Manager
Mark Flake Assistant Vice President & Network Services Manager
Liz Owen Assistant Vice President HR & Chief Risk Officer
Ashley Peebles Assistant Vice President & Customer Service Manager
Scott Lewis Assistant Vice President & Information Security Officer
Pat Stokes Assistant Cashier
Greg Jackson Accounting Officer
Tammy Pope Accounting Officer
Deborah Ladd Item Processing Officer
Linda Goforth Electronic Banking Officer
Patti Rickles ACH Officer
Westside BranchTommy Jackson Assistant Vice President
Eastside BranchBrad Copeland Vice President
Carthage Branch Mike Brooks President
Billy Cook Vice President
Sue Fisher Assistant Cashier
Sebastopol BranchConnie Comans President
Union BranchRobert C. Palmer, Jr. President
Marianne Strickland Assistant Cashier
Dekalb & Scooba BranchReginald Moore Assistant Vice President
Jan White Branch Operations Officer
Kosciusko BranchSteve Potts Vice President
Meridian Eastgate BranchCharles Young Regional Commercial Lender
Vikki Gunter Assistant Vice President
Meridian Broadmoor BranchJustin Branstetter Assistant Vice President
Annette Brooks Assistant Cashier
Forest BranchRichard Latham Vice President
Dymple Winstead Assistant Vice President
Decatur BranchCamp Keith Vice President & Sr. Consumer Credit Officer
Louisville BranchBruce Lee President
Marion Gardner Assistant Cashier
Lynn Graham Branch Operations Officer
Collinsville BranchMike Shelby Vice President
Starkville BranchStan Acy Regional Commercial Lender
Rhonda Edmonson Assistant Cashier
Charles Byrd Assistant Cashier & Appraisal Review Specialist
Hattiesburg BranchTravis Moore Regional President South Mississippi
Blake Walker President Hattiesburg
Biloxi Cedar Lake BranchBrandon Sherwood President Gulf Coast Region
Sharon Pollina Assistant Vice President
Mortgage Loan DepartmentDavid Blair Kosciusko Branch Vice President
Tammy Warren Biloxi Lemoyne Branch Assistant Vice President
Charlene DeWeese Philadelphia Annex Assistant Cashier & Mortgage Loan Officer
Philadelphia Main Office521 Main Street Philadelpia, MS 39350 601.656.4692
Westside Branch912 West Beacon Street Philadelphia, MS 39350 601.656.4978
Northside Branch802 Pecan Avenue Philadelphia, MS 39350 601.656.4977
Eastside Branch599 East Main Street Philadelphia, MS 39350 601.656.4976
Union Branch502 Bank Street Union, MS 39365
601.774.9231
Carthage Branch301 West Main Street Carthage, MS 39051 601.267.4525
Sebastopol Branch24 Pine Street Sebastopol, MS 39359 601.625.7447
Dekalb Branch176 Main Avenue Dekalb, MS 39328
601.743.2115
Kosciusko Branch775 North Jackson Street Kosciusko, MS 39090
662.289.4356
Scooba Branch27597 Hwy 16 East Scooba, MS 39358 662.476.8431
Meridian Eastgate Branch1825 Hwy 39 North Meridian, MS 39301 601.693.8367
Meridian Broadmoor Branch5015 Hwy 493 Meridian, MS 39305 601.581.1541
Decatur Branch15330 Hwy 15 South Decatur, MS 39327 601.635.2321
Forest Branch247 Woodland Drive North Forest, MS 39074
601.469.3424
Louisville Main 100 East Main Street Louisville, MS 39339 662.773.6261
Louisville Industrial Branch803 South Church Street Louisville, MS 39339
662.773.6261
Noxapater Branch45 East Main Street Noxapater, MS 39346
662.724.4261
Collinsville Branch9065 Collinsville Road Colllinsville, MS 39325
601.626.7608
Starkville Branch201 Hwy 12 West Starkville, MS 39759 662.323.1420
Flowood Branch5419 Hwy 25 North, Suite Q Flowood, MS 39232 601.992.7688
Hattiesburg Branch6222 Highway 98 Hattiesburg, MS 39402 601.264.4425
Biloxi Cedar Lake Branch
1765 Popps Ferry Road Biloxi, MS 39532 228.594.6913
Biloxi Lemoyne Boulevard Branch15309 Lemoyne Boulevard Biloxi, MS 39532 228.207.2343
OUR BANK LOCATIONS
76
OUR BANK OFFICERS
CB_Inside_2013_v1.indd 6-7 3/5/14 10:54 AM

As we close the book on 2013, it’s appropriate to pause for a moment to honor a group of local business and civic leaders from more than a century ago.
While our founders would not recognize modern
banking with our host of technologies, they would
certainly recognize the core values under which we
operate. Since 1908, we have embraced the principles
of true community banking as the foundation of our
growth, success and strength. For having set this
institution on such a course, we are grateful.
How have these principles determined our fate?
It begins with a core commitment of service to the community. We provide banking services for
customers who grace our doorway, but we also invest in the growth of area businesses and volunteer
countless hours in a wide array of civic, economic development and charitable endeavors. By doing so, we
work daily to enhance a shared quality of life and we are recognized corporately and individually as friends
and neighbors.
The Citizens Bank has opened and maintains many accounts. But it’s the relationships behind the accounts
that have the greatest value to us. In today’s world, service is perhaps the most over-promised and
under-delivered word in American business but it sits at the heart of our daily mission. Relationship-based
banking uniquely positions us as a bank that knows its customers far beyond the numbers, imploring us to
help our customers reach their goals. A customer’s success is truly our success.
Our commitment extends beyond the
relationships we share with our consumer
customers. The Citizens Bank is equally committed
to the total financial needs and convenience of
business customers. This commitment is reflected in
a complete array of deposit accounts and services
along with loans and technologies designed to
enhance the corporate banking relationship. We
offer Remote Deposit Capture to businesses,
allowing them to make non-cash deposits from their
desktop computers and alleviating the need to make
a trip to the bank during a business day.
Additionally, Online Cash Management is available
to business owners along with Merchant Services
for credit and debit card purchases at their
point-of-sale; business credit cards and loans.
Among the many credit resources we offer area
businesses are Working Capital Loans, Construction
Loans, Seasonal or Operating Lines of Credit,
Inventory Loans, Business Acquisition Loans, Land
Development Loans and more. Our Commercial
Loan professionals are consistently of service to
businesses large and small. At The Citizens Bank, we
approach every business as a big business.
In the course of pursuing these measures of doing
business, our bank has become synonymous with
traditions of trust, fiscal integrity and service. Like
a table relying on each leg to stand strong, we
recognize the importance of each of these traits
as being essential to our prosperity. Without any
one component of these, we are unfulfilled in our
mission. That being said, we are confirmed in having
excelled in these areas by our selection as a TOP
200 COMMUNITY BANK IN THE UNITED STATES
by American Banker Magazine. The Citizens Bank
has achieved this honor each of the last four years
as we meet the financial needs of families and
business owners throughout Attala, Forrest, Lamar,
Lauderdale, Leake, Kemper, Neshoba, Newton,
Oktibbeha, Rankin, Scott, Winston, Harrison and
Jackson Counties.98
CB_Inside_2013_v1.indd 8-9 3/5/14 10:54 AM

Beyond principles and achievement, however, it’s important to note the changing face of banking
in banks across the nation. New and more stringent regulatory oversight will require more of
management’s time in 2014 and beyond. New and changing technologies are altering the delivery
system of products and financial services as an enhancement to the personal service we have
long provided.
Our new Online Banking system brings new features such as Finance 360, a personal financial
management program. We are also introducing Mobile Remote Deposit Capture, allowing customers
to make deposits to their accounts via their smart device through our Mobile Banking application.
Slowly but surely, we are witnessing an increase in the use of these services by a customer base that
appreciates convenience. As the new year unfolds, we will be creating a new Online Banking website
that is both robust and responsive. By definition, a responsive website such as ours is one that can be
pulled up on a desktop computer, a tablet or a smart phone browser; each equally visible to the user.
This state-of-the-art capability will be the newest manner in which we are meeting the needs of those
who rely on us. As more and more individuals rely on the smart devices to access information wherever
they have internet access, our responsive website will provide a high level of viability.
1110
The 2013 Christmas Season brought an ugly
reality to the lives of millions of Americans in the
form of identity theft. More than 70 million Target
customers learned their debit card information,
including Personal Identification Number, had been
breached. As a result, our bank…along with most
every bank…has been re-issuing new debit cards to
affected customers. It is important to note that The
Citizens Bank has a security system in place to help
protect our debit card customers. Working with
our card processor, we notify customers if large or
“unusual” transaction requests are being processed
against their debit card; and we can notify our
customers to seek verification that the transaction is
legitimate. Additionally, we take every precaution to
protect our customers from identity theft when we
are notified by card processers of a security breach
at specific stores or other retail establishments.
As has long been our privilege and tradition, The
Citizens Bank is proud to recognize our employees
who roll up their sleeves in a wide spectrum of
community endeavors. Most recently, the bank
had floats in local Christmas parades, serving free
hot chocolate to families enjoying the holiday
event. Throughout the year, the bank is invested in
serving area students and local civic organizations
in the communities we serve. A case in point is our
participation in high school and college career days
and the participation of 25 of our staff members in
the Mississippi Bankers Association’s “A Banker In
Every Classroom” program.
But it doesn’t stop there. The Citizens Bank
provides eleven scholarships yearly to deserving
students across our market area. The bank has
awarded funds in excess of $100,000 to high school
juniors and seniors since the Reward A’s programs
inception to pursue their educational goals. In
many of our markets, we have introduced School
Stash debit cards in partnership with local schools,
with funds being generated for the benefit of the
participating schools.
Corporately and individually, The Citizens Bank and
its staff are actively involved in area scouting and
the Mississippi Special Olympics. You’ll find we have
our hand in Kiwanis and the Mississippi Gulf Coast
Honor Flight, not to mention Red Cross and the
State Games of Mississippi. You’ll find us at work
for the benefit of the Blair E. Batson Hospital for
Children and serving in Adult Volunteer Literacy
Programs, along with the Mississippi Sound Maritime
Historical Foundation and the Salvation Army. We
also work to support several high school Key Clubs,
Mississippi Main Street and 4-H Clubs, along with our
Chambers of Commerce, Lions Club, Sertoma and
Rotary. We even have teams hitting the pavement
for the American Cancer Society Relay for Life and
a number of employees serve as coaches for Little
League baseball, basketball, soccer and football.
Every moment we invest in service is a moment of
privilege.
CB_Inside_2013_v1.indd 10-11 3/5/14 10:54 AM

The future is not without challenge.
With 106 years of experience and a foundation
of service, solutions and strength, however, we
will face challenges and create opportunities,
following the formula for success that has served
us generation after generation. In the process
of doing so, we will continue to define what
successful and responsive community banking
is all about. Our standards of excellence will
never be negotiable.
CB_Inside_2013_v1.indd 12 3/5/14 10:54 AM

CITIZENS HOLDING COMPANY
Philadelphia, Mississippi
Consolidated Financial Statements
As of December 31, 2013 and 2012 and for the Years Ended December 31, 2013, 2012 and 2011

CONTENTS
Report of Independent Registered Public Accounting Firm 1
Management’s Assessment of Internal Control over Financial Reporting 3
Consolidated Financial Statements
Consolidated Statements of Condition 4
Consolidated Statements of Income 5
Consolidated Statements of Comprehensive (Loss) Income 6
Consolidated Statements of Changes in Stockholders’ Equity 7
Consolidated Statements of Cash Flows 8 – 9
Notes to Consolidated Financial Statements 10 – 61

1
REPORT OF INDEPENDENT REGISTERED PUBLIC ACCOUNTING FIRM
To the Board of Directors and Stockholders Citizens Holding Company Philadelphia, Mississippi
We have audited the accompanying consolidated statements of condition of Citizens Holding Company and subsidiary (the “Company”) as of December 31, 2013 and 2012, and the related consolidated statements of income, comprehensive (loss) income, changes in stockholders' equity, and cash flows for each of the three years in the period ended December 31, 2013. We have also audited the Company's internal control over financial reporting as of December 31, 2013, based on criteria established in Internal Control — Integrated Framework issued by the Committee of Sponsoring Organizations of the Treadway Commission in 1992. The Company's management is responsible for these consolidated financial statements, for maintaining effective internal control over financial reporting, and for its assessment of the effectiveness of internal control over financial reporting included in the accompanying Management’s Assessment of Internal Control Over Financial Reporting. Our responsibility is to express an opinion on these consolidated financial statements and an opinion on the Company's internal control over financial reporting based on our audits.
We conducted our audits in accordance with the standards of the Public Company Accounting Oversight Board (United States). Those standards require that we plan and perform the audits to obtain reasonable assurance about whether the financial statements are free of material misstatement and whether effective internal control over financial reporting was maintained in all material respects. Our audits of the financial statements included examining, on a test basis, evidence supporting the amounts and disclosures in the financial statements, assessing the accounting principles used and significant estimates made by management, and evaluating the overall financial statement presentation. Our audit of internal control over financial reporting included obtaining an understanding of internal control over financial reporting, assessing the risk that a material weakness exists, and testing and evaluating the design and operating effectiveness of internal control based on the assessed risk. Our audits also included performing such other procedures as we considered necessary in the circumstances. We believe that our audits provide a reasonable basis for our opinions.

2
To the Board of Directors and Stockholders Citizens Holding Company
Page Two A company's internal control over financial reporting is a process designed to provide reasonable assurance regarding the reliability of financial reporting and the preparation of financial statements for external purposes in accordance with generally accepted accounting principles. A company's internal control over financial reporting includes those policies and procedures that (a) pertain to the maintenance of records that, in reasonable detail, accurately and fairly reflect the transactions and dispositions of the assets of the company; (b) provide reasonable assurance that transactions are recorded as necessary to permit preparation of financial statements in accordance with generally accepted accounting principles, and that receipts and expenditures of the company are being made only in accordance with authorizations of management and directors of the company; and (c) provide reasonable assurance regarding prevention or timely detection of unauthorized acquisition, use, or disposition of the company's assets that could have a material effect on the financial statements.
Because of its inherent limitations, internal control over financial reporting may not prevent or detect misstatements. Also, projections of any evaluation of effectiveness to future periods are subject to the risk that controls may become inadequate because of changes in conditions, or that the degree of compliance with the policies or procedures may deteriorate.
In our opinion, the consolidated financial statements referred to above present fairly, in all material respects, the consolidated financial position of the Company as of December 31, 2013 and 2012, and the results of their operations and their cash flows for each of the years in the three-year period ended December 31, 2013, in conformity with accounting principles generally accepted in the United States of America. Also in our opinion, the Company maintained, in all material respects, effective internal control over financial reporting as of December 31, 2013, based on criteria established in Internal Control — Integrated Framework issued by the Committee of Sponsoring Organizations of the Treadway Commission.
Ridgeland, Mississippi March 7, 2014

3
Citizens Holding Company Philadelphia, MS 39350
MANAGEMENT’S ASSESSMENT OF INTERNAL CONTROL OVER FINANCIAL REPORTING
Management of Citizens Holding Company (the “Company”) is responsible for establishing and maintaining adequate internal control over financial reporting. Internal control over financial reporting is a process designed under the supervision of the Company’s principal executive and principal financial officers to provide reasonable assurance regarding the reliability of financial reporting and the preparation of the Company’s financial statements for external purposes in accordance with accounting principles generally accepted in the United States of America.
Management, under the direction of the chief executive officer and chief financial officer, assessed the Company’s internal control over financial reporting as of December 31, 2013 based on the criteria for effective internal control over financial reporting established in Internal Control — Integrated Framework issued by the Committee of Sponsoring Organizations of the Treadway Commission in 1992. Based on this assessment, management believes that, as of December 31, 2013, the Company maintained effective internal control over financial reporting.
The Company’s internal control over financial reporting includes policies and procedures that (1) pertain to the maintenance of records that in reasonable detail accurately and fairly reflect the transactions and dispositions of the assets of the Company, (2) provide reasonable assurance that transactions are recorded as necessary to permit preparation of financial statements in accordance with generally accepted accounting principles and that receipts and expenditures of the Company are being made only in accordance with authorizations of management and directors of the Company, and (3) provide reasonable assurance regarding prevention or timely detection of unauthorized acquisition, use or disposition of the Company’s assets that could have a material effect on the financial statements.
Because of its inherent limitations, internal control over financial reporting may not prevent or detect misstatements. Projections of any evaluation of effectiveness to future periods are subject to risk that controls may become inadequate because of changes in conditions, or that the degree of compliance with the policies or procedures may deteriorate.
HORNE LLP, the Company’s Independent Registered Public Accounting Firm, has audited the Company’s internal control over financial reporting as of December 31, 2013, as stated in their report, beginning on page 1, which expresses an unqualified opinion on the Company’s internal control over financial reporting as of December 31, 2013.
Greg L. McKee Robert T. Smith President and Chief Executive Officer Treasurer and Chief Financial Officer
March 7, 2014
4
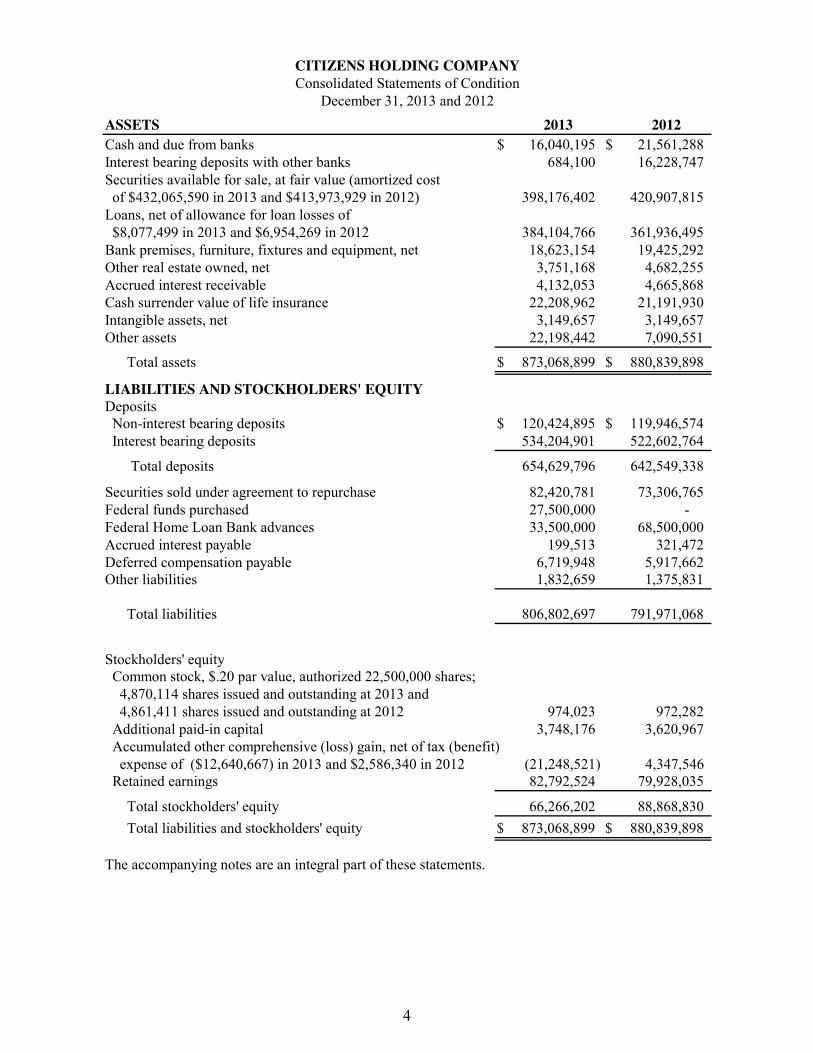
ASSETS 2013 2012Cash and due from banks $ 16,040,195 $ 21,561,288Interest bearing deposits with other banks 684,100 16,228,747Securities available for sale, at fair value (amortized cost of $432,065,590 in 2013 and $413,973,929 in 2012) 398,176,402 420,907,815Loans, net of allowance for loan losses of $8,077,499 in 2013 and $6,954,269 in 2012 384,104,766 361,936,495Bank premises, furniture, fixtures and equipment, net 18,623,154 19,425,292Other real estate owned, net 3,751,168 4,682,255Accrued interest receivable 4,132,053 4,665,868Cash surrender value of life insurance 22,208,962 21,191,930Intangible assets, net 3,149,657 3,149,657Other assets 22,198,442 7,090,551
Total assets $ 873,068,899 $ 880,839,898
LIABILITIES AND STOCKHOLDERS' EQUITYDeposits Non-interest bearing deposits $ 120,424,895 $ 119,946,574 Interest bearing deposits 534,204,901 522,602,764
Total deposits 654,629,796 642,549,338
Securities sold under agreement to repurchase 82,420,781 73,306,765Federal funds purchased 27,500,000 -Federal Home Loan Bank advances 33,500,000 68,500,000Accrued interest payable 199,513 321,472Deferred compensation payable 6,719,948 5,917,662Other liabilities 1,832,659 1,375,831
Total liabilities 806,802,697 791,971,068
Stockholders' equity Common stock, $.20 par value, authorized 22,500,000 shares; 4,870,114 shares issued and outstanding at 2013 and 4,861,411 shares issued and outstanding at 2012 974,023 972,282 Additional paid-in capital 3,748,176 3,620,967 Accumulated other comprehensive (loss) gain, net of tax (benefit) expense of ($12,640,667) in 2013 and $2,586,340 in 2012 (21,248,521) 4,347,546 Retained earnings 82,792,524 79,928,035
Total stockholders' equity 66,266,202 88,868,830 Total liabilities and stockholders' equity $ 873,068,899 $ 880,839,898
The accompanying notes are an integral part of these statements.
CITIZENS HOLDING COMPANYConsolidated Statements of Condition
December 31, 2013 and 2012

5
2013 2012 2011Interest income
Interest and fees on loans $ 20,610,580 $ 23,244,808 $ 25,338,479Interest on securities
Taxable 7,949,437 7,326,516 7,885,853Non-taxable 3,504,084 3,751,909 3,684,702
Other interest 51,994 64,580 64,635 Total interest income 32,116,095 34,387,813 36,973,669
Interest expenseDeposits 1,944,997 2,710,082 3,210,445Other borrowed funds 2,135,460 2,998,939 3,431,648
Total interest expense 4,080,457 5,709,021 6,642,093 Net interest income 28,035,638 28,678,792 30,331,576
Provision for loan losses (2,204,366) (1,545,797) (2,995,426) Net interest income after provision
for loan losses 25,831,272 27,132,995 27,336,150
Non-interest incomeService charges on deposit accounts 3,884,997 3,702,425 3,688,615Other service charges and fees 1,953,263 1,840,211 1,714,411Net gains on sales of securities 423,388 459,934 715,223Other income 1,554,454 1,399,209 1,324,130
Total non-interest income 7,816,102 7,401,779 7,442,379
Non-interest expenseSalaries and employee benefits 13,110,603 13,736,939 14,056,536Occupancy expense 2,016,965 2,007,513 1,926,803Equipment expense 2,379,167 2,480,323 2,381,842Other expense 7,220,876 7,875,192 7,878,439
Total non-interest expense 24,727,611 26,099,967 26,243,620
Income before income taxes 8,919,763 8,434,807 8,534,909
Income tax expense 1,769,903 1,650,808 1,317,062 Net income $ 7,149,860 $ 6,783,999 $ 7,217,847 Net income per share – basic $ 1.47 $ 1.40 $ 1.49 Net income per share – diluted $ 1.47 $ 1.39 $ 1.49 Average shares outstanding
Basic 4,868,263 4,857,798 4,842,353 Diluted 4,869,767 4,865,865 4,848,809
The accompanying notes are an integral part of these statements.
CITIZENS HOLDING COMPANYConsolidated Statements of Income
Years Ended December 31, 2013, 2012, and 2011

6
2013 2012 2011
Net income $ 7,149,860 $ 6,783,999 $ 7,217,847
Other comprehensive (loss) income
Unrealized holding (losses) gains on available-for-sale securities (40,399,686) 307,841 11,306,672 Income tax effect 15,069,083 (114,825) (4,217,388) Net unrealized (losses) gains (25,330,603) 193,016 7,089,284
Reclassification adjustment for gains included in net income (423,388) (459,934) (715,223) Income tax effect 157,924 171,555 266,778 Net gains included in net income (265,464) (288,379) (448,445)
Total other comprehensive (loss) income (25,596,067) (95,363) 6,640,839
Comprehensive (loss) income $ (18,446,207) $ 6,688,636 $ 13,858,686
The accompanying notes are an integral part of these statements.
CITIZENS HOLDING COMPANYConsolidated Statements of Comprehensive (Loss) Income
Years Ended December 31, 2013, 2012, and 2011

7
Acc
umul
ated
Num
ber
Add
ition
alO
ther
of S
hare
sC
omm
onPa
id-I
nC
ompr
ehen
sive
Ret
aine
dIs
sued
Stoc
kC
apita
lIn
com
e (L
oss)
Earn
ings
Tota
lB
alan
ce, D
ecem
ber 3
1, 2
010
4,83
8,41
1
$
967,
682
$
3,06
1,22
1
$(2
,197
,930
)
$
74,4
64,1
23
$
76,2
95,0
96 N
et in
com
e-
-
-
-
7,21
7,84
77,
217,
847
Div
iden
ds p
aid
($0.
88 p
er sh
are)
-
-
-
-
(4
,261
,652
)(4
,261
,652
) O
ptio
ns e
xerc
ised
5,50
0
1,10
0
62
,285
-
-
63,3
85
S
tock
com
pens
atio
n ex
pens
e-
-
123,
702
-
-
123,
702
Oth
er c
ompr
ehen
sive
inco
me,
net
-
-
-
6,64
0,83
9
-
6,64
0,83
9B
alan
ce, D
ecem
ber 3
1, 2
011
4,84
3,91
196
8,78
2
3,24
7,20
8
4,44
2,90
9
77
,420
,318
86,0
79,2
17 N
et in
com
e-
-
-
-
6,78
3,99
96,
783,
999
Div
iden
ds p
aid
($0.
88 p
er sh
are)
-
-
-
-
(4
,276
,282
)(4
,276
,282
) O
ptio
ns e
xerc
ised
17,5
00
3,
500
253,
925
-
-
257,
425
Sto
ck c
ompe
nsat
ion
expe
nse
-
-
11
9,83
4
-
-
11
9,83
4 O
ther
com
preh
ensi
ve lo
ss, n
et-
-
-
(9
5,36
3)
-
(95,
363)
Bal
ance
, Dec
embe
r 31,
201
24,
861,
411
972,
282
3,
620,
967
4,
347,
546
79,9
28,0
3588
,868
,830
Net
inco
me
-
-
-
-
7,
149,
860
7,14
9,86
0 D
ivid
ends
pai
d ($
0.88
per
shar
e)-
-
-
-
(4
,285
,371
)
(4
,285
,371
) O
ptio
ns e
xerc
ised
8,70
3
1,74
1
12
7,20
9
-
-
12
8,95
0 O
ther
com
preh
ensi
ve in
com
e, n
et-
-
-
(2
5,59
6,06
7)
-
(2
5,59
6,06
7)B
alan
ce, D
ecem
ber 3
1, 2
013
4,87
0,11
4
$
974,
023
3,74
8,17
6
(2
1,24
8,52
1)
82,7
92,5
24$
66,2
66,2
02
The
acco
mpa
nyin
g no
tes a
re a
n in
tegr
al p
art o
f the
se st
atem
ents
.
CIT
IZEN
S H
OLD
ING
CO
MPA
NY
Con
solid
ated
Sta
tem
ents
of C
hang
es in
Sto
ckho
lder
s' Eq
uity
Yea
rs E
nded
Dec
embe
r 31,
201
3, 2
012,
and
201
1
8
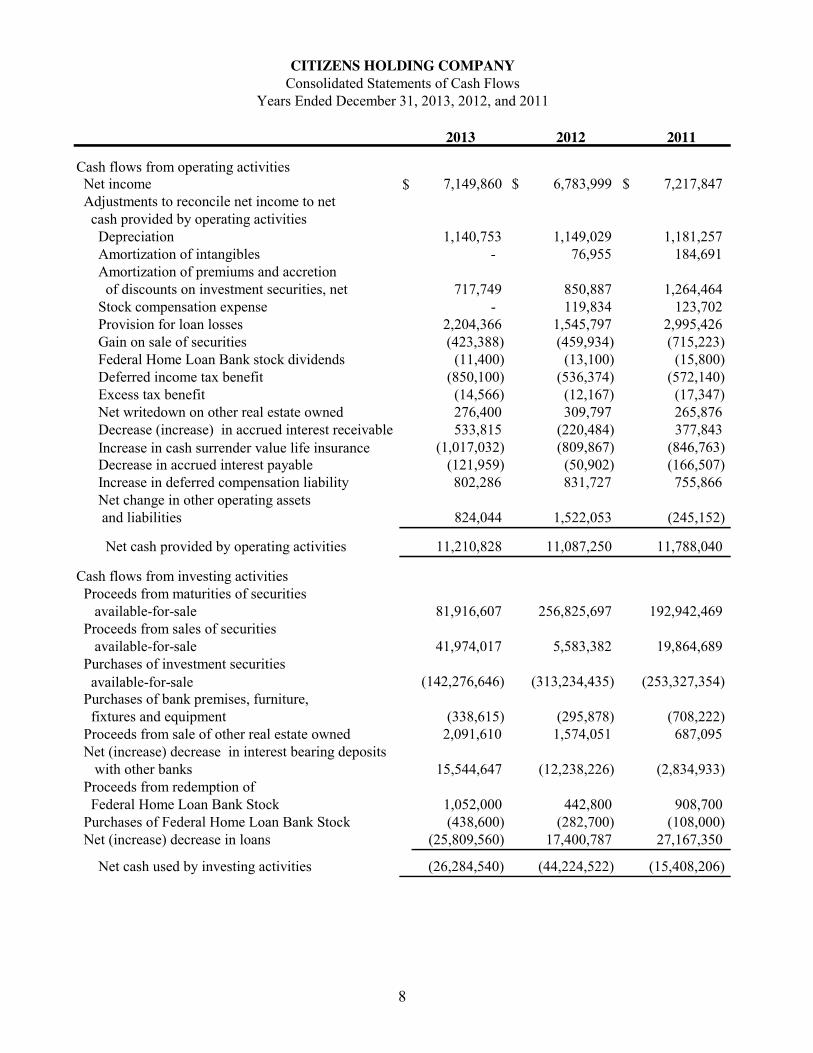
2013 2012 2011
Cash flows from operating activities Net income $ 7,149,860 $ 6,783,999 $ 7,217,847 Adjustments to reconcile net income to net cash provided by operating activities Depreciation 1,140,753 1,149,029 1,181,257 Amortization of intangibles - 76,955 184,691 Amortization of premiums and accretion of discounts on investment securities, net 717,749 850,887 1,264,464 Stock compensation expense - 119,834 123,702 Provision for loan losses 2,204,366 1,545,797 2,995,426 Gain on sale of securities (423,388) (459,934) (715,223) Federal Home Loan Bank stock dividends (11,400) (13,100) (15,800) Deferred income tax benefit (850,100) (536,374) (572,140) Excess tax benefit (14,566) (12,167) (17,347) Net writedown on other real estate owned 276,400 309,797 265,876 Decrease (increase) in accrued interest receivable 533,815 (220,484) 377,843 Increase in cash surrender value life insurance (1,017,032) (809,867) (846,763) Decrease in accrued interest payable (121,959) (50,902) (166,507) Increase in deferred compensation liability 802,286 831,727 755,866 Net change in other operating assets and liabilities 824,044 1,522,053 (245,152)
Net cash provided by operating activities 11,210,828 11,087,250 11,788,040
Cash flows from investing activities Proceeds from maturities of securities available-for-sale 81,916,607 256,825,697 192,942,469 Proceeds from sales of securities available-for-sale 41,974,017 5,583,382 19,864,689 Purchases of investment securities available-for-sale (142,276,646) (313,234,435) (253,327,354) Purchases of bank premises, furniture, fixtures and equipment (338,615) (295,878) (708,222) Proceeds from sale of other real estate owned 2,091,610 1,574,051 687,095 Net (increase) decrease in interest bearing deposits with other banks 15,544,647 (12,238,226) (2,834,933) Proceeds from redemption of Federal Home Loan Bank Stock 1,052,000 442,800 908,700 Purchases of Federal Home Loan Bank Stock (438,600) (282,700) (108,000) Net (increase) decrease in loans (25,809,560) 17,400,787 27,167,350
Net cash used by investing activities (26,284,540) (44,224,522) (15,408,206)
CITIZENS HOLDING COMPANYConsolidated Statements of Cash Flows
Years Ended December 31, 2013, 2012, and 2011

9
2013 2012 2011
Cash flows from financing activities Net increase in deposits $ 12,080,458 $ 70,211,203 $ 34,908,412 Net increase (decrease) in federal funds purchased 27,500,000 - (2,500,000) Net change in securities sold under agreement to repurchase 9,114,016 (46,913,668) 9,736,996 Proceeds from exercise of stock options 128,950 257,425 63,385 Excess tax benefit on stock option exercises 14,566 12,167 17,347 Dividends paid to stockholders (4,285,371) (4,276,282) (4,261,652) Federal Home Loan Bank advance proceeds 10,000,000 - - Federal Home Loan Bank advance payments (45,000,000) - (15,900,000)
Net cash provided by financing activities 9,552,619 19,290,845 22,064,488
Net (decrease) increase in cash and due from banks (5,521,093) (13,846,427) 18,444,322
Cash and due from banks, beginning of year 21,561,288 35,407,715 16,963,393
Cash and due from banks, end of year $ 16,040,195 $ 21,561,288 $ 35,407,715
Supplemental disclosures of cash flow information Cash paid for Interest $ 4,202,416 $ 5,760,923 $ 6,808,600
Income taxes $ 2,357,215 $ 2,442,092 $ 3,012,862
Noncash disclosures
Real estate acquired by foreclosure $ 1,436,923 $ 1,697,450 $ 2,753,415
The accompanying notes are an integral part of these financial statements.
Consolidated Statements of Cash FlowsYears Ended December 31, 2013, 2012, and 2011
2 of 2

CITIZENS HOLDING COMPANY Years Ended December 31, 2013, 2012 and 2011
NOTES TO CONSOLIDATED FINANCIAL STATEMENTS
10
Note 1. Summary of Significant Accounting Policies
Basis of Financial Statement Presentation
The accounting policies of Citizens Holding Company and its subsidiary conform to generally accepted accounting principles (“GAAP”) in the United States of America and to general practices within the banking industry. The consolidated financial statements of Citizens Holding Company include the accounts of its wholly-owned subsidiary, The Citizens Bank of Philadelphia, Mississippi (collectively, the “Company”). All significant intercompany transactions have been eliminated in consolidation.
Nature of Business
The Citizens Bank of Philadelphia, Mississippi (the “Bank”) operates under a state bank charter and provides general banking services. As a state bank, the Bank is subject to regulations of the Mississippi Department of Banking and Consumer Finance and the Federal Deposit Insurance Company. Citizens Holding Company is also subject to the regulations of the Federal Reserve. The area served by the Bank is Neshoba County, Mississippi and the immediately surrounding areas. Services are provided at several branch offices.
Estimates
The preparation of financial statements in conformity with GAAP requires management to make estimates and assumptions that affect the reported amounts of assets and liabilities and disclosure of contingent assets and liabilities at the date of the financial statements and the reported amounts of revenues and expenses during the reporting period. Actual results could differ from those estimates.
Estimates that are particularly susceptible to significant change relate to the determination of the allowance for loan losses and the valuation of real estate acquired in connection with foreclosures or in satisfaction of loans. In connection with the determination of the allowance for loan losses and valuation of foreclosed real estate, management obtains independent appraisals for significant properties.

CITIZENS HOLDING COMPANY Years Ended December 31, 2013, 2012 and 2011
NOTES TO CONSOLIDATED FINANCIAL STATEMENTS
11
Note 1. Continued
While management uses available information to recognize losses on loans and to value foreclosed real estate, future additions to the allowance or adjustments to the valuation may be necessary based on changes in local economic conditions. In addition, regulatory agencies, as an integral part of their examination process, periodically review the Company’s allowance for loan losses and valuations of foreclosed real estate. Such agencies may require the Company to recognize additions to the allowance or to make adjustments to the valuation based on their judgments about information available to them at the time of their examination. Due to these factors, it is reasonably possible that the allowance for loan losses and valuation of foreclosed real estate may change materially in the near term.
Cash, Due from Banks and Interest Bearing Deposits with Other Banks
For the purpose of reporting cash flows, cash and due from banks includes cash on hand and demand deposits. Cash flows from loans originated by the Company, deposits, and federal funds purchased and sold are reported net in the statement of cash flows. The Company is required to maintain average reserve balances with the Federal Reserve Bank based on a percentage of deposits. The average reserve required by the Federal Reserve Bank at December 31, 2013 and 2012 was $2,015,000 and $1,902,000, respectively.
Interest-bearing deposits with other banks mature within one year and are carried at cost.
Investment Securities
In accordance with the investments topic of the Accounting Standards Codification (“ASC”), securities are classified as “available-for-sale,” “held-to-maturity” or “trading”. Fair values for securities are based on quoted market prices where available. If quoted market prices are not available, fair values are based on quoted market prices of comparable instruments. Gains or losses on the sale of securities are determined using the specific identification method. Currently, the Company has no held-to-maturity or trading securities.
Securities Available-for-Sale
Securities that are held for indefinite periods of time or used as part of the Company’s asset/liability management strategy and that may be sold in response to interest rate changes, changes in prepayment risk, the need to increase regulatory capital and other similar factors are classified as available-for-sale. Securities available-for-sale are reported at fair value, with unrealized gains and losses reported, net of related income tax effect, as a separate component of stockholders’ equity.

CITIZENS HOLDING COMPANY Years Ended December 31, 2013, 2012 and 2011
NOTES TO CONSOLIDATED FINANCIAL STATEMENTS
12
Note 1. Continued
Realized gains or losses, determined on the basis of the cost of specific securities sold, are included in earnings. The amortization of premiums and accretion of discounts are recognized in interest income.
The Company periodically reviews its securities for impairment based upon a number of factors, including but not limited to, length of time and extent to which the fair value has been less than cost, the likelihood of the security’s ability to recover any decline in its fair value, financial condition of the underlying issuer, ability of the issuer to meet contractual obligations and ability to retain the security for a period of time sufficient to allow for recovery in fair value. Impairments on securities are recognized when management, based on its analysis, deems the impairment to be other-than-temporary. Disclosures about unrealized losses in our securities portfolio that have not been recognized as other-than-temporary impairments are provided in Note 3.
Loans and Allowance for Loan Losses
Loans receivable that management has the intent and ability to hold for the foreseeable future or until maturity or payoff are reported at the principal amount outstanding, net of unearned income and an allowance for loan losses. The Company has no loans held-for-sale.
Unearned income includes deferred fees net of deferred direct incremental loan origination cost. Unearned income attributable to loans held with a maturity of more than one year is recognized as income or expense over the life of the loan.
Unearned discounts on installment loans are recognized as income over the terms of the loans by a method that approximates the interest method. Unearned income and interest on commercial loans are recognized based on the principal amount outstanding. For all other loans, interest is accrued daily on the outstanding balances. For impaired loans, interest is discontinued on a loan when management believes, after considering collection efforts and other factors, that the borrower’s financial condition is such that collection of interest is doubtful. Cash collections on impaired loans are credited to the loan receivable balance, and no interest income is recognized on those loans until the principal balance has been collected. The Company generally discontinues the accrual of interest income when a loan becomes 90 days past due as to principal or interest; however, management may elect to continue the accrual when the estimated net realizable value of collateral is sufficient to cover the principal balance and the accrued interest. Interest income on other nonaccrual loans is recognized only to the extent of interest payments. Upon discontinuance of the accrual of interest on a loan, any previously accrued but unpaid interest is reversed against interest income.

CITIZENS HOLDING COMPANY Years Ended December 31, 2013, 2012 and 2011
NOTES TO CONSOLIDATED FINANCIAL STATEMENTS
13
Note 1. Continued
A loan is impaired when management determines that it is probable the Company will be unable to collect all contractual principal and interest payments due in accordance with the terms of the loan agreement. Impaired loans are measured based on the present value of expected future cash flows discounted at the loan’s effective interest rate or, as a practical expedient, at the loan’s observable market price or the fair value of the collateral if the loan is collateral dependent. The amount of impairment, if any, and any subsequent changes are included in the allowance for loan losses.
Troubled debt restructurings are those for which concessions have been granted to the borrower due to a deterioration of the borrower’s financial condition. Such concessions may include reduction in interest rates or deferral of interest or principal payments. In evaluating whether to restructure a loan, management analyzes the long-term financial condition of the borrower, including guarantor and collateral support, to determine whether the proposed concessions will increase the likelihood of repayment of principal and interest. Restructured loans are classified as performing, unless they are on nonaccrual status of 90 days or more delinquent, in which case they are considered nonperforming.
The allowance for loan losses is established through a provision for loan losses charged against net income. Loans determined to be uncollectible are charged against the allowance for loan losses, and subsequent recoveries, if any, are credited to the allowance. The allowance represents an amount, which, in management’s judgment, will be adequate to absorb estimated probable losses on existing loans that may become uncollectible. In order to determine an adequate level of allowance, management utilizes a model that calculates the allowance for loan loss by applying an average historical charge-off percentage by loan segment and over a 20 quarter period of time with the most current quarters weighted to show the effect of the most recent chargeoff activity to the current loan balances in the corresponding loan segment. Additionally, specific reserves on an individual loan basis may be applied in addition to the allowance calculated using the model. This specific reserve is determined by an extensive review of the borrower’s credit history, capacity to pay, adequacy of collateral and general economic conditions related to the respective loan. This specific reserve will stay in place until such time that the borrower’s obligation is satisfied or the loan is greatly improved.
Large groups of small-balance homogenous loans are collectively evaluated for impairment. Accordingly, the Company does not separately identify individual consumer and residential loans for impairment disclosures.
CITIZENS HOLDING COMPANY Years Ended December 31, 2013, 2012 and 2011
NOTES TO CONSOLIDATED FINANCIAL STATEMENTS
14
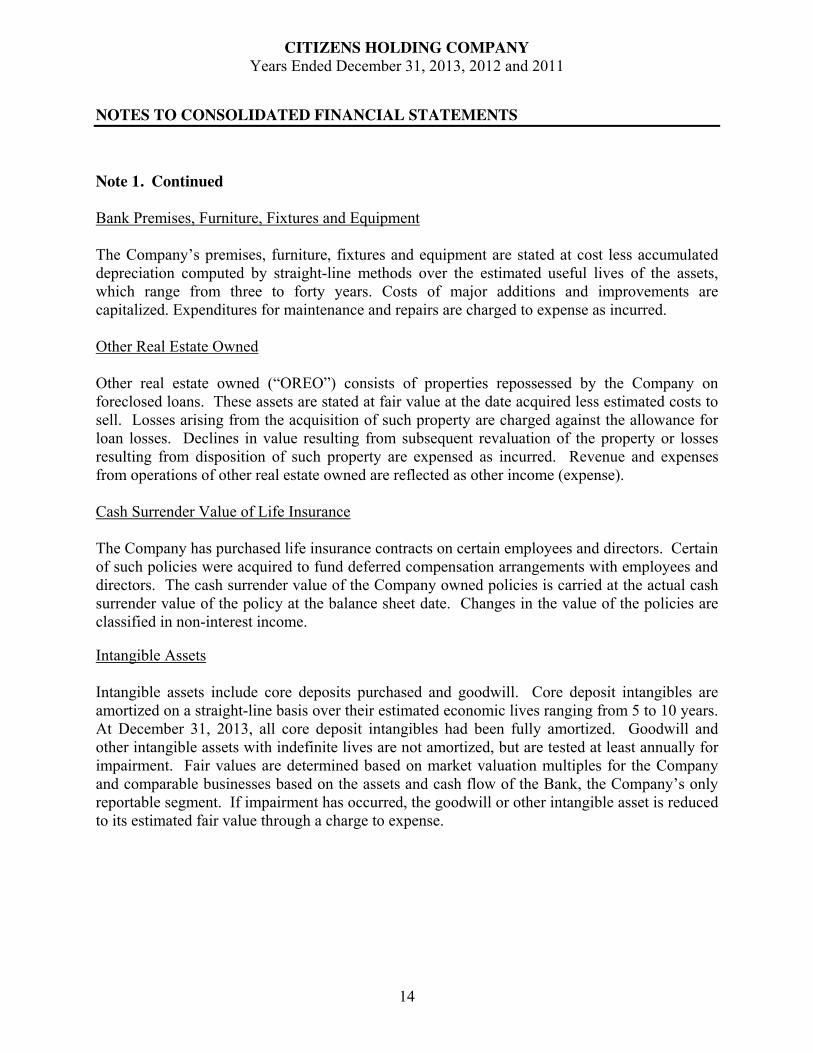
Note 1. Continued
Bank Premises, Furniture, Fixtures and Equipment
The Company’s premises, furniture, fixtures and equipment are stated at cost less accumulated depreciation computed by straight-line methods over the estimated useful lives of the assets, which range from three to forty years. Costs of major additions and improvements are capitalized. Expenditures for maintenance and repairs are charged to expense as incurred.
Other Real Estate Owned
Other real estate owned (“OREO”) consists of properties repossessed by the Company on foreclosed loans. These assets are stated at fair value at the date acquired less estimated costs to sell. Losses arising from the acquisition of such property are charged against the allowance for loan losses. Declines in value resulting from subsequent revaluation of the property or losses resulting from disposition of such property are expensed as incurred. Revenue and expenses from operations of other real estate owned are reflected as other income (expense).
Cash Surrender Value of Life Insurance
The Company has purchased life insurance contracts on certain employees and directors. Certain of such policies were acquired to fund deferred compensation arrangements with employees and directors. The cash surrender value of the Company owned policies is carried at the actual cash surrender value of the policy at the balance sheet date. Changes in the value of the policies are classified in non-interest income.
Intangible Assets
Intangible assets include core deposits purchased and goodwill. Core deposit intangibles are amortized on a straight-line basis over their estimated economic lives ranging from 5 to 10 years. At December 31, 2013, all core deposit intangibles had been fully amortized. Goodwill and other intangible assets with indefinite lives are not amortized, but are tested at least annually for impairment. Fair values are determined based on market valuation multiples for the Company and comparable businesses based on the assets and cash flow of the Bank, the Company’s only reportable segment. If impairment has occurred, the goodwill or other intangible asset is reduced to its estimated fair value through a charge to expense.
CITIZENS HOLDING COMPANY Years Ended December 31, 2013, 2012 and 2011
NOTES TO CONSOLIDATED FINANCIAL STATEMENTS
15
Note 1. Continued
Trust Assets
Assets held by the trust department of the Company in its fiduciary or agency capacities are not assets of the Company and are not included in the consolidated financial statements.
Income Taxes
Provisions for income taxes are based on taxes payable or refundable for the current year and the changes in deferred tax assets and liabilities, excluding components of other comprehensive income. Deferred tax assets and liabilities are included in the financial statements at currently enacted income tax rates applicable to the period in which the deferred tax assets and liabilities are expected to be realized or settled. As changes in tax laws or rates are enacted, deferred tax assets and liabilities are adjusted through the provision for income taxes. Deferred tax assets are reduced by a valuation allowance when, in the opinion of management, it is more likely than not that some portion or all of the deferred tax assets will not be realized.
Comprehensive (Loss) Income
Comprehensive income includes net earnings reported in the consolidated statements of income and changes in unrealized gain (loss) on securities available-for-sale reported as a component of stockholders’ equity. Unrealized gain (loss) on securities available-for-sale, net of related income taxes, is the only component of accumulated other comprehensive income for the Company.

CITIZENS HOLDING COMPANY Years Ended December 31, 2013, 2012 and 2011
NOTES TO CONSOLIDATED FINANCIAL STATEMENTS
16
Note 1. Continued
Net Income Per Share
Net income per share-basic is computed by dividing net income by the weighted average number of common shares outstanding during the year. Net income per share-diluted is based on the weighted average number of shares of common stock outstanding for the periods, including the dilutive effect of the Company’s outstanding stock options. The effect of the dilutive shares for the years 2013, 2012 and 2011 is illustrated in the following table.
2013 2012 2011
Basic weighted average shares outstanding 4,868,263 4,857,798 4,842,353Dilutive effect of stock options 1,504 8,067 6,456
Dilutive weighted average shares outstanding 4,869,767 4,865,865 4,848,809 Net income $ 7,149,860 $ 6,783,999 $ 7,217,847
Net income per share-basic $ 1.47 $ 1.40 $ 1.49 Net income per share-diluted $ 1.47 $ 1.39 $ 1.49

CITIZENS HOLDING COMPANY Years Ended December 31, 2013, 2012 and 2011
NOTES TO CONSOLIDATED FINANCIAL STATEMENTS
17
Note 1. Continued
Advertising Costs
Advertising costs are charged to expense when incurred. Advertising expense was $621,216, $636,652 and $730,496 for the years ended December 31, 2013, 2012 and 2011, respectively.
Securities Sold Under Agreements to Repurchase
Securities sold under agreements to repurchase are accounted for as collateralized financing transactions and are recorded at the amounts at which the securities were sold. Securities, generally U. S. Government, federal agency and state county municipal securities, pledged as collateral under these financing arrangements cannot be sold or re-pledged by the secured party.
Reclassifications
Certain information for 2011 and 2012 has been reclassified to conform to the financial presentation for 2013. Such reclassifications had no effect on net income or stockholders’ equity.
Stock-Based Compensation
At December 31, 2013, the Company had outstanding grants under two stock-based compensation plans, which are the 1999 Employees’ Long-Term Incentive Plan, which expired in 2009, and the 1999 Directors’ Stock Compensation Plan. Compensation expense for the option grants is determined based on the estimated fair value of the stock options on the applicable grant date. Further, compensation expense is based on an estimate of the number of grants expected to vest and is recognized over the grants’ implied vesting period of 6 months and 1 day. The Company did not estimate any forfeitures for 2013, 2012 or 2011, due to the low historical forfeiture rate. Expense associated with the Company’s stock based compensation is included in salaries and benefits on the Consolidated Statements of Income. The Company recognizes compensation expense for all share-based payments to employees in accordance with ASC 718, “Compensation – Stock Compensation.” See Note 18 for further details regarding the Company’s stock-based compensation.
Subsequent Events
The Company has evaluated, for consideration of recognition or disclosure, subsequent events that have occurred through the date of issuance of its financial statements, and has determined that no significant events occurred after December 31, 2011 but prior to the issuance of these
financial statements that would have a material impact on its Consolidated Financial Statements.

CITIZENS HOLDING COMPANY Years Ended December 31, 2013, 2012 and 2011
NOTES TO CONSOLIDATED FINANCIAL STATEMENTS
18
Note 2. Intangible Assets
In 2002, the Company acquired CB&T Capital Corporation, a one-bank holding company, whose wholly-owned subsidiary was Citizens Bank & Trust Company in Louisville, Mississippi. In addition to the intangible assets related to the purchase of CB&T Capital Corporation, the Company recorded intangible assets from the purchase of branches located in Kosciusko and Scooba, Mississippi and from the purchase of Three D Mortgage Company. The following table details the goodwill associated with each purchase, which is no longer being amortized, in accordance with ASC Topic 350, Intangibles- Goodwill and Other.
Purchase Total
Kosciusko Branch $ 295,837 Scooba Branch 220,000 Three D Mortgage Company 66,220 CB&T Capital Corporation 2,567,600
Total goodwill $ 3,149,657
The Company has also allocated intangible assets to be recognized as core deposit intangibles from the CB&T Capital Corporation acquisition. The core deposit intangible balance is detailed as follows:
Life to Date Unamortized Purchase Total Amortization Balance
CB&T Capital Corporation $ 1,846,909 $ 1,846,909 $ -
Total core deposit intangible $ 1,846,909 $ 1,846,909 $ -
Total amortization expense related to all intangible assets for the years ended December 31, 2013, 2012 and 2011 was $-0-, $76,955 and $184,691, respectively.

CITIZENS HOLDING COMPANY Years Ended December 31, 2013, 2012 and 2011
NOTES TO CONSOLIDATED FINANCIAL STATEMENTS
19
Note 3. Investment Securities The amortized cost and fair value of investment securities at December 31, 2013 and 2012 are as follows:
Gross Gross Amortized Unrealized Unrealized
2013 Cost Gains Losses Fair Value
Securities available-for-sale Obligations of U.S. Government agencies $ 316,305,125 $ 98,740 $ 33,587,465 $ 282,816,400 Mortgage-backed securities 16,476,430 719,825 29,861 17,166,394 State, County, Municipals 96,258,584 2,309,291 3,140,470 95,427,405 Other investments 3,025,451 - 259,248 2,766,203
Total $ 432,065,590 $ 3,127,856 $ 37,017,044 $ 398,176,402
Gross Gross Amortized Unrealized Unrealized
2012 Cost Gains Losses Fair Value
Securities available-for-sale Obligations of U.S. Government agencies $ 269,196,449 $ 546,153 $ 628,701 $ 269,110,901 Mortgage-backed securities 36,386,126 2,054,119 18,944 38,421,301 State, County, Municipals 105,300,892 5,640,711 372,243 110,569,360 Other investments 3,093,462 - 287,209 2,806,253
Total $ 413,973,929 $ 8,240,983 $ 1,307,097 $ 420,907,815

CITIZENS HOLDING COMPANY Years Ended December 31, 2013, 2012 and 2011
NOTES TO CONSOLIDATED FINANCIAL STATEMENTS
20
Note 3. Continued
The following table shows the gross unrealized losses and fair value of the Company’s investments with unrealized losses that are not deemed to be other-than-temporarily impaired, aggregated by investment category and length of time that individual securities have been in a continuous unrealized loss position, at December 31, 2013 and 2012 (in thousands):
December 31, 2013 Less than 12 months 12 months or more Total
Description of Securities Fair
ValueUnrealized
LossesFair
ValueUnrealized
LossesFair
ValueUnrealized
Losses
Obligations of U. S. Government agencies $255,350 $29,954 $26,367 $ 3,633 $281,717 $ 33,587 Mortgage backed securities 3,581 30 - - 3,581 30State, County, Municipal 20,131 1,461 10,014 1,680 30,145 3,141Other investments - - 2,766 259 2,766 259
Total $279,062 $ 31,445 $39,147 $ 5,572 $318,209 $ 37,017
December 31, 2012 Less than 12 months 12 months or more Total
Description of Securities Fair
ValueUnrealized
LossesFair
ValueUnrealized
LossesFair
ValueUnrealized
Losses Obligations of U. S. Government agencies $ 98,074 $ 629 $ - $ - $ 98,074 $ 629 Mortgage backed securities 7,359 19 - - 7,359 19State, County, Municipal 14,466 371 260 1 14,726 372Other investments - - 2,806 287 2,806 287
Total $119,899 $ 1,019 $ 3,066 $ 288 $ 122,965 $1,307

CITIZENS HOLDING COMPANY Years Ended December 31, 2013, 2012 and 2011
NOTES TO CONSOLIDATED FINANCIAL STATEMENTS
21
Note 3. Continued
Investment Securities.
The Company’s unrealized losses on its Obligations of U. S. Government agencies, Mortgage backed securities and State, County and Municipal bonds are the result of upward trend in interest rates, mainly in the mid-term sector. None of the unrealized losses disclosed in the previous table are related to credit deterioration. The Company has determined that none of the securities in this classification are other-than-temporarily impaired at December 31, 2013 or 2012.
Other investments. The Company’s unrealized loss on other investments relates to an investment in a pooled trust preferred security. The decline in value of the pooled trust preferred security is related to the deterioration of the markets for these types of securities brought about by the lowered credit ratings and past deferrals and defaults of the underlying issuing financial institutions. However, due to the reductions in defaults and deferrals during the year, the unrealized losses have improved from $287,209 in 2012 to $259,248 in 2013. The Company owns a senior tranche of this security and therefore has a higher degree of which future deferrals and defaults would be required before the cash flow for the Company’s tranche is negatively impacted. The Company does not intend to sell this security and it is not more likely than not that the Company will be required to sell at a price less than amortized cost prior to maturity. Given these factors, the Company does not consider the investment to be other-than-temporarily impaired at December 31, 2013 or 2012. This security is not subject to any of the restrictions put forth under the Volcker Rule that was brought about by the passage of the Dodd-Frank Act.
The amortized cost and estimated fair value of securities at December 31, 2013, by contractual maturity, are shown below. Expected maturities will differ from contractual maturities because borrowers may have the right to call or prepay obligations with or without call or prepayment penalties.
Amortized Cost Fair Value
Securities available-for-sale Due in one year or less $ 2,429,035 2,448,452 Due after one year through five years 25,040,034 26,060,534 Due after five years through ten years 106,046,230 101,286,491 Due after ten years 298,550,291 268,380,925
Total $ 432,065,590 398,176,402
Investment securities with carrying values of $133,977,764 and $107,788,715 at December 31, 2013 and 2012, respectively, were pledged as collateral for public deposits.

CITIZENS HOLDING COMPANY Years Ended December 31, 2013, 2012 and 2011
NOTES TO CONSOLIDATED FINANCIAL STATEMENTS
22
Note 3. Continued
Gross realized gains and losses are included in net gains on sales of securities. Total gross realized gains and gross realized losses from the sale of investment securities for each of the years ended December 31 were:
2013 2012 2011 Gross realized gains $ 1,039,793 $ 459,934 $ 715,223 Gross realized losses 616,405 - -
$ 423,388 $ 459,934 $ 715,223
Note 4. Federal Home Loan Bank Stock
The Company, as a member of the Federal Home Loan Bank of Dallas (“FHLB”) system, owns stock in the organization. No ready market exists for the stock, and it has no quoted market value. The Company’s investment in the FHLB is carried at cost of $2,633,300 and $3,235,300 at December 31, 2013 and 2012, respectively, and is included in other assets. The Company has purchased stock and had stock redeemed in 2013 and 2012 at the par value of $100 per share.
While the Federal Home Loan Banks have been negatively impacted by the current economic conditions, the Federal Home Loan Bank of Dallas reported profits for 2013 and 2012, as of 2012 and 2013, was in compliance with its regulatory capital and liquidity requirements, and in 2012 and 2013, continued to pay dividends on its stock and make redemptions at the par value. With consideration given to these factors, management concluded that the stock was not impaired at December 31, 2013 or 2012.
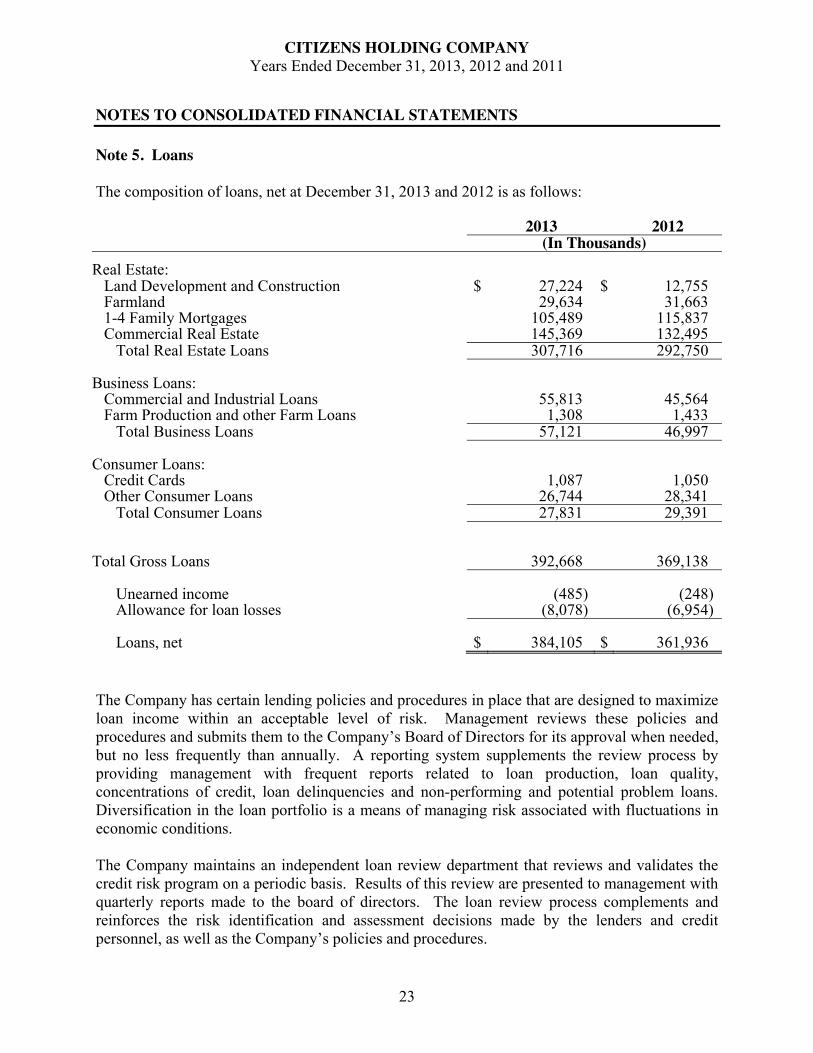
CITIZENS HOLDING COMPANY Years Ended December 31, 2013, 2012 and 2011
NOTES TO CONSOLIDATED FINANCIAL STATEMENTS
23
Note 5. Loans
The composition of loans, net at December 31, 2013 and 2012 is as follows:
2013 2012(In Thousands)
Real Estate: Land Development and Construction $ 27,224 $ 12,755 Farmland 29,634 31,663 1-4 Family Mortgages 105,489 115,837 Commercial Real Estate 145,369 132,495 Total Real Estate Loans 307,716 292,750
Business Loans: Commercial and Industrial Loans 55,813 45,564 Farm Production and other Farm Loans 1,308 1,433 Total Business Loans 57,121 46,997
Consumer Loans: Credit Cards 1,087 1,050 Other Consumer Loans 26,744 28,341 Total Consumer Loans 27,831 29,391
Total Gross Loans 392,668 369,138
Unearned income (485) (248) Allowance for loan losses (8,078) (6,954)
Loans, net $ 384,105 $ 361,936
The Company has certain lending policies and procedures in place that are designed to maximize loan income within an acceptable level of risk. Management reviews these policies and procedures and submits them to the Company’s Board of Directors for its approval when needed, but no less frequently than annually. A reporting system supplements the review process by providing management with frequent reports related to loan production, loan quality, concentrations of credit, loan delinquencies and non-performing and potential problem loans. Diversification in the loan portfolio is a means of managing risk associated with fluctuations in economic conditions.
The Company maintains an independent loan review department that reviews and validates the credit risk program on a periodic basis. Results of this review are presented to management with quarterly reports made to the board of directors. The loan review process complements and reinforces the risk identification and assessment decisions made by the lenders and credit personnel, as well as the Company’s policies and procedures.

CITIZENS HOLDING COMPANY Years Ended December 31, 2013, 2012 and 2011
NOTES TO CONSOLIDATED FINANCIAL STATEMENTS
24
Note 5. Continued
Loans are made principally to customers in the Company’s market. The Company’s lending policy provides that loans collateralized by real estate are normally made with loan-to-value ratios of 80 percent or less. Commercial loans are typically collateralized by property, equipment, inventories or receivables with loan-to-value ratios from 50 percent to 80 percent. Real estate mortgage loans are collateralized by personal residences with loan-to-value ratios of 80 percent or less. Consumer loans are typically collateralized by real estate, vehicles and other consumer durable goods. Approximately $54.8 million and $51.1 million of the loans outstanding at December 31, 2013 and 2012, respectively, were variable rate loans.
In the ordinary course of business, the Company has granted loans to certain directors and their affiliates (collectively referred to as “related parties”). These loans were made on substantially the same terms, including interest rates and collateral, as those prevailing at the time for comparable transactions with other unaffiliated persons and do not involve more than normal risk of collectability. Activity in related party loans during 2013 is presented in the following table.
Balance outstanding at December 31, 2012 $ 1,853,223
Principal additions 525,049
Principal reductions 1,051,945
Balance outstanding at December 31, 2013 $ 1,326,327
Loans are considered to be past due if the required principal and interest payments have not been received as of the date such payments were due. Loans are placed on non-accrual status, when, in management’s opinion, the borrower may be unable to meet payment obligations as they become due, as well as when required by regulatory provisions. Loans may be placed on non-accrual status regardless of whether such loans are considered past due. When interest accruals are discontinued, all unpaid accrued interest is reversed. Interest income is subsequently recognized only to the extent cash payments are received in excess of principal due. Loans are returned to accrual status when all the principal and interest amounts contractually due are brought current and future payments are reasonably assured.
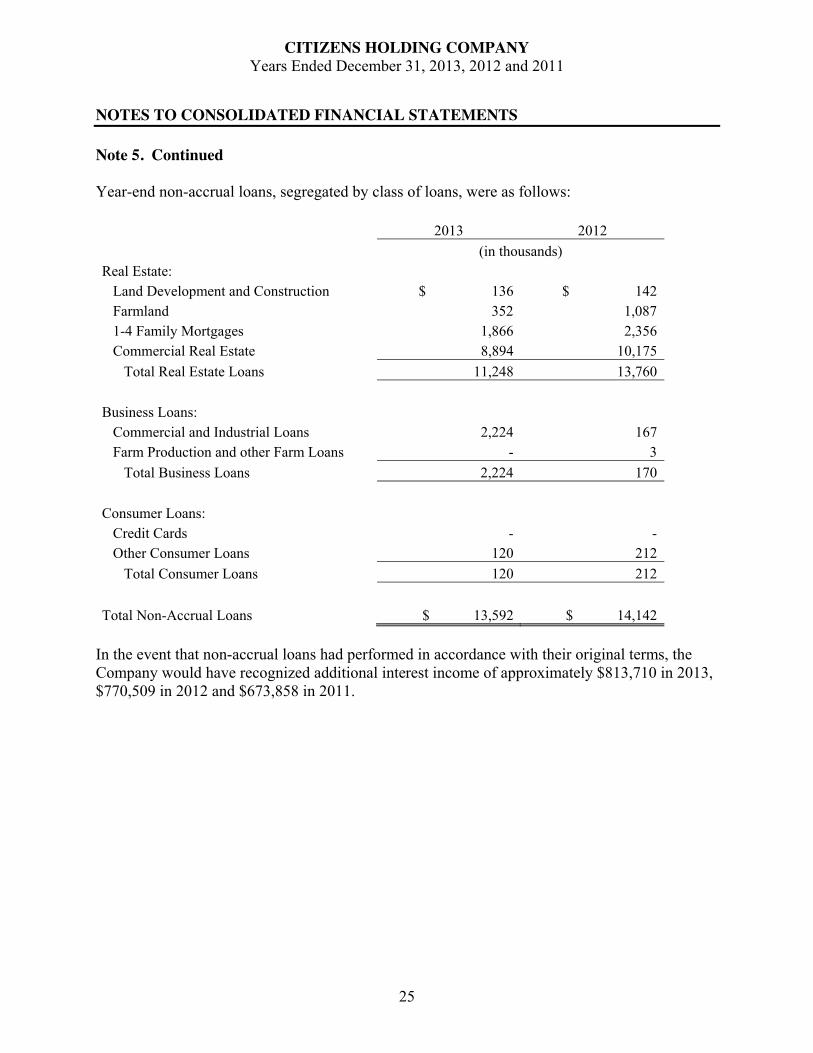
CITIZENS HOLDING COMPANY Years Ended December 31, 2013, 2012 and 2011
NOTES TO CONSOLIDATED FINANCIAL STATEMENTS
25
Note 5. Continued
Year-end non-accrual loans, segregated by class of loans, were as follows:
2013 2012 (in thousands)
Real Estate: Land Development and Construction $ 136 $ 142 Farmland 352 1,087 1-4 Family Mortgages 1,866 2,356 Commercial Real Estate 8,894 10,175 Total Real Estate Loans 11,248 13,760
Business Loans: Commercial and Industrial Loans 2,224 167 Farm Production and other Farm Loans - 3 Total Business Loans 2,224 170
Consumer Loans: Credit Cards - - Other Consumer Loans 120 212 Total Consumer Loans 120 212
Total Non-Accrual Loans $ 13,592 $ 14,142
In the event that non-accrual loans had performed in accordance with their original terms, the Company would have recognized additional interest income of approximately $813,710 in 2013, $770,509 in 2012 and $673,858 in 2011.

CITIZENS HOLDING COMPANY Years Ended December 31, 2013, 2012 and 2011
NOTES TO CONSOLIDATED FINANCIAL STATEMENTS
26
Note 5. Continued
An age analysis of past due loans, segregated by class of loans, as of December 31, 2013 was as follows (in thousands):
AccruingLoans Loans
Loans 90 or more 90 or more 30-89 Days Days Total Past Current Total Days
Past Due Past Due Due Loans Loans Loans Past Due Real Estate: Land Development and Construction $ 170 $ - $ 170 $ 27,054 $ 27,224 $ - Farmland 419 69 488 29,146 29,634 - 1-4 Family Mortgages 4,234 1,088 5,322 100,167 105,489 335 Commercial Real Estate 3,308 9,316 12,624 132,745 145,369 1,750 Total Real Estate Loans 8,131 10,473 18,604 289,112 307,716 2,085
Business Loans: Commercial and Industrial Loans 248 23 271 55,542 55,813 - Farm Production and other Farm Loans 5 - 5 1,303 1,308 - Total Business Loans 253 23 276 56,845 57,121 -
Consumer Loans: Credit Cards 39 10 49 1,038 1,087 10 Other Consumer Loans 1,105 41 1,146 25,598 26,744 - Total Consumer Loans 1,144 51 1,195 26,636 27,831 10
Total Loans $ 9,528 $ 10,547 $ 20,075 $372,593 $392,668 $ 2,095

CITIZENS HOLDING COMPANY Years Ended December 31, 2013, 2012 and 2011
NOTES TO CONSOLIDATED FINANCIAL STATEMENTS
27
Note 5. Continued
An age analysis of past due loans, segregated by class of loans, as of December 31, 2012 was as follows (in thousands):
AccruingLoans Loans
Loans 90 or more 90 or more 30-89 Days Days Total Past Current Total Days
Past Due Past Due Due Loans Loans Loans Past Due Real Estate: Land Development and Construction $ 2,588 $ - $ 2,588 $ 10,167 $ 12,755 $ - Farmland 786 589 1,375 30,288 31,663 - 1-4 Family Mortgages 8,139 623 8,762 107,075 115,837 32 Commercial Real Estate 3,033 5,013 8,046 124,449 132,495 544 Total Real Estate Loans 14,546 6,225 20,771 271,979 292,750 576
Business Loans: Commercial and Industrial Loans 3,070 9 3,079 42,485 45,564 - Farm Production and other Farm Loans 2 - 2 1,431 1,433 - Total Business Loans 3,072 9 3,081 43,916 46,997 -
Consumer Loans: Credit Cards 40 30 70 980 1,050 30 Other Consumer Loans 1,711 57 1,768 26,573 28,341 3 Total Consumer Loans 1,751 87 1,838 27,553 29,391 33
Total Loans $ 19,369 $ 6,321 $ 25,690 $343,448 $369,138 $ 609

CITIZENS HOLDING COMPANY Years Ended December 31, 2013, 2012 and 2011
NOTES TO CONSOLIDATED FINANCIAL STATEMENTS
28
Note 5. Continued
Loans are considered impaired when, based on current information and events, it is probable the Company will be unable to collect all the amounts due in accordance with the original contractual terms of the loan agreement, including scheduled principal and interest payments. In determining which loans to evaluate for impairment, management looks at past due loans, bankruptcy filings and any situation that might lend itself to cause a borrower to be unable to repay the loan according to the original contract terms. If a loan is determined to be impaired and the collateral is deemed to be insufficient to fully repay the loan, a specific reserve will be established. Interest payments on impaired loans are typically applied to principal unless collectability of the principal amount is reasonably assured, in which case interest is recognized on a cash basis. Impaired loans or portions thereof, are charged-off when deemed uncollectible.
Impaired loans as of December 31, by class of loans, are as follows (in thousands):
Recorded Recorded Unpaid Investment Investment Total Average
2013 Principal With No With Recorded Related Recorded Balance Allowance Allowance Investment Allowance Investment
Real Estate: Land Development and Construction $ 136 $ 25 $ 111 $ 136 $ 103 $ 278 Farmland 352 220 132 352 24 720 1-4 Family Mortgages 1,866 1,054 812 1,866 202 2,111 Commercial Real Estate 8,894 976 7,918 8,894 896 9,535 Total Real Estate Loans 11,248 2,275 8,973 11,248 1,225 12,644
Business Loans: Commercial and Industrial Loans 2,224 118 2,106 2,224 1,072 1,195 Farm Production and other Farm Loans - - - - - 2 Total Business Loans 2,224 118 2,106 2,224 1,072 1,197
Consumer Loans: Other Consumer Loans 120 120 - 120 - 166 Total Consumer Loans 120 120 - 120 - 166
Total Loans $ 13,592 $ 2,513 $ 11,079 $ 13,592 $ 2,297 $ 14,007

CITIZENS HOLDING COMPANY Years Ended December 31, 2013, 2012 and 2011
NOTES TO CONSOLIDATED FINANCIAL STATEMENTS
29
Note 5. Continued
Recorded Recorded Unpaid Investment Investment Total Average
2012 Principal With No With Recorded Related Recorded Balance Allowance Allowance Investment Allowance Investment
Real Estate: Land Development and Construction $ 142 $ 18 $ 124 $ 142 $ 117 $ 638 Farmland 1,087 947 140 1,087 24 864 1-4 Family Mortgages 2,356 1,740 616 2,356 186 2,211 Commercial Real Estate 10,175 5,954 4,221 10,175 711 8,496 Total Real Estate Loans 13,760 8,659 5,101 13,760 1,038 12,209
Business Loans: Commercial and Industrial Loans 167 76 91 167 55 226 Farm Production and other Farm Loans 3 3 - 3 - 12 Total Business Loans 170 79 91 170 55 238
Consumer Loans: Other Consumer Loans 212 212 - 212 - 323 Total Consumer Loans 212 212 - 212 - 323
Total Loans $ 14,142 $ 8,950 $ 5,192 $ 14,142 $ 1,093 $ 12,770

CITIZENS HOLDING COMPANY Years Ended December 31, 2013, 2012 and 2011
NOTES TO CONSOLIDATED FINANCIAL STATEMENTS
30
Note 5. Continued
The following table presents troubled debt restructurings segregated by class (in thousands, except number of loans):
Pre-Modification Post-Modification December 31, 2013 Outstanding Outstanding
Number of Recorded Recorded Loans Investment Investment
Commercial real estate 5 $ 9,261 $ 7,119
Total 5 $ 9,261 $ 7,119
Pre-Modification Post-Modification December 31, 2012 Outstanding Outstanding
Number of Recorded Recorded Loans Investment Investment
Commercial real estate 4 $ 6,850 $ 5,602
Total 4 $ 6,850 $ 5,602
Changes in the Company’s troubled debt restructurings are set forth in the table below:
Number Recorded of Loans Investment
Totals at January 1, 2013 4 $ 5,602 Additional loans with concessions 1 2,411 Reductions due to: Writedown (333) Principal paydowns (561)
Total at December 31, 2013 5 $ 7,119
The allocated allowance for loan losses attributable to restructured loans was $1,196,274 and $42,850 at December 31, 2013 and 2012, respectively.
The Company had no remaining availability under commitments to lend additional funds on these troubled debt restructurings at December 31, 2013.

CITIZENS HOLDING COMPANY Years Ended December 31, 2013, 2012 and 2011
NOTES TO CONSOLIDATED FINANCIAL STATEMENTS
31
Note 5. Continued
The Corporation utilizes a risk grading matrix to assign a risk grade to each of its loans when originated and is updated as factors related to the strength of the loan changes. Loans are graded on a scale of 1 to 9. A description of the general characteristics of the 9 risk grades is as follows.
Grade 1. MINIMAL RISK - These loans are without loss exposure to the Corporation. This classification is reserved for only the best, well secured loans to borrowers with significant capital strength, low leverage, stable earnings and growth and other readily available financing alternatives. This type of loan would also include loans secured by a program of the government.
Grade 2. MODEST RISK - These loans include borrowers with solid credit quality and moderate risk of loss. These loans may be fully secured by certificates of deposit with another reputable financial institution, or secured by readily marketable securities with acceptable margins.
Grade 3. AVERAGE RISK - This is the rating assigned to most of the loans held by the Corporation. This includes loans with average loss exposure and average overall quality. These loans should liquidate through possessing adequate collateral and adequate earnings of the borrower. In addition, these loans are properly documented and are in accordance with all aspects of the current loan policy.
Grade 4. ACCEPTABLE RISK - Borrower generates sufficient cash flow to fund debt service but most working asset and capital expansion needs are provided from external sources. Profitability and key balance sheet ratios are usually close to peers but one or more may be higher than peers.
Grade 5. MANAGEMENT ATTENTION - Borrower has significant weaknesses resulting from performance trends or management concerns. The financial condition of the borrower has taken a negative turn and may be temporarily strained. Cash flow is weak but cash reserves remain adequate to meet debt service. Management weakness is evident.
Grade 6. OTHER LOANS ESPECIALLY MENTIONED (OLEM) - Loans in this category are fundamentally sound but possess some weaknesses. OLEM loans have potential weaknesses, which may, if not checked or corrected, weaken the asset or inadequately protect the Bank's credit position at some future date. These loans have an identifiable weakness in credit, collateral, or repayment ability but there is no expectation of loss.
Grade 7. SUBSTANDARD ASSETS - Assets classified as substandard are inadequately protected by the current net worth and paying capacity of the obligor or of the collateral pledged, if any. Assets classified as substandard must have a well-defined weakness based upon objective evidence. Assets classified as substandard are characterized by the distinct possibility that the
CITIZENS HOLDING COMPANY Years Ended December 31, 2013, 2012 and 2011
NOTES TO CONSOLIDATED FINANCIAL STATEMENTS
32
Note 5. Continued
insured institution will sustain some loss if the deficiencies are not corrected. The possibility that liquidation would not be timely requires a substandard classification even if there is little likelihood of total loss.
Grade 8. DOUBTFUL - A loan classified as doubtful has all the weaknesses of a substandard classification and the added characteristic that the weakness makes collection or liquidation in full, on the basis of currently existing facts, conditions, and values, highly questionable or improbable. The possibility of loss is extremely high, but because of certain important and reasonable specific pending factors that may work to the advantage and strengthening of the asset, its classification as an estimated loss is deferred until its more exact status may be determined. A doubtful classification could reflect the fact that the primary source of repayment is gone and serious doubt exists as to the quality of a secondary source of repayment.
Grade 9. LOSS - Loans classified loss are considered uncollectible and of such little value that their continuance as bankable assets is not warranted. This classification does not mean that the asset has absolutely no recovery or salvage value, but rather it is not practical or desirable to defer writing off this basically worthless asset even though partial recovery may occur in the future. Also included in this classification is the defined loss portion of loans rated substandard assets and doubtful assets.
These internally assigned grades are updated on a continual basis throughout the course of the year and represent management’s most updated judgment regarding grades at December 31, 2013.

CITIZENS HOLDING COMPANY Years Ended December 31, 2013, 2012 and 2011
NOTES TO CONSOLIDATED FINANCIAL STATEMENTS
33
Note 5. Continued
The following table details the amount of gross loans by loan grade and class for the year ended December 31, 2013 (in thousands):
SpecialSatisfactory Mention Substandard Doubtful Loss Total
Grades 1, 2, 3,4 5,6 7 8 9 Loans Real Estate: Land Development and Construction $ 25,165 $ 192 $ 1,867 $ - $ - $ 27,224 Farmland 25,160 744 3,730 - - 29,634 1-4 Family Mortgages 87,108 4,671 13,710 - - 105,489 Commercial Real Estate 125,339 5,915 14,115 - - 145,369 Total Real Estate Loans 262,772 11,522 33,422 - - 307,716
Business Loans: Commercial and Industrial Loans 52,871 426 416 2,100 - 55,813 Farm Production and other Farm Loans 1,298 8 2 - - 1,308 Total Business Loans 54,169 434 418 2,100 - 57,121
Consumer Loans: Credit Cards 1,077 - 10 - - 1,087 Other Consumer Loans 25,942 193 564 42 3 26,744 Total Consumer Loans 27,019 193 574 42 3 27,831
Total Loans $ 343,960 $ 12,149 $ 34,414 $ 2,142 $ 3 $ 392,668

CITIZENS HOLDING COMPANY Years Ended December 31, 2013, 2012 and 2011
NOTES TO CONSOLIDATED FINANCIAL STATEMENTS
34
Note 5. Continued
The following table details the amount of gross loans by loan grade and class for the year ended December 31, 2012:
SpecialSatisfactory Mention Substandard Doubtful Loss Total
Grades 1, 2, 3,4 5,6 7 8 9 Loans Real Estate: Land Development and Construction $ 10,596 $ 1,890 $ 269 $ - $ - $ 12,755 Farmland 27,069 2,701 1,893 - - 31,663 1-4 Family Mortgages 97,630 6,177 12,030 - - 115,837 Commercial Real Estate 108,914 6,728 16,853 - - 132,495 Total Real Estate Loans 244,209 17,496 31,045 - - 292,750
Business Loans: Commercial and Industrial Loans 41,449 3,486 601 28 - 45,564 Farm Production and other Farm Loans 1,358 26 49 - - 1,433 Total Business Loans 42,807 3,512 650 28 - 46,997
Consumer Loans: Credit Cards 1,020 - 30 - - 1,050 Other Consumer Loans 26,995 287 1,029 28 2 28,341 Total Consumer Loans 28,015 287 1,059 28 2 29,391
Total Loans $ 315,031 $ 21,295 $ 32,754 $ 56 $ 2 $ 369,138
The allowance for loan losses is a reserve established through a provision for possible loan losses charged to expense, which represents management’s best estimate of probable losses that will occur within the existing portfolio of loans. The allowance, in the judgment of management, is necessary to reserve for estimated loan losses and risks inherent in the loan portfolio.
The allowance on the majority of the loan portfolio is calculated using a historical chargeoff percentage applied to the current loan balances by loan segment. This historical period is the average of the previous 5 years with the most current years weighted to show the effect of the most recent chargeoff activity. This percentage is also adjusted for economic factors such as unemployment and general business conditions, both local and nationwide.
The group of loans that are considered to be impaired are individually evaluated for possible loss and a specific reserve is established to cover any loss contingency. Loans that are determined to be a loss with no benefit of remaining in the portfolio are charged off to the allowance. These specific reserves are reviewed periodically for continued impairment and adequacy of the specific reserve and adjusted when necessary.

CITIZENS HOLDING COMPANY Years Ended December 31, 2013, 2012 and 2011
NOTES TO CONSOLIDATED FINANCIAL STATEMENTS
35
Note 5. Continued
Net chargeoffs, segregated by class of loans, were as follows:
2013 2012 2011 Real Estate: Land Development and Construction $ 15,787 $ (87,917) $ (60,964) Farmland (14,915) 2,386 (423,078) 1-4 Family Mortgages (152,756) (220,591) (911,026) Commercial Real Estate (514,099) (854,847) (79,236) Total Real Estate Loans (665,983) (1,160,969) (1,474,304)
Business Loans: Commercial and Industrial Loans (350,740) 936 (994,522) Farm Production and other Farm Loans 1,700 (3,436) (4,671) Total Business Loans (349,040) (2,500) (999,193)
Consumer Loans: Credit Cards (17,726) (9,441) (43,763) Other Consumer Loans (48,387) (100,030) (175,824) Total Consumer Loans (66,113) (109,471) (219,587)
Total Net Chargeoffs $ (1,081,136) $ (1,272,940) $ (2,693,084)

CITIZENS HOLDING COMPANY Years Ended December 31, 2013, 2012 and 2011
NOTES TO CONSOLIDATED FINANCIAL STATEMENTS
36
Note 5. Continued
The following table details activity in the allowance for loan losses by portfolio segment for the years ended December 31, 2013, 2012 and 2011:
Real Business 2013 Estate Loans Consumer Total
Beginning Balance $ 4,629,559 $ 1,554,698 $ 770,012 $ 6,954,269
Provision for loan losses 742,177 1 ,561,751 (99,562) 2,204,366
Chargeoffs 763,914 375,498 135,302 1,274,714
Recoveries 97,931 26,458 69,189 193,578
Net Chargeoffs 665,983 349,040 66,113 1,081,136
Ending Balance $ 4,705,753 $ 2,767,409 $ 604,337 $ 8,077,499
Period end allowance allocated to: Loans individually evaluated for impairment 1,224,874 1,071,729 - 2,296,603
Loans collectively evaluated for impairment 3,480,879 1,695,680 604,337 5,780,896
Ending Balance $ 4,705,753 $ 2,767,409 $ 604,337 $ 8,077,499

CITIZENS HOLDING COMPANY Years Ended December 31, 2013, 2012 and 2011
NOTES TO CONSOLIDATED FINANCIAL STATEMENTS
37
Note 5. Continued
Real Business 2012 Estate Loans Consumer Total
Beginning Balance $ 4,176,475 $ 1,672,467 $ 832,470 $ 6,681,412
Provision for loan losses 1,614,053 (115,269) 47,013 1,545,797
Chargeoffs 1,218,879 55,390 229,926 1,504,195
Recoveries 57,910 52,890 120,455 231,255
Net Chargeoffs 1,160,969 2,500 109,471 1,272,940
Ending Balance $ 4,629,559 $ 1,554,698 $ 770,012 $ 6,954,269
Period end allowance allocated to: Loans individually evaluated for impairment 1,038,521 54,706 - 1,093,227
Loans collectively evaluated for impairment 3,591,038 1,499,992 770,012 5,861,042
Ending Balance $ 4,629,559 $ 1,554,698 $ 770,012 $ 6,954,269
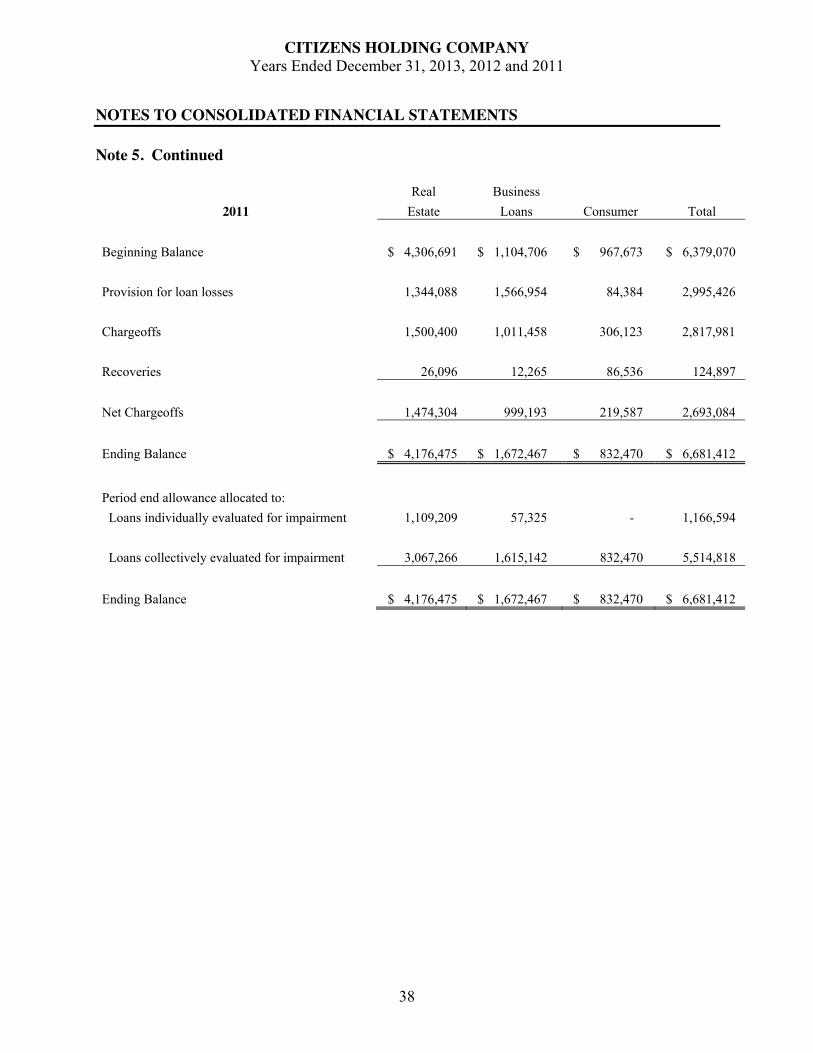
CITIZENS HOLDING COMPANY Years Ended December 31, 2013, 2012 and 2011
NOTES TO CONSOLIDATED FINANCIAL STATEMENTS
38
Note 5. Continued
Real Business 2011 Estate Loans Consumer Total
Beginning Balance $ 4,306,691 $ 1,104,706 $ 967,673 $ 6,379,070
Provision for loan losses 1,344,088 1,566,954 84,384 2,995,426
Chargeoffs 1,500,400 1,011,458 306,123 2,817,981
Recoveries 26,096 12,265 86,536 124,897
Net Chargeoffs 1,474,304 999,193 219,587 2,693,084
Ending Balance $ 4,176,475 $ 1,672,467 $ 832,470 $ 6,681,412
Period end allowance allocated to: Loans individually evaluated for impairment 1,109,209 57,325 - 1,166,594
Loans collectively evaluated for impairment 3,067,266 1,615,142 832,470 5,514,818
Ending Balance $ 4,176,475 $ 1,672,467 $ 832,470 $ 6,681,412
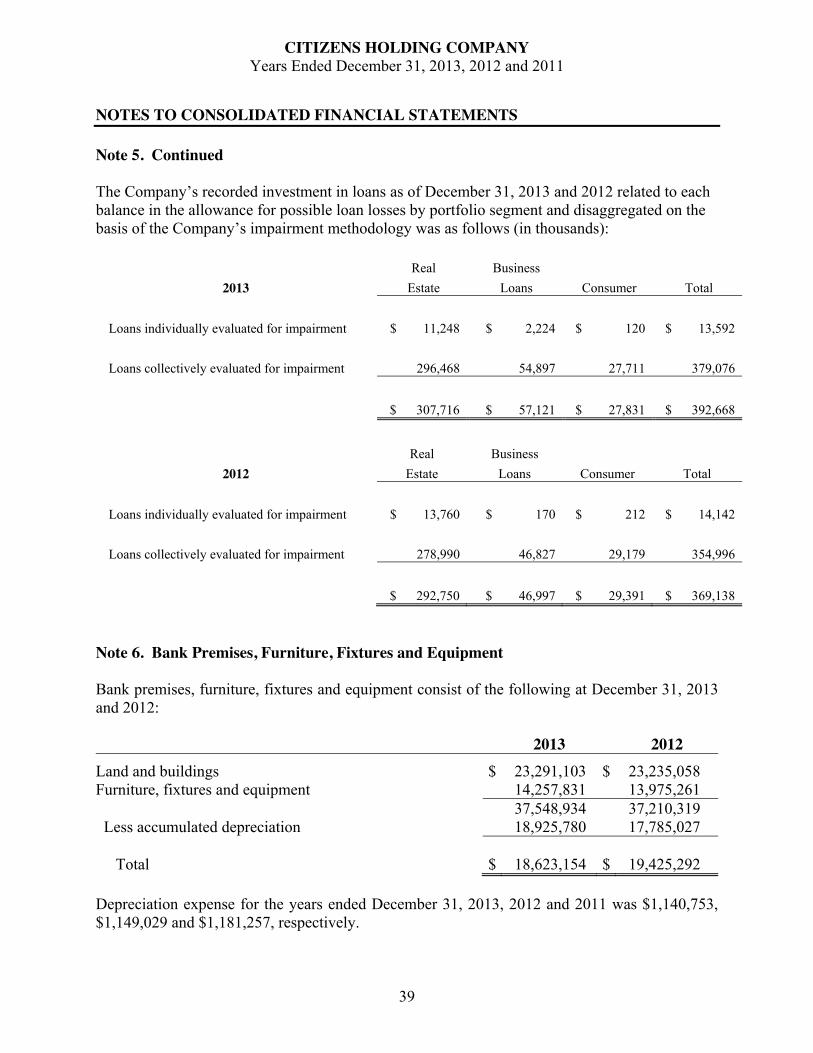
CITIZENS HOLDING COMPANY Years Ended December 31, 2013, 2012 and 2011
NOTES TO CONSOLIDATED FINANCIAL STATEMENTS
39
Note 5. Continued
The Company’s recorded investment in loans as of December 31, 2013 and 2012 related to each balance in the allowance for possible loan losses by portfolio segment and disaggregated on the basis of the Company’s impairment methodology was as follows (in thousands):
Real Business 2013 Estate Loans Consumer Total
Loans individually evaluated for impairment $ 11,248 $ 2,224 $ 120 $ 13,592
Loans collectively evaluated for impairment 296,468 54,897 27,711 379,076
$ 307,716 $ 57,121 $ 27,831 $ 392,668
Real Business 2012 Estate Loans Consumer Total
Loans individually evaluated for impairment $ 13,760 $ 170 $ 212 $ 14,142
Loans collectively evaluated for impairment 278,990 46,827 29,179 354,996
$ 292,750 $ 46,997 $ 29,391 $ 369,138
Note 6. Bank Premises, Furniture, Fixtures and Equipment
Bank premises, furniture, fixtures and equipment consist of the following at December 31, 2013 and 2012:
2013 2012 Land and buildings $ 23,291,103 $ 23,235,058 Furniture, fixtures and equipment 14,257,831 13,975,261
37,548,934 37,210,319 Less accumulated depreciation 18,925,780 17,785,027
Total $ 18,623,154 $ 19,425,292
Depreciation expense for the years ended December 31, 2013, 2012 and 2011 was $1,140,753, $1,149,029 and $1,181,257, respectively.

CITIZENS HOLDING COMPANY Years Ended December 31, 2013, 2012 and 2011
NOTES TO CONSOLIDATED FINANCIAL STATEMENTS
40
Note 7. Deposits
The composition of deposits as of December 31, is as follows:
2013 2012 Non-interest bearing $ 120,424,895 $ 119,946,574 NOW and money market accounts 248,015,410 228,111,275 Savings deposits 53,745,787 46,240,652 Time deposits, $100,000 or more 124,886,164 131,935,125 Other time deposits 107,557,540 116,315,712
Total $ 654,629,796 $ 642,549,338
The scheduled maturities of time deposits at December 31, 2013 are as follows:
Year Ending December 31, Amount2014 $ 196,696,0242015 33,234,2642016 2,359,2522017 56,684 2018 97,480
$ 232,443,704
Interest expense for time deposits over $100,000 was approximately $754,000, $996,000 and $1,158,000 for the years ended December 31, 2013, 2012 and 2011, respectively.

CITIZENS HOLDING COMPANY Years Ended December 31, 2013, 2012 and 2011
NOTES TO CONSOLIDATED FINANCIAL STATEMENTS
41
Note 8. Federal Home Loan Bank Advances
Pursuant to collateral agreements with the FHLB, advances are collateralized by all of the Bank’s FHLB stock ($2,633,300 included in other assets at December 31, 2013) and qualifying first mortgages and other loans. As of December 31, 2013, the balance in qualifying first mortgages and other loans was $145,282,544. At December 31, 2013 and 2012, advances from the FHLB, along with their rate and maturity date, consist of the following:
Advance Amount at
December 31, Interest Final2013 2012 Rate Maturity
- 10,000,000 3.66 June 17, 2013 - 15,000,000 3.07 June 24, 2013 - 10,000,000 3.24 July 16, 2013 - 10,000,000 3.66 July 16, 2013
10,000,000 - 0.16 January 21, 2014 3,500,000 3,500,000 4.67 December 16, 2014 20,000,000 20,000,000 2.53 January 09, 2018 $ 33,500,000 $ 68,500,000
The scheduled payments for the next five years are as follows:
Year Due Payment2014 13,500,0002015 -2016 -2017 -2018 20,000,000Thereafter -
$ 33,500,000
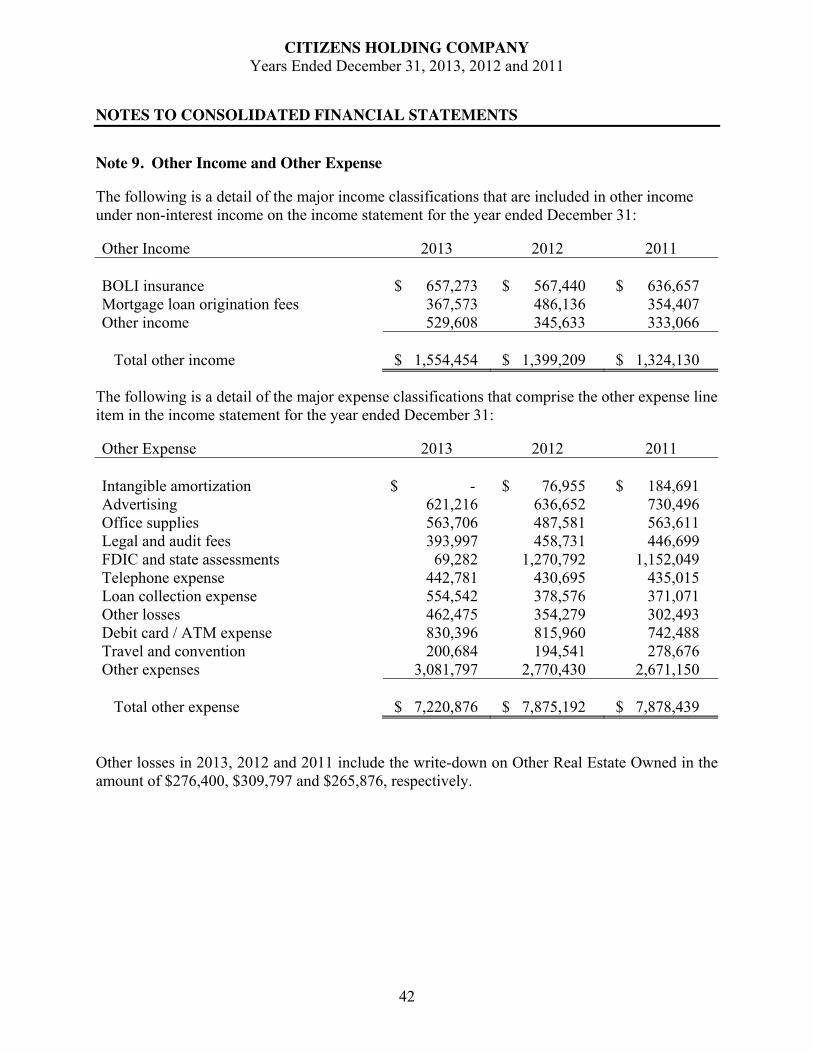
CITIZENS HOLDING COMPANY Years Ended December 31, 2013, 2012 and 2011
NOTES TO CONSOLIDATED FINANCIAL STATEMENTS
42
Note 9. Other Income and Other Expense
The following is a detail of the major income classifications that are included in other income under non-interest income on the income statement for the year ended December 31:
Other Income 2013 2012 2011
BOLI insurance $ 657,273 $ 567,440 $ 636,657 Mortgage loan origination fees 367,573 486,136 354,407 Other income 529,608 345,633 333,066
Total other income $ 1,554,454 $ 1,399,209 $ 1,324,130
The following is a detail of the major expense classifications that comprise the other expense line item in the income statement for the year ended December 31:
Other Expense 2013 2012 2011
Intangible amortization $ - $ 76,955 $ 184,691 Advertising 621,216 636,652 730,496 Office supplies 563,706 487,581 563,611 Legal and audit fees 393,997 458,731 446,699 FDIC and state assessments 69,282 1,270,792 1,152,049 Telephone expense 442,781 430,695 435,015 Loan collection expense 554,542 378,576 371,071 Other losses 462,475 354,279 302,493 Debit card / ATM expense 830,396 815,960 742,488 Travel and convention 200,684 194,541 278,676 Other expenses 3,081,797 2,770,430 2,671,150
Total other expense $ 7,220,876 $ 7,875,192 $ 7,878,439
Other losses in 2013, 2012 and 2011 include the write-down on Other Real Estate Owned in the amount of $276,400, $309,797 and $265,876, respectively.

CITIZENS HOLDING COMPANY Years Ended December 31, 2013, 2012 and 2011
NOTES TO CONSOLIDATED FINANCIAL STATEMENTS
43
Note 10. Income Taxes
The consolidated provision for income taxes consists of the following:
2013 2012 2011 Currently payable Federal $ 2,335,959 $ 1,917,068 $ 1,677,406 State 284,044 270,114 211,796
2,620,003 2,187,182 1,889,202Deferred tax benefit (850,100) (536,374) (572,140) Income tax expense $ 1,769,903 $ 1,650,808 $ 1,317,062
The differences between income taxes calculated at the federal statutory rate and income tax expense were as follows:
2013 2012 2011
Federal taxes based on statutory rate $ 3,032,719 $ 2,867,834 $ 2,901,869 State income taxes, net of federal benefit 187,469 178,275 139,785 Tax-exempt investment interest (1,159,571) (1,231,567) (1,201,271)Other, net (290,714) (163,734) (523,321)
Income tax expense $ 1,769,903 $ 1,650,808 $ 1,317,062
At December 31, 2013 and 2012, net deferred tax assets consist of the following:
2013 2012Deferred tax assets Allowance for loan losses $ 3,012,907 $ 2,593,942 Deferred compensation liability 2,506,541 2,207,288 Intangible assets 154,037 215,797 Unrealized loss on available-for-sale securities 12,640,667 - Other 689,235 678,366
Total 19,003,387 5,695,393
Deferred tax liabilities Premises and equipment 1,056,263 1,197,848 Unrealized gain on available-for-sale securities - 2,586,339 Other 152,844 194,033
Total 1,209,107 3,978,220 Net deferred tax asset $ 17,794,280 $ 1,717,173

CITIZENS HOLDING COMPANY Years Ended December 31, 2013, 2012 and 2011
NOTES TO CONSOLIDATED FINANCIAL STATEMENTS
44
Note 10. Continued
The net deferred tax asset of $17,794,280 and $1,717,173 at December 31, 2013 and 2012, respectively, is included in other assets. The Company has evaluated the need for a valuation allowance related to the above deferred tax assets and, based on the weight of the available evidence, has determined that it is more likely than not that all deferred tax assets will be realized.
As of December 31, 2013, the Company has no unrecognized tax benefits related to federal and state income tax matters. As of December 31, 2013, the Company has not accrued for interest and penalties related to uncertain tax positions. It is the Company’s policy to recognize interest or penalties related to income tax matters in income tax expense.
The Company and the Bank file a consolidated U. S. federal income tax return. The Company is currently open to audit under the statute of limitations by the Internal Revenue Service for the years ended December 31, 2010 through 2013. The Company and Bank’s state income tax returns are open to audit under the statute of limitations for the years ended December 31, 2010 through 2013.
Note 11. Summarized Financial Information of Citizens Holding Company
Summarized financial information of Citizens Holding Company, excluding the Bank, at December 31, 2013 and 2012, and for the years ended December 31, 2013, 2012 and 2011, is as follows:
Balance Sheets December 31, 2013 and 2012
2013 2012Assets Cash (1) $ 1,750,766 $ 1,657,268 Investment in bank subsidiary (1) 64,188,216 86,885,774 Other assets (1) 327,220 326,188
Total assets $ 66,266,202 $ 88,869,230
Liabilities Other liabilities $ - $ 400
Stockholders’ equity 66,266,202 88,868,830
Total liabilities and stockholders’ equity $ 66,266,202 $ 88,869,230
(1) Fully or partially eliminates in consolidation.

CITIZENS HOLDING COMPANY Years Ended December 31, 2013, 2012 and 2011
NOTES TO CONSOLIDATED FINANCIAL STATEMENTS
45
Note 11. Continued
Income Statements Years Ended December 31, 2013, 2012 and 2011
2013 2012 2011 Interest income $ 2,140 $ 3,348 $ 3,264
Other income Dividends from bank subsidiary (1) 4,332,000 4,332,000 4,332,000 Equity in undistributed earnings of bank subsidiary (1) 2,898,509 2,603,735 3,016,877 Other income - - 51 Total other income 7,230,509 6,939,083 7,348,928 Other expense 136,317 252,278 236,904 Income before income taxes 7,096,332 6,686,805 7,115,288 Income tax benefit (53,528) (97,194) (102,559) Net income $ 7,149,860 $ 6,783,999 $ 7,217,847
(1) Eliminates in consolidation.
Statements of Cash Flows Years Ended December 31, 2013, 2012 and 2011
2013 2012 2011 Cash flows from operating activities Net income $ 7,149,860 $ 6,783,999 $ 7,217,847 Adjustments to reconcile net income to net cash provided by operating
activities Equity in undistributed earnings of Bank (2,898,509) (2,603,735) (3,016,877) Stock compensation expense - 119,834 123,702 Increase in other assets (1,032) (40,774) (61,093) Decrease in other liabilities (400) - - Net cash provided by operating activities 4,249,919 4,259,324 4,263,579

CITIZENS HOLDING COMPANY Years Ended December 31, 2013, 2012 and 2011
NOTES TO CONSOLIDATED FINANCIAL STATEMENTS
46
Note 11. Continued
2013 2012 2011 Cash flows from financing activities Dividends paid to stockholders $ (4,285,371) $ (4,276,282) $ (4,261,652) Proceeds from exercise of stock options 128,950 257,425 63,385 Net cash used by financing activities (4,156,421) (4,018,857) (4,198,267) Net increase in cash 93,498 240,467 65,312
Cash, beginning of year 1,657,268 1,416,801 1,351,489
Cash, end of year $ 1,750,766 $ 1,657,268 $ 1,416,801
The Bank is required to obtain approval from state regulators before paying dividends. The Bank paid dividends of $4,332,000, $4,332,000 and $4,332,000 to the Citizens Holding Company during the years ended December 31, 2013, 2012 and 2011, respectively.
Note 12. Related Party Transactions
The Company had, and may be expected to have in the future, banking transactions in the ordinary course of business with directors, significant stockholders, principal officers, their immediate families, and affiliated companies in which they are principal stockholders (commonly referred to as related parties). In management’s opinion, such loans are made on substantially the same terms, including interest rates and collateral, as those prevailing at the time for comparable transactions with unrelated parties, and do not involve more than the normal risk of collectability at the time of the transaction.
Activity in related party loans is detailed in tabular form in Note 5 of the notes to the Financial Statements.
Deposits from related parties at December 31, 2013 and 2012 approximated $3,698,844 and $5,903,725, respectively.
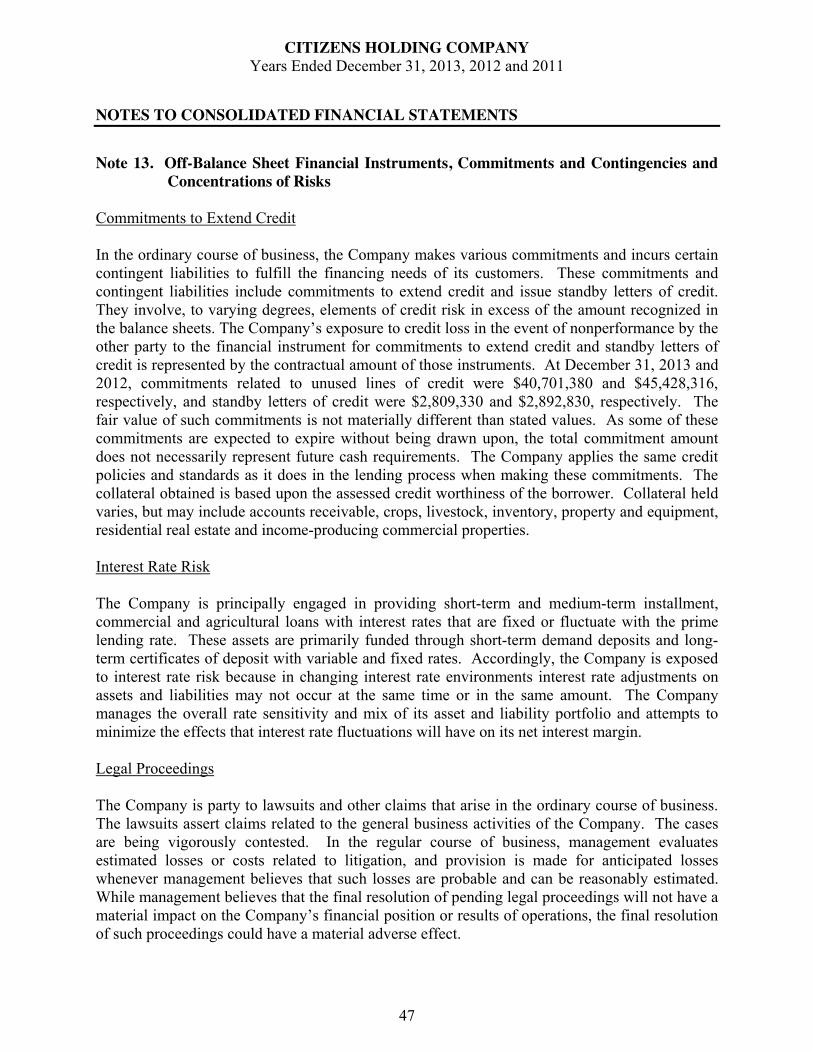
CITIZENS HOLDING COMPANY Years Ended December 31, 2013, 2012 and 2011
NOTES TO CONSOLIDATED FINANCIAL STATEMENTS
47
Note 13. Off-Balance Sheet Financial Instruments, Commitments and Contingencies and Concentrations of Risks
Commitments to Extend Credit
In the ordinary course of business, the Company makes various commitments and incurs certain contingent liabilities to fulfill the financing needs of its customers. These commitments and contingent liabilities include commitments to extend credit and issue standby letters of credit. They involve, to varying degrees, elements of credit risk in excess of the amount recognized in the balance sheets. The Company’s exposure to credit loss in the event of nonperformance by the other party to the financial instrument for commitments to extend credit and standby letters of credit is represented by the contractual amount of those instruments. At December 31, 2013 and 2012, commitments related to unused lines of credit were $40,701,380 and $45,428,316, respectively, and standby letters of credit were $2,809,330 and $2,892,830, respectively. The fair value of such commitments is not materially different than stated values. As some of these commitments are expected to expire without being drawn upon, the total commitment amount does not necessarily represent future cash requirements. The Company applies the same credit policies and standards as it does in the lending process when making these commitments. The collateral obtained is based upon the assessed credit worthiness of the borrower. Collateral held varies, but may include accounts receivable, crops, livestock, inventory, property and equipment, residential real estate and income-producing commercial properties.
Interest Rate Risk
The Company is principally engaged in providing short-term and medium-term installment, commercial and agricultural loans with interest rates that are fixed or fluctuate with the prime lending rate. These assets are primarily funded through short-term demand deposits and long-term certificates of deposit with variable and fixed rates. Accordingly, the Company is exposed to interest rate risk because in changing interest rate environments interest rate adjustments on assets and liabilities may not occur at the same time or in the same amount. The Company manages the overall rate sensitivity and mix of its asset and liability portfolio and attempts to minimize the effects that interest rate fluctuations will have on its net interest margin.
Legal Proceedings
The Company is party to lawsuits and other claims that arise in the ordinary course of business. The lawsuits assert claims related to the general business activities of the Company. The cases are being vigorously contested. In the regular course of business, management evaluates estimated losses or costs related to litigation, and provision is made for anticipated losses whenever management believes that such losses are probable and can be reasonably estimated. While management believes that the final resolution of pending legal proceedings will not have a material impact on the Company’s financial position or results of operations, the final resolution of such proceedings could have a material adverse effect.

CITIZENS HOLDING COMPANY Years Ended December 31, 2013, 2012 and 2011
NOTES TO CONSOLIDATED FINANCIAL STATEMENTS
48
Note 13. Continued
Concentration of Risk
The Company makes agricultural, agribusiness, commercial, residential and consumer loans primarily in eastern central Mississippi. A substantial portion of the customers’ abilities to honor their contracts is dependent on their business and the agricultural economy in the area.
Although the Company’s loan portfolio is diversified, there is a relationship in this region between the agricultural economy and the economic performance of loans made to nonagricultural customers. The Company’s lending policies for agricultural and nonagricultural customers require loans to be well-collateralized and supported by cash flows. Collateral for agricultural loans includes equipment, crops, livestock, and land. Credit losses from loans related to the agricultural economy are consistent with credit losses experienced in the portfolio as a whole. The concentration of credit in the regional agricultural economy is taken into consideration by management in determining the allowance for loan losses. See Note 5 for a summary of loans by type.
Note 14. Lease Commitment and Total Rental Expense
The Company has operating leases under non-cancellable operating lease agreements for banking facilities and equipment. Future minimum rental payments due under the leases are as follows:
Years Ending December 31, Amounts2014 $ 452,9282015 378,4442016 378,4442017 378,4442018 378,444
$ 1,966,704
The total rental expense included in the income statements for the years ended December 31, 2013, 2012 and 2011 is $150,333, $177,416 and $145,207, respectively.
CITIZENS HOLDING COMPANY Years Ended December 31, 2013, 2012 and 2011
NOTES TO CONSOLIDATED FINANCIAL STATEMENTS
49
Note 15. Benefit Plans
The Company provides its employees with a profit sharing and savings plan, which allows employees to direct a percentage of their compensation into a tax deferred retirement account, subject to statutory limitations. To encourage participation, the Company provides a 50 percent matching contribution for up to 6 percent of each participant’s compensation, plus discretionary non-matching contributions. Employees are eligible after one year of service. For 2013, 2012 and 2011, the Company’s contributions were $511,984, $778,724 and $786,824, respectively.
Deferred Compensation Plans
The Company provides a deferred compensation plan covering its directors. Participants in the deferred compensation plan can defer a portion of their compensation for payment after attaining age 70. Life insurance contracts have been purchased which may be used to fund payments under the plan. Net expenses related to this plan were $157,017, $26,862 and $75,327 for the plan years ended December 31, 2013, 2012 and 2011, respectively.
The Company has also entered into deferred compensation arrangements with certain officers that provide for payments to such officers or their survivors after retirement. Life insurance policies have been purchased that may be used to fund payments under these arrangements. The obligations of the Company under both the directors and officers deferred compensation arrangements are expensed on a systematic basis over the remaining expected service period of the individual directors and officers. Net expenses related to this plan were $804,755, $882,904 and $844,184 for the plan years ended December 31, 2013, 2012 and 2011, respectively.
Note 16. Regulatory Matters
The Company (on a consolidated basis) and the Bank are subject to various regulatory capital requirements administered by federal banking agencies. Failure to meet the minimum regulatory capital requirements can initiate certain mandatory and possible additional discretionary actions by regulators that, if undertaken, could have a direct material adverse effect on the Company.
Under the regulatory capital adequacy guidelines and the regulatory framework for prompt corrective action, the Company must meet specific capital guidelines involving quantitative measures of the Company’s assets, liabilities and certain off-balance sheet items as calculated under regulatory accounting practices. The Company’s capital amounts and classification under the prompt corrective action guidelines are also subject to qualitative judgments by the regulators about components, risk weightings, and other factors. Quantitative measures established by regulation to ensure capital adequacy require the Company to maintain minimum amounts and ratios of total capital and Tier I capital to risk-weighted assets (as defined in the regulations) and Tier I capital to average assets (as defined in the regulations). Management believes, as of December 31, 2013, that the Company and the Bank meet all capital adequacy requirements to which they are subject.

CITIZENS HOLDING COMPANY Years Ended December 31, 2013, 2012 and 2011
NOTES TO CONSOLIDATED FINANCIAL STATEMENTS
50
Note 16. Continued
As of December 31, 2013 and 2012, the most recent regulatory notification categorized the Bank as well capitalized. There have been no conditions or events that would cause changes to the capital structure of the Company since this notification. To continue to be categorized as well capitalized under the regulatory framework for prompt corrective action, the Company would have to maintain minimum total risk-based, Tier I risk-based, and Tier I leverage ratios as disclosed below, in comparison with actual capital amounts and ratios:
To Be WellFor Capital Capitalized under Prompt
Actual Adequacy Purposes Corrective Action Provisions Amount Ratio Amount Ratio Amount Ratio
As of December 31, 2013 Total Capital (to Risk-Weighted Assets) Citizens Holding Company $ 90,881,652 17.49% $ 41,581,280 8% $ N/A - Citizens Bank 88,800,245 17.09% 41,559,111 8 51,948,889 10% Tier I Capital (to Risk-Weighted Assets) Citizens Holding Company $ 84,365,066 16.23% $ 20,790,640 4 N/A - Citizens Bank 82,287,080 15.84% 20,779,556 4 31,169,333 6 Tier I Capital (to Average Assets) Citizens Holding Company $ 84,365,066 9.63% $ 35,026,360 4 N/A - Citizens Bank 82,287,080 9.40% 35,013,482 4 43,766,853 5
To Be WellFor Capital Capitalized under Prompt
Actual Adequacy Purposes Corrective Action Provisions Amount Ratio Amount Ratio Amount Ratio
As of December 31, 2012 Total Capital (to Risk-Weighted Assets) Citizens Holding Company $ 87,379,179 18.22% $ 38,372,601 8% $ N/A - Citizens Bank 85,392,046 17.81% 38,346,180 8 47,932,725 10% Tier I Capital (to Risk-Weighted Assets) Citizens Holding Company $ 81,371,626 16.96% $ 19,271,353 4 N/A - Citizens Bank 79,388,571 16.56% 19,173,090 4 28,759,635 6 Tier I Capital (to Average Assets) Citizens Holding Company $ 81,372,626 9.58% $ 33,958,656 4 N/A - Citizens Bank 79,388,571 9.36% 33,944,452 4 42,430,564 5

CITIZENS HOLDING COMPANY Years Ended December 31, 2013, 2012 and 2011
NOTES TO CONSOLIDATED FINANCIAL STATEMENTS
51
Note 17. Fair Values of Financial Instruments
Under the authoritative guidance on fair value measurements, fair value is the price that would be received to sell an asset or paid to transfer a liability in an orderly transaction between market participants at the measurement date. In determining fair value, the Company uses various methods including market, income and cost approaches. Based on these approaches, the Company often utilizes certain assumptions about risk and or the risks inherent in the inputs to the valuation technique. These inputs can be readily observable, market corroborated, or generally unobservable inputs. The Company utilizes valuation techniques that maximize the use of observable inputs and minimize the use of unobservable inputs. Based on the observability of the inputs used in the valuation techniques, the Company is required to provide the following information according to the fair value hierarchy. The fair value hierarchy ranks the quality and reliability of the information used to determine fair values. Financial assets and liabilities carried at fair value will be classified and disclosed in one of the three following categories:
Level 1 Quoted prices in active markets for identical assets or liabilities; Level 2 Quoted prices in active markets for similar assets and liabilities and
inputs that are observable for the asset or liability; or Level 3 Unobservable inputs, such as discounted cash flow models or
valuations.
The determination of where assets and liabilities fall within this hierarchy is based upon the lowest level of input that is significant to the fair value measurement. The fair value estimates, methods and assumptions used by the Company in estimating its fair value disclosures for financial instruments were:
Cash and Due from Banks and Interest Bearing Deposits with Banks
The carrying amounts reported in the balance sheet for these instruments approximate fair value because of their immediate and shorter-term maturities, which is considered to be three months or less at the time of purchase.
CITIZENS HOLDING COMPANY Years Ended December 31, 2013, 2012 and 2011
NOTES TO CONSOLIDATED FINANCIAL STATEMENTS
52
Note 17. Continued
Securities Available-for-Sale
Fair values for investment securities are based on quoted market prices, when available (Level 1). If quoted market prices are not available, fair values are based on quoted market prices of comparable instruments (Level 2). When neither quoted prices nor comparable instruments are available, unobservable inputs are needed to form an expected future cash flow analysis to establish fair values (Level 3).
The Company owns certain beneficial interests in one collateralized debt obligation secured by community bank trust preferred securities. These interests do not trade in a liquid market, and therefore, market quotes are not a reliable indicator of their ultimate realizability. The Company utilizes a discounted cash flow model using inputs of (1) market yields of trust-preferred securities as the discount rate and (2) expected cash flows which are estimated using assumptions related to defaults, deferrals and prepayments to determine the fair values of these beneficial interests. Many of the factors that adjust the timing and extent of cash flows are based on judgment and not directly observable in the markets. Therefore, these fair values are classified as Level 3 valuations for accounting and disclosure purposes. Since observable transactions in these securities are extremely rare, the Company uses assumptions that a market participant would use in valuing these instruments. These assumptions primarily include cash flow estimates and market discount rates. The cash flow estimates are sensitive to the assumptions related to the ability of the issuers to pay the underlying trust preferred securities according to their terms. The market discount rates depend on transactions, which are rare given the lack of interest of investors in these types of beneficial interests.

CITIZENS HOLDING COMPANY Years Ended December 31, 2013, 2012 and 2011
NOTES TO CONSOLIDATED FINANCIAL STATEMENTS
53
Note 17. Continued
The following table presents assets and liabilities that are measured at fair value on a recurring basis as of December 31, 2013:
Quoted Pricesin Active Significant
Markets for Other Significant Identical Observable UnobservableAssets Inputs Inputs
(Level 1) (Level 2) (Level 3) TotalsSecurities available for sale Obligations of U.S. Government agencies -$ 282,816,400$ -$ 282,816,400$ Mortgage-backed securities - 17,166,394 - 17,166,394 State, County, Municipals - 95,427,405 - 95,427,405 Other Investments - - 2,766,203 2,766,203
-$ 395,410,199$ 2,766,203$ 398,176,402$
The following table presents assets and liabilities that are measured at fair value on a recurring basis as of December 31, 2012:
Quoted Pricesin Active Significant
Markets for Other Significant Identical Observable UnobservableAssets Inputs Inputs
(Level 1) (Level 2) (Level 3) TotalsSecurities available for sale Obligations of U.S. Government agencies -$ 269,110,901$ -$ 269,110,901$ Mortgage-backed securities - 38,421,301 - 38,421,301 State, County, Municipals - 110,569,360 - 110,569,360 Other Investments - - 2,806,253 2,806,253
-$ 418,101,562$ 2,806,253$ 420,907,815$
CITIZENS HOLDING COMPANY Years Ended December 31, 2013, 2012 and 2011
NOTES TO CONSOLIDATED FINANCIAL STATEMENTS
54
Note 17. Continued
The following table reports the activity in assets measured at fair value on a recurring basis using significant unobservable inputs, during the years ended December 31, 2013 and 2012.
2013 2012Balance at January 1 2,806,253$ 2,029,295$
Principal payments received (68,012) - Unrealized gains included in other comprehensive income 27,962 776,958
Balance at December 31 2,766,203$ 2,806,253$
The amount of total gains or losses for the period includedin earnings attributable to the change in unrealized gains
As of December 31, 2013 and 2012, management determined, based on the current credit ratings, known defaults and deferrals by the underlying banks and the degree to which future defaults and deferrals would be required to occur before the cash flow for the Company’s tranche is negatively impacted, that no other-than-temporary impairment exists.
The Company recorded no gains or losses in earnings for the period that were attributable to the change in unrealized gains or losses relating to assets still held at the reporting date.
Net Loans
For variable-rate loans that reprice frequently and with no significant change in credit risk, fair values are based on carrying values. The fair values for other loans (i.e., commercial real estate and rental property mortgage loans, commercial and industrial loans, financial institution loans, and agricultural loans) are estimated using discounted cash flow analyses, using interest rates currently being offered for loans with similar terms to borrowers of similar credit quality.

CITIZENS HOLDING COMPANY Years Ended December 31, 2013, 2012 and 2011
NOTES TO CONSOLIDATED FINANCIAL STATEMENTS
55
Note 17. Continued
Impaired Loans
Loans considered impaired are reserved for at the time the loan is identified as impaired taking into account the fair value of the collateral less estimated selling costs. Collateral may be real estate and/or business assets including but not limited to, equipment, inventory and accounts receivable. The fair value of real estate is determined based on appraisals by qualified licensed appraisers. The fair value of the business assets is generally based on amounts reported on the business’s financial statements. Appraised and reported values may be adjusted based on management’s historical knowledge, changes in market conditions from the time of valuation and management’s knowledge of the client and the client’s business. Since not all valuation inputs are observable, these nonrecurring fair value determinations are classified Level 3. Impaired loans are reviewed and evaluated on at least a quarterly basis for additional impairment and adjusted accordingly, based on the same factors previously identified.
Other real estate owned
OREO is comprised of commercial and residential real estate obtained in partial and total satisfaction of loan obligations. OREO acquired in settlement of indebtedness is recorded at fair value of the real estate, less costs to sell. Subsequently, it may be necessary to record nonrecurring fair value adjustments for decline in fair value. Fair value, when recorded, is determined based on appraisals by qualified licensed appraisers and adjusted for management’s estimates of costs to sell. As such, values for OREO are classified as Level 3.
CITIZENS HOLDING COMPANY Years Ended December 31, 2013, 2012 and 2011
NOTES TO CONSOLIDATED FINANCIAL STATEMENTS
56
Note 17. Continued
The following table presents assets measured at fair value on a nonrecurring basis during December 31, 2013 and 2012 and were still held at those respective dates:
Quoted Pricesin Active Significant
Markets for Other Significant Identical Observable UnobservableAssets Inputs Inputs
(Level 1) (Level 2) (Level 3) TotalsDecember 31, 2013
Impaired loans -$ -$ 8,782,923$ 8,782,923$ Other real estate owned - - 645,468 645,468
$ - $ - 9,428,391$ 9,428,391$
December 31, 2012Impaired loans -$ -$ 4,099,031$ 4,099,031$ Other real estate owned - - 2,469,110 2,469,110
-$ -$ 6,568,141$ 6,568,141$
Impaired loans with a carrying value of $11,079,526 and $5,192,258 had an allocated allowance for loan losses of $2,296,603 and $1,093,227 at December 31, 2013 and 2012, respectively. The allocated allowance is based on the carrying value of the impaired loan and the fair value of the underlying collateral less estimated costs to sell.
After monitoring the carrying amounts for subsequent declines or impairment after foreclosure, management determined that a fair value adjustment to OREO in the amount of $276,400 and $309,797 was necessary and was recorded during the year ended December 31, 2013 and 2012, respectively.

CITIZENS HOLDING COMPANY Years Ended December 31, 2013, 2012 and 2011
NOTES TO CONSOLIDATED FINANCIAL STATEMENTS
57
Note 17. Continued
Federal Funds Sold and Securities Sold Under Agreement to Repurchase
Due to the short term nature of these instruments, the carrying amount is equal to the fair value.
Deposits
The fair values for demand deposits, NOW and money market accounts and savings accounts are, by definition, equal to the amount payable on demand at the reporting date (i.e., their carrying amounts). The carrying amounts for variable-rate, fixed-term money market accounts and time deposits approximate their fair values at the reporting date. Fair values for fixed-rate time deposits are estimated using a discounted cash flow calculation that applies interest rates currently being offered on similar deposits to a schedule of aggregated expected monthly maturities on time deposits.
Federal Home Loan Bank Borrowings
The fair value of FHLB advances is based on discounted cash flow analysis.
Off-Balance Sheet Instruments
The fair value of commitments to extend credit and letters of credit are estimated using fees currently charged to enter into similar agreements. The fees associated with these financial instruments are not material.

CITIZENS HOLDING COMPANY Years Ended December 31, 2013, 2012 and 2011
NOTES TO CONSOLIDATED FINANCIAL STATEMENTS
58
Note 17. Continued
The following represents the carrying value and estimated fair value of the Company’s financial instruments at December 31, 2013:
Quoted Pricesin Active Significant
Markets for Other Significant Total Carrying Identical Observable Unobservable Fair
Value Assets Inputs Inputs Value(Level 1) (Level 2) (Level 3)
Financial assets Cash and due from banks 16,040,195$ 16,040,195$ -$ -$ 16,040,195$ Interest bearing deposits with banks 684,100 684,100 - - 684,100 Securities available-for-sale 432,065,590 - 395,410,199 2,766,203 398,176,402 Net loans 384,104,766 - - 385,646,132 385,646,132
Financial liabilities Deposits 654,629,796$ 422,186,092$ -$ 232,602,224$ 654,788,316$ Federal Home Loan Bank advances 33,500,000 - - 34,622,359 34,622,359 Securities Sold under Agreement to Repurchase 82,420,781 82,420,781 - - 82,420,781
The following represents the carrying value and estimated fair value of the Company’s financial instruments at December 31, 2012:
Quoted Pricesin Active Significant
Markets for Other Significant Total Carrying Identical Observable Unobservable Fair
Value Assets Inputs Inputs Value(Level 1) (Level 2) (Level 3)
Financial assets Cash and due from banks 21,561,288$ 21,561,288$ -$ -$ 21,561,288$ Interest bearing deposits with banks 16,228,747 16,228,747 - - 16,228,747 Securities available-for-sale 413,973,929 - 418,101,563 2,806,252 420,907,815 Net loans 361,936,495 - - 362,114,991 362,114,991
Financial liabilities Deposits 642,549,338$ 394,298,501$ -$ 248,464,899$ 642,763,400$ Federal Home Loan Bank advances 68,500,000 - - 70,844,530 70,844,530 Securities Sold under Agreement to Repurchase 73,306,765 73,306,765 - - 73,306,765
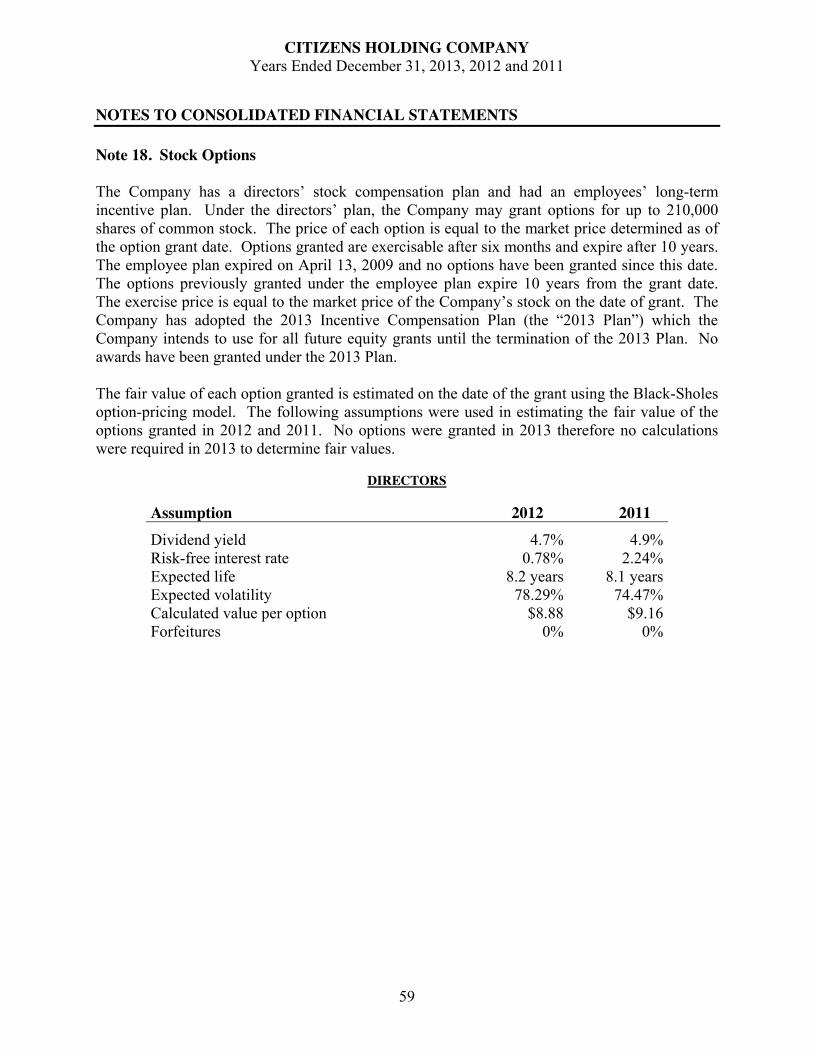
CITIZENS HOLDING COMPANY Years Ended December 31, 2013, 2012 and 2011
NOTES TO CONSOLIDATED FINANCIAL STATEMENTS
59
Note 18. Stock Options
The Company has a directors’ stock compensation plan and had an employees’ long-term incentive plan. Under the directors’ plan, the Company may grant options for up to 210,000 shares of common stock. The price of each option is equal to the market price determined as of the option grant date. Options granted are exercisable after six months and expire after 10 years. The employee plan expired on April 13, 2009 and no options have been granted since this date. The options previously granted under the employee plan expire 10 years from the grant date. The exercise price is equal to the market price of the Company’s stock on the date of grant. The Company has adopted the 2013 Incentive Compensation Plan (the “2013 Plan”) which the Company intends to use for all future equity grants until the termination of the 2013 Plan. No awards have been granted under the 2013 Plan.
The fair value of each option granted is estimated on the date of the grant using the Black-Sholes option-pricing model. The following assumptions were used in estimating the fair value of the options granted in 2012 and 2011. No options were granted in 2013 therefore no calculations were required in 2013 to determine fair values.
DIRECTORS
Assumption 2012 2011Dividend yield 4.7% 4.9%Risk-free interest rate 0.78% 2.24%Expected life 8.2 years 8.1 yearsExpected volatility 78.29% 74.47%Calculated value per option $8.88 $9.16Forfeitures 0% 0%
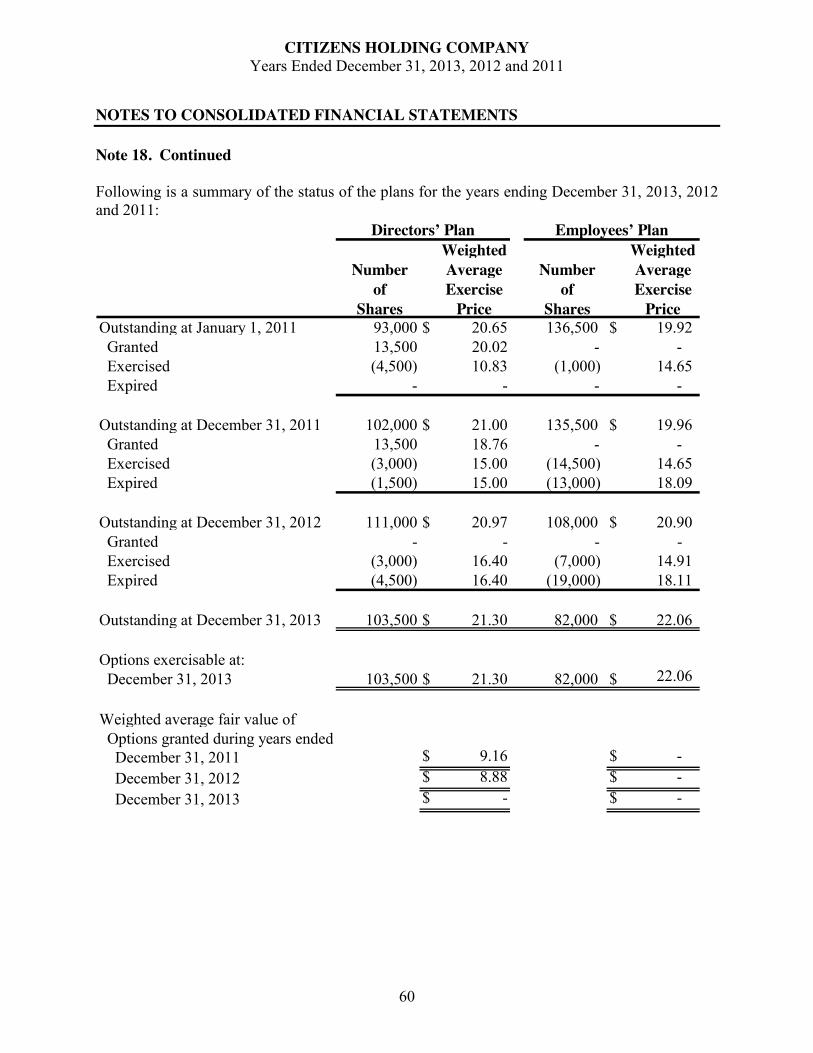
CITIZENS HOLDING COMPANY Years Ended December 31, 2013, 2012 and 2011
NOTES TO CONSOLIDATED FINANCIAL STATEMENTS
60
Note 18. Continued
Following is a summary of the status of the plans for the years ending December 31, 2013, 2012 and 2011:
Weighted Weighted Number Average Number Average
of Exercise of Exercise Shares Price Shares Price
Outstanding at January 1, 2011 93,000 $ 20.65 136,500 $ 19.92 Granted 13,500 20.02 - - Exercised (4,500) 10.83 (1,000) 14.65 Expired - - - -
Outstanding at December 31, 2011 102,000 $ 21.00 135,500 $ 19.96 Granted 13,500 18.76 - - Exercised (3,000) 15.00 (14,500) 14.65 Expired (1,500) 15.00 (13,000) 18.09
Outstanding at December 31, 2012 111,000 $ 20.97 108,000 $ 20.90 Granted - - - - Exercised (3,000) 16.40 (7,000) 14.91 Expired (4,500) 16.40 (19,000) 18.11
Outstanding at December 31, 2013 103,500 $ 21.30 82,000 $ 22.06
Options exercisable at: December 31, 2013 103,500 $ 21.30 82,000 $ 22.06
Weighted average fair value of Options granted during years ended December 31, 2011 $ 9.16 $ - December 31, 2012 $ 8.88 $ - December 31, 2013 $ - $ -
Directors’ Plan Employees’ Plan

CITIZENS HOLDING COMPANY Years Ended December 31, 2013, 2012 and 2011
NOTES TO CONSOLIDATED FINANCIAL STATEMENTS
61
Note 18. Continued
The following table presents the outstanding stock options granted in relation to the option price and the weighted average maturity.
Options Weighted Weighted Average Range of Exercise Prices Outstanding Average Price Life Remaining
$15.01 to $20.00 36,000 18.79 5 years, 1 month $20.01 to $22.50 99,500 21.39 2 years, 5 months $22.51 and above 50,000 24.11 3 years, 5 months
Total 185,500 $21.64 3 years, 2 months
The intrinsic value of options granted under the Directors’ Plan at December 31, 2013 was $7,200 and the intrinsic value of the Employees’ Plan at December 31, 2013 was $900 for a total intrinsic value at December 31, 2013 of $8,100. Additionally, the total intrinsic value of options exercised during 2013 and 2012 was $39,050 and $32,620, respectively. There was no unrecognized stock-based compensation expense at December 31, 2013.
62
Management’s Discussion and Analysis of Financial Condition and Results of Operations as of December 31, 2013, 2012 and 2011
OVERVIEW
The following information discusses the financial condition and results of operations of Citizens Holding Company (the “Company”) as of December 31, 2013, 2012 and 2011. In this discussion, all references to the activities, operations or financial performance of the Company reflect the Company’s activities, operations and financial performance through its wholly-owned subsidiary, The Citizens Bank of Philadelphia, Mississippi (the “Bank”), unless otherwise specifically noted.
Over the past three years, the Company has experienced growth in total assets and total deposits as management has capitalized on opportunities for organic growth within our market area and the addition of a branch in 2011. The Company has received approval to add two additional branches in 2014. Despite a decrease in 2013, total assets increased over the three-year period by $54.8 million or 6.7%. In the three-year period, net income increased in 2011, decreased in 2012 and then increased again in 2013. Although the cost of deposits decreased in all three years, the interest received on earning assets decreased at a faster rate and the net interest margin decreased in all three years. Loan loss provisions in 2013 increased after decreasing in 2012. Regardless of the decreases in the interest margins, management believes it has made appropriate provisions for loan losses.
During 2013, the Company’s assets decreased by $7,770,999, or 0.9%, from 2012, loans increased by $22,168,271, or 6.1% and total deposits increased by $12,080,458, or 1.9%. Loans increased in 2013 due to the Company’s expansion into new market areas and an increase in loan demand. Certificates of deposit ended 2013 at $232,443,704, or 6.4% lower than 2012. Demand, NOW, savings and money market accounts increased $27,887,591, or 7.1%, to $422,186,092 at December 31, 2013.
During 2012, the Company’s assets increased by $26,894,444, or 3.1%, from 2011, loans decreased by $20,644,034, or 5.4% and total deposits increased by $70,211,203, or 12.3%. Loans decreased in 2012 due to the continuing downturn in national and local economies and the weak loan demand that resulted from the sluggish economy. Certificates of deposit ended 2012 at $248,250,837, or 3.0% higher than 2011. Demand, NOW, savings and money market accounts increased $62,941,350, or 19.0%, to $394,298,501 at December 31, 2012.
During 2011, the Company’s assets increased by $35,712,722, or 4.4%, from 2010, loans decreased by $32,916,191, or 7.9% and total deposits increased by $34,908,413, or 6.5%. Loans decreased in 2011 due to the downturn in national and local economies and the weak loan demand that resulted from the recession. Certificates of deposit ended 2011 at $240,980,983, or 0.4% lower than 2010. Demand, NOW, savings and money market accounts increased $33,928,766, or 11.4%, to $331,357,152 at December 31, 2011.
In 2013, the Company’s net income after taxes increased to $7,149,860, an increase of $365,861 from 2012. The decrease in rates on earning assets was greater than the decrease in rates paid on deposits in 2013. This decrease was offset by the increase in non-interest income

63
and a decrease in other operating expenses. Net income for 2013 produced, on a fully diluted basis, earnings per share of $1.47 compared to $1.39 in 2012 and $1.49 for 2011.
In 2012, the Company’s net income after taxes decreased to $6,783,999, a decrease of $433,848 from 2011. The decrease in rates on earning assets was greater than the decrease in rates paid on deposits in 2012. This decrease was offset by the decrease in the provision for loan losses and other operating expenses causing earnings to decrease slightly. Net income for 2012 produced, on a fully diluted basis, earnings per share of $1.39 compared to $1.49 in 2011 and $1.48 for 2010.
In 2011, the Company’s net income after taxes increased to $7,217,847, an increase of $55,316 over 2010. The decrease in the rates paid on deposits being greater than the decrease in rates on earning assets was offset by the increase in the provision for loan losses and other operating expenses causing earnings to increase slightly. Net income for 2011 produced, on a fully diluted basis, earnings per share of $1.49 compared to $1.48 in 2010 and $1.45 for 2009.
The Company’s return on average assets (“ROA”) was 0.81% in 2013, compared to 0.81% in 2012 and 0.87% in 2011. The Company’s return on average equity (“ROE”) was 9.00% in 2013, 7.71% in 2012 and 8.78% in 2011. During these periods, leverage capital ratios (the ratio of equity to average total assets) increased from 9.47% in 2011 to 9.58% in 2012 and increased again to 9.63% in 2013. The ROE in 2013, 2012 and 2011 is a function of the level of net income during those years. The changes in ROA were also a result of the Company’s income increasing in 2011 before decreasing in 2012 and again increasing in 2013 and also affected by the change in total assets during these time periods. The Company set the annual dividend payout rate to approximately 59.86% of 2013 earnings per share, as compared to 62.86% in 2012 and 59.06% in 2011. The leverage capital ratio of 9.63% in 2013 remains well above the regulatory requirement of 5% to be considered “well capitalized” under applicable Federal Deposit Insurance Corporation (the “FDIC”) guidelines for the Bank.
CRITICAL ACCOUNTING POLICIES
The preparation of financial statements in conformity with accounting principles generally accepted in the United States of America requires management to make estimates and assumptions that affect the reported amounts of assets and liabilities and disclosure of contingent assets and liabilities at the date of the financial statements and the reported amounts of revenues and expenses during the reporting period. Actual results could differ from those estimates.
The accounting policy most important to the presentation of our financial statements relates to the allowance for loan loss and the related provision for loan losses. The allowance for loan losses is available to absorb probable credit losses inherent in the entire loan portfolio. The appropriate level of the allowance is based on a monthly analysis of the loan portfolio and represents an amount that management deems adequate to provide for inherent losses, including collective impairment as recognized under ASC Subtopic 450-20, Loss Contingencies. The collective impairment is calculated based on loans grouped by similar risk characteristics. Another component of the allowance is losses on loans assessed as impaired under ASC Subtopic 310-10, Loan Impairments. The balance of these loans determined to be impaired under ASC Subtopic 310-10 and their related allowance is included in management's estimation and
64
analysis of the allowance for loan losses. For a discussion of other considerations in establishing the allowance for loan losses and our loan policies and procedures for addressing credit risk, please refer to the disclosures in this Item under the heading “Provision for Loan Losses and Asset Quality.”
The Company currently classifies all of its debt securities as available-for-sale as they might be sold before maturity. Securities available for sale are carried at fair value, with unrealized holding gains and losses reported in other comprehensive income (loss), net of tax. Interest income includes amortization of purchase premium or discount. Premiums and discounts on securities are amortized on the level-yield method without anticipating prepayments, except for mortgage-backed securities where prepayments are anticipated. Gains and losses on sales are recorded on the trade date and determined using the specific identification method.
Management evaluates securities for other-than-temporary impairment (“OTTI”) on at least a quarterly basis, and more frequently when economic or market conditions warrant such an evaluation. For securities in an unrealized loss position, management considers the extent and duration of the unrealized loss, and the financial condition and near-term prospects of the issuer. Management also assesses whether it intends to sell, or it is more likely than not that it will be required to sell, a security in an unrealized loss position before recovery of its amortized cost basis. If either of the criteria regarding intent or requirement to sell is met, the entire difference between amortized cost and fair value is recognized as impairment through earnings. For debt securities that do not meet the aforementioned criteria, the amount of impairment is split into two components as follows: 1) OTTI related to credit loss, which must be recognized in the income statement; and 2) OTTI related to other factors, which is recognized in other comprehensive income. The credit loss is defined as the difference between the present value of the cash flows expected to be collected and the amortized cost basis.
Real estate acquired through foreclosure on a loan or by surrender of the real estate in lieu of foreclosure is called “OREO”. OREO is initially recorded at the fair value of the property less estimated costs to sell, which establishes a new cost basis. OREO is subsequently accounted for at the lower of cost or fair value of the property less estimated costs. If fair value declines subsequent to foreclosure, a valuation allowance is recorded through noninterest expense. Fair value is commonly based on recent real estate appraisals. These appraisals may utilize a single valuation approach or a combination of approaches including comparable sales and the income approach. Valuation adjustments are routinely made in the appraisal process by the independent appraisers to adjust for differences between the comparable sales and income data available. Valuation adjustments are also required when the listing price to sell an OREO has had to be reduced below the current carrying value. If there is a decrease in the fair value of the property from the last valuation, the decrease in value is charged to noninterest expense. All income produced from, changes in fair values in, and gains and losses on OREOs is also included in noninterest expense. During the time the property is held, all related operating and maintenance costs are expensed as incurred.

65
Goodwill resulting from business combinations prior to January 1, 2009 represents the excess of the purchase price over the estimated fair value of the net assets acquired. Goodwill and intangible assets acquired in a business combination and determined to have an indefinite useful life are not amortized, but instead reviewed for impairment when there is evidence to suggest that the estimated fair value of the net assets is lower than the carrying value, or at a minimum of once a year. Intangible assets with definite useful lives are amortized over their estimated useful lives to their estimated residual values. Goodwill was the only intangible asset with an indefinite life on our balance sheet. Other intangible assets consisted of core deposit and acquired customer relationship intangible assets arising from the Company’s acquisition of the Citizens Bank and Trust Company of Louisville, Mississippi. These assets are initially measured at fair value and then are amortized on an accelerated method over their estimated useful lives, which were determined to be 15 years.
The Company recognizes stock compensation expenses in accordance with FASB ASC Topic 718, Compensation-Stock Compensation. Generally, all options granted to employees and directors fully vest six months and one day after the date of grant, rather than vesting in tranches over a specified period. Given the limited historical amount of forfeited options, the Company has not reduced compensation expense for estimated forfeitures.
The Company utilizes the Black-Scholes valuation model to determine the fair value of stock options. The Black-Scholes model requires the use of certain assumptions, including the volatility of the Company's stock price, the expected life of the option, the expected dividend rate and the discount rate. The Company does not currently expect to change the model or its methods for determining the assumptions underlying the valuation of future stock option grants. For more information on the Company’s stock options and the assumptions used to calculate the expense of such options, please refer to Note 1, “Summary of Significant Accounting Policies,” and Note 18, “Stock Options” to the Company’s Consolidated Financial Statements included in this Annual Report.
The Company uses the asset and liability method, which recognizes the future tax consequences attributable to an event or a liability or asset that has been recognized in the consolidated financial statements. Due to tax regulations, several items of income and expense are recognized in different periods for tax return purposes than for financial reporting purposes. These items represent “temporary differences.” Deferred tax assets and liabilities are the expected future tax amounts for the temporary differences between carrying amounts and tax bases of assets and liabilities, computed using enacted tax rates. Deferred tax assets represent future deductions in the Company’s income tax return, while deferred tax liabilities represent future payments to tax authorities. Income tax expense is the total of the current year income tax due or refundable and the change in deferred tax assets and liabilities. A valuation allowance, if needed, reduces deferred tax assets to the amount expected to be realized.

66
A tax position is recognized as a benefit only if it is "more likely than not" that the tax position would be sustained in a tax examination, with a tax examination being presumed to occur. The amount recognized is the largest amount of tax benefit that is greater than 50% likely of being realized on examination. For tax positions not meeting the "more likely than not" test, no tax benefit is recorded. The Company recognizes interest and/or penalties related to income tax matters in income tax expense.
Please refer to Note 1, “Summary of Significant Accounting Policies,” to the Consolidated Financial Statements of the Company included in this Annual Report for a detailed discussion of our other significant accounting policies affecting the Company.

67
DISCLOSURE REGARDING FORWARD-LOOKING STATEMENTS
In addition to historical information, this Annual Report contains statements which constitute forward-looking statements and information that are based on management’s beliefs, plans, expectations, assumptions and on information currently available to management. The words “may,” “should,” “expect,” “anticipate,” “intend,” “plan,” “continue,” “believe,” “seek,” “estimate,” and similar expressions used in this report that do not relate to historical facts are intended to identify forward-looking statements. The Company notes that a variety of factors could cause its actual results or experience to differ materially from the anticipated results or other expectations described or implied by such forward-looking statements. The risks and uncertainties that may affect the operation, performance, development and results of the business of the Company and the Bank, include, but are not limited to, the following:
the risk of adverse changes in business conditions in the banking industry generally and in the specific markets in which the Company operates;
changes in the legislative and regulatory environment that negatively impact the Company and the Bank through increased operating expenses;
increased competition from other financial institutions;
the impact of technological advances;
expectations about the movement of interest rates, including actions that may be taken by the Federal Reserve Board in response to changing economic conditions;
changes in asset quality and loan demand;
expectations about overall economic strength and the performance of the economy in the Company’s market area; and
other risks detailed from time to time in the Company’s filings with the Securities and Exchange Commission.
The Company undertakes no obligation to update or revise any forward-looking statements subsequent to the date on which they are made.
SELECTED FINANCIAL DATA
The following selected financial data has been taken from the Company’s Consolidated Financial Statements and related notes included in this Annual Report and should be read in conjunction with such consolidated financial statements and related notes. Dollar references in all of the following tables are in thousands except for per share data.
The major components of the Company’s operating results for the past five years are summarized in Table 1 - Five Year Financial Summary of Consolidated Statements and Related Statistics.

68
TABLE 1 - FIVE YEAR SUMMARY OF CONSOLIDATED STATEMENTS AND RELATED STATISTICS (in thousands, except per share and ratio
amounts)2013 2012 2011 2010 2009
Summary of Earnings
Total Interest Income 32,116$ 34,388$ 36,974$ 38,138$ 40,889$ Total Interest Expense 4,080 5,709 6,642 8,726 11,336 Provision for loan losses 2,204 1,546 2,995 2,456 3,013 Non-interest income 7,816 7,402 7,442 7,409 8,058 Non-interest expense 24,728 26,100 26,244 25,120 25,827 Income tax expense 1,770 1,651 1,317 2,082 1,631 Net Income 7,150 6,784 7,218 7,163 7,139
Per Share Data
Earnings-basic 1.47$ 1.40$ 1.49$ 1.48$ 1.47$ Earnings-diluted 1.47 1.39 1.49 1.48 1.45 Cash dividends 0.88 0.88 0.88 0.85 0.81 Book value at year end 13.61 18.28 17.77 15.77 15.42
Selected Year End Actual Balances
Loans, net of unearned income 392,183$ 368,891$ 389,262$ 421,876$ 447,221$ Allowance for loan losses 8,077 6,954 6,681 6,379 5,526 Securities available for sale 398,176 420,908 374,508 324,730 318,404 Earning assets 785,592 802,220 760,744 741,383 764,780 Total assets 873,069 880,840 853,945 818,233 840,004 Deposits 654,630 642,549 572,338 537,430 569,803 Long term borrowings 33,626 68,674 68,677 84,760 74,947 Shareholders' equity 66,266 88,869 86,079 76,295 74,597
Selected Year End Average Balances
Loans, net of unearned income 371,200$ 381,597$ 407,748$ 437,563$ 441,841$ Allowance for loan losses 7,078 7,056 6,594 5,939 4,867 Securities available for sale, amortized cost 419,461 360,721 325,179 302,571 285,603 Earning assets 801,549 766,663 753,042 762,993 732,968 Total assets 882,285 842,456 829,177 839,212 806,213 Deposits 650,931 592,723 543,711 556,798 559,036 Long term borrowings 58,192 72,553 82,576 86,378 79,774 Shareholders' equity 79,458 87,972 82,254 78,776 74,330

69
2013 2012 2011 2010 2009Selected Ratios
Return on average assets 0.81% 0.81% 0.87% 0.85% 0.88%Return on average equity 9.00% 7.71% 8.78% 9.09% 9.58%Dividend payout ratio 59.86% 62.86% 59.06% 57.43% 55.10%Equity to year end assets 7.59% 10.09% 10.08% 9.32% 8.88%Total risk-based capital to risk-adjusted assets 17.49% 18.22% 17.53% 16.37% 14.97%Leverage capital ratio 9.63% 9.58% 9.47% 9.01% 8.72%Efficiency ratio 67.52% 70.73% 68.51% 65.52% 66.48%
NET OPERATING INCOME
Net operating income for 2013 increased by 6.0% to $7,149,860 or $1.47 per share-basic and -diluted, from $6,783,999, or $1.40 per share-basic and $1.39 per share-diluted for 2012. The provision for loan losses for 2013 was $2,204,366 compared to the provision of $1,545,797 in 2012. The increase in the loan loss provision for 2013 was mainly due to management’s assessment of inherent losses in the loan portfolio including the impact caused by current local and national economic conditions. Non-interest income increased by $414,323, or 5.6%, and non-interest expense decreased by $1,372,356 or 5.3%, in 2013. Non-interest income for 2013 increased primarily due to an increase in service fees on deposit accounts and other service charges. Non-interest expense decreased due to a decrease in salaries and benefits and a decrease in regulatory costs. The decrease in salaries and benefits is related to a reduction in the number of employees and the reduction in 401-k matching for our officers and employees.
Net operating income for 2012 decreased by 6.0% to $6,783,999, or $1.40 per share-basic and $1.39 per share-diluted, from $7,217,847, or $1.49 per share basic and diluted for 2011. The provision for loan losses for 2012 was $1,545,797 compared to the provision of $2,995,426 in 2011. The decrease in the loan loss provision for 2012 was mainly due to management’s assessment of inherent losses in the loan portfolio including the impact caused by current local and national economic conditions. Non-interest income decreased by $40,600, or 0.5%, and non-interest expense decreased by $143,653 or 0.5%, in 2012. Non-interest income for 2012 decreased primarily due to a reduction in the gains from sales of securities. Non-interest expense decreased due to a decrease in salaries and benefits. The decrease in salaries and benefits is related to a reduction in the number of employees and the freezing of salaries for our existing officers and employees.
Net operating income for 2011 increased by 0.3% to $7,217,847, or $1.49 per share-basic and diluted, from $7,162,531, or $1.48 per share basic and diluted for 2010. The provision for loan losses for 2011 was $2,995,426 compared to the provision of $2,455,790 in 2010. The increase in the loan loss provision for 2011 was mainly due to management’s assessment of inherent losses in the loan portfolio including the impact caused by current local and national economic conditions. Non-interest income increased by $33,813, or 0.5%, and non-interest expense increased by $1,123,880 or 4.5%, in 2011. Non-interest income for 2011 increased primarily due to normal growth in other service charges. Non-interest expense increased due to

70
an increase in equipment expenses and increases in salaries and benefits. The increase in salaries and benefits is related to our new staffing for branching and credit administration and normal raises for our existing officers and employees.
NET INTEREST INCOME
Net interest income is the most significant component of the Company’s earnings. Net interest income is the difference between interest and fees realized on earning assets, primarily loans and securities, and interest paid on deposits and other borrowed funds. The net interest margin is this difference expressed as a percentage of average earning assets. Net interest income is affected by several factors, including the volume of earning assets and liabilities, the mix of earning assets and liabilities, and interest rates. The discussion below is presented on a tax equivalent basis which management believes to be the best way to analyze net interest income.
Net interest income on a tax equivalent basis was $29,229,000, $29,978,000 and $31,563,000 for the years 2013, 2012 and 2011, respectively. Net interest margin was 3.59%, 3.93% and 4.20% for the same periods. During 2013, the yields on interest earning assets declined more than the rates paid on interest bearing deposits with the largest decrease occurring in the rates paid on certificates of deposit. For the year ended December 31, 2013, the average yield on earnings assets was 4.08%, a decrease of 58 basis points compared to the average yield at December 31, 2012. The average rate paid on interest-bearing liabilities was 0.60%, a decrease of 28 basis points compared to the average rate at December 31, 2012. The volume of earning assets increased 6.9% while the volume of interest-bearing liabilities increased 5.2% in 2013.
For the year ended December 31, 2012, the average yield on earnings assets was 4.66%, a decrease of 42 basis points compared to the average yield at December 31, 2011. The average rate paid on interest-bearing liabilities was 0.88%, a decrease of 15 basis points compared to the average rate at December 31, 2011. The volume of earning assets increased 1.4% while the volume of interest-bearing liabilities decreased 0.2% in 2012.
For the year ended December 31, 2011, the average yield on earnings assets was 5.08%, a decrease of 9 basis points compared to the average yield at December 31, 2010. The average rate paid on interest-bearing liabilities was 1.03%, a decrease of 27 basis points compared to the average rate at December 31, 2010. The volume of earning assets decreased 1.3% while the volume of interest-bearing liabilities decreased 3.3% in 2011.
During this three-year period, loan demand was weak in 2011 and 2012 before improving in 2013. Loans generally provide the Company with yields that are greater than the yields on typical investment securities.
During 2003, the Company purchased $11.4 million of additional bank-owned life insurance. The income received by the Company on these policies increased the Company’s total investment to approximately $20.4 million at December 31, 2011, $21.2 million at December 31, 2012 and $22.2 million at December 31, 2013. The additional purchases were

71
made to provide a future funding source for certain of the Company’s deferred compensation arrangements. Such insurance also offers more attractive yields than other investment securities.
Table 2 – Average Balance Sheets and Interest Rates sets forth average balance sheet data, including all major categories of interest-earning assets and interest-bearing liabilities, together with the interest earned or interest paid and the average yield or average rate paid on each such category for the fiscal years ended December 31, 2013, 2012 and 2011.

72
TABLE 2 – AVERAGE BALANCE SHEETS AND INTEREST RATES (in thousands)
2013 2012 2011 2013 2012 2011 2013 2012 2011Loans: Loans, net of unearned(1) $370,769 $381,234 $407,299 $20,612 $23,247 $25,341 5.56% 6.08% 6.22%
Investment Securities Taxable 328,797 257,073 230,777 7,949 7,326 7,911 2.42% 2.85% 3.43% Tax-exempt 101,543 103,648 94,402 4,696 5,028 4,904 4.62% 4.85% 5.19% Total Investment Securities 430,340 360,721 325,179 12,645 12,354 12,815 2.94% 3.42% 3.94%
Federal Funds Sold and Other 14,882 21,086 19,821 40 51 49 0.27% 0.24% 0.25%
Total Interest Earning Assets(1)(2) 815,991 763,041 752,299 33,297 35,652 38,205 4.08% 4.67% 5.08%
Non-Earning Assets 66,294 79,415 101,646
Total Assets $882,285 $842,456 $853,945
Deposits: Interest-bearing Demand Deposits $240,524 $191,930 $170,323 $527 $739 $802 0.22% 0.39% 0.47% Savings 49,933 44,777 39,497 76 99 130 0.15% 0.22% 0.33% Time 239,104 248,886 234,892 1,307 1,838 2,278 0.55% 0.74% 0.97% Total Deposits 529,561 485,593 444,712 1,910 2,676 3,210 0.36% 0.55% 0.72%
Borrowed Funds Short-term Borrowings 85,804 79,002 114,000 666 754 1,075 0.78% 0.95% 0.94% Long-term Borrowings 58,048 75,256 82,327 1,469 2,244 2,356 2.53% 2.98% 2.86%Total Borrowed Funds 143,852 154,258 196,327 2,135 2,998 3,431 1.48% 1.94% 1.75% Total Interest-Bearing Liabilities 673,413 639,851 641,039 4,045 5,674 6,641 0.60% 0.88% 1.03%
Non-Interest Bearing Liabilities Demand Deposits 120,457 107,130 116,895 Other Liabilities 8,957 7,503 9,932 Shareholders' Equity 79,458 87,972 86,079 Total Liabilities and Shareholders' Equity $882,285 $842,456 $853,945
Interest Rate Spread 3.48% 3.79% 4.05%
Net Interest Margin $29,252 $29,978 $30,719 3.58% 3.79% 4.05%
Less Tax Equivalent Adjustment 1,193 1,278 1,296
Net Interest Income $28,059 $28,700 $30,317
Income/ExpenseAverage Balance Average Yield/Rate

73
(1) Overdrafts on demand deposit accounts are not included in the average volume calculation as they are not considered interest earning assets by the Company. They are included in the “Non-Earning Assets” balance above.
(2) Earning Assets in Table 2 does not include the dividend paying stock of the Federal Home Loan Bank.
(3) Demand deposits are not included in the average volume calculation as they are not interest bearing liabilities. They are included within the non-interest bearing liabilities section above.
Table 3 – Net Average Interest Earning Assets illustrates net interest earning assets and liabilities for 2013, 2012, and 2011.
TABLE 3 – NET AVERAGE INTEREST EARNING ASSETS (in thousands)
2013 2012 2011
Average interest earning assets 815,991$ 763,041$ 752,299$ Average interest bearing liabilities 673,413 639,851 641,039
Net average interest earning assets 142,578$ 123,190$ 111,260$

74
Table 4 – Volume/Rate Analysis depicts the effect on interest income and interest expense of changes in volume and changes in rate from 2011 through 2013. Variances, which were attributable to both volume and rate, are allocated proportionately between rate and volume using the absolute values of each for a basis for the allocation. Non-accruing loans are included in the average loan balances used in determining the yields. Interest income on tax-exempt securities and loans has been adjusted to a tax equivalent basis using a federal income tax rate of 34%.
TABLE 4 – VOLUME/RATE ANALYSIS (in thousands)
Volume Rate Total Volume Rate TotalINTEREST INCOME
Loans (582)$ (2,053) (2,635)$ (1,585)$ (509)$ (2,094)$ Taxable Securities 1,734 (1,111) 623 749 (1,334) (585) Non-Taxable Securities (97) (235) (332) 449 (325) 124 Federal Funds Sold and Other (17) 6 (11) 3 (1) 2
TOTAL INTEREST INCOME 1,038$ (3,393)$ (2,355)$ (384)$ (2,169)$ (2,553)$
INTEREST EXPENSE
Interest-bearing demand deposits 106$ (318) (212) 83$ (146)$ (63) Savings Deposits 8 (31) (23) 12 (43) (31) Time Deposits (53) (478) (531) 103 (543) (440) Short-term borrowings 53 (141) (88) (334) 13 (321) Long-term borrowings (435) (340) (775) (211) 99 (112)
TOTAL INTEREST EXPENSE (322)$ (1,307)$ (1,629) (347)$ (620)$ (967)
NET INTEREST INCOME 1,360$ (2,086)$ (726)$ (37)$ (1,549)$ (1,586)$
2013 Change from 2012 2012 Change from 2011

75
LOANS
The loan portfolio constitutes the major earning asset of the Company and, in the opinion of management, offers the best alternative for maximizing net interest margin. The Company’s loan personnel have the authority to extend credit under guidelines established and approved by the Board of Directors. Any aggregate credit that exceeds the authority of the loan officer is forwarded to the Board’s loan committee for approval. The loan committee is composed of certain directors, including the Chairman of the Board of Directors. All aggregate loans that exceed the loan committee’s lending authority are presented to the full Board of Directors for ultimate approval or denial. The loan committee not only acts as an approval body to ensure consistent application of the Company’s loan policy but also provides valuable insight through communication and pooling of knowledge, judgment, and experience of its members.
The Company has stated in its loan policy the following objectives for its loan portfolio:
to make loans after sound and thorough credit analysis;
to properly document all loans;
to eliminate loans from the portfolio that are under-priced, high risk or difficult and costly to administer;
to seek good relationships with the customer;
to avoid undue concentrations of loans; and
to keep non-accrual loans to a minimum by aggressive collection policies.
Loan demand in the Company’s market improved in 2013 after declining in 2012 and 2011 due to economic conditions. Although the Company continues to face intense competition for available loans from other financial institutions and the current economic conditions have improved slightly, the Company was able in 2013 to increase the amount of loans outstanding. The impact on the housing market caused by the opening of a casino on the nearby Choctaw Indian Reservation in 1995 is beginning to show less of an impact in the area. Real estate mortgage loans originated by the Company decreased by 8.93%, or $10,347,060 in 2013, by 13.6%, or $18,150,577, in 2012 and by 6.7%, or $9,639,327, in 2011 when compared to the prior year. The decrease in mortgage loans in all years reflects the weakness in the national and local housing markets after seeing normal growth in the previous years.
Commercial and agricultural loans increased by $22,476,553, or 10.6% in 2013, and by $6,229,238 or 3.0% in 2012 and decreased by $11,625,283, or 5.4% in 2011. Commercial, financial and agricultural loans are the largest segment of the loan portfolio and, by nature, bear a higher degree of risk. Management believes the lending practices, policies and procedures applicable to this loan category are adequate to manage any risk represented by the growth of the loans in this category.

76
Consumer loans declined by $1,560,119, or 5.3% in 2013, $7,681,230, or 21.1% in 2012 and $3,010,288, or 7.6% in 2011, compared to the prior year. The Company believes that changes in consumer purchasing habits and the increase in loan sources have affected the growth of this segment of loans.
Table 5 – Loans Outstanding reflects outstanding balances by loan type for the past five years. Additional loan information is presented in Note 5, “Loans,” to the Company’s Consolidated Financial Statements included in this Annual Report.
TABLE 5 – LOANS OUTSTANDING (in thousands)
2013 2012 2011 2010 2009
Commercial, financial and agricultural $232,124 $211,155 $203,458 $217,143 $226,171Real estate - construction 27,224 12,755 13,481 21,838 32,599Real estate - mortgage 105,489 115,837 133,987 143,627 139,357Consumer 27,831 29,391 38,540 39,491 49,393
TOTAL LOANS $392,668 $369,138 $389,466 $422,099 $447,520
AT DECEMBER 31,
Table 6 – Loan Liquidity and Sensitivity to Changes in Interest Rates reflects the maturity schedule or repricing frequency of all loans. Also presented are fixed and variable rate loans maturing after one year.
TABLE 6 – LOAN LIQUIDITY
1 YEAR 1 - 5 OVER 5OR LESS YEARS YEARS Total
Commercial, financial and agricultural $67,015 $155,847 $9,262 $232,124Real estate - construction 12,712 14,181 331 $27,224Real estate - mortgage 28,214 58,105 19,170 $105,489Consumer 14,968 12,506 357 $27,831
Total loans $122,909 $240,639 $29,120 $392,668
LOAN MATURITIES AT DECEMBER 31, 2013

77
1 - 5 OVER 5YEARS YEARS
Fixed rates $230,165 $14,795Variable rates 10,474 14,325
Total loans $240,639 $29,120
SENSITIVITY TO CHANGES IN INTEREST RATES
Each loan the Company makes either has a stated maturity as to when the loan is to be repaid or is subject to an agreement between the Company and the customer governing its progressive reduction. The Company’s policy is that every loan is to be repaid by its stated maturity and not carried as a continuing debt. Generally, the Company requires that principal reductions on a loan must have begun prior to the second renewal date of the loan.
PROVISION FOR LOAN LOSSES AND ASSET QUALITY
The allowance for loan losses represents an amount that in management’s judgment will be adequate to absorb estimated probable losses within the existing loan portfolio. Loans that management determines to be uncollectible are charged against the allowance for loan losses, and subsequent recoveries, if any, are credited to the allowance. Management’s judgment in determining the adequacy of the allowance is based on evaluations of the collectability of specific loans and prior loss experience. Other factors considered by management include specific economic events, general economic conditions and trends, and loan portfolio mix and growth. The allowance for loan losses is subject to close regulatory review from the FDIC and the Mississippi Department of Banking and Consumer Finance and is also a factor in each agency’s determination of our capital adequacy. The estimation of losses in our loan portfolio is susceptible to changes resulting from changes in the financial condition of individual borrowers and economic conditions in the Company’s market area.
The allowance for loan losses is established through a provision for loan losses charged against net income. This expense is determined by a number of factors, including historical loan losses, assessment of specific credit weaknesses within the portfolio, assessment of the prevailing economic climate, and other factors that may affect the overall condition of the loan portfolio. Management utilized these factors to determine the provision for loan losses for each of 2011, 2012 and 2013. The ratio of net loans charged off to average loans was 0.29% in 2013, 0.33% in 2012 and 0.66% in 2011. The chargeoffs in 2011, 2012 and 2013 reflect the weakness of the economy and the continuing local and national high unemployment. Management evaluates the adequacy of the allowance for loan loss on a monthly basis and makes adjustments to the allowance based on this analysis.
The provision for loan losses in 2013 was $2,204,366 compared to $1,545,797 in 2012 and $2,995,426 in 2011. The increase in the provision for 2013 was mainly due to management’s assessment of incurred losses in the loan portfolio including the impact caused by current local and national economic conditions. The Company uses a model that takes into account historical charge-offs and recoveries and applies that to certain loan segments of our
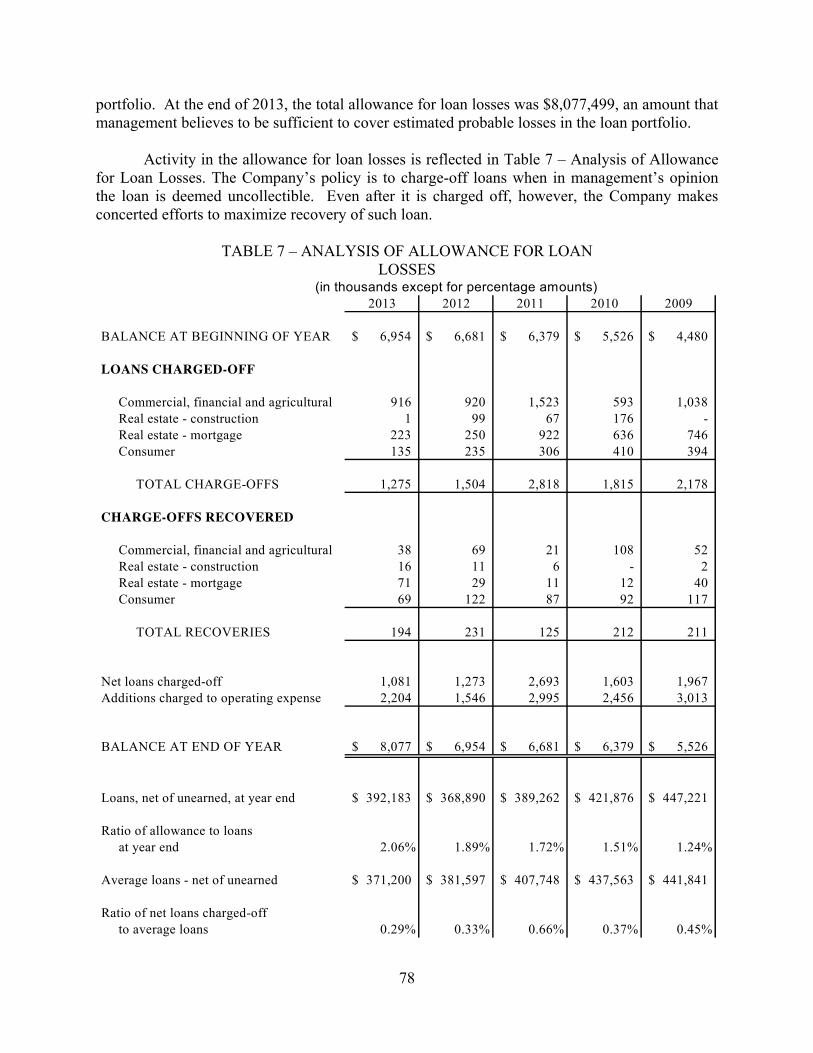
78
portfolio. At the end of 2013, the total allowance for loan losses was $8,077,499, an amount that management believes to be sufficient to cover estimated probable losses in the loan portfolio.
Activity in the allowance for loan losses is reflected in Table 7 – Analysis of Allowance for Loan Losses. The Company’s policy is to charge-off loans when in management’s opinion the loan is deemed uncollectible. Even after it is charged off, however, the Company makes concerted efforts to maximize recovery of such loan.
TABLE 7 – ANALYSIS OF ALLOWANCE FOR LOAN LOSSES
(in thousands except for percentage amounts)2013 2012 2011 2010 2009
BALANCE AT BEGINNING OF YEAR 6,954$ 6,681$ 6,379$ 5,526$ 4,480$
LOANS CHARGED-OFF
Commercial, financial and agricultural 916 920 1,523 593 1,038 Real estate - construction 1 99 67 176 - Real estate - mortgage 223 250 922 636 746 Consumer 135 235 306 410 394
TOTAL CHARGE-OFFS 1,275 1,504 2,818 1,815 2,178
CHARGE-OFFS RECOVERED
Commercial, financial and agricultural 38 69 21 108 52 Real estate - construction 16 11 6 - 2 Real estate - mortgage 71 29 11 12 40 Consumer 69 122 87 92 117
TOTAL RECOVERIES 194 231 125 212 211
Net loans charged-off 1,081 1,273 2,693 1,603 1,967 Additions charged to operating expense 2,204 1,546 2,995 2,456 3,013
BALANCE AT END OF YEAR 8,077$ 6,954$ 6,681$ 6,379$ 5,526$
Loans, net of unearned, at year end 392,183$ 368,890$ 389,262$ 421,876$ 447,221$
Ratio of allowance to loans at year end 2.06% 1.89% 1.72% 1.51% 1.24%
Average loans - net of unearned 371,200$ 381,597$ 407,748$ 437,563$ 441,841$
Ratio of net loans charged-off to average loans 0.29% 0.33% 0.66% 0.37% 0.45%

79
(in thousands)
203 2012 2011 2010 2009
Commercial, financial and agricultural 5,565$ 3,965$ 3,453$ 3,047$ 2,975$ Real estate - construction 495 351 285 434 161 Real estate - mortgage 1,413 1,868 2,111 1,930 1,401 Consumer 604 770 832 968 989
Total 8,077$ 6,954$ 6,681$ 6,379$ 5,526$
AT DECEMBER 31,
ALLOCATION OF ALLOWANCE FOR LOAN LOSSES
2013 2012 2011 2010 2009
Commercial, financial and agricultural 59.11% 57.20% 52.24% 51.44% 50.54%Real estate - construction 6.93% 3.46% 3.46% 5.17% 7.28%Real estate - mortgage 26.86% 31.38% 34.40% 34.03% 31.14%Consumer 7.09% 7.96% 9.90% 9.36% 11.04%
100.00% 100.00% 100.00% 100.00% 100.00%
AT DECEMBER 31,
COMPOSITION OF LOAN PORTFOLIO BY TYPE
Loan balances outstanding, as illustrated in Table 5, declined in 2011 and 2012 as the Company’s credit standards tightened, loan demand weakened and the competition for loans increased. In 2013 loans increased due to increased loan demand even though the Company maintained its tightened credit standards and competition for available loans was still present. The highest percentage increase in 2013 occurred in the construction real estate category, primarily due to an increase in the demand in this market. The allowance for loan losses is allocated to the various categories based on the historical loss percentage for each segment of loan and any specific reserves that might be assigned to those loans.
Non-performing assets and the relative percentages of such assets to loan balances are presented in Table 8 – Non-performing Assets. Non-performing loans include non-accrual loans, loans delinquent 90 days or more based on contractual terms and troubled debt restructurings. Management classifies loans as non-accrual when it believes that collection of interest is doubtful. This typically occurs when payments are past due over 90 days, unless the loans are well secured and in the process of collection. Another measurement of asset quality is other real estate owned (OREO), which represents properties acquired by the Company through foreclosure following loan defaults by customers. The percentage of OREO to total loans at December 31, 2013 was 0.98% compared to 1.29% in 2012. OREO decreased in 2013 after increasing in 2012 and 2011 due to a larger amount of foreclosures in 2011 and the sale of several parcels that were acquired in foreclosure and a write-down of several parcels to fair market value during 2012 and 2013.
Loans on non-accrual status amounted to $13,591,793 in 2013 as compared to $14,141,887 in 2012 and $11,299,060 in 2011. Interest income forgone on loans classified as non-accrual in 2013 was $813,710 as compared to $770,509 in 2012 and $673,858 in 2011.
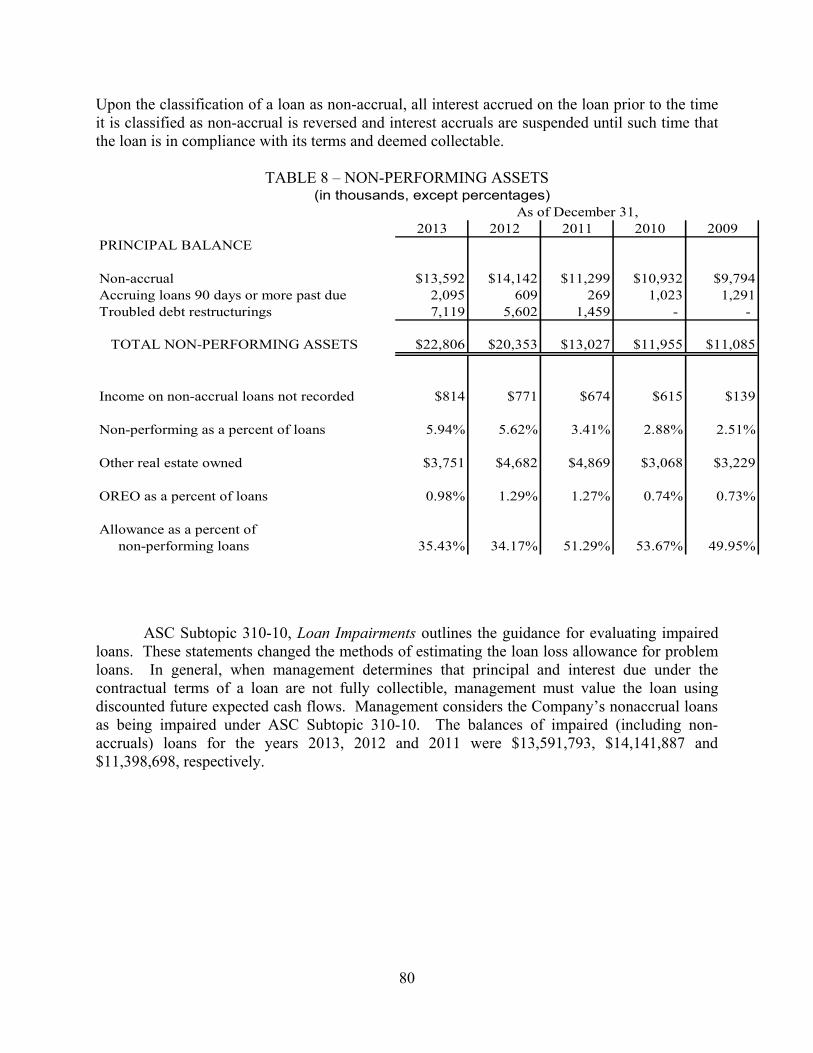
80
Upon the classification of a loan as non-accrual, all interest accrued on the loan prior to the time it is classified as non-accrual is reversed and interest accruals are suspended until such time that the loan is in compliance with its terms and deemed collectable.
TABLE 8 – NON-PERFORMING ASSETS (in thousands, except percentages)
2013 2012 2011 2010 2009PRINCIPAL BALANCE
Non-accrual $13,592 $14,142 $11,299 $10,932 $9,794Accruing loans 90 days or more past due 2,095 609 269 1,023 1,291Troubled debt restructurings 7,119 5,602 1,459 - -
TOTAL NON-PERFORMING ASSETS $22,806 $20,353 $13,027 $11,955 $11,085
Income on non-accrual loans not recorded $814 $771 $674 $615 $139
Non-performing as a percent of loans 5.94% 5.62% 3.41% 2.88% 2.51%
Other real estate owned $3,751 $4,682 $4,869 $3,068 $3,229
OREO as a percent of loans 0.98% 1.29% 1.27% 0.74% 0.73%
Allowance as a percent of non-performing loans 35.43% 34.17% 51.29% 53.67% 49.95%
As of December 31,
ASC Subtopic 310-10, Loan Impairments outlines the guidance for evaluating impaired loans. These statements changed the methods of estimating the loan loss allowance for problem loans. In general, when management determines that principal and interest due under the contractual terms of a loan are not fully collectible, management must value the loan using discounted future expected cash flows. Management considers the Company’s nonaccrual loans as being impaired under ASC Subtopic 310-10. The balances of impaired (including non-accruals) loans for the years 2013, 2012 and 2011 were $13,591,793, $14,141,887 and $11,398,698, respectively.

81
This table details the impaired loans by category for years ending 2013, 2012 and 2011.
AT DECEMBER 31,2013 2012 2011
Commercial, financial and agricultural 11,469,394$ 11,431,714$ 7,763,051$Real estate - construction 136,271 141,917 1,134,329Real estate - mortgage 1,865,718 2,258,167 2,065,784Consumer 120,410 310,089 435,534
Total loans 13,591,793$ 14,141,887$ 11,398,698$
Management monitors any loans that are classified under FDIC regulations as loss, doubtful or substandard, even if management has not classified the loans as non-performing or impaired. In addition to loans classified for regulatory purposes, management also designates certain loans for internal monitoring purposes in a “watch” category. Loans may be placed on management’s watch list as a result of delinquent status, management’s concern about the borrower’s financial condition or the value of the collateral securing the loan, a substandard classification during regulatory examinations, or simply as a result of management’s desire to monitor more closely a borrower’s financial condition and performance. Watch category loans may include loans that are still performing and accruing interest and may be current under the terms of the loan agreement but which management has a significant degree of concern about the borrowers’ ability to continue to perform according to the terms of the loan agreement. Watch category loans may also include loans, which, although adequately secured and performing, reflect a past delinquency problem or unfavorable financial trends exhibited by the borrower. Loss exposure on these loans is typically evaluated based primarily upon the estimated liquidation value of the collateral securing the loan.
At December 31, 2013, loans totaling $40,836,320 were included on the Company’s watch list compared to $42,731,860 at December 31, 2012. The majority of these loans are real estate loans that, although adequately collateralized, have experienced frequent delinquencies in scheduled payments. The inclusion of loans on this list does not indicate a greater risk of loss; rather it indicates that the loan possesses one of the several characteristics described above warranting increased oversight by management.
SECURITIES
At December 31, 2013, the Company classified all of its securities as available-for-sale. Securities available-for-sale are reported at fair value, with unrealized gains and losses included as a separate component of equity, net of tax. The Company does not hold any securities classified as held to maturity or held for trading purposes.
Table 9 – Securities and Securities Maturity Schedule summarizes the carrying value of securities from 2011 through 2013 and the maturity distribution at December 31, 2013, by classification.

82
TABLE 9 – SECURITIES (in thousands)
2013 2012 2011SECURITIES AVAILABLE FOR SALEU. S. Government Agencies $316,305 $269,194 $234,356Mortgage Backed Securities 16,476 36,386 32,435State, County and Muncipal Obligations 96,259 105,301 93,655Other Securities 3,026 3,093 3,093
TOTAL SECURITIES AVAILABLE FOR SALE $432,066 $413,974 $363,539
SECURITIES MATURITY SCHEDULE
1 year or less 1 to 5 years 5 to 10 years over 10 yearsActual Average Actual Average Actual Average Actual Average
Balance Yield Balance Yield Balance Yield Balance YieldAVAILABLE-FOR-SALE U. S. Government Agencies(1) -$ 0.00% 11,438$ 4.46% 79,883$ 2.36% 241,460$ 2.48% State, County and Municipal(2) 2,429 4.98% 13,602 5.01% 26,163 5.62% 54,065 4.84% Other Securities - 0.00% - 0.00% - 0.00% 3,025 5.20%
TOTAL AVAILABLE-FOR-SALE 2,429$ 4.98% 25,040$ 4.76% 106,046$ 3.16% 298,550$ 2.94%
(1) The maturities for the mortgage backed securities included in this line item are based on final maturity.
(2) Average yields were calculated on tax equivalent basis using a marginal federal income tax rate of 34% and a state tax rate of 5%.
The change in the carrying value of the available-for-sale portfolio is due to market value fluctuations resulting from the changing interest rate environment during 2013. This change is not used in the Tier 1 capital calculation.
The above table shows an increase in the U. S. Government Agencies securities and a decrease in the Mortgage Backed Securities and State, County and Municipal classifications. The increase was due to the Company’s effort to increase yields while maintaining credit quality and to purchase securities for our commercial repurchase agreement program with certain customers. As a result of this commercial repurchase agreement program, the Company increased its margin on the balances in this program. The Company strives to maximize the yields on its portfolio while balancing pledging needs and managing risk. The Company seeks to invest most of it funds not needed for loan demand in higher yielding securities and not in the lower yielding federal funds sold.

83
DEPOSITS
The Company offers a wide variety of deposit services to individual and commercial customers, such as non-interest-bearing and interest-bearing checking accounts, savings accounts, money market deposit accounts and time deposits. The deposit base is the Company’s major funding source for earning assets. Time deposits decreased in 2013 due to customers desiring to stay short and liquid with their deposits and increased in 2012 due to the pricing strategy of the Company to manage liquidity needs. During this time, all other segments of deposits increased.
A three-year schedule of average deposits by type and maturities of time deposits greater than $100,000 is presented in Table 10 – Deposit Information.
TABLE 10 – DEPOSIT INFORMATION (in thousands, except percentages)
2011Average Average Average Average Average AverageBalance Rate Balance Rate Balance Rate
Noninterest-bearing $120,457 $107,130 $98,131Interest-bearing demand 240,524 0.22% 191,930 0.39% 170,323 0.47%Savings 49,933 0.15% 44,777 0.22% 40,365 0.33%Time deposits 239,104 0.55% 248,886 0.74% 234,892 0.97%
$650,018 0.30% $592,723 0.55% $543,711 0.59%
2013 2012
MATURITY RANGES OF TIME DEPOSITS OF $100,000 OR MORE
3 months or less $31,6793 through 12 months 75,6921 year to 3 years 17,515over 3 years -
$124,886
AS OF DECEMBER 31, 2013
The Company, in its normal course of business, will acquire large time deposits, generally from public entities, with a variety of maturities. These funds are acquired on a bid basis and are considered to be part of the deposit base of the Company.
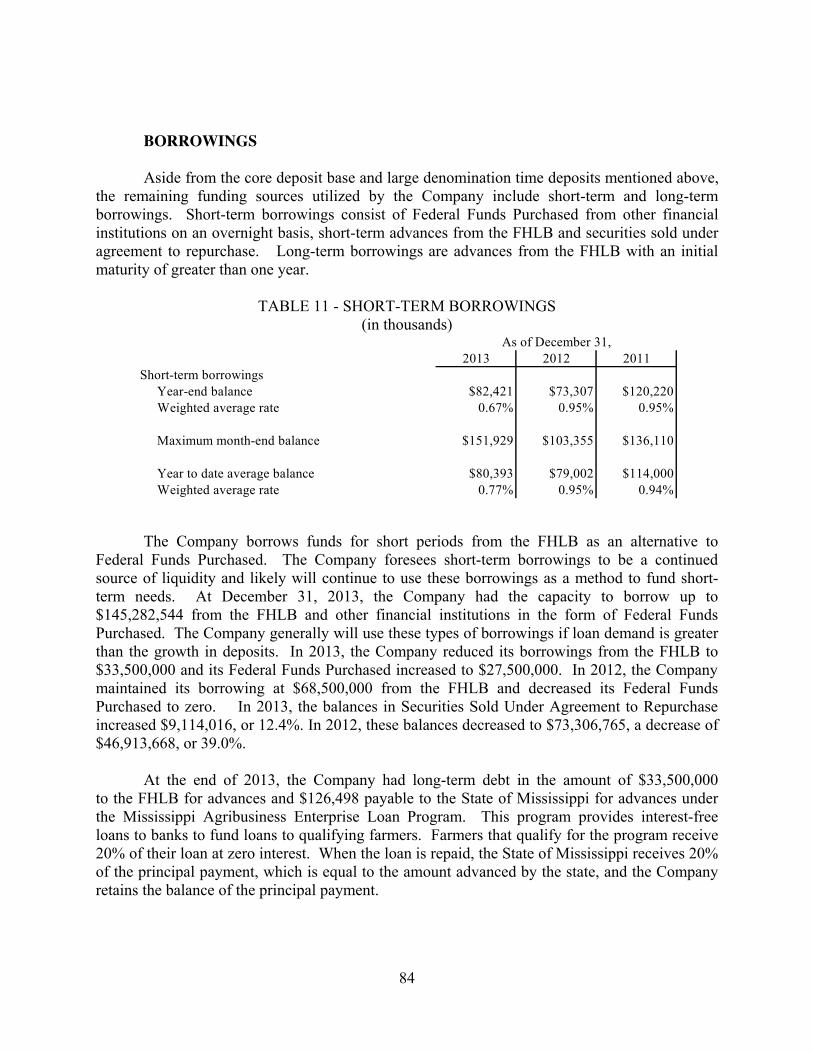
84
BORROWINGS
Aside from the core deposit base and large denomination time deposits mentioned above, the remaining funding sources utilized by the Company include short-term and long-term borrowings. Short-term borrowings consist of Federal Funds Purchased from other financial institutions on an overnight basis, short-term advances from the FHLB and securities sold under agreement to repurchase. Long-term borrowings are advances from the FHLB with an initial maturity of greater than one year.
TABLE 11 - SHORT-TERM BORROWINGS (in thousands)
2013 2012 2011Short-term borrowings Year-end balance $82,421 $73,307 $120,220 Weighted average rate 0.67% 0.95% 0.95%
Maximum month-end balance $151,929 $103,355 $136,110
Year to date average balance $80,393 $79,002 $114,000 Weighted average rate 0.77% 0.95% 0.94%
As of December 31,
The Company borrows funds for short periods from the FHLB as an alternative to Federal Funds Purchased. The Company foresees short-term borrowings to be a continued source of liquidity and likely will continue to use these borrowings as a method to fund short-term needs. At December 31, 2013, the Company had the capacity to borrow up to $145,282,544 from the FHLB and other financial institutions in the form of Federal Funds Purchased. The Company generally will use these types of borrowings if loan demand is greater than the growth in deposits. In 2013, the Company reduced its borrowings from the FHLB to $33,500,000 and its Federal Funds Purchased increased to $27,500,000. In 2012, the Company maintained its borrowing at $68,500,000 from the FHLB and decreased its Federal Funds Purchased to zero. In 2013, the balances in Securities Sold Under Agreement to Repurchase increased $9,114,016, or 12.4%. In 2012, these balances decreased to $73,306,765, a decrease of $46,913,668, or 39.0%.
At the end of 2013, the Company had long-term debt in the amount of $33,500,000 to the FHLB for advances and $126,498 payable to the State of Mississippi for advances under the Mississippi Agribusiness Enterprise Loan Program. This program provides interest-free loans to banks to fund loans to qualifying farmers. Farmers that qualify for the program receive 20% of their loan at zero interest. When the loan is repaid, the State of Mississippi receives 20% of the principal payment, which is equal to the amount advanced by the state, and the Company retains the balance of the principal payment.

85
The remaining maturity schedule of the long-term debt at December 31, 2013 is listed below.
(in thousands)2013
Less than one year $13,508One year to three years 13Over three years 20,105
Total long-term borrowings $33,626
NON-INTEREST INCOME AND EXPENSE
Table 12 - Non-Interest Income and Expense illustrates the Company’s non-interest income and expense from 2011 through 2013 and percentage changes between such years.
TABLE 12 - NON-INTEREST INCOME & EXPENSE (in thousands)
% CHANGE % CHANGE2013 FROM '12 2012 FROM '11 2011
NON-INTEREST INCOMEService charges on deposit accounts 3,885$ 4.94% 3,702$ 0.35% 3,689$ Other operating income 3,931 6.24% 3,700 -1.41% 3,753
TOTAL NON-INTEREST INCOME 7,816$ 5.59% 7,402$ -0.54% 7,442$
NON-INTEREST EXPENSESalaries and employee benefits 13,111$ -4.56% 13,737$ -2.28% 14,057$ Occupancy expense, including equipment 4,396 -2.05% 4,488 4.15% 4,309 Other operating expense 7,221 -8.30% 7,875 -0.04% 7,878
TOTAL NON-INTEREST EXPENSE 24,728$ -5.26% 26,100$ -0.55% 26,244$
Non-interest income typically consists of service charges on checking accounts, including debit card fees, and other financial services. With continued pressure on interest rates, the Company has sought to increase its non-interest income through the expansion of fee income and the development of new services. Currently, the Company’s main sources of non-interest income are service charges on checking accounts, safe deposit box rentals, credit life insurance premiums and title insurance service fees.
During 2013, non-interest income increased by $414,323, or 5.59%, when compared to 2012. An increase in other income and service charge income from checking accounts was partially offset by a decrease in proceeds from gains on sales of investment securities.
During 2012, non-interest income decreased by $40,600, or 0.55%, when compared to 2011. An increase in other income and service charge income from checking accounts was offset by a decrease in proceeds from gains on sales of investment securities.
86
During 2011, non-interest income increased by $33,813, or 0.45%, when compared to 2010. An increase in other income and proceeds from gains on sales of investment securities was offset by a decrease in service charge income from checking accounts.
Non-interest expenses consist of salaries and benefits, occupancy expense and other overhead expenses incurred by the Company in the transaction of its business. In 2013, non-interest expense decreased by $1,372,356, or 5.3%, to $24,727,611. Included in this decrease was a reduction in salaries and benefits in the amount of $626,336, or 4.6% and a decrease in occupancy expense in the amount of $91,704, or 2.0%. The decrease in occupancy expense is related to cost savings and the closing of a branch in Meridian, Mississippi in 2013.
In 2012, non-interest expense decreased by $143,653, or 0.55%, to $26,099,967. Included in this was a decrease in salaries and benefits in the amount of $319,597, or 2.3% and an increase in occupancy expense in the amount of $80,710, or 4.2%. The increase in occupancy expense is related to cost increases and the addition of a branch in Flowood, Mississippi in 2012.
In 2011, non-interest expense increased by $1,123,880, or 4.47%, to $26,243,620. Included in this was an increase in salaries and benefits in the amount of $276,148, or 2.0% and an increase in occupancy expense in the amount of $504,188, or 13.3%. The increase in occupancy expense is in part related to the opening of the new branch building in Hattiesburg.
In 2013, the Company’s efficiency ratio was 67.52%, compared to 70.73% in 2012 and 68.51% in 2011. The efficiency ratio is calculated to measure the cost of generating one dollar of revenue. The efficiency ratio is calculated by dividing non-interest expense by the sum of net interest income, on a fully tax equivalent basis, and non-interest income. The overall increase in the efficiency ratio over the past three years reflects increases in non-interest expense associated with managing the growth in assets during the period.
INCOME TAXES
The Company records a provision for income taxes currently payable, along with a provision for deferred taxes to be realized in the future. Such deferred taxes arise from differences in timing of certain items for financial statement reporting rather than income tax reporting. The deferred tax amount of $17,794,280 is considered realizable without the use of extraordinary tax planning strategies.
The Company’s effective tax rate was 19.84%, 19.57% and 15.43% in 2013, 2012 and 2011, respectively. The major difference between the effective tax rate applied to the Company’s financial statement income and the federal statutory rate of 34% is interest on tax-exempt securities and loans. Further tax information is disclosed in Note 10, “Income Taxes” to the Company’s Consolidated Financial Statements included in this Annual Report.

87
LIQUIDITY AND RATE SENSITIVITY
Liquidity management is the process by which the Company ensures that adequate liquid funds are available to meet its financial commitments on a timely basis. These commitments include honoring withdrawals by depositors, funding credit obligations to borrowers, servicing long-term obligations, making shareholder dividend payments, paying operating expenses, funding capital expenditures and maintaining reserve requirements.
The Company’s predominant sources of funding include: core deposits (consisting of both commercial and individual deposits); proceeds from maturities of securities; repayments of loan principal and interest; Federal Funds Purchased; and short-term and long-term borrowing from the FHLB. In 2013, the Company experienced an increase in deposits and an increase in loans outstanding. The decrease in investment securities is mainly the result of the decrease in market value brought about by the increase in medium term investment interest rates. The Company relies upon non-core sources of funding, such as Federal Funds Purchased and short and long term borrowings from the FHLB, when deposit growth is not adequate to meet its short term needs. While the strategy of using these wholesale funding sources is adequate to cover liquidity deficiencies in the short term, the Company’s goal is to increase core deposits as a source of long term funding. Management does not intend to rely on borrowings from the FHLB as the first choice as a source of funds but prefers to increase core deposits through increased competition for available deposits. Management believes that core deposits can be increased by offering more competitive rates and superior service to our customers.
The Company paid off $45 million of FHLB advances that matured during 2013 and will continue to pay off advances at maturity if they are no longer needed to maintain the Company’s liquidity position.
The deposit base is diversified between individual and commercial accounts, which the Company believes helps it avoid dependence on large concentrations of funds. The Company does not solicit certificates of deposit from brokers. The primary sources of liquidity on the asset side of the balance sheet are federal funds sold and securities classified as available-for-sale. The entire investment securities portfolio is classified in the available-for-sale category, and is available to be sold, should liquidity needs arise. Management, through its Asset Liability Committee (“ALCO”), and the Board review the Company’s liquidity position on a monthly basis. At December 31, 2013, both the ALCO and the Board of Directors determined that the Company’s liquidity position was adequate.

88
Table 13 - Funding Uses and Sources details the main components of cash flows for 2013 and 2012.
TABLE 13 - FUNDING USES AND SOURCES (in thousands)
2013 2012
Average Increase/(decrease) Average Increase/(decrease)Balance Amount Percent Balance Amount Percent
FUNDING USES
Loans, net of unearned income 370,769$ (10,465)$ -2.75% 381,234$ (26,065)$ -6.40% Taxable securities 328,797 71,724 27.90% 257,073 26,296 11.39% Tax-exempt securities 101,543 (2,105) -2.03% 103,648 9,246 9.79% Federal funds sold and other 14,881 (6,205) -29.43% 21,086 1,265 6.38%
TOTAL USES 815,990$ 52,949$ 6.94% 763,041$ 10,742$ 1.43%
FUNDING SOURCES
Noninterest-bearing deposits 120,457$ 13,327$ 12.44% 107,130$ 8,999$ 9.17% Interest-bearing demand and savings deposits 290,457 53,750 22.71% 236,707 26,888 12.81% Time deposits 239,104 (9,782) -3.93% 248,886 13,994 5.96% Short-term borrowings 5,411 2,511 86.59% 2,900 870 42.86% Commercial repo 80,393 1,391 1.76% 79,002 (32,968) -29.44% Long-term debt 58,048 (14,308) -19.77% 72,356 (10,146) -12.30%
TOTAL SOURCES 793,870$ 46,889$ 6.23% 753,096$ 7,637$ 1.01%
The Company’s liquidity depends substantially on the ability of the Bank to transfer funds to the Company in the form of dividends. The information under the heading “Market Price and Dividend Information” in this Annual Report discusses federal and state statutory and regulatory restrictions on the ability of the Bank to transfer funds to the Company in the form of dividends.
CAPITAL RESOURCES
The Company and Bank are subject to various regulatory capital guidelines as required by federal and state banking agencies. These guidelines define the various components of core capital and assign risk weights to various categories of assets.
The Federal Deposit Insurance Corporation Improvement Act of 1991 (“FDICIA”) required federal regulatory agencies to define capital tiers. These tiers are: well capitalized, adequately capitalized, undercapitalized, significantly undercapitalized, and critically undercapitalized. Under FDICIA, a “well-capitalized” institution must achieve a Tier 1 risk-based capital ratio of at least 6.00%, a total capital ratio of at least 10.00%, a leverage ratio of at least 5.00% and not be under a capital directive order. These ratios generally measure the percentage of a bank’s capital to all or certain categories of assets. Failure to meet capital requirements can initiate regulatory action that could have a direct material effect on the
89
Company’s financial statements. If a bank is only adequately capitalized, regulatory approval is required before the bank may accept brokered deposits. If undercapitalized, capital distributions, asset growth, and expansion are limited, and the institution is required to submit a capital restoration plan.
During 2013, total capital increased primarily due to earnings that were in excess of dividends.
Management believes the Company and the Bank meet all the capital requirements to be well-capitalized under the guidelines established by FDICIA as of December 31, 2013, as noted below in Table 14 - Capital Ratios. To be classified as well-capitalized, the Company and Bank must maintain the ratios described above.

90
TABLE 14 – CAPITAL RATIOS (in thousands, except percentage amounts)
2013 2012 2011Tier 1 capital Shareholders' equity 66,266$ 88,869$ 86,082$ Less: Intangibles (3,150) (3,150) (3,229) Add/less: Unrealized loss/(gain) on securities 21,249 (4,348) (4,443)
TOTAL TIER 1 CAPITAL 84,365$ 81,371$ 78,410$
Total capital Tier 1 capital 84,365$ 81,371$ 78,410$ Allowable allowance for loan losses 6,517 6,008 6,030
TOTAL CAPITAL 90,882$ 87,379$ 84,440$
RISK WEIGHTED ASSETS 519,766$ 479,658$ 481,784$
AVERAGE ASSETS (FOURTH QUARTER) 875,659$ 848,966$ 828,295$
RISK BASED RATIOS TIER 1 16.23% 16.96% 16.27%
TOTAL CAPITAL 17.49% 18.22% 17.53%
LEVERAGE RATIOS 9.63% 9.58% 9.47%
At December 31,
Management’s strategy with respect to capital levels is to maintain a sufficient amount of capital to allow the Company to respond to growth and acquisition opportunities in our service area. Over the past three years, the Company has been able to increase the amount of its capital, through retention of earnings, while still increasing the dividend payout ratio to approximately 59.9% of earnings per share. The Company does not currently have any commitments for capital expenditures that would require the Company to raise additional capital by means other than retained earnings. The Company does not plan to change this strategy unless needed to support future acquisition activity.
OFF-BALANCE SHEET ARRANGEMENTS
In the ordinary course of business, the Company makes various commitments and incurs certain contingent liabilities to fulfill the financing needs of its customers. These commitments and contingent liabilities include commitments to extend credit and issue standby letters of credit. These off-balance sheet arrangements are further detailed in Note 13, “Off-Balance Sheet Financial Instruments, Commitments and Contingencies and Concentrations of Risks,” in the notes to the Company’s Consolidated Financial Statements included in this Annual Report.

91
CONTRACTUAL OBLIGATIONS
The following table summarizes the contractual obligations of the Company as of December 31, 2013.
Payments Due by Period (in thousands)
Less than 1-3 3 - 5 Over 5Contractual Obligations Total 1 year Years Years Years
Long Term Debt 33,500$ 13,500$ -$ 20,000$ -$ Operating Leases 1,967 453 757 757 - Other Long-term Liabilities 126 8 13 105 -
Total 35,593$ 13,961$ 770$ 20,862$ -$
Long-term debt obligations represent borrowings from the FHLB that have an original maturity in excess of one year. Operating leases are primarily for the lease of ATM machines and other leases for mailing equipment. The equipment leases are for various terms. The other long-term liabilities are those obligations of the Company under the Agribusiness Enterprise Loan Program of the State of Mississippi.
QUANTITATIVE AND QUALITATIVE DISCLOSURES ABOUT MARKET RISK
OVERVIEW
The definition of market risk is the possibility of loss that could result from adverse changes in market prices or interest rates. The Company has taken steps to assess the amount of risk that is associated with its asset and liability structure. The Company measures the potential risk on a regular basis and makes changes to its strategies to manage these risks. The Board of Directors reviews important policy limits each month, with a more detailed risk analysis completed on a quarterly basis. These measurement tools are important in allowing the Company to manage market risk and to plan effective strategies to respond to any adverse changes in risk. The Company does not participate in some of the financial instruments that are inherently subject to substantial market risk. All of the financial instruments entered into by the Company are for purposes other than trading.

92
MARKET/INTEREST RATE RISK MANAGEMENT
Interest rate risk is the primary market risk that management must address. Interest rate risk is the exposure of Company earnings and capital to changes in interest rates. All financial institutions assume interest rate risk as an integral part of normal operations.
The primary purpose in managing interest rate risk is to effectively invest capital and preserve the value created by the core banking business of the Company. The Company utilizes an investment portfolio to manage the interest rate risk naturally created through its business activities. The process of managing interest rate risk generally involves both reducing the exposure of the Company’s net interest margin to swings in interest rates and concurrently ensuring that there is sufficient capital and liquidity to support balance sheet growth. The Company uses a quarterly interest rate risk report to evaluate its exposure to interest rate risk, project earnings and manage the composition of the balance sheet and its growth.
In addition to the quarterly interest rate risk report, the Company employs a number of tools to measure interest rate risk. One tool is static gap analysis, which matches assets with specified maturities to liabilities with corresponding maturities. Although management believes that this does not provide a complete picture of the Company’s exposure to interest rate risk, it does highlight significant short-term repricing volume mismatches. The following table presents the Company’s rate sensitivity static gap analysis at December 31, 2013 ($ in thousands):
90 days One year
Total rate sensitive assets $ 282,344 $ 136,015 Total rate sensitive liabilities 480,271 141,354
Net gap $ (197,927) $ (5,339)
Interest Sensitive Within
The analysis shows a negative gap position over the next three-month period, which indicates that the Company would benefit somewhat from a decrease in market interest rates in the very short term. Although rate increases would be detrimental to the interest rate risk of the Company, management believes there is adequate flexibility to alter the overall rate sensitivity structure as necessary to minimize exposure to these changes.
Management believes that static gap analysis does not fully capture the impact of interest rate movements on interest sensitive assets and liabilities. Thus, the Company also measures interest rate risk by analyzing interest rate sensitivity and the rate sensitivity gap. Table 15 - Interest Rate Sensitivity provides additional information about the financial instruments that are sensitive to changes in interest rates. This tabular disclosure is limited by its failure to depict accurately the effect on assumptions of significant changes in the economy or interest rates or changes in management’s expectations or intentions relating to the Company’s financial statements. The information in the interest rate sensitivity table below reflects contractual interest rate pricing dates and contractual maturity dates. For indeterminate maturity deposit products (money market, NOW and savings accounts), the tables present principal cash flows in

93
the shortest term. Although these deposits may not reprice within this time frame, the depositors of such funds have the ability to reprice. Weighted average floating rates are based on the rate for that product as of December 31, 2013 and 2012.
TABLE 15 - INTEREST RATE SENSITIVITY AS OF DECEMBER 31, 2013 (in thousands)
Carrying Fair2014 2015 2016 2017 2018 Thereafter Value Value
Loans Fixed Rate $95,488 $43,725 $72,563 $58,242 $55,638 $14,795 $340,451 $341,472 Average Int Rate 5.58% 6.26% 5.28% 5.13% 4.66% 6.10% 6.36% Floating Rate $27,418 $1,275 $318 $4,611 $4,270 $14,325 $52,217 $52,217 Average Int Rate 4.36% 4.17% 3.93% 5.64% 4.41% 5.04% 4.66%Investment securities Fixed Rate $2,429 $4,241 $3,984 $7,975 $8,841 $401,570 $429,040 $395,410 Average Int Rate 4.98% 4.96% 4.69% 3.99% 5.40% 4.08% 3.31% Floating Rate $3,025 $3,025 $2,766 Average Int Rate 5.20% 5.20%Other earning assets Fixed Rate $684 $684 $684 Average Int Rate 0.25% 0.25% Floating Rate Average Int Rate
Interest-bearing deposits Fixed Rate $498,458 $33,234 $2,359 $57 $97 $0 $534,205 $534,419 Average Int Rate 0.31% 0.60% 0.55% 0.55% 0.55% 0.00% 0.41% Floating Rate Average Int RateOther int-bearing liabilities Fixed Rate $13,500 $20,000 $33,500 $34,622 Average Int Rate 1.33% 2.53% 2.05% Floating Rate $82,421 $82,421 $82,421 Average Int Rate 0.67% 0.67%

94
AS OF DECEMBER 31, 2012 (in thousands)
Carrying Fair2013 2014 2015 2016 2017 Thereafter Value Value
Loans Fixed Rate $81,620 $70,011 $37,618 $74,860 $31,746 $22,162 $318,017 $318,196 Average Int Rate 6.07% 6.50% 6.33% 5.70% 4.99% 6.68% 6.36% Floating Rate $19,427 $12,273 $472 $252 $4,646 $14,051 $51,121 $51,121 Average Int Rate 4.72% 4.74% 4.15% 4.53% 5.71% 5.10% 4.91%Investment securities Fixed Rate $2,083 $2,450 $5,172 $23,569 $15,442 $362,165 $410,880 $418,101 Average Int Rate 3.90% 4.92% 4.88% 3.34% 5.13% 3.19% 3.31% Floating Rate $3,093 $3,093 $2,807 Average Int Rate 4.16% 4.16%Other earning assets Fixed Rate $16,229 $16,229 $16,229 Average Int Rate 0.25% 0.25% Floating Rate Average Int Rate
Interest-bearing deposits Fixed Rate $574,970 $48,440 $3,970 $13 $56 $0 $522,603 $522,816 Average Int Rate 0.31% 0.64% 0.79% 0.60% 0.60% 0.00% 0.41% Floating Rate Average Int RateOther int-bearing liabilities Fixed Rate $45,000 $3,500 $20,000 $68,500 $70,845 Average Int Rate 3.37% 4.67% 2.53% 3.19% Floating Rate $73,307 $73,307 $73,307 Average Int Rate 0.95% 0.95%
Rate sensitivity gap analysis is another tool management uses to measure interest rate risk. The rate sensitivity gap is the difference between the repricing of interest-earning assets and the repricing of interest-bearing liabilities within certain defined time frames. The Company’s interest rate sensitivity position is influenced by the distribution of interest-earning assets and interest-bearing liabilities among the maturity categories. Table 16 - Rate Sensitivity Gap reflects interest-earning assets and interest-bearing liabilities by maturity distribution as of December 31, 2013. Product lines repricing in time periods predetermined by contractual agreements are included in the respective maturity categories.

95
TABLE 16 - RATE SENSITIVITY GAP AT DECEMBER 31, 2013 (in thousands, except percentage amounts)
1 - 90 91 - 365 1 - 5 OverDays Days Years 5 years Total
INTEREST EARNING ASSETS
Loans 55,750$ 59,863$ 226,143$ 27,581$ 369,337$ Investment securities 225,910 76,152 53,588 42,526 398,176 Interest Bearing Due From Bank Accounts 684 - - - 684
TOTAL INTEREST BEARING ASSETS 282,344$ 136,015$ 279,731$ 70,107$ 768,197$
INTEREST BEARING LIABILITIES
Interest bearing demand deposits 231,542$ -$ -$ -$ 231,542$ Savings and Money Market deposits 69,957 - - - 69,957 Time deposits 58,851 137,854 35,740 - 232,445 Short term borrowings 109,921 - - - 109,921 Long term borrowings 10,000 3,500 20,126 - 33,626
TOTAL INTEREST BEARING LIABILITIES 480,271$ 141,354$ 55,866$ -$ 677,491$
Rate sensitive gap (197,927)$ (5,339)$ 223,865$ 70,107$ 90,706$ Rate sensitive cumulative gap (197,927) (203,266) 20,599 90,706 - Cumulative gap as a percentage of total earning assets -25.77% -26.46% 2.68% 11.81%
The purpose of the above table is to measure interest rate risk utilizing the repricing intervals of interest sensitive assets and liabilities. Rate sensitive gaps constantly change as funds are acquired and invested and as rates change. Rising interest rates are likely to increase net interest income in a positive gap position while falling interest rates are beneficial in a negative gap position.
The above rate sensitivity analysis places interest-bearing demand and savings deposits in the shortest maturity category because these liabilities do not have defined maturities. If these deposits were placed in a maturity distribution representative of the Company’s deposit base history, the shortfall of the negative rate sensitive gap position would be reduced in the 1-to-90 day time frame. It is the goal of the Company to achieve a cumulative gap ratio of plus or minus 15% for all periods under one year, with maximum acceptable limits of plus or minus 20%. Quarterly, management discusses with the ALCO and the board of directors the gap position in relation to the established goals, highlights any reasons for variances from the goals and suggests

96
changes to better align the Company’s position with the established goals. When reviewing the Company’s position, impacting factors and suggested changes, the board of directors also considers other corporate objectives, including increasing core deposits and increasing profitability, before implementing changes intended to align the Company’s position with the established goals. While the board of directors continues to closely monitor the Company’s negative gap position, at this time, management does not anticipate making any significant changes to the Company’s operating practices in order to mitigate the negative gap position.
The rate sensitivity gap table illustrates that the Company had a large negative cumulative gap position for the one-year period as of December 31, 2013. This negative gap position was mainly due to: (1) the interest-bearing and savings deposits being classified in the 1-90 day category; (2) approximately 84.6% of certificates of deposit maturing during the next twelve months; and (3) a significant portion of the Company’s loans maturing after one year.
The interest rate sensitivity and rate sensitivity gap tables, taken together, indicate that the Company continues to be in a liability sensitive position when evaluating the maturities of interest-bearing items. Thus, a decline in the interest rate environment would enhance earnings, while an increase in interest rates would have the opposite effect on the Company’s earnings. The Company has attempted to mitigate the impact of its interest rate position by increasing the amount of its variable rate loans and also by structuring deposit rates to entice customers to shorten the maturities of their time deposits. The effect of any changes in interest rates on the Company would be mitigated by the fact that interest-bearing demand and savings deposits may not be immediately affected by changes in general interest rates.
Short term interest rates decreased in 2011 and remained low in 2012 and 2013 in connection with decreases in the target Federal Funds rate by the Federal Reserve Bank. However during 2013, medium term interest rates increased in anticipation of the ending of bond buying program by the Federal Reserve Bank. Overall, the effect on the Company was marginal. The Company’s net interest margin in 2013 was 3.58% and in 2012 was 3.93%.

97
Quarterly Financial Trends (in thousands, except per share amounts)
First Quarter Second Quarter Third Quarter Fourth QuarterInterest Income 7,987$ 7,992$ 8,078$ 8,059$ Interest Expense 1,232 1,185 826 837 Net Interest Income 6,755 6,807 7,252 7,222 Provision for Loan Losses 175 574 1,080 375 Non-interest Income 1,681 1,929 2,183 2,023 Non-interest Expense 6,557 6,147 5,850 6,174 Income Taxes 290 410 497 573 Net Income 1,414$ 1,605$ 2,008$ 2,123$ Per common share: Basic 0.29$ 0.33$ 0.41$ 0.44$ Diluted 0.29$ 0.33$ 0.41$ 0.44$ Cash Dividends 0.22$ 0.22$ 0.22$ 0.22$
First Quarter Second Quarter Third Quarter Fourth QuarterInterest Income 8,899$ 9,003$ 8,275$ 8,211$ Interest Expense 1,511 1,457 1,397 1,344 Net Interest Income 7,388 7,546 6,878 6,867 Provision for Loan Losses 536 330 463 217 Non-interest Income 1,610 1,637 1,841 2,314 Non-interest Expense 6,410 6,674 6,273 6,743 Income Taxes 389 427 354 481 Net Income 1,663$ 1,752$ 1,629$ 1,740$ Per common share: Basic 0.34$ 0.36$ 0.34$ 0.36$ Diluted 0.34$ 0.36$ 0.33$ 0.36$ Cash Dividends 0.22$ 0.22$ 0.22$ 0.22$
2013
2012

98
Market Price and Dividend Information
MARKET PRICE
The Company’s common stock trades on The NASDAQ Global Market (“NASDAQ”) under the symbol “CIZN”. On March 6, 2014, the common stock’s closing price on NASDAQ was $18.12. The following table sets forth the high and low sales prices for the common stock as reported on NASDAQ, as well as the dividends declared, in each quarter in the past two fiscal years.
Dividends Declared2012 High Low (per common share)
January - March 20.63$ 17.51$ 0.22April - June 19.99 18.01 0.22July - September 19.90 18.13 0.22October - December 19.84 17.55 0.22
Dividends Declared2013 High Low (per common share)
January - March 19.80$ 18.55$ 0.22April - June 20.17 17.50 0.22July - September 18.80 17.63 0.22October - December 19.30 17.75 0.22
On March 6, 2014, shares of the Company’s common stock were held of record by approximately 452 shareholders.
DIVIDENDS
Dividends totaled $0.88 per share for 2013 and 2012.
If funds are available, the Board of Directors of the Company typically declares dividends on a quarterly basis in March, June, September and December with payment following at the end of the month in which the dividend was declared. Funds for the payment by the Company of cash dividends are obtained from dividends, loans or advances received by the Company from the Bank. Accordingly, the declaration and payment of dividends by the Company depend upon the Bank’s earnings and financial condition, general economic conditions, compliance with regulatory requirements, and other factors. The Bank must also receive the approval of the Mississippi Department of Banking and Consumer Finance prior to the payment of a dividend.

99
STOCK PERFORMANCE GRAPH
The following performance graph compares the performance of the Company’s common stock to the NASDAQ Composite Index and the Morningstar Regional Bank index (a peer group of other regional bank holding companies) for the Company’s reporting period. The graph assumes that the value of the investment in the Company’s common stock and each index was $100 at December 31, 2008 and that all dividends were reinvested.
Performance Graph December 31, 2008 - December 31, 2013
0
50
100
150
200
250
300
2008 2009 2010 2011 2012 2013
Dol
lars
Citizens Holding Company NASDAQ Market Index Morningstar Regional Banks
12/29/2008 12/31/2009 12/31/2010 12/31/2011 12/31/2012 12/31/2013
Citizens Holding Company 100.00 110.23 108.39 94.21 109.46 109.74 NASDAQ Market Index 100.00 145.34 171.70 170.34 200.57 281.14 Morningstar Regional Banks 100.00 88.51 107.76 97.00 115.23 159.88
There can be no assurance that the Company’s common stock performance will continue in the future with the same or similar trends depicted in the performance graph above. The Company does not and will not make or endorse any predictions as to future stock performance.

100
THE CITIZENS BANK OFFICERS
Greg McKee President and CEO
Robert T. Smith Senior Vice President, CFO
Erdis Chaney Vice President, Senior Deposit Officer
Ledale Reynolds Vice President and CIO
Ray Stone Vice President, Senior Credit Officer
Mark Taylor Vice President, COO
Randy Cheatham Vice President
Jackie Hester Vice President, Marketing Officer
Darrel Bates Vice President
Jean T. Fulton Vice President, Internal Auditor
Gayle Sharp Vice President, Loan Operations Manager
Brad Copeland Vice President
Mark Majure Vice President
Vicki Brown Vice President, BSA Officer
Bob Posey Vice President
Mike Chandler Vice President
Archie Anderson Vice President
Stacy Arnold Vice President, Compliance Officer
Joshua Sullivan Vice President, Senior Credit Analyst
Sommer Vick Assistant Vice President
Carolyn K. McKee Assistant Vice President
Beth Branning Assistant Vice President
Tommy Jackson Assistant Vice President
Mitch Peden Assistant Vice President, Information Services Manager
Mark Flake Assistant Vice President, Network Services Manager
Tammy Pope Accounting Officer
Greg Jackson Accounting Officer
Pat Stokes Assistant Cashier
Ashley Peebles Assistant Vice President Customer Service Manager
Elizabeth Owen Assistant Vice President, Director of Human Resources, Chief Risk Officer
Deborah Ladd Item Processing Officer
Linda Goforth Electronic Banking Officer
Scott Lewis Assistant Vice President Information Security Officer
Patti Rickles ACH Officer
Carthage Branch
Mike Brooks President
Billy Cook Vice President
Sue Fisher Assistant Cashier Deposit Operations Officer
Sebastopol Branch
Connie Comans President
Union Branch
Robert C. Palmer, Jr. President
Marianne Strickland Assistant Cashier
Kosciusko Branch
Steve Potts Vice President
David Blair Vice President
Scooba and DeKalb Branches
Reggie Moore Assistant Vice President
Jan White Branch Operations Officer
Forest Branch
Richard Latham Vice President
Dymple Winstead Assistant Vice President
Decatur Branch
Camp Keith Vice President, Senior Consumer Credit Officer, Contingency Officer
Louisville Branch
Bruce Lee President
Marion Gardner Assistant Cashier
Lynn Graham Branch Operations Officer
Starkville Branch
Stan Acy Regional Commercial Lender
Charles Byrd Assistant Cashier, Appraisal Review Specialist
Rhonda Edmondson Assistant Cashier
Collinsville Branch
Mike Shelby Vice President
Meridian Eastgate
Charles Young Regional Commercial Lender
Vikki Gunter Assistant Vice President
Meridian Broadmoor
Justin Branstetter Assistant Vice President
Annette Brooks Assistant Cashier
Hattiesburg Branch
Travis Moore Regional President
Blake Walker President, Hattiesburg Market
Flowood Branch
Billy Cook Vice President
Biloxi Cedar Lake
Brandon Sherwood Gulf Coast President
Tammy Warren Assistant Vice President Mortgage Loan Officer
Mortgage Loan Department
Charlene Deweese Assistant Cashier

101
BOARD OF DIRECTORS
Don Fulton Craig Dungan, MD Corporate PERT Coordinator Physician W. G. Yates and Sons Construction Co. Meridian Gastroenterology PLLC Donald L. Kilgore Greg L. McKee Attorney General President & Chief Executive Officer Mississippi Band of Choctaw Indians Citizens Holding Company and The Citizens Bank David A. King Proprietor David P. Webb Philadelphia Motor Company Attorney Baker, Donelson, Bearman, Caldwell & Herbert A. King Berkowitz, PC Civil Engineer King Engineering Associates, Inc. A. T. Williams Certified Public Accountant Adam Mars A. T. Williams, CPA Business Manager Mars, Mars, Mars & Chalmers Terrell E. Winstead Chief Financial Officer Molpus Woodlands Group
CITIZENS HOLDING COMPANY OFFICERS
Herbert A. King Chairman
Greg L. McKee President and Chief Executive Officer
Carolyn K. McKee Secretary
Robert T. Smith Treasurer and Chief Financial Officer
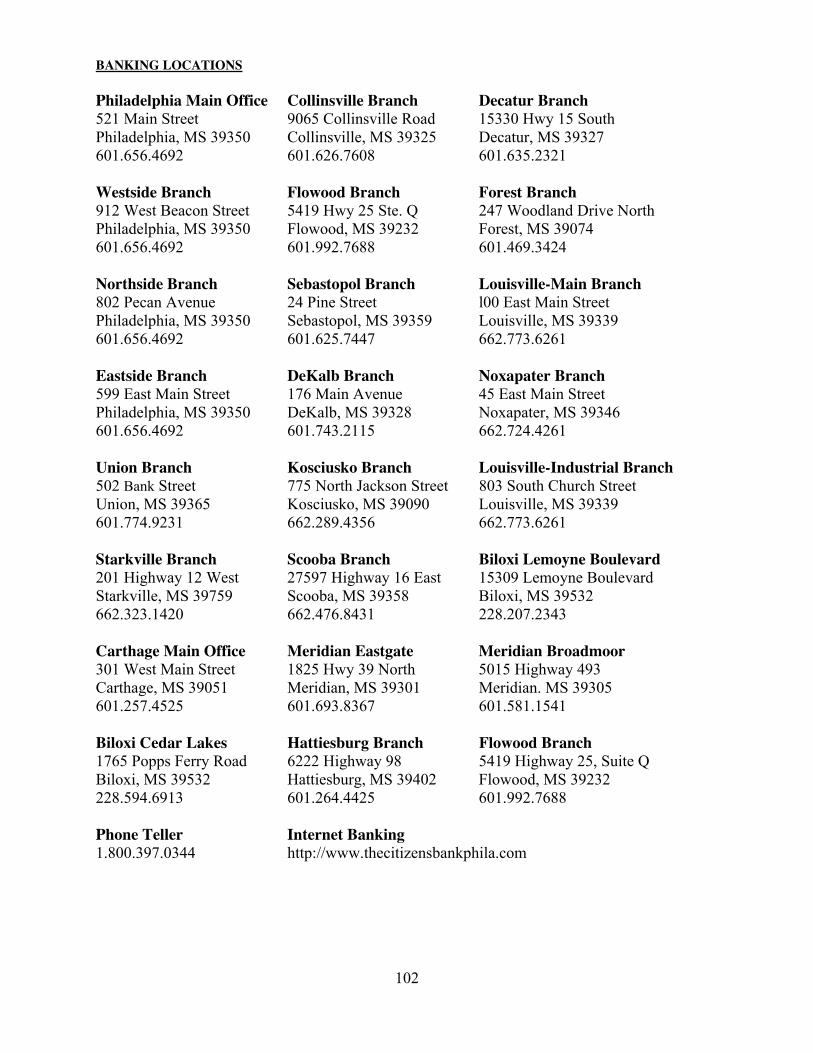
102
BANKING LOCATIONS
Philadelphia Main Office Collinsville Branch Decatur Branch 521 Main Street 9065 Collinsville Road 15330 Hwy 15 South Philadelphia, MS 39350 Collinsville, MS 39325 Decatur, MS 39327 601.656.4692 601.626.7608 601.635.2321
Westside Branch Flowood Branch Forest Branch 912 West Beacon Street 5419 Hwy 25 Ste. Q 247 Woodland Drive North Philadelphia, MS 39350 Flowood, MS 39232 Forest, MS 39074 601.656.4692 601.992.7688 601.469.3424
Northside Branch Sebastopol Branch Louisville-Main Branch 802 Pecan Avenue 24 Pine Street l00 East Main Street Philadelphia, MS 39350 Sebastopol, MS 39359 Louisville, MS 39339 601.656.4692 601.625.7447 662.773.6261
Eastside Branch DeKalb Branch Noxapater Branch 599 East Main Street 176 Main Avenue 45 East Main Street Philadelphia, MS 39350 DeKalb, MS 39328 Noxapater, MS 39346 601.656.4692 601.743.2115 662.724.4261
Union Branch Kosciusko Branch Louisville-Industrial Branch 502 Bank Street 775 North Jackson Street 803 South Church Street Union, MS 39365 Kosciusko, MS 39090 Louisville, MS 39339 601.774.9231 662.289.4356 662.773.6261
Starkville Branch Scooba Branch Biloxi Lemoyne Boulevard 201 Highway 12 West 27597 Highway 16 East 15309 Lemoyne Boulevard Starkville, MS 39759 Scooba, MS 39358 Biloxi, MS 39532 662.323.1420 662.476.8431 228.207.2343
Carthage Main Office Meridian Eastgate Meridian Broadmoor 301 West Main Street 1825 Hwy 39 North 5015 Highway 493 Carthage, MS 39051 Meridian, MS 39301 Meridian. MS 39305 601.257.4525 601.693.8367 601.581.1541
Biloxi Cedar Lakes Hattiesburg Branch Flowood Branch 1765 Popps Ferry Road 6222 Highway 98 5419 Highway 25, Suite Q Biloxi, MS 39532 Hattiesburg, MS 39402 Flowood, MS 39232 228.594.6913 601.264.4425 601.992.7688
Phone Teller Internet Banking1.800.397.0344 http://www.thecitizensbankphila.com

103
FINANCIAL INFORMATION
CORPORATE HEADQUARTERS 521 Main Street P.O. Box 209 Philadelphia, MS 39350
601.656.4692
ANNUAL STOCKHOLDER MEETING The Annual Stockholder meeting of the Citizens Holding Company, Inc. will be held Tuesday, April 22, 2014, at 4:30 P.M. in the lobby of the main office of The Citizens Bank, 521 Main Street, Philadelphia, Mississippi.
STOCK REGISTRAR AND TRANSFER AGENT American Stock Transfer & Trust Company 59 Maiden Lane New York, NY 10038
FORM 10-K The Corporation’s most recent Annual Report on Form 10-K, filed with the Securities and Exchange Commission, is available without charge to stockholder’s upon request to the Treasurer of the Citizens Holding Company.
FINANCIAL CONTACT Robert T. Smith Treasurer and Chief Financial Officer P.O. 209 Philadelphia, Mississippi 39350
Additional information can be obtained from our corporate website at www.citizensholdingcompany.com


CB_Cover_2013_v1.indd 3-4 3/5/14 10:55 AM

CITIZENS HOLDING COMPANY521 Main Street, Philadelphia, MS 39350 601.656.4692 www.thecitizensbankphila.com
ANNUAL REPORT2013
CB_Cover_2013_v1.indd 1-2 3/5/14 10:55 AM