annual report and accounts 2015 -...
TRANSCRIPT

Annual reportand accounts 2015Annual reportand accounts 2015

URENCO has a pivotal role in the nuclear fuel supply chain, providing our customers with the enrichment service they need to produce low carbon electricity through nuclear generation.
This helps to keep the lights on and the world moving.
As demand for electricity increases, nuclear provides a secure and reliable source of low carbon energy as part of a balanced energy mix.

1,302.41,601.4 1,514.6 1,612.0
1,842.2
0
500
1000
1500
2000
20152014201320122011
784.61,012.6 967.9 1,070.8 1,167.3
201520142013201220110
200
400
600
800
1000
1200
3 2 1
11
6
201520142013201220110
2
4
6
8
10
12
902.81,185.3
880.0 979.2
1,201.5
20152014201320122011
0
200
400
600
800
1000
1200
359.1 401.5336.6
404.5452.1
201520142013201220110
100
200
300
400
500
€527m
European Enrichment Sites €77.9m
USA Enrichment Site €345.1m
TMF €163.8m2
We have increased our global capacity to 19,000 tSW/a at the end of 2015 compared to 18,100 tSW/a at the end of 2014.
At a glanceFinancial and operational highlights
We had six Lost Time Incidents related to employees and contractors across our enrichment facilities and construction sites in 2015.
We met 100% of our customer delivery commitments again this year.
Operations
EBITDA
Cash generated from operations
Capital expenditure
Our order book extends to beyond 2025 and reflects our global customer base.
€517m
€1,842m
€1,167m
€1,202mNet income
€452m
Revenue
European Enrichment Sites €133.6m
USA Enrichment Site €175.0m
TMF €208.8m
< previous next >
Download the freeLayar App
Scan this page
Discoverinteractive content
INTERACTIVE PRINT
URENCO Annual report and accounts 2015 3
Introduction
Chairman’s statement 07
Strategic reportOur global role 08Our strategy 10Our values 11Our role in the nuclear fuel supply chain 12Our uranium enrichment process 13Chief Executive Officer’s review 16Our markets 20Principal risks and uncertainties 24Sustainability 28Group Finance Report 34Board of Directors 38
GovernanceCorporate governance 42Audit Committee Report 44Sustainability Committee Report 48Remuneration Report 49Directors’ Report 56Directors’ Responsibilities Statement 58
Financial statementsIndependent Auditor’s Report 59Consolidated Group Financial Statements 63Company Financial Statements 111Glossary 128Contacts 130
Contents
Use the QR code below to download a free mobile application to discover interactive content throughout the report. Look out for the icon.
< previous next >

4
An employee at work in the instrument lab
Financial statementsGovernanceStrategic reportIntroductionContents
< previous next >

URENCO Annual report and accounts 2015 5
Nuclear is a long-term business and URENCO takes a long-term view of its operations. Our customers have entrusted us with meeting their future uranium enrichment needs – we take this very seriously and deeply value these relationships.
Our values guide our strategic and operational decision-making. We endeavour to do all we can to meet both current and future demand while at the same time fulfilling our commitments to society and the environment.
Our geographical reach and diversity of supply are distinct competitive advantages which allow us to respond flexibly to market demand.
We are constantly working to ensure we have the people, skills and resources in place to meet our commitments to our stakeholders and to ensure the long-term sustainability of our business.
It is what we call ‘enriching the future’.
URENCO’s operational heritage of more than 40 years has built a company that plays an important role in the world’s nuclear energy industry, helping our customers generate low carbon energy in a safe and sustainable way.
Introduction
Financial statementsGovernanceStrategic reportIntroduction
< previous next >
Contents

6
The process service corridor at one of our enrichment facilities
Financial statementsGovernanceStrategic reportIntroductionContents
< previous next >

URENCO Annual report and accounts 2015 7
There continue to be significant levels of inventory and pricing pressures in the world enrichment market which will, if sustained, have an impact on our future performance. However, our order book in the medium-term remains strong and we have the ability to operate our enrichment facilities in a flexible manner so that we can adapt to the market environment. Nuclear is a long-term business, a nuclear reactor is an investment for at least 40 years, and we believe we have the financial stability to service our customers’ requirements in the long-term.
Global outlook The restart of Japan’s Sendai nuclear reactors was a positive step and we look forward with cautious optimism to further progress during 2016. The long-term nature of the nuclear industry, and the construction of 66 nuclear reactors around the world1, will also help address the current market challenges.
The COP21 meeting in Paris in December 2015 has reinforced the importance of reducing global carbon emissions to help mitigate the impact of climate change. World leaders have agreed to support the objective of limiting global temperature increases to below 1.5°C by 2050. As a clean and reliable electricity supply, nuclear power is well positioned to help meet these targets as part of a balanced energy mix.
Our commitments Safety is at the core of our culture. Operating at the highest levels of safety is one of our key strategic priorities. Our safety record improved this year, supported by a renewed focus on behavioural safety, to support our ZERO HARM campaign. It is encouraging that the number of Lost Time Incidents decreased to six in 2015 from 11 in 2014.
We have been operating successfully for more than 40 years and sustainability is a core part of URENCO’s culture and operations. In 2015, we set out our KPIs for each of our sustainability focus areas. We talk about performance against these targets on pages 28-30 of this report.
Operations In 2015 we completed key projects. The third phase of our capacity expansion project in the USA was finished on schedule. The restructuring of Enrichment Technology Company, our joint venture with Areva, has been substantially completed. As we reported last year, the construction of our Tails Management Facility (TMF) in the UK has experienced delays and increased costs. This project is progressing and commissioning is now planned to commence in 2017.
Leadership I have been a non-executive director since 2009 and am honoured to have been appointed Chairman for 2016.
We welcome Dr Thomas Haeberle as our new Chief Executive Officer and Thomas brings more than 25 years of experience in the chemicals industry. The Board thanks Helmut Engelbrecht for his significant contribution to the company’s success. He served as CEO from 2005 to 2015 and steered the company through a period of significant growth.
I would like to thank Sir John Hood, our former Chairman, and Victor Goedvolk, who served on the Board for more than 12 years, for their contributions to the Board. We welcome Miriam Maes and Justin Manson to our Board.
The success of URENCO is underpinned by our employees. We value the impact their expertise, commitment and customer focused attitude has on our performance. A group wide employee survey was conducted in March 2015, which received a record response rate of 95.6% and reconfirmed the sustained level of commitment and engagement of our workforce.
EducationURENCO is proud of its educational initiatives aimed at nurturing future industry talent and helping to create public trust in the nuclear sector. Our educational initiatives aim to address important topics such as energy security and low carbon energy in the context of climate change. This year we have broadened our engagement with the British Science Association (BSA) and launched a partnership with the Science Museum, London to inspire a new generation of science and engineering leaders.
My thanks go to my Board colleagues and our employees for contributing to our success this year. We are positive about the long-term success of URENCO and remain committed to meeting the present and future needs of our customers.
Stephen BillinghamChairman
IntroductionChairman’s statement
URENCO has delivered robust financial and operational results for 2015. These results have been generated by continued deliveries from our strong forward order book. URENCO has remained focused on providing the highest level of customer service in order to retain our position as a supplier of choice.
References1 World Nuclear Association, http://www.world-nuclear.org/information-library/facts-and-figures/world-nuclear-power-reactors-and-uranium-requireme.aspx (accessed March 2016)
Financial statementsGovernanceStrategic reportIntroduction
< previous next >
Contents

8
What we doWe are an international supplier of enrichment services for the civil nuclear market. With operations in four countries, we serve utility customers worldwide who provide low carbon electricity through nuclear generation. The majority of our customers source the feed, uranium hexafluoride (UF6), which we then enrich to international specifications, enabling them to continue to the next stage of the nuclear fuel supply chain. The ability to operate our centrifuges flexibly allows us to conserve feed material and provide Enriched Uranium Product (EUP) and natural uranium in addition to enrichment services.
Helping our customers meet global energy demands and produce low carbon energy is just part of what we do. Educating the next generation on the importance of nuclear within the energy mix, and meeting our wider commitments to sustainability, are also core parts of our culture.
Our facilitiesWe have four uranium enrichment facilities. These are located at Almelo in the Netherlands; Capenhurst in the UK; Eunice, New Mexico in the USA; and Gronau in Germany. Our Head Office is located close to London in the UK.
We are the only company in the world to operate enrichment facilities in four countries under four different regulatory regimes. This geographical reach and diversity of supply are distinct competitive advantages which allow us to respond flexibly to our customers’ needs. We have a strong forward order book which allows us to plan future production volumes in advance.
We are also firmly committed to responsible uranium stewardship and have subsidiaries dedicated to overseeing our work in this area. These include URENCO ChemPlants Limited, which is responsible for the construction of TMF in the UK, and Capenhurst Nuclear Services Limited (CNS), which provides responsible materials management and uranium stewardship for the nuclear industry.2
Our Stable Isotopes business in the Netherlands draws on our expertise and capabilities in centrifuge technology to produce a variety of products for medical, industrial and research applications.
Our operations and customers
URENCO operations
Customers
URENCO UKCapenhurst, United Kingdom – URENCO UK provides a production capacity of 4,900 tSW/a.
URENCO USAEunice, New Mexico – our American enrichment facility continues to bring capacity online. It currently stands at 4,600 tSW/a.
All site capacity data as at 31 December 2015
Strategic reportOur global role
URENCO is a leading provider of uranium enrichment services to the world’s nuclear energy industry.
References2 For more information on our materials management and uranium stewardship, visit www.capenhurstnuclearservices.com 3 URENCO internal data, Global Customer Survey 2014, September 2014
Financial statementsGovernanceStrategic reportIntroductionContents
< previous next >

URENCO Annual report and accounts 2015 9
Our customersAs a leading provider of enrichment services, we supply more than 50 customers in 18 countries. Through robust, long-term partnerships we support customers to deliver on their goals and respond flexibly to their requirements.
We regularly survey our customers to assess the quality of our services and the strength of our customer relationships. In our 2014 Global Customer Survey, 81% of URENCO customers said they were ‘very satisfied’ with their enrichment services, and 76% said they were ‘very satisfied’ with their relationship with URENCO.3
The Treaty of AlmeloOur heritage can be traced back to the Treaty of Almelo. Signed in 1970 by the UK, Dutch and German governments, the Treaty of Almelo laid the foundations for international cooperation. At its core was a commitment to promote the peaceful application of nuclear power and to harness atomic expertise for use in energy, science and medicine. It created a platform for the joint development of centrifuge enrichment technology and put robust safeguards in place to protect this technology from misuse and proliferation. Under the terms and principles of the Treaty, URENCO has become a key provider of enrichment services globally. As URENCO has grown, it has extended its international cooperation through treaties with the USA and France.
By complying with these agreements and living our values (see page 11), we continue to focus on quality, reliability, and the highest standards of uranium stewardship and corporate responsibility.
In 2013, our shareholders announced they were considering divesting their shares in URENCO, and discussion on a potential sale continued during 2015. The Treaty of Almelo provides a framework for the consistent operation of the Group, and any change in ownership would have to adhere to the provisions of this treaty and others, ensuring long-term continuity and stability for our business and our customers.
URENCO NederlandAlmelo, The Netherlands – our Dutch enrichment facility provides a production capacity of 5,400 tSW/a.
URENCO DeutschlandGronau, Germany – our German enrichment facility provides a production capacity of 4,100 tSW/a.
Financial statementsGovernanceStrategic reportIntroductionContents
< previous next >< previous next >

10
Value creation
Continue our core business: the enrichment of uranium
Our customers source the feed, uranium hexafluoride (UF6), and we enrich it to international specifications, enabling them to continue to the next stage of the nuclear fuel supply chain. We can also provide EUP and natural uranium.
Remain responsive to customer requirements
We build strong, long-term relationships with our customers and ensure we remain responsive to their uranium enrichment requirements.
Focus expansion on markets where we see greatest demand
Global energy demand is rising and nuclear is an important part of a sustainable and low carbon energy mix. We are well placed to meet both current and future demand for nuclear energy.
Continue to develop our technology
We have been operating our technology efficiently for over 40 years. We will continue to develop our technology to ensure we have the services in place to meet market needs.
Responsiveness: Maintaining close,
long-term relationships with our customers and responding flexibly to
their needs.
International presence and collaboration
Maximising our geographical reach and advantage to provide
security of supply to our customers.
URENCO’s centrifuge technology
Using our experience and expertise of
more than 40 years to operate our
technology efficiently and provide a
responsive service to our customers.
Highly motivated and committed
peopleBuilding our strength
as a key market player by investing substantially in our people’s skills and
development.
Responsible, long-term businessMeeting our
commitments in the areas of health, safety, the environment, asset integrity, safeguards,
security, ethical conduct and social performance.
2015
The implementation of this strategy is based on five strategic elements:
Our five strategic elements
Strategic reportOur strategy
We provide our customers around the world with safe and reliable supplies of enriched uranium to fuel civil nuclear reactors.
Enrichment Customer base Technology Market presence
Our core business is the supply of enrichment
services and the provision of Enriched Uranium Product (EUP) and natural uranium.
Our customers are at the heart of our business. They choose us to enrich their uranium as we are a reliable long-term
partner and our geographical diversity allows us to respond
to their needs.
Our core asset is our reliable, efficient centrifuge technology
coupled with more than 40 years of operational
experience of enrichment services.
We have a strong forward order book which allows
us to plan production volumes many years
in advance.
Financial statementsGovernanceStrategic reportIntroductionContents
< previous next >

URENCO Annual report and accounts 2015 11
Strategic reportOur values
We encourage strong employee engagement with our values and embed them across the organisation.
Integrity We conduct all our relationships with
honesty, fairness and respect.
Development We are committed to the sustainable
development of our business by continuously
developing our employees, services
and products.
Flexibility We respond to best meet our customers’ needs by
flexibly deploying our skills and capabilities.
Safety We operate to the
highest standards of safety, environmental
and security requirements.
Profitability We are committed to making profits
to secure our future and reward our
shareholders and employees.
Our vision Our mission
Our duty to the Treaty of AlmeloThe Treaty of Almelo enshrines the enduring purpose and principles of URENCO regardless of ownership.
We believe the world needs nuclear energy to meet the demands of sustainable global energy. We can help the transition to a low
carbon economy through the deployment of our enrichment services and technology.
Our mission is to be the supplier of choice within our sector and a key contributor to sustainable energy.
Financial statementsGovernanceStrategic reportIntroductionContents
< previous next >

Download the freeLayar App
Scan this page
Discoverinteractive content
INTERACTIVE PRINT
12
Strategic reportOur role in the nuclear fuel supply chain
URENCO plays a key role in the global nuclear fuel supply chain. We provide our customers with the enrichment services they need to produce low carbon electricity through nuclear generation.
The nuclear fuel supply chain
1. MiningUranium ore is extracted, purified and milled to become uranium oxide, also known as ‘yellow cake’.
2. ConversionUranium oxide is chemically converted into uranium hexafluoride (UF6) and transported to one of our enrichment facilities.
3. Enrichment & feed materialsThe enrichment process starts with the arrival of customers’ uranium hexafluoride (UF6) at our enrichment facilities. We heat UF6 to turn it into a gas and feed it into our gas centrifuges. The centrifuge separates the two isotopes contained in uranium, U235 and U238. The lighter U235 is generally enriched to up to 5%, which is sufficient to sustain a continuous fission reaction in a nuclear power plant. The flexibility of our centrifuges allows us to conserve feed material and therefore provide Enriched Uranium Product (EUP) and natural uranium in addition to enrichment services.
4. Fuel fabrication The customers’ enriched uranium is transported to fuel fabricators, where it is converted into pellets before being loaded into fuel rods.
5. Nuclear power generation
The fuel rods are transported to nuclear power stations, where they power the nuclear reactors. Fuel rods are placed into reactors and used to generate steam, which in turn drives turbines which power generators.
6. Electricity distributionAt the end of the nuclear fuel supply chain, the nuclear power plants provide a secure source of low carbon energy – generating electricity for homes, schools, hospitals, offices and industries around the world.
Financial statementsGovernanceStrategic reportIntroductionContents
< previous next >

URENCO Annual report and accounts 2015 13
Strategic reportOur uranium enrichment process
URENCO’s part in the process starts with the delivery of customers’ uranium hexafluoride (UF6) to our enrichment facilities. UF6 is the most suitable form of uranium for enrichment because it is easily turned into a gas when heated.
Heating UF6 to turn it into a gasUF6 is delivered to our facilities in internationally standardised transport containers by approved suppliers. UF6 is solid at ambient temperature. At our enrichment facility we connect the transport container holding UF6 to the plant feed system. It is then heated in order to vaporise the UF6 and turn it into gas at sub-atmospheric pressure.
Spinning UF6 at high speed to enrich itThe UF6 gas is fed into a centrifuge casing containing a cylindrical rotor which spins at high speed, separating uranium’s two isotopes. The heavier isotope U238 is forced closer to the wall of the rotor than the lighter U235. As a result, the UF6 gas closer to the wall is depleted of U235 and the UF6 gas nearer the rotor axis is slightly enriched in U235. We repeat the process over and over again until we achieve the desired levels of U235 enrichment to meet our customers’ specifications.
Compressing and cooling the enriched uraniumWe feed the enriched uranium (UF6 containing up to 5% of the U235 isotope) from the centrifuge cascades into a compressor and then into a cooling box containing a cylinder. As it cools, the UF6 vapour solidifies in cylinders. We homogenise the cylinders and check the quality of a sample before delivery to customers.
We weigh and analyse all cylinders to comply with the accounting and tracking requirements of the European Atomic Energy Community (EURATOM), United States Nuclear Regulatory Commission (USNRC) and the International Atomic Energy Agency (IAEA).
Storing and converting depleted uraniumThe UF6 gas closer to the wall in the centrifuge is partially depleted in U235. This by-product is known as tails. We collect and cool tails in a cooling box containing a cylinder, weighing to ensure all material can be accounted for. Tails still contain a low concentration of U235 and can be re-enriched if economically viable.
We store tails at our enrichment facilities in internationally approved containers pending deconversion to a chemically stable form – uranium oxide (U3O8) – for long-term storage.
As well as storing tails at our facilities, we currently contract a third party to chemically transform depleted UF6 into U3O8. We are constructing our own Tails Management Facility to convert UF6 to U3O8. The conversion process creates hydrofluoric acid, a valuable chemical used globally by industry.
A closer look at the enrichment process
Financial statementsGovernanceStrategic reportIntroductionContents
< previous next >

14
Financial statementsGovernanceStrategic reportIntroductionContents
< previous next >

URENCO Annual report and accounts 2015 15
Two URENCO apprentices walk through the UF6 corridor at one of our enrichment facilities
Financial statementsGovernanceStrategic reportIntroductionContents
< previous next >

16
URENCO is committed to meeting the present and future needs of its customers by optimising the supply of enrichment services, driving innovation and efficiency in response to market conditions, and reinforcing its role as a reliable, long-term partner to the industry. Here, URENCO’s new Chief Executive Officer, Thomas Haeberle, answers questions about the company’s performance in 2015 and its future priorities.
Strategic reportChief Executive Officer’s review
Thomas Haeberle Chief Executive Officer
Financial statementsGovernanceStrategic reportIntroductionContents
< previous next >

URENCO Annual report and accounts 2015 17
How did URENCO perform in 2015?URENCO achieved a strong operational and financial performance in 2015, and continues to have long-term financial stability through delivering on its strong order book. Market conditions continue to remain challenging and the build-up of worldwide inventories and oversupply of enriched uranium continue to impact negatively on pricing. The company’s revenue for the year increased by €230.2 million to €1,842.2 million (2014: €1,612.0 million). This increase reflects higher volumes as well as higher average unit revenues for both SWU and uranium driven by favourable foreign exchange movements. EBITDA of €1,167.3 million was 9.0% higher than last year (€1,070.8 million), mainly due to the increase in revenues.
How did you progress in 2015 with your capacity expansion in the USA?During the year, URENCO’s USA capacity reached 4.6 million SWU, with URENCO USA achieving a smooth transition from construction to operation on schedule. We have the regulatory approval to expand our USA capacity in the future, when there is a requirement from our customers.
How did URENCO’s safety performance compare to last year?Safety, as ever, remained a key focus for URENCO in 2015. There was a reduction in the number of Lost Time Incidents (LTIs) from 11 in 2014 to six. Although this is still too many, an increased focus on behavioural safety has led to improvements in the way that LTIs, injuries and near misses are monitored and reported. These improvements have highlighted learnings which URENCO staff can share in order to reduce the occurrence of related incidents in the future. During August 2015, there was an incident at URENCO’s enrichment facility in the Netherlands which did not cause any injuries or have a detrimental impact on the environment. However, it had an impact on business with part of the affected hall being temporarily out of production. Learnings from this incident were shared across the Group.
Can you provide an update on the TMF?The construction of the TMF at our Capenhurst site is URENCO’s current key capital expenditure project. As was reported last year, there have been delays and increased costs. During 2015, a comprehensive review was conducted by our new project management team which concluded that the facility will incur further increases in construction costs. As a result the team has implemented some new contractual arrangements. Despite the cost overruns, the project is progressing and operations are planned to commence in 2017. The TMF is a key element of URENCO’s approach to responsible uranium stewardship, and a core part of our commitment to sustainability as it will enable URENCO to manage the by-product of the uranium enrichment process, thus reducing our reliance on third parties.
And have there been developments at ETC?In response to the changing global market, URENCO is concluding its restructuring of Enrichment Technology Company, (our joint venture with Areva). This has involved a significant reduction in capacity whilst retaining the essential skills required to meet future demand for centrifuge technology, thereby protecting URENCO’s long-term capabilities in this area and being a responsible and reliable partner.
What is the current outlook for URENCO?URENCO has and will continue to experience challenging conditions in the global nuclear fuel market due to oversupply in the enrichment market. We have a strong order book which extends beyond 2025 with an approximate value of €17 billion, (2014: €16 billion),4 however, it is clear that the market is changing rapidly. A priority during this period is to work closely with our customers, respond flexibly to their requirements and build further on our established relationships. URENCO has a long-term view of its business and strives to ensure that it has the skills and capabilities to ensure exceptional customer service for many years to come.
What is the outlook for the global nuclear market?Since 2011, the phase-out of nuclear power in European countries including Germany, and the shutdown of Japanese reactors, have created difficult conditions for URENCO and its customers. The restart of Japan’s Sendai nuclear reactors in 2015 does potentially signal a shift in momentum and should be greeted with cautious optimism as a step in the right direction. We will continue to support our Japanese customers. The UK government has shown strong support for nuclear new build, which will provide low carbon energy production for decades to come.
What’s your view of the global nuclear energy landscape?Due to population growth and urbanisation, the energy market reflects both the world’s cities and centralised urban areas, which are associated with approximately 70% of global energy consumption,5 and the less developed parts of the world where decentralised energy demand is strong but where limited grid capacity and poor infrastructure require more distributed power generation.
References4 2014 order book extends beyond 2025.5 The World Bank, http://www.worldbank.org/en/topic/urbandevelopment/overview
Financial statementsGovernanceStrategic reportIntroductionContents
< previous next >

18
Strategic reportChief Executive Officer’s review continued
Nuclear power is well positioned to meet the needs of both these markets. In the big cities of the developed world and emerging economies, traditional ‘big nuclear’ can provide large quantities of secure and reliable energy to meet growth and consumption requirements. In markets where grid connections are not as sophisticated, nuclear could be deployed on a small or micro scale.
How important is nuclear to the global energy mix?It is viewed as extremely important. Global nuclear power generation is predicted to increase by between 60% and 86% through to 2040,6 with the IAEA’s ‘high growth scenario’ projecting an increase in capacity to 631.8 GWe by 2030.7
Globally the development of renewables is a key area of focus. It is acknowledged that we need to wean ourselves off fossil fuels and ensure we have sustainable, low carbon forms of energy so that the global temperature rises by no more than the generally accepted level of 1.5°C by 2050.8 Nuclear energy fits this requirement extremely well as it is low carbon and secure. Furthermore as a society we continue to have increased demands for electricity, which will continue as countries develop, therefore having a low carbon form of electricity that can be produced within countries’ own borders becomes an essential part of the energy mix.
Is sustainability important to URENCO?Yes. Sustainability is and always has been a core part of URENCO’s culture and operations. The Sustainability Committee, which is a Board committee, is now in its second year, and has made progress in embedding sustainability across the Group. Sustainability KPIs were developed and implemented in 2015 (see page 20 of URENCO’s Sustainability Report for more information); and in 2016 we will be looking to improve the way we perform and report on our progress in the core sustainability focus areas. URENCO will also continue to focus on public and school education to promote the nuclear sector and inspire the next generation of scientists.
Does your sustainability model reflect the expertise required across your workforce?Our employees are one of URENCO’s key stakeholders. Last year, the company undertook its 2015 employee survey and achieved a record response rate of 95.6%. Commitment, engagement and satisfaction levels were all higher than external benchmarks (see page 30 for more information)9, which underscores URENCO’s efforts to be an Employer of Choice.
What are URENCO’s priorities for 2016 and beyond?2016 will be an important year of consolidation following the successful conclusion of the capacity expansion in the USA. With no major growth forecast for the coming years, capital expenditure will be scaled back. We will also complete the construction of the TMF in 2017 and will focus on investment in our facilities to make our operations more effective and efficient. We will continue to enhance our core activity of providing a reliable delivery of enrichment services to our customers.
Do you foresee any R&D development in the coming year?
Certainly. We will be working with our stakeholders to assess future opportunities. Although these developments are a long way off, as we support the shift towards smaller modular reactors, or indeed micro-scale nuclear units such as U-Battery, we want to ensure we have the skills, knowledge and funds in place to meet these market needs. I believe nuclear will be a key constituent of the world energy market for many years to come, and our priority today is to make sure URENCO remains responsive to customers’ uranium enrichment requirements and to deliver on our promises over the long-term.
What attracted you to the position of CEO at URENCO?I joined URENCO in December 2015 and took up the position as CEO on 1 January 2016. I bring more than 25 years of experience in the chemicals industry and am delighted to be leading the company at this exciting time and look forward to our future. I believe that nuclear has a crucial role to play and is an essential element of the energy mix for the future sustainability of our planet. The key is to manage it with an absolute priority on safety and security.
Thomas Haeberle
Chief Executive Officer
References6International Energy Agency, World Energy Outlook 2015, November 2015, p586-7, based on comparison of the Current Policies and New Policies Scenarios in the 2013 v 2040 period 7World Nuclear News, http://www.world-nuclear-news.org/NP-IAEA-sees-slow-but-sure-nuclear-growth-0809157.html (accessed March 2016)8International Energy Agency, World Energy Outlook Special Report: Energy and Climate Change, June 2015, p18, https://www.iea.org/publications/freepublications/publication/WEO2015SpecialReportonEnergyandClimateChange.pdf9URENCO internal data, URENCO Employee Survey 2015, March 2015
Financial statementsGovernanceStrategic reportIntroductionContents
< previous next >
URENCO Annual report and accounts 2015 19
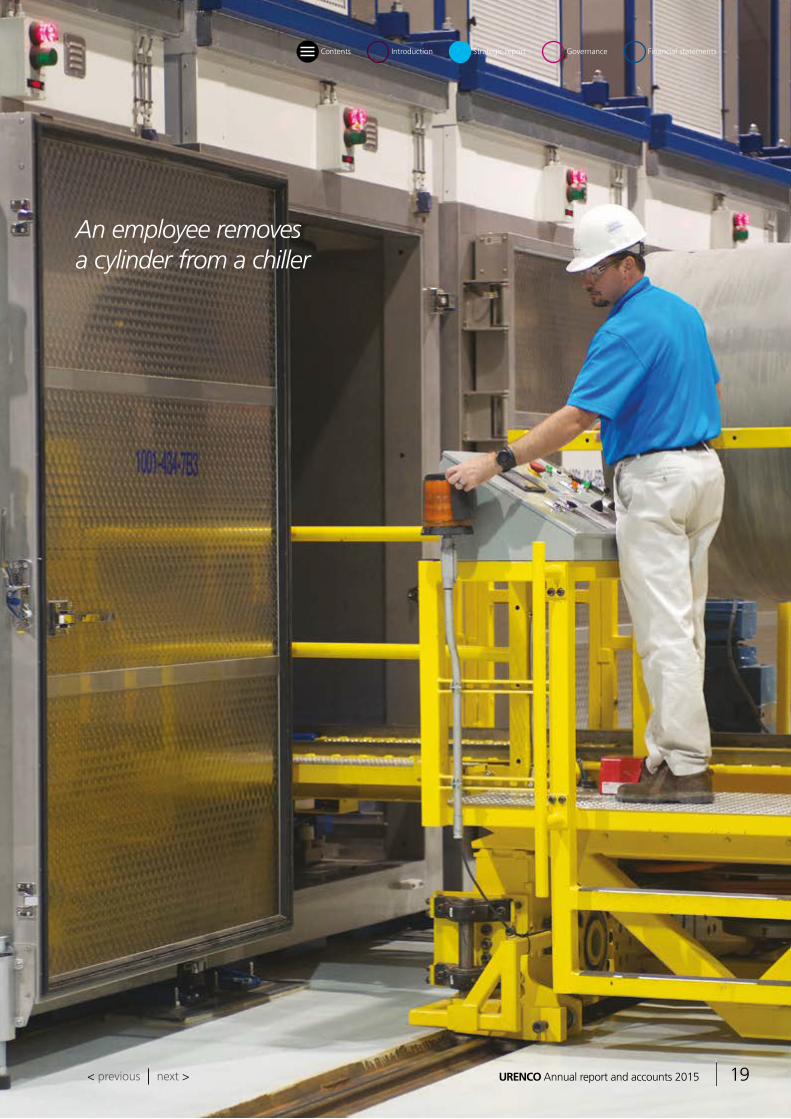
An employee removes a cylinder from a chiller
Financial statementsGovernanceStrategic reportIntroductionContents
< previous next >

20
As a supplier of enrichment services for more than 40 years, URENCO makes a valuable contribution to the low carbon economy. We supply more than 50 customers in 18 countries with a reliable source of enrichment services and feed in order to ensure optimal operation of their reactors. Our geographic diversity enables us to respond flexibly to customer demand.
Strategic reportOur markets
The global nuclear marketEach reactor is a multi-billion pound upfront investment for our customers, and we provide them with a reliable source of enriched uranium to keep their reactors running. Since 2011, the phase-out of nuclear power in European countries including Germany, and the shutdown of reactors in Japan, have led to a slowdown in the global nuclear market, resulting in increased worldwide inventories and pricing pressures. While the restart of nuclear reactors in Japan is a welcome development, the enrichment market is likely to remain challenging for some time.
Increased demand for electricity and the trend towards decarbonisation of heating and transport will result in future growth in nuclear power generation. Global nuclear power generation is predicted to increase by between 60% and 86% through to 2040,10 with the IAEA’s ‘high growth scenario’ projecting a 68% increase in capacity to 631.8 GWe by 2030.11 Electricity demand is increasing twice as fast as overall energy use, and is likely to have risen by more than two thirds in the period 2011 to 2035,12 with global electricity production expected to double by 2050.13 Furthermore, according to the latest IPCC Synthesis Report, at least 80% of the world’s electricity must be low carbon by mid-century if we are to stand a chance of keeping global warming below 1.50C.14 It is widely recognised that nuclear, which provides a secure and reliable source of low carbon energy, has an essential role to play in tackling the twin challenges of rising electricity demand and global climate change.
Currently, nuclear power provides about 11% of the world’s electricity, and 21% of electricity in OECD countries.15 As of January 2016, there are 439 commercial nuclear power reactors in operation around the world, with a total generating capacity of 382.2GWe – an increase from 437 operable reactors and 377.7 GWe capacity in January 2015.16 A further 66 reactors are currently under construction.17
References10 International Energy Agency, World Energy Outlook 2015, November 2015, p586-7, based on comparison of the Current Policies and New Policies Scenarios in the 2013 v 2040
period 11World Nuclear News, http://www.world-nuclear-news.org/NP-IAEA-sees-slow-but-sure-nuclear-growth-0809157.html (accessed March 2016)12World Nuclear Association, http://www.world-nuclear.org/information-library/current-and-future-generation/world-energy-needs-and-nuclear-power.aspx (accessed March 2016)13World Nuclear Association, Hot Topics 2015, p.5 14World Nuclear Association, Hot Topics 2015, p.6 15World Nuclear Association, http://www.world-nuclear.org/information-library/current-and-future-generation/world-energy-needs-and-nuclear-power.aspx (accessed March 2016)16World Nuclear News, http://www.world-nuclear-news.org/NP-World-starts-up-10-shuts-down-eight-nuclear-reactors-in-2015-411601.html (accessed March 2016)17World Nuclear News, http://www.world-nuclear.org/information-library/facts-and-figures/world-nuclear-power-reactors-and-uranium-requireme.aspx (accessed March 2016)18European Nuclear Society, https://www.euronuclear.org/info/encyclopedia/n/nuclear-power-plant-europe.htm (accessed March 2016)19European Nuclear Society, https://www.euronuclear.org/info/encyclopedia/n/nuclear-power-plant-europe.htm (accessed March 2016)20 World Nuclear Association, http://www.world-nuclear.org/information-library/facts-and-figures/world-nuclear-power-reactors-and-uranium-requireme.aspx
(accessed March 2016)21European Nuclear Society, https://www.euronuclear.org/info/encyclopedia/n/nuclear-power-plant-europe.htm (accessed March 2016)22European Nuclear Society, https://www.euronuclear.org/info/encyclopedia/n/nuclear-power-plant-europe.htm (accessed March 2016)23World Nuclear Association, http://www.world-nuclear.org/information-library/country-profiles/countries-a-f/belarus.aspx (accessed March 2016)
Financial statementsGovernanceStrategic reportIntroductionContents
< previous next >

URENCO Annual report and accounts 2015 21
References24World Nuclear Association, http://www.world-nuclear.org/info/Country-Profiles/Countries-G-N/Germany/ (accessed March 2016)25World Nuclear Association, http://www.world-nuclear.org/info/Country-Profiles/Countries-A-F/Belgium/ (accessed March 2016)26World Nuclear Association, http://www.world-nuclear.org/info/Country-Profiles/Countries-O-S/Switzerland/ (accessed March 2016)27 World Nuclear Association, http://www.world-nuclear.org/information-library/facts-and-figures/world-nuclear-power-reactors-and-uranium-requireme.aspx
(accessed March 2016)28 Nuclear Energy Institute, http://www.nei.org/Knowledge-Center/Nuclear-Statistics/US-Nuclear-Power-Plants (accessed March 2016)29 Nuclear Energy Institute, September 2015, http://www.nei.org/News-Media/News/News-Archives/5-Reasons-Nuclear-Energy-Is-Vital-to-EPA-s-Clean-P30 Nuclear Energy Institute, http://www.nei.org/Knowledge-Center/Nuclear-Statistics/US-Nuclear-Power-Plants (accessed March 2016)31 World Nuclear Association, http://www.world-nuclear.org/info/Country-Profiles/Countries-T-Z/United-Arab-Emirates/ (accessed March 2016)32 World Nuclear Association, http://www.world-nuclear.org/info/Country-Profiles/Countries-A-F/China--Nuclear-Power/ (accessed March 2016)33 World Nuclear Association, http://www.world-nuclear.org/info/Country-Profiles/Countries-G-N/India/ (accessed March 2016)34 World Nuclear Association, http://www.world-nuclear.org/info/country-profiles/countries-o-s/south-africa/ (accessed March 2016)35World Nuclear Association, http://www.world-nuclear.org/info/country-profiles/countries-o-s/south-africa/ (accessed March 2016)36World Nuclear Association, http://www.world-nuclear.org/info/Country-Profiles/Countries-A-F/Brazil/ (accessed March 2016)
EuropeA varied and evolving market:
• As of February 2016, there is a total of 185 nuclear power plant units in operation in Europe, with an installed electric net capacity of 163 GWe18
• 23 new reactors are being built or planned in a number of European countries, including Finland (two)19, the UK (four)20, Slovakia (two)21 and France (one)22
• Several countries look likely to launch nuclear energy programmes in the near term, for example Lithuania and Poland. Belarus has two new nuclear power plants under construction23
• Germany24, Belgium25 and Switzerland26 are due to phase out nuclear between 2022 and 2035.
North AmericaThe world’s largest producer of nuclear power:
• The USA accounts for more than 30% of worldwide nuclear generation of electricity27
• In 2014, the USA’s 100 nuclear reactors produced 798 TWh, over 19% of total electrical output28
• Strong government support and ambitious greenhouse gas reduction targets have paved the way for significant growth in nuclear capacity - for example, President Obama’s Clean Power Plan, announced in 2015, requires domestic power plants to cut carbon emissions by 32% below 2005 levels by 203029
• Five new units are expected to come online by 2020, but historically low prices of fuel used for electricity generation, for example natural gas, combined with a decline or minimal growth in electricity demand continue to challenge the economics of both existing and proposed nuclear power projects.30
Middle East and AsiaEmerging nuclear market with strong growth potential:
• The UAE has four new reactors, totalling 5.6 GWe, due for completion by 2020, with the first expected to come online in 201731
• Mainland China has 30 nuclear power reactors in operation, 24 under construction, and more about to start construction; a three-fold increase in nuclear capacity to at least 58 GWe is expected by 2020/21, with more coming online through to 205032
• India has a flourishing indigenous nuclear power programme; it aims to derive 25% of its electricity from nuclear power by 2050.33
South Africa and South AmericaGrowing nuclear market with business opportunities:
• South Africa has two nuclear reactors generating 5% of its electricity34
• The South African Government has plans for a further 9.6 GWe in the next decade, but financial constraints could hamper expansion35
• Brazil has two nuclear reactors generating 3% of its electricity, and a third under construction; there are proposals for four more large reactors to come online throughout the 2020s.36
Our markets around the world
Financial statementsGovernanceStrategic reportIntroductionContents
< previous next >

22
A view from a crane across the storage raft at one of our enrichment facilities
Financial statementsGovernanceStrategic reportIntroductionContents
< previous next >

URENCO Annual report and accounts 2015 23
Financial statementsGovernanceStrategic reportIntroductionContents
< previous next >

Risk management and mitigation is a key area of focus for URENCO. Across all areas of URENCO, we work hard to raise risk awareness and we have developed a range of measures to help identify, manage and mitigate potential risks and threats which could impact our business.
Our approach Robust risk management is at the centre of our business ethos and operations. It is a vital component of our global leadership within the nuclear industry. As part of our Governance, Risk and Control framework, we follow best practice and ensure we comply with the rigorous legal requirements under which we operate.
Operating in a heavily regulated industry, we focus on managing and overcoming all risks at source through continuous identification, analysis, evaluation and response. Our Executive Risk Management Committee reviews the Group’s top risks, their controls and planned actions, and reports back to the Audit Committee and Board on a regular basis.
Strategic reportPrincipal risks and uncertainties
24
Our risk management framework is based on a three ‘lines of defence’ approach:
Second line Third lineRisk management
& compliance
The Audit Committee oversee the effective operation of the Company’s
risk management framework. The Group Business Assurance and Internal Audit functions support the
business in ensuring the effective implementation of and compliance
with the risk management policies and procedures across
the business.
Governance
Our Internal Audit function provides independent
assurance that controls, implemented either to mitigate or avoid risks, are operated efficiently and effectively across
the organisation.
First lineOperational
management
Operational management are tasked with identifying and assessing risks on an
ongoing basis and are responsible for
implementing and maintaining appropriate
controls aligned to Group Policies and Procedures.
Financial statementsGovernanceStrategic reportIntroductionContents
< previous next >

During the year the Board considered the nature and level of risk that we are prepared to accept in order to deliver our business strategies. The Board has set out the principal risks to achieving its strategic aims here.
1 Safety
DescriptionAcross URENCO, we need to ensure we operate to the highest standards of safety to maintain a safe environment for our colleagues and stakeholders.
MitigationWe seek to operate to the highest standards of safety and have implemented safety management systems, designed to minimise our risks, whilst ensuring that regular monitoring ensures compliance with safety standards.
We focus on continuous improvement and the detection and remediation of potential hazards before incidents have a chance to occur. We also meet regulatory requirements and follow regulatory protocols for the safe handling of uranium and other chemicals. By adhering to best practice in this area we continually seek to ensure minimal impact to employees, contractors, the public and the environment.
2 Markets
DescriptionWe experience on-going challenging market conditions which, exacerbated by on-going price volatility across energy markets, impacts opportunities for growth.
MitigationOur global diversification and flexible plant structure support our ability to remain responsive to changing market conditions, customer demands and opportunities to utilise our technology and capabilities.
We continue to model a broad range of market scenarios and stress test the effectiveness of our commercial strategies, mitigations and responses to new and emerging market threats and opportunities.
We also monitor the ongoing sustainability and robustness of our order book through regular review of our commercial contracts to ensure that any mark to market risks are identified and appropriate early interventions and mitigations are implemented.
3 Safeguards
DescriptionThere is a potential risk for uranic material to be misappropriated from our enrichment facilities.
MitigationURENCO works closely with governments and organisations to create and comply with safeguard regimes and we continually maintain and review our uranium tracking methods on site.
A common set of safeguards is applied across the organisation to ensure non-proliferation and prevent the misappropriation of uranic material.
Our safeguard programmes are also supported by a rigorous accounting and audit approach to the uranic materials we keep on site to ensure that we consistently meet the stringent inspection criteria set by IAEA and EURATOM.
4 Security
DescriptionWe need to ensure the security of uranic material and our own technology and assets, particularly with regards to the increasing threat of cybercrime to the energy sector.
MitigationWe continue to work closely with the relevant government bodies, across the jurisdictions in which we operate, (for example GCHQ in the UK and the Department of Homeland Security in the USA) to ensure that we comply with all applicable national and international security requirements and understand the nature of new and emerging physical and cyber security threats.
Each of our sites are also supported by dedicated security resources to control access to sites, actively screen all personnel and ensure appropriate security policies and procedures are implemented. The ongoing monitoring of the effectiveness of security polices and arrangements are monitored and risk assessed on an ongoing basis by the URENCO Group Security function.
5 Transport
DescriptionThe availability and willingness of third party logistics providers, regulators or port authorities to transport or accept uranic materials may impact our ability to optimise the benefits of a global infrastructure.
MitigationThe safe behaviour of our transportation partners is guided by the standards we set at URENCO. Such standards reduce the risk of an accident or the misappropriation of sensitive materials.
We only place contracts with approved companies and ensure we perform regular contract and performance monitoring audits. We adhere to IAEA guidelines and all other national and international regulations regarding the transportation of fissile material, and we go beyond regulatory requirements in aspects of our own logistics procedures.
6 Policy
DescriptionThe nuclear industry remains a topic for debate with public and governmental opinion differing on its role in the future energy mix. In any jurisdiction, a change in government can bring about a change in policy, while unanticipated events can also change policy direction.
MitigationURENCO continually monitors nuclear policy around the world and on a regular basis, engages with policy makers and stakeholders to ensure that the benefits of nuclear as a sustainable, long-term and low carbon source of energy are understood and considered as part of both the energy debate and future government policy.
URENCO Annual report and accounts 2015 25
Financial statementsGovernanceStrategic reportIntroductionContents
< previous next >

10 Counterparty risk
DescriptionWe could be exposed to credit risk predominantly through transactions with other participants in the nuclear supply chain.
MitigationURENCO actively monitors the creditworthiness of commercial counterparties and has a set of limits with different levels of authority for sign off. We also incorporate appropriate credit protection clauses in all customer contracts to ensure payment protection.
Our exposures to financial counterparties are managed through a counterparty credit exposure policy which sets credit limits based on counterparties’ credit ratings.
11 Project management
DescriptionURENCO is committed to the ongoing investment in its physical infrastructure to ensure it has the capability and capacity to meet its current and future needs.
Given the size and complexity of our projects there is a risk that we do not select the right project delivery strategies to ensure the effective management of project costs, schedule, quality of design, construction and commissioning.
MitigationProjects are subject to appropriate governance structures and contracting frameworks are implemented to manage the effective delivery of capital investments and to maximise cost and schedule certainty. Risk-based performance parameters and incentive frameworks are also established on a project by project basis to further address the risks inherent in project delivery.
Projects are also subject to management, commercial and internal audit assurance reviews to monitor project performance and to ensure that adequate project controls and contractual arrangements are in place to support early identification and resolution of risks and issues.
12 Long-term nuclear liabilities
DescriptionThe cost and timing of URENCO’s long-term nuclear decommissioning activities are subject to external factors which URENCO can influence but not control. For example, Government policy for long-term disposal costs of depleted U3O8.
MitigationURENCO continues to work with its regulators and government agencies, in partnership with other nuclear operators and stakeholders, to ensure that a sustainable and economically viable solution for the long-term storage of uranic material is developed.
13 People
DescriptionWe need to ensure we make the necessary investment in our people and succession planning processes to guarantee that we have the appropriate skills and experiences to support URENCO’s long-term sustainability.
MitigationFocused development programmes are in place across the organisation to ensure that our colleagues’ development plans are aligned with the organisation’s needs and support the development of a pipeline of talent.
7 Regulation
DescriptionOur operations and development are controlled by our ability to meet the stringent regulatory requirements of each country we operate in and supply. We are answerable to multiple national governments and subject to penalties if required standards are not met.
MitigationURENCO maintains compliance activities across the business. Our strong relationships with government regulators are managed locally by our Heads of Compliance at our production sites, while our URENCO Group functions also maintain good dialogue with both national and trans-national regulators (e.g. the IAEA) and other governmental agencies.
All learning elicited from our engagement with regulators is then shared across the URENCO Group through internal workshops and communications. Our focus on innovation and performance enables us to guide and share best practice across the industry as a whole.
8 Pricing
DescriptionPrices in the longer term fail to recover to the level needed to sustain ongoing investment in enrichment capability and threaten future centrifuge innovation and development.
MitigationOur current long-term contracts with customers incorporate agreed forward pricing, to mitigate short-term price risk.
We also ensure that while our responses to new market opportunities are competitive and offer a clear value proposition to our customers, they do not compromise our ability to support and finance re-investment and the ongoing manufacturing and development of our enrichment technology.
9 Financial volatility
DescriptionSignificant fluctuations in exchange rates may impact the predictability of the business model and introduces complexity and volatility to URENCO’s income statement.
MitigationThe Group mitigates its exchange rate exposure by hedging a portion of its forecast US dollar revenues and of its forecast sterling capital expenditure. This reduces the volatility of the Group’s cash flows and reported earnings. The Group also mitigates currency exposure by holding a portion of its borrowings in US dollars and in euros to align with its assets.
To manage our interest costs, we adjust the proportion of our fixed rate to floating rate borrowings by the use of interest rate swaps. We have also taken advantage of recent low interest rates to issue fixed rate bonds.
We also regularly forecast the cash requirements of the business including projected cash flows from operations, projected capital expenditure, and the maturity of existing borrowings. Our Treasury department manages liquidity risk by ensuring that adequate medium-term committed funding is always available to meet our needs.
26
Financial statementsGovernanceStrategic reportIntroductionContents
< previous next >

URENCO Annual report and accounts 2015 27
Employees make some checksin the enrichment hall at one
of our enrichment facilities
Financial statementsGovernanceStrategic reportIntroductionContents
< previous next >

28
Sustainability goes to the very heart of our business. Nuclear power plays an essential role in meeting the world’s low carbon energy demands and its production requires processes that are efficient, safe and cost-effective. Being a responsible business is a core part of our global role in enrichment services.We believe that good corporate citizenship goes hand in hand with long-term commercial success – and like any business we want to live up to our corporate responsibilities. This is a view that resonates with our customers; in our 2014 Customer Survey, 95% of those questioned said that a supplier’s approach to corporate responsibility was ‘important’ to them.37
Our approach to sustainability
We have made significant progress in recent years in the way we manage sustainability at URENCO. Each quarter, sustainability data is collected, interrogated and shared with Executive Management. The Managing Directors of each enrichment facility are accountable for the sustainability performance of their sites, with additional accountability assigned to sponsors of each Focus Area within our sustainability strategy. To demonstrate our commitment in this area, in 2013 we established a Sustainability Committee with Board-level involvement. The Sustainability Committee holds regular meetings with senior management across the Group. This approach supports our objective to incorporate sustainability into all operational and strategic decision making.
In 2015, we reached a key sustainability milestone by achieving G4 Core requirements from the most up-to-date Global Reporting Initiative (GRI) sustainability reporting guidelines (G4) for our Group Sustainability Report 2014. This reflects our engagement with clear and accountable reporting practices. Additionally, we introduced sustainability KPIs for the first time within each of our focus areas. Also in 2015, we established a Sustainability Programme Team which oversees the delivery of all sustainability initiatives at URENCO and reports directly to the Sustainability Committee.
Our sustainability strategyOur sustainability strategy focuses on six key areas of sustainability. These are:
Strategic reportSustainability
References37 URENCO internal data, Global Customer Survey 2014, September 201438 ZERO HARM is an internal initiative to provide employees with a memorable acronym to ensure safety is always being considered. Please see our Sustainability Report 2015 for more information on ZERO HARM.39 From 1980 to 1983, the Hexapartite Safeguards Project (HSP), involving Australia, Euratom, the IAEA, Japan, the USA and the “Troika” consisting of Germany, the Netherlands and the UK negotiated how best to carry out safeguards inspections in centrifuge enrichment plants.40European Safeguards Research and Development Association
Financial statementsGovernanceStrategic reportIntroductionContents
< previous next >
Health and safety, safeguards and securityHealth and safety, safeguards and security are vital elements of our culture and are championed by our employees and contractors across the Group. At all our facilities, our operations are checked and regulated by government authorities.
Health and SafetySafety is our core priority. In 2015, we had six LTIs, compared to 11 in 2014. We renewed our focus on behavioural safety across the Group.
Our ZERO HARM38 campaign aims to embed a system of safety behaviours and values across the Group. It includes quarterly communications to employees around the ZERO HARM principles, plus monthly features on safety issues specific to URENCO.
In 2015, we developed a new Safety Plan to support the ongoing delivery of ZERO HARM into 2016 and beyond. The new plan includes increased leadership visibility and on-site interaction with workers; cross-site health and safety audits; awareness raising and shared learning; and an aligned safety communications strategy. More information on our work in this area can be found in our 2015 Sustainability Report.
We take the health and wellbeing of our employees and contractors very seriously. As part of our commitment in this area, we have developed a range of measures designed to keep our people fit and well. Across the Group, we provide a variety of initiatives including monthly wellness newsletters, quarterly health challenges, sports and healthy living initiatives and general health initiative schemes.
Through the work of Stable Isotopes, one of URENCO’s business units, we also contribute to health and wellbeing on a broader scale. Stable Isotopes harnesses our centrifuge technology and enrichment processes for use in industry, medicine and science. Each year, more than one million patient treatments are performed using radioactive sources from Stable Isotopes’ enriched materials. More information on Stable Isotopes can be found in our 2015 Sustainability Report.
SafeguardsURENCO has a dedicated Safeguards culture. Enrichment is one of the most proliferation-sensitive parts of the nuclear fuel cycle, which needs an effective non-discriminatory Safeguards regime. Non-proliferation aspects are considered throughout all company business areas, from contract negotiations through to implementation of operational procedures.
We have many years’ experience in the development and implementation of Safeguards regimes in Gas Centrifuge Enrichment Plants (GCEPs). The current Safeguards regime for GCEPs, which is based on the Hexapartite Safeguards Project and the Additional Protocol39 and recently improved by the Partnership Approach between Euratom and the IAEA, was substantially shaped by active URENCO contributions.
We take a strong interest in sharing our Safeguards experience with other stakeholders. This is regularly done by participation in, and active contribution to, international Safeguards conferences such as ESARDA40, INMM and GCEP-specific international workshops. We also host IAEA safeguards inspection training courses on URENCO sites.
SecurityURENCO invests in comprehensive measures to ensure the security of our sites and operations, including physical, personnel and cyber security threats and risks. These include rigorous screening processes and stringent on-site security precautions for anyone accessing our sites. We also operate multiple layers of cyber security controls to address information security requirements in both IT and operational technology. We comply with all relevant industry and regulatory standards and maintain various security certifications for people, processes and technology across all our locations.
Environmental impactWe are committed to minimising the environmental impact of our business and achieving greater efficiencies across our facilities.
Our Energy Savings Group drives accountability and action for energy efficiency and optimisation. Specific initiatives include on-going preparation for the rollout of TC21 centrifuge efficiency upgrades at URENCO USA during 2016. These upgrades were implemented at URENCO Deutschland in 2014.
An investigation into potential TC12 centrifuge efficiency upgrades will be complete by early 2016.
Across the Group, LED lighting upgrades continue, with the UF6 handling areas and technical support building at URENCO USA all now equipped, as well as a third of the facility at URENCO Deutschland.
We also play a leading role in responsible uranium stewardship and environmental protection. The construction of the TMF in the UK is our major commitment in this area. Once complete, the TMF will enable URENCO to deconvert tails by-product and recycle circa 5,000 tonnes of hydrogen fluoride a year. We also run a range of decontamination, storage and waste minimisation initiatives.
Supplier of choiceWe pride ourselves on the strength of our customer relationships. These relationships are underpinned by quality, flexibility and reliability. During 2015, we maintained our 100% record for customer deliveries and met all orders on time. We also continued to build on the satisfaction levels for our enrichment services (81%) and customer relationships (76%) achieved in our 2014 Global Customer Survey.
Download the freeLayar App
Scan this page
Discoverinteractive content
INTERACTIVE PRINT
URENCO Annual report and accounts 2015 29
Financial statementsGovernanceStrategic reportIntroductionContents
< previous next >
Employer of choiceWe want to be recognised as an employer of choice – a company that offers an inspiring and fulfilling working environment for all our employees. In March 2015, we conducted a Group-wide Employee Survey. With a record response rate of 95.6%, the survey showed improvements in the majority of themed areas compared to 2013, confirming that we have sustained a high level of commitment and engagement. Survey highlights include (scored out of 10):
– Commitment and Engagement: both remained high at 7.6 and 7.3 respectively (benchmark41 6.9 and 6.7)
– Clarity on safety regulations: steady at 8.2 (benchmark 7.5)
– Level of pride in the organisation, how well employees fit in and support URENCO’s strategy all improved compared to 2013 and were significantly higher than the benchmark
– Satisfaction: above the external benchmark.
During 2015, we continued to invest in employee development. Looking to ensure we have the expertise to sustain our business over the long-term, 181 people participated in Leadership Training across the Group. We also focused on expanding the capabilities of our talent base and monitor diversity.
Community engagementBuilding strong links with the local communities where we operate is a core aspect of our sustainability programme and one of our principal responsibilities.
Across the URENCO Group, we support local communities through both practical and financial investments focused on education, environment, healthy living and culture. Through our community and education programmes, we enhance people’s understanding of our industry and nurture interest in science among school children.
During 2015 we expanded our Richie science workshops in the Netherlands, UK, the USA and Germany, inspiring more than 27,000 schoolchildren to learn about science in a fun and engaging way. We also continued our work with the British Science Association (BSA) to extend our Richie rollout as part of the UK-wide CREST Star framework. In addition, across the Group we delivered a range of employee fundraising and volunteering programmes.
2015 was a special year for STEM education at the company. URENCO launched a partnership with the Science Museum to complement our ethos of nurturing interest in STEM subjects through activities such as our Richie educational programme, to nurture and inspire the energy leaders of the future.
Further details of our community initiatives are in our 2015 Sustainability Report.
Asset integrityAs a long-term business, it is imperative to ensure that our plant components, systems and infrastructure continue to function efficiently. As such, asset integrity lies at the very heart of URENCO’s overall strategy.
In 2015, we continued to invest in our facilities and equipment across the Group. We accelerated our asset improvement programme in the UK and introduced new facilities in the Netherlands, while conducting a Group-wide review based on our asset integrity audit in 2014.
30
References41The external benchmark is a comparison with Effectory International’s Global Employee Engagement Index for the regions where URENCO is active (US and Europe).42GCSE (General Certificate of Education) is a qualification in a specific subject typically taken by school students in the UK aged 14-16. 43For more information on CREST Discovery, aimed at 11-14 year olds, please visit: http://www.britishscienceassociation.org/crest-discovery44Key Stage 3 is the term for the period of schooling in schools in England and Wales when pupils are typically aged between 11 and 14.
Financial statementsGovernanceStrategic reportIntroductionContents
< previous next >

Download the freeLayar App
Scan this page
Discoverinteractive content
INTERACTIVE PRINT
URENCO Annual report and accounts 2015 31
Case studyRichie: URENCO’s science ambassador
The ongoing challenges around energy security and developing a low-carbon economy can be supported by nurturing a new generation of science leaders.
URENCO’s Richie Programme aims to inspire our future scientists by running activities for school children up to the age of 16.
Through our Richie science workshops in the Netherlands, the UK, the USA and Germany, primary school children experience and learn about science in a fun and interactive way. The workshops, which are attended by URENCO employee volunteers, bring the science that supports our operations alive through a series of practical experiments. Our aim is to use Richie to nurture the young engineers and scientists of the future. Since 2007 more than 87,000 school children have participated in our science education outreach programmes.
In 2015, a highlight for our Richie programme was the Richie Lecture, held in December at the Science Museum in London. Titled ‘The Energy Leaders of the Future’, it aimed to inspire secondary school students to study science and engineering subjects at GCSE42, and in turn to develop a new generation of science leaders.
Dr Gabrielle Walker, the TV presenter and leading voice on energy matters, gave a keynote address to 300 students on the importance of energy to our daily lives and explained how studying STEM subjects opens doors when starting a career.
The event included a private viewing of the Science Museum’s Engineer Your Future exhibit and gave students the opportunity to speak directly to young people who are studying STEM subjects at an advanced level.
The lecture was held in partnership with the British Science Association (BSA), one of the UK’s leading science organisations. Significantly, the audience was almost exactly half male and half female, defying the often-held belief that sciences are male dominated subjects.
A video of the Richie Lecture is available to watch at www.learnwithrichie.com/teachers/richie-lecture, and the Richie Lecture 2016 will take place again later this year.
In 2015, we also continued our work with the BSA to extend our Richie rollout as part of the CREST Star Framework – a UK-wide award scheme which enables children to solve STEM problems through practical investigation. 2015 marked the end of the first full academic year since the materials were introduced and feedback has been excellent, with an overall reach of more than 15,000 school children. Given this success, URENCO will be working with the BSA in 2016 to develop a Discovery Award43 which is targeted at Key Stage 344 students. In this way, students who participate in URENCO’s Key Stage 2 activities at primary school will be able to continue with URENCO-inspired classroom materials and activities into secondary school.
At the Richie Lecture in December 2015, students experienced the inside of a centrifuge through URENCO’s virtual reality headsets.
Financial statementsGovernanceStrategic reportIntroductionContents
< previous next >

32
Financial statementsGovernanceStrategic reportIntroductionContents
< previous next >

URENCO Annual report and accounts 2015 33
UF6 filling stations operating with improved efficiency at one
of our enrichment facilities
Financial statementsGovernanceStrategic reportIntroductionContents
< previous next >

Results for 2015RevenueRevenue for the year ended 31 December 2015 was €1,842.2 million, compared to €1,612.0 million in 2014. This year-on-year increase of €230.2 million was due primarily to additional SWU revenue of €161.1 million and additional Uranium revenue of €48.3 million as a result of both higher volumes and higher average unit revenues driven by beneficial foreign exchange movements.
EBITDAEBITDA for 2015 increased by 9.0% to €1,167.3 million compared to last year (2014: €1,070.8 million) which was mainly due to the increased revenue. The EBITDA margin for 2015 of 63.4% (2014: 66.4%) was adversely impacted by increased costs following a periodic review of tails and decommissioning provisions.
Net incomeNet income increased by 11.8% to €452.1 million (2014: €404.5 million) corresponding to a net income margin of 24.5% (2014: 25.1%). This increase in net income was mainly due to increased EBITDA, and lower income tax expense due to the tax effect of non-taxable and non-deductible items, partially offset by higher depreciation.
Depreciation was €496.1 million in 2015 compared to €417.9 million in 2014, reflecting a higher underlying charge for USA operations as well as an adverse impact from foreign exchange movements.
Net finance costs for 2015 were €131.5 million, compared to €131.7 million in 2014, with an increase in costs associated with the refinancing of debt being offset by a favourable impact from foreign exchange movements on cash flow hedges.
Joint ventureIn response to the changing global market, the restructuring of Enrichment Technology Company (ETC) is substantially complete. We have reduced capacity significantly whilst retaining the essential skills required to meet future demand for centrifuge technology, thereby protecting our long-term capabilities in this area and being a responsible partner.
Cash flowOperating cash flows before movements in working capital amounted to €1,325.0 million (2014: €1,132.7 million) and cash generated from operating activities was €1,201.5 million (2014: €979.2 million) as a result of higher revenues partially offset by increased operating costs and adverse working capital movements.
Tax paid in the period was €121.7 million (2014: €145.7 million). Net cash flows from operating activities increased by 29.6% to €1,079.8 million (2014: €833.5 million).
Net cash flows from operating activities are used to finance investing activities, to service the Group’s debt and, in the future, to finance the long-term nuclear decommissioning funds which will meet the Group’s liabilities in this area.
EBITDA performance
2015€m
2014 €m
% increase/
(decrease)
Income from operating activities 664.6 652.9 2%
Add back: depreciation and amortisation 496.1 417.9
Add back: share of results of joint venture 6.6 0.0
EBITDA 1,167.3 1,070.8 9%
Financial performance
Revenue
EBITDA
Income from operating activities
Net income
Basic earnings per share (RH scale)
Five year summary funding ratios
EBITDA / Net Interest
EBITDA / Net Interest 2015
Ratio of funds from operations to total adjusted debt (FFO/TAD) (RH Scale)
Financial performance€€million
EBITDA / Net Interest (LH scale)
EBITDA / Net Interest 2013 (LH scale)
Ratio of funds from operations to total adjusted debt (FFO/TAD), as at the end of the year (RH scale)
3.0
2.5
2.0
1.5
1.0
0.5
0
€
3.0
2.5
2.0
1.5
1.0
0.5
0
20132012201120102009
20152014201320122011
1600
1400
1200
1000
800
600
400
200
0
€million
2000
1400
1600
1800
1200
1000
800
600
400
200
0
Five year summary funding ratiosEBITDA/ %INTEREST
8.37.3 7.0
8.2 7.9
20132012201120102009
1086420
25
20
15
FFO/TAD%
EBITDA/INTEREST
6.0
20152014201320122011
1086420
25
20
051015
0
2
4
6
8
10
0
5
10
15
20
25
7.08.2 7.9 7.5
34
Strategic reportGroup Finance Report
Increased deliveries in 2015 resulted in improved sales and EBITDA compared to 2014.
Financial statementsGovernanceStrategic reportIntroductionContents
< previous next >
Home

Capital expenditureThe Group invested a total of €517.4 million in 2015 (2014: €537.1 million), reflecting the conclusion of our capacity expansion programme in the USA and the ongoing investment in TMF of €208.8 million (2014: €153.7 million). Commercial operation of TMF is scheduled for 2017.
Capital structureThe Group’s equity increased to €2,430.3 million during the year (2014: €2,145.1 million) due to increased retained earnings of €143.0 million, a decrease in hedging reserve of €156.4 million, and an increase in foreign currency translation reserve of €298.6 million mainly due to the weakening of the euro against the US dollar.
The Group monitors its capital structure through the use of financial ratios, principally those of net debt to total assets and funds from operations to total adjusted debt (FFO/TAD).
Net debt increased to €2,827.5 million (2014: €2,774.0 million). The Group’s net debt to total asset ratio remained strong at 36% (2014: 38%) well within the Group’s target ratio of less than 60%.
The Group targets an FFO/TAD ratio that results in a strong investment grade credit rating. The FFO/TAD ratio was 21.7% (2014: 20.8%) as EBITDA, the main component of FFO, has increased, mitigating the impact of increased Net Debt and nuclear provisions.
The Group’s interest cover also remains strong at 6.0x (2014: 7.5x).
Group pension fundsURENCO operates a number of pension schemes for our employees in the Netherlands, UK, the USA and Germany. These are a mixture of defined contribution and defined benefit schemes.
The net liability for the Group’s defined benefit pension schemes at 31 December 2015 was €70.9 million (2014: €101.6 million). This decrease was due to the increase in the fair value of the plan assets of €14.0 million and the €16.7 million decrease in the present value of the defined benefit obligation.
Following the 2012 triennial valuation deficit repair payments of £6.5 million are being made annually for seven years, until 2020. The Group started the triennial valuation of the UK scheme in 2015 which has been closed to new starters since 2008. The review is expected to be completed in 2016. The latest preliminary results show a continuing deficit and increased future costs for providing the final salary benefits.
In response to the escalating costs associated with the UK defined benefit scheme, the Group has commenced consultation with regard to the potential closure of the UK defined benefit scheme to future contributions for most members and the provision of alternative arrangements structured on a defined contribution basis.
2015 Capital expenditure(€517.4 million)
2014 Capital expenditure(€537.1 million)
European Enrichment Sites €133.6m
USA Enrichment Site €175.0m
TMF €208.8m
European Enrichment Sites €86.1m
USA Enrichment Site €297.3m
TMF €153.7m
Property, Plant & Equipment
Property, Plant & Equipment 2015
Net Debt
Property, plant & equipment vs debt
€527m
European Enrichment Sites €77.9m
USA Enrichment Site €345.1m
TMF €163.8m
€m
20152014201320122011
500060007000
4000300020001000
0
2,963
4,285 4,662 4,8215,369
3,5564,285 4,662 4,821
6,016
20132012201120102009
€m50004000300020001000
0
010002000300040005000600070008000
URENCO Annual report and accounts 2015 35
Financial statementsGovernanceStrategic reportIntroductionContents
< previous next >

Plant and machinery decommissioning We have an obligation under our operating licences to decommission our enrichment facilities safely once they reach the end of their operational life. During 2015 the Group carried out a periodic review of the costs associated with plant and machinery decommissioning.
In 2015 the decommissioning provision increased by €51.5 million (2014: €14.8 million) due to the installation of additional plant and machinery of €4.4 million (2014: €6.4 million), additional container purchases of €11.9 million (2014: €8.4 million) and the impact of the periodic decommissioning review (primarily associated with the costs of decommissioning cylinders) of €35.2 million (2014: nil).
The addition to the decommissioning provision associated with the installation of plant and machinery and additional container purchases has been recognised as an equivalent addition to the decommissioning asset in the statement of financial position.
Tails deconversion, storage and eventual disposal We provide for the costs of deconverting the by-product of the enrichment process (chemically converting tails from UF6 to U3O8), long-term storage and eventual disposal. During 2015 the Group carried out its periodic review of the costs associated with tails deconversion, storage and disposal.
In light of the fact that URENCO UK, URENCO Netherlands and URENCO Deutschland all intend to contract with URENCO ChemPlants (a wholly owned subsidiary which owns TMF) for deconversion services from 2017, the basis of the provisions associated with deconversion services has been revised from the current contracted rate with Areva to a rate reflecting the intra-group cost of deconversion using TMF. As a consequence, URENCO UK, URENCO Netherlands and URENCO Deutschland have also updated their associated transport cost assumptions to reflect the change in location of the deconversion facility.
Additional tails provisions in the year were €182.9 million (2014: €149.2 million), with €130.0 million of the increase due to higher production rates of tails and €52.9 million due to impact of the periodic review.
Provisions utilised during 2015 were slightly lower at €43.5 million (2014: €48.3 million) due to decreased deconversion activity.
Further information on nuclear provisions can be found on pages 104 and 105.
Order book We have a strong order book which extends beyond 2025 with an approximate value at 31 December 2015 of €16.6 billion based on €/$ of 1 : 1.09 (2014: €15.8 billion based on €/$ of 1 : 1.30).
Funding position
In August 2015, URENCO issued €500 million in bonds with a coupon of 2.25%, which will mature in 2022. The proceeds were used to repay short-term debt and manage future debt maturities, including a tender which resulted in a repurchase of part of the 4% Eurobonds due in May 2017. The nominal value of the repurchased bonds was €137.6 million.
Liquidity continues to remain strong as a result of cash flow generation and proceeds from the bonds raised in 2015. As at 31 December 2015 the Group has €925 million of committed undrawn revolving credit facilities as well as cash and short-term deposits of €391.3 million (2014: €522.3).
Our funding position remains robust and continues to be underpinned by our strong order book, which gives long-term revenue visibility, and robust EBITDA margins, resulting in significant cash flow generation.
The Company’s debt is rated by Moody’s (Baa1/Stable/P-2) and Standard & Poor’s (BBB+/Stable). In June 2015 URENCO announced that it was no longer retaining the services of Fitch.
Funding programme The Group’s funding strategy is to:
• Use a range of financial instruments and financial markets in order to exploit attractive funding opportunities as they emerge.
• Maintain a core of longer-dated debt and committed borrowing facilities, consistent with the long-term nature of the Group’s investments and the need to maintain an optimised long-term capital structure.
• Manage debt maturities by raising funds in advance of ultimate repayment dates of debt instruments.
The average time to maturity of the Group’s debt at 31 December 2015 was 5.7 years (at 31 December 2014: 5.4 years).
Managing foreign currency risk Our foreign currency hedging policy has the twin objectives of reducing volatilities in net cash flow and income. However, a long-term reduction in income exposure is much more difficult to achieve due to the strict requirements with respect to hedge accounting under IFRS. The functional currency of URENCO Limited is sterling, although the company reports its results in euros.
The Group receives most of its customer revenues in US dollars and euros. URENCO hedges the net cash flows of its European business, by selling US dollar customer revenue and buying forward the sterling required to meet the costs of the UK operations; and selling the remaining US dollars to buy euros. The net cash flows of the USA business of URENCO have been used to pay US dollar denominated costs.
The Group smooths the impact of changes in foreign exchange rates by using a progressive rolling programme of buying and selling currency over a period of up to six years ahead. This medium-term hedging period strikes a balance between the objective of maximising cash flow certainty (which suggests a long hedging period) and the objective of maintaining a hedge portfolio that largely qualifies for hedge accounting under IFRS. URENCO has a stable future revenue stream that is managed using a portfolio of financial hedges. There is always an element of uncertainty due to changes in quantities and timing of deliveries based on market movements and customers’ requirements, which makes it difficult to achieve effective hedge accounting over the longer term. The movements on the ineffective portions of effective revenue hedges amounted to a net finance income of €23.0 million (2014: net finance cost of €23.3 million).
During the year, URENCO entered into €1.0 billion of cross currency swaps to convert the economic exposure of part of the Group’s debt from euros to US dollars. This better aligns the currency of the debt with the asset base and cash flows of the Group.
Strategic reportGroup Finance Report continued
36
Financial statementsGovernanceStrategic reportIntroductionContents
< previous next >

Interest bearing loans and borrowings (€3,219 million)
EIB (€532m)
European Private Placements (€112m)
US Private Placements (€322m)
Eurobonds (€2,099m)
Other loans (€154m)
Hedged and monthly exchange rates
$ to € exchange rate
Average rate of hedges in place
URENCO Group Financial Policy Statement The Financial Policy of the Group defines the broad parameters for financing the company and has the agreement and support of all of our shareholders.
The Group will finance itself through a combination of equity, including retained reserves and debt. For these purposes, long-term unfunded decommissioning liabilities are treated as debt. URENCO Limited cannot issue new equity without the agreement of all of its shareholders.
In order to achieve an efficient financial profile, the gearing level and financial ratios will be maintained to retain a solid investment grade credit rating for the Group.
At all times, the Group will maintain sufficient liquidity to ensure that it is a going concern and will manage the composition of its debt to minimise risks from market deterioration in liquidity, interest rates or currencies. Detailed treasury management policies set parameters for the management of these risks.
Dividend policy The Group will aim to pay a dividend out of its annual earnings. The dividend shall be set to take account of net profit, cash flows, reserves and the level of credit ratios. Until financial ratios comfortably exceed the minimum threshold for BBB+ at S&P and Baa1 at Moody’s, the annual dividend will not exceed 100% of the net income for the year. A lower dividend may be set when credit ratios, cash flow or funding conditions dictate that this is necessary and, equally, a higher dividend may be declared when the minimum thresholds of the key financial ratios are comfortably exceeded.
In 2015 €340.0 million in dividends for the year ended 31 December 2014 was paid to shareholders (2014: €340.0 million).
Outlook URENCO anticipates pricing pressures to continue in the near term due to the presence of excess inventories. It is possible that URENCO will experience ongoing challenges to profit margin in the coming years. However, URENCO is a company which takes a long-term view and is confident in its ability to provide customers with the best possible service delivery and the highest level of quality and expertise.
The Strategic Report was approved by the Board of Directors on 2 March 2016 and signed on behalf of the Board by:
Stephen Billingham Chairman
Funding facilities at 31 December 2014(€million)
Bank loans (€896m)
EIB (€526m)
European Private Placements (€184m)
US Private Placements (€470m)
Eurobonds (€1,000m)
1.5
RATE
1.4
1.3
1.2
1.1
1.02011 2012 2013 2014 2015
0.9
1.2
1.5
Download the freeLayar App
Scan this page
Discoverinteractive content
INTERACTIVE PRINT
URENCO Annual report and accounts 2015 37
Financial statementsGovernanceStrategic reportIntroductionContents
< previous next >
1. Stephen Billingham
Chairman (from 1 January 2016)
Stephen is Chairman of Anglian Water Group, Chairman of Punch Taverns plc and a non-executive director of Balfour Beatty plc. Stephen was Finance Director (CFO) of British Energy Group plc, the FTSE 100 company and the UK’s largest electricity generator. Prior to joining British Energy, he was the Group Finance Director (CFO) of the international engineering and design consultancy, WS Atkins plc. He was the Finance Director of the team that signed the Metronet/London Underground Public Private Partnership. He has been Group Treasurer of the engineering group BICC plc (now Balfour Beatty plc) and the utility Severn Trent plc and has held finance positions in Burmah Oil plc and British Telecom plc. Stephen joined the URENCO Board in September 2009 and was appointed Chairman on 1 January 2016. Year Of Birth 1958.
2. Thomas Haeberle
Chief Executive Officer (from 1 January 2016)
Thomas joined URENCO in December 2015 and became Chief Executive Officer on 1 January 2016, at which time he joined the URENCO Board.
Thomas gained a PhD in Chemical Reaction Engineering from the University of Erlangen-Nürnberg. He started his career in 1987 at Röhm GmbH, the manufacturer of Plexiglas. He progressed his career with the company throughout its transition to Degussa GmbH and thereafter Evonik Industries AG.
Thomas was appointed President and CEO of Infracor GmbH, the key service provider of Marl Chemical Park, from 2003 to 2006 and he has also served as President of Degussa’s Methacrylates, Building Blocks and Industrial Chemicals Business Units. He was appointed to the Board of Evonik Degussa GmbH in 2009 and Evonik Industries AG in 2011. Year Of Birth 1956.
3. Ralf ter Haar
Chief Financial Officer
Ralf joined URENCO in June 2014 and was appointed Chief Financial Officer (CFO) of URENCO Limited in November 2014. He joined URENCO from NXP Semiconductors N.V., where he held the position of Senior Vice President and Corporate Controller. Prior to joining NXP in 2009, Ralf served as Alcatel-Lucent’s CFO for the Asia Pacific Region, based in Shanghai, and its Global Head of Trade & Project Finance, based in Paris. Ralf started his career in banking, with ABN AMRO, where he held various positions in the investment banking division as well as the international network. He holds a MSc in economics and a LLM in business law from the Erasmus University in Rotterdam. Ralf joined the URENCO Board in November 2014. Year Of Birth 1965.
Strategic reportThe Board of Directors
4. George Verberg
Deputy Chairman and Chairman, Remuneration and Appointments Committee
George graduated from the Netherlands School of Economics of the Erasmus University. From 1971 to 1974 he was at the Ministry of Education, Culture and Science. In 1974 he moved to the Ministry of Economic Affairs where he held the positions of Director General for Trade and Services, and Director General for Energy. He joined NV Nederlands Gasunie in 1988 and was CEO from 1992 to 2004. He was appointed President of the International Gas Union from 2003 to 2006 and joined the URENCO Board in December 2003. George is Deputy Chairman and also Chairman of the Remuneration and Appointments Committee. Year Of Birth 1942.
5. Richard Nourse
Non-executive Director
Richard is Managing Partner of Greencoat Capital LLP, the renewable energy and cleantech fund manager. Richard is also a Director of Enrichment Holdings Limited, the company through which the British Government holds its shareholding in URENCO, having previously been a Director at the Shareholder Executive, part of the British Government. Until 2007, he held senior positions at Merrill Lynch, including Head of the EMEA Energy and Power Team. Richard started his career in the City over 25 years ago with Morgan Grenfell. He joined the URENCO Board in January 2009. Year Of Birth 1964.
6. Frank Weigand
Deputy Chairman and Chairman, Audit Committee (from 1 January 2016)
Frank completed his PhD in Physics at the Max-Planck-Institute for Polymer Research in Germany in 1996. He joined McKinsey in 1996, holding senior positions in serving clients on strategic, organisational and operational issues across Europe and in Asia. Frank was also a member of the leadership group of McKinsey’s ‘Electric Power and Natural Gas’, ‘cement’ and ‘operations’ practices. In 2001, he became Director of Strategy and Quality Management at RWE Systems in Dortmund, Germany. In 2005 he was appointed Director of Corporate Planning and Controlling at RWE Power AG before becoming Vice President Controlling for RWE Group. From 2010 to 2012 he was CFO of RWE npower plc in Swindon, UK. Since 2013, Frank has been CFO of RWE Power AG and RWE Generation SE. He joined the URENCO board in November 2014 and is Deputy Chairman and also Chairman of the Audit Committee. Year Of Birth 1966.
38
1.
2.
3.
4.
5.
6.
Financial statementsGovernanceStrategic reportIntroductionContents
< previous next >

Directors who also served in 2015
7. Alan Bevan
Non-executive Director (from 25 February 2015)
Alan joined E.ON SE in January 2010 as Vice President in the M&A department and became Senior Vice President and Global Head of Mergers & Acquisitions in December 2010. Previously, Alan was responsible for Strategy and M&A at E.ON’s UK subsidiary.
Alan joined the URENCO Board in February 2015 and is a member of the Remuneration and Appointments Committee. Year Of Birth 1967.
8. Miriam Maes
Non-executive Director (from 8 October 2015) and Chair, Sustainability Committee (from 1 January 2016)
Miriam has worked for more than 30 years for multinational companies and over 10 years in the energy and climate change industry.
She became the Founder and CEO of Foresee, an energy and climate change strategy consultancy in 2007. Miriam currently serves as Chairman of the Board of the Elia Group and is also a non-Executive Director on the Boards of Assystem, Naturex and Vilmorin & Cie. In February 2015, Miriam was appointed as a Commissioner on the London Sustainable Development Commission. Miriam first entered the energy sector in 2002 with Texas Utilities (TXU) and subsequently with Électricité de France (EDF) in the UK.
Miriam joined the URENCO Board in October 2015. Year Of Birth 1956.
9. Justin Manson
Non-executive Director (from 1 January 2016)
Justin is a Director of the Shareholder Executive, HM Government, and a member of its Executive Committee. He is a non-Executive Director and member of the Audit and Risk Committee of UK Export Finance.
He was an investment banker at Morgan Stanley for twenty years and before that at CSFB and First Boston for eight years. He has corporate finance, mergers and acquisitions, and capital markets experience across numerous industries and was based in London, New York, Tokyo and Mexico City. He has been an adviser to governments and state-owned companies as well as to multinational companies and financial institutions.
Justin is a trustee of the Chelsea Academy Foundation and has been a trustee of the Royal National Theatre Foundation and a member of its Finance and Investment Committee. He joined the URENCO Board in January 2016 and is a member of the Audit Committee and the Sustainability Committee. Year Of Birth 1960.
10. Sir John Hood
Chairman (until 31 December 2015)
Sir John is the President and Chief Executive Officer of the Robertson Foundation and Chair of the Rhodes Trust. He also serves as a Director on the board of BG Group plc and WPP plc, and as Chairman of Matakina Limited and of Study Group Limited.
In addition to these appointments, Sir John serves on the boards of Teach For All, the Mandela Rhodes Foundation, the Fletcher Trust, the Kawharu Foundation and the Saïd Business School Foundation. He also serves on advisory boards for Singapore Management University, the African Leadership Academy and the University of Oxford’s Medical Sciences Division.
Sir John joined the URENCO Board in January 2012. Year Of Birth 1952.
11. Helmut Engelbrecht
Chief Executive Officer (until 31 December 2015)
Helmut graduated in mechanical engineering from the University of Aachen and has a PhD in nuclear technology. In 1986 he moved to PreussenElektra becoming Head of Corporate Development in 1998, and was appointed Director of E.ON Benelux in 2000. Helmut joined URENCO in 2003 and was appointed CEO in January 2005. He joined the URENCO Board in April 2003. Year Of Birth 1952.
12. Victor Goedvolk
Non-executive Director (until 8 October 2015)
Victor graduated in Economics from Erasmus University in Rotterdam and was subsequently appointed Assistant Professor of Business Economics in the Faculty of Economics. From 1978 he was a staff member of a consultancy firm in the Benelux. In 1983 he joined the Ministry of Finance and was appointed Deputy Secretary General in 1986. From 1990 until his retirement in 2004 he was CFO of Fortis ASR and Non-executive Director of Fortis Bank. He was appointed Vice-Chairman of Ultra-Centrifuge Nederland NV and joined the URENCO Board in April 2003. He currently also holds several non-executive positions in Dutch companies and institutions. Year Of Birth 1944.
13. Bernhard Fischer
Non-executive Director (until 25 February 2015)
Bernhard graduated in mechanical engineering from the University of Hannover. In 1982 he joined PreussenElektra and held several positions in the power plant sector until he became Managing Director of E.ON Kraftwerke in 2000.
From 2002 until 2005 he was responsible for energy business optimisation at E.ON Energie before being appointed as a Board Member of E.ON Energie. In July 2009 he received a PhD degree (Dr. h.c.) from the University of Munich. From 1 January 2010 to March 2014 he was Chief Executive Officer of E.ON-Generation GmbH, being responsible for operation of the whole E.ON Generation Fleet. He currently supports E.ON as special advisor to the Group CEO in Nuclear and Safety. Year Of Birth 1955.
13.
URENCO Annual report and accounts 2015 39
10.7.
12.
8.
9.
11.
Financial statementsGovernanceStrategic reportIntroductionContents
< previous next >
40
Company Secretary Sarah Newby
Registered number 01022786
Registered officeURENCO LimitedURENCO CourtSefton ParkBells HillStoke PogesBuckinghamshire SL2 4JS
Auditors Deloitte LLP2 New StreetLondon EC4A 3BZ
Contents Financial statementsGovernanceStrategic reportIntroduction
< previous next >

URENCO Annual report and accounts 2015 41
GovernanceCorporate governance 42Audit Committee Report 44Sustainability Committee Report 48Remuneration Report 49Directors’ Report 56Directors’ Responsibilities Statement 58
Financial statementsIndependent Auditor’s Report 59Consolidated Group Financial Statements 63Company Financial Statements 111Glossary 128Contacts 130
Financial statementsConsolidated Group Financial StatementsFor the year ended 31st December 2015
Contents Financial statementsGovernanceStrategic reportIntroduction
< previous next >

GovernanceCorporate governanceEnsuring good governance at URENCOOur policy on corporate governance is to follow principles of good governance, transparent reporting and URENCO’s core values. We practise a system of full transparency where management reports regularly and comprehensively to the Board and provides extensive background information for all matters requiring Board approval. All Board decisions are clearly minuted and recorded. In addition, Board representatives, together with external advisers as appropriate, consider in further detail issues of particular complexity through regular meetings of the Audit Committee, Sustainability Committee, Remuneration and Appointments Committee and, where required, special working groups. Our commitment to good corporate governance ensures the Group has clear strategic direction and enables us to assess, control and manage risk effectively.
The UK Corporate Governance Code sets out Principles of Good Corporate Governance and Code Provisions which are applicable to listed companies incorporated in the UK. As a non-listed company, URENCO is not subject to the UK Corporate Governance Code, however we recognise the value of applying the principles of the Code where appropriate.
The Board and its committees
Board composition
The Board consists of the Chairman, six Non-executive Directors and two Executive Directors.
Two Non-executive Directors are appointed by each of URENCO’s three Shareholders. An additional Non-executive Director is elected onto the Board by unanimous resolution of the Shareholders and elected as Chairman by the Board. The two Executive Directors are elected into position by the Board.
The Directors of the Company in office during the 2015 financial year were:
Non-executive Directors
• John Hood Chairman
• Frank Weigand Deputy Chairman and Chairman of the Sustainability Committee
• George Verberg Deputy Chairman and Chairman of the Remuneration and Appointments Committee
• Stephen Billingham Chairman of the Audit Committee
• Richard Nourse
• Victor Goedvolk (until 8 October 2015)
• Miriam Maes (from 8 October 2015)
• Bernhard Fischer (until 25 February 2015)
• Alan Bevan (from 25 February 2015)
Executive Directors
• Helmut Engelbrecht Chief Executive Officer
• Ralf ter Haar Chief Financial Officer
The Directors of the Company in office as at the date of the Annual Report and their biographies are on pages 38-39.
Operation of the Board
The Board has overall control of the Group’s affairs and is responsible to the Shareholders for policies and strategic direction. The Board meets regularly to consider matters specifically reserved for its decision. These include the approval of the strategic business plan, finance policies, budget and financial statements, major capital projects, acquisitions and disposals, major regulatory issues and major policies on environmental, health and safety issues, and senior management appointments.
The Board and its Committees are provided with full and timely information well in advance of meetings. The agenda is set by the Chairman in consultation with the Executive Directors and Company Secretary. Formal minutes recording discussions and decisions of all Board and Committee meetings are prepared and circulated to the respective Board and Committee members.
The Board recognises the need for a reasonable balance between Executive and Non-executive Directors in providing judgement and advice on decision-making. In addition to fulfilling their legal responsibilities as Directors, Non-executive Directors are valued by the Company for the judgement and experience they provide to the Board at Board and Committee meetings.
Board meetings
URENCO’s Board meets regularly throughout the year in order to effectively discharge its duties. During 2015, the Board met six times.
Each year the Board holds one of its meetings at an enrichment facility. In 2015 that meeting was held at URENCO Deutschland.
Board meetings attendanceNumber of
meetings (reflecting the
number of meetings held
while in office)Meetings attended
John Hood 6 6
Frank Weigand 6 4
George Verberg 6 6
Stephen Billingham 6 6
Victor Goedvolk 5 5
Richard Nourse 6 6
Alan Bevan 6 5
Miriam Maes 1 1
Helmut Engelbrecht 6 6Ralf ter Haar 6 6
42
Financial statementsGovernanceStrategic reportIntroduction
< previous next >
Contents

GovernanceCorporate governance continuedBoard committees
The Board has three Committees, the Audit Committee, the Sustainability Committee and the Remuneration and Appointments Committee. More detail of the work of these Committees is contained later in this report. The Committees report formally to the Board after each meeting.
Accountability and audit
The Board has overall responsibility for internal controls, including risk management, and approves appropriate policies regarding Group objectives. The Executive Directors are responsible for identifying, evaluating and managing both financial and non-financial risk and implementing and maintaining control systems in accordance with Board policies.
The Group’s core targets and objectives are set out in the business plan and budget, which are approved annually by the Board. Management reports for the Group are prepared on a quarterly basis and distributed to the Board. In addition, the Board receives monthly reports containing key performance indicators. The plans and reports cover both revenue and expenditure (including capital) and financing.
The Board is also responsible for the Group’s system of internal control and for reviewing its effectiveness. This system is designed to manage rather than eliminate the risk of failure to achieve business objectives, and can only provide reasonable and not absolute assurance against material misstatement or loss.
Additional background information
Shareholding structure
URENCO’s shares are ultimately held one-third by the UK Government (through Enrichment Investments Limited), one-third by the Dutch Government (through Ultra-Centrifuge Nederland Limited), and one-third by German utilities (through Uranit UK Limited). Shares in its German holding company are indirectly held 50% by E.ON Kernkraft GmbH and 50% by RWE AG.
History and wider governance issues
URENCO was founded in 1970 following the signing of the Treaty of Almelo by the governments of Germany, the Netherlands and the UK. It was incorporated as an English private limited liability company on 31 August 1971. The Treaty of Almelo establishes the fundamental principles for supervising effectively URENCO’s technology and enrichment operations with respect to non-proliferation. A Joint Committee of representatives of the governments of the signatory countries exercises this supervisory role but has no role in URENCO’s day-to-day operations. The Joint Committee considers all questions concerning the safeguards system (as established by IAEA and EURATOM), classification arrangements and security procedures, exports of the technology and EUP and other non-proliferation issues. The Joint Committee also considers issues connected with changes in URENCO’s ownership and transfers of technology. URENCO’s Executive Management periodically meets with the Joint Committee.
Before the construction of URENCO’s enrichment facility in the US and in order to permit the transfer into the USA of classified information regarding URENCO’s proposed new facility, the USA government entered into a new intergovernmental treaty (the Treaty of Washington) with the governments of Germany, the Netherlands and the UK to ensure that the same conditions that had been agreed in the Treaty of Almelo would also apply in the USA. The Treaty of Washington was signed on 24 July 1992.
In order to permit the completion (in 2006) of the joint venture with Areva regarding the Group’s technology business ETC, France needed to adhere to the principles of the Treaty of Almelo. A new treaty (the Treaty of Cardiff) was signed on 12 July 2005 by the governments of Germany, the Netherlands, the UK and France. EC competition clearance was also required to complete the transaction. This was granted on 1 July 2006. The terms of the clearance require certain commitments from URENCO and Areva to ensure that URENCO and Areva remain competitors in the field of enrichment and that no commercially sensitive information about their enrichment operations passes between URENCO and Areva by virtue of their being joint shareholders of ETC.
URENCO Annual report and accounts 2015 43
Financial statementsGovernanceStrategic reportIntroduction
< previous next >
Contents

GovernanceAudit Committee Report
44
References1 Miriam Maes joined the Audit Committee on 8 October 2015, replacing Victor Goedvolk. 2 Justin Manson joined the Audit Committee on 1 January 2016, replacing Stephen Billingham.
Chairman’s statement
Frank Weigand Chairman, Audit Committee
I am pleased to present the report of the Audit Committee for 2015.
I took over as Chairman of the Audit Committee from Stephen Billingham with effect from 1 January 2016. I would like to take this opportunity to thank Stephen for the value that his input and expertise has brought to the Audit Committee for over six years. In October 2015, Victor Goedvolk retired from the Audit Committee after more than twelve years of service. I and my fellow Audit Committee members wish to thank Victor for his contribution to the Committee over this period. Miriam Maes was appointed to the Audit Committee on 8 October 2015 as successor to Victor. On 1 January 2016, Justin Manson joined the Audit Committee and I look forward to working alongside Justin and Miriam going forwards.
The Audit Committee of URENCO Limited plays a critical role in ensuring high quality financial reporting and providing assurance to the Board on the effectiveness of the internal control environment. In this report the Committee is required to provide a description of the key activities it has performed and an overview of those significant issues it has considered during the course of the year.
The Committee is a committee of the Board of Directors of URENCO Limited. Its role is to monitor, on behalf of the Board, the Group’s financial reporting, the integrity of its financial statements and its systems of internal control (financial, operational, compliance and risk management). The Committee provides updates and, where appropriate, recommendations to the Board on these matters.
DutiesIn accordance with its Terms of Reference, the Committee’s key responsibilities include, but are not limited to:
• monitoring and reviewing financial control matters for the Group;
• monitoring the integrity of the financial statements and the appropriateness of accounting policies;
• reviewing significant financial reporting topics and challenging significant accounting judgements contained in the financial statements;
• approving, on the Board’s behalf, the half year financial statements;
• reviewing the Annual Report and Accounts and advising the Board as to whether they are fair, balanced and understandable;
• reviewing the systems of internal control and risk management, including reviewing foreign exchange, interest rate and funding risk together with other commercial risks;
• monitoring and reviewing the external auditor’s independence, objectivity and effectiveness and recommending to the Board external audit fees for approval and the appointment of auditors each year;
• monitoring and reviewing the effectiveness of the internal audit function and reviewing the internal audit plan, internal audit reports and management’s responses to findings and recommendations; and
• reviewing any material investigations instigated in response to allegations of suspected or actual frauds, impropriety or any behaviours that are contrary to URENCO’s Code of Conduct and values, as committed by either URENCO employees, any associated persons or third parties operating on behalf of URENCO.
A copy of the Audit Committee’s Terms of Reference is available on URENCO’s website at www.urenco.com.
An annual review of the Terms of Reference was conducted at the Audit Committee meeting of 8 December 2015 and the Terms of Reference were updated on 2 March 2016 following Board approval.
Committee composition & attendanceThe Audit Committee comprises three members:
• Frank Weigand (Non-Executive Director & Committee Chairman; Deputy Chairman of the Board)
• Miriam Maes (Non-Executive Director)1
• Justin Manson (Non-Executive Director)2
Given that all of the Audit Committee members are appointees of shareholders in URENCO Limited, they are not considered independent under guidance of the UK Corporate Governance Code.
The Committee is required, under its Terms of Reference, to meet at least three times a year. During 2015 the Committee met six times. The membership and attendance record of the Audit Committee members during the year is set out below.
Governance
Following due and careful consideration, the Board is satisfied that the membership of the Committee meets the requirement for recent and relevant financial experience.
The Committee has a standing agenda, aligned to events in the Group’s financial and reporting calendar, for consideration at each meeting. At the invitation of the Audit Committee, the Chairman of the Board, the Chief Executive Officer, Chief Financial Officer, Executive Director of Finance, Group Treasurer, Head of Group Internal Audit and the Group’s external auditors (Deloitte LLP) also attend the Committee’s meetings. The Company Secretary is secretary to the Audit Committee.
Member since
Meetings attended
(reflecting the number of meetings held
while in office)
Stephen Billingham 01/09/2009 6 of 6
Victor Goedvolk 09/04/2003 5 of 5
Frank Weigand 03/12/2014 5 of 6Miriam Maes 08/10/2015 1 of 1
Financial statementsGovernanceStrategic reportIntroduction
< previous next >
Contents
GovernanceAudit Committee Report continuedPrivate meetings were held at each Committee meeting with the Head of Group Internal Audit and the external auditors at which executive management was not present. In addition, the Chairman of the Audit Committee held meetings with the audit engagement partner during the year.
No formal assessment of Audit Committee performance has been undertaken in the period although the Committee Chairman and Company Secretary conducted an effectiveness review in November 2015, based on a framework provided by the external auditors, and reported the results to the December Committee meeting. Given their status as nominees of shareholders, members of the Audit Committee are not submitted for re-election at the Group’s Annual General Meeting.
Detailed below is the key work undertaken by the Committee during the year under review and up to the date of this Annual Report.
Activities of the Audit Committee during the year
Internal controls and risk
During 2015 the Audit Committee received and considered regular reports from the Group’s external auditor, and the Group’s Internal Audit, Finance, Tax, Treasury and Risk functions in order to assess the quality and effectiveness of the system of internal controls. These included reviews of:
• the 2014 Annual Report and the 2015 half year results;• work completed by both the internal and external auditors in
reviewing and auditing the Group, in order to assess the adequacy and effectiveness of the Group’s internal controls;
• the independence, objectivity and fees of the external auditors and scope of audit and non-audit services;
• work completed by Internal Audit regarding the adequacy and effectiveness of the Group’s internal controls for capital expenditure projects, including the TMF;
• Internal Audit’s annual report on compliance with the Group’s anti-bribery and corruption policy;.
• the Group’s top strategic risks and regular operational risk reports;
• Group Tax’s annual Group Tax update and review of tax policy;• the Group’s insurance strategy and policy; and• Group Treasury activities.
The Audit Committee has reviewed the effectiveness of URENCO’s risk management and internal control systems for the financial year and the period to the date of approval of the financial statements. The Audit Committee can confirm that no significant weaknesses were identified during the year with regards to the adequacy of the system of internal control.
Significant accounting judgements
The Committee discussed with management the critical accounting judgements and key sources of estimation uncertainty outlined in note 2 of the Annual Report, “Significant estimates, assumptions and judgements”. The significant areas of focus reviewed by the Committee in relation to the 2015 accounts included significant accounting principles, policies and practice and their appropriateness. In conducting these discussions the Committee considered the work and recommendations of the Group finance functions and the input and reports received from the external auditors. The significant matters the Committee considered included the following:
• Carrying value of the enrichment business: Key judgements are required in determining the Cash Generating Units (CGU) of the enrichment business and the assets to be included within each CGU. There is an ongoing requirement for management to assess CGUs for indicators of impairment at each period end. If there is an indicator of impairment, then an impairment test needs to be performed. Key assumptions and judgements are required in the assessment of the carrying values of the enrichment business for the purposes of impairment testing. These include: estimations of future market dynamics and associated market pricing projections; estimates of levels of long-term growth for the nuclear enrichment market; extension of the US operating licence beyond 2040; ongoing capital expenditure requirements to maintain and operate the business, together with levels of associated operating costs; and discount rates. The value in use calculations are based on long-term cashflow projections which utilise the Group’s 10 year business plan and include relevant sensitivity analyses for key assumptions and variables. Pricing assumptions are based on internal market analysis of future market conditions, with reference to external forecast data where available.
Response: URENCO has two key CGUs, its European operations and its US operations. For 2015 URENCO concluded that there were no indicators of impairment for its European operations and accordingly no impairment test has been carried out.
In response to the challenging conditions faced by the nuclear market, management identified an indicator of impairment for its US CGU. Therefore, an impairment test on its US operations has been completed which showed that, while the recoverable amount of the CGU exceeded the net book value of its assets, the adverse changes in external market developments and the corresponding impact on assumed uncontracted SWU prices, have led to a significantly reduced level of headroom for the US operations when compared to the analysis performed at 31 December 2014.
Assumptions relating to uncontracted SWU price in the impairment test for the US operations are a key driver and have a material influence on the recoverable amount of the CGU. However, the value is not materially sensitive to SWU price fluctuations prior to 2025 as the majority of sales in that period are already contracted.
A further deterioration in long-term forecast market conditions would result in erosion of the recoverable amount of the US operations and may result in an impairment of the CGU.
The Committee received reporting from Deloitte LLP documenting their assessment, challenge and findings in respect of impairment in their written report to the Committee presented on 23 February 2016. This work was discussed with Deloitte, and used in order to assist the Audit Committee’s challenge of management judgements on this matter.
• Inventory and ownership of inventory: Key judgements include the recognition of inventory balances, including the allocation between uranium feed and SWU, the valuation of inventory held, the accounting for uranic conversion transactions, allocation of direct costs, and the accounting assay to be adopted. In addition, an annual inventory “headroom” test is performed to ensure the accuracy and completeness of provisions, and to assess ownership of material.
URENCO Annual report and accounts 2015 45
Financial statementsGovernanceStrategic reportIntroduction
< previous next >
Contents

GovernanceAudit Committee Report continuedResponse: URENCO Finance Management have prepared detailed accounting papers for the Audit Committee in prior periods, setting out the background to accounting for inventory and their assessment of ownership of material. In prior years, the Committee has reviewed and challenged the accounting policies applied in this area, and are satisfied on their compliance with International Financial Reporting Standards, and appropriateness to URENCO’s business model.
Using information included in Deloitte’s Audit Committee Report, the annual “headroom test” is reviewed by the Audit Committee, which is discussed and challenged with management. This “headroom test” assesses the level of inventory to which URENCO holds legal title. The Audit Committee reviewed information regarding the headroom test at 31 December 2015, and was satisfied that it was appropriate.
In addition, the Committee received oral and written reports on the external audit work planned and undertaken in this area from Deloitte LLP. This planned work and its results are reviewed in detail by the Committee.
• Provisioning: Key judgements include the calculation of provisions required in respect of tails and decommissioning obligations, the relevant discount and inflation rates applied, and the likely costs of future activity required for URENCO to satisfy its legal obligations.
Response: The Group reviews its provisions strategy on a periodic basis, using a steering group of senior technical and operational personnel. A review of provisions required in respect of tails and decommissioning obligations was performed during the year. During the year, the provisions required in respect of tails and decommissioning obligations increased by €234.4 million, largely driven by increased cost estimates for tails as a result of the increased costs associated with the construction of TMF.
The Audit Committee reviewed and challenged the key assumptions and judgements employed in the periodic review as well as the resulting associated financial provisions estimated to be required.
The provisions recognised at each period end are audited by Deloitte LLP, and the Audit Committee receives oral and written reporting on this work. This included consideration of Deloitte’s work in respect of cost estimates, timing estimates, and the application of applicable discount and inflation rates. These matters are discussed with Deloitte, both to understand their work, and to facilitate challenge of management in this area.
• Revenue and profit recognition: Key judgements include URENCO’s assessment of the period in which revenue and profit should be recognised, the fair value of consideration received, ownership and legal title over material, and the accounting adopted for any unusual or non-standard transactions in the period. These judgements are relevant for sales of enriched uranium, uranium feed and natural uranium each year.
Response: Each year, the Audit Committee consider and assess the financial reporting impact of the application of any new accounting standards and pronouncements relevant to revenue recognition, through the annual review of finance policies prepared by finance management.
These accounting policies are summarised within Note 2 to the Annual Report.
In respect of the external audit, Deloitte LLP outlined to the Audit Committee their approach to the audit of revenue, as part of their presentation of the detailed Audit Plan on 6 October 2015. The appropriateness of this planned work was considered by the Audit Committee as part of the audit planning process, and the proposed scope of work was discussed with our auditors.
The Committee also considered any observations and findings made by the auditors as part of their reporting to the Committee within their written report presented on 23 February 2016. For the year ended 31 December 2015, this included the auditors’ observation that a high volume of sales occurred in the final month of the year, where the Committee satisfied itself that this was due to the requested timing of deliveries from customers.
Finally, in respect of non-standard or complex transactions in the period, the Audit Committee challenged the management team in order to understand their commercial substance, and proposed accounting, in order to ensure these were appropriate and understandable to readers of the accounts.
Financial and business reportingAt the meeting of 23 February 2016, the Committee reviewed the content of this Annual Report and Accounts and advised the Board that, in its view, taken as a whole, it is fair, balanced and understandable and provides the information necessary for shareholders to assess the Group’s performance, business model and strategy.
In justifying this statement the Audit Committee has considered the robust process which operates in creating the Annual Report and Accounts, including the fact that:
• clear guidance and instruction is given to all contributors;
• revisions to regulatory requirements are monitored on an on-going basis;
• planning meetings are conducted between management of key subsidiaries and the external auditors in advance of the year end reporting process, and the information / developments raised in these meetings used to inform the compilation of the Annual Report;
• a thorough process of review, evaluation and verification of the inputs from business units is undertaken to ensure accuracy and consistency;
• a meeting of the Audit Committee is held to review and consider the draft Annual Report and Accounts in advance of the final sign off; and
• final sign off is provided by the Board.
External audit effectiveness and independenceThe Committee has satisfied itself that the UK professional and regulatory requirements for audit partner rotation and employment of former employees of the external auditor have been complied with.
The external auditors are required to adhere to a rotation policy based on best practice and professional standards in the United Kingdom. The standard period for rotation of the audit engagement partner is five years, and for any key audit partner, seven years. The audit engagement partner was appointed in 2011 and will rotate off at the conclusion of the 2015 audit in accordance with this requirement. The appointment of a replacement engagement partner has been approved by the Audit Committee.
46
Financial statementsGovernanceStrategic reportIntroduction
< previous next >
Contents

URENCO notes the EU rules on mandatory audit firm rotation and the Order by the Competition and Markets Authority regarding the mandatory use of competitive tender processes and auditor responsibilities including the associated transition rules. According to those rules URENCO will be required to formally tender the external audit at the latest following completion of the 2020 audit.
The Committee reviewed the effectiveness of the external auditor during 2015. This process incorporated feedback from management and key individuals across the Group, as well as the Committee’s own experience. The assessment considered the robustness of the audit process, the quality of the delivery of the audit plan, the quality of reporting on findings and recommendations to the Committee and management, and the quality of the audit team and service provided.
In considering the independence of the external auditor, the Committee received a transparency report from the auditor, which describes their arrangements to identify, report and manage any conflicts of interest, and reviewed the extent of non-audit services provided to the Group. Since 2014 the Committee has had an Auditor Independence Policy which was reviewed by the Committee on 23 February 2016. The Committee concluded that it is satisfied with the effectiveness and independence of the external auditor.
Having reviewed Deloitte LLP’s performance during the year and satisfied itself of their continuing independence and objectivity within the context of applicable regulatory requirements and professional standards, the Committee has invited the Board to recommend the reappointment of Deloitte LLP as auditor at the forthcoming Annual General Meeting (AGM) and a resolution to that effect appears in the notice of the AGM. Deloitte LLP has accumulated significant knowledge and experience that allow it to carry out effective and efficient audits during this period and provide insightful and informed challenge.
Risk management and the effectiveness of internal controlThe Terms of Reference of the Audit Committee require that the Audit Committee review and examine the effectiveness of the Company’s internal controls and risk management systems and advise the Board in the exercise of its responsibility for maintaining sound risk management and internal control systems.
The Board has approved a set of policies, procedures and frameworks for effective internal control. The Group has procedures for the delegation of authorities for significant matters, to ensure approval is sought at the appropriate level. These procedures are subject to regular review and provide an ongoing process for identifying, evaluating and managing the significant risks faced by the Group. Such a system is designed to manage rather than eliminate the risk of failure to achieve business objectives and can provide only reasonable and not absolute assurance against material misstatement or loss.
A formal annual certification is provided by senior management confirming that appropriate internal controls were in operation and confirming compliance with Group policies and procedures. Any weaknesses are highlighted, are reviewed by senior management, the Group Head of Internal Audit and reported to the Audit Committee. The internal audit function will also monitor and selectively check the results of this exercise, ensuring that representations made are consistent with the results of its work during the year.
Group Business Assurance regularly provides an update detailing new commercial or operational risks and any additional mitigation required to Audit Committee meetings. In addition the Audit Committee performs an annual review and evaluation of the risks which are considered to be significant at a Group level, and the adequacy and appropriateness of mitigating controls or risk reduction strategies. These are then considered by the Board. The types of risks identified included both strategic and material operational risks and are detailed on pages 24 to 26 of the report.
The Terms of Reference also require that the Committee review and approve the statements to be included in the Annual Report (and if interim statements are produced, to do likewise) concerning internal controls and risk management prior to endorsement by the Board. In 2015, as in previous years, the Audit Committee conducted such review and approval.
Much of the Committee’s work in this area was driven by the Group Head of Internal Audit’s reports on the effectiveness of internal controls and fraud. A summary of the Committee’s engagement with the Internal Audit function is set out below.
Internal auditThe Group has an internal audit department with responsibility for reviewing and providing assurance on the adequacy of the internal control environment across all of URENCO’s operations.
The Group Head of Internal Audit has direct access to the Chairman of the Audit Committee and provided updates regarding internal audit activities, progress of the Group internal audit plan, the results of any unsatisfactory audits, the action plans to address these areas and any resource requirements required to meet the Committee’s assurance requirements.
During the year, the Committee also reviewed the proposed internal audit programme for 2016 and the performance of the Group Head of Internal Audit. No significant issues or concerns were highlighted.
ApprovalOn behalf of the Audit Committee
Frank Weigand
Chairman of the Audit Committee
2 March 2016
GovernanceAudit Committee Report continued
URENCO Annual report and accounts 2015 47
Financial statementsGovernanceStrategic reportIntroduction
< previous next >
Contents

GovernanceSustainability Committee ReportChair’s statement
Miriam Maes Chair, Sustainability Committee
I am pleased to present the report of the Sustainability Committee for 2015.
I took over as Chairman from Frank Weigand on 1 January 2016. I would like to take this opportunity to thank Frank for his efforts in overseeing and helping to drive forward key sustainability policies at URENCO. His input and expertise has been instrumental in the success of our sustainability programme so far.
The Sustainability Committee is a committee of the Board of Directors of URENCO Limited. The purpose of the Committee is to monitor, on behalf of the Board, the implementation of URENCO’s core values and sustainability agenda. The Committee’s main areas of focus are health, safety, environment, asset integrity, security, safeguards, ethical conduct and social performance. The Committee also maintains an overview of the Group’s policies and achievement of key objectives in these areas and reports to the Board on the results of these reviews.
In this report the Committee provides a description of the key activities it has performed during the course of the year.
DutiesIn accordance with its terms of reference, the Committee’s key responsibilities include, but are not limited to:
• Reviewing on an annual basis the Group’s sustainability agenda and associated policies, with a view to ensuring that these take account of external developments and expectations, and reporting to the Board on the results of these reviews.
• Conducting annual reviews of the Group’s implementation of policies on: safety and asset integrity; social performance (including community relations, social investment and political contexts); environment and ethical conduct and reporting to the Board on the results of these reviews.
• To consider and approve sustainability key performance indicators.
• To consider and approve the Group’s Sustainability Report.
• To compile a report on its activities to be included in the Group’s Annual Report.
A copy of the Sustainability Committee’s Terms of Reference is available on URENCO’s website at www.urenco.com.
Committee composition and attendanceThe Sustainability Committee comprises four members:
• Miriam Maes (Chair1 and Non-Executive Director)
• Frank Weigand (Non-Executive Director2, Deputy Chairman of the Board)
• Justin Manson (Non-Executive Director3)
• Thomas Haeberle (Chief Executive Officer4)
The Committee met three times in 2015. Two of the meetings took place at URENCO’s operational sites (Capenhurst and Gronau) and Committee members participated in an enrichment facility tour at each site.
The membership and attendance record of the Sustainability Committee members during 2015 is set out below.
Activities of the Sustainability Committee during the yearIn 2015 the Committee:
• Considered and approved the 2014 Sustainability Report to meet the Core standards outlined by the Global Reporting Initiative’s (GRI) G4 reporting requirements.
• Monitored the design of the sustainability programme.
• Considered and approved non-financial KPIs for 2015 in each of our six sustainability focus areas.
• Oversaw the creation of a sustainability culture across the Group to integrate sustainability into the business.
• Monitored progress on the asset integrity programme and peer review process.
ApprovalOn behalf of the Sustainability Committee
Miriam Maes
Chair of the Sustainability Committee
2 March 2016
Number of meetings
(reflecting the number of
meetings held while in office) Meetings attended
Frank Weigand 3 3
George Verberg 3 3
Stephen Billingham 3 3Helmut Engelbrecht 3 3
References1 Miriam Maes replaced George Verberg who served on the Committee throughout the whole of 2015. Miriam was appointed Chair on 1 January 2016. 2 Frank Weigand was Chair until 31 December 2015. 3 Justin Manson replaced Stephen Billingham who served on the Committee throughout the whole of 2015.4 Thomas Haeberle succeeded Helmut Engelbrecht who served on the Committee throughout the whole of 2015.
48
Financial statementsGovernanceStrategic reportIntroduction
< previous next >
Contents

GovernanceRemuneration ReportChairman’s statement
George Verberg Chairman, Remuneration and Appointments Committee
The role of URENCO’s Remuneration and Appointments Committee remains to ensure that the Chair of the Board and executive positions are occupied by high calibre individuals who are fully able to meet the requirements of the role. Furthermore the committee is responsible for the remuneration arrangements for the Chair of the Board and for the Executive Directors, in order to offer every encouragement to enhance the Company’s performance and deliver our strategy in a responsible manner.
IntroductionThis report is on the activities of the Remuneration and Appointments Committee for the period to 31 December 2015. It sets out the remuneration policy and remuneration details for the Executive and Non-executive Directors of URENCO.
The report is split into three main areas:
• The statement by the Chairman of the Remuneration and Appointments Committee;
• The annual report on remuneration; and
• The policy report.
The annual report on remuneration provides details on remuneration in the period. It will be subject to approval from shareholder representatives at the Remuneration and Appointments Committee.
CompositionThe Remuneration and Appointments Committee is composed entirely of Non-executive Directors. The Chairman of the Committee in 2015 was George Verberg. Frank Weigand, Alan Bevan and Richard Nourse were members of the Committee. Frank Weigand and Alan Bevan share one voting-right. Bernhard Fischer resigned from the Committee in 20151. In attendance by invitation are the URENCO Limited Board Chairman, the Chief Executive Officer and Head of Group Human Resources. The Chief Executive Officer does not attend the meetings where his remuneration is discussed.
Role and responsibilitiesThe Remuneration and Appointments Committee is a committee of the Board of Directors of URENCO Limited.
The key responsibilities of the Remuneration and Appointments Committee are to make recommendations to the Board on:
• The remuneration packages for each Director.
• The appointment of the Chief Executive Officer, Chief Financial Officer and the Company Secretary.
• The fees of Non-executive Directors of the Company.
• Succession planning.
• The appointment of Independent Directors.
• Organisational and governance recommendations if needed.
Membership and attendance during the year
Key issues in 2015During 2015 the Remuneration and Appointments Committee:
• Reviewed the 2015 targets set for the CEO and CFO.
• Set 2016 targets for the CEO and CFO.
• Conducted and completed the search for a new CEO .
• Conducted the ongoing search for a new Chair of the Board.
• Considered Executive Remuneration, Chair and Non-executive Director fees.
• Discussed succession planning.
• Reviewed the long-term incentive scheme.
ApprovalOn behalf of the Remuneration and Appointments Committee
George Verberg
Chairman of the Remuneration and Appointments Committee
2 March 2016
Number of meetings
Meetings attended
George Verberg 7 7
Richard Nourse 7 7
Frank Weigand 7 6
Bernhard Fischer 2 1Alan Bevan 5 3
URENCO Annual report and accounts 2015 49
References1Alan Bevan replaced Bernhard Fischer on 26 February 2015.
Financial statementsGovernanceStrategic reportIntroduction
< previous next >
Contents

GovernanceRemuneration Report
Annual report on remunerationSingle total figure of remuneration for each Director
The remuneration of the Executive Directors for the years 2015 and 2014 was made up as follows:Basic salary
and fees1
€Pensions
€Benefits
€
Performance related bonuses2
€LTIS3
€Total 2015
€
Executive Directors
Helmut Engelbrecht4 2,108,520 2,962,331 76,753 174,357 602,771 5,924,732
Ralf ter Haar 488,109 95,943 256,839 381,644 99,748 1,322,283Total 2,596,629 3,058,274 333,592 556,001 702,519 7,247,0151 The amount for Helmut Engelbrecht includes certain items payable under the terms of his 2005 contract of employment, including additional salary paid in lieu of notice and a lump sum payment in respect of pre-age 65 pension benefits.2 The amount for Ralf ter Haar is based on performance criteria which include elements related to retention and ongoing service with the Company.3 The amounts for LTIS include amounts receivable as a result of the achievements of performance targets relating to the financial year, which are accrued on a straight-line basis during the service period. Also included are adjustments following revisions to forecast performance targets.4 Certain aspects relating to Basic salary and fees and Pensions for Helmut Engelbrecht remain subject to finalisation.
Basic salary and fees
€Pensions
€Benefits
€
Performance related
bonuses€
LTIS5
€Total 2014
€
Executive Directors
Helmut Engelbrecht 585,069 164,937 87,259 77,330 (12,152) 902,443
Marcel Niggebrugge 462,918 - 205,418 60,432 - 728,768
Ralf ter Haar6 71,521 - 26,297 20,112 - 117,930
Total 1,119,508 164,937 318,974 157,874 (12,152) 1,749,1415 These amounts reflect adjustments to amounts receivable for LTIS following revisions to forecast EPS and EPS growth which resulted in targets not being met.6 Ralf ter Haar replaced Marcel Niggebrugge on 1 November 2014.
The remuneration of the Non-executive Directors for the years 2015 and 2014 was made up as follows: Basic salary
or fees€
Benefits€
Performance related bonuses
€LTIS
€Total 2015
€
Non-Executive Directors
John Hood 275,152 - - - 275,152
Alan Bevan 40,855 - - - 40,855
Stephen Billingham 59,324 - - - 59,324
Bernhard Fischer 12,145 - - - 12,145
Victor Goedvolk 43,245 - - - 43,245
Miriam Maes7 13,124 13,124
Richard Nourse 48,578 - - - 48,578
George Verberg 61,827 - - - 61,827
Frank Weigand 69,187 - - - 69,187Total 623,437 - - - 623,437 7 Miriam Maes replaced Victor Goedvolk on 8 October 2015
Basic salary or fees
€Benefits
€
Performance related bonuses
€LTIS
€Total 2014
€
Non-Executive Directors
John Hood 216,965 - - - 216,965
Stephen Billingham 53,462 - - - 53,462
Bernhard Fischer 43,777 - - - 43,777
Victor Goedvolk 50,410 - - - 50,410
Gerd Jaeger 49,085 - - - 49,085
Richard Nourse 43,777 - - - 43,777
George Verberg 55,717 - - - 55,717
Frank Weigand8 6,668 - - - 6,668
Total 519,861 - - - 519,8618 Frank Weigand replaced Gerd Jaeger on 24 November 2014
50
Financial statementsGovernanceStrategic reportIntroduction
< previous next >
Contents

GovernanceRemuneration Report continued
Additional requirements in respect of the single total figure table
Taxable benefits
Taxable benefits paid to Executive Directors include provision of motor vehicles, medical insurance and living expenses.
In the event that payments are made in sterling, the average rate is adopted for conversion purposes, this was at £0.72687 for €1 for 2015 (2014: £0.80658 to €1).
Performance related bonuses
Performance related bonuses for Executive Directors are based on performance criteria.
Long-term incentive scheme
The long-term incentive scheme is an annual scheme which grants cash awards with the maximum potential award determined at grant. Awards only vest to the extent that certain performance targets are met over a four year performance period.
The Executive Directors are eligible to share in the Company’s long-term incentive scheme. Details of the accrued entitlements earned by the Executive Directors are shown below:
HelmutEngelbrecht
€Ralf ter Haar
€
Scheme maturing at
31 December
Incentive scheme accrual as at 1 January 2015 188,606 -
Exchange adjustments 4,760 (1,389)
LTIS paid during the year - -
LTIS 2012 accrued during the year 202,415 - 2015
LTIS 2013 accrued during the year - - 2016
LTIS 2014 accrued during the year 400,356 99,748 2017
Total incentive scheme accrual as at 31 December 2015 796,137 98,359
The Executive Directors participate in incentive schemes, which are granted on a yearly basis. All schemes result in an award of cash with the maximum potential determined at the date of grant, with the awards vesting no earlier than the third anniversary of grant. However, the performance criteria under the various schemes and associated cash awards are different.
2012/2013 LTIS:
The Executive Directors’ awards vest to the extent that EPS performance targets are met over the four year performance period. EPS is calculated as net income attributable to equity holder of the parent divided by the number of shares.
The unvested awards would lapse for individuals who are dismissed or resign. For leavers by retirement, illness or caused by death these awards would usually vest at the normal time, subject to performance measured over the full performance period, and pro-rated for the proportion of the vesting period that has elapsed.
2014 LTIS:
Performance is measured on three metrics: increase in EPS, EBITDA margin and Missed Deliveries. The three metrics are weighted as follows: EPS 70%; EBITDA Margin 20%; Missed Deliveries 10%.
The Executive Directors’ awards vest to the extent that EPS and EBITDA Margin performance targets are met over the four year performance period, and Missed Deliveries performance targets are met over the three year performance period. The three metrics are calculated as follows:
• EPS is calculated as net income attributable to equity holder of the parent divided by the number of shares (see note 11 to the consolidated financial statements). EPS growth is measured by comparing the actual EPS in Year 0 (2013) to the actual EPS in year 4 (2017).
• EBITDA Margin is measured as the unweighted average EBITDA margin for the period 2014 to 2017 inclusive.
• Missed Deliveries are measured as the cumulative number of missed deliveries for the period 2015 to 2017 inclusive.
Any unvested awards would lapse for individuals who are dismissed or resign. For leavers by retirement, illness or caused by death these awards would usually vest at the date of leaving with any payment made as close to the leaving date as possible. The amount of the payment would be determined based on the full performance period.
URENCO Annual report and accounts 2015 51
Financial statementsGovernanceStrategic reportIntroduction
< previous next >
Contents

Award sizes as percentage of salary for Executive Directors:
2012/2013 LTIS
Base 2013 2012
Scheme maturity 2016 2015
Growth in EPS achieved over 4
year period
Cash award as
percentage of salary
Growth in EPS achieved over 4
year period
Cash award as
percentage of salary
10% 50% 10% 50%
17% 75% 30% 75%
35% 150% 50% 100%
- - 100% 150%
2014 LTIS
MetricGrowth in EPS achieved
over 4 year period 2014-2017Average EBITDA Margin over
4 year period 2014-2017Missed Deliveries over
3 year period 2015-2017
Metric Weighting 70% 20% 10%
Performance Target 0% 15% 32% >40% <60%60-
62.99%63-
64.99% >65% >3 2 1 0
% of metric achieved 0% 40% 85% 100% 0% 20% 50% 100% 0% 40% 50% 100%
Cash award as percentage of salary1 0% 42% 90% 105% 0% 6% 15% 30% 0% 6% 8% 15%
1 Gross cash award as percentage of salary is calculated as Metric Weighting multiplied by cash award for percentage of metric achieved.
Total pension entitlements
The Executive Directors are eligible for membership to the Group pension scheme. The scheme has a defined benefit pension section, which is approved by HM Revenue and Customs (closed to new entrants) and a defined contribution section. The scheme also provides for dependants’ pensions and lump sums on death in service.
Details of the pension entitlements earned by the current Executive Directors are shown below:
Defined benefit pension schemeAccrued
pension at 31/12/2015
€
Accrued pension at
31/12/2014€
Transfer value at
31/12/2015€
Transfer value at
31/12/2014€
Helmut Engelbrecht 219,640 230,643 6,300,813 5,614,591
Accrued pensions and transfer values are retranslated from sterling to euros at the closing rate of £0.73714 to €1 (2014: £0.77667 to €1).
Accrued pension: The pension per annum to which the Director would be entitled if he left the Company on 31 December 2015 (actual pension) and 2014 (deferred pension) respectively.
Transfer value: The expected cost of providing the accrued pension within the Company’s pension scheme calculated on the basis of guidance issued by the Company’s actuary.
In addition to the accruals already made in the Company’s defined benefit scheme, H. Engelbrecht had a right under his 2005 contract of employment to receive a certain income as retirement benefit which would be payable under certain conditions. These rights vested on 31 December 2015. The revenue funding cost of this company commitment, as assessed by an independent actuary, has been assessed to be €2.8 million, which has been recognised as an unfunded pension liability. The estimated costs at 31 December 2014 were €2.5 million, which were then disclosed as a contingent liability. These costs will be reviewed periodically.
Furthermore H. Engelbrecht will be entitled to a total amount of €0.5 million for services to be provided to URENCO Group during the next three years.
Relative importance of spend on pay
The table below shows the actual employee pay of the Group and change between the current and previous years, compared to retained earnings and dividends.
2015€m
2014€m % Increase
Total employee pay 202.3 168.5 20.1%
Retained earnings 2,008.9 1,865.9 7.7%
Dividend 340.0 340.0 0%
GovernanceRemuneration Report continued
_
52
Financial statementsGovernanceStrategic reportIntroduction
< previous next >
Contents
GovernanceRemuneration Report continued
Statement of implementation of remuneration policy in the following financial yearThe Company’s policy on Executive Directors’ remuneration is that the overall remuneration package should be sufficiently competitive to attract, retain and motivate high quality executives capable of achieving the Group’s objectives and thereby enhancing shareholder value. The package consists of basic salary, benefits, pension and performance related bonus and a long-term incentive scheme (LTIS), with a significant proportion based on performance and dependent upon the achievement of targets.
The remuneration of the Non-executive Directors is in line with UK market standards and is reviewed annually rather than biannually, other than the remuneration of the Chairman which is set at the beginning of the term of appointment.
The salary and benefits for Executives are reviewed annually. The Chief Executive Officer and the Chief Financial Officer both received a 2.6% increase in basic salary for the 2015 calendar year. This increase in basic salary was in line with the increase for all employees throughout the Company. Executive Directors receive benefits that principally comprise living expenses, motor vehicles, private healthcare and other expenses.
Consideration of matters relating to Directors’ remunerationThe Committee makes recommendations to the Board on the remuneration packages for each Director. Remuneration for each Non-executive Director is subject to final approval at the Annual General Meeting.
Policy Report
Introduction
The information below summarises key aspects of the Company’s remuneration policy for Executive and Non-executive Directors.
Future policy
The policy is that a substantial proportion of the pay and benefits package should be performance related. The following provides a summary of the key components of the remuneration package for Directors:
Basic salary
Purpose
To recruit and retain high calibre executives.
Operation
This is determined for each Executive Director taking into account the responsibilities of the individual and information from independent sources on the level of salary for similar jobs in a selected group of comparable companies.
Basic salary levels are reviewed annually by the Committee, taking account of Company performance, individual performance, levels of increase for the broader UK population and inflation.
The Committee also considers the impact of any basic salary increase on the total remuneration package.
Annual increases are typically within the standard maximum given. However, there may be occasions when the Committee needs to recognise, for example, development in role, change in responsibility and/or specific retention issues.
In these circumstances, the Committee may offer a higher annual increase.
Maximum levels will be reviewed to take account of any significant rise in inflation levels.
Opportunity
Standard annual salary increase in line with the increase for all employees throughout the company.
All taxable benefits
Purpose
To provide market competitive benefits.
Operation
The Company provides the following ongoing benefits:
• Car related benefits
• Medical insurance
• Death insurance
• Holiday leave
• Other ancillary benefits.
URENCO Annual report and accounts 2015 53
Financial statementsGovernanceStrategic reportIntroduction
< previous next >
Contents

In addition, the Company pays additional benefits when specific business circumstances require it, including costs and allowances related to relocation and international assignments.
The Company reimburses all reasonable and necessary business expenses.
Opportunity
The Committee reserves the discretion to exceed the ongoing maximum level for certain situation–specific benefits, such as relocation. Full details of the exercise of any such discretion will be provided to shareholders in the Remuneration Report.
Performance related bonuses
Purpose
To encourage and reward delivery of the Company’s strategic priorities.
Operation
Performance related bonuses for Executive Directors are based on performance criteria.
Opportunity
Performance criteria relate to safety performance; EBITDA; and major capital projects. 30% of potential bonus is payable at the discretion of the Committee.
Long-term incentive scheme
Purpose
To encourage creation of value in the business over the longer term.
Operation
An annual scheme which grants cash awards with the maximum potential awards determined at grant. Awards only vest to the extent that certain minimum performance targets are met over a four year performance period.
It is the Committee’s intention that these outstanding awards should be paid out in accordance to the terms on grant of the schemes.
Opportunity
Award size as a percentage of salary for Executive Directors is set out in the table on page 52.
Pensions
Purpose
To offer market–competitive levels of benefit.
Operation
The Executive Directors are eligible for membership to the Group pension scheme. The scheme has a defined benefit pension section, which is approved by HM Revenue & Customs (closed to new entrants) and a defined contribution section. The scheme also provides for dependent’s pensions and lump sums on death in service.
Opportunity
The company makes regular contributions for pension payments. The maximum contribution is 23.2% of salary for the defined benefit scheme and 13.0% of salary for the defined contribution scheme.
GovernanceRemuneration Report continued
54
Financial statementsGovernanceStrategic reportIntroduction
< previous next >
Contents
GovernanceRemuneration Report continuedThe following provides a summary of the key elements of the remuneration package for Non-executive Directors:
Fees
Purpose
To recruit and retain high calibre Non-executive Directors.
Operation
This is determined for each Non-executive Director taking into account the responsibilities of the individual and information from independent sources on the level of salary for similar jobs in a selected group of comparable companies.
Remuneration for Non-executive Directors is subject to final approval at the Annual General Meeting.
Approach to recruitment remunerationThe on-going remuneration arrangements for a newly recruited or promoted Director will reflect the remuneration policy in place for Directors at the time of appointment. The on-going components for Executive Directors will therefore comprise basic salary and fees, benefits, performance related bonus, LTIS and pension contribution. The on-going components for Non-executive Directors will comprise fees.
The initial basic salary for a newly recruited or promoted Executive Director will be set to reflect the individual’s experience, salary levels within the Company and market levels. For external and internal appointments, the Committee may agree that the Company will meet certain relocation expenses as appropriate.
ApprovalThis report was approved by the board of Directors on 2 March 2016 and signed on its behalf by:
Sarah Newby Company Secretary
2 March 2016
URENCO Annual report and accounts 2015 55
Financial statementsGovernanceStrategic reportIntroduction
< previous next >
Contents
GovernanceDirectors’ ReportThe Directors present their Annual Report and Accounts for the year ended 31 December 2015.
Regulations relating to Strategic Report The Directors have ensured compliance with the Companies Act 2006 (Strategic Report and Directors Report) Regulations 2013 and have presented the Strategic Report separately to the Directors’ Report. Both Reports must also be separately approved by the Board of Directors and signed on behalf of the Board by a Director or the Company Secretary.
Results and dividends Net income for the year attributable to equity holders of the Parent Company amounted to €452.1 million (2014: €404.5 million).
The Directors recommend a final dividend for the year of €350.0 million. No interim dividend was paid during 2015 (2014: final dividend of €340.0 million paid in 2015, with no interim dividend declared or paid in 2014).
Principal activity The URENCO Group’s principal activity is the provision of a service to enrich uranium to provide fuel for nuclear power utilities, by enriching uranium provided by our customers. The Group currently achieves this in Europe through its main operating subsidiary, URENCO Enrichment Company Limited, which has three operating subsidiaries that own and operate enrichment facilities in Germany (Gronau), the Netherlands (Almelo), the UK (Capenhurst) and through another Group subsidiary in the USA at Eunice, New Mexico.
The Group also owns a 50% interest in ETC, a joint venture company jointly owned with Areva. ETC provides gas centrifuge technology for the Group’s enrichment facilities through its subsidiaries in the UK, Germany, the Netherlands and the USA. The Group accounts for its interest in ETC using the Equity Accounting method.
URENCO Limited is the ultimate holding Company and provides management and strategic support for the URENCO Group, being URENCO Limited and its subsidiaries.
More information on the Group’s activities is presented from page 8 in the Strategic Report.
Going concern The Group’s business activities, achievements, risks and opportunities are set out in the Chief Executive Officer’s review on pages 16 to 18 and the Group Finance Report on pages 34 to 37. The Group finance review includes information on the financial position of the Company as well as a description of the Group’s objectives, policies and processes for managing its capital, its exposures to foreign currencies and other financial risks. URENCO’s business is long-term by nature and its significant order book of contracted and agreed sales (€16.6 billion extending beyond 2025 (2014: €15.8 billion)) provides a strong foundation for the future. The Group has adequate financial resources and its cash flow forecasts indicate that financing facilities committed and in place are sufficient to cover the Group’s cash needs to at least a year after the approval date of these financial statements, including all committed capital expenditure.
The Directors are satisfied that the Group has adequate resources to continue in operational existence for the foreseeable future. Thus they continue to adopt the going concern basis of accounting in preparing the financial statements.
Risk management: the use of financial instruments The Group’s policies with respect to financial instrument risk management are covered on page 36 and in note 24 to the consolidated financial statements.
Research and development Research activities within the Group are predominately carried out by the Central Technology Group (CTG) which conducted research and development into improving operational performance and safety.
Research activities relating to core centrifuge technology are undertaken by ETC to maintain the Group’s position of technical excellence. The Group continues to seek out opportunities to exploit new markets.
Donations During the year, the Group made no contributions (2014: €9,000) to local political parties. Last year such contributions were made in the US from income generated by one of URENCO’s US entities. As part of the Group’s commitment to the communities in which it operates, contributions totalling €1,659,900 (2014: €1,277,600) were made during the year to local charities and community projects.
Events after the reporting period As of 2 March 2016, no material structural changes or business events have occurred that might serve to alter any of the disclosures contained in the Annual Report and Accounts.
56
Financial statementsGovernanceStrategic reportIntroduction
< previous next >
Contents

GovernanceDirectors’ Report continued
Disabled employees It is the policy of the Group to give full and proper consideration to applications from disabled people for employment where the job can be adequately performed by a disabled person. In the event that an existing employee becomes disabled, it is the policy of the Group to allow that person to continue their employment if possible, or to provide alternative training if necessary.
Employee involvement During the period, employees within the Group have been informed of developments throughout the Group and in the industry. This is through Group and local newsletters, the intranet, notices and meetings. Where appropriate, formal meetings were held between local management and employee representatives as part of the ongoing process of communication.
Directors’ interests The Directors held no interests in the issued share capital of URENCO Limited either beneficially or otherwise at 31 December 2015 or at any other time during the year. The Directors have declared that they have no material interest during the year in any contract which is significant in relation to the Company’s business.
Supplier payment policy and practice The Group values its relationships with suppliers of goods and services. The Group negotiates terms and conditions of supply prior to delivery and, as a matter of policy, honours these terms once delivery has been made. At 31 December 2015, the Company had an average of 20 days’ purchases owed to trade creditors (2014: an average of 32 days’ purchases owed to trade creditors).
AuditorDeloitte LLP have expressed their willingness to continue in office as auditor. A resolution to reappoint Deloitte LLP for the coming year will be put to the Annual General Meeting on 2 March 2016.
By order of the Board.
Sarah Newby Company Secretary
2 March 2016
URENCO Annual report and accounts 2015 57
Financial statementsGovernanceStrategic reportIntroduction
< previous next >
Contents
GovernanceDirectors’ Responsibilities StatementThe Directors are responsible for preparing the Annual Report and the Group financial statements in accordance with applicable law and regulations.
The Board confirms that the Annual Report and Accounts, taken as a whole, is fair, balanced and understandable and provides the information necessary for shareholders to assess the performance, strategy and business model of the company.
Company law requires the Directors to prepare financial statements for each financial year. Under that law the directors are required to prepare the group financial statements in accordance with International Financial Reporting Standards (IFRSs) as adopted by the European Union and Article 4 of the IAS Regulation and have elected to prepare the parent company financial statements in accordance with United Kingdom Generally Accepted Accounting Practice (United Kingdom Accounting Standards and applicable law). Under company law the Directors must not approve the Group financial statements unless they are satisfied that they present fairly the financial position, financial performance and cash flows of the Group for that period.
In preparing the Group financial statements, International Accounting Standards require the Directors to:
• Properly select and apply accounting policies;
• Present information, including accounting policies, in a manner that provides relevant, reliable, comparable and understandable information;
• Provide additional disclosures when compliance with the specific requirements in IFRSs is insufficient to enable users to understand the impact of particular transactions, other events and conditions on the entity’s financial position and financial performance; and
• Make an assessment of the Group’s ability to continue as a going concern.
The Directors are responsible for keeping proper accounting records that are sufficient to show and explain the Group’s transactions and disclose with reasonable accuracy at any time the financial position of the Group and enable them to ensure that the Group financial statements comply with the Companies Act 2006 and Article 4 of the IAS Regulation. They are also responsible for safeguarding the assets of the Group and hence for taking reasonable steps for the prevention and detection of fraud and other irregularities.
Each of the persons who is a Director at the date of approval of this annual report confirms that:
• So far as the Director is aware, there is no relevant audit information of which the Company’s auditor is unaware; and
• The Director has taken all the steps that he/she ought to have taken as a Director in order to make himself/herself aware of any relevant audit information and to establish that the Company’s auditor is aware of that information.
This confirmation is given and should be interpreted in accordance with the provisions of s418 of the Companies Act 2006.
The Directors are responsible for the maintenance and integrity of the corporate and financial information included on the Company’s website. Legislation in the United Kingdom governing the preparation and dissemination of financial statements may differ from legislation in other jurisdictions.
By order of the Board.
Sarah Newby Company Secretary
2 March 2016
58
Financial statementsGovernanceStrategic reportIntroduction
< previous next >
Contents

Opinion on financial statements of URENCO LimitedIn our opinion:
• the financial statements give a true and fair view of the state of the Group’s and of the parent company’s affairs as at 31 December 2015 and of the Group’s profit for the year then ended;
• the Group financial statements have been properly prepared in accordance with International Financial Reporting Standards (IFRSs) as adopted by the European Union;
• the parent company financial statements have been properly prepared in accordance with United Kingdom Generally Accepted Accounting Practice, including Financial Reporting Standard (FRS) 101 Reduced Disclosure Framework; and
• the financial statements have been prepared in accordance with the requirements of the Companies Act 2006.
The financial statements comprise the Consolidated Income Statement, the Consolidated Statement of Comprehensive Income, the Consolidated and Parent Company Statements of Financial Position, the Consolidated and Parent Company Statements of Changes in Equity, the Consolidated Cash Flow Statement and the related Consolidated notes 1 to 32 and related Parent notes 1 to 20.
The financial reporting framework that has been applied in the preparation of the Group financial statements is applicable law and IFRSs as adopted by the European Union.
The financial reporting framework that has been applied in the preparation of the parent company financial statements is applicable law and United Kingdom Accounting Standards (United Kingdom Generally Accepted Accounting Practice), including FRS 101 “Reduced Disclosure Framework”.
Going concernWe have reviewed the Directors’ statement on page 56 that the Group is a going concern. We confirm that:
• we have concluded that the Directors’ use of the going concern basis of accounting in the preparation of the financial statements is appropriate; and
• we have not identified any material uncertainties that may cast significant doubt on the Group’s ability to continue as a going concern.
However, because not all future events or conditions can be predicted, this statement is not a guarantee as to the Group’s ability to continue as a going concern.
IndependenceWe are required to comply with the Financial Reporting Council’s Ethical Standards for Auditors and we confirm that we are independent of the Group and we have fulfilled our other ethical responsibilities in accordance with those standards. We also confirm we have not provided any of the prohibited non-audit services referred to in those standards.
Our assessment of risks of material misstatementThe assessed risks of material misstatement described below, which are the same risks as identified in the prior year, are those that had the greatest effect on our audit strategy, the allocation of resources in the audit and directing the efforts of the engagement team:
Carrying value of the enrichment business
Risk
URENCO has two cash generating units (“CGUs”), its European and US operations. In response to the challenging conditions faced by the nuclear market, management has identified an indicator of impairment for its US CGU and accordingly has assessed its carrying value for impairment.
Management concluded that there were no indicators of impairment for its European CGU and accordingly no impairment test has been carried out. Note 4 to the financial statements provides further information in respect of the carrying value of the assets included in the enrichment business (€6.9 billion at 31 December 2015).
Management exercise judgement in assessing that the enrichment business is comprised of two CGUs. There is an ongoing requirement for management to assess each CGU for indicators of impairment at each reporting period end.
There is inherent risk in relation to impairment indicators and models, as management are required to exercise a significant level of judgement in forming their key assumptions. These key assumptions are estimations of future market dynamics and associated market pricing projections; estimates of levels of long-term growth for the nuclear enrichment market; extension of the US operating licence beyond 2040; ongoing capital expenditure requirements to maintain and operate the business, together with levels of associated operating costs; and discount rates.
The outcome of impairment assessments could vary significantly were different assumptions applied. Further details of management’s process to assess assets for impairment is outlined on pages 69 and 70.
How the scope of our audit responded to the risk
We have scrutinised the determination of the US and European CGUs and the indicator of impairment analysis performed by management. We have reviewed and challenged the management conclusion that there are no indicators of impairment for the European CGU.
Financial statementsIndependent Auditor’s Report
URENCO Annual report and accounts 2015 59
Financial statementsGovernanceStrategic reportIntroduction
< previous next >
Contents

We undertook a detailed analysis and challenge of the key assumptions and sensitivity analysis used in the US CGU impairment testing, specifically future market dynamics and associated market pricing projections; estimates of levels of long-term growth for the nuclear enrichment market; extension of the US operating licence beyond 2040; ongoing capital expenditure requirements to maintain and operate the business, together with levels of associated operating costs; and discount rates. This included agreement to third party documentation where possible, evaluation and challenge of Board approved forecasts against recent performance, projected long-term pricing and the long-term order book.
We utilised Deloitte valuation specialists to independently develop an expectation in respect of the specific discount rate used to assess the US CGU and compared it against that used by management. In addition, we evaluated the disclosures prepared by management on pages 69 and 70.
Inventory and ownership of inventory
Risk
Complex calculations and management judgment are required in respect of the allocation between inventory types and valuation of uranic material. This allocation and valuation includes determining the feed and Separative Work Unit (“SWU”) components of enriched uranium product (“EUP”), described and defined further on pages 128 and 129. As at 31 December 2015, the Group holds €507.7 million of inventories (refer to note 18 of the financial statements).
The allocation between feed and SWU components requires management to assess physical inventory levels (on URENCO sites and at third parties), forecast customer requirements and consider the level to which material will be enriched (the “product assay”) and depleted (the “accounting assay”).
In order to produce a certain volume of enriched uranium to the required level of enrichment, URENCO can use increased levels of feed or higher consumption of SWU to produce the same output. Use of additional SWU results in a surplus of feed, as less feed is used in the enrichment process than supplied by the customer. Assessment is required of whether this surplus feed is owned by URENCO (“own feed”) and may be recognised within inventory through comparison of actual feed stocks held to levels of feed required to fulfil future customer enrichment obligations.
How the scope of our audit responded to the risk
Physical inventory positions were compared to perpetual inventory systems and we reviewed and challenged International Atomic Energy Agency (“IAEA”) regulatory inspection documents relating to inspection of control of uranic materials. We received and verified confirmations from third parties in respect of URENCO’s inventory held at their sites.
We reviewed and recalculated management’s allocation of inventory between feed, SWU and natural uranium, validating the inputs into the calculation to source documentation. We scrutinised the annual movements in inventory, validating the reconciling items to supporting evidence and by recalculation, where appropriate.
We performed procedures to challenge management’s determination of the “accounting assay” (average mean contractual customer tails assay), including review of operating reports and forecasts, confirmation of future enrichment contract terms, and verified movements in actual assay levels to operational activities in the period.
In respect of own feed, we independently recalculated the levels of feed to which URENCO held ownership of each period, taking into account borrowed material and own feed inherent in material to be re-enriched.
Provisioning
Risk
The Group holds €1,416.0 million of long-term provisions at 31 December 2015, the majority of which are in respect of decommissioning costs and the disposal of tails (refer to note 26 of the financial statements) described and defined further on page 77. Provision is made for future decommissioning of enrichment sites and associated equipment and in respect of decontamination of its transport containers. In addition, as the enrichment process generates depleted uranium (“tails”), provisions must be made for the costs of the eventual deconversion of the material to a more stable chemical form and subsequent storage.
Management formally review the provisions strategy on a triennial basis, the latest triennial review was performed during the year. The increased costs associated with the construction of the new Tails Management Facility (“TMF”) have been included within the tails deconversion cost estimate during the year (refer to note 26 of the financial statements).
The determination of future cost, timing and macroeconomic assumptions, including discount rate and inflation rate, in relation to all of these long-term provisions requires significant management judgment and estimation. In particular, given the nature of the industry, there is often very limited independent third party data as to the eventual cost and timing of these activities.
Further descriptions on the nature of tails, deconversion and other items noted above are provided on pages 104 and 105.
How the scope of our audit responded to the risk
We have reviewed and challenged management’s formal triennial review of the provisions strategy performed in the year. We compared future cost and timing estimates against internal project data, including TMF deconversion costs and, where possible, external support. We challenged key assumptions through meetings with technical and operational personnel, and through comparison to other market participants and the prevailing industry approach. Levels of tails to be deconverted and plant and machinery to be decommissioned were challenged and verified to operational and financial reports. We assessed and benchmarked the reasonableness of discount rates and inflation rates adopted to external market data.
Financial statementsIndependent Auditors’ Report continued
60
Financial statementsGovernanceStrategic reportIntroduction
< previous next >
Contents

Revenue and profit recognition
Risk
The Group has recognised revenue of €1,842.2 million in 2015. Given the complex nature of the Group’s enrichment contracts, management judgment is required in applying the Group’s revenue and profit recognition policies to enrichment services, feed and natural uranium sale transactions.
These revenue and profit recognition judgments include the date at which transfer of risk and reward occurs; accounting for variability or optionality within sales contracts; consideration of the costs of the enrichment activities and the feed sold; consideration of whether URENCO holds legal title to feed sold; and consideration of onerous contract terms.
The Group’s policy on revenue recognition is set out on page 71 of the Group financial statements.
How the scope of our audit responded to the risk
We carried out testing relating to design and implementation of internal controls over revenue recognition and assessed the timing and value of revenue recognised through agreement, on a sample basis, to executed contracts and signed delivery documentation. We agreed deliveries occurring near 31 December 2015 to physical delivery notifications and traced payments to bank statements.
In respect of the cost of enrichment services, feed or natural uranium supplied to customers, we recalculated the prevailing weighted average cost based on the Group’s cost of production.
For bill and hold transactions, where revenue has been recognised and material continues to be held at URENCO’s premises, we reviewed customer requests and confirmations of legal title, in order to evidence whether irreversible sales had taken place.
The description of risks above should be read in conjunction with the significant issues considered by the Audit Committee discussed on page 45.
These matters were addressed in the context of our audit of the financial statements as a whole, and in forming our opinion thereon, and we do not provide a separate opinion on these matters.
Our application of materialityWe define materiality as the magnitude of misstatement in the financial statements that makes it probable that the economic decisions of a reasonably knowledgeable person would be changed or influenced. We use materiality both in planning the scope of our audit work and in evaluating the results of our work.
We determined materiality for the Group to be €25 million (2014: €25 million), which is below 5% (2014: 5%) of pre-tax profit, and below 2% (2014: 2%) of equity.
We agreed with the Audit Committee that we would report to the Committee all audit differences in excess of €500,000 (2014: €500,000), as well as differences below that threshold which, in our view, warranted reporting on qualitative grounds. We also report to the Audit Committee on disclosure matters that we identified when assessing the overall presentation of the financial statements.
An overview of the scope of our auditOur Group audit was scoped by obtaining an understanding of the Group and its environment, including Group-wide controls, and assessing the risks of material misstatement at the Group level.
As in the prior year, our Group audit scope focused primarily on the four enrichment sites, URENCO UK Limited, URENCO Deutschland GmbH, URENCO Nederland B.V. and Louisiana Energy Services, LLC. All four of the Group’s enrichment locations were subject to a full scope audit as they represent the principal business units and account for the majority of the Group’s net assets (94% of Group total), revenue (96% of Group total) and profit before tax (95% of Group total).
Our audit work at each location was executed at levels of materiality applicable to each individual entity which were lower than Group materiality, ranging from €1.8 million to €15.0 million (2014: €1.8 million to €15.0 million).
At URENCO’s head office we tested the consolidation process and carried out analytical procedures to confirm our conclusion that there were no significant risks of material misstatement of the aggregated financial information of the remaining components not subject to audit or audit of specified account balances.
The Group audit team continued to follow a programme of planned site visits that has been designed so that the Senior Statutory Auditor or a senior member of the Group audit team visits each of the four enrichment site locations at least once every other year.
Opinion on other matters prescribed by the Companies Act 2006In our opinion, based on the work undertaken in the course of the audit:
• the information given in the Strategic Report and the Directors’ Report for the financial year for which the financial statements are prepared is consistent with the financial statements; and
• the Strategic Report and the Director’s Report have been prepared in accordance with applicable legal requiremens.
In the light of the knowledge and understanding of the company and its environment obtained in the course of the audit, we have not identified any material misstatements in the Strategic Report and the Director’s Report.
Financial statementsIndependent Auditors’ Report continued
URENCO Annual report and accounts 2015 61
Financial statementsGovernanceStrategic reportIntroduction
< previous next >
Contents

Matters on which we are required to report by exception
Adequacy of explanations received and accounting records
Under the Companies Act 2006 we are required to report to you if, in our opinion:
• we have not received all the information and explanations we require for our audit; or
• adequate accounting records have not been kept by the parent company, or returns adequate for our audit have not been received from branches not visited by us; or
• the parent company financial statements are not in agreement with the accounting records and returns.
We have nothing to report in respect of these matters.
Directors’ remuneration
Under the Companies Act 2006 we are also required to report if in our opinion certain disclosures of Directors’ remuneration have not been made. We have nothing to report arising from this matter.
Our duty to read other information in the Annual Report
Under International Standards on Auditing (UK and Ireland), we are required to report to you if, in our opinion, information in the annual report is:
• materially inconsistent with the information in the audited financial statements; or
• apparently materially incorrect based on, or materially inconsistent with, our knowledge of the Group acquired in the course of performing our audit; or
• otherwise misleading.
In particular, we are required to consider whether we have identified any inconsistencies between our knowledge acquired during the audit and the Directors’ statement that they consider the annual report is fair, balanced and understandable and whether the annual report appropriately discloses those matters that we communicated to the audit committee which we consider should have been disclosed. We confirm that we have not identified any such inconsistencies or misleading statements.
Respective responsibilities of Directors and auditorAs explained more fully in the Directors’ Responsibilities Statement, the Directors are responsible for the preparation of the financial statements and for being satisfied that they give a true and fair view. Our responsibility is to audit and express an opinion on the financial statements in accordance with applicable law and International Standards on Auditing (UK and Ireland).
We also comply with International Standard on Quality Control 1 (UK and Ireland). Our audit methodology and tools aim to ensure that our quality control procedures are effective, understood and applied. Our quality controls and systems include our dedicated professional standards review team and independent partner reviews.
This report is made solely to the company’s members, as a body, in accordance with Chapter 3 of Part 16 of the Companies Act 2006. Our audit work has been undertaken so that we might state to the company’s members those matters we are required to state to them in an auditor’s report and/or those further matters we have expressly agreed to report to them on in our engagement letter and for no other purpose. To the fullest extent permitted by law, we do not accept or assume responsibility to anyone other than the company and the company’s members as a body, for our audit work, for this report, or for the opinions we have formed.
Scope of the audit of the financial statementsAn audit involves obtaining evidence about the amounts and disclosures in the financial statements sufficient to give reasonable assurance that the financial statements are free from material misstatement, whether caused by fraud or error. This includes an assessment of: whether the accounting policies are appropriate to the Group’s and the parent company’s circumstances and have been consistently applied and adequately disclosed; the reasonableness of significant accounting estimates made by the Directors; and the overall presentation of the financial statements. In addition, we read all the financial and non-financial information in the annual report to identify material inconsistencies with the audited financial statements and to identify any information that is apparently materially incorrect based on, or materially inconsistent with, the knowledge acquired by us in the course of performing the audit. If we become aware of any apparent material misstatements or inconsistencies we consider the implications for our report.
Ross Howard FCA (Senior Statutory Auditor) for and on behalf of Deloitte LLP Chartered Accountants and Statutory Auditor London, United Kingdom
2 March 2016
Financial statementsIndependent Auditors’ Report continued
62
Financial statementsGovernanceStrategic reportIntroduction
< previous next >
Contents

Financial statementsConsolidated Income StatementFor the year ended 31 December 2015
Notes2015
€m2014
€m
Revenue from sales of goods and services 3 1,842.2 1,612.0
Work performed by the Group and capitalised 20.8 18.1Changes to inventories of work in progress and finished goods 24.4 2.7Raw materials and consumables used (11.0) (8.8)Tails provision created 26 (182.9) (149.2)Employee benefits expense 6 (202.3) (168.5)Depreciation and amortisation 5 (496.1) (417.9)Other expenses 5 (323.9) (235.5)Share of results of joint venture 15 (6.6) -Income from operating activities 5 664.6 652.9
Finance income 7 89.3 35.5Finance costs 8 (220.8) (167.2)Income before tax 533.1 521.2
Income tax expense 9 (81.0) (116.7)Net income for the year attributable to the owners of the Company 452.1 404.5
Earnings per share € €Basic earnings per share 11 2.7 2.4
URENCO Annual report and accounts 2015 63
Financial statementsGovernanceStrategic reportIntroduction
< previous next >
Contents

Financial statementsConsolidated Statement of Comprehensive IncomeFor the year ended 31 December 2015
Notes2015
€m2014
€m
Net income for the year attributable to the owners of the Company 452.1 404.5
Other comprehensive income:
Items that may be reclassified subsequently to the income statement
Cash flow hedges – transfers to revenue 25 57.4 (0.9)Cash flow hedges – mark to market (133.7) (121.9)Net investment hedge - mark to market (87.6) (38.7)Deferred tax credit on hedges 9 7.1 23.7
Current tax credit/(charge) on hedges 9 3.3 (0.2)
Exchange differences on hedge reserve (2.9) (1.5)(156.4) (139.5)
Exchange differences on foreign currency translation of foreign operations 298.8 273.5Share of joint venture exchange differences on foreign currency translation of foreign operations (0.2) -
298.6 273.5
Items that will not be reclassified subsequently to the income statement
Actuarial gains/(losses) on defined benefit pension schemes 27 38.9 (44.5)Deferred tax (charge)/credit on actuarial gains/(losses) 9 (10.3) 10.3Current tax credit on actuarial gains/(losses) 9 - 0.2Share of joint venture actuarial gains on defined benefit pension schemes 2.5 -Utility partner payments (0.3) (0.1)Deferred tax credit on utility partner payments 9 0.1 -
30.9 (34.1)
Other comprehensive income 173.1 99.9
Total comprehensive income for the year attributable to the owners of the Company 625.2 504.4
64
Financial statementsGovernanceStrategic reportIntroduction
< previous next >
Contents

Financial statements Consolidated Statement of Financial Position As at 31 December 2015
Notes2015
€m2014
€m
Assets Non-current assetsProperty, plant and equipment 12 6,150.5 5,483.9Investment property 13 7.5 5.8Intangible assets 14 52.5 64.4Investments 15 7.2 0.7Financial assets 17 9.1 9.0Derivative financial instruments 25 77.7 16.2Deferred tax assets 9 301.0 248.3
6,605.5 5,828.3
Current assetsInventories 18 507.7 475.2Trade and other receivables 19 426.6 543.9Derivative financial instruments 25 21.6 24.7Short-term bank deposits 20 - 322.8Cash and cash equivalents 21 391.3 199.5
1,347.2 1,566.1Total assets 7,952.7 7,394.4
Equity and liabilities Equity attributable to the owners of the CompanyShare capital 22 237.3 237.3Additional paid in capital 16.3 16.3Retained earnings 2,008.9 1,865.9Hedging reserve (287.7) (131.3)Foreign currency translation reserve 455.5 156.9Total equity 2,430.3 2,145.1
Non-current liabilitiesTrade and other payables 28 140.4 132.0Interest bearing loans and borrowings 25 2,989.6 2,792.8Provisions 26 1,416.0 1,108.1Retirement benefit obligations 27 70.9 101.6Deferred income 23 42.4 40.9Derivative financial instruments 25 203.3 92.2Deferred tax liabilities 9 58.2 47.9
4,920.8 4,315.5
Current liabilitiesTrade and other payables 28 278.2 291.8Interest bearing loans and borrowings 25 229.2 503.5Provisions 26 5.0 1.7Derivative financial instruments 25 83.3 109.0Income tax payable 4.1 19.1Deferred income 23 1.8 8.7
601.6 933.8Total liabilities 5,522.4 5,249.3Total equity and liabilities 7,952.7 7,394.4
Registered Number 01022786The financial statements were approved by the Board of Directors and authorised for issue on 2 March 2016. They were signed on its behalf by:
Dr Thomas Haeberle Ralf ter Haar Chief Executive Officer Chief Financial Officer
URENCO Annual report and accounts 2015 65
Financial statementsGovernanceStrategic reportIntroduction
< previous next >
Contents

Financial statements Consolidated Statement of Changes in Equity As at 31 December 2015
Share capital€m
Additional paid in capital
€m
Retained earnings
€m
Hedging reserves
€m
Foreigncurrency
translationreserve
€m
Attributableto the owners
of theCompany
€m
As at 1 January 2015 237.3 16.3 1,865.9 (131.3) 156.9 2,145.1
Income for the period - - 452.1 - - 452.1
Other comprehensive income - - 30.9 (156.4) 298.6 173.1
Total comprehensive income - - 483.0 (156.4) 298.6 625.2
Equity dividends paid - - (340.0) - - (340.0)As at 31 December 2015 237.3 16.3 2,008.9 (287.7) 455.5 2,430.3
Share capital€m
Additional paid in capital
€m
Retained earnings
€m
Hedging reserves
€m
Foreigncurrency
translationreserve
€m
Attributableto the owners
of theCompany
€m
As at 1 January 2014 237.3 16.3 1,835.5 8.2 (116.6) 1,980.7
Income for the period - - 404.5 - - 404.5
Other comprehensive income - - (34.1) (139.5) 273.5 99.9
Total comprehensive income - - 370.4 (139.5) 273.5 504.4
Equity dividends paid - - (340.0) - - (340.0)
As at 31 December 2014 237.3 16.3 1,865.9 (131.3) 156.9 2,145.1
66
Financial statementsGovernanceStrategic reportIntroduction
< previous next >
Contents

Financial statements Consolidated Cash Flow Statement As at 31 December 2015
Notes2015
€m2014
€m
Income before tax 533.1 521.2Adjustments to reconcile Group income before tax to net cash inflows from operating activities:Share of joint venture results 15 (3.9) -Depreciation and amortisation 5 496.1 417.9Finance income 7 (89.3) (35.5)Finance cost 8 220.8 167.2Loss on disposal / write off of property, plant and equipment 0.8 0.8Increase in provisions 167.4 61.1Operating cash flows before movements in working capital 1,325.0 1,132.7Increase in inventories (10.9) (106.7)Decrease/(increase) in receivables and other debtors 0.6 (14.8)Decrease in payables and other creditors (113.2) (32.0)Cash generated from operating activities 1,201.5 979.2Income taxes paid (121.7) (145.7)Net cash flow from operating activities 1,079.8 833.5
Investing activitiesInterest received 42.9 31.2Proceeds from sale of property, plant and equipment 0.5 16.1Purchases of property, plant and equipment (449.9) (426.4)Prepayments in respect of fixed asset purchases(i) (67.5) (110.7)Purchase of intangible assets (2.3) (5.5)Purchase of investment (0.3) (0.2)Net cash flow from investing activities (476.6) (495.5)
Financing activitiesInterest paid (172.0) (139.7)Payments in respect of derivatives (93.4) (0.5)Dividends paid to equity holders 10 (340.0) (340.0)Proceeds from new borrowings 827.7 1,599.6Placement of short-term deposits - (322.8)Repayment of borrowings (989.7) (1,045.4)Net cash flow from financing activities (767.4) (248.8)
Net (decrease)/increase in cash and cash equivalents (164.2) 89.2Cash and cash equivalents and short-term deposits at 1 January 522.3 90.2Effect of foreign exchange rate changes 33.2 20.1Cash and cash equivalents at 31 December 21 391.3 199.5Short-term deposits at 31 December 20 - 322.8Cash and cash equivalents and short-term deposits at 31 December 391.3 522.3(i) This represents prepayments in respect of fixed asset purchase payments made to the ETC joint venture in advance of deliveries of centrifuge cascades.
URENCO Annual report and accounts 2015 67
Financial statementsGovernanceStrategic reportIntroduction
< previous next >
Contents

Financial statementsNotes to the Consolidated Financial StatementsFor the year ended 31 December 2015
1. Authorisation of financial statements and compliance with IFRS The financial statements of URENCO Limited and its subsidiaries (“the URENCO Group”) for the year ended 31 December 2015 were approved and authorised for issue by the Board of Directors on 2 March 2016 and the statement of financial position was signed on the Board’s behalf by Dr Thomas Haeberle and Ralf ter Haar.
URENCO Limited is a company domiciled and incorporated in the UK under the Companies Act 2006. The address of the Company’s registered office is given on page 130. URENCO Limited is the ultimate holding company of the URENCO Group. The nature of the Group’s operations and its principal activities are set out in note 4, in the Chief Executive Officer’s review, and in the Directors’ Report.
The Group financial statements have been prepared in accordance with International Financial Reporting Standards (IFRS), as adopted by the European Union, and as applied in accordance with the provisions of the Companies Act 2006.
2. Significant accounting policies
Basis of preparation and presentation
The Group consolidated financial statements have been prepared under the historical cost convention, except for those financial instruments and pension obligations that have been measured at fair value. The carrying values of recognised financial assets and liabilities that are hedged items in fair value hedges, and are otherwise carried at amortised cost, are adjusted to record changes in the fair values attributable to the risks that are being hedged.
The Group consolidated financial statements are presented in euros and all values are rounded to the nearest 0.1 million (€m) except where otherwise indicated. The financial statements are presented in euros as a significant portion of the Group’s cost base is euro denominated. The Group consists of entities that have functional currencies of US dollar, sterling and euros. The Parent Company’s functional currency is sterling, which means that its books and records are denominated in sterling even though the financial statements are presented in euros.
Going concernAs discussed in the Directors’ Report, the Directors are satisfied that the Company has adequate resources to continue in operational existence for the foreseeable future. Thus they continue to adopt the going concern basis of accounting in preparing the annual financial statements.
Changes in accounting policy and disclosuresThe accounting policies adopted are consistent with those followed in the preparation of the Group’s annual financial statements for the year ended 31 December 2014, except as follows:
The Group has adopted the following new and amended IFRS and IAS during the year. Adoption of these revised standards did not have any effect on the financial performance or position of the Group as at 31 December 2015.
International Accounting Standards (IFRS / IAS)
IASB Effective Date – periods commencing on or after
EU-endorsed effective Date – periods commencing on or after
Amendments to IAS 19 Employee Benefits – Contributions from employees or third parties that are linked to services 1 July 2014 1 February 2015
Amendments to IFRS 8, IFRS 13, IAS 16, IAS 24 and IAS 38 issued in the Annual Improvements Cycle 2010-2012 1 July 2014 1 February 2015
Amendments to IFRS 1, IFRS 13 and IAS 40 issued in the Annual Improvement Cycle 2011-2013 1 July 2014 1 January 2015
New standards and interpretations
At the date of authorisation of these financial statements, the following Standards and Interpretations which have not been applied in these financial statements were in issue but not yet effective (and in some cases had not yet been adopted by the EU):
68
Financial statementsGovernanceStrategic reportIntroduction
< previous next >
Contents

Financial statementsNotes to the Consolidated Financial Statements continuedFor the year ended 31 December 2015
2. Significant accounting policies continued
International Accounting Standards (IFRS / IAS)IASB Effective Date – periods commencing on or after
EU-endorsed effective Date – periods commencing on or after
New standards
IFRS 9 – Financial instruments 1 January 2018TBC – Endorsement outstanding
IFRS 14 – Regulatory Deferral Accounts
First time adopters with first financial statements beginning on or after 1 January 2016
EU has decided not to endorse
IFRS 15 – Revenue from Contracts with Customers 1 January 2018TBC – Endorsement outstanding
IFRS 16 – Leases 1 January 2019TBC – Endorsement outstanding
Amended standardsAmendments to IFRS 10 and IAS 28 – Sale or contribution of Assets between an Investor and its Associate or Joint Venture Deferred TBC – Endorsement haltedAmendments to IFRS 11 – Accounting for Acquisitions of Interests in Joint Operations 1 January 2016 1 January 2016Amendments to IAS 16 and IAS 38 – Clarification of Acceptable Methods of Depreciation and Amortisation 1 January 2016 1 January 2016
Amendments to IAS 27 – Equity method in Separate Financial Statements 1 January 2016TBC – Endorsement outstanding
Annual Improvements – 2012-2014 cycle 1 January 2016TBC – Endorsement outstanding
Amendments to IFRS 10, IFRS 12 and IAS 28 – Applying the consolidation exception 1 January 2016
EU has decided not to endorse
Amendments to IAS 1 – Disclosure Initiative 1 January 2016TBC – Endorsement outstanding
The Directors have not yet evaluated the impact of the adoption of these standards and interpretations on the consolidated financial statements in the period of initial application.
Basis of consolidation The Group consolidated financial statements incorporate the financial statements of the Company and entities controlled by the Company (its subsidiaries) made up to 31 December each year. The financial statements also incorporate the Company’s share of the results of its joint venture using the equity method made up to 31 December each year. Control is achieved when the Company has the power over the investee; is exposed, or has rights, to variable returns from its involvement with the investee; and has the ability to use its power to affect its returns. Subsidiaries continue to be consolidated until the date such control ceases to exist.
The results of subsidiaries acquired or disposed of during the year are included in the consolidated income statement from the effective date of acquisition or up to the effective date of disposal, as appropriate. If a subsidiary ceases to be controlled, other than by sale or exchange of shares, no income or loss will be recognised in the consolidated income statement.
Where necessary, adjustments are made to the financial statements of subsidiaries and joint ventures to bring the accounting policies used into line with those used by the Group. The financial statements of subsidiaries and joint ventures are prepared for the same reporting year as the Parent Company.
All intra-group transactions, balances, income and expense are eliminated on consolidation.
Significant estimates, assumptions and judgementsIn the process of applying the Group’s accounting policies, the Directors have to make significant estimates, assumptions and judgements. There is a risk that the carrying values of the Group’s assets and liabilities could be materially different should these assumptions be materially incorrect. The main areas of risk are discussed below:
• Property, plant and equipment, investment property, intangible assets, investments and inventory are reviewed for impairment whenever events or circumstances indicate that the carrying value may not be fully recoverable. The carrying values of property, plant and equipment, investment property, intangible assets, investments and inventory are given in notes 12, 13, 14, 15 and 18 respectively. Where impairment indicators have been identified, the Directors have assessed the recoverable amount of assets based on value in use.
Determination of the value in use requires the Directors to make an estimation of value for the cash generating units (CGU) involved and changes in estimates could impact the recoverable values of these assets. The key assumptions utilised within the value in use calculations are reviewed regularly and include: estimations of future market dynamics and associated market pricing projections; estimates of levels of long-term growth for the nuclear enrichment market; extension of the US operating licence beyond 2040;
URENCO Annual report and accounts 2015 69
Financial statementsGovernanceStrategic reportIntroduction
< previous next >
Contents

Financial statementsNotes to the Consolidated Financial Statements continuedFor the year ended 31 December 2015
2. Significant accounting policies continued ongoing capital expenditure requirements to maintain and operate the business, together with levels of associated operating costs;
and discount rates. The value in use calculations for CGUs are based on long-term cash flow projections which utilise the Group’s 10 year business plan and relevant sensitivity analyses for key assumptions and variables are also assessed. Pricing assumptions are based on internal market analysis of future market conditions, with reference to external forecast data where available. URENCO has two key CGUs, its European operations and its US operations. For 2015 URENCO concluded that there were no indicators of impairment for its European operations and accordingly no impairment test has been carried out. An impairment test on its US operations at 31 December 2015 has been completed which showed that, while the recoverable amount of the CGU exceeded the carrying value of its assets, the adverse changes in external market developments and the corresponding impact on assumed uncontracted SWU prices, have led to a significantly reduced level of headroom for the US operations when compared to the analysis performed at 31 December 2014.
Assumptions relating to uncontracted SWU prices in the impairment test for the US operations are a key driver and have a material influence on the recoverable amount of the CGU. However, the value is not materially sensitive to SWU price fluctuations prior to 2025 as the majority of sales in that period are already contracted. A further deterioration in long-term forecast market conditions would result in erosion of the recoverable amount of the US operations, and may result in an impairment of the CGU.
• Depreciation of centrifuges is calculated based on their expected operational life and is charged so as to write off the cost of assets over their estimated useful lives down to their residual value. During 2015 no changes in the estimated useful life were made.
• Deferred tax assets are recognised for all unused tax losses to the extent that it is probable that suitable taxable income will be available against which the losses can be utilised. Significant management judgement is required to determine the amount of deferred tax assets that can be recognised, based upon the likely timing and level of future taxable profits for the period 2016 to 2025. The carrying value of deferred tax assets at 31 December 2015 was €301.0 million (2014: €248.3 million). At 31 December 2015, there were unrecognised deferred tax assets relating to US tax losses with a tax value of €18.8 million (2014: €21.0 million). Further details are contained in note 9.
• The cost of defined benefit pension plans is determined using actuarial valuations. The actuarial valuation involves making assumptions about life expectancies, discount rates, expected rates of return on assets, future salary increases, and future pension increases. Due to the long-term nature of these plans, such estimates are subject to significant uncertainty. Details of these assumptions and the Group pension liability are given in note 27.
• In certain circumstances, sales of goods and services are deemed to have been met from inventory borrowed under agreement from third parties. Calculating the exact amount of third party inventory utilised requires assumptions around forecast future customer activity and plant operations. In such circumstances where revenue is generated from the sale of borrowed inventory, the profit that results from the sale of those inventories is deferred until future periods.
• In order to account for constituent parts of enriched uranium product or low assay feed, where the resultant fungible material is part owned by third parties and part owned by URENCO, certain assumptions and judgements are required in order to attribute inventory value across the categories of raw materials, work-in-progress and finished goods. These judgements involve consideration of anticipated customer behaviour and forecasts surrounding market price developments. These judgements result in the calculation of an average mean contractual customer tails assay or “accounting assay” that is used to derive the SWU and feed component of enriched uranium product and low assay feed.
• Provision for tails disposal and for decommissioning of plant and machinery is made on a discounted basis to meet long-term liabilities. A year of discounting is unwound annually to recognise progression towards the full escalated cost estimate for eventual safe disposal or decommissioning. The final amounts of these provisions are uncertain but are evaluated based upon the planned operational activity involved in successfully achieving safe disposal or decommissioning as well as third party pricing assumptions.
The provision for tails is calculated as a rate applicable to the quantity of tails held at the statement of financial position date. Consequently, a movement in the rate or quantity of tails held would result in a movement in the provision, excluding any changes due to translation of non-euro denominated provisions to the reporting currency of euros. The movement in the tails provision is taken directly to the income statement.
Decommissioning costs are also escalated and discounted based upon current operational expectations. These include all costs associated with returning the site to ‘greenfield’ or ‘brownfield’ status. Adjustments to the decommissioning provisions associated with property, plant and equipment result in adjustments to the value of the related asset. Where the related asset is fully written down to residual value and the provision has decreased, a gain will be taken directly to the income statement. The Directors intend to decommission plant used in the enrichment process as soon as practicably possible after it is shut down.
The cash flows have been inflated at a rate of 2% (2014: 2%) per annum and discounted at a rate of 4% (2014: 4%), to take account of the time value of money, in accordance with industry practice. The fundamental assumptions underlying these provisions are reviewed on a periodic basis. The last review was carried out in 2015. Details of the provisions are given in note 26.
• The Group has taken out derivative instruments, many of which are designated as accounting hedges. Judgement is applied in management’s assessment of the effectiveness of these hedges in particular where the probability and timing of the cash revenues or expenditures (the hedged items) is concerned to which the hedging instruments are related.
70
Financial statementsGovernanceStrategic reportIntroduction
< previous next >
Contents

Financial statementsNotes to the Consolidated Financial Statements continuedFor the year ended 31 December 2015
2. Significant accounting policies continued
Interests in joint ventures The Group has an interest in a joint venture which is a joint arrangement. The Group has accounted for the results of its Enrichment Technology Company (ETC) joint venture in accordance with IFRS 11 Joint Arrangements. The Group has recognised and measured the investment using the equity method in accordance with IAS 28 Investments in Associates and Joint Ventures.
A joint arrangement is an arrangement of which two or more parties have joint control. A joint arrangement is either a joint operation or a joint venture. Joint control is the contractually agreed sharing of control of an arrangement, which exists only when decisions about the relevant activities require the unanimous consent of the parties sharing control.
The arrangement with ETC is a joint venture, whereby the parties that have joint control of the arrangement have rights to the net assets of the arrangement rather than rights to the assets and obligations for the liabilities, relating to the arrangement.
Financial statements of jointly controlled entities are prepared for the same reporting period as the Group.
When the Group contributes or sells assets to the joint venture, any portion of the gain or loss from the transaction is recognised based on the substance of the transaction. When the Group purchases assets from the joint venture, the Group does not recognise its share of the income of the joint venture from the transaction until it uses the purchased assets to sell enrichment services to an independent party.
The carrying value of the investment in the joint venture is increased or decreased to recognise the Group’s share of the net profit or net loss of the joint venture and for changes in the Group’s share of the joint venture’s other comprehensive income. Distributions received from the joint venture reduce the carrying amount of the investment. The Group’s share of the net profit or net loss of the joint venture is recognised in the consolidated income statement. The Group’s share of changes recognised in other comprehensive income of the joint venture is recognized in the consolidated statement of comprehensive income. The Group discontinues recognising its share of net assets or its share of net results from the joint venture when the value of the investment has reduced to nil. After the Group’s interest is reduced to nil, additional losses are provided for, and a liability is recognised, only to the extent that the Group has incurred legal or constructive obligations or made payments on behalf of the joint venture. If the joint venture subsequently reports a positive equity, the Group resumes recognising its share of net assets, net result and other comprehensive income of the joint venture.
Revenue recognition The Group operates as a supplier of uranium enrichment services.
Customers usually provide UF6 to the Group as part of their contract for enrichment with URENCO. Customers are billed for the enrichment services, expressed as separative work units (“SWU”) deemed to be contained in the Enriched Uranium Product (“EUP”) delivered. SWU is a standard unit of measurement that represents the effort required to separate a given amount of uranium into two streams: EUP having a higher percentage of U235 and depleted uranium having a lower percentage of U235. The SWU contained in EUP is calculated using an industry standard formula based on the physics of enrichment.
The Group also generates revenue from the sale of uranium to customers.
Revenue is recognised to the extent that it is probable that the economic benefits will flow to the Group and the revenue can be reliably measured. Revenue is measured at the fair value of the consideration received or receivable and represents amounts receivable for services and goods provided in the normal course of business, excluding discounts, VAT and other sales related taxes.
Customers may make advance payments to be applied against future orders or deliveries. Advances are accounted for as deferred revenue and revenue is recognised on provision of the service or transfer of legal title to the goods.
Sale of servicesRevenue is derived from the sales of the SWU component of EUP arising from the enrichment service provided. Revenue is recognised at the time the service is provided under the terms of the contract with customers. This is the earlier of allocation of the enrichment activity (SWU) to the customer’s book account (either held at a third party or with URENCO) or physical delivery by URENCO of the SWU component of EUP.
Additionally, revenue is derived from the sales of services for handling uranic materials which is recognised at the time the service is provided.
Sale of goods Revenue is derived from the sale of uranium in the form of UF6 and U3O8 that is owned by URENCO and occasionally from the sale of the uranium component of EUP. Revenue is recognised at the time legal title to the material is transferred under the terms of the contract with customers. This may be at physical delivery or transfer to a customer’s book account held by a third party or with URENCO.
Interest IncomeInterest income is accrued on a time basis by reference to the principal outstanding and at the effective interest rate applicable, which is the rate that exactly discounts estimated future cash receipts through the expected life of the financial asset to that asset’s net carrying amount.
URENCO Annual report and accounts 2015 71
Financial statementsGovernanceStrategic reportIntroduction
< previous next >
Contents
Financial statementsNotes to the Consolidated Financial Statements continuedFor the year ended 31 December 2015
2. Significant accounting policies continued
Work performed by the entity and capitalised Costs for project management during construction of enrichment and deconversion facilities are capitalised and credited to the income statement at cost. Cost includes direct materials and labour, plus attributable overheads. It is the Company’s policy to capitalise the costs of facility construction and installing capacity. It also capitalises those costs directly associated with obtaining operating licences.
Leasing and hire purchase commitments Assets held under finance leases, which are leases where substantially all risks and rewards of ownership of the asset have passed to the Group are capitalised in the statement of financial position and are depreciated over their useful lives. The capital elements of future obligations under finance leases and hire purchase are included as liabilities in the statement of financial position. The interest elements of the rental obligations are charged in the income statement over the periods of the finance leases and hire purchase contracts and represent a constant proportion of the balance of capital repayments outstanding.
Rental payments under operating leases are charged to the income statement on a straight-line basis over the term of the lease. Benefits received and receivable as an incentive to enter into an operating lease are also spread on a straight-line basis over the lease term.
Foreign currencies The consolidated financial statements are presented in euros which is the Group’s presentational currency. The items included in these consolidated financial statements relating to the Group companies are measured using their functional currency, that is the currency in the main environment in which they operate.
Transactions in currencies other than an entity’s functional currency are recorded at the rates of exchange prevailing on the dates of the transactions. At each statement of financial position date, monetary assets and liabilities that are denominated in foreign currencies are retranslated at the rates prevailing at the statement of financial position date. Non-monetary assets and liabilities carried at fair value that are denominated in foreign currencies are translated at the rates prevailing at the date when the fair value was determined. Non-monetary items that are measured in terms of historical cost in a foreign currency are translated using the exchange rates as at the dates of the initial transactions. Gains and losses arising on retranslation are included in other comprehensive income. The functional currencies across the Group are sterling, US dollar, and the euro.
In order to hedge its exposure to certain foreign exchange risks, the Group enters into forward contracts and options (see page 76 for details of the Group’s accounting policies in respect of such derivative financial instruments).
On consolidation, the assets and liabilities of the Group’s non-euro operations are translated into euros at exchange rates prevailing on the statement of financial position date. Income and expenditure items are translated at the average exchange rates for the period unless exchange rates fluctuate significantly. As most of the Group’s transactions are in stable currencies, the use of average rates of exchange is appropriate. However, if exchange rates were subject to significant fluctuations, translation would be made using closing rates of exchange with appropriate explanation. Exchange differences arising are recognised as other comprehensive income and transferred to the Group’s foreign currency translation reserves.
Retirement benefit costs The Group operates a number of pension schemes in the UK, Germany, the Netherlands and the USA. Some are defined benefit schemes (four in total) which, with the exception of Germany, are funded externally; and others are defined contribution schemes. No post-retirement benefits other than pensions are provided.
Payments to defined contribution retirement benefit schemes are charged as an expense as they fall due. Payments made to state-managed retirement benefit schemes are dealt with as payments to defined contribution schemes where the Group’s obligations under the schemes are equivalent to those arising in defined contribution retirement benefit schemes.
For defined benefit retirement schemes, the cost of providing benefits is determined using the projected unit credit method, with actuarial assessments being carried out at each statement of financial position date. Actuarial gains and losses are recognised in full in the consolidated statement of comprehensive income in the period in which they occur.
Past service cost is immediately recognised in the income statement to the extent that the benefits are already vested. Otherwise it is amortised on a straight-line basis over the average period until the benefits become vested.
The retirement benefit obligations recognised in the statement of financial position represent the present value of the defined benefit obligation as reduced by the fair value of scheme assets. Any asset resulting from this calculation is limited to past service cost, plus the present value of available refunds and reductions in future contributions to the plan.
Net-interest is calculated by applying a discount rate to the net defined benefit liability or asset. Net interest expense or income is recognised within finance costs (see note 8) or finance income (see note 7).
Taxation The tax expense represents the sum of the tax currently payable on the Group’s net income for the year and attributable deferred tax.
72
Financial statementsGovernanceStrategic reportIntroduction
< previous next >
Contents

Financial statementsNotes to the Consolidated Financial Statements continuedFor the year ended 31 December 2015
2. Significant accounting policies continued
Current income tax The tax currently payable is based on taxable income for the year. Taxable income differs from net income as reported in the income statement because it excludes items of income or expense that are taxable or deductible in other years and it further excludes items that are never taxable or deductible. The Group’s liability for current tax is calculated using tax rates that have been enacted or substantively enacted by the statement of financial position date.
Current income tax relating to items recognised in other comprehensive income is also recognised in other comprehensive income and not in the income statement.
Deferred income tax Deferred tax is the tax expected to be payable or recoverable on differences between the carrying amounts of assets and liabilities in the financial statements and the corresponding tax bases used in the computation of taxable income and is accounted for using the statement of financial position liability method. Deferred tax liabilities are recognised for all taxable temporary differences and deferred tax assets are recognised to the extent that it is probable that taxable income will be available against which deductible temporary differences can be utilised. Such assets and liabilities are not recognised if the temporary difference arises from goodwill or from the initial recognition (other than in a business combination) of other assets and liabilities in a transaction that affects neither the tax income nor the accounting income.
Deferred tax liabilities are recognised for taxable temporary differences arising on investments in subsidiaries and associates, and interests in joint ventures, except where the Group is able to control the timing of the reversal of the temporary difference and it is probable that the temporary difference will not reverse in the foreseeable future.
The carrying amount of deferred tax assets is reviewed at each statement of financial position date and reduced to the extent that it is no longer probable that sufficient taxable income will be available to allow all or part of the asset to be recovered.
Deferred tax is calculated at the tax rates that are expected to apply in the period when the liability is settled or the asset is realised, based on the tax laws and rates that have been enacted or substantively enacted at the statement of financial position date. Deferred tax is charged or credited in the income statement, except when it relates to items charged or credited directly to other comprehensive income, in which case the deferred tax is also recorded within other comprehensive income.
Deferred tax assets and liabilities are offset when there is a legally enforceable right to set off current tax assets against current tax liabilities and when they relate to income taxes levied by the same taxation authority, and the Group intends to settle its current tax assets and liabilities on a net basis.
Property, plant and equipmentPlant and machinery is stated at cost, excluding the costs of day-to-day servicing, less accumulated depreciation and impairment losses (if any). Such cost includes the cost of replacing part of the plant and equipment when that cost is incurred, if the recognition criteria are met. Decommissioning assets are also reported under plant and machinery and are measured at net present value of future decommissioning costs and revised for changes. Decommissioning assets are depreciated over 2 – 15 years using the straight line method.
Land and buildings held for use in the production or supply of goods or services, or for administrative purposes, are stated in the statement of financial position at their cost less accumulated depreciation and impairment losses.
Properties in the course of construction are carried at cost including directly attributable costs, less any recognised impairment loss. Borrowing costs for qualifying assets are capitalised in accordance with the Group’s accounting policy. The borrowing costs capitalisation rate of assets under construction was 4.41% (2014: 3.65%). Depreciation of these assets commences when the assets are commissioned for use.
Office fixtures and fittings and computer equipment are stated at cost less accumulated depreciation and any recognised impairment.
Depreciation is charged so as to write off the cost of assets, other than freehold land and properties under construction, over their estimated useful lives, using the straight-line method, on the following basis:
Buildings 12 – 40 years
Plant and machinery 2 – 15 years
Office fixtures and fittings 12 years
Motor vehicles 4 years
Computer equipment 3 – 5 years
The gain or loss arising on the disposal or retirement of an asset is determined as the difference between the sales proceeds and the carrying amount of the asset and is recognised in the income statement.
The carrying amount of property, plant and equipment is reviewed for impairment when events or changes in circumstances indicate the carrying amount may not be recoverable.
URENCO Annual report and accounts 2015 73
Financial statementsGovernanceStrategic reportIntroduction
< previous next >
Contents

Financial statementsNotes to the Consolidated Financial Statements continuedFor the year ended 31 December 2015
2. Significant accounting policies continued
Investment property The Group has elected the cost model to measure investment property, whilst information about the fair value is disclosed in note 13 about investment property.
Investment property, which is property held to earn rentals, is stated at cost, less accumulated depreciation and impairment losses (if any). Cost includes the purchase price and directly attributable costs of bringing the asset to the location and condition necessary for it to be capable of operating in the manner intended by management, excluding the costs of day-to-day servicing.
Depreciation is charged so as to write off the cost of the assets, other than the land element, over its estimated useful life of 10 years, using the straight-line method.
The gain or loss arising on the disposal or retirement of an asset is determined as the difference between the sales proceeds and the carrying amount of the asset and is recognised in the income statement.
The carrying amount of the investment property is reviewed for impairment when there is any indication that the carrying amount may not be recoverable.
Intangible assets
Research and development expenditure
Expenditure on research activities is recognised as an expense in the period in which it is incurred.
An internally generated intangible asset arising from the Group’s development activities is recognised only if all of the following conditions are met:
• An asset is created that can be identified;
• It is probable that the asset created will generate future economic benefits;
• The development cost of the asset can be measured reliably; and
• There is adequate technical, financial and other resource available to complete the development.
Internally generated intangible assets are amortised on a straight-line basis over their useful lives. Expenditure on development activities where the above criteria are not met is recognised as an expense in the period in which it is incurred.
Amortisation is charged so as to write off the cost or valuation of internally generated intangible assets, over their estimated useful lives, using the straight-line method.
The carrying value of capitalised development expenditure is reviewed for impairment annually before being brought into use.
Licence costs
Licences acquired are carried initially at cost. Licence costs are amortised on a straight-line basis over their useful lives.
Amortisation is charged so as to write off the cost or valuation of licence costs, over their estimated useful lives, using the straight-line method.
The licence in the USA was granted in 2006 and is being amortised over the remaining licence period from the commencement of production in the USA. The first amortisation took place in 2010 when UUSA started its production.
Other software assets
Software and development costs associated with the Group’s implementation of its ERP system (SAP 6.0) have been capitalised following “Go Live” of the system in November 2010.
Amortisation of these capitalised project costs takes place on a straight-line basis, based on a useful economic life of five years, with no residual value.
The carrying value of intangible assets is reviewed for impairment whenever events or changes in circumstances indicate the carrying value may not be recoverable.
Waiver payment
The waiver payment comprises the right of UUK for not having to make future royalty cash payments associated with certain plant and equipment at the Capenhurst site. The consideration for this waiver payment will be settled by contracted storage services to be provided in future years by CNS. Initial recognition was measured at valuation based on estimated cash flow savings for the royalty payments. Amortisation on this waiver payment takes place on a straight-line basis over the estimated useful life of nine years.
74
Financial statementsGovernanceStrategic reportIntroduction
< previous next >
Contents

Financial statementsNotes to the Consolidated Financial Statements continuedFor the year ended 31 December 2015
2. Significant accounting policies continued
Impairment of property, plant and equipment and intangible assets At each statement of financial position date, the Group reviews the carrying amounts of its property, plant and equipment and its intangible assets to determine whether there is any indication that those assets have suffered an impairment loss. If any such indication exists, the recoverable amount of the asset is estimated in order to determine the extent of the impairment loss (if any). Where the asset does not generate cash flows that are independent from other assets, the Group estimates the recoverable amount of the cash generating unit to which the asset belongs.
Recoverable amount is the higher of fair value less selling costs and value in use. In assessing value in use, the estimated future cash flows are discounted to their present value using a pre-tax discount rate that reflects current market assessments of the time value of money and the risks specific to the asset for which the estimates of future cash flows have not been adjusted.
If the recoverable amount of an asset (or cash generating unit) is estimated to be less than its carrying amount, the carrying amount of the asset (or cash generating unit) is reduced to its recoverable amount. An impairment loss is recognised as an expense immediately.
Where an impairment loss subsequently reverses, the carrying amount of the asset (or cash generating unit) is increased to the revised estimate of its recoverable amount, but so that the increased carrying amount does not exceed the carrying amount that would have been determined had no impairment loss been recognised for the asset (or cash generating unit) in prior years. A reversal of an impairment loss is recognised as income immediately.
Inventories Inventories are stated at the lower of cost and net realisable value. For raw materials, work-in-progress and finished goods, costs comprise direct material costs and, where applicable, direct labour and production costs, and those overheads that have been incurred in bringing the inventories to their present location and condition. Cost is calculated predominantly by using the weighted average method. Net realisable value represents the estimated selling price less all estimated costs of completion and costs to be incurred in marketing, selling and distribution. Spares and other equipment are valued on a FIFO basis.
Inventory borrowings URENCO periodically borrows SWU or feed from third parties in order to optimise its operational efficiency and inventory position. The interest payments made by URENCO under loan agreements are recorded in the income statement under other expenses. These payments are recorded as “non-operational expense” and therefore do not form part of the direct costs that go into URENCO’s valuation of own inventory production. During the term of the agreement URENCO recognises both an asset and liability on its statement of financial position, valued at the weighted average cost of SWU or feed, unless sales have been made from borrowings, in which case the liability is measured at market price. Any movements in the Group’s weighted average cost does lead to revaluation of both asset and liability. At the end of the loan period URENCO returns the SWU or feed to the lender and URENCO has the intention to source this from its own production.
Short-term bank deposits Short-term bank deposits comprise deposits with an original maturity of more than three months and with an end date less than twelve months from the date of the statement of financial position.
Cash and cash equivalents Cash and cash equivalents in the consolidated statement of financial position and consolidated cash flow statement comprise cash at bank and in hand and short-term deposits with an original maturity of three months or less.
Financial instruments Financial instruments are initially recognised at fair value. Financial assets and financial liabilities are recognised on the Group’s consolidated statement of financial position when the Group becomes a party to the contractual provisions of the instrument. Financial assets are derecognised when either the rights to receive cash flows from those assets have expired or when the Group transfers its rights to receive cash flows from the asset and either (a) has transferred substantially all the risks and rewards of the asset or (b) has transferred control of the asset. Financial liabilities are derecognised when the Group’s obligations under the liability are discharged, or cancelled, or have expired.
Trade receivables Trade receivables can carry interest in accordance with the contract conditions. Trade receivables are stated at their invoiced value as payments are invariably received within the contract terms. For these reasons, no provisions are deemed necessary.
URENCO Annual report and accounts 2015 75
Financial statementsGovernanceStrategic reportIntroduction
< previous next >
Contents

Financial statementsNotes to the Consolidated Financial Statements continuedFor the year ended 31 December 2015
2. Significant accounting policies continued
Financial liabilities Financial liabilities are classified according to the substance of the contractual arrangements entered into.
Interest bearing loans and borrowings Obligations for loans and borrowings are recognised when the Group becomes party to the related contracts and are measured initially at fair value.
After initial recognition, interest bearing loans and borrowings are subsequently remeasured at amortised cost using the effective interest method.
Gains and losses arising on the repurchase, settlement or otherwise cancellation of liabilities are recognised respectively in finance income and finance cost.
Trade payables Trade payables are not usually interest bearing and are stated at their nominal value.
Derivative financial instruments and hedging The Group’s activities expose it primarily to the financial risks of changes in foreign currency exchange rates and interest rates. The Group uses foreign exchange forward contracts and interest rate swaps to hedge these exposures. The Group does not use derivative financial instruments for trading purposes. All derivative instruments that are not designated in a hedge relationship, or do not qualify for hedge accounting purposes, are economic hedges for existing exposures.
Derivative financial instruments are initially recognised and subsequently remeasured at fair value. The fair value on initial recognition is the transaction price unless part of the consideration given or received is for something other than the instrument itself. The fair value of derivative financial instruments is subsequently calculated using discounted cash flow techniques or other appropriate pricing models. The chosen method is used consistently for similar types of instruments. All valuation techniques take into account assumptions based upon market data. The fair value of forward contracts is the present value of the expected settlement amount, which is the present value of the difference between the contract rate and the current forward rate multiplied by the notional foreign currency amount. Fair value of interest rate swaps is the net present value of all expected future cash flows based on current market rates taking due account of counterpart credit risk and own credit risk.
Any gains or losses arising from changes in the fair value of derivatives that do not qualify for hedge accounting are taken to the consolidated income statement. Such gains or losses are recorded in finance income or finance costs.
Financial assets and financial liabilities are disclosed on a gross basis. URENCO has ISDA agreements with some financial counterparties that give a right to net settlement under mutual agreement only. URENCO settles all financial assets and liabilities on a gross basis and intends to continue to do so.
The treatment of gains and losses arising from revaluing derivatives designated as hedging instruments depends on the nature of the hedging relationship as follows:
Cash flow hedges
Changes in the fair value of derivative financial instruments that are designated and are effective as hedges of highly probable future cash flows are recognised directly in other comprehensive income and any ineffective portion is recognised immediately in the consolidated income statement. The ineffective portion is recorded in finance income or finance costs.
Amounts deferred in other comprehensive income are recognised in the consolidated income statement in the same period in which the hedged item affects net income or loss. These amounts are recorded in the same line of the income statement as the hedged item.
Fair value hedges
For an effective hedge of changes in fair value, the hedged item is adjusted for changes in fair value attributable to the risk being hedged and the gains and losses are taken to income or loss; the derivative is remeasured at fair value and gains and losses are taken to income or loss. Both the change in fair value of the hedged item and the value movement of the derivative are recorded in finance costs in the income statement.
76
Financial statementsGovernanceStrategic reportIntroduction
< previous next >
Contents

Financial statementsNotes to the Consolidated Financial Statements continuedFor the year ended 31 December 2015
2. Significant accounting policies continued
Hedges of a net investment
Hedges of a net investment in a foreign operation, including a hedge of a monetary item that is accounted for as part of the net investment, are accounted for in a way similar to cash flow hedges. Gains or losses on the hedging instrument relating to the effective portion of the hedge are recognised directly in equity while any gains or losses relating to the ineffective portion are recognised in income and loss (in finance income or finance costs). On disposal of the foreign operation, the cumulative value of any such gains or losses recognised directly in other comprehensive income is transferred to income or loss.
Provisions Provisions are recognised when the Group has a present obligation (legal or constructive) as a result of a past event and it is probable that an outflow of resources will be required to settle that obligation which can be assessed with reasonable certainty. Where the time value of money is material, provisions are discounted using pre-tax rates. Where discounting is used, the increase in the provision due to the passage of time is recognised within finance costs.
The enrichment process generates depleted uranium (“tails”). Provisions are made for all estimated costs for the eventual disposal of tails and are discounted to reflect the expected timing of expenditure or consumption of other economic benefits in the future, including the depreciation of fixed assets held for the purpose of meeting these liabilities. The costs take account of conversion to a different chemical state, intermediate storage, transport and safe disposal.
The Directors intend to decommission plant and machinery used in the enrichment process as soon as practicably possible after it has shut down. To meet these eventual decommissioning costs, provisions are charged in the income statement for all plant and equipment in operation, at a rate considered to be adequate for the purpose. Once plant and equipment has been commissioned, the full discounted cost of decommissioning is recognised in the accounts as a provision. This is matched by capitalised decommissioning costs which are included in property, plant and equipment, under plant and machinery.
The Group’s other provisions are for restructuring costs and refeeding of low assay feed. Provisions for restructuring costs are recognised when the Group has a detailed formal plan for the restructuring that has been communicated to affected parties. Provisions for refeeding low assay feed represent the cost to the Group of re-enriching low assay feed in the future, back to the assay of natural uranium.
3. RevenueAn analysis of the Group’s revenue is as follows:
Year ended 31/12/15
€m
Year ended 31/12/14
€m
Sales of goods and services 1,842.2 1,612.0
Finance income 89.3 35.5
Total income 1,931.5 1,647.5
In 2015, €57.4 million of net losses (2014: net gains €0.9 million) relating to foreign currency hedging activities has been included in sales revenue (see note 25).
4. Segment informationThe URENCO Group’s principal activity is the provision of a service to enrich uranium to provide fuel for nuclear power utilities, by enriching uranium provided by customers.
Operating segments are reported in a manner consistent with the internal reporting provided to the chief decision makers. The chief decision makers have been identified as the Executive Directors. Operating segments have been identified based on the risk and returns of the Group’s major operations. The risks and returns of the Group’s operations are primarily determined by the nature of the different activities that the Group engages in, rather than by the geographical location of these operations.
The Group’s operating segments are as follows:
• For the enrichment business: the provision of enrichment and associated services for the nuclear power industry and the construction of the Tails Management Facility at the UK site for deconversion of depleted UF6 into U3O8.
• For construction of centrifuges (being ETC): the research, development, manufacture and installation of plant and equipment for the provision of enrichment services.
• Other relates to Head Office and Capenhurst Nuclear Services Limited (CNS) which provides uranium handling services at the Capenhurst facility.
URENCO Annual report and accounts 2015 77
Financial statementsGovernanceStrategic reportIntroduction
< previous next >
Contents

Financial statementsNotes to the Consolidated Financial Statements continuedFor the year ended 31 December 2015
4. Segment information continued
Segment performance is evaluated based on net income which is calculated on the same basis as income from operating activities in the consolidated financial statements. Finance costs and finance income are managed centrally and presented in the segment note accordingly.
Segment information for these businesses, based upon the accounting policies set out in note 2, is presented below:
Year ended 31 December 2015
Enrichment business
€mETC€m
Other (i)
€mConsolidated
€m
Revenue
External sales 1,762.3 - 79.9 1,842.2Total revenue 1,762.3 - 79.9 1,842.2
Result
Income from operating activities 623.7 20.7 20.2 664.6
Finance income - - 89.3 89.3
Finance costs - - (220.8) (220.8)
Income before tax 623.7 20.7 (111.3) 533.1
Income tax (102.6) - 21.6 (81.0)
Net income for the year 521.1 20.7 (89.7) 452.1
Other information
Depreciation and amortisation 506.8 - (10.7) 496.1
EBITDA 1,130.4 - 36.9 1,167.3
Capital additions:
Property, plant and equipment 729.2 - (8.4) 720.8
Investment property - - - -
Intangible assets 0.5 - 1.8 2.3
Segment assets 7,403.8 6.3 542.6 7,952.7
Segment liabilities 3,568.6 - 1,953.8 5,522.4
(i) Other comprises the corporate Head Office, CNS and eliminations.
78
Financial statementsGovernanceStrategic reportIntroduction
< previous next >
Contents

Financial statementsNotes to the Consolidated Financial Statements continuedFor the year ended 31 December 2015
4. Segment information continued
Year ended 31 December 2014
Enrichment business
€mETC(i)
€mOther (ii)
€mConsolidated
€m
Revenue
External sales 1,585.2 - 26.8 1,612.0
Total revenue 1,585.2 - 26.8 1,612.0
Result
Income from operating activities 616.0 3.6 33.3 652.9
Finance income - - 35.5 35.5
Finance costs - - (167.2) (167.2)
Income before tax 616.0 3.6 (98.4) 521.2
Income tax (130.4) - 13.7 (116.7)
Net income for the year 485.6 3.6 (84.7) 404.5
Other information
Depreciation and amortisation 427.9 - (10.0) 417.9
EBITDA 1,043.9 - 26.9 1,070.8
Capital additions:
Property, plant and equipment 517.5 - 1.5 519.0
Investment property - - - -
Intangible assets 3.2 - 2.3 5.5
Segment assets 6,858.0 - 536.4 7,394.4
Segment liabilities 3,268.7 26.3 1,954.3 5,249.3
(i) The share of ETC result and segment liabilities for ETC are not recognised as explained in note 15.(ii) Other comprises the corporate Head Office, CNS and eliminations.
URENCO Annual report and accounts 2015 79
Financial statementsGovernanceStrategic reportIntroduction
< previous next >
Contents

Financial statementsNotes to the Consolidated Financial Statements continuedFor the year ended 31 December 2015
4. Segment information continued
Geographical information The Group’s operations are located in the UK, Germany, the Netherlands and the USA.
The following tables present revenue by location by customer and certain asset information regarding the Group’s geographical segments by location, irrespective of the origin of the goods/services and assets:
Year ended 31 December 2015UK€m
Rest of Europe
€mUS€m
Rest of the world*
€mConsolidated
€m
Total external revenue 71.5 663.1 943.4 164.2 1,842.2
Location of non-current assets
Property, plant and equipment 1,434.0 1,269.2 3,447.3 - 6,150.5
Investment property 5.8 1.7 - - 7.5
Intangible assets 7.7 16.0 28.8 - 52.5
* predominantly Asia
Year ended 31 December 2014UK€m
Rest of Europe
€mUS€m
Rest of the world*
€mConsolidated
€m
Total external revenue 37.0 665.3 728.9 180.8 1,612.0
Location of non-current assets
Property, plant and equipment 1,123.8 1,369.4 2,990.7 - 5,483.9
Investment property 5.8 - - - 5.8
Intangible assets 12.0 22.0 30.4 - 64.4
* predominantly Asia
5. Income from operating activitiesIncome from operating activities before tax and net finance costs has been arrived at after charging:
Year ended 31/12/15
€m
Year ended 31/12/14
€m
Depreciation of property, plant and equipment (note 12) 476.7 396.3
Depreciation of investment property (note 13) 0.3 0.3
Amortisation of intangible assets (note 14) 19.1 21.3
496.1 417.9
Employee benefits expense (note 6) 202.3 168.5
Operating, general and administrative costs 332.8 238.9
Minimum lease payments under operating leases recognised in income for the year 3.8 4.3
Research and development costs 31.4 15.0
Foreign exchange gains(i) (112.0) (80.5)
Foreign exchange losses(i) 67.9 57.8Other Expenses 323.9 235.5
(i) Derivatives not qualifying as effective hedges are reported in finance income and cost (see notes 7 and 8).
80
Financial statementsGovernanceStrategic reportIntroduction
< previous next >
Contents

Financial statementsNotes to the Consolidated Financial Statements continuedFor the year ended 31 December 2015
5. Income from operating activities continuedAn analysis of auditor’s remuneration throughout the Group is provided below:
Year ended 31/12/15
€m
Year ended 31/12/14
€m
Audit of Company 0.2 0.2
Audit of subsidiaries 0.5 0.5
Total audit fees 0.7 0.7
Audit related assurance services 0.3 0.1
Total assurance services 1.0 0.8
Services related to taxation - -
Total other non-audit services - 0.1
Total non-audit services - 0.1
Total fees 1.0 0.9
Details of the Company’s policy on the use of auditors for non-audit services and how the auditor’s independence and objectivity was safeguarded are set out in the Audit Committee Report on page 46.
6. Employee benefits expenseThe average monthly number of Group employees (including Executive Directors) was:
Year ended 31/12/15 Number
Year ended 31/12/14Number
Technical 1,184 1,217
Commercial 36 38
Administration 298 270
1,518 1,525
Their aggregate remuneration comprised:Year ended
31/12/15 €m
Year ended 31/12/14
€m
Wages and salaries 162.1 133.5
Social security costs 14.4 13.4
Pension costs 25.8 21.6
202.3 168.5
Directors’ emoluments (see page 50):Year ended
31/12/15 €m
Year ended 31/12/14
€m
Emoluments 4.1 2.1
Amounts receivable under long-term incentive scheme 0.7 -
Company contributions paid to a defined benefit pension scheme 0.2 0.2
Company contributions paid to a defined contribution pension scheme 0.1 -
Company contributions to be paid for past service costs 2.8 -
Number Number
Members of defined benefit pension schemes 1 1
Members of defined contribution schemes 1 -
URENCO Annual report and accounts 2015 81
Financial statementsGovernanceStrategic reportIntroduction
< previous next >
Contents

Financial statementsNotes to the Consolidated Financial Statements continuedFor the year ended 31 December 2015
6. Employee benefits expense continuedIn respect of the highest paid Director:
Year ended 31/12/15
€m
Year ended 31/12/14
€m
Emoluments including pension 5.9 0.9
Accrued pension at the end of the year 0.2 0.2
7. Finance incomeYear ended
31/12/15 €m
Year ended 31/12/14
€m
Interest on bank and other deposits 0.6 1.0
Income from non designated derivatives 33.4 7.4
Interest rate / cross currency interest rate swaps 55.3 27.1
89.3 35.5
8. Finance costsYear ended
31/12/15 €m
Year ended 31/12/14
€m
Interest on bank borrowings and other loans 122.6 119.4
Capitalised interest cost (41.5) (35.0)
Interest rate / cross currency interest rate swaps 77.1 17.4
Unwinding of discount on provisions 45.6 29.8
Net interest expense on defined benefit pension schemes 3.6 2.5
Surety bond 3.0 2.4
Charge to the income statement from non designated derivatives 10.4 30.7
220.8 167.2
82
Financial statementsGovernanceStrategic reportIntroduction
< previous next >
Contents

Financial statementsNotes to the Consolidated Financial Statements continuedFor the year ended 31 December 2015
9. Income taxThe major components of income tax expense for the years ended 31 December 2015 and 2014 are:
Consolidated income statement
Year ended 31/12/15
€m
Year ended 31/12/14
€m
Current income tax
UK corporation tax (1.6) 23.3
Foreign income tax 99.9 99.7
Adjustments in respect of prior periods 7.8 (0.2)
Total current tax 106.1 122.8
Deferred income tax (see deferred income tax analysis below)
Origination and reversal of temporary differences (9.7) (16.1)
Adjustments in respect of prior periods (14.5) 4.1
Write-off of expired tax losses(i) 5.0 -
Movement in unrecognised deferred tax(i) (4.6) 5.9
Impact of change in tax rate for deferred tax (1.3) -
Total deferred tax (25.1) (6.1)
Income tax expense reported in the consolidated income statement 81.0 116.7
(i) New Mexico state tax losses with a tax value of €5.0 million have expired during the year and have been written off. A full valuation allowance was held against these tax losses and has therefore been released resulting in €nil impact on the 2015 income tax expense. An additional €0.4 million valuation allowance has been provided during the year which has increased the 2015 income tax expense.
Income tax related to items charged or credited directly to other comprehensive income
Year ended 31/12/15
€m
Year ended 31/12/14
€m
Current tax
Arising on financial instruments reported in equity (3.3) 0.2
Arising on actuarial (losses)/gains on defined benefit pension schemes - (0.2)
Total current tax (3.3) -
Deferred tax
Arising on financial instruments reported in equity (7.1) (23.7)
Arising on actuarial (losses)/gains on defined benefit pension schemes 10.3 (10.3)
Arising on utility partner payments (0.1) -
Total deferred tax 3.1 (34.0)Income tax (income) / expense reported in the consolidated statement of comprehensive income (0.2) (34.0)
The charge for the year can be reconciled to the expense in the consolidated income statement as follows:
€m
Year ended 31/12/15
% €m
Year ended 31/12/14
%
Income before tax 533.1 521.2Weighted at the average UK statutory income tax rate of 20.25% (2014: 21.5%) 107.9 20.3 112.1 21.5
Adjustments in respect of income tax of previous years (6.7) (1.3) 3.8 0.7
Tax effect of non-deductible / non-taxable items (59.5) (11.2) (30.5) (5.8)
Movement in unrecognised deferred tax (4.6) (0.9) 5.9 1.1
Effect of different foreign tax rates 45.2 8.5 25.4 4.9
Effect of rate changes on deferred tax (1.3) (0.2) - -
Income tax expense reported in consolidated income statement 81.0 15.2 116.7 22.4
URENCO Annual report and accounts 2015 83
Financial statementsGovernanceStrategic reportIntroduction
< previous next >
Contents

Financial statementsNotes to the Consolidated Financial Statements continuedFor the year ended 31 December 2015
9. Income tax continuedReductions in the UK mainstream corporation tax rate from 23% to 21% (effective from 1 April 2014) and 20% (effective from 1 April 2015) were enacted during 2013. Further reductions to 19% (effective from 1 April 2017) and to 18% (effective from 1 April 2020) were substantively enacted on 26 October 2015. Consequently, the average annual UK corporation tax rate for the year ended 31 December 2015 is 20.25% (2014: 21.50%).
The Group’s UK deferred tax assets and liabilities have been revalued using an 18% tax rate, resulting in a net deferred tax income of €1.3 million being credited to the income statement, and a net deferred tax income of €0.2 million being credited to other comprehensive income.
Deferred income taxDeferred income tax recognised at 31 December relates to the following:
Consolidated statement of financial position
Consolidated income statement
31/12/15€m
31/12/14 €m
Year ended31/12/15
€m
Year ended 31/12/14
€m
Deferred tax (liabilities)/assets
Relating to fair value movements on financial instruments (14.1) - (0.5) 1.4
Relating to fixed assets (111.5) (57.3) (52.6) 55.2Relating to other temporary differences 12.6 (2.8) 15.4 8.3
Relating to prior years - - (4.1) -
Relating to provisions 43.8 5.4 40.4 (28.1)
Relating to retirement benefits 11.0 6.8 14.9 (8.8)
Effect of rate changes on deferred tax - - 1.0 -
Total deferred tax liabilities (58.2) (47.9)
Deferred tax assets/(liabilities)
Relating to amounts allowed when paid 61.6 25.5 33.7 24.4
Relating to fair value movements on financial instruments 17.7 2.1 (5.0) 2.1
Relating to fixed assets (388.1) (332.0) (20.8) (132.1)
Relating to other temporary differences (8.2) 22.6 (20.9) (5.7)
Relating to prior year - - 18.6 (4.1)
Relating to provisions 84.2 94.9 (12.7) 45.7
Relating to retirement benefits 4.1 18.4 (14.4) 9.4
Relating to start up costs 84.9 84.3 (7.4) (6.1)
Relating to tax losses 463.6 353.5 34.6 50.4
Effect of rate changes on deferred tax - - 0.3 -
Valuation allowance (18.8) (21.0) 4.6 (5.9)
Total deferred tax assets 301.0 248.3
Deferred tax income 25.1 6.1
84
Financial statementsGovernanceStrategic reportIntroduction
< previous next >
Contents

Financial statementsNotes to the Consolidated Financial Statements continuedFor the year ended 31 December 2015
9. Income tax continuedThe recognition of the deferred tax assets set out above is based on the expectations of suitable taxable profits in the future. In the case of the Group’s US enrichment operations, net deferred tax assets of €200.4 million (2014: €167.8 million), relating predominately to unused tax losses and start up costs, have been recognised based on the expectations of future taxable profits in the period 2016 to 2025. At 31 December 2015 unused tax losses with a tax value of €18.8 million (2014: €21.0 million) have not been recognised. To the extent unutilised, €8.8 million will expire in 2016 and the remaining €10.0 million will expire in 2017.
There are no income tax consequences for the URENCO Group attaching to the payment of dividends by URENCO Limited to its shareholders.
URENCO assesses its liabilities and contingencies for all tax years open to audit based upon the latest information available. For those matters where it is probable that an adjustment will be made, the Group records its best estimate of these tax liabilities. Inherent uncertainties exist in estimates of tax contingencies due to the complexities of interpretation and changes in tax laws. Whilst URENCO believes it has adequately provided for the outcome of these matters, future results may include favourable or unfavourable adjustments to these estimated tax liabilities in the period the assessments are made, or resolved. The final outcome of tax examinations may result in a materially different outcome than assumed in the tax liabilities.
10. Dividends paid and proposedYear ended
31/12/15 €m
Year ended 31/12/14
€m
Declared and paid during the year
Amounts recognised as distributions to equity holders in the period:Final dividend for the year ended 31 December 2014 of 202.38 cents per share (2013: 202.38 cents per share) 340.0 340.0
340.0 340.0
Proposed for approval at the Annual General MeetingProposed final dividend for the year ended 31 December 2015 of 208.33 cents per share (2014: 202.38 cents per share) 350.0 340.0
The expected final dividend is subject to approval by shareholders at the Annual General Meeting and has not been included as a liability in these financial statements.
11. Earnings per share Earnings per share amounts are calculated by dividing net income attributable to equity holders of the parent by the weighted average number of ordinary shares outstanding during the year.
The calculation of the basic earnings per share is based on the following data: Year ended
31/12/15Year ended
31/12/14
In millions of euros Earnings for the purposes of basic earnings per share being net income attributable to equity holders of the parent 452.1 404.5In millions of sharesWeighted average number of ordinary shares for the purposes of basic earnings per share 168.0 168.0In eurosBasic earnings per share 2.7 2.4
There has been no movement in the number of issued ordinary shares during the year (see note 22).
No information for diluted EPS is included as there are no potentially dilutive shares (of any class or category) in issue and hence no dilutive impact.
URENCO Annual report and accounts 2015 85
Financial statementsGovernanceStrategic reportIntroduction
< previous next >
Contents

Financial statementsNotes to the Consolidated Financial Statements continuedFor the year ended 31 December 2015
12. Property, plant and equipment
2015
Freehold land and buildings
€m
Plant and machinery
€m
Fixtures and fittings
€m
Motor vehicles
€m
Assets under construction
€mTotal
€m
Cost as at 1 January 2015 1,773.6 6,025.6 115.7 18.2 971.6 8,904.7
Additions 40.3 222.9 15.2 0.1 442.3 720.8
Transfers (see notes 13 and 14) 127.7 189.6 9.8 0.2 (308.2) 19.1Disposals (0.8) (1.4) - - - (2.2)
Written off (1.5) - (1.8) - - (3.3)
Exchange adjustments 152.6 308.7 3.7 0.2 56.2 521.4
Cost as at 31 December 2015 2,091.9 6,745.4 142.6 18.7 1,161.9 10,160.5
Depreciation as at 1 January 2015 342.5 2,990.2 75.8 12.3 - 3,420.8
Charge for the year 62.8 395.4 16.1 2.4 - 476.7
Disposals (0.2) (0.8) - - - (1.0)
Written off (1.4) - (1.8) - - (3.2)
Transfers (see note 13) (0.7) - - - - (0.7)
Exchange adjustments 15.7 98.8 2.8 0.1 - 117.4
Depreciation as at 31 December 2015 418.7 3,483.6 92.9 14.8 - 4,010.0Carrying amount as at 1 Jan 2015 1,431.1 3,035.4 39.9 5.9 971.6 5,483.9
Carrying amount as at 31 December 2015 1,673.2 3,261.8 49.7 3.9 1,161.9 6,150.5
All land, buildings and other tangible fixed assets are carried at historical cost less accumulated depreciation.
The category of fixtures and fittings comprises office fixtures and fittings and computer equipment.
Fixtures and fittings held under finance leases had a net book value at 31 December 2015 of €nil million (2014: €0.1 million).
The transfers in 2015 relate to a reclassification from property, plant and equipment to other software assets and licence costs and investment property with net book value of €0.9 million and €1.7 million respectively.
At 31 December 2015, the Group had entered into contractual commitments for the acquisition of property, plant and equipment amounting to €110.7 million (2014: €228.8 million) principally in relation to cascades, equipment and buildings.
Included in plant and machinery are the following amounts relating to capitalised decommissioning costs: 2015
€m2014
€m
Cost at 31 December 307.6 261.2
Depreciation at 31 December (173.1) (146.7)
Carrying amount at 31 December 134.5 114.5
Included in property, plant and equipment are the following amounts relating to capitalised interest costs:2015
€m2014
€m
Cost at 31 December 314.5 272.6
Depreciation at 31 December (68.6) (51.0)
Carrying amount at 31 December 245.9 221.6
86
Financial statementsGovernanceStrategic reportIntroduction
< previous next >
Contents

Financial statementsNotes to the Consolidated Financial Statements continuedFor the year ended 31 December 2015
12. Property, plant and equipment continued
2014
Freehold land and buildings
€m
Plant and machinery
€m
Fixtures and fittings
€mMotor vehicles
€m
Assets under construction
€mTotal
€m
Cost as at 1 January 2014 1,518.5 5,550.2 99.1 13.3 655.3 7,836.4
Additions 33.6 71.8 11.7 1.2 400.7 519.0
Transfers (see note 14) 66.8 78.3 1.5 3.7 (150.8) (0.5)Disposals - (0.1) (0.5) (0.4) - (1.0)
Written off (0.5) (0.5) - - - (1.0)
Exchange adjustments 155.2 325.9 3.9 0.4 66.4 551.8
Cost as at 31 December 2014 1,773.6 6,025.6 115.7 18.2 971.6 8,904.7
Depreciation as at 1 January 2014 278.0 2,554.7 60.7 10.1 - 2,903.5
Charge for the year 49.6 331.5 12.9 2.3 - 396.3
Disposals - - (0.5) (0.4) - (0.9)
Written off (0.1) (0.1) - - - (0.2)
Exchange adjustments 15.0 104.1 2.7 0.3 - 122.1
Depreciation as at 31 December 2014 342.5 2,990.2 75.8 12.3 - 3,420.8
Carrying amount as at 1 Jan 2014 1,240.5 2,995.5 38.4 3.2 655.3 4,932.9
Carrying amount as at 31 December 2014 1,431.1 3,035.4 39.9 5.9 971.6 5,483.9
13. Investment property
2015Total
€m
Cost as at 1 January 2015 6.1
Transfers (see note 12) 2.4
Exchange adjustments 0.3
Cost as at 31 December 2015 8.8
Depreciation as at 1 January 2015 0.3
Charge for the year 0.3
Transfers (see note 12) 0.7
Depreciation as at 31 December 2015 1.3
Carrying amount as at 1 January 2015 5.8
Carrying amount as at 31 December 2015 7.5
Investment property includes land and buildings acquired by URENCO UK Limited in December 2013 and land and buildings owned by URENCO Nederland B.V. transferred from Property, Plant and Equipment during the year.
No formal valuation was conducted on the investment properties during 2015. The fair value of the investment properties has been assessed by the Directors using a discounted cashflow valuation method to identify any material changes to the formal valuations conducted previously. The fair value as at 31 December 2015 under this method was €7.8 million (31 December 2014: €7.8 million).
The rental income earned by the Group from its investment property, all of which is leased out under operating leases, amounted to €1.0 million (2014: €1.0 million). Associated direct operating expenses amounted to €0.8 million (2014: €0.2 million).
URENCO Annual report and accounts 2015 87
Financial statementsGovernanceStrategic reportIntroduction
< previous next >
Contents

Financial statementsNotes to the Consolidated Financial Statements continuedFor the year ended 31 December 2015
13. Investment property continued
2014Total
€m
Cost as at 1 January 2014 5.8
Exchange adjustments 0.3
Cost as at 31 December 2014 6.1
Depreciation as at 1 January 2014 -
Charge for the year 0.3
Exchange adjustments -
Depreciation as at 31 December 2014 0.3
Carrying amount as at 1 January 2014 5.8
Carrying amount as at 31 December 2014 5.8
14. Intangible assets
2015
Licencecosts
€m
Other software
assets€m
Waiverpayments
€mTotal
€m
Cost as at 1 January 2015 64.3 84.0 7.1 155.4
Additions 0.2 2.1 - 2.3
Transfers (see note 12) 0.6 0.3 - 0.9
Exchange adjustments 3.6 4.8 0.5 8.9
Cost as at 31 December 2015 68.7 91.2 7.6 167.5
Amortisation as at 1 January 2015 18.1 67.7 5.2 91.0
Charge for the year 4.1 14.1 0.9 19.1
Exchange adjustments 0.7 4.0 0.2 4.9
Amortisation as at 31 December 2015 22.9 85.8 6.3 115.0
Carrying amount as at 1 January 2015 46.2 16.3 1.9 64.4
Carrying amount as at 31 December 2015 45.8 5.4 1.3 52.5
The licence costs mainly relate to the costs of obtaining a licence in the USA. This licence was granted to LES in 2006 for a 30 year term. The costs are amortised on a straight-line basis over the remaining licence period from the date of the commencement of production in the USA. The USA enrichment plant commenced commercial operations in June 2010 having received the necessary approvals from the US Nuclear Regulatory Commission. The transfers in 2014 and 2013 relate to a reclassification from property, plant and equipment to other software assets and licence costs.
Software and development costs associated with the Group’s implementation of its ERP system (SAP 6.0) have been capitalised. Amortisation of capitalised project costs takes place on a straight-line basis, with no residual value. The initial costs have been amortised based on a useful economic life of five years. Costs which have been capitalised subsequently are amortised based on a useful economic life of three to four years.
From 2012 a waiver payment was recognised during the year as an intangible asset. This waiver payment represents the right for URENCO UK Limited to continue to use certain plant and equipment at the Capenhurst site without future royalty payments to be made. The consideration for this waiver payment will be settled by contracted storage services to be provided in future years by CNS. This consideration is included in deferred income.
Included in Intangible assets are the following amounts relating to capitalised interest costs: 2015
€m2014
€m
Cost at 31 December 1.2 1.1
Depreciation at 31 December (1.1) (0.8)
Carrying amount at 31 December 0.1 0.3
88
Financial statementsGovernanceStrategic reportIntroduction
< previous next >
Contents

Financial statementsNotes to the Consolidated Financial Statements continuedFor the year ended 31 December 2015
14. Intangible assets continued
2014
Licencecosts
€m
Other software
assets€m
Waiverpayments
€mTotal
€m
Cost as at 1 January 2014 57.6 75.8 6.6 140.0
Additions 3.0 2.5 - 5.5
Transfers (see note 12) - 0.5 - 0.5
Exchange adjustments 3.7 5.2 0.5 9.4
Cost as at 31 December 2014 64.3 84.0 7.1 155.4
Amortisation as at 1 January 2014 14.3 49.0 1.5 64.8
Charge for the year 3.2 14.6 3.5 21.3
Exchange adjustments 0.6 4.1 0.2 4.9
Amortisation as at 31 December 2014 18.1 67.7 5.2 91.0
Carrying amount as at 1 January 2014 43.3 26.8 5.1 75.2
Carrying amount as at 31 December 2014 46.2 16.3 1.9 64.4
15. Investments
Investments in joint venture The Group has a 50% interest in Enrichment Technology Company Limited (ETC), a joint arrangement whose principal activity is in the research, development, manufacture and installation of plant and equipment for the provision of enrichment services. The Group’s 50% share is held for 21.7% by URENCO Limited and for 28.3% by URENCO Deutschland GmbH. The Group accounts for its interest in ETC using the equity accounting method (see note 2).
The share of the assets, liabilities and expenses of the joint arrangement at 31 December were: 2015
€m2014
€m
Share of the joint venture balance sheet
Non-current assets 23.5 21.1
Current assets 32.6 140.2
Share of gross assets 56.1 161.3
Non-current liabilities (27.1) (27.0)
Current liabilities (22.7) (160.6)
Share of gross liabilities (49.8) (187.6)
6.3 (26.3)
Unrecognised share of net liabilities of joint venture - 26.3
Group’s share of net assets 6.3 -
For the year to 31/12/15
€m
For the year to31/12/14
€m
Share of joint venture results
Total revenue 208.9 346.6
Group’s share of profit for the year 20.7 3.6
Group’s share of profit for the year not recognised (16.8) (3.6)
Consolidation adjustments (10.5) -
Share of results of joint venture (6.6) -
In 2012 the Group reduced the carrying value of its investment in ETC to nil, which was driven by an impairment loss on ETC’s manufacturing assets. This impairment loss predominantly reflected lower estimated future net cash inflows reflecting the planned downsizing of ETC’s operations and workforce.
URENCO Annual report and accounts 2015 89
Financial statementsGovernanceStrategic reportIntroduction
< previous next >
Contents

Financial statementsNotes to the Consolidated Financial Statements continuedFor the year ended 31 December 2015
15. Investments continuedFrom 2012 the Group has recorded the investment in ETC at nil reflecting that ETC had negative equity and the Group does not recognise its share of the net liabilities of the joint venture once the value of the investment has reduced to nil. Last year the Group did not recognise its share of net liabilities of the joint venture of €26.3 million. At 31 December 2015 the Group recognised its share of the net assets of the joint venture, because ETC had returned to a positive equity position.
2015€m
2014€m
Unrecognised share of net liabilities of joint venture
As at 1 January (26.3) (14.7)
Group’s share of profit for the year not recognised - 3.6
Group’s share of other comprehensive income not recognised - (15.2)
Reversal of previously unrecognised Group’s share of profit 16.8 -
Reversal of previously unrecognised Group’s share of other comprehensive income 9.5 -
As at 31 December - (26.3)
On consolidation, the Group makes the necessary adjustments to the joint venture results to ensure that income from direct transactions with the joint venture is not recognised.
Other investments€m
Cost as at 1 January 2015 0.7
Additions 0.2
Cost as at 31 December 2015 0.9
Carrying value as at 1 January 2015 0.7
Carrying value as at 31 December 2015 0.9
The Group invested in a 10% share in Twente Technology Fund (TTF). TTF is an innovative venture capital fund. The fund invests in promising young start-up high tech corporations in the Twente area in the Netherlands. URENCO has invested €0.9 million in the fund.
16. Subsidiaries A list of the Company’s investments in subsidiaries, including the name, country of incorporation and proportion of ownership interest is given in note 7 to the Company’s separate financial statements.
17. Financial assets31/12/15
€m31/12/14
€m
Restricted cash 9.1 9.0
Restricted cash primarily represents two items:
• An amount which is held in an Escrow account for an agreement for relocation of a pipeline dated August 2006. The Escrow agreement terminates on the earlier of the 50th anniversary of the agreement or receipt by the Escrow Agent of written notice of termination executed by Trinity Pipeline, L.P. and LES.
• A money market account. The money market account is an account for the purpose of an employee contractual commitment.
18. Inventories31/12/15
€m31/12/14
€m
Raw materials 74.5 39.7
Work-in-progress 430.7 433.1
Finished goods 2.5 2.4
507.7 475.2
Work-in-progress comprises costs associated with the delivery of enrichment contracts where the SWU element of enriched uranium has not been allocated to the customer.
90
Financial statementsGovernanceStrategic reportIntroduction
< previous next >
Contents
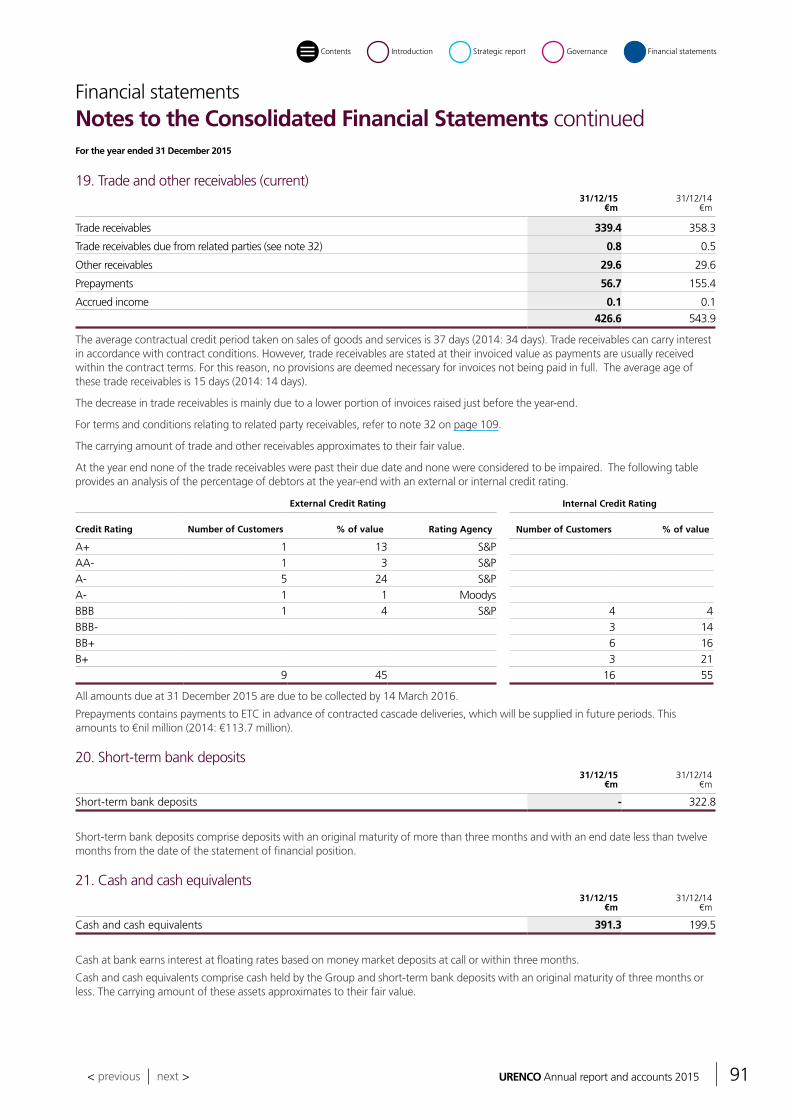
Financial statementsNotes to the Consolidated Financial Statements continuedFor the year ended 31 December 2015
19. Trade and other receivables (current) 31/12/15
€m31/12/14
€m
Trade receivables 339.4 358.3
Trade receivables due from related parties (see note 32) 0.8 0.5
Other receivables 29.6 29.6
Prepayments 56.7 155.4
Accrued income 0.1 0.1
426.6 543.9
The average contractual credit period taken on sales of goods and services is 37 days (2014: 34 days). Trade receivables can carry interest in accordance with contract conditions. However, trade receivables are stated at their invoiced value as payments are usually received within the contract terms. For this reason, no provisions are deemed necessary for invoices not being paid in full. The average age of these trade receivables is 15 days (2014: 14 days).
The decrease in trade receivables is mainly due to a lower portion of invoices raised just before the year-end.
For terms and conditions relating to related party receivables, refer to note 32 on page 109.
The carrying amount of trade and other receivables approximates to their fair value.
At the year end none of the trade receivables were past their due date and none were considered to be impaired. The following table provides an analysis of the percentage of debtors at the year-end with an external or internal credit rating.
External Credit Rating
Credit Rating Number of Customers % of value Rating Agency
A+ 1 13 S&PAA- 1 3 S&PA- 5 24 S&PA- 1 1 MoodysBBB 1 4 S&PBBB-BB+B+
9 45
All amounts due at 31 December 2015 are due to be collected by 14 March 2016.
Prepayments contains payments to ETC in advance of contracted cascade deliveries, which will be supplied in future periods. This amounts to €nil million (2014: €113.7 million).
20. Short-term bank deposits31/12/15
€m31/12/14
€m
Short-term bank deposits - 322.8
Short-term bank deposits comprise deposits with an original maturity of more than three months and with an end date less than twelve months from the date of the statement of financial position.
21. Cash and cash equivalents31/12/15
€m31/12/14
€m
Cash and cash equivalents 391.3 199.5
Cash at bank earns interest at floating rates based on money market deposits at call or within three months.
Cash and cash equivalents comprise cash held by the Group and short-term bank deposits with an original maturity of three months or less. The carrying amount of these assets approximates to their fair value.
Internal Credit Rating
Number of Customers % of value
4 43 146 163 21
16 55
URENCO Annual report and accounts 2015 91
Financial statementsGovernanceStrategic reportIntroduction
< previous next >
Contents

Financial statementsNotes to the Consolidated Financial Statements continuedFor the year ended 31 December 2015
22. Share capital and reserves31/12/15
€m31/12/14
€m
Authorised:
240 million ordinary shares of £1 each
‘A’ ordinary 113.0 113.0
‘B’ ordinary 113.0 113.0
‘C’ ordinary 113.0 113.0
339.0 339.0
Issued and fully paid:
168 million ordinary shares of £1 each
‘A’ ordinary 79.1 79.1
‘B’ ordinary 79.1 79.1
‘C’ ordinary 79.1 79.1
237.3 237.3
The ‘A’, ‘B’ and ‘C’ ordinary shares have identical rights.
The reserves outlined in the consolidated statement of changes in equity on page 66 are as follows:
Hedging reserve
The hedging reserve is a separate component of equity used to record changes in the fair values of cash flow hedging instruments and net investment hedging instruments in accordance with the Group’s accounting policy.
Foreign currency translation reserve
The foreign currency translation reserve is used to record exchange differences arising from the translation of the financial statements of certain foreign subsidiaries and the parent entity.
23. Deferred incomeDeferred income relates to payments received in advance for contracted enrichment or storage services, which will be supplied in future periods.
2015€m
2014€m
As at 1 January 49.6 39.4
Movement during the year (7.3) 7.9
Exchange difference 1.9 2.3
As at 31 December 44.2 49.6
Included in current liabilities 1.8 8.7
Included in non-current liabilities 42.4 40.9
44.2 49.6
The movement during the year was mainly due to the deliveries made under a contract which had been prepaid by the customer at the end of 2014. No such prepayments existed at the end of 2015. The balance at year-end substantially relates to deferred income for contracted storage services to be provided by CNS in future years for which the consideration was received in advance, predominantly in the form of land and a waiver of royalty payments. This deferred income was initially determined as the present value of estimated future storage fees for a fixed volume of uranic material. Revenue recognition takes place during the years these storage services will be provided. The unwinding of the discount on the deferred income is recorded as finance costs.
92
Financial statementsGovernanceStrategic reportIntroduction
< previous next >
Contents

Financial statementsNotes to the Consolidated Financial Statements continuedFor the year ended 31 December 2015
24. Financial risk management objectives and policies The Group’s principal financial liabilities consist of trade payables and other financial instruments including bank loans, private and publicly traded debt and financial derivatives. The main purpose of these financial instruments is to raise finance for the Group’s operations. The Group also has various financial assets such as trade receivables and cash and short-term deposits, which arise directly from its operations or debt issues. All financial instruments, including derivatives, are unsecured. No collateral is pledged or received in respect of the Group’s financial instruments.
The Group’s derivative transactions are principally forward currency contracts, interest rate swaps and cross-currency swaps. The purpose of these transactions is to manage the interest rate and currency risks arising from the Group’s operations and its sources of finance.
It is the Group’s policy that no speculative trading in financial instruments shall be undertaken.
The Group is exposed to credit risk, interest rate risk, foreign currency risk and liquidity risk. The Board reviews and agrees policies for managing each of these risks and they are summarised below. The Group’s accounting policies in relation to derivatives are set out in note 2.
Credit riskThe Group’s principal financial assets are cash and cash equivalents, short-term bank deposits, trade and other receivables and derivative financial instruments, which represent the Group’s maximum exposure totalling €860.4 million (2014: €951.6 million).
The Group trades only with creditworthy third parties, who are mainly other participants in the nuclear fuel supply chain. It is the Group’s policy that all customers wishing to trade on credit are subject to an internal approval process based on a system of credit scoring similar to that used by external rating agencies. Customers are assigned credit limits based on this credit score and their credit balances are monitored and managed against these limits on a monthly basis. Historically, there has been no payment default by any counterparty trading with the Group under this procedure.
With respect to credit risk arising from other financial assets of the Group, comprising cash and cash equivalents, short-term deposits, and certain financial derivative instruments, the Group’s credit risk is the risk of default of the counterparty, with a maximum exposure equal to the carrying amount of these instruments. Counterparties for these assets are banks with investment-grade credit ratings assigned by international credit-rating agencies and limits are set depending on the credit rating of the counterparty.
The Group has not pledged and does not hold collateral over any balances.
Interest rate risk Some of the Group’s borrowings are exposed to the risk of changes in market interest rates, which relates primarily to the Group’s long-term debt obligations with floating interest rates.
In order to manage its interest costs, the Group’s policy is to maintain a proportion of its borrowings at fixed rates of interest. Given the current low level of interest rates the Group has issued medium term fixed rate bonds, the Board having approved the Group to exceed the previous 60% fixed rate limit. The Group has entered into interest rate swaps, in which the Group agrees to exchange, at specified intervals, the difference between the fixed and variable rate interest amounts calculated by reference to an agreed notional principal amount. These swaps are designated to hedge the underlying debt obligations. At 31 December 2015, after taking into account the effect of fixed rate interest rate swaps, 94% (2014: 84%) of the Group’s borrowings are at a fixed rate of interest.
Interest rate sensitivity analysis In respect of non-derivative financial instruments with fixed interest rates, changes in market interest rates will only affect income if these are measured at their fair value. As such, all financial instruments with fixed interest rates that are carried at amortised cost are not subject to interest rate risk as defined in IFRS 7.
Changes in market interest rates affect the interest income or expense of non-derivative variable-interest financial instruments, the interest payments of which are not designated as hedged items of cash flow hedges against interest rate risks. As a consequence, they are included in the calculation of income-related sensitivities.
In the case of fair value hedges designated for hedging interest rate risks, the changes in the fair values of the hedged item and the hedging instrument attributable to interest rate movements balance out almost completely in the income statement in the same period. As a consequence, these financial instruments are also not exposed to interest rate risk.
The following demonstrates the sensitivity to a reasonably possible change in interest rates, with all other variables held constant, of the Group’s income before tax (through the impact on floating rate borrowings).
If market interest rates had been 100 basis points higher/(lower) at 31 December 2015, income before tax would have been €2.0 million lower/(higher) (31 December 2014: €5.1 million lower/(higher).
URENCO Annual report and accounts 2015 93
Financial statementsGovernanceStrategic reportIntroduction
< previous next >
Contents

Financial statementsNotes to the Consolidated Financial Statements continuedFor the year ended 31 December 2015
24. Financial risk management objectives and policies continued
Foreign currency risk Currency risk as defined by IFRS 7 is the risk that the fair value or future cash flows of a financial instrument will fluctuate because of changes in foreign exchange rates.
The Group has transactional currency exposures as a result of approximately 62% (2014: 53%) of its revenues being denominated in US dollars, whilst currently only approximately 32% (2014: 32%) of its costs are US dollar-based.
The Group also has transactional currency exposures as a result of approximately 29% (2014: 23%) of Group costs being denominated in sterling, whilst revenue is mainly in euro and US dollar.
In order to mitigate these exposures, the Group’s policy is to hedge its net contracted US dollar and sterling exposures in its UK and rest of European businesses (i.e. cash revenues less cash costs) using forward currency contracts and related derivative financial instruments. The Group’s policy is to hedge forward its net contracted US dollar and sterling exposures to a minimum of 90% in year one, 80% in year two, 60% in year three, 40% in year four and a minimum of 20% in year five.
Foreign currency sensitivity analysis The following sensitivity analysis addresses the effect of currency risks on the Group’s financial instruments:
• A number of Group loans which are denominated in US dollars and euro are designated as, and are effective hedges, of the Group’s investments in US dollars and euro denominated assets. Any gains/losses arising on the retranslation of these US dollar or euro loans are recorded directly to other comprehensive income and would be offset in equity by a corresponding loss/gain arising on the retranslation of the related hedged foreign currency net asset.
• The Group is exposed to currency risks from currency forward contracts, the majority of which are against the US dollar. These are currency derivatives that are part of an effective cash flow hedge for currency fluctuations resulting from exchange rate movements in accordance with IAS 39. Exchange rate fluctuations of the currencies on which these transactions are based affect the hedging reserve in shareholders’ equity and the fair value of these hedging transactions. Any ineffectiveness or ineffective hedges affect the income statement.
The following table demonstrates the sensitivity to changes in sterling and euro against the US dollar:
Change in £ / US$
rate
Effect on income
before tax€m
Effect onequity
€m
Change in€ / US$
rate
Effect onincome
before tax €m
Effect onequity
€m
2015 +10% 6.5 65.8 +10% 4.1 128.2
-10% (8.0) (80.4) -10% (5.0) (156.7)
2014 +10% 20.6 37.6 +10% 55.2 105.7
-10% (25.1) (46.0) -10% (67.5) (129.1)
Liquidity risk The Group plans its funding operations and monitors the risk of a shortage of funds on a monthly basis, using a forward planning model that considers the maturity of existing borrowings, projected capital expenditure and projected cash flows from operations.
The Group has €925 million (2014: €750 million) undrawn committed bank facilities. The Group manages liquidity risk by a combination of undrawn credit facilities and by refinancing debt in advance of the maturity date.
The Group seeks to achieve flexibility and continuity of funding through the active use of a range of different instruments, markets and currencies. External debt funding is sought over a range of different tenors in order to avoid a concentration of maturities. At 31 December 2015, 7% (2014: 15%) of the Group’s interest bearing loans and borrowings will mature in less than one year.
94
Financial statementsGovernanceStrategic reportIntroduction
< previous next >
Contents

Financial statementsNotes to the Consolidated Financial Statements continuedFor the year ended 31 December 2015
24. Financial risk management objectives and policies continuedThe table below summarises the maturity profile of the Group’s financial liabilities at 31 December based on contractual undiscounted payments:
2015
Less than 3 months
€m
3-12months
€m
1-5years
€m>5 years
€mTotal
€m
Interest bearing loans and borrowings 36.4 286.0 1,130.9 2,216.2 3,669.5
Trade and other payables 278.2 - 140.4 - 418.6
Interest rate/cross currency swaps – net payment/(receipt) 4.5 28.6 106.4 238.9 378.4
Foreign exchange contracts 14.1 49.9 110.3 3.1 177.4
Other financial liabilities - 5.6 54.4 100.7 160.7
333.2 370.1 1,542.4 2,558.9 4,804.6
2014
Less than 3 months
€m
3-12months
€m
1-5years
€m>5 years
€mTotal
€m
Interest bearing loans and borrowings 35.0 563.9 1,410.8 1,719.4 3,729.1
Trade and other payables 291.8 - 132.0 - 423.8
Interest rate/cross currency swaps – net payment/(receipt) 1.0 52.0 40.3 210.0 303.3
Foreign exchange contracts 16.0 26.7 61.7 - 104.4
Other financial liabilities - 12.9 51.7 97.0 161.6
343.8 655.5 1,696.5 2,026.4 4,722.2
Capital management The primary objective of the Group’s capital management is to ensure that it maintains a strong investment-grade credit rating and healthy capital ratios in order to support the long-term success of the business and to maintain an appropriate level of shareholder returns.
The principal means of adjusting the Group’s capital structure is through changes in the proportion of cash reinvested in the business or returned to shareholders.
The Group monitors its capital structure through the use of financial ratios, principally those of Net Debt to Total Assets and Funds From Operations to Total Adjusted Debt (FFO/TAD). FFO is defined as EBITDA adjusted for interest costs, current tax expenses, operating lease and pension obligations. TAD is interest bearing loans and borrowings adjusted for cash and short-term bank deposits, operating leases, retirement benefit obligation deficit, and tails and decommissioning provisions. The calculation used to determine FFO has been revised during the year to better reflect the methodology used by the majority of market analysts.
The Group targets an FFO/TAD ratio that results in a strong investment grade credit rating. The Group targets a long-term ratio of less than 60% for Net Debt to Total Assets, which the Group defines as interest bearing loans and borrowings (current and non-current) less Cash and cash equivalents and short-term deposits divided by Total Assets.
2015€m
2014€m
Net debt 2,827.5 2,774.0
Total assets 7,952.7 7,394.4
Net debt to total assets 35.6% 37.5%
URENCO Annual report and accounts 2015 95
Financial statementsGovernanceStrategic reportIntroduction
< previous next >
Contents

Financial statementsNotes to the Consolidated Financial Statements continuedFor the year ended 31 December 2015
24. Financial risk management objectives and policies continued2015
€m2014
€m
EBITDA 1,167.3 1,070.8
Less:
Net interest on bank borrowings and other loans (150.4) (113.7)
Unwinding of discount on provisions (45.6) (29.8)
Current tax expenses (106.1) (122.8)
Plus:
Operating lease depreciation 4.0 4.1
Pension normalisation 1.0 4.0
Funds from operations (FFO) 870.2 812.6
Interest bearing loans and borrowings 3,218.8 3,296.3
Cash and short-term bank deposits (391.3) (522.3)
Operating lease adjustment 111.5 107.1
Pensions deficit 70.9 101.6
Deferred tax on pensions deficit (15.1) (25.2)
Tails and decommissioning provisions 1,327.3 1,042.6
Depreciation within tails provisions (239.8) -
Deferred tax on provisions (128.0) (100.3)
Deferred tax on depreciation within tails provisions 49.5 -
Total adjusted debt (TAD) 4,003.8 3,899.8
FFO/TAD 21.7% 20.8%
96
Financial statementsGovernanceStrategic reportIntroduction
< previous next >
Contents

Financial statementsNotes to the Consolidated Financial Statements continuedFor the year ended 31 December 2015
25. Other financial assets and financial liabilities
Interest bearing loans and borrowings
At 31 December
EffectiveInterest rate
% Maturity2015
€m2014
€m
Current
Bank overdrafts: - -Other loans:
€500 million Eurobond (part) Floating 22 May 15 - 105.1
€500 million Eurobond (part) 3.15% 22 May 15 - 34.9
€500 million Eurobond (part) Floating 22 May 15 - 204.8
$50 million series A senior notes 5.51% 12 Dec 15 - 41.3
€25 million Eurobond Floating 17 Dec 15 - 25.6
€50 million Eurobond 3.34% 17 Dec 15 - 50.0
$100 million series B Senior notes 6.47% 30 Jun 16 92.1 -
$100 million series B Senior notes 5.56% 12 Dec 16 92.1 -
$132.2 million European Investment Bank financing facility 3.30% 29 Mar 23 13.6 12.1
$99 million European Investment Bank financing facility 3.15% 22 May 23 10.1 9.1
€100 million European Investment Bank financing facility 4.772% 17 Oct 24 7.1 7.1
€100 million European Investment Bank financing facility 3.34% 28 Oct 27 7.1 7.1
$108.6 million European Investment Bank financing facility Floating 29 Jun 28 7.1 6.4229.2 503.5
Non-current
Other loans:
$100 million series B Senior notes 6.47% 30 Jun 16 - 82.7
$100 million series B Senior notes 5.56% 12 Dec 16 - 82.7
€500 million Eurobond 4.00% 5 May 17 362.2 500.0
$100 million Senior notes 5.50% 11 May 17 92.1 82.7
€100 million Term facility agreement (inflation linked) 2.88% + inflation 7 Dec 17 112.0 112.2
€100 million European Investment Bank financing facility 4.439% 23 Mar 18 100.0 100.0
$50 million series C Senior notes 5.66% 12 Dec 18 46.0 41.3
€750 million Eurobond 2.50% 15 Feb 21 746.6 750.0
€500 million Eurobond 2.25% 5 Aug 22 495.2 -
$132.2 million European Investment Bank financing facility 3.30% 29 Mar 23 94.7 97.1
$99 million European Investment Bank financing facility 3.15% 22 May 23 70.9 72.8
€100 million European Investment Bank financing facility 4.772% 17 Oct 24 57.1 64.3
€500 million Eurobond 2.375% 2 Dec 24 495.3 500.0
€100 million European Investment Bank financing facility 3.34% 28 Oct 27 78.6 85.6
$108.6 million European Investment Bank financing facility Floating 29 Jun 28 85.7 83.4
Yen 20 billion Loan Agreement 6.24% 28 Apr 38 153.2 138.0
2,989.6 2,792.8
3,218.8 3,296.3
URENCO Annual report and accounts 2015 97
Financial statementsGovernanceStrategic reportIntroduction
< previous next >
Contents
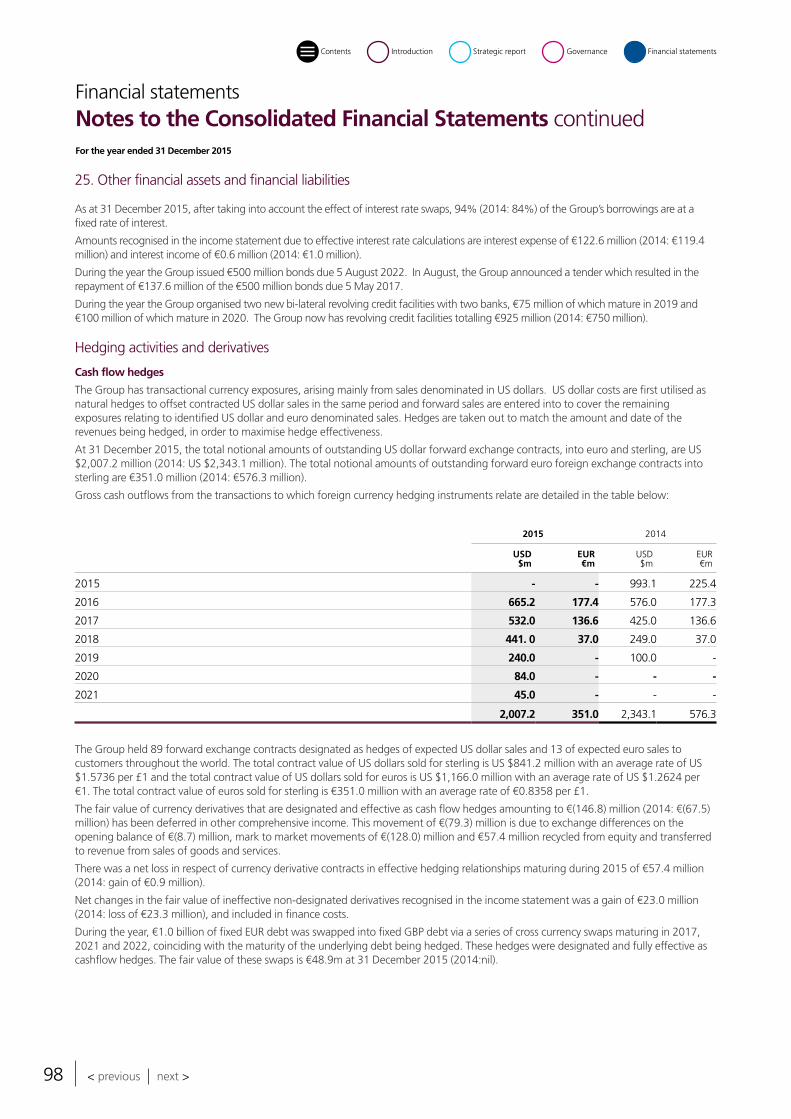
Financial statementsNotes to the Consolidated Financial Statements continuedFor the year ended 31 December 2015
25. Other financial assets and financial liabilities
As at 31 December 2015, after taking into account the effect of interest rate swaps, 94% (2014: 84%) of the Group’s borrowings are at a fixed rate of interest.
Amounts recognised in the income statement due to effective interest rate calculations are interest expense of €122.6 million (2014: €119.4 million) and interest income of €0.6 million (2014: €1.0 million).
During the year the Group issued €500 million bonds due 5 August 2022. In August, the Group announced a tender which resulted in the repayment of €137.6 million of the €500 million bonds due 5 May 2017.
During the year the Group organised two new bi-lateral revolving credit facilities with two banks, €75 million of which mature in 2019 and €100 million of which mature in 2020. The Group now has revolving credit facilities totalling €925 million (2014: €750 million).
Hedging activities and derivatives
Cash flow hedges
The Group has transactional currency exposures, arising mainly from sales denominated in US dollars. US dollar costs are first utilised as natural hedges to offset contracted US dollar sales in the same period and forward sales are entered into to cover the remaining exposures relating to identified US dollar and euro denominated sales. Hedges are taken out to match the amount and date of the revenues being hedged, in order to maximise hedge effectiveness.
At 31 December 2015, the total notional amounts of outstanding US dollar forward exchange contracts, into euro and sterling, are US $2,007.2 million (2014: US $2,343.1 million). The total notional amounts of outstanding forward euro foreign exchange contracts into sterling are €351.0 million (2014: €576.3 million).
Gross cash outflows from the transactions to which foreign currency hedging instruments relate are detailed in the table below:
2015 2014
USD$m
EUR€m
USD$m
EUR€m
2015 - - 993.1 225.4
2016 665.2 177.4 576.0 177.3
2017 532.0 136.6 425.0 136.6
2018 441. 0 37.0 249.0 37.0
2019 240.0 - 100.0 -
2020 84.0 - - -
2021 45.0 - - -
2,007.2 351.0 2,343.1 576.3
The Group held 89 forward exchange contracts designated as hedges of expected US dollar sales and 13 of expected euro sales to customers throughout the world. The total contract value of US dollars sold for sterling is US $841.2 million with an average rate of US $1.5736 per £1 and the total contract value of US dollars sold for euros is US $1,166.0 million with an average rate of US $1.2624 per €1. The total contract value of euros sold for sterling is €351.0 million with an average rate of €0.8358 per £1.
The fair value of currency derivatives that are designated and effective as cash flow hedges amounting to €(146.8) million (2014: €(67.5) million) has been deferred in other comprehensive income. This movement of €(79.3) million is due to exchange differences on the opening balance of €(8.7) million, mark to market movements of €(128.0) million and €57.4 million recycled from equity and transferred to revenue from sales of goods and services.
There was a net loss in respect of currency derivative contracts in effective hedging relationships maturing during 2015 of €57.4 million (2014: gain of €0.9 million).
Net changes in the fair value of ineffective non-designated derivatives recognised in the income statement was a gain of €23.0 million (2014: loss of €23.3 million), and included in finance costs.
During the year, €1.0 billion of fixed EUR debt was swapped into fixed GBP debt via a series of cross currency swaps maturing in 2017, 2021 and 2022, coinciding with the maturity of the underlying debt being hedged. These hedges were designated and fully effective as cashflow hedges. The fair value of these swaps is €48.9m at 31 December 2015 (2014:nil).
98
Financial statementsGovernanceStrategic reportIntroduction
< previous next >
Contents

Financial statementsNotes to the Consolidated Financial Statements continuedFor the year ended 31 December 2015
25. Other financial assets and financial liabilities continued
Fair value hedges
The Group uses interest rate swaps and cross currency interest rate swaps to manage its exposure to interest rate movements on its borrowings and also to effectively hedge its net investments in foreign subsidiaries. The interest rate swaps convert fixed rate debt into floating rate debt in the same currency and the cross currency interest rate swaps convert fixed rate debt in one currency into fixed and floating rate debt in another currency. Contracts with nominal values of €2,188.1 million at 31 December 2015 (2014: €941.6 million) have fixed interest receipts at an average rate of 3.49% (2014: 5.23%) for periods up until 2038 (2014: to 2038) and fixed interest payments at an average rate of 4.43% (2014: 4.31%) or floating interest payments until May 2015 at an average margin of 0.71% (2014: 0.71%) plus LIBOR or EURIBOR.
At 31 December 2014 the Group had contracts with a nominal value of €100.0 million which had fixed interest payments at an average rate of 3.15% and had floating interest receipts at an average margin of 0.38% plus LIBOR or EURIBOR. These matured in May 2015.
The fair value of swaps outstanding at 31 December 2015 is estimated at €40.5 million liability (combined currency and interest rate swaps) (2014: €71.7 million liability). These amounts are based on current market rates versus URENCO actual rates at the statement of financial position date.
Swaps with a fair value amounting to €40.5 million are designated and effective as fair value, net investment or cash flow hedges and the fair value thereof has been reflected in the hedging reserve or in the consolidated income statement together with the change in fair value of the underlying debt instrument.
Hedge of net investments in foreign operations
Included in loans at 31 December 2015 were (after-swap) borrowings of US $1,948.3 million (2014: US $1,787.1 million) which have been designated as hedges of the net investment in the US subsidiary, URENCO USA Inc. In addition, borrowings of €765.0 million (2014: €794.2 million) have been designated as hedges of the net investment in the European sites. These borrowings are being used to hedge the Group’s exposure to foreign exchange risk on these investments. Gains or losses on the retranslation of these borrowings are transferred to other comprehensive income to offset any gains or losses on translation of the net investments in the subsidiaries.
Fair values
Set out below is a comparison by class of the carrying amounts and fair values of the Group’s financial instruments that are carried in the financial statements:
Book value2015
€m
Fair value2015
€m
Book value2014
€m
Fair value2014
€m
Financial assets
Trade and other receivables 426.6 426.6 543.9 543.9
Other financial assets
Forward foreign exchange contracts – hedged 50.4 50.4 25.3 25.3
Forward foreign exchange contracts – non-hedged - - - -
Interest rate/cross currency swaps 48.9 48.9 15.6 15.6
Short-term deposits - - 322.8 322.8
Cash 391.3 391.3 199.5 199.5
Total 917.2 917.2 1,107.1 1,107.1
Financial liabilities
Interest bearing loans and borrowings
Floating rate borrowings 204.9 213.5 512.4 216.5
Fixed rate borrowings 3,013.9 3,082.7 2,783.9 3,218.8
Trade and other payables 418.6 418.6 423.8 423.8
Derivative financial liabilities at fair value through profit or loss
Derivatives in designated hedges 197.2 197.2 109.0 109.0
Forward foreign exchange contracts - - 5.5 5.5
Interest rate/cross currency swaps 89.4 89.4 86.7 86.7
Total 3,924.0 4,001.4 3,921.3 4,060.3
URENCO Annual report and accounts 2015 99
Financial statementsGovernanceStrategic reportIntroduction
< previous next >
Contents
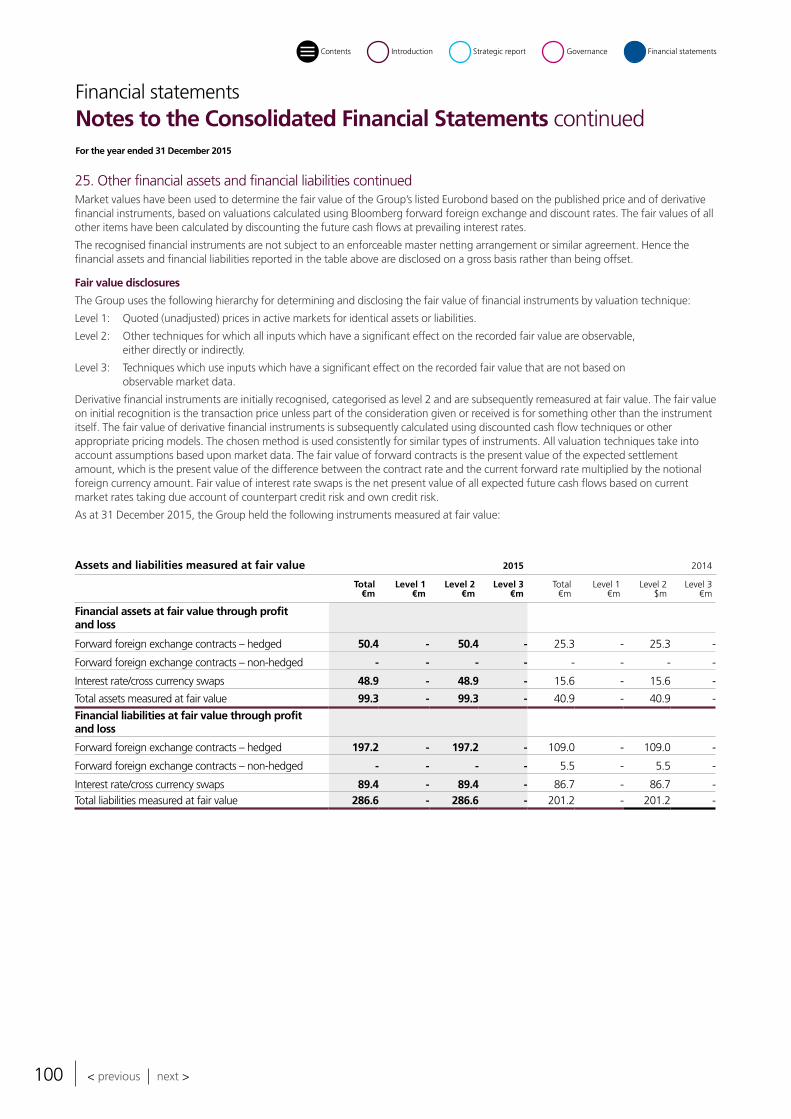
Financial statementsNotes to the Consolidated Financial Statements continuedFor the year ended 31 December 2015
25. Other financial assets and financial liabilities continuedMarket values have been used to determine the fair value of the Group’s listed Eurobond based on the published price and of derivative financial instruments, based on valuations calculated using Bloomberg forward foreign exchange and discount rates. The fair values of all other items have been calculated by discounting the future cash flows at prevailing interest rates.
The recognised financial instruments are not subject to an enforceable master netting arrangement or similar agreement. Hence the financial assets and financial liabilities reported in the table above are disclosed on a gross basis rather than being offset.
Fair value disclosures
The Group uses the following hierarchy for determining and disclosing the fair value of financial instruments by valuation technique:
Level 1: Quoted (unadjusted) prices in active markets for identical assets or liabilities.
Level 2: Other techniques for which all inputs which have a significant effect on the recorded fair value are observable, either directly or indirectly.
Level 3: Techniques which use inputs which have a significant effect on the recorded fair value that are not based on observable market data.
Derivative financial instruments are initially recognised, categorised as level 2 and are subsequently remeasured at fair value. The fair value on initial recognition is the transaction price unless part of the consideration given or received is for something other than the instrument itself. The fair value of derivative financial instruments is subsequently calculated using discounted cash flow techniques or other appropriate pricing models. The chosen method is used consistently for similar types of instruments. All valuation techniques take into account assumptions based upon market data. The fair value of forward contracts is the present value of the expected settlement amount, which is the present value of the difference between the contract rate and the current forward rate multiplied by the notional foreign currency amount. Fair value of interest rate swaps is the net present value of all expected future cash flows based on current market rates taking due account of counterpart credit risk and own credit risk.
As at 31 December 2015, the Group held the following instruments measured at fair value:
Assets and liabilities measured at fair value 2015 2014
Total €m
Level 1€m
Level 2€m
Level 3€m
Total€m
Level 1€m
Level 2$m
Level 3€m
Financial assets at fair value through profit and loss
Forward foreign exchange contracts – hedged 50.4 - 50.4 - 25.3 - 25.3 -
Forward foreign exchange contracts – non-hedged - - - - - - - -
Interest rate/cross currency swaps 48.9 - 48.9 - 15.6 - 15.6 -
Total assets measured at fair value 99.3 - 99.3 - 40.9 - 40.9 -
Financial liabilities at fair value through profit and loss
Forward foreign exchange contracts – hedged 197.2 - 197.2 - 109.0 - 109.0 -
Forward foreign exchange contracts – non-hedged - - - - 5.5 - 5.5 -
Interest rate/cross currency swaps 89.4 - 89.4 - 86.7 - 86.7 -Total liabilities measured at fair value 286.6 - 286.6 - 201.2 - 201.2 -
100
Financial statementsGovernanceStrategic reportIntroduction
< previous next >
Contents

Financial statementsNotes to the Consolidated Financial Statements continuedFor the year ended 31 December 2015
25. Other financial assets and financial liabilities continued
Classification of assets and liabilities
2015
Cash and receivables
€m
Derivatives used for hedging
€m
Non-financial
assets€m
Total€m
Assets
Property, plant and equipment - - 6,150.5 6,150.5
Investment property - - 7.5 7.5
Intangible assets - - 52.5 52.5
Investments - - 7.2 7.2
Financial assets 9.1 - - 9.1
Derivative financial instruments - 99.3 - 99.3
Deferred tax assets - - 301.0 301.0
Trade and other receivables 369.9 - 56.7 426.6
Inventories - - 507.7 507.7
Cash 391.3 - - 391.3
Total 770.3 99.3 7,083.1 7,952.7
2015
Loans and payables
€m
Derivatives used for hedging
€m
Other financial liabilities
€m
Non-financial liabilities
€mTotal
€m
Liabilities
Trade and other payables 418.6 - - - 418.6
Deferred income - - 44.2 - 44.2
Interest bearing loans and borrowings 3,218.8 - - - 3,218.8
Derivative financial instruments - 286.6 - - 286.6
Deferred tax liabilities - - - 58.2 58.2
Provisions - - - 1,421.0 1,421.0
Retirement benefit obligations - - - 70.9 70.9
Income tax payable - - - 4.1 4.1
Total 3,637.4 286.6 44.2 1,554.2 5,522.4
URENCO Annual report and accounts 2015 101
Financial statementsGovernanceStrategic reportIntroduction
< previous next >
Contents
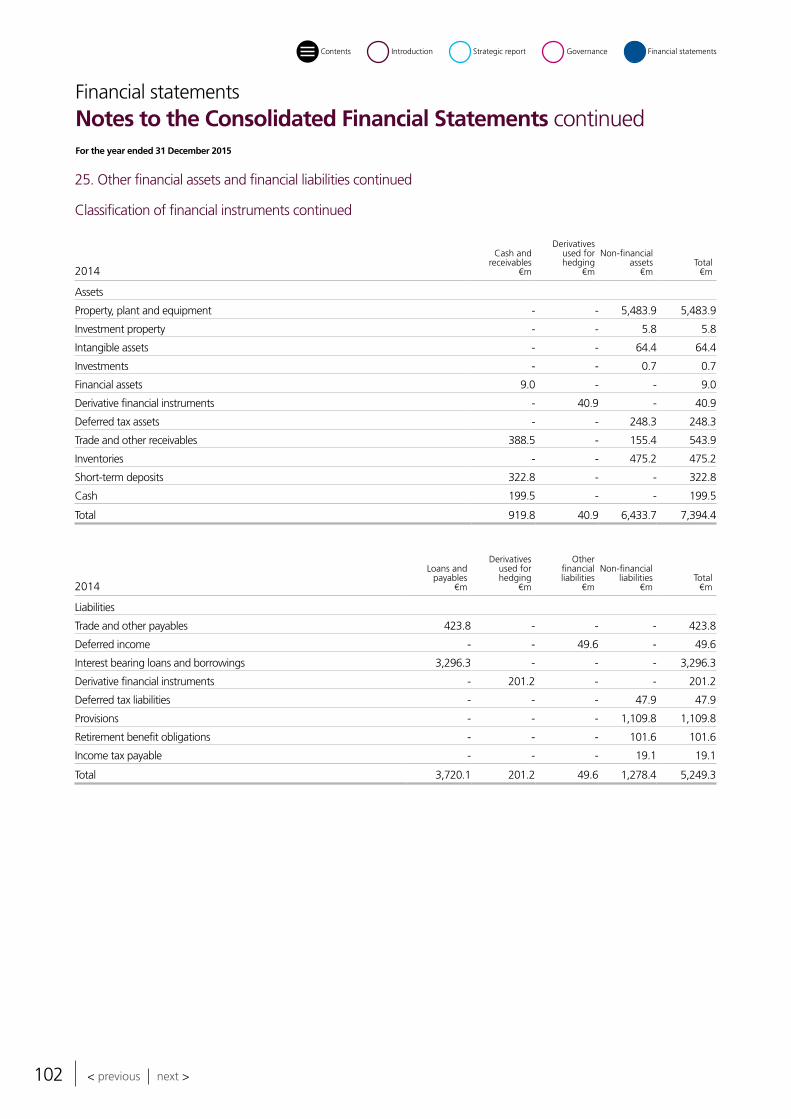
Financial statementsNotes to the Consolidated Financial Statements continuedFor the year ended 31 December 2015
25. Other financial assets and financial liabilities continued
Classification of financial instruments continued
2014
Cash and receivables
€m
Derivatives used for hedging
€m
Non-financial assets
€mTotal
€m
Assets
Property, plant and equipment - - 5,483.9 5,483.9
Investment property - - 5.8 5.8
Intangible assets - - 64.4 64.4
Investments - - 0.7 0.7
Financial assets 9.0 - - 9.0
Derivative financial instruments - 40.9 - 40.9
Deferred tax assets - - 248.3 248.3
Trade and other receivables 388.5 - 155.4 543.9
Inventories - - 475.2 475.2
Short-term deposits 322.8 - - 322.8
Cash 199.5 - - 199.5
Total 919.8 40.9 6,433.7 7,394.4
2014
Loans and payables
€m
Derivatives used for hedging
€m
Other financial liabilities
€m
Non-financial liabilities
€mTotal
€m
Liabilities
Trade and other payables 423.8 - - - 423.8
Deferred income - - 49.6 - 49.6
Interest bearing loans and borrowings 3,296.3 - - - 3,296.3
Derivative financial instruments - 201.2 - - 201.2
Deferred tax liabilities - - - 47.9 47.9
Provisions - - - 1,109.8 1,109.8
Retirement benefit obligations - - - 101.6 101.6
Income tax payable - - - 19.1 19.1
Total 3,720.1 201.2 49.6 1,278.4 5,249.3
102
Financial statementsGovernanceStrategic reportIntroduction
< previous next >
Contents

Financial statementsNotes to the Consolidated Financial Statements continuedFor the year ended 31 December 2015
25. Other financial assets and financial liabilities continuedThe fair values of derivative financial instruments at 31 December are set out below, with the following maturities:
Fair valueasset
31/12/15€m
Fair valueliability
31/12/15€m
Fair valueasset
31/12/14€m
Fair valueliability
31/12/14€m
Cash flow hedgesWithin one year 21.6 (83.3) 9.0 (44.7)1 to 2 years 17.7 (61.0) 8.5 (31.9)2 to 3 years 12.4 (38.3) 6.9 (18.3)3 to 4 years 2.5 (11.5) 0.9 (13.4)More than 4 years 45.1 (3.1) - (0.8)
99.3 (197.2) 25.3 (109.1)
Fair value hedgesWithin one year - - 5.1 -1 to 2 years - - - -2 to 3 years - - - -3 to 4 years - - - -More than 4 years - - - -
- - 5.1 -
Net investment hedgesWithin one year - - - -1 to 2 years - (7.2) - -
2 to 3 years - - - -3 to 4 years - - - -More than 4 years - (49.1) - -
- (56.3) - -
Derivative instruments designated in part as cash flow hedges and in part as net investment hedgesWithin one year - - - (4.8)1 to 2 years - - - -2 to 3 years - - - -3 to 4 years - - - -More than 4 years - (33.1) - (27.8)
- (33.1) - (32.6)
Derivative instruments designated in part as fair value hedges and in part as net investment hedgesWithin one year - - - (47.9)1 to 2 years - - - -2 to 3 years - - - -3 to 4 years - - - -More than 4 years - - - -
- - - (47.9)
Currency derivatives not designated as cash flow hedges and charged to incomeWithin one year - - 10.5 (11.6)1 to 2 years - - - -2 to 3 years - - - -3 to 4 years - - - -
- - 10.5 (11.6)
Total 99.3 (286.6) 40.9 (201.2)
Of which - non-current 77.7 (203.3) 16.2 (92.2)Of which - current 21.6 (83.3) 24.7 (109.0)
URENCO Annual report and accounts 2015 103
Financial statementsGovernanceStrategic reportIntroduction
< previous next >
Contents

Financial statementsNotes to the Consolidated Financial Statements continuedFor the year ended 31 December 2015
26. Provisions
Tailsdisposal
€m
Decommissioning of plant and
machinery€m
Other€m
Total€m
At 1 January 2015 694.0 348.6 67.2 1,109.8
Additional provision in the year 182.9 51.5 117.2 351.6
Unwinding of discount 28.0 14.6 3.0 45.6
Utilisation of provision (43.5) (4.7) (95.5) (143.7)
Release of provision - (0.7) (1.3) (2.0)
Transfers 22.4 - - 22.4
Exchange difference 25.4 8.8 3.1 37.3
At 31 December 2015 909.2 418.1 93.7 1,421.0
Included in current liabilities 5.0
Included in non-current liabilities 1,416.0
1,421.0
Tailsdisposal
€m
Decommissioning of plant and
machinery€m
Other€m
Total€m
At 1 January 2014 545.5 315.5 96.7 957.7
Additional provision in the year 149.2 14.8 85.4 249.4
Unwinding of discount 19.1 12.8 (2.1) 29.8
Utilisation of provision (48.3) (4.5) (105.1) (157.9)
Release of provision (0.2) (0.3) (11.9) (12.4)
Exchange difference 28.7 10.3 4.2 43.2
At 31 December 2014 694.0 348.6 67.2 1,109.8
Included in current liabilities 1.7
Included in non-current liabilities 1,108.1
1,109.8
Provision for tails disposal The enrichment process generates depleted uranium (“tails”). This provision has been made on a discounted basis for all estimated future costs for the eventual safe disposal of the tails. The costs take account of conversion to a different chemical state, intermediate storage, transport and safe disposal.
The final amount of the provision is uncertain but is evaluated based upon the planned operational activity involved in successfully achieving safe disposal in accordance with current regulatory requirements. The planned costs are based on historic experience, operational assumptions, depreciation assumptions, internal cost forecasts and understood contract prices for the relevant parts of the disposal cycle. These costs are escalated where appropriate based on current expectations of inflation and discounted to provide a present value cost per unit, or tails rate, which is applied to the quantity of tails held at the statement of financial position date. Further description of the estimates and assumptions applied are given in note 2.
Management has considered the applicable inflation rate of 2% per annum (2014: 2% per annum) and the risk free discount rate of 4% per annum (2014: 4% per annum) and concluded they are unchanged from those applied at year end 2014. The real discount rate is 1.96% (2014: 1.96%).
During the year the tails provision increased by €182.9 million (2014: €149.2 million) due to tails generated in that period and an increase in the applied tails rate. This addition to the tails provision has been recognised as a cost in the income statement under tails provision created. During the year, a detailed technical and operational review of tails provisioning was conducted. This review updated several of the technical, operational and financial assumptions and timings underlying the tails provision calculations as well as utilisation of the Group’s Tails Management Facility. As a result tails provisions were increased by €52.9 million. Costs incurred during the year on the safe deconversion, storage and disposal of tails of €43.5 million (2014: €48.3 million) have been charged against the provision.
It is expected that €404.9 million of the tails provision will be used within the next 10 years, €300.6 million of the provision will be used within the next 10 to 30 years and €203.7 million will be used within the next 30 to 100 years.
Of the total €909.2 million (2014: €694.0 million) of tails provisions held at year end, €669.4 million relates to discounted future cash flows and €239.8 million relates to discounted future depreciation of assets currently held for the purpose of meeting tails liabilities.
104
Financial statementsGovernanceStrategic reportIntroduction
< previous next >
Contents

Financial statementsNotes to the Consolidated Financial Statements continuedFor the year ended 31 December 2015
26. Provisions continuedThe provision for tails disposal is dependent on certain assumptions and estimates, such as timing of disposal and the applicable discount rate. A 10% reduction of the discount rate would lead to an increase of the provision by €77.6 million, whilst a 10% increase in the discount rate would lead to a decrease of the provision by €61.6 million.
Provision for decommissioning of plant and machinery The Directors intend to decommission plant and machinery as soon as practicably possible after it is taken out of use. Enrichment plant will be disassembled, declassified, decommissioned and the site returned to ‘greenfield’ or ‘brownfield’ status. Containers will be cleaned, dismantled and scrapped. To meet these eventual costs of decommissioning, provisions are charged in the accounts, for all plant and machinery in operation, at amounts considered to be adequate for the purpose.
The final amount of the provision is uncertain but is evaluated based upon the planned operational activity involved in successfully achieving full decommissioning of any land, plant or equipment used in enrichment activities, in accordance with the Directors’ intention and current regulatory requirements. The planned costs are based on historic experience and price estimates for the relevant activities and processes of the decommissioning cycle, which include deconstruction, decontamination and disposal of all materials involved in the enrichment process. These costs are escalated based on current expectations of inflation and discounted to provide a present value cost based on the expected useful life of the asset in use and timing of subsequent decommissioning activity. Further description of the estimates and assumptions applied are given in note 2.
Management has considered the applicable inflation rate of 2% per annum (2014: 2% per annum) and the risk free discount rate of 4% per annum (2014: 4% per annum) and concluded they are unchanged from those applied at year end 2014. The real discount rate is 1.96% (2014: 1.96%).
During the year the decommissioning provision increased by €51.5 million (2014: €14.8 million) due to the installation of additional plant and machinery of €4.4 million (2014: €6.4 million), additional container purchases of €11.9 million (2014: €8.4 million) and revised assumptions surrounding the decommissioning of plant and machinery of €35.2 million (2014: €nil). Of the €35.2 million resulting from revised assumptions, €13.3 million has been expensed to the Income Statement and €21.9 million has been recognised in decommissioning assets. The addition to the decommissioning provision associated with the installation of plant and machinery and additional container purchases has been recognised as an equivalent addition to the decommissioning asset in the statement of financial position.
It is expected that this provision will be used over the next 5 to 50 years.
The provision for decommissioning plant and machinery is dependent on certain assumptions and estimates, such as timing of decommissioning and the applicable discount rate. A 10% reduction of the discount rate would lead to an increase of the provision by €32.8 million, whilst a 10% increase in the discount rate would lead to a decrease of the provision by €29.6 million.
Other provisions These comprise provisions relating to the future re-enrichment of low assay feed and personnel provisions. During the year, the provisions relating to the future re-enrichment of low assay feed increased by €110.0 million due to the creation of low assay feed and reduced by €93.3 million due to expenditure incurred on re-enrichment of low assay feed. In addition to the net increase in provisions relating to the future re-enrichment of low assay feed of €16.7 million there was a €2.2 million increase in personnel provisions relating to pension costs and restructuring.
It is expected that other provisions will be used over the next ten years.
Other provisions are not materially sensitive to discount rates.
27. Retirement benefit obligationsThe Group operates a number of pension schemes in the UK, Germany, the Netherlands and the USA. Some are defined benefit schemes (four in total); others are defined contribution schemes and are funded externally. The defined benefit schemes comprise both funded and unfunded schemes. No other post-retirement benefits are currently provided by the Group. ETC forms part of URENCO’s defined benefit pension schemes. Assets and liabilities are allocated on a notional basis by employee to enable correct accounting across the subsidiaries.
As disclosed in the Remuneration Report on page 52, in addition to the accruals already made in the Company’s defined benefit scheme, H Engelbrecht had a right under his contract of employment to receive a certain income as retirement benefit which would be payable under certain conditions. From the date of his resignation on 31 December 2015 these rights have vested. The revenue funding cost of this company commitment, as assessed by an independent actuary, has been assessed to be €3.1 million, which has been recognised as an unfunded pension liability. The estimated costs at 31 December 2014 were €2.5 million, which were then disclosed as a contingent liability. These costs will be reviewed periodically.
Valuations of the schemes are carried out at least every three years. The most recent actuarial assessments for the UK scheme of plan assets and the present value of the defined benefit obligations were carried out at 5 April 2012 and subsequently rolled forward to 31 December 2014. Following the triennial valuation of the UK schemes, a revised deficit repair plan was agreed with the UK trustees. The plan includes deficit repair payments of £6.5 million annually for seven years, until 2020. A triennial valuation for the UK schemes has started in 2015 and is expected to be completed in 2016.
URENCO Annual report and accounts 2015 105
Financial statementsGovernanceStrategic reportIntroduction
< previous next >
Contents

Financial statementsNotes to the Consolidated Financial Statements continuedFor the year ended 31 December 2015
27. Retirement benefit obligations continuedThe latest valuation preliminary results show a continuing deficit and increased future costs for providing the final salary benefits. URENCO proposes to close the UK defined benefit section for further accrual from April 2017 and has had initial discussions with Trade Union officials and the Trustee Board to brief them on the proposed future strategy of the defined benefit scheme. This proposed change for most defined benefit section pension scheme members has also been communicated to the members of the UK pension scheme.
Actuarial assessments of plan assets and the present value of the defined benefit obligations are due to be carried out in accordance with the regulatory timetable of the relevant country. The present values of the defined benefit obligation, the related current service cost and past service cost were measured using the projected unit credit method.
Key financial assumptions used:2015
%2014
%
Discount rate 2.4-3.9 2.2-3.8
Expected rate of salary increases 2.5-4.1 2.5-4.1
Future pension increases 1.0-3.1 1.8-3.1
In addition to the key financial assumptions shown above, the Group reviews the demographic and mortality assumptions. Mortality assumptions reflect best practice in the countries in which the Group operates defined benefit schemes (the Netherlands, UK and Germany) and have regard to the latest available published tables, adjusted where appropriate, to reflect the experience of the Group and an extrapolation of past longevity improvements into the future. The tables used and key assumptions are as follows:
Mortality assumptions: Netherlands UK Germany
2015years
2014years
2015years
2014years
2015years
2014years
Life expectancy at age 60 for a male currently aged 60 26.3 26.1 28.2 28.7 23.6 23.4
Life expectancy at age 60 for a female currently aged 60 28.8 28.6 30.7 30.6 28.1 28.0
Life expectancy at age 60 for a male currently aged 40 28.7 28.5 30.5 31.2 26.4 26.2
Life expectancy at age 60 for a female currently aged 40 30.9 30.8 33.1 33.1 30.7 30.6
Mortality tables: Netherlands UK Germany
2015
AG Prognosetafel 2014 with TW fund specific mortality
experience 2014
S1PA YOB tables with appropriate age weightings
using CMI 2014 projections 1.5% minimum improvements p.a. Heubeck table 2005 G
2014
AG Prognosetafel 2014 with TW fund specific mortality experience
2014
S1NA YOB tables with appropriate age ratings using CMI 2011 projections 1.5% minimum
improvements p.a. Heubeck table 2005 G
Sensitivity analysisThe discount rate and the inflation rate have a significant effect on the amounts reported as retirement benefit obligations. The effect of a 0.25% change in isolation in certain assumptions as at 31 December 2015 for the Group’s retirement benefit schemes would have had the effects shown in the table below:
(Increase) / decrease in retirement benefit obligations
€m
Discount rate Effect of increase in discount rate by +0.25% at 31 December 2015 29.4
Effect of decrease in discount rate by -0.25% at 31 December 2015 (31.5)
Inflation rate Effect of increase in inflation rate by +0.25% at 31 December 2015 (18.3)
Effect of decrease in inflation rate by -0.25% at 31 December 2015 17.2
106
Financial statementsGovernanceStrategic reportIntroduction
< previous next >
Contents

Financial statementsNotes to the Consolidated Financial Statements continuedFor the year ended 31 December 2015
27. Retirement benefit obligations continuedAmounts recognised in income in respect of these defined benefit schemes are as follows:
Year ended31/12/15
€m
Year ended31/12/14
€m
Current service cost (14.0) (10.5)
Administrative expense paid from scheme assets (0.8) (1.0)
Net interest expense on defined benefit pension scheme (3.6) (2.5)
Past service cost (4.2) (4.4)
(22.6) (18.4)
The net interest cost charge for the year has been included in the consolidated income statement within finance expense.
The amount charged to income in respect of defined contribution pension schemes was €6.8 million (2014: €5.7 million).
The actual return on scheme assets was €(1.5) million (2014: €71.8 million).
Amounts recognised in the statement of comprehensive income in respect of these defined benefit schemes are as follows: Year ended
31/12/15€m
Year ended31/12/14
€m
Actuarial gains/(losses) 38.9 (44.5)
Exchange difference (20.7) (3.6)
18.2 (48.1)
The amount included in the statement of financial position arising from the Group’s obligations in respect of its defined benefit schemes is as follows:
Movement in present value of defined benefit obligation2015
€m2014
€m
TotalFunded
schemesUnfunded
schemes TotalFunded
schemesUnfunded
schemes
At 1 January (668.0) (642.8) (25.2) (532.7) (512.1) (20.6)
Current service cost (14.0) (13.5) (0.5) (10.5) (10.1) (0.4)
Past service cost (4.2) (1.0) (3.2) (4.4) (4.4) -
Interest cost (22.3) (21.7) (0.6) (22.8) (22.1) (0.7)
Actuarial gains/(losses) 59.1 59.1 - (96.0) (91.5) (4.5)
Benefits paid to members 21.8 20.9 0.9 23.4 22.4 1.0
Contributions by members (1.3) (1.3) - (1.4) (1.4) -
Foreign exchange (22.4) (22.4) - (23.6) (23.6) -
At 31 December (651.3) (622.7) (28.6) (668.0) (642.8) (25.2)
Movements in the fair value of plan assets2015
€m2014
€m
At 1 January 566.4 475.4
Interest income 18.7 20.3
Actuarial (losses)/gains (20.2) 51.5
Contributions by employer 18.2 21.2
Contributions by members 1.3 1.4
Benefits paid to members (20.8) (22.4)
Administrative expenses paid from scheme assets (0.8) (1.0)
Foreign exchange 17.6 20.0
At 31 December 580.4 566.4
URENCO Annual report and accounts 2015 107
Financial statementsGovernanceStrategic reportIntroduction
< previous next >
Contents

Financial statementsNotes to the Consolidated Financial Statements continuedFor the year ended 31 December 2015
27. Retirement benefit obligations continued2015
€m2014
€m
Present value of defined benefit obligation (651.3) (668.0)
Fair value of plan assets 580.4 566.4
Recognised (liability) at 31 December (70.9) (101.6)
The major categories and fair values of scheme assets at 31 December for each category are as follows:
Fair value of assets
2015€m
2014€m
Equity instruments 263.6 238.8
Debt instruments 267.3 253.1
Other assets 49.5 74.5
580.4 566.4
Other assets primarily relate to the mark to market position on the LDI swap portfolio. Experience adjustments (surplus/deficits) arise where actuarial assumptions made at a previous valuation have not been borne out in practice. The estimated amounts of contributions expected to be paid to the schemes during the current financial year (2016) is €18.7 million.
28. Trade and other payables
Current31/12/15
€m31/12/14
€m
Trade payables 54.8 61.8
Other payables 26.0 14.8
Accruals 157.4 155.3
Amounts due to joint venture 40.0 59.9
278.2 291.8
Trade and other payables principally comprise amounts outstanding for trade purchases and ongoing costs. The average credit period taken for trade purchases is 20 days (2014: 32 days).
The Directors consider that the carrying amount of trade payables approximates to their fair value.
Non-current31/12/15
€m31/12/14
€m
Other payables 140.4 132.0
Other payables comprise SWU and feed borrowed from third parties for the purpose of optimising production flexibility. The SWU and feed is expected to be returned in or by 2018.
29. Operating lease arrangements
The Group as lessee The Group has entered into operating leases on certain land, property, motor vehicles and items of machinery. These leases have an unweighted average life of five years based on the number of contracts and a weighted average life of 26 years based on the value of the contracts. The remaining terms of the leases vary from one to 96 years.Future minimum rentals payable under non-cancellable operating leases as at 31 December are as follows:
31/12/15€m
31/12/14€m
Within one year 3.8 4.1
In the second to fifth years inclusive 12.0 10.8
After five years 100.7 97.0
116.5 111.9
108
Financial statementsGovernanceStrategic reportIntroduction
< previous next >
Contents
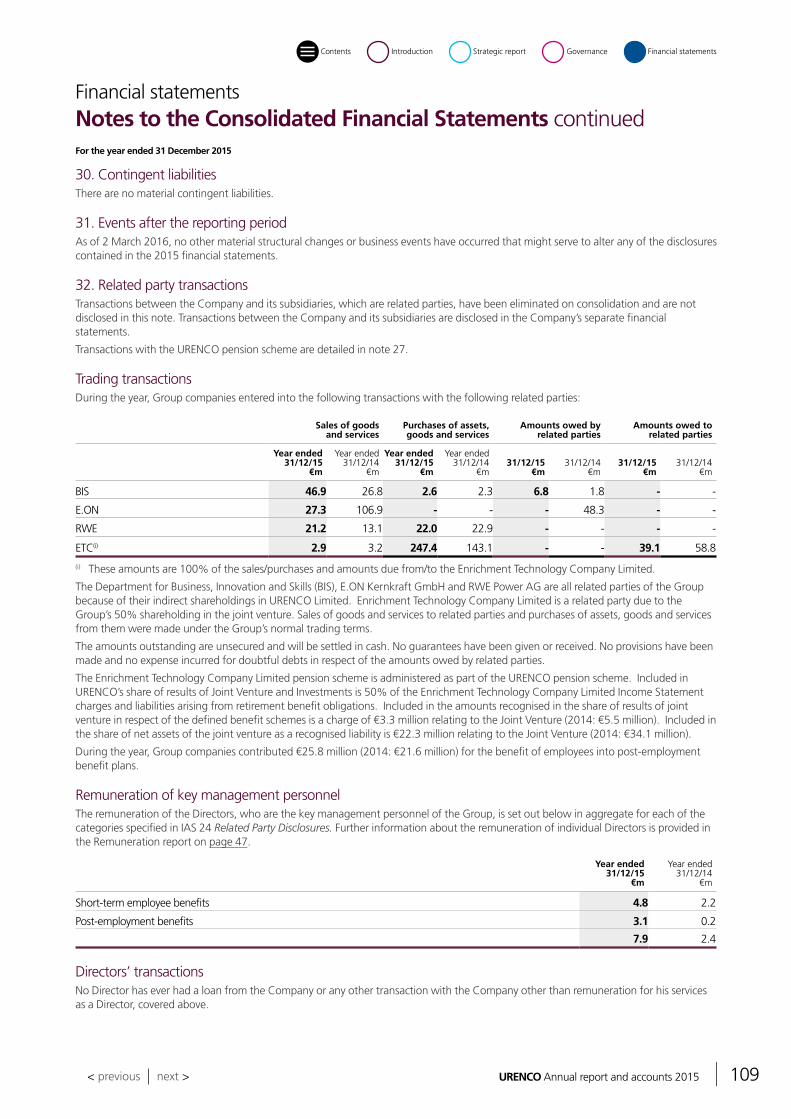
Financial statementsNotes to the Consolidated Financial Statements continuedFor the year ended 31 December 2015
30. Contingent liabilities There are no material contingent liabilities.
31. Events after the reporting period As of 2 March 2016, no other material structural changes or business events have occurred that might serve to alter any of the disclosures contained in the 2015 financial statements.
32. Related party transactions Transactions between the Company and its subsidiaries, which are related parties, have been eliminated on consolidation and are not disclosed in this note. Transactions between the Company and its subsidiaries are disclosed in the Company’s separate financial statements.
Transactions with the URENCO pension scheme are detailed in note 27.
Trading transactions During the year, Group companies entered into the following transactions with the following related parties:
Sales of goods and services
Purchases of assets, goods and services
Amounts owed by related parties
Amounts owed to related parties
Year ended 31/12/15
€m
Year ended 31/12/14
€m
Year ended 31/12/15
€m
Year ended 31/12/14
€m31/12/15
€m31/12/14
€m31/12/15
€m31/12/14
€m
BIS 46.9 26.8 2.6 2.3 6.8 1.8 - -
E.ON 27.3 106.9 - - - 48.3 - -
RWE 21.2 13.1 22.0 22.9 - - - -
ETC(i) 2.9 3.2 247.4 143.1 - - 39.1 58.8
(i) These amounts are 100% of the sales/purchases and amounts due from/to the Enrichment Technology Company Limited.
The Department for Business, Innovation and Skills (BIS), E.ON Kernkraft GmbH and RWE Power AG are all related parties of the Group because of their indirect shareholdings in URENCO Limited. Enrichment Technology Company Limited is a related party due to the Group’s 50% shareholding in the joint venture. Sales of goods and services to related parties and purchases of assets, goods and services from them were made under the Group’s normal trading terms.
The amounts outstanding are unsecured and will be settled in cash. No guarantees have been given or received. No provisions have been made and no expense incurred for doubtful debts in respect of the amounts owed by related parties.
The Enrichment Technology Company Limited pension scheme is administered as part of the URENCO pension scheme. Included in URENCO’s share of results of Joint Venture and Investments is 50% of the Enrichment Technology Company Limited Income Statement charges and liabilities arising from retirement benefit obligations. Included in the amounts recognised in the share of results of joint venture in respect of the defined benefit schemes is a charge of €3.3 million relating to the Joint Venture (2014: €5.5 million). Included in the share of net assets of the joint venture as a recognised liability is €22.3 million relating to the Joint Venture (2014: €34.1 million).
During the year, Group companies contributed €25.8 million (2014: €21.6 million) for the benefit of employees into post-employment benefit plans.
Remuneration of key management personnel The remuneration of the Directors, who are the key management personnel of the Group, is set out below in aggregate for each of the categories specified in IAS 24 Related Party Disclosures. Further information about the remuneration of individual Directors is provided in the Remuneration report on page 47.
Year ended31/12/15
€m
Year ended31/12/14
€m
Short-term employee benefits 4.8 2.2
Post-employment benefits 3.1 0.2
7.9 2.4
Directors’ transactions No Director has ever had a loan from the Company or any other transaction with the Company other than remuneration for his services as a Director, covered above.
URENCO Annual report and accounts 2015 109
Financial statementsGovernanceStrategic reportIntroduction
< previous next >
Contents

110
Registered number 01022786
Financial statementsGovernanceStrategic reportIntroductionContents
< previous next >

URENCO Annual report and accounts 2015 111
Company Financial StatementsDirectors’ Responsibilities Statement 112Company Statement of Financial Position 113Company Statement of Changes in Equity 114Notes to the Company Financial Statements 115
Financial statementsCompany Financial StatementsFor the year ended 31st December 2015
Financial statementsGovernanceStrategic reportIntroductionContents
< previous next >

Financial statementsDirectors’ Responsibilities StatementIn respect of the Parent Company Financial Statements
Statement of Directors’ responsibilities in respect of the accounts The Directors are responsible for preparing the annual report and the financial statements in accordance with applicable law and regulations.
Company law requires the Directors to prepare financial statements for each financial year. Under that law the Directors have elected to prepare the financial statements in accordance with United Kingdom Generally Accepted Accounting Practice, including Financial Reporting Standard (FRS) 101 Reduced Disclosure Framework and applicable law. Under company law the Directors must not approve the financial statements unless they are satisfied that they give a true and fair view of the state of affairs of the Company and of the profit or loss of the Company for that period. In preparing the Parent Company financial statements, the Directors are required to:
• Select suitable accounting policies and then apply them consistently; • Make judgements and accounting estimates that are reasonable and prudent;• State whether applicable UK Accounting Standards have been followed, subject to any material departures disclosed and explained
in the financial statements; and• Prepare the financial statements on the going concern basis unless it is inappropriate to presume that the Company will continue in
business.
The Directors are responsible for keeping adequate accounting records that are sufficient to show and explain the Company’s transactions and disclose with reasonable accuracy at any time the financial position of the Company and enable them to ensure that the financial statements comply with the Companies Act 2006. They are also responsible for safeguarding the assets of the Company and hence for taking reasonable steps for the prevention and detection of fraud and other irregularities.
The Directors are responsible for the maintenance and integrity of the corporate and financial information included on the Company’s website. Legislation in the United Kingdom governing the preparation and dissemination of financial statements may differ from legislation in other jurisdictions.
By order of the Board.
Sarah Newby Company Secretary
2 March 2016
112
Financial statementsGovernanceStrategic reportIntroduction
< previous next >
Contents

Financial statementsCompany Statement of Financial PositionAs at 31 December 2015
Notes2015
€m
2014As restated
€m
Non-current assetsProperty, plant and equipment 5 7.3 10.8Intangible assets 6 3.0 3.0Investments in subsidiaries and associate 7 2,293.1 2,264.6Deferred tax asset 9 1.9 -Derivative financial instruments 13 192.2 79.8
2,497.5 2,358.2Current assetsAmounts due from Group undertakings 8 2,320.8 541.7Trade and other receivables 8 183.6 149.0Derivative financial instruments 13 104.9 131.7
Short-term deposits - 322.8
Cash and cash equivalents 382.1 174.62,991.4 1,319.8
Total assets 5,488.9 3,678.0
Current liabilitiesInterest bearing loans and borrowings 10 (229.2) (83.1)Amounts due to Group undertakings 11 (1,370.2) (1,021.2)Trade and other payables 12 (107.6) (77.1)Derivative financial instruments 13 (104.9) (120.1)
(1,811.9) (1,301.5)Non-current liabilitiesInterest bearing loans and borrowings 10 (778.3) (930.6)Amounts due to Group undertakings 11 (1,755.9) (381.5)Derivative financial instruments 13 (232.1) (110.4)Other payables (1.9) (0.3)Retirement benefit obligations 14 (9.4) (7.2)
(2,777.6) (1,430.0)Total liabilities (4,589.5) (2,731.5)Net assets 899.4 946.5
EquityShare capital 15 237.3 237.3Retained earnings 16 670.1 709.2Hedging reserve (8.0) -Total equity 899.4 946.5
Registered Number 01022786
The profit after tax for the financial year of the Parent Company amounts to €426.6 million (2014: €648.2 million).
The financial statements were approved by the Board of Directors and authorised for issue on 2 March 2016.
They were signed on its behalf by:
Dr Thomas Haeberle Ralf ter Haar Chief Executive Officer Chief Financial Officer
URENCO Annual report and accounts 2015 113
Financial statementsGovernanceStrategic reportIntroduction
< previous next >
Contents

Financial statementsCompany Statement of Changes in EquityFor the year ended 31 December 2015
Share capital €m
Retained earnings
€m
Hedgingreserve
€m
Attributable to the owners of the
Company €m
As at 1 January 2015 237.3 709.2 - 946.5
Income for the period - 426.6 - 426.6
Other comprehensive income - (125.7) (8.0) (133.7)
Total comprehensive income - 300.9 (8.0) 292.9
Equity dividends paid - (340.0) - (340.0)
As at 31 December 2015 237.3 670.1 (8.0) 899.4
As restatedShare capital
€m
Retained earnings
€m
Hedging reserve
€m
Attributable to the owners of the
Company €m
As at 1 January 2014 237.3 467.5 - 704.8
Income for the period - 648.2 - 648.2
Other comprehensive income - (66.5) - (66.5)
Total comprehensive income - 581.7 - 581.7
Equity dividends paid - (340.0) - (340.0)
As at 31 December 2014 237.3 709.2 - 946.5
114
Financial statementsGovernanceStrategic reportIntroduction
< previous next >
Contents

Financial statementsNotes to the Company Financial StatementsFor the year ended 31 December 2015
1. Significant accounting policiesThe separate financial statements of the Parent Company are presented as required by the Companies Act 2006. As permitted by that Act, the separate financial statements have been prepared in accordance with United Kingdom Generally Accepted Accounting Practice, including Financial Reporting Standard (FRS) 101 Reduced Disclosure Framework.
Basis of preparation and presentationThe accounts are prepared under the historical cost basis, except for those financial instruments and pension obligations that have been measured at fair value.
The URENCO Limited financial statements are presented in euros. This is consistent with the presentation of the Group consolidated financial statements.
No Company income statement is presented for URENCO Limited, as permitted under section 408 of the Companies Act 2006.
UK GAAP replacementIn the year ended 31 December 2015, the Company has changed its accounting framework from the previously existing UK GAAP to FRS 101, with comparative numbers for 2014 also based on FRS 101. The transition to FRS 101 did have a net impact on equity at 1 January 2014 and at 31 December 2014 and also on total comprehensive income, net of tax for the year ended 31 December 2014. Note 21 provides an explanation of the transition to FRS 101.
The Company has applied FRS 101 Reduced Disclosure Framework incorporating the Amendments to FRS 101 issued by the FRC in July 2015 and the amendments to Company law made by The Companies, Partnerships and Groups (Accounts and Reports) Regulations 2015 prior to their mandatory effective date of accounting periods beginning on or after 1 January 2016.
As permitted by FRS 101, the Company has taken advantage of the disclosure exemptions available under that standard in relation to the presentation of a cash flow statement, standards not yet effective, financial instruments and related party transactions. Where required, equivalent disclosures are given in the Group accounts of URENCO Limited.
Going concernAs discussed in the Directors’ Report, the Directors are satisfied that the Company has adequate resources to continue in operational existence for the foreseeable future. Thus they continue to adopt the going concern basis of accounting in preparing the annual financial statements.
TaxationThe charge for tax is based on the result for the year and takes into account deferred tax.
Deferred tax is recognised in respect of all temporary differences that have originated but not been reversed by the reporting date, where transactions or events that result in an obligation to pay more, or a right to pay less, tax in the future have occurred at the reporting date. Temporary differences are differences between the Company’s taxable profits and its results as stated in the financial statements.
Deferred tax is not provided on temporary differences arising from the revaluation of fixed assets where there is no commitment to sell the asset, or on unremitted earnings of subsidiaries and associates where there is no commitment to remit these earnings.
A net deferred tax asset is regarded as recoverable, and therefore recognised, only when, on the basis of all available evidence, it can be regarded as more likely than not that there will be suitable taxable profits from which the future reversal of the underlying temporary differences can be deducted.
Deferred tax is measured at the average tax rates that are expected to apply in the periods in which the temporary differences are expected to reverse based on tax rates or laws that have been enacted or substantively enacted by the reporting date. Deferred tax is measured on a non-discounted basis.
Operating leasesRentals paid under operating leases are recognised on a straight-line basis over the term of the lease.
Foreign currenciesThe Company’s functional currency is sterling and the financial statements are presented in euros. Transactions in foreign currencies are recorded at the rate ruling at the date of the transaction. Monetary assets and liabilities denominated in foreign currencies are re-translated at the rate of exchange ruling at the reporting date, with all differences being taken to profit and loss. All other translation differences are taken to total comprehensive income. The average sterling to euro rate for 2015 was £0.72687 to €1 (2014: £0.80658 to €1) and the year end rate was £0.73714 to €1 (2014: £0.77667 to €1).
URENCO Annual report and accounts 2015 115
Financial statementsGovernanceStrategic reportIntroduction
< previous next >
Contents

Financial statementsNotes to the Company Financial Statements continuedFor the year ended 31 December 2015
1. Significant accounting policies continued
Tangible fixed assets and depreciation Tangible fixed assets are included at cost less depreciation. Depreciation is provided on all tangible fixed assets, other than freehold land, at rates calculated to write off the cost of each asset evenly over its expected useful life, as follows:
Freehold buildings 12 – 40 years Plant and machinery 3 – 15 years Office fixtures and fittings 12 years Computer equipment 3 – 5 years
The carrying values of tangible assets are reviewed for impairment when events or changes in circumstances indicate that the carrying value may not be recoverable.
Intangible fixed assetsSoftware and development costs associated with the Group’s implementation of its ERP system (SAP 6.0) have been capitalised within computer equipment. Depreciation of these capitalised project costs takes place on a straight-line basis, based on a useful economic life of five years, with no residual value.
InvestmentsInvestments in subsidiary undertakings are held at cost. The Company assesses investments for impairment whenever events or changes in circumstances indicate that the carrying value of an investment may not be recoverable. If any such indication of impairment exists, the Company makes an estimate of the investment’s recoverable amount. The recoverable amount is the higher of the amount at which the investment could be disposed of, less any direct selling costs, and value in use. Where the carrying amount of an investment exceeds its recoverable amount, the investment is considered impaired and is written down to its recoverable amount. Any impairment loss is recognised as an expense immediately. If, after an impairment loss has been recognised, the recoverable amount of an investment increases because of a change in economic conditions or in the expected use of the asset, the resulting reversal of the impairment loss is recognised as income to the extent that it increases the carrying amount of the investment up to the amount that it would have been had the original impairment not occurred.
Derivative financial instrumentsThe Company enters into derivative financial instruments in order to manage foreign exchange risk on behalf of URENCO Group. Additionally the Company uses interest rate swaps and cross currency interest rate swaps. Further details of derivative financial instruments are disclosed in note 13.
Derivatives are initially recognised at fair value at the date the contract is entered into and are subsequently remeasured to their fair value at each reporting date. The resulting gains or losses are recorded as finance income or finance costs unless the derivative is designated and effective as a hedging instrument, in which event the timing of recognition in the income statement depends on the nature of the hedge relationship. A derivative is presented as a non-current asset or a non-current liability if the remaining maturity of the instrument is more than 12 months and it is not expected to be realised or settled within 12 months. Other derivatives are presented as current assets or current liabilities.
The fair value on initial recognition is the transaction price unless part of the consideration given or received is for something other than the instrument itself. The fair value of derivative financial instruments is subsequently calculated using discounted cash flow techniques. The chosen method is used consistently for similar types of instruments. All valuation techniques take into account assumptions based upon market data. The fair value of forward contracts is the present value of the expected settlement amount, which is the present value of the difference between the contract rate and the current forward rate multiplied by the notional foreign currency amount. Fair value of interest rate swaps is the net present value of all expected future cash flows based on current market rates taking due account of counterpart credit risk and own credit risk.
116
Financial statementsGovernanceStrategic reportIntroduction
< previous next >
Contents

Financial statementsNotes to the Company Financial Statements continuedFor the year ended 31 December 2015
1. Significant accounting policies continued
Retirement benefit obligations The Company operates a defined benefit pension scheme for the benefit of all employees who started their employment prior to 31 December 2007. For employees joining the Company after this date, the Company operates a defined contribution scheme. Payments to the defined contribution scheme are charged as an expense as they fall due. On 10 August 2009, the Company’s defined benefit scheme merged with the URENCO UK pension scheme.
Regarding the defined benefit scheme, in accordance with IAS 19, the Company has recognised the retirement benefit obligations. The scheme, which is funded by contributions partly from the employees and partly from the Company, is administered independently.
The cost of providing benefits is determined using the projected unit credit method, with actuarial assessments being carried out at each reporting date. Actuarial gains and losses are recognised in full in the statement of comprehensive income in the period in which they occur. They are recognised directly in retained earnings and included as a movement in the present value of the net defined benefit liability.
Past service cost is recognised immediately as an expense to the extent that the benefits are already vested and otherwise is amortised on a straight-line basis over the average period until the benefits become vested.
Scheme assets are measured at fair value, which is based upon market price information, and in the case of quoted securities is the published bid price.
The retirement benefit obligations recognised in the statement of financial position represent the present value of the defined benefit obligation as reduced by the fair value of scheme assets. Any asset resulting from this calculation is limited to past service cost, plus the present value of available refunds and reductions in future contributions to the plan.
Net interest is calculated by applying a discount rate to the net defined benefit liability or asset and is recorded on a net basis as net finance income or expense.
Use of estimatesThe preparation of financial statements requires management to make estimates and assumptions that affect the reported amounts of assets and liabilities as well as the disclosure of contingent assets and liabilities at the reporting date and the reported amounts of revenues and expenses during the reporting period. Actual outcomes could differ from those estimates.
2. Employee benefits expense
The average monthly number of Company employees (including Executive Directors) was:2015
Number2014
Number
Technical 35 35
Administration 105 102
140 137
Their aggregate remuneration comprised:
Year ended31/12/15
€m
Year ended31/12/14
€m
Wages and salaries 21.7 15.8
Social security costs 2.1 2.1
Pension costs 6.6 2.2
30.4 20.1
URENCO Annual report and accounts 2015 117
Financial statementsGovernanceStrategic reportIntroduction
< previous next >
Contents
Financial statementsNotes to the Company Financial Statements continuedFor the year ended 31 December 2015
2. Employee benefits expense continued
Directors’ emoluments (see page 50):
Year ended31/12/15
€m
Year ended31/12/14
€m
Emoluments 4.1 2.1
Amounts receivable under long-term incentive scheme 0.7 -
Company contributions paid to a defined benefit pension scheme 0.2 0.2
Company contributions paid to a defined contribution pension scheme 0.1 -
Company contributions to be paid for past service costs 2.8 -
Number Number
Members of defined benefit pension schemes 1 1
Members of defined contribution schemes 1 -
In respect of the highest paid Director:
Year ended31/12/15
€m
Year ended31/12/14
€m
Emoluments including pension 5.9 0.9
Accrued pension at the end of the year 0.2 0.2
In addition to the accruals already made in the Company’s defined benefit scheme, H. Engelbrecht had a right under his contract of employment to receive a certain income as retirement benefit which would be payable under certain conditions. These rights vested on 31 December 2015. The revenue funding cost of this Company commitment, as assessed by an independent actuary, has been assessed to be €3.1 million, which has been recognised in the year. These costs will be reviewed periodically.
3. Taxation
Deferred tax
Deferred tax balances recognised at 31 December are as follows:2015
€m
2014As restated
€m
Relating to fixed assets 0.3 0.2
Relating to short-term temporary differences 1.0 0.3
Relating to fair value movements on financial instruments (0.5) (2.2)
Retirement benefit obligations 1.1 1.7
Total deferred tax asset 1.9 -
4. Dividends paid and proposedYear ended
31/12/15€m
Year ended31/12/14
€m
Declared and paid during the year
Amounts recognised as distributions to equity holders in the period:
Final dividend for the year ended 31 December 2014 of 202.38 cents per share (2013: 202.38 cents per share) 340.0 340.0
340.0 340.0
Proposed for approval at the Annual General MeetingProposed final dividend for the year ended 31 December 2015 of 208.33 cents per share (2014: 202.38 cents per share) 350.0 340.0
The expected final dividend is subject to approval by shareholders at the Annual General Meeting and has not been included as a liability in these financial statements.
118
Financial statementsGovernanceStrategic reportIntroduction
< previous next >
Contents

Financial statementsNotes to the Company Financial Statements continuedFor the year ended 31 December 2015
5. Property, plant and equipmentFixtures and
fittings€m
Cost as at 1 January 2015 14.6
Additions 2.2
Disposals (5.8)
Exchange adjustments 0.8
Cost as at 31 December 2015 11.8
Depreciation as at 1 January 2015 3.8
Charge for the year 0.5
Exchange adjustments 0.2
Depreciation as at 31 December 2015 4.5
Net book value as at 1 January 2015 10.8
Net book value as at 31 December 2015 7.3 All tangible fixed assets are carried at historical cost less accumulated depreciation. The category of fixtures and fittings comprises office fixtures and fittings and computer equipment. Disposals in the year relate to assets sold to other Group companies.
6. Intangible assetsSoftware
assets€m
Cost as at 1 January 2015 6.8
Additions 1.8
Exchange adjustments 0.3
Cost as at 31 December 2015 8.9
Amortisation as at 1 January 2015 3.8
Charge for the year 1.9
Exchange adjustments 0.2
Amortisation as at 31 December 2015 5.9
Net book value as at 1 January 2015 3.0
Net book value as at 31 December 2015 3.0
7. Investments in subsidiaries and associateShares
in subsidiary and associated
undertakings€m
Cost as at 1 January 2015 2,497.5
Additions 28.5
Cost as at 31 December 2015 2,526.0
Impairment as at 1 January 2015 and at 31 December 2015 (232.9)
Carrying amount as at 1 January 2015 2,264.6
Carrying amount as at 31 December 2015 2,293.1
Additions in the year relates to a further capital contribution in the wholly owned subsidiary, Capenhurst Nuclear Services Limited.
During 2012, the Company fully impaired its investment in Enrichment Technology Company Limited to a value of €nil and the impairment loss of €232.9 million was recognised as an expense. The recoverable amount for the impairment test was determined by the value in use method, which was measured by discounting estimated future cash flows using a pre-tax discount rate of 10%.
URENCO Annual report and accounts 2015 119
Financial statementsGovernanceStrategic reportIntroduction
< previous next >
Contents

Financial statementsNotes to the Company Financial Statements continuedFor the year ended 31 December 2015
7. Investments in subsidiaries and associate continuedDetails of the Company’s subsidiaries and associate at 31 December 2015 are as follows:
Nature of business
Place ofincorporation
(or registration)and operation
Proportionof ownership
interest%
Proportionof voting
power held%
Name of subsidiary
URENCO Enrichment Company Limited Holding / central services England and Wales 100 100
URENCO UK Limited Enrichment services England and Wales(i) 100 100
URENCO ChemPlants Limited Deconversion England and Wales 100 100
URENCO Deutschland GmbH Enrichment services Germany(i) 100 100
URENCO Nederland BV Enrichment services the Netherlands(i) 100 100
URENCO Deelnemingen BV Holding the Netherlands(i) 100 100
URENCO Finance NV Financing the Netherlands 100 100
URENCO USA Inc. Holding US 100 100
URENCO Inc. Sales / marketing US(i) 100 100
URENCO Finance UK Limited Holding company UK(i) 100 100
URENCO Finance US LLC Financing US(i) 100 100
Louisiana Energy Services, LLC Enrichment services US(i) 100 100
Capenhurst Nuclear Services Limited Uranium handling services England and Wales 100 100
URENCO USA Energy Services LLC Consultancy services US(i) 100 100
URENCO Consultancy Services Limited Dormant UK 100 100
Latin American Contract Services Limited Dormant UK(i) 100 100
URENCO Logistics GmbH Dormant Germany(i) 100 100
National Enrichment Facility Series 2004 LLC Financing US(i) 100 100
Name of associate
Enrichment Technology Company Limited Manufacturing England and Wales(i)(ii) 50 50
(i) Denotes companies / partnership whose shares are indirectly held by URENCO Limited.(ii) 21.7% is held directly by URENCO Limited, with the remaining 28.3% held by URENCO Deutschland GmbH.
8. Trade and other receivables
31/12/15€m
31/12/14As restated
€m
Amounts due from Group undertakings 2,320.8 541.7
Other debtors 1.4 1.2
Corporation tax receivable 104.8 95.0
Prepayments and accrued income 77.4 52.8
2,504.4 690.7
The amounts due from Group undertakings include intercompany current accounts and the majority of these are subject to interest. The average rate prevailing in the year was 0.31% (2014: 0.38%). The intercompany debtor is not secured on the company’s assets and is payable on demand.
120
Financial statementsGovernanceStrategic reportIntroduction
< previous next >
Contents

Financial statementsNotes to the Company Financial Statements continuedFor the year ended 31 December 2015
9. Deferred tax asset
31/12/15€m
31/12/14As restated
€m
Deferred tax 1.9 -
10. Interest bearing loans and borrowings
31/12/15€m
31/12/14As restated
€m
Bank and other loans repayable:
Current:
$50 million series A Senior notes 5.51% - 41.3
$100 million series B Senior notes 6.47% 92.1 -
$100 million series B Senior notes 5.56% 92.1 -
$132.2 million European Investment Bank financing facility 3.30% 13.6 12.1
$99 million European Investment Bank financing facility 3.15% 10.1 9.1
€100 million European Investment Bank financing facility 4.772% 7.1 7.1
€100 million European Investment Bank financing facility 3.34% 7.1 7.1
$108.6 million European Investment Bank financing facility Floating 7.1 6.4
Total current 229.2 83.1
Between 2 and 5 years:
$100 million series B Senior notes 6.47% - 82.7
$100 million series B Senior notes 5.56% - 82.7
$100 million Senior notes 5.50% 92.1 82.7
€100 million European Investment Bank financing facility 4.439% 100.0 100.0
$50 million series C Senior notes 5.66% 46.0 41.3
Greater than 5 years:
$132.2 million European Investment Bank financing facility 3.30% 94.7 97.1
$99 million European Investment Bank financing facility 3.15% 70.9 72.8
€100 million European Investment Bank financing facility 4.77% 57.1 64.3
€100 million European Investment Bank financing facility 3.34% 78.6 85.6
$108.6 million European Investment Bank financing facility Floating 85.7 83.4
Yen 20 billion Loan Agreement 6.24% 153.2 138.0
Total non-current 778.3 930.6
11. Amounts due to Group undertakings
31/12/15€m
31/12/14As restated
€m
Current liabilities 1,370.2 1,021.2
Non-current liabilities 1,755.9 381.5
3,126.1 1,402.7
Intercompany current accounts included in amounts due to Group undertakings are subject to interest. The average rate prevailing in the year was 0.31% (2014: 0.38%). The intercompany creditor is not secured on the company’s assets and is payable on demand.
URENCO Annual report and accounts 2015 121
Financial statementsGovernanceStrategic reportIntroduction
< previous next >
Contents

Financial statementsNotes to the Company Financial Statements continuedFor the year ended 31 December 2015
12. Trade and other payables
31/12/15€m
31/12/14As restated
€m
Trade payables 2.4 4.4
Amounts due to related parties 31.1 28.6
Other taxes and social security costs 0.5 1.1
Accruals 73.6 43.0
107.6 77.1
13. Derivative financial instruments
Categories of financial instruments at fair value
Amounts duewithin one year
Amounts dueafter one year
31/12/15€m
31/12/14As restated
€m31/12/15
€m
31/12/14As restated
€m
Financial assets at fair value through profit and loss
Intercompany balances – embedded forward foreign exchange contracts 83.3 44.7 114.5 63.6
Interest rate / cross currency contracts - non-hedged - 78.0 48.9 -
Forward foreign exchange contracts 21.6 9.0 28.8 16.2
Total assets measured at fair value 104.9 131.7 192.2 79.8
Financial liabilities at fair value through profit and loss
Intercompany balances – embedded forward foreign exchange contracts (21.6) (11.1) (28.8) (18.1)
Interest rate / cross currency contracts - hedged - - (8.0) -
Interest rate / cross currency contracts - non-hedged - (58.8) (81.4) (28.0)
Forward foreign exchange contracts (83.3) (50.2) (113.9) (64.3)
Total liabilities measured at fair value (104.9) (120.1) (232.1) (110.4)
The Company is exposed to certain transactional currency exposures arising from transactions made by other members of the URENCO Group. Such exposures arise from transactions in currencies other than the functional currency of the entity, mainly the US dollar and euro.
It is the policy of the Company to enter into forward foreign exchange contracts to cover specific foreign currency payments and receipts on behalf of the Group. The Company hedges the net cash flows of its European business, by selling US dollar customer revenues, buying forward sterling required to meet the costs of the UK operations and selling the remaining US dollars to buy euros. The Company reduces the impact of changes in foreign exchange rates by using a progressive rolling programme of buying and selling currencies over a period of up to six years ahead.
Under cross currency interest rate swap contracts, the Company agrees to exchange the difference between fixed interest in euro currency, into fixed interest in sterling, and from fixed interest in sterling to fixed interest in US dollars on agreed notional principal amounts. Such contracts enable the Company to mitigate the risk of changing foreign currency exchange rates on the fair value of interest payments in foreign currency, and the fair value of investments in subsidiaries at the URENCO Group level. The fair value of cross currency interest rate swaps at the reporting date is determined by discounting the future cash flows using the curves at the reporting date. The average interest rate is based on the outstanding balances at the end of the financial year.
14. Retirement benefit obligationsThe Company operates a defined benefit pension scheme and the pension cost relating to the defined benefit scheme is assessed in accordance with the advice of independent, professionally qualified actuaries using the projected unit credit method.
The valuation used for IAS19R disclosures has been based on the most recent actuarial valuation and updated by the actuaries during 2015 to take account of the requirements of IAS19R in order to assess the liabilities of the scheme at 31 December 2015. Scheme assets
are stated at their market values at the reporting dates.
122
Financial statementsGovernanceStrategic reportIntroduction
< previous next >
Contents

Financial statementsNotes to the Company Financial Statements continuedFor the year ended 31 December 2015
14. Retirement benefit obligations continued
Main assumptions:
Key financial assumptions 2015 2014
Discount rate 3.9% 3.8%
Salary increases 4.1% 4.1%
Pension increases 3.1% 3.1%
Price inflation 3.1% 3.1%
Mortality assumptions 2015 2014
Life expectancy at age 60 for a male currently aged 60 29.7 29.4
Life expectancy at age 60 for a female currently aged 60 31.8 31.2
Life expectancy at age 60 for a male currently aged 40 32.0 31.9
Life expectancy at age 60 for a female currently aged 40 34.2 33.8
The assets and liabilities of the scheme at 31 December are: Market value
2015€m
Market value2014
€m
Equities 28.6 26.9
Bonds 25.0 20.0
Total market value of scheme assets 53.6 46.9
Present value of scheme liabilities (63.0) (54.1)Pension liability (9.4) (7.2)
Movement in present value of benefit obligation2015
€m2014
€m
At 1 January (54.1) (42.9)
Current service costs (1.3) (1.2)
Past service costs (3.9) -
Interest cost (2.2) (2.1)
Actuarial gain / (loss) 1.5 (5.6)
Benefits paid to members 1.4 1.0
Contribution by members (0.1) (0.1)
Exchange difference (4.3) (3.2)
At 31 December (63.0) (54.1)
Movements in the fair value of plan assets2015
€m2014
€m
At 1 January 46.9 38.7
Interest income 1.9 1.9
Actuarial gains 1.3 2.6
Contribution by employer 2.4 1.8
Contribution by members 0.1 0.1
Benefits paid to members (1.4) (1.0)
Exchange difference 2.4 2.8
At 31 December 53.6 46.9
URENCO Annual report and accounts 2015 123
Financial statementsGovernanceStrategic reportIntroduction
< previous next >
Contents

Financial statementsNotes to the Company Financial Statements continuedFor the year ended 31 December 2015
14. Retirement benefit obligations continued
Components of pension cost2015
€m2014
€m
Current service cost (1.3) (1.2)
Interest on pension scheme liabilities (2.2) (2.1)
Interest on scheme assets 1.9 1.9
Past service costs (3. 9) -
Administrative expenses and taxes - (0.1)
Total pension cost recognised in income statement 5.5 1.5
Actuarial gains/ (losses) 2.8 (3.0)
Total pension movement recognised in the SOCI 2.8 (3.0)
2015€m
2014€m
Present value of defined benefit obligation (63.0) (54.1)
Fair value of plan assets 53.6 46.9
Recognised liability at 31 December (9.4) (7.2)
The discount rate and the inflation rate have a significant effect on the amounts reported as retirement benefit obligations. The effect of a 0.25% change in isolation in certain assumptions as at 31 December 2015 for the Company’s retirement benefit schemes would have had the effects shown in the table below.
(Increase)/ decrease in retirement benefit obligations
31 December 2015
Discount rate
Effect of increase in discount rate by +0.25% at 31 December 2015 2.0
Effect of decrease in discount rate by -0.25% at 31 December 2015 (2.1)
Inflation rate
Effect of increase in inflation rate by +0.25% at 31 December 2015 (1.9)
Effect of decrease in inflation rate by -0.25% at 31 December 2015 1.8
Experience adjustments (surplus/deficits) arise where actuarial assumptions made at a previous valuation have not been borne out in practice.
Regular contributions to the scheme from both the members and employer for the year beginning 1 January 2016 are expected to be €2.5 million in line with 2015. It is anticipated that contribution rates will continue in line with current agreements until reviewed at the next triennial valuation in 2018.
A current triennial valuation for the pension scheme commenced in 2015 and is expected to be completed in 2016. The latest valuation preliminary results show a continuing deficit and increased future costs for providing the final salary benefits. URENCO proposes to close the UK defined benefit section for further accrual from April 2017 and has had initial discussions with Trade Union officials and the Trustee Board to brief them on the proposed future strategy of the defined benefit scheme. The proposed change for most defined benefit section pension scheme members has also been communicated to the members of the UK pension scheme.
In 2008, the Company also introduced a defined contribution scheme for new employees. The total cost of defined contribution arrangements of €1.2 million (2014: €1.0 million) has been fully expensed against profits in the current year.
124
Financial statementsGovernanceStrategic reportIntroduction
< previous next >
Contents

Financial statementsNotes to the Company Financial Statements continuedFor the year ended 31 December 2015
15. Called up share capital
31/12/15€m
31/12/14€m
Authorised
Ordinary share capital, 240 million ordinary shares of £1 each:
‘A’ Ordinary Shares 113.0 113.0
‘B’ Ordinary Shares 113.0 113.0
‘C’ Ordinary Shares 113.0 113.0
339.0 339.0
Issued
Allotted, called up and fully paid, 168 million ordinary shares of £1 each:
‘A’ Ordinary shares 79.1 79.1
‘B’ Ordinary shares 79.1 79.1
‘C’ Ordinary shares 79.1 79.1
237.3 237.3
The ‘A’, ‘B’ and ‘C’ ordinary shares have identical rights.
16. Retained earnings
€m
At 31 December 2013 (As restated) 467.5
Net profit for the year 2014 648.2
Dividends paid (340.0)
Actuarial loss on retirement benefit obligation (3.0)
Deferred tax on actuarial loss 0.5
Foreign exchange translation differences (64.0)
At 31 December 2014 (As restated) 709.2
Net profit for the year 2015 426.6
Dividends paid (340.0)
Actuarial gain on retirement benefit obligation 2.8
Deferred tax on actuarial gain (0.6)
Foreign exchange translation differences (127.9)
At 31 December 2015 670.1
17. Operating lease arrangements
The Company as lessee
The Company has entered into operating leases on certain land, property, motor vehicles and items of machinery. These leases have an unweighted average life of five years based on the number of contracts and a weighted average life of seven years based on the value of the contracts. The remaining terms of the leases vary from one to ten years.
Future minimum rentals payable under non-cancellable operating leases as at 31 December are as follows:
31/12/15€m
31/12/14€m
Within one year 1.1 1.1
In the second to fifth years inclusive 3.3 3.2
After five years 0.2 0.1
4.6 4.4
URENCO Annual report and accounts 2015 125
Financial statementsGovernanceStrategic reportIntroduction
< previous next >
Contents

126
Financial statementsNotes to the Company Financial Statements continuedFor the year ended 31 December 2015
(i) These amounts are 100% of the sales/purchases and amounts due from/to the Enrichment Technology Company Limited.
The Company has taken advantage of the exemption in FRS 101 not to disclose transactions between wholly owned subsidiaries of the Group.
Enrichment Technology Company Limited is a related party due to the Group’s 50% shareholding in the joint venture. Sales of goods and services to related parties and purchases of assets, goods and services from them were made under the Group’s normal trading terms.
The amounts outstanding are unsecured and will be settled in cash. No guarantees have been given or received. No provisions have been made and no expense incurred for doubtful debts in respect of the amounts owed by related parties.
19. Contingent liabilities The Company is party to a number of composite guarantees of borrowings by certain of its subsidiaries which at the reporting date amounted to €2,550.2 million (2014: €2,505.5 million). The Directors do not expect any liability to arise under these guarantees.
20. Events after the reporting period As of 2 March 2016, no other material structural changes or business events have occurred that might serve to alter any of the disclosures contained in the 2015 financial statements.
21. Explanation of transition to FRS 101This is the first year that the Company has presented its financial statements under FRS 101 (Financial Reporting Standard 101 – Reduced Disclosure Framework) issued by the Financial Reporting Council. The following disclosures are required in the year of transition. The last financial statements under a previous GAAP (UK GAAP) were for the year ended 31 December 2014 and the date of transition to FRS 101 was therefore 1 January 2014.
18. Related party transactions At the reporting date, amounts due from subsidiary undertakings were €2,320.8 million (2014: €541.7 million) comprising current assets of €2,320.8 million (2014: €541.7 million) and long-term loans of €nil million (2014: €nil million).
At the reporting date, amounts due to subsidiary undertakings and related parties were €2,883.5 million (2014: €1,431.3 million) comprising current liabilities of €1,401.3 million (2014: €1,049.8 million) and non-current liabilities of €1,755.9 million (2014: €381.5 million).
The amounts due from and to Group undertakings include intercompany current accounts due from and to subsidiary undertakings and related parties. The majority of these are subject to interest. The average rate prevailing in the year was 0.31% (2014: 0.38%).
Transactions with the URENCO pension scheme are detailed in note 14.
Trading transactionsDuring the year, the Company entered into the following transactions with the following related party:
Sales of goods and services
Purchases of assets, goods and services
Year ended31/12/15
€m
Year ended31/12/14
€m
Year ended31/12/15
€m
Year ended31/12/14
€m
ETC(i) - - 0.3 0.5
Amounts owed by related parties
Amounts owed to related parties
Year ended31/12/15
€m
Year ended31/12/14
€m
Year ended31/12/15
€m
Year ended31/12/14
€m
ETC(i) - - 31.1 28.6
(i) These amounts are 100% of the sales/purchases and amounts due from/to the Enrichment Technology Company Limited.
Financial statementsGovernanceStrategic reportIntroduction
< previous next >
Contents

URENCO Annual report and accounts 2015 127
Financial statementsNotes to the Company Financial Statements continuedFor the year ended 31 December 2015
21. Explanation of transition to FRS 101 continued
Reconciliation of equity
At 1 January
2014€m
At 31 December 2014
€m
Equity reported under previous UK GAAP 665.4 943.9
Adjustment to equity on transition to FRS 101
1. Recognition of fair value of financial instruments and revaluation of loan balances 44.0 4.8
2. Deferred tax adjustments (4.6) (2.2)
Equity reported under FRS 101 704.8 946.5
Notes to the reconciliation of equity
The derivative financial instruments are treated differently on transition from the previous UK GAAP accounting policy to FRS 101. Under the previous UK GAAP derivative financial instruments are not recorded in the statement of financial position and only on maturity were any gains or losses recognised as income or expense. Under FRS 101 derivative financial instruments have to be recognised on the statement of financial position at fair value with any gain or loss on revaluation being recognised immediately as income or expense unless in a hedge relationship.
The recognition of fair value of financial instruments recognised at 31 December 2014 comprises forward foreign currency contracts, interest rate/ cross currency contracts and embedded derivatives in intercompany balances totalling a reduction in equity of (€19.0m) per note 13. Additionally, transition requires revaluation of the Yen 20 billion loan included in non-current liabilities at the closing exchange rate which was previously translated at historic exchange rate. Under FRS 101 the balance is reduced, resulting in an increase to equity of €23.8m relating to foreign currency exchange gains.
The retirement benefit obligation is treated differently on transition from the previous UK GAAP accounting policy to FRS 101. Under the old FRS 17, the return on scheme assets and interest expense on scheme liabilities are calculated separately and at different rates to those under IAS 19. Under IAS 19, interest income or expense is calculated on the net surplus or deficit. Consequently the net interest expense will be higher under FRS 101 which is offset by lower actuarial gains/ losses net of tax. Due to the offset there is no net impact on the overall equity position on transition.
Deferred taxation adjustments are largely in relation to recognition of unrealised gains and losses of derivatives now recognised on the statement of financial position. These gains and losses are only realised on delivery of the underlying financial instruments and therefore leads to recognition of temporary differences.
Reconciliation of total comprehensive income for the year ended 31 December 2014 Net profit
Other comprehensive
income
Total income for the financial year under previous UK GAAP 650.4 (31.9)
1. Recognition of fair value of financial instruments (4.2) -
2. Impact of change in accounting standards on deferred tax 2.4 -
3. Difference on reporting pension charges (0.4) 0.4
4. Difference on foreign exchange gains or losses - (35.0)
Total income for the financial year under FRS 101 648.2 (66.5)
Notes to the reconciliation of total comprehensive income
The derivative financial instruments are treated differently on transition from the previous UK GAAP accounting policy to FRS 101. Under the previous UK GAAP derivative financial instruments are not recorded in the statement of financial position and only on maturity were any gains or losses recognised as income or expense. Under FRS 101 derivative financial instruments have to be recognised on the statement of financial position at fair value with any gain or loss on revaluation being recognised immediately as income or expense.
Deferred taxation adjustments are largely in relation to recognition of unrealised gains and losses of derivatives now recognised on the statement of financial position. These gains and losses are only realised on delivery of the underlying financial instruments and therefore leads to recognition of temporary differences. This has an impact on total income during the year.
Foreign exchange gains and losses arise on transition to FRS 101 as the accounting for loan balances and hedging instruments designated in foreign currencies is different under FRS 101 compared to old UKGAAP. Under FRS 101 these are translated at the closing exchange rate, whereas previously, loan balances were translated at the historic exchange rate and hedging instruments were not recognised. Loan balances are not designated as part of fair value hedges and therefore any gains or losses are recognised through comprehensive income.
Financial statementsGovernanceStrategic reportIntroduction
< previous next >
Contents

128
Glossary of terms
ArevaThe French energy group.
Capital expenditurePurchases of property, plant and equipment including prepayments relating to payments to ETC in advance of contracted cascade deliveries, which will be supplied in future periods.
CascadeThe arrangement of centrifuges connected in parallel and in series is termed a “cascade”. In a uranium enrichment plant several cascades are operated in parallel to form an “operational unit” producing one U235 assay. Various operational units form one enrichment plant.
CNSCapenhurst Nuclear Services Limited. This company has taken responsibility for storage of certain uranic materials on behalf of the Nuclear Decommissioning Authority at the Capenhurst facility in the UK.
DeconversionThis is the process of removing the volatile fluorine component from uranium hexafluoride to make stable uranium oxide (U3O8). URENCO has chosen to use U3O8 as the long-term retrievable storage form of uranium.
EBITDAEarnings before interest (including other finance costs), taxation, depreciation and amortisation and joint venture results (or income from operating activities plus depreciation and amortisation, plus joint venture results).
EnrichmentThe step taken in the nuclear fuel cycle that increases the concentration of U235, relative to U238, in order to make uranium usable as a fuel for light water reactors.
Enrichment GroupA collective name for URENCO Enrichment Company Ltd and its subsidiaries namely: URENCO UK Ltd (UUK); URENCO Nederland B.V. (UNL); URENCO Deutschland GmbH (UD) and URENCO Inc (UI).
ETCEnrichment Technology Company Limited.
EuratomThe European Atomic Energy Community, established in 1957 by members of the European Union.
EUPEnriched Uranium Product, i.e. UF6 enriched, typically, to between 3% and 5% U235 content.
FeedNatural or reprocessed uranium, converted to UF6, and fed into the cascades for enrichment.
FFO/TADFFO/TAD is the ratio of funds from operations (FFO) to total adjusted debt (TAD). FFO is defined as EBITDA adjusted for interest costs, current tax expenses and operating lease and pension obligations. TAD is interest bearing loans and borrowings adjusted for cash and short-term bank deposits, operating leases, retirement benefit obligation deficit, and tails and decommissioning provisions.
Gas centrifugeGas centrifugation is a uranium enrichment process which uses the gas centrifuge to accelerate molecules so that particles of different masses are physically separated along the radius of a rotating container. This increases the concentration of the fissionable U235 isotope.
Global Reporting Initiative (GRI)The GRI is the reporting framework which provides guidance on sustainability performance reporting.
IAEA The International Atomic Energy Agency is the world’s central intergovernmental forum for scientific and technical co-operation in the nuclear field.
IASInternational Accounting Standards.
IFRSInternational Financial Reporting Standards.
Joint CommitteeThe committee of representatives of the governments of the Netherlands, the United Kingdom and Germany that oversees URENCO’s compliance with the Treaty of Almelo.
Louisiana Energy Services LLCOwner and operator for URENCO USA, 100% owned by the URENCO Group.
LTIA Lost Time Incident is any work related injury or illness which prevents that person from doing any work the day after the accident.
National Enrichment Facility (NEF)Now known as URENCO USA.
Net assetsTotal assets less total liabilities.
Net debtLoans and borrowings (current and non-current) plus obligations under finance leases less cash and cash equivalents and short-term deposits.
Net finance costsFinance costs less finance income.
Financial statementsGovernanceStrategic reportIntroduction
< previous next >
Contents

URENCO Annual report and accounts 2015 129
Glossary of terms continued
Net interestNet finance costs excluding income and costs on non-designated hedges and excluding capitalised borrowing costs.
Nuclear fuel supply chainThe multiple steps that convert uranium as it is extracted from the earth to nuclear fuel for use in power plants. Uranium enrichment is one step in the nuclear fuel supply chain.
Order book Contracted and agreed business estimated on the basis of “requirements” and “fixed commitment” contracts.
Parent CompanyURENCO Limited.
STEM The STEM education programme includes Science, Technology, Engineering and Maths
Supplier of choiceIncreasing available capacity and experience of new operating environments facilitates first class service delivery and the flexibility to meet the changing needs of our customers. This will enable URENCO to be considered the “supplier of choice” by our customers.
SWUSeparative Work Unit. The standard measure of the effort required to increase the concentration of the fissionable U235 isotope.
Tails (Depleted UF6)Uranium hexafluoride that contains a lower concentration than the natural concentration (0.711%) of the U235 isotope.
Tails Management Facility (TMF)The facility constructed and operated by URENCO ChemPlants Limited that will manage the deconversion of tails to stable uranium oxide (U3O8). Currently under construction at URENCO’s site in Capenhurst, UK, it will consist of a number of associated storage, maintenance and residue processing facilities to support URENCO’s long-term strategy for the management of tails.
Treaty of AlmeloIn the early 1970s the German, Dutch and British governments signed the Treaty of Almelo, an agreement under which the three partners would jointly develop the centrifuge process of uranium enrichment.
Treaty of CardiffIn July 2005 the German, Dutch, British and French governments signed the Treaty of Cardiff, an agreement between the four governments to supervise the collaboration between URENCO and Areva in their joint venture, ETC.
Treaty of WashingtonIn July 1992 the German, Dutch, British and United States of America governments signed the Treaty of Washington, an agreement which was required in order to permit the establishment of the National Enrichment Facility.
tSWTonnes of Separative Work.
tSW/aTonnes of Separative Work per annum.
TurnoverRevenue from the sale of goods and services.
UECURENCO Enrichment Company Limited.
UK GAAPThe Generally Accepted Accounting Practice in the UK.
Uranic MaterialNatural uranium, enriched uranium and depleted uranium.
UraniumA fairly abundant metallic element. Approximately 993 of every 1,000 uranium atoms are U238. The remaining seven atoms are U235 (0.711%), which is used in today’s nuclear power stations to generate energy by fission.
Uranium hexafluoride (UF6)All enrichment processes today work with gaseous material; therefore uranium is converted to UF6.
URENCO ChemPlants LimitedURENCO ChemPlants Limited, a subsidiary company of URENCO, is responsible for the construction and operation of the Tails Management Facility at URENCO’s site at Capenhurst,UK.
URENCO USAURENCO’S enrichment facility in New Mexico, USA, owned and operated by Louisiana Energy Services LLC.
USNRCNuclear Regulatory Commission – the Nuclear Regulator in the USA.
U235
The fissionable uranium isotope found in natural uranium.
U235 assayThe weight percentage of U235 atoms in uranium presented as a percentage of U235 atoms divided by all uranium atoms.
U238
The non-fissionable uranium isotope that makes up most of natural uranium.
U3O8
Uranium oxide, the most stable form of uranium.
Working capitalInventories, trade and other receivables, less the current portion of trade and other payables.
Financial statementsGovernanceStrategic reportIntroduction
< previous next >
Contents

Contact Listing
Registered office and Group headquarters address:
URENCO Limited URENCO Court Sefton Park Bells Hill Stoke Poges Buckinghamshire SL2 4JS United Kingdom
General enquiriesTel: +44 (0) 1753 660 660 E-mail: [email protected] Contact: Jayne Hallett – Director of Corporate Communications
Investor relationsTel: +44 (0) 1753 660 660 E-mail: [email protected] Contact: Sally Wright – Investor Relations
URENCO Enrichment Company LimitedURENCO Court Sefton Park Bells Hill Stoke Poges Buckinghamshire SL2 4JS United Kingdom
Tel: +44 (0) 1753 660 660 E-mail: [email protected] Contact: Jayne Hallett – Director of Corporate Communications
URENCO Deutschland GmbHPostfach 19 20 D – 48580 Gronau Germany
Tel: +49 (0) 2562 711 0 E-mail: [email protected] Contact: Joachim Ohnemus – Managing Director
URENCO Nederland BVPostbus 158 7600 AD Almelo The Netherlands
Tel: +31 (0) 5 46 54 54 54 E-mail: [email protected] Contact: Ad Louter – Managing Director
URENCO UK LimitedCapenhurst Cheshire CH1 6ER United Kingdom
Tel: +44 (0) 151 473 4000 E-mail: [email protected] Contact: Chris Chater – Executive Director
URENCO, Inc. and URENCO USA, Inc.1560 Wilson Boulevard, Suite 300 Arlington Virginia 22209-2463 USA
Tel: +1 (703) 682-5203 E-mail: [email protected] Contact: Kirk Schnoebelen – President and CEO
URENCO ChemPlants LimitedCapenhurst Cheshire CH1 6ER United Kingdom
Tel: +44 (0) 151 473 7400 E-mail: [email protected] Contact: Pleun Schuddebeurs– Managing / Executive Project Director
Capenhurst Nuclear Services LimitedCapenhurst Cheshire CH1 6ER United Kingdom
Tel: +44 (0) 151 473 3635 E-mail: [email protected] Contact: David Slater – Managing Director
Louisiana Energy Services, LLCPO Box 1789 Eunice New Mexico 88231 USA
Tel: +1 (505) 394 4646 Email: [email protected] Contact: David Sexton – President and CEO
Enrichment Technology Company Limited21 London End Beaconsfield Buckinghamshire HP9 2HN United Kingdom
Tel: +44 (0) 1494 687200 E-mail: [email protected] Contact: Michael Smith – Company Secretary
130
Financial statementsGovernanceStrategic reportIntroduction
< previous next >
Contents

URENCO Annual report and accounts 2015 131
Contents Financial statementsGovernanceStrategic reportIntroduction
< previous next >

www.urenco.com
URENCO LimitedURENCO CourtSefton ParkBells HillStoke PogesBuckinghamshireSL2 4JS, UK
< previous