annual report 2 015 - epson corporate segment comprises the printing systems business, visual...
TRANSCRIPT

SEIKO EPSON CORPORATION
ANNUAL REPORT 2015April 2014 - March 2015

1
Cautionary Statement
This report includes forward-looking statements that are based on management’s view from the information available at the time of the announcement. These statements are subject to various risks and uncertainties. Actual results may be materially different from those discussed in the forward-looking statements. The factors that may affect Epson include, but are not limited to, general economic conditions, the ability of Epson to continue to quickly introduce new products and services, consumption trends, competition, technology trends, and exchange rate fluctuations. In this annual report, “Epson” or the “Group” refers to the Epson Group, while “the Company” may refer to the Group or the parent company, Seiko Epson Corporation.

2
Table of Contents
Consolidated Financial Highlights ..................................................................................................... 3
Information on the Company ............................................................................................................ 7
1. Overview of the business group .................................................................................................. 7
2. Major equipment and facilities................................................................................................. 10
3. Overview of capital expenditures ............................................................................................. 13
4. Plans for new additions or disposals ......................................................................................... 14
5. Major management contracts .................................................................................................. 15
Risks Related to Epson’s Business Operations ................................................................................. 16
Business Conditions ......................................................................................................................... 22
1. Overview of business results ..................................................................................................... 22
2. Manufacturing, orders received and sales ................................................................................ 25
3. Analysis of financial condition and results of operations .......................................................... 26
4. Research and development activities ........................................................................................ 29
5. Issues for Fiscal 2015 ............................................................................................................... 31
6. Dividend policy ........................................................................................................................ 33
Corporate Governance .................................................................................................................... 34
1. Approach to corporate governance .......................................................................................... 34
2. Details of audit remuneration................................................................................................... 44
3. Basic policy regarding company control ................................................................................... 45
Management ................................................................................................................................... 47
Index to Consolidated Financial Statements .................................................................................... 49
Consolidated Statement of Financial Position .............................................................................. 50
Consolidated Statement of Comprehensive Income ...................................................................... 52
Consolidated Statement of Changes in Equity.............................................................................. 54
Consolidated Statement of Cash Flows ........................................................................................ 56
Notes to Consolidated Financial Statements ................................................................................. 57
Report of Independent Auditors ................................................................................................. 116
Additional Information .................................................................................................................. 117
1. Principal subsidiaries and affiliates ......................................................................................... 117
2. Distribution of ownership among shareholders ...................................................................... 121
3. Major shareholders ................................................................................................................ 122
4. Epson stock price ................................................................................................................... 124
5. Corporate data and investor information ............................................................................... 125

3
Consolidated Financial Highlights Seiko Epson Corporation and Subsidiaries
For the years ended March 31 IFRS
Millions of yen Thousands of U.S. dollars
2014 2015 2015 Statement of Comprehensive Income
Revenue 1,008,407 1,086,341 9,040,034
Information-related equipment business segment
841,228 907,296 7,550,105
Devices and precision products business segment
148,779 156,297 1,300,632
Sensing and industrial solutions business segment
16,174 23,396 194,690
Other 1,333 1,390 11,566
Adjustments 891 (2,038) (16,959)
Gross profit 362,589 395,924 3,294,699 Selling, general and administrative expenses (272,501) (294,648) (2,451,926)
Profit from operating activities 79,549 131,380 1,093,284
Profit before tax 77,977 132,536 1,102,904 Profit for the period attributable to owners of the parent company 84,203 112,560 936,673
Total comprehensive income for the period 120,480 145,483 1,210,643
Statement of Cash Flows Net cash provided by (used in) operating activities 114,859 108,828 905,617
Net cash provided by (used in) investing activities (41,244) (32,735) (272,405)
Free cash flows 73,615 76,093 633,212 Net cash provided by (used in) financing activities (56,567) (55,392) (460,946)
Statement of Financial Position Current assets 560,645 650,383 5,412,191 Non-current assets 348,245 355,898 2,961,629 Total assets 908,890 1,006,282 8,373,820 Current liabilities 336,087 355,442 2,957,826 Non-current liabilities 208,045 153,531 1,277,624 Equity attributable to owners of the parent company 362,371 494,325 4,113,547

4
IFRS
Millions of yen Thousands of U.S. dollars
2014 2015 2015 Per Share Data (yen and U.S. dollars) Basic earnings per share (Note 2) 235.35 314.61 2.62 Cash dividends per share (Note 4) 50.00 115.00 0.95 Equity attributable to owners of the parent company, per share (Note2) 1,012.83 1,381.66 11.50
Financial Ratios (%) Equity attributable to owners of the parent company, ratio 39.9 49.1
ROE (Profit for the period attributable to owners of the parent company/ Beginning and ending balance average equity attributable to owners of the parent company)
27.7 26.3
ROA (Profit from operating activities/ Beginning and ending balance average total assets)
9.2 13.7
ROS (Profit from operating activities/ Revenue) 7.9 12.1
Number of Employees
Information-related equipment business segment
55,104 52,010
Devices and precision products business segment 13,723 12,787
Sensing and industrial solutions business segment
1,197 1,246
Other 252 306 Corporate 2,895 3,529 Total 73,171 69,878
Notes 1. The Consolidated Financial Statements have been prepared on the basis of International Financial Reporting Standards (IFRS) from
the year ended March 31, 2014. 2. Seiko Epson Corporation (the “Company”) completed the Company’s ordinary shares split into two shares with an effective date of
April 1, 2015. Per share data are calculated under the assumption that the share splits took effect at the beginning of the year ended March 31, 2014.
3. U.S. dollar amounts have been translated from yen, for convenience only, at the rate of ¥120.17 =U.S.$1 as of March 31, 2015. 4. In this table, cash dividends per share refers to the amount paid for each share in each fiscal year. 5. Equity attributable to owners of the parent company is equity excluding non-controlling interests in subsidiaries.

5
For the years ended March 31 JGAAP Millions of yen 2010 2011 2012 2013 2014
Statements of Income Net sales 985,363 973,663 877,997 851,297 1,003,606
Information-related equipment 712,692 702,918 - - -
Electronic devices 248,001 231,235 - - -
Precision products 57,746 68,276 - - -
Other 19,714 1,279 - - -
Eliminations and corporate (52,791) (30,046) - - -
Information-related equipment business segment
- 713,936 691,801 688,029 -
Devices and precision products business segment
- 212,670 174,811 156,872 -
Other - 61,446 17,316 1,273 -
Eliminations and corporate - (14,390) (5,932) 5,122 -
Information-related equipment business segment
- - - 685,862 836,436
Devices and precision products business segment
- - - 140,790 148,956
Sensing and industrial solutions business segment
- - - 11,413 16,181
Other - - - 1,273 1,334
Eliminations and corporate - - - 11,957 699
Gross profit 259,469 262,963 248,846 234,439 322,976 Selling, general and administrative expenses
241,241 230,253 224,219 213,184 238,007
Operating income 18,227 32,709 24,626 21,255 84,968
Ordinary income 13,875 31,174 27,022 17,629 78,121 Income (loss) before income taxes and minority interests (799) 15,381 15,622 (3,479) 71,916
Net income (loss) (19,791) 10,239 5,032 (10,091) 83,698
Research and development costs 68,849 54,377 52,106 49,923 50,531
Capital expenditures 25,937 31,813 38,908 43,155 37,825
Depreciation and amortization 47,395 41,159 37,651 39,320 38,725
Net cash provided by (used in) operating activities 56,542 32,395 26,678 42,992 111,253
Net cash provided by (used in) investing activities (43,203) (23,615) (31,528) (39,511) (39,519)
Free cash flows 13,338 8,780 (4,849) 3,480 71,733 Net cash provided by (used in) financing activities (41,087) (42,691) (57,406) 21,298 (56,567)

6
JGAAP Millions of yen 2010 2011 2012 2013 2014
Balance Sheet Current assets 596,210 543,530 487,190 519,457 602,452 Property, plant and equipment (net of accumulated depreciation) 225,354 213,623 213,086 217,388 216,170
Total assets 870,090 798,229 740,769 778,547 865,872 Current liabilities 328,652 315,422 313,314 326,688 313,636 Non-current liabilities 258,574 211,999 179,314 193,052 200,505 Net assets 282,864 270,808 248,140 258,806 351,730
Number of Employees Information-related equipment 45,863 44,711 - - - Electronic devices 22,439 20,659 - - - Precision products 5,839 5,985 - - -
Information-related equipment business segment
- - 55,841 50,823 55,104
Devices and precision products business segment - - 16,101 13,859 13,723
Sensing and industrial solutions business segment
- - - - 1,197
Other 590 245 249 241 252 Corporate 3,206 2,951 3,112 3,838 2,895 Total 77,936 74,551 75,303 68,761 73,171
Per Share Data (yen and U.S. dollars) Net income (loss) (Note 1) (99.34) 51.25 26.22 (56.41) 233.94 Cash dividends (Note 3) 7.00 20.00 26.00 20.00 50.00 Shareholders’ equity (Note1) 1,407.92 1,347.71 1,377.60 1,435.20 976.41
Financial Ratios (%) Shareholders’ equity ratio 32.3 33.7 33.3 33.0 40.3 ROE (net income (loss)/average shareholders’ equity at beginning and end of year)
(6.8) 3.7 2.0 (4.0) 27.6
ROA (ordinary income/average total assets at beginning and end of year) 1.6 3.7 3.5 2.3 9.5 ROS (operating income/net sales) 1.8 3.4 2.8 2.5 8.5
Notes 1. Seiko Epson Corporation (the “Company”) completed the Company’s ordinary shares split into two shares with an effective date of
April 1, 2015. Per share data are calculated under the assumption that the share splits took effect at the beginning of the year ended March 31, 2014.
2. Ordinary income is a common item on financial statements in Japan, which is calculated by adding to or subtracting from operating income items such as interest income, rent income, interest expenses and foreign exchange gains or losses.
3. In this table, cash dividends per share refers to the amount paid for each share in each fiscal year. 4. Shareholders’ equity is net assets excluding minority interests.

7
Information on the Company 1. Overview of the business group Epson is primarily engaged in developing, manufacturing, selling, and providing services for products in four business segments: information-related equipment, devices and precision products, sensing and industrial solutions, and other. Epson is organized into operations divisions that come under consolidated management. The majority of advanced R&D and product development is conducted in Japan (by Corporate R&D and R&D organizations in the various operations divisions), while manufacturing and sales activities are conducted around the world by Epson Group manufacturing and sales companies, both in Japan and abroad. A brief description of Epson’s businesses is provided below along with a list of the main Epson Group companies involved in each segment. (1) Information-related equipment business segment This segment comprises the printing systems business, visual communications business, and others. The businesses in this segment leverage Epson’s unique Micro Piezo, a micro-display, and other technologies to develop, manufacture, and sell products. The main activities of these businesses are described below. Printing systems business This business is primarily responsible for home and office inkjet printers, page printers, and color image scanners, as well as commercial inkjet printers, serial impact dot matrix (SIDM) printers, POS system products, inkjet label printers, and related consumables. Visual communications business This business is primarily responsible for 3LCD projectors for business, education, and the home; high-temperature polysilicon TFT panels for 3LCD projectors; and label printers and smart glasses. Others In the Others business, PCs are sold in the Japanese market through a domestic subsidiary. The major Epson Group companies involved in each business of this segment are listed in the table below.
Business area Main products Main subsidiaries and affiliates
Manufacturing companies Sales companies
Printing Systems
Inkjet printers, page printers, color image scanners, commercial inkjet printers, serial impact dot matrix printers, printers for use in POS systems, inkjet label printers, related consumables and others
Tohoku Epson Corporation Akita Epson Corporation Epson Portland Inc. Epson Telford Ltd. Tianjin Epson Co., Ltd. Epson Engineering (Shenzhen) Ltd. P.T. Epson Batam P.T. Indonesia Epson Industry Epson Precision (Philippines), Inc.
Epson Sales Japan Corporation Epson America, Inc. Epson Europe B.V. Epson (U.K.) Ltd. Epson Deutschland GmbH Epson France S.A. Epson Italia s.p.a. Epson Iberica, S.A. Epson (China) Co., Ltd Epson Korea Co., Ltd. Epson Hong Kong Ltd. Epson Taiwan Technology &
Trading Ltd. Epson Singapore Pte. Ltd. Epson Australia Pty. Ltd. Epson India Pvt. Ltd.
Visual Communications
3LCD projectors, high-temperature polysilicon TFT panels for 3LCD projectors, label printers, smart glasses and others
Epson Engineering (Shenzhen) Ltd. Epson Precision (Philippines), Inc.
Others Personal computers and others - Epson Sales Japan Corporation
Epson Direct Corporation

8
(2) Devices and precision products business segment This segment comprises the micro-devices business and precision products business. These businesses leverage Epson’s traditional strengths in areas such as micromachining, low-power design, and high-density assembly to develop, manufacture and sell a variety of products. The main activities of these businesses are described below. Micro-devices business This business is primarily responsible for offering small electronic devices that are highly accurate and energy efficient. It also develops and manufactures devices to meet the needs of other businesses within the Epson Group.
Quartz device business The business mainly provides crystal units, crystal oscillators, and quartz sensors for consumer, automotive, and industrial equipment applications.
Semiconductor business This business provides CMOS LSIs and other chips mainly for consumer electronics and automotive applications.
Precision products business Based on ultra-fine and ultra-precision processing technologies, and high-density mounting technologies, this business develops and manufactures watches, and provides metal powders and surface finishing.
Watch business This business develops and manufactures Seiko brand watches and develops, manufactures and sells watch movements.
Others
Metal powder business This business develops, manufactures and sells a variety of high-performance metal powders for use as raw materials in the production of electronic components, etc. Surface finishing business This business provides high-value-added surface finishing in a wide variety of industrial fields.
The major Epson Group companies involved in each business of this segment are listed in the table below.
Business area Main products Main subsidiaries and affiliates
Manufacturing companies Sales companies
Micro-devices
[Quartz device business] Crystal units, crystal oscillators, quartz sensors and others
Miyazaki Epson Corporation Akita Epson Corporation Epson Precision Malaysia Sdn. Bhd.
Epson Electronics America, Inc. Epson Europe Electronics GmbH Epson Hong Kong Ltd. Epson Taiwan Technology &
Trading Ltd. Epson Singapore Pte. Ltd.
[Semiconductor business] CMOS LSIs and others
Tohoku Epson Corporation Singapore Epson Industrial Pte. Ltd.
Precision products
[Watch business] Watches, watch movements and others
Epson Precision (Shenzhen) Ltd. Orient Watch (Shenzhen) Ltd. Epson Precision (Johor) Sdn. Bhd.
Orient Watch Co., Ltd. Time Module (Hong Kong) Ltd.
[Others] Metal powders, surface finishing
Epson Atmix Corporation Singapore Epson Industrial Pte. Ltd.

9
(3) Sensing and industrial solutions business segment This segment uses advanced precision mechatronics and other technologies to provide industrial robots and other production systems that dramatically increase productivity. In the fields of personal health and sports, these businesses combine sensing systems that have extremely accurate built-in sensors with cloud-based services to provide products and services that improve quality of life. The major Epson Group companies involved in business of this segment are listed in the table below.
Business area Main products Main subsidiaries and affiliates
Manufacturing companies Sales companies
Sensing and industrial solutions
Industrial robots, IC handlers, industrial inkjet printing systems, sensing systems and others
Akita Epson Corporation Epson Engineering (Shenzhen) Ltd.
Epson Sales Japan Corporation Epson America, Inc. Epson Deutschland GmbH Epson (China) Co., Ltd. Epson Hong Kong Ltd.
(4) Other This segment comprises the businesses of Epson Group companies that offer services for and within the Epson Group.

10
2. Major equipment and facilities Epson’s major equipment and facilities are as follows. (1) Seiko Epson Corporation
As of March 31, 2015
Name of plant (location)
Business segment Type of facilities
Book value (Millions of yen)
Number of employees (Persons)
Buildings and structures
Machinery, equipment
and vehicles
Land (Area: m2)
Other Total
Head Office (Suwa-shi, Nagano)
Overall administration and other
Other facilities 1,484 101
1,247
(43,322)
[3,171]
102 2,936 555
Tokyo Office (Shinjuku-ku, Tokyo)
Overall administration and other
Other facilities 19 - -
(-) 1 21 36
Hirooka Office (Shiojiri-shi, Nagano)
Information-related equipment Other
Printer development and design and component manufacturing facilities Research and development facilities
17,820 11,582
5,753
(189,347)
[22,989]
2,338 37,494 4,769
Matsumoto Minami Plant (Matsumoto-shi, Nagano)
Information-related equipment
Printer development and design facilities
1,419 704
3,764
(179,759)
[1,758]
265 6,153 697
Toyoshina Plant (Azumino-shi, Nagano)
Information-related equipment Sensing and industrial solutions
3LCD projector and smart glasses development and design facilities Factory automation development, design and manufacturing facilities
1,808 948 -
(-) [108,004]
1,556 4,313 1,724
Suwa Minami Plant (Fujimi-machi, Suwa-gun, Nagano)
Information-related equipment Other
Printer components and liquid crystal panel manufacturing facilities Research and development facilities
5,329 11,163 1,443
(113,082) [28,909]
807 18,744 908
Chitose Plant (Chitose-shi, Hokkaido)
Information-related equipment
Liquid crystal panel manufacturing facilities
2,082 904 1,375
(160,528) 777 5,140 201
Ina Plant (Minowa-machi, Kamiina-gun, Nagano)
Devices and precision products
Crystal device development and design facilities
2,197 1,454 129
(39,943) [1,502]
163 3,945 478
Fujimi Plant (Fujimi-machi, Suwa-gun, Nagano)
Devices and precision products Sensing and industrial solutions Other
Semiconductor and sensing systems development and design facilities Research and development facilities
7,872 1,355 1,996
(247,143) 731 11,956 1,045
Sakata Plant (Sakata-shi, Yamagata)
Devices and precision products
Semiconductor manufacturing facilities Other
5,918 3,578 2,177
(538,828) 729 12,404 91
Hino Office (Hino-shi, Tokyo)
Devices and precision products
Sales facilities 3,022 1 8,346
(40,725) 24 11,394 218

11
Name of plant (location)
Business segment Type of facilities
Book value (Millions of yen)
Number of employees (Persons)
Buildings and structures
Machinery, equipment
and vehicles
Land (Area: m2)
Other Total
Shiojiri Plant (Shiojiri-shi, Nagano)
Devices and precision products
Watch manufacturing facilities 1,669 2,356 1,047
(41,836) [5,764]
380 5,454 656
(2) Domestic subsidiaries
As of March 31, 2015
Company name (location)
Business segment Type of facilities
Book value (Millions of yen) Number of employees (Persons)
Buildings and structures
Machinery, equipment
and vehicles
Land (Area:
m2) Other Total
Tohoku Epson Corporation (Sakata-shi, Yamagata)
Information-related equipment Devices and precision products
Printer component and semiconductor manufacturing facilities
2 6 -
(-) 730 739 2,076
Akita Epson Corporation (Yuzawa-shi, Akita)
Information-related equipment Devices and precision products Sensing and industrial solutions
Printer component, crystal device, and sensing system manufacturing facilities
1,714 148 650
(65,436) 339 2,852 851
Epson Atmix Corporation (Hachinohe-shi, Aomori)
Devices and precision products
Manufacturing facilities for metal powders, etc.
2,640 1,719 209
(20,495) [34,208]
131 4,701 196
(3) Overseas subsidiaries
As of March 31, 2015
Company name (location)
Business segment Type of facilities
Book value (Millions of yen) Number of employees (Persons)
Buildings and structures
Machinery, equipment and
vehicles
Land (Area:
m2) Other Total
Epson Engineering (Shenzhen) Ltd. (Shenzhen, China)
Information-related equipment Sensing and industrial solutions
Printer, 3LCD projector, liquid crystal panel and factory automation manufacturing facilities
3,395 3,349
-
(-)
[64,104]
4,157 10,902 10,449
Singapore Epson Industrial Pte. Ltd. (Singapore)
Information-related equipment Devices and precision products
Printer consumables, semiconductor, and watch manufacturing facilities and surface finishing facilities
3,822 7,720
66
(41,065)
[50,276]
1,047 12,657 5,687
P.T. Indonesia EpsonIndustry
(Bekasi, Indonesia)
Information-related equipment
Printer manufacturing facilities 3,505 4,629
-
(-)
[254,871]
4,684 12,819 8,754

12
Company name (location)
Business segment Type of facilities
Book value (Millions of yen) Number of employees (Persons)
Buildings and structures
Machinery, equipment and
vehicles
Land (Area:
m2) Other Total
Epson Precision (Philippines), Inc. (Lipa, Philippines)
Information-related equipment
Printer and 3LCD projector manufacturing facilities
8,709 3,150
621
(100,000)
[130,000]
3,152 15,633 8,946
Epson Precision Malaysia Sdn. Bhd. (Kuala Lumpur, Malaysia)
Devices and precision products
Crystal device manufacturing facilities
555 3,471 379
(32,437) 36 4,443 2,107
Notes 1. The above figures do not include consumption tax. 2. “Other” under the book value column includes tools, furniture and fixtures and other property, plant and
equipment, but does not include construction in progress. 3. Portions of land are leased from companies not included in consolidated accounts. The size of each area of
leased land is indicated in brackets [ ]. 4. Tohoku Epson Corporation uses a portion of the facilities of the Sakata Plant. 5. Figures for Singapore Epson Industrial Pte. Ltd. and Epson Precision (Philippines), Inc., are included in
consolidated business results. 6. The above book value amounts are after adjustments for consolidated accounts.

13
3. Overview of capital expenditures Capital expenditures for the consolidated fiscal year under review were concentrated in key strategic areas, primarily new products and rationalizing, upgrading and maintaining equipment and facilities to help foster the development of new businesses and prepare for future growth. In addition, Epson continued to carefully select investments and efficiently utilize existing facilities in an effort to generate stable cash flow. As a result of these efforts, total capital expenditures (including property, plant and equipment, software and lease rights) amounted to ¥45.4 billion. No equipment with significant impact on production capacity was sold or removed. Capital expenditures in each business segment are discussed below. Information-related equipment segment Investment used for commercializing new products such as printers and 3LCD projectors, etc., and for rationalizing, upgrading and maintaining equipment and facilities amounted to ¥30.1 billion in the fiscal year under review. Devices and precision products segment Investment used for commercializing new products such as crystal devices and watches, etc., and for rationalizing, upgrading and maintaining equipment and facilities amounted to ¥7.7 billion in the fiscal year under review. Sensing and industrial solutions segment Investment used for commercializing new products such as factory automation systems and sensing systems and for rationalizing, upgrading and maintaining equipment and facilities amounted to ¥1.1 billion in the fiscal year under review. Other and overall Investment in R&D and other activities amounted to ¥6.3 billion in the fiscal year under review.

14
4. Plans for new additions or disposals Epson plans to allocate ¥70.0 billion to capital expenditures for the consolidated fiscal year ending March 31, 2016. The business segmentation method has been changed effective from the consolidated fiscal year ending March 31, 2016.
Business segment Planned amount of capital expenditures
(100 million yen) Main type and purpose of equipment and facilities
Printing solutions 320 Commercializing new products; rationalizing, upgrading and maintaining equipment and facilities, etc.
Visual communications 90 Commercializing new products; rationalizing, upgrading and
maintaining equipment and facilities, etc. Wearable & Industrial products 90 Commercializing new products; rationalizing, upgrading and
maintaining equipment and facilities, etc.
Other and overall 200 Increase of production capacity, investment in research and development, etc.
Total 700 –
Notes 1. The above amounts do not include consumption tax. 2. Required funds will be covered by current funds in hand. 3. There are no plans to dispose of or sell major equipment and facilities with the exception of disposals and
sales associated with regular and ongoing upkeep of equipment and facilities.

15
5. Major management contracts Reciprocal technical assistance agreements
Name of contracting company
Name of other party Country Type of contract Contract period
Seiko Epson Corporation
Hewlett-Packard Company U.S.A. License to use patents relating to information-related equipment
May 1, 2012 until the expiry of the patents
Seiko Epson Corporation
International Business Machines Corporation
U.S.A. License to use patents relating to information-related equipment
April 1, 2006 until the expiry of the patents
Seiko Epson Corporation
Microsoft Corporation U.S.A. License to use patents relating to information-related equipment and software used by such equipment
September 29, 2006 until the expiry of the patents
Seiko Epson Corporation
Eastman Kodak Company U.S.A. License to use patents relating to
information-related equipment October 1, 2006 until the expiry of the patents
Seiko Epson Corporation
Xerox Corporation
U.S.A.
License to use patents relating to electrophotography and inkjet printers
March 31, 2008 until the expiry of the patents
Seiko Epson Corporation
Texas Instruments Incorporated
U.S.A.
License to use patents relating to semiconductors and information-related equipment
April 1, 2008 until March 31, 2018
Seiko Epson Corporation
Canon Incorporated Japan License to use patents relating to information-related equipment
August 22, 2008 until the expiry of the patents
16
Risks Related to Epson’s Business Operations At present, we have identified the following significant factors as risks that could have a materially adverse effect on our future business, financial condition or operating results and that should thus be taken into account by investors. There may be other risk factors of which we are unaware at this time. We strive to recognize, prevent, and control potential risks and to address risks that materialize. Also, all forward-looking statements hereunder were made at Epson’s discretion as of the date this Annual Report was submitted. 1. Our financial performance could be adversely affected by fluctuations in printer sales. The ¥907.2 billion in revenue in the information-related equipment segment in the year ended March 31, 2015 accounted for more than 80% of Epson’s consolidated revenue of ¥1,086.3 billion. Inkjet printers (including printer consumables) for the home, emerging markets, as well as for office, commercial, and industrial applications accounted for a large majority of our revenue and profit. Consequently, a decrease in revenue from printers and printer consumables could have a materially adverse effect on our operating results. 2. Our financial performance could be adversely affected by competition. Adverse effects of competition on sales All of our products, including our core printer and projector products, are subject to the effects of vigorous competition, which could cause, among other things, prices to fall, demand to shift toward lower-priced products, and unit shipments to decline. We are taking strategic action to address the risk of such declines in prices and unit shipments. On one hand, we must provide products tailored to customer needs in each market along with high-value products and services. On the other hand, we must reduce manufacturing costs by increasing design and development efficiency and by reducing fixed costs. However, there is no assurance we will succeed in these efforts, and if we are unable effectively to counteract downward pressure on prices, our operating results could be adversely affected. Adverse effects of competition on technology Some of the products that we sell contain technology that places Epson in competition against other companies. For example: - The Micro Piezo technology1 that we use in our inkjet printers competes with the thermal inkjet
technologies2 of other companies; - The 3LCD technology3 that we use in our projectors competes with other companies’ DLP technologies4. We believe that the technologies we use in these products are superior to the alternative technologies of other companies. However, if consumer opinion with respect to our technologies changes, or if other revolutionary technologies appear on the market and compete with our technologies, we could lose our competitive advantage and our operating results could be adversely affected.
1Micro Piezo technology is an inkjet technology created by Epson that manipulates piezoelectric elements to fire small droplets of ink from nozzles.
2Thermal inkjet technology (also known as bubble-jet technology) is a printer technology in which the ink is heated to create bubbles and the pressure from the bubbles is used to fire the ink.
33LCD technology uses high-temperature polysilicon TFT liquid-crystal panels as light valves. The light from the light source is divided into the three primary colors (red, blue and green) using special mirrors, the picture is created on separate LCDs for each color, and then the picture is recombined without loss and projected on the screen.
4DLP technology uses a digital micro-mirror device (DMD) as a display device. A DMD is a semiconductor on which a large number of micro mirrors are arranged, each mirror directing light onto its own individual pixel. An image is formed by the light from the light source being reflected from the mirrors onto the screen. DLP and DMD are registered trademarks of Texas Instruments Incorporated.
The emergence of new competitors We presently face competition from powerful companies that have advanced technological capabilities, abundant financial resources, or strong financial compositions. We also face competition from companies around the world that have market recognition, strong supply capacities, or the ability to compete on price. There is, therefore, a possibility that other companies could use their brand power, technological strength,

17
ability to procure funds, marketing power, sales skills, low-cost production ability, or other advantages to enter business areas where we are active. 3. Sudden changes in the business environment could affect Epson. We are laying a strong foundation to achieve sustained growth by concentrating our management resources on the four areas of printing, visual communications, quality of life, and manufacturing, as we believe these are areas that promise future growth and where we can leverage our unique strengths. To achieve sustained growth, we are executing strategies based on a long-range vision and a mid-range business plan. Since we consider technological advantage to be a critical component of competitive strength, we are driving advances in our unique core technologies, including Micro Piezo printheads, micro-displays, sensing systems, and robots, all of which originated from the compact, energy-saving, high-precision technologies that have been Epson’s unique strengths since the Company was founded. By driving advances and combining these technologies to create platforms, we are developing and manufacturing products and providing services that meet the needs of our customers. However, the pace of technological change is generally rapid and product life cycles are usually short in the product markets in which we are focusing our management resources. In addition, demand and capital expenditure trends in Epson’s main markets move in tandem with the global economy and could hurt demand for Epson’s products, and there is no guarantee that the mid-range plan and business strategies we are pursuing will be successful. We must understand the needs of markets and customers, and we must invest and conduct research and development from a medium- and long-range perspective based on product market forecasts. We must also pursue a strategy of creating development and design platforms that enable us to transition quickly and smoothly from existing products to new products. If we are unable to adequately adapt to changes in market needs and technological innovations, or if economic downturns or other factors cause demand to fall and prevent a recovery, or if we are unable to adequately accommodate sudden changes in demand in our main markets, our operating results could be adversely affected. 4. Our revenue and earnings could be adversely impacted by sales of third-party inkjet printer
consumables. Ink cartridges, which comprise the bulk of consumables sold for inkjet printers, are an important source of revenue and profit for Epson. However, third parties also supply ink cartridges and other inkjet printer consumables that can be used in Epson printers. These alternative products are typically sold for less than genuine Epson brand consumables and are more prevalent in emerging markets compared to the markets of developed countries. To counter sales of third-party consumables for inkjet printers, we must emphasize the quality of genuine Epson products and must look to continuously realize customer value by further enhancing customer convenience with inkjet printers tailored to the needs of customers in each market. Printer models equipped with high-capacity ink tanks are an example of such products. We also take legal measures if any of the patent rights or trademark rights we hold over our ink cartridges are infringed upon. However, there is no assurance that any of these efforts will be effective, and if our ink cartridge revenue declines because unit shipments of Epson brand ink cartridges shrink as sales of alternative products expand and as we lose market share, or if we must lower the prices of Epson brand products to stay competitive, our operating results could be adversely affected. 5. Expanding businesses overseas entails risks for Epson. We continue to expand our businesses overseas, and overseas revenue accounted for more than 70% of our consolidated revenue for the business year ended March 31, 2015. We have production sites all over Asia, including China, Indonesia, Singapore, Malaysia and the Philippines, as well as in the United States, the United Kingdom, and other countries. We have also established many sales companies all over the world. As of the end of March 31, 2015, our overseas employees accounted for more than 70% of our total workforce. We believe that our global presence provides many advantages. For example, it enables us to undertake marketing activities aligned with the market needs of individual regions. It also makes us cost-competitive by reducing manufacturing costs and lead times. There are, however, unavoidable risks associated with overseas manufacturing and sales operations. These include but are not limited to changes in national laws, ordinances,
18
or regulations related to manufacturing and sales; social, political or economic changes; transport delays; damage to infrastructure (e.g., power supply); currency exchange restrictions; insufficient skilled labor; changes in regional labor environments; changes in taxes, regulations or the like protective of trade; and laws, ordinances, regulations or the like related to the import and export of Epson products. 6. Procuring products from certain suppliers entails risks for Epson. We procure some parts and materials from third parties, but we generally conduct ongoing transactions without entering into long-term purchase agreements. We try to multi-source parts and materials. However, certain parts and materials are procured from a single source because procuring them from an alternative supplier is not possible. We must have procurement operations that are stable and efficient, so we work with our suppliers to maintain product quality, improve products, and reduce costs. However, if our manufacturing and sales activities were to be disrupted due to things such as supplier parts shortages or supplier quality problems, our operating results could adversely be affected. 7. Problems could arise relating to quality issues. The existence of quality guarantees on Epson products and the details of those guarantees differ from one customer account to another, depending on the agreement we have entered into with them. If an Epson product is defective or does not conform to the required standard, it may have to be replaced or repaired or otherwise reworked at Epson’s expense. Or, if the product causes personal injury or property damage, we could bear product liability or hold other liability. We could also be held liable to a customer and could incur expenses for repairs or corrections on the grounds that we did not adequately display or explain an Epson product’s features or performance. Furthermore, product quality problems could cause loss of trust in Epson products, and we could lose major accounts or see a drop in demand for our products, any of which might adversely affect our operating results. 8. Epson’s intellectual property rights activities expose Epson to certain risks. Patent rights and other intellectual property rights are extremely important for maintaining our competitiveness. We have independently developed many of the technologies we need, and we acquire patent rights, trademark rights, and other forms of intellectual property rights for them. We also license the intellectual property rights for products and technologies. We must strengthen our intellectual property portfolio by placing personnel in key positions to manage our intellectual property. If any of the following situations relating to intellectual property were to occur, our operating results could adversely be affected. - An objection might be raised to, or an application to invalidate might be filed with respect to, an intellectual
property right of Epson, and as a result, that right might be recognized as invalid. - A third party to whom we originally had not granted a license could come to possess a license as a result of a
merger with or acquisition by another party, potentially causing us to lose the competitive advantage conferred by that intellectual property.
- New restrictions could be imposed on an Epson business as a result of a buyout or a merger with a third party, and we could be forced to spend money to find a solution to those restrictions.
- Intellectual property rights that we hold might not give us a competitive advantage, or we might not be able to use them effectively.
- We or any of our customers could be accused by a third party of infringing on intellectual property rights, which could force us to spend a large amount of time and money to resolve this and associated issues, or which could interfere with our efforts to focus our management resources.
- If a third-party’s claim of intellectual property right infringement were to be upheld, we could incur material damage if required to pay large amounts in compensation or royalties or if forced to stop using the applicable technology.
- A suit could be brought against Epson by an employee or other person seeking remuneration for an invention or the like, potentially forcing us to spend significant time and money to resolve the issue and, depending on the outcome, potentially requiring us to pay a large sum as remuneration.
9. Epson is vulnerable to risks of problems arising relating to the environment. Epson is subject, both in Japan and overseas, to various environmental regulations concerning industrial waste and emissions into the atmosphere that arise from manufacturing processes. Environmental conservation is one

19
of our most important management policies, and we proactively engage in environmental conservation efforts on a variety of fronts, in line with “Environmental Vision 2050” and our mid-range action plans. For example, we have programs to develop and manufacture products that have a small environmental footprint. We also have programs to reduce energy use, promote the recovery and recycling of end-of-life products, ensure compliance with international substance regulations (primarily the RoHS Directive and REACH regulations in the EU), and improve environmental management systems. Thanks to these efforts, we have not had any serious environmental issues to date. In the future, however, it is possible that an environmental problem could arise that would require us to pay damages and/or fines, bear costs for cleanup, or force a halt of production. Moreover, new regulations could be enacted that would require major expenditures, and, if such a situation should occur, Epson’s operating results could be adversely affected. 10. Epson faces risks concerning the hiring and retention of personnel. We must hire and retain talented personnel both in Japan and overseas to develop advanced new technologies and manufacture advanced new products, but the competition for such personnel is becoming increasingly intense. We must hire and retain talented personnel by, for example, introducing compensation and benefit packages that are commensurate with roles and by proactively promoting people with the right skills overseas. If we are unable to continue to hire and keep enough of such employees, or if we are unable to pass along technologies and skills, we could find it difficult or impossible to execute our business plans. 11. Fluctuations in foreign currency exchanges create risks for Epson. A significant portion of our revenue is denominated in U.S. dollars or the euro. We expanded our overseas procurement and moved our production sites overseas, causing our dollar-denominated expenses to rise, and although our dollar-denominated revenue and expenses are more or less counterbalanced, our euro-denominated revenue is still greater than our euro-denominated expenses. Also, although we use currency forwards and other means to hedge against the risks inherent in foreign currency exchanges, unfavorable movements in the exchange rates of foreign currencies such as the U.S. dollar or euro against the yen could adversely affect our financial situation and financial results. 12. There are risks inherent in pension systems. We have a defined-benefit pension plan and a lump-sum payment on retirement as defined-benefit plans. We revised the defined-benefit retirement pension plan in April 2014 in response to a drop in the rate of return on pension assets and an increase in the number of beneficiaries. The revisions are designed to enable us to adapt to future market changes and maintain stable operations into the future. However, if there is a change in the operating results of the pension assets or in the ratio used as the basis for calculating retirement allowance liabilities, our financial position and operating results could be adversely affected. 13. Epson is vulnerable to proceedings relating to antitrust laws and regulations. With business operations that span the globe, Epson is subject in Japan and overseas to proceedings relating to antitrust laws and regulations, such as those prohibiting private monopolies and those protecting fair trade. Overseas authorities sometimes investigate or gather information on certain industries and, in conjunction with this, Epson’s market conditions and sales methods may come under investigation. Such investigations and proceedings, or violations of applicable statutes, could interfere with our sales activities. They could also potentially damage Epson’s credibility or result in a large civil fine. Any of these could adversely affect our operating results. Seiko Epson and certain of its consolidated subsidiaries are currently under investigation by the European Commission and other anti-trust law regulatory authorities regarding allegations of involvement in a liquid crystal display price-fixing cartel. It is difficult at this time to predict the outcome of these investigations and when they may be settled. 14. Epson is at risk of material legal actions being brought against it. Epson conducts businesses internationally. We are engaged primarily in the development, manufacture and sale of printing solutions, visual communications equipment, and wearable and industrial products, as well as the provision of services related thereto. Given the nature of these businesses, there is a possibility that an action could be brought or legal proceedings could be started against Epson regarding, for example, intellectual property rights, product liability, antitrust laws or environmental regulations.

20
As of the date we submitted our Annual Securities Report, Epson was contending with the following material actions. In Germany, the organization for collecting copyright fees on behalf of copyright holders, Verwertungsgesellschaft Wort (“VG Wort”), has brought a series of legal actions seeking payment of copyright fees against importers and vendors of PCs, printers and other digital equipment that is capable of reproducing copyrighted works. In January 2004, VG Wort brought a civil action against Epson Deutschland GmbH (“EDG”), a consolidated subsidiary of Seiko Epson, to seek payment of copyright fees on single-function printers. The court initially ruled that single-function printers are subject to a copyright fee and decreed that EDG pay the fee at a rate of between 10 to 256.70 euros per printer depending on the printer’s printable pages per minute. However, the claim was dismissed by the appeals court and the Supreme Court. The plaintiff, however, unsatisfied with this ruling, appealed to the Federal Constitutional Court of Germany. In December 2010, the Federal Constitutional Court ruled that the August 2008 ruling of the Supreme Court violates rights set forth in Article 14 of the constitutional law of Germany. It thus dismissed the ruling of the Supreme Court and referred the case back to the Supreme Court for review. Then, in July 2011, the Supreme Court referred the case to the Court of Justice of the European Union, and an inquiry was begun in October 2012, but in June 2013 the Court of Justice of the European Union issued a ruling that would allow EU member states to impose copyright fees on printer and PC manufacturers. In response to this ruling, the Supreme Court, in July 2014, also ruled that printers and PCs are subject to copyright fees, and the high court began an appellate review of specific copyright fees. Companies in general, including Epson, and industry organizations are showing a willingness to take a stance against the expansion of the scope of such copyright fees. In June 2010, Epson Europe B.V. (“EEB”), a consolidated subsidiary of Seiko Epson, brought a civil suit against La SCRL Reprobel (“Reprobel”), a Belgium-based group that collects copyright royalties, seeking restitution for copyright royalties for multifunction printers. With Reprobel subsequently filing a suit against EEB, the two lawsuits were adjoined. EEB’s claims were rejected at the first trial, but EEB, dissatisfied with the decision, intends to appeal. Apart from this, civil actions have been brought against Epson and certain of our consolidated subsidiaries by customers in the United States, regarding allegations of involvement in a liquid crystal display price-fixing cartel. It is difficult at this time to predict the outcome of these civil actions and when they may be settled, but our operating results and future business could be affected, depending on the outcomes of suits and legal proceedings. 15. Epson is vulnerable to certain risks in internal control over financial reporting. We are building and using internal controls to ensure the reliability of financial reporting. With the establishment and operation of internal controls for financial reporting high on our list of important management issues, we have been pursuing a Groupwide effort to audit and improve corporate oversight of our Group companies. However, since there is no assurance that we will be able to establish and operate an effective internal control system on a continuous basis, and since there are inherent limitations to internal control systems, if the internal controls that Epson implements fail to function effectively, or if there are deficiencies in internal control over financial reporting or material weaknesses in the internal controls, it might adversely affect the reliability of our financial reporting. 16. Epson is vulnerable to risks inherent in its tie-ups with other companies. One of our business strategy options is to enter into business tie-ups with other companies. However, the parties may review the arrangements of tie-ups, and there is a possibility that tie-ups could be dissolved or be subject to changes. There is also no assurance that the business strategy of tie-ups will succeed or contribute to our operating results exactly as expected. 17. Epson could be severely affected in the event of a natural or other disaster. We have research and development, procurement, manufacturing, logistics, sales and service sites around the globe, and our operating results could be adversely affected by any number of unpredictable events, including but not limited to natural disasters, pandemics involving new strains of the influenza virus, infection by computer viruses, leaks or theft of customer data, failures of mission-critical internal IT systems, supply chain disruptions, and acts of terrorism or war.

21
The central region of Nagano Prefecture, home to some of our key plants and offices, has numerous cities and towns designated as “Areas Requiring Enhanced Measures to Respond to Disasters” due to the high risk of a large-scale disaster in the event of an earthquake in the Tokai region. Moreover, an active fault line traces the Itoigawa–Shizuoka geotectonic line through the middle of the Nagano Prefecture region. We revised our earthquake-response policy after the new designation of Areas Requiring Enhanced Measures to Respond to Disasters in April 2002, and we planned disaster drills, prepared earthquake disaster management and response plans, and established business continuity plans to mitigate the effects of disasters to the extent possible. However, if a major earthquake occurs in the central Nagano Prefecture region, it is possible that, despite these countermeasures, the effect on Epson could be extreme. Although Epson is insured against losses arising from earthquakes, the scope of indemnification is limited. 18. Laws, regulations, or licenses and the like pose risks for Epson. Epson is a multinational corporation with a variety of business operations around the globe. We ensure compliance with the laws and regulations of the countries in which we operate by building a robust compliance framework in each country and each business and by communicating the nature and importance of compliance requirements internally. To expand our businesses in the future, we must strengthen our sales and marketing activities that target new customers, including public institutions, and we must develop new areas, such as the health and medical markets, where legal, regulatory, and compliance requirements are extremely strict. Compliance remains high on our list of important management issues, and we are developing measures to prevent and control potential issues as appropriate. However, if we were to violate or potentially violate laws and regulations relating to, among others, corruption, advertising and labeling, personal data and privacy protection, or if the authorities were to introduce stricter laws and regulations or impose more stringent laws, we could see our credibility damaged, could become subject to the imposition of a large civil fine, could see constraints placed on our business activities, or could see the costs of complying with such laws and regulations increase. Any of the foregoing could adversely affect our financial performance and future business development.

22
Business Conditions 1. Overview of business results (1) Operating results On the whole, the global economy continued its gradual recovery during the year under review. Regionally, the U.S. economy continued to expand, with strong consumer spending and solid job growth. The European economy as a whole continues to pick up, but elements of uncertainty, such as a recession in Russia and the rekindling of fiscal problems, remain. China’s growth rate slowed. However, the Indian economy picked up, and the economies of ASEAN countries also continued to gradually recover. Although a temporary dip was seen following a hike in the consumption tax, the Japanese economy continued to gradually recover on the whole, largely due to an improved export environment owing to the weaker yen, the effects of government economic measures, and lower crude oil prices. The main markets for the products of the Epson Group (“Epson”) fared as follows. Demand for inkjet printers remained firm in Europe but contracted in Japan compared to last year due to delayed recovery in consumer spending following the consumption tax hike. Demand also decreased slightly in North America. Demand for large-format printers decreased somewhat in Japan but moved sideways in Europe and remained firm in the United States. Demand for serial-impact dot-matrix (SIDM) printers is slipping in the Americas and Europe, and is now on a downward trend in China, where demand for SIDM printers used in tax collection systems has temporarily run its course. Demand for point-of-sale (POS) system products was similar to that in the same period last year in both the Americas and Europe. Demand for projectors was firm thanks largely to growth in the Americas and Asia, where the FIFA World Cup helped drive unit sales higher in the first half of the year. In the main markets for Epson's electronic devices demand was mixed. While demand for feature phones continued to decelerate, there was firm demand for smartphones. Digital camera market demand was sluggish. In the precision products market, Japanese demand for watches temporarily contracted, particularly for premium models, following a run-up in sales prior to the increase in the consumption tax, but demand has gradually recovered in the latter part of the period. Markets were solid in the Americas and Europe. Industrial robot demand increased in the smartphone and automotive sectors, while demand for IC handlers was also firm. Given the foregoing market conditions, Epson established the SE15 Updated Mid-Range Business Plan (FY2013–FY2015), in March 2013. Under the updated three-year plan, we have maintained the basic strategic course charted by the SE15 Long-Range Corporate Vision. The basic strategy has been to manage our businesses so that they create steady profit while avoiding the single-minded pursuit of revenue growth. Our top priority has been steady profit and cash flow. To achieve this in the existing segments, we have been readjusting our product mixes and adopting new business models. Meanwhile, we have been aggressively developing markets in new segments. The average exchange rates of the yen against the U.S. dollar and of the yen against the euro during the year under review were ¥109.93 and ¥138.77, respectively. This represents 10% depreciation in the value of the yen against the dollar and 3% depreciation in the value of the yen against the euro, year over year. The foregoing factors are reflected in our consolidated financial results for the 2014 fiscal year, the second year of our updated business plan. Revenue was ¥1,086.3 billion ($9,040,034 thousand), up 7.7% year over year. Business profit was ¥101.2 billion ($842,773 thousand), up 12.4% year over year. Profit from operating activities was ¥131.3 billion ($1,093,284 thousand), up 65.2% year over year. Profit before tax was ¥132.5 billion ($1,102,904 thousand), up 70% year over year. Profit for the period was ¥112.7 billion ($938,545 thousand), up 33.6% year over year. (Note) Business profit is calculated by subtracting Cost of sales and Selling, general and administrative expenses from Revenue. A breakdown of the financial results in each reporting segment is as follows.

23
Information-Related Equipment Business Segment Printing systems revenue increased, helped in part by foreign exchange effects. We succeeded in sharply expanding inkjet printer revenue despite a decline in ink cartridge printer shipments because a reinforced lineup of printers with high-capacity ink tanks had strong sales especially in emerging markets. We also reinforced our business inkjet printer lineup for a resolute entry into the business market. At the same time, we launched a managed print services business in Japan. Under this new business model, customers pay a flat fee for a package that includes printer, ink, and maintenance service. In addition, revenue from consumables also rose due to an improved composition of the install base. In large-format inkjet printers we saw ongoing firm demand in the large-photo and color calibration (proofing) markets. In the professional photo market we increased revenue by launching compact, high-performance new models. In the inkjet textile printing market, the range of applications expanded to encompass everything from apparel to small personal items and interior goods. Meanwhile, we expanded the territories where we sell direct-to-garment printers to capture opportunities created by a rise in demand for custom and original T-shirts. Page printer revenue decreased due to a decline in unit shipments, the result of Epson’s focus on selling high-added-value models. SIDM printer revenue was flat year over year because the effects of a temporary lull in demand in China and a decline in unit shipments in the Americas and Europe were offset by foreign exchange effects and increased sales of low-priced models in Asia. POS system product revenue increased because of unit shipment growth in Europe and expanded sales of label printers for on-demand, in-house printing. Visual communications revenue increased, owing in part to foreign exchange effects. 3LCD projector revenue grew sharply in the Americas and Asia. This growth was the result of an expanded and improved lineup of high-performance products, the special demand generated by the FIFA World Cup, and increased sales in the education market. Segment profit in the information-related equipment segment increased due to a combination of revenue growth from major products and foreign exchange effects. As a result of the foregoing factors, revenue in the information-related equipment segment was ¥907.2 billion ($7,550,105 thousand), up 7.9% year over year. Segment profit was ¥133.6 billion ($1,112,299 thousand), up 8.0% year over year. Devices and Precision Products Business Segment Revenue in the micro-devices business increased, in part due to foreign exchange effects. Crystal device revenue fell due to ongoing price erosion in the markets for AT-cut crystal and tuning-fork crystal products. Semiconductor revenue increased due to growth in internal demand and external sales, including silicon foundry orders. Precision products revenue increased owing to factors such as increased sales of premium watches, which lifted average selling prices, and foreign exchange effects. Segment profit in the devices and precision products segment increased, in part due to revenue gains resulting from foreign exchange effects. As a result of the foregoing factors, revenue in the devices and precision products segment was ¥156.2 billion ($1,300,632 thousand), up 5.1% year over year. Segment profit was ¥14.8 billion ($123,508 thousand), up 36.7% year over year. Sensing and Industrial Solutions Business Segment Revenue in the sensing and industrial solutions segment increased. In factory automation systems, industrial robot net sales grew on increased orders from Asia, while IC handler net sales grew on increased orders from manufacturers of semiconductors for smartphones. Segment profit in the sensing and industrial solutions segment increased primarily due to increased revenue from sales of industrial robots. As a result of the foregoing factors, revenue in the sensing and industrial solutions segment was ¥23.3 billion ($194,690 thousand), up 44.6% year over year. Segment loss was ¥9.0 billion ($75,193 thousand), compared to a segment loss of ¥9.9 billion in the same period last year. The loss in this new segment comprises strategic investment and up-front expenses for development of new products and markets. We will continue to work to strengthen this segment, which we see as a key area in which we can leverage our strengths to deliver innovative products and services.

24
Other Other revenue was ¥1.3 billion ($11,566 thousand), up 4.2% year over year. Segment loss was ¥0.3 billion ($2,646 thousand), compared to a ¥0.2 billion segment loss last year. Adjustments Adjustments to the total profit of reporting segments amounted to negative ¥37.8 billion ($315,195 thousand). (Adjustments in the previous fiscal year were negative ¥34.3 billion.) The loss mainly comprises selling, general and administrative expenses for areas that do not correspond to the reporting segments, such as research and development expenses for new businesses and basic technology, and general corporate expenses. (2) Cash flow performance Net cash provided by operating activities during the year was ¥108.8 billion ($905,617 thousand), compared to ¥114.8 billion in the previous fiscal year. Although depreciation and amortization totaling ¥44.9 billion versus ¥112.7 billion in profit for the period added to net cash, a ¥25.3 billion decrease in net defined benefit liabilities and a ¥19.2 billion increase in inventories contributed to the decrease in net cash from operating activities. Net cash used in investing activities was ¥32.7 billion ($272,405 thousand) compared to ¥41.2 billion in the previous fiscal year, as the ¥42.7 billion spent on the purchase of property, plant, equipment, and intangible assets was partially offset by things such as the sale of certain noncurrent assets. Net cash used in financing activities was ¥55.3 billion ($460,946 thousand), compared to ¥56.5 billion last fiscal year, as the Company had a ¥42.1 billion net decrease in short-term and long-term loans payable and bonds payable and ¥12.8 billion in dividends paid. As a result of the foregoing, the fiscal year-end balance of cash and cash equivalents totaled ¥245.3 billion ($2,041,524 thousand) compared to ¥211.5 billion at the end of the previous fiscal year. (3) Parallel disclosure Differences between the main items on IFRS consolidated financial statements and those on consolidated financial statements prepared based on Japanese accounting standards (Expenses associated with post-employment benefits) Under Japanese accounting standards, Epson wrote off actuarial gains and losses and past service costs over a certain period of time. Under IFRS, remeasurements of net defined benefit liabilities and assets are recognized in full as other comprehensive income in the period in which they are incurred and transferred to retained earnings immediately. Past service costs are recognized as a net loss either in the period when the plan is amended or curtailed, or in the period when associated restructuring costs or termination benefits are recognized, whichever is earlier. Since actuarial assumptions for defined benefit liabilities differ, retirement benefit costs are additionally recognized. Due to these effects, the cost of sales and selling, general and administrative expenses in the fiscal year 2013 decreased by ¥6,435 million when calculated based on IFRS rather than on Japanese standards, while other comprehensive income increased by ¥13,086 million. Cost of sales, selling, general and administrative expenses, and finance costs in the fiscal year 2014 increased by ¥6,247 million, other operating income increased by ¥30,071 million, and other comprehensive income decreased by ¥1,512 million. *Please refer to the following for Epson’s financial results for previous years: http://global.epson.com/IR/

25
2. Manufacturing, orders received and sales (1) Actual manufacturing The following table shows actual manufacturing information by segment in the fiscal year under review.
Business segment Year ended March 31, 2015
(From April 1, 2014, to March 31, 2015) (Millions of yen)
Change compared to
previous fiscal year (%)
Information-related equipment 886,416 107.9
Devices and precision products 152,960 111.4
Sensing and industrial solutions 23,973 159.3
Total for the reporting segments 1,063,350 109.2
Other 592 78.9
Total 1,063,942 109.2
Notes 1. The above figures are based on sales prices. Intersegment transactions are offset and therefore eliminated. 2. The above figures do not include consumption tax. 3. The above figures include outsourced manufacturing. (2) Orders received Epson’s policy is to manufacture products based on sales forecasts. Accordingly, this section does not apply. (3) Actual sales The following table shows actual sales information by segment in the fiscal year under review.
Business segment Year ended March 31, 2015
(From April 1, 2014, to March 31, 2015) (Millions of yen)
Change compared to
previous fiscal year (%)
Information-related equipment 906,701 107.8
Devices and precision products 150,292 104.4
Sensing and industrial solutions 23,182 145.2
Total for the reporting segments 1,080,176 107.9
Other 808 90.6
Total 1,080,984 107.9
Notes 1. Intersegment transactions are offset and therefore eliminated. 2. The above figures do not include consumption tax. 3. No customer accounts for more than 10% of the actual total sales.

26
3. Analysis of financial condition and results of operations (1) Analysis of operating results Revenue Consolidated revenue was ¥1,086.3 billion, a year-over-year increase of ¥77.9 billion (7.7%). Revenue for each reporting segment is discussed below. The information-related equipment segment recorded revenue of ¥907.2 billion, a year-over-year increase of ¥66.0 billion (7.9%). The segment as a whole benefited from foreign exchange effects as well as from the factors described below. Inkjet printer revenue expanded sharply despite a decline in ink cartridge printer shipments because a reinforced lineup of printers with high-capacity ink tanks had strong sales especially in emerging markets. The Company also reinforced its business inkjet printer lineup for a resolute entry into the business market. At the same time, the Company launched a managed print services business in Japan. Under this new business model, customers pay a flat fee for a package that includes printer, ink, and maintenance service. In addition, revenue from consumables rose along with an improved composition of the install base. In large-format inkjet printers Epson saw ongoing firm demand in the large-photo and color calibration (proofing) markets. In the professional photo market, the Company increased revenue from both printers and ink by launching compact, high-performance new models. In the inkjet textile printing market, the range of applications expanded to encompass everything from apparel to small personal items and interior goods. Meanwhile, the Company expanded the territories where we sell direct-to-garment printers to capture opportunities created by a rise in demand for custom and original T-shirts. Page printer revenue decreased due to a decline in unit shipments, the result of Epson’s focus on selling high-added-value models. SIDM printer revenue was flat year over year because the effects of a temporary lull in demand in China and a decline in unit shipments in the Americas and Europe were offset by foreign exchange effects and increased sales of low-priced models in Asia. POS system product revenue increased due to unit shipment growth in Europe and expanded sales of label printers for on-demand, in-house printing. Visual communications revenue increased, owing in part to foreign exchange effects. 3LCD projector revenue grew sharply in the Americas and Asia. This growth was the result of an expanded and improved lineup of high-performance products, the special demand generated by the FIFA World Cup, and increased sales in the education market. The devices and precision products segment recorded revenue of ¥156.2 billion, a year-over-year increase of ¥7.5 billion (5.1%). The factors that contributed most significantly to this change are described below. Crystal device revenue fell due to ongoing price erosion in the markets for AT-cut crystal and tuning-fork crystal products. Semiconductor revenue increased due to growth in internal demand and external sales, including silicon foundry orders. Watch revenue increased primarily because of growth in sales of premium watches, which lifted average selling prices, and foreign exchange effects. The sensing and industrial solutions segment recorded revenue of ¥23.3 billion, a year-over-year increase of ¥7.2 billion (44.6%). In factory automation systems, industrial robot revenue grew on increased orders from Asia, while IC handler revenue grew on increased orders from manufacturers of semiconductors for smartphones. In the “other” segment, revenue was ¥1.3 billion, a 4.2% increase from the previous year. Cost of sales and gross profit Cost of sales was ¥690.4 billion, a year-over-year increase of ¥44.5 billion (6.9%). In addition to foreign exchange effects, the increase in cost of sales is due largely to higher material and processing costs associated with an increase in revenue. As a result, gross profit was ¥3,959 billion, up ¥33.3 billion (9.2%) year over year.

27
Selling, general and administrative expenses and business profit Selling, general and administrative (SG&A) expenses were ¥294.6 billion, an increase of ¥22.1 billion (8.1%). In addition to foreign exchange effects, the increase in SG&A expenses is largely a result of higher labor costs, primarily in the form of bonuses, associated with the Company’s improved financial performance. As a result, business profit was ¥101.2 billion, up ¥11.1 billion (12.4%) year over year. Segment profit (business profit) in each reporting segment was as follows. Segment profit in the information-related equipment segment was ¥133.6 billion, up ¥9.8 billion (8.0%) year over year. This was due primarily to increased sales of key products, in addition to foreign exchange effects. Segment profit in the devices and precision products segment was ¥14.8 billion, up ¥3.9 billion (36.7%) year over year. This increase was due to revenue growth, including foreign exchange effects. Segment loss in the sensing and industrial solutions segment was ¥9.0 billion, a ¥900 million improvement compared with the ¥9.9 billion loss in the previous period. This improvement was primarily due to industrial robot profit growth. In the “other” segment loss was ¥300 million, compared with a ¥200 million loss in the previous period. As for adjustments, segment loss was ¥37.8 billion, a ¥3.5 billion increase over the ¥34.3 billion loss incurred in the previous period. Adjustments consisted primarily of patent royalties, R&D expenses for basic research and new businesses that do not belong to a reporting segment, and SG&A expenses, comprising Head Office expenses. Other operating income, other operating expenses, and profit from operating activities Other operating income was ¥39.9 billion, a year-over-year increase of ¥39.9 billion (565.3%). The increase in other operating income resulted from changes in the defined-benefit plan in Japan that reduced past service costs by ¥30 billion and the sale of assets. Other operating expenses were ¥9.8 billion, a year-over-year decrease of ¥6.7 billion (40.7%). Other operating expenses decreased because the foreign exchange loss shrank from ¥9.2 billion last fiscal year to ¥2.5 billion this fiscal year. As a result, profit from operating activities was ¥131.3 billion, a year-over-year increase of ¥51.8 billion (65.2%). Finance income and finance costs Finance income was ¥3.2 billion, a year-over-year increase of ¥500 million (21.7%). The increase in finance income was primarily due to an increase in interest income. Finance costs were ¥2.3 billion, a year-over-year decrease of ¥2.1 billion (47.6%). The decrease in finance costs was primarily due to a decrease in interest paid. Profit before tax The foregoing resulted in profit before tax of ¥132.5 billion, a year-over-year increase of ¥54.5 billion (70.0%). Income taxes Income taxes were ¥18.6 billion, a ¥27.9 billion increase compared with the previous period. The increase in income taxes was mainly because the negative ¥27.8 billion corporate tax adjustment recorded in the previous period fell to negative ¥4.5 billion. Profit for the year Profit for the year was ¥112.7 billion, a year-over-year increase of ¥28.3 billion (33.6%). (2) Liquidity and capital resources Cash flow Net cash provided by operating activities was ¥108.8 billion, a decrease of ¥6.0 billion compared with the previous period. Although profit for the period and income taxes were both higher, by ¥28.3 billion and ¥27.9 billion, respectively, net cash provided by operating activities declined mainly because of a ¥20.5 billion effect

28
from net defined benefit liabilities, a ¥17.6 billion effect from increased inventories, a ¥16.9 billion effect caused by higher income taxes paid, and a ¥12.1 billion effect from a decrease in trade payables. Net cash used in investing activities totaled ¥32.7 billion, a year-over-year decrease of ¥8.5 billion. This was primarily due to a ¥13.7 billion increase in income on the sale of an investment property. Net cash used in financing activities totaled ¥55.3 billion, a year-over-year decrease of ¥1.1 billion. Although dividends paid increased by ¥9.3 billion, net cash used in financing activities decreased mainly because the net change in interest-bearing liabilities decreased by ¥10.4 billion. As a result of the foregoing factors, cash and cash equivalents at the end of the fiscal year stood at ¥245.3 billion, an increase of ¥33.8 billion compared with the end of the previous fiscal year, giving Epson sufficient liquidity. The combined total of short-term loans payable, long-term loans payable, and bonds payable was ¥185.9 billion, a decrease of ¥34.5 billion compared with the previous period, owing to progress in repaying general interest-bearing liabilities. Long-term loans payable (excluding the current portion) at the end of the period totaled ¥50.5 billion, at a weighted average interest rate of 0.70% due in 2017. These borrowings were obtained as unsecured loans primarily from banks. Financial condition Total assets were ¥1,006.2 billion, an increase of ¥97.3 billion compared with the end of the previous fiscal year. This increase was primarily due to a ¥38.8 billion increase in inventories, a ¥33.8 billion increase in cash and cash equivalents, and a ¥13.1 billion increase in trade and other receivables. Total liabilities were ¥508.9 billion, down ¥35.1 billion compared with the end of the previous fiscal year. While trade and other payables increased by ¥16.5 billion, total liabilities decreased mainly because of a ¥36.2 billion decrease in other financial liabilities included in current and non-current liabilities accompanying a net reduction in short-term and long-term loans payable and bonds payable, as well as a ¥25.1 billion decrease in net defined benefit liabilities accompanying changes to Epson’s defined-benefit plan for employees in Japan. The equity attributable to owners of the parent company totaled ¥494.3 billion, a ¥131.9 billion increase compared with the previous fiscal year-end. This was primarily due to a ¥98.6 billion increase in retained earnings and a ¥33.3 billion increase in other components of equity, including changes in the exchange differences on translation of foreign operations associated with the depreciation of the yen. Working capital, defined as current assets less current liabilities, was ¥294.9 billion, an increase of ¥70.3 billion compared with the end of the previous fiscal year. The ratio of interest-bearing liabilities to total assets declined to 18.5% from 24.3% at the end of the previous fiscal year.

29
4. Research and development activities Epson conducts research and development to create products and services that offer value that exceeds customer expectations. We seek to create value by driving advances in our unique core technologies in the areas of Micro Piezo printheads, microdisplays, sensing, and robotics. We also create value by turning these core technologies—all of which evolved from Epson’s long-established strengths in compact, energy-saving, high-precision technologies—into platforms that meet the needs of a wide spectrum of customers. The R&D divisions of our operations follow these basic guidelines to develop core technologies and shared technology platforms that will strengthen the Company’s market position, in both the near and long term. Meanwhile, the mission of Corporate R&D is to develop new and existing core technologies as well as shared technology platforms so as to create new businesses and revolutionize existing ones. Total R&D spending during the fiscal year was ¥47.8 billion. The information-related equipment segment accounted for ¥24.4 billion, the devices and precision products segment for ¥4.5 billion, and the sensing and industrial solutions segment for ¥5.2 billion. The “other” segment and corporate segment accounted for the remaining ¥13.5 billion. The main R&D accomplishments in each segment are described below. Information-related equipment In the printing systems business, Epson released a compact new inkjet consumer printer that, aside from printing photos taken with a digital camera or smartphone, allows users to easily create original stickers, labels, and postcards using a smartphone app. Measuring 249 mm x 176 mm x 85 mm tall (W x D x H), the product is small enough to rest on the palm of a hand. When not in use, it can be stored vertically on a bookshelf and easily taken down and transported to wherever it is needed. Epson also released its first mobile inkjet printers. Equipped with a built-in battery1, these printers are the smallest and lightest in their class2 thanks primarily to smaller paper-feed and paper-transport rollers, a higher component layout density, which was achieved by dividing circuits up into multiple smaller circuit boards, and an aluminum frame that reduced the weight of the products while giving additional strength. Users can conveniently slip these compact printers into a briefcase along with a tablet PC and take them out on the road. When not in use, the printers can be stored in a desk drawer. In addition, the Company released a color inkjet label printer that prints attractive product labels that can be affixed to bottles and packages. The printer can also be used to print identifying labels that increase the visibility and recognition of materials, chemicals, and other products in a manufacturing setting. Last year we developed a new type of PrecisionCore printhead that has an expanded range of applications and is used to build Epson PrecisionCore lineheads. The color inkjet label printer is the first product in Japan to employ high-speed PrecisionCore lineheads. The product prints at rates of up to 300 mm/second and, with 600 x 1,200 dpi resolution, provides excellent image quality. It is ideal for customers who want to reduce costs by printing the labels they need when they need them, on-demand, in quantities of about 1,000 labels. In the visual communications business, the Company released a new wall-mounted ultra-short throw projector for educational purposes that has a built-in electronic blackboard function with finger touch-enabled operation. The operation of this interactive projector is intuitive. Users can use familiar hand gestures to select tool icons on the electronic blackboard, zoom or shrink images, or scroll through content. Teachers can use arrows, triangles, circles and other simple graphics to grab and hold students’ attention. With this product, teachers and students can write on images with a pen and erase things with their fingers, much like on a traditional blackboard. The Company also developed a new home theater projector that employs a laser light source, an Epson first. Featuring 4K Enhancement Technology3, the product supports amazing 4K content. This projector achieves absolute black4, displaying zero lumens during full-black scenes, such as when the scene changes.
1Can print up to approximately 50 color prints or 100 monochrome prints on a fully charged battery. Performance may vary depending on usage conditions.
2It is the smallest and lightest A4 inkjet printer in Japan as of June 2014, as per Epson research. The printer is 309 mm wide, 154 mm deep, 61 mm high and weighs approximately 1.6 kg.
34K Enhancement Technology shifts each pixel diagonally by 0.5 pixels to double the resolution to 3840 x 2160 and achieve ultra-high definition.
4A screen brightness of zero lumens in a completely dark room from which all outside sources of light are

30
blocked. Devices and precision products In the microdevices business, the Company commercialized a new series of microcontrollers with 16-bit flash memory built in. These low-power microcontrollers operate on 1.2 V and are designed specifically for small sensor products, such as electronic locks, motion sensors, and gas alarms used in the industrial and housing sectors, as well as for wearable products that will be paired with smartphones. By eliminating the circuitry for a liquid crystal display, Epson was able to reduce the surface area of these products by up to 87% compared with earlier models. Sensing and industrial solutions The Company released Pulsense activity trackers that monitor heart rate, exercise intensity, caloric intake and consumption, sleep quality, and stress level comfortably at the wrist. In addition to measuring acceleration, these products are equipped with a unique Epson sensor that accurately measures pulse by using the light-absorbing property of hemoglobin in blood. The sensor works by shining light from an LED on blood vessels near the surface of the skin of the wrist and measuring blood flow based on the amount of reflected light. All of the data taken with Pulsense products can be uploaded to a PC or smartphone for review and analysis using a special website or mobile app. These activity monitors can continuously track the wearer’s heart rate for up to about 36 hours at a time and can thus record the wearer’s activity, whether exercise or sleep patterns, around the clock. The Company also released a new IC test handler that is perfectly suited for use in testing smartphone ICs, demand for which remains robust. This handler has the same basic features of its predecessor, but we increased the standard contact pressure it exerts when plugging ICs into test sockets, to allow the handler to accommodate chips with high pin counts. The handler gives users flexibility in designing their test environments, because the hands that transport ICs inside the system can be configured for either inline 4-site test mode5 or square 4-site test mode6, and the handler can also be upgraded to an 8-site test mode7.
5A mode in which four ICs are simultaneously tested in a series 6A mode in which four ICs are arranged in a 2 x 2 configuration for simultaneous testing 7A mode in which eight ICs are simultaneously tested

31
5. Issues for Fiscal 2015 At the start of the 2013 fiscal year Epson began working under an updated three-year plan called the Updated SE15 Second-Half Mid-Range Business Plan (FY2013–FY2015). We have been closely adhering to the strategic course charted by the SE15 Long-Range Corporate Vision and, in line with the updated plan, are pursuing a basic strategy of managing our businesses so that they create steady profit while avoiding the single-minded pursuit of revenue growth. Our top priority will be steady income and cash flow. To achieve this in existing segments, we will readjust our product mixes and adopt new business models. Meanwhile, we will aggressively develop markets in new segments. Working under a new mid-range plan from the 2016 fiscal year, we will move steadily forward to lay the foundation for a metamorphosis during which Epson will change from being primarily a company that provides consumer imaging products into a company that once again posts strong growth by creating and providing new information solutions and equipment for businesses and professionals, as well as consumers. Although the outlook is not entirely clear, the global economy as a whole is expected to continue growing. The economies of the U.S. and other developed countries are by and large in recovery mode, but economic growth is seen slowing in some emerging nations. Society is changing, shifting increasingly toward sustainable industry and sustainable economic activity. This trend will likely alter the kind of customer value that Epson will need to provide. In this type of business environment, we will remake Epson into a company that once again posts strong growth. We will achieve this by focusing our management resources on the four areas described below, where we can continue to leverage the strengths of our unique core technologies, by expanding our business segments, and by building stronger new businesses that will support the Company’s growth in the future. Ultimately, we aim to consistently achieve a return on sales (business profit*/revenue) of 10% and return on equity (profit for the period/equity attributable to owners of the parent company) of 10% or more as early as possible by remaining even more mindful of the cost of capital. *Business profit is very similar to operating income under Japanese accounting standards (J-GAAP), both conceptually and numerically. Epson began using business profit as an indicator after adopting International Financial Reporting Standards (IFRS) in FY2014 to facilitate comparisons with past results. Strategies in Each Area Printing In printing, we will look to use Epson’s unique Micro Piezo inkjet technology to create an innovative printing environment. In inkjet printers, we will work to sell more high-end consumer models, which tend to generate higher print volume. We will also continue to upgrade and expand our lineup of products tailored to the needs of consumers in emerging countries. We will launch powerful new office printers equipped with state-of-the-art Micro Piezo print-heads and build up our managed print services business, a new business model, to further increase our competitiveness. Digital inkjet printing systems are increasingly replacing conventional analog systems in the commercial, industrial, and business printing markets, where they are used to print everything from billboards to wrapping film for food products to textiles. By creating new customer value in the form of shorter production processes and lower environmental impact, we will tap more deeply into these markets and build strong core businesses that will sustain future growth. In business systems, we will achieve steady income growth by uncovering new demand while maintaining a grip on the top share in existing segments.
Visual Communications In the visual communications business we will create new forms of visual communication using micro-display technology. Epson is the leader in liquid-crystal projectors and has a high market share in the home and business segments. However, to expand the business and increase our earnings power, we also want to further elevate our position in the high-lumen, short-throw, and ultra-short throw projector niches, and to do so, we will enhance our ability to propose solutions and will build up our sales network. Epson’s smart glasses have the

32
potential to change the way we live and work. Epson’s smart glasses have the potential to change the way we live and work. Offering a see-through display and hands-free navigation, they give Epson the opportunity to create new applications and new value for both consumer and industrial markets. Quality of Life We will use high-accuracy sensing technology to create new value that improves the quality of life. Epson has been building new businesses around innovative sensing products such as wristwatch-like GPS running monitors and heart rate monitors, and we intend to continue to capitalize on our sensing technologies, which combine semiconductors and crystal devices, and the technical expertise accumulated in the watch business, to help enrich the lives of our customers. Going forward, we want to provide life-enriching wearable personal devices in the health, sports, and medical fields, and toward that end are integrating cloud technology and building a product development process that will be able to efficiently serve diversified markets. Meanwhile, in the industrial sector, such as in the monitoring of building, equipment, and infrastructure soundness, we will drive growth by creating innovative sensing solutions that provide insightful, useful information that would otherwise be invisible. Manufacturing Epson has long contributed to factory automation in a wide range of fields with SCARA robots, compact six-axis robots, and other precision assembly robots. With labor shortages looming and labor costs soaring in emerging countries, Epson will use its advanced robotics technologies to help usher in next-generation manufacturing by providing robots and production equipment that radically boost throughput in production processes that have traditionally been difficult to automate.
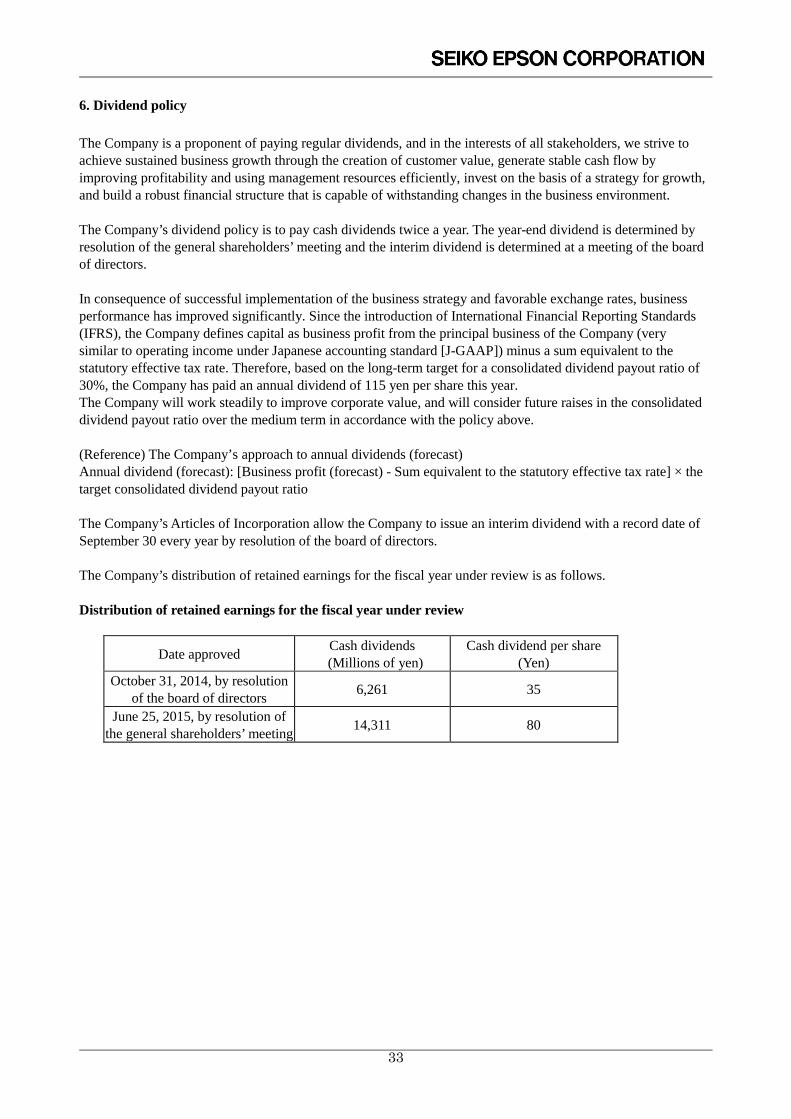
33
6. Dividend policy The Company is a proponent of paying regular dividends, and in the interests of all stakeholders, we strive to achieve sustained business growth through the creation of customer value, generate stable cash flow by improving profitability and using management resources efficiently, invest on the basis of a strategy for growth, and build a robust financial structure that is capable of withstanding changes in the business environment. The Company’s dividend policy is to pay cash dividends twice a year. The year-end dividend is determined by resolution of the general shareholders’ meeting and the interim dividend is determined at a meeting of the board of directors. In consequence of successful implementation of the business strategy and favorable exchange rates, business performance has improved significantly. Since the introduction of International Financial Reporting Standards (IFRS), the Company defines capital as business profit from the principal business of the Company (very similar to operating income under Japanese accounting standard [J-GAAP]) minus a sum equivalent to the statutory effective tax rate. Therefore, based on the long-term target for a consolidated dividend payout ratio of 30%, the Company has paid an annual dividend of 115 yen per share this year. The Company will work steadily to improve corporate value, and will consider future raises in the consolidated dividend payout ratio over the medium term in accordance with the policy above. (Reference) The Company’s approach to annual dividends (forecast) Annual dividend (forecast): [Business profit (forecast) - Sum equivalent to the statutory effective tax rate] × the target consolidated dividend payout ratio The Company’s Articles of Incorporation allow the Company to issue an interim dividend with a record date of September 30 every year by resolution of the board of directors. The Company’s distribution of retained earnings for the fiscal year under review is as follows. Distribution of retained earnings for the fiscal year under review
Date approved Cash dividends (Millions of yen)
Cash dividend per share (Yen)
October 31, 2014, by resolution of the board of directors 6,261 35
June 25, 2015, by resolution of the general shareholders’ meeting 14,311 80

34
Corporate Governance 1. Approach to corporate governance (1) Corporate governance system Outline Epson’s basic approach to corporate governance is geared toward ▪ continuously increasing corporate value; and ▪ reinforcing business checks and balances, practicing sound corporate ethics, and ensuring business
transparency and health. The Company has a board of directors and a board of corporate auditors. The board of directors had 10 members, including two outside directors, as of the date the Annual Securities Report was submitted. It meets once a month and convenes extraordinary meetings as needed. The board of directors makes decisions on basic management policies, key business operations, period-end closing, disclosure timeframes, and other important issues. Various management bodies have been created to advise the board of directors or president, deliberate on issues to facilitate decision making, and oversee and enhance the execution of business. Epson’s board of corporate auditors consists of five corporate auditors, including three outside corporate auditors. It strives to ensure greater independence and transparency of audits. The names of the outside directors and outside auditors have been reported to the Tokyo Stock Exchange (TSE) for they are considered to be independent directors/auditors as defined by the TSE. The main corporate management bodies and their aims are described below: Corporate Strategy Council and Corporate Management Meetings The Corporate Strategy Council and corporate management meetings are convened to thoroughly deliberate on matters before they are referred to the board of directors. Compliance Committee The Compliance Committee meets to hear and discuss important matters concerning Epson’s compliance programs. It reports its findings and offers opinions to the board of directors. Nomination Committee and Compensation Committee As advisory bodies to the board of directors, the Nomination Committee screens board of director candidates, and the Compensation Committee deliberates on director remuneration issues. The Company strives to ensure the transparency and objectivity of deliberations, with outside directors sitting on both of the committees and corporate auditors able to attend committee meetings as observers. Epson’s system of corporate governance is schematically represented below:

35
Reasons for adopting the current system of corporate governance Epson is looking to initiate fresh growth by developing and executing strategic measures based on the Updated SE15 Second-Half Mid-Range Business Plan (FY2013–FY2015), which is aimed at achieving the goals set forth in Epson’s SE15 Long-Range Corporate Vision. As it moves forward on the updated mid-range business plan, the Company believes that it will be important to have a governance system that strikes a good balance between business speed and efficiency on the one hand and effective oversight of management on the other. For this reason, the Company employs an agile, practical management organization wherein directors who understand the situation inside the Company simultaneously oversee multiple key business operations, while the outside directors conduct checks to assure that business decisions make sense. In addition, Epson employs independent outside directors and independent corporate auditors to ensure a sound management audit function. The names of the outside directors and outside auditors have been reported to the Tokyo Stock Exchange (TSE) as they are considered to be independent directors/auditors as defined by the TSE. Internal control system The Company passed a resolution at the April 30, 2015, meeting of the board of directors to partially amend Epson’s basic internal control system policy. The content of the revised basic policy is described below. Basic internal control system policy The Company considers its Management Philosophy to be its most important business concept, and to realize it Epson has established Principles of Corporate Behavior that are shared across the Group, including at subsidiaries. The Company will establish the following basic policy regarding the internal control system (a system for ensuring that business is conducted suitably by the corporate group) and provide an improved internal control system for the Epson Group as a whole. Compliance (1) The Company will establish “Principles of Corporate Behavior” as a guide for putting the Management
Philosophy into practice. The Company will also establish regulations that spell out things such as basic compliance requirements and the organizational framework.
(2) A member of the board will be selected to serve as the Chief Compliance Officer (CCO). The CCO will head an organization that oversees and monitors the execution of all compliance operations.
(3) The Company also created a Compliance Committee to serve as an advisory body to the board of directors. The Compliance Committee will be chaired by the CCO and have as members the outside directors, outside corporate auditors, and a director appointed by the board of directors. The Compliance Committee

36
will meet to hear and discuss important matters concerning the Company’s compliance program. It will report its findings and offer opinions to the board of directors.
(4) Compliance promotion and enforcement will be supervised by the president of Seiko Epson. Group-wide compliance programs will be carried out by Head Office supervisory departments with the cooperation of departments in the various operations divisions and subsidiaries. Compliance programs of the divisions and their related subsidiaries will be promoted by the respective chief operating officers of the divisions. A dedicated compliance department will help to ensure the coverage and effectiveness of compliance programs by monitoring compliance across the Epson Group and by taking corrective action or making adjustments where needed.
(5) The Corporate Strategy Council, an advisory body to the president comprising members of the board of directors of the Company, will address important matters with respect to compliance promotion and enforcement in the Epson Group as a whole, including subsidiaries. The Council will strive to ensure the effectiveness of compliance by exhaustively discussing and analyzing the implementation of programs for assuring observance of statutes, internal regulations, business ethics, and initiatives in high-risk and other key areas.
(6) The Company, including its subsidiaries, will strive to provide an effective whistleblowing system. Employees will be encouraged and will be able to easily and immediately report compliance violations using internal and external hotlines and e-mail addresses. Controls will be in place to protect whistleblowers from reprisal, and allegations will be reported to the Company’s corporate auditors, the Compliance Committee, and the Corporate Strategy Council in a way that whistleblowers cannot be identified.
(7) The Company will strive to enhance legal awareness by providing Epson Group employees with web-based training and other educational opportunities.
(8) The president of Seiko Epson will periodically report important compliance-related matters to the board of directors and will take measures as needed to respond to issues.
(9) Epson’s “Principles of Corporate Behavior” states that the Company will have no association whatsoever with antisocial forces. The Company takes a firm stance in rejecting any and all contact with antisocial forces that threaten social order and security.
Business execution system (1) The Company will formulate long-term vision statements and mid-range business plans, and it will set
clear medium- and long-range goals for the Epson Group as a whole. (2) The Company will institute a system that will ensure the appropriate and efficient execution of business.
To that end, the Company will establish regulations governing organizational management, levels of authority , the division of responsibilities, and the management of affiliated companies, thus distributing power and authority across the entire Group.
(3) Personnel responsible for business operations will report the matters below to the board of directors at least once every three months.
• Current business performance and performance outlook • Risk management responses • Status of key business operations Risk management (1) The Company will establish a basic risk management regulation that stipulates the risk management
system of the Company, including its subsidiaries, and that defines the organization, risk management methods and procedures, and other basic elements of this system.
(2) Overall responsibility for risk management in the Epson Group, including subsidiaries, will belong to the president of Seiko Epson. Group-wide risk management will be carried out by Head Office supervisory departments with the cooperation of the operations divisions and subsidiaries. Risks unique to an individual business will be managed by the chief operating officer of that business, including subsidiaries consolidated under it. The Company will also set up a department that will supervise risk management, monitor overall risk management Group-wide, make corrections and adjustments thereto, and ensure the effectiveness of risk management programs.
(3) The Corporate Strategy Council strives to ensure effective management of serious risks that could have an egregious affect on society by dynamically and exhaustively discussing and analyzing ways to identify and

37
control risks. Also, when major risks become apparent, the president will lead the entire company in mounting a swift initial response in line with the Company’s prescribed crisis management program.
(4) The president of Seiko Epson will periodically report to the board of directors on critical risk management issues and formulate appropriate measures to respond to these issues.
Ensuring the appropriateness of operations in the corporate group (1) The Group’s management structure will help to ensure that operations in the corporate group, including
subsidiaries, are conducted appropriately. Essentially, the Company will be organized into product-based divisions. Each division will be headed by a chief operating officer who owns global consolidated responsibility for that business. Meanwhile, supervisory functions within the Head Office will own global responsibility. Responsibility for providing the framework for business operations at subsidiaries will be owned by the head of each business. Group-wide corporate functions will be the responsibility of the heads of Head Office supervisory departments.
(2) The Company will have business processes that enable business to be controlled on a Group level. This will be accomplished by internal regulations that require subsidiaries to report or acquire pre-approval for certain business operations from the parent company, Seiko Epson, and by requiring issues that meet certain criteria to be submitted to Epson’s board of directors for resolution. In certain regions, moreover, the Company will seek to ensure the suitability and efficiency of Group-wide business operations by establishing a company that acts as a regional head office that supervises subsidiaries.
(3) An internal auditing department will conduct audits Group-wide, including subsidiaries, based on a basic internal audit regulation, thereby strengthening and enhancing internal audits Group-wide, including at subsidiaries.
Safeguarding and management of work-related information (1) Information on business operations will be safeguarded and managed under regulations governing, among
other things, document control, management approval, and contracts, with directors and corporate auditors reviewing these and other relevant documents on an ongoing basis.
(2) The Company strives to prevent the leak and loss of Epson Group internal information by managing confidential information according to the level of sensitivity, in accordance with internal information security regulations.
Audit system (1) Corporate auditors will have the authority to conduct interviews with directors and other personnel
whenever they deem such interviews necessary based on corporate regulations governing auditors and audit procedures.
(2) Corporate auditors will also be authorized to attend Corporate Strategy Council sessions, corporate management meetings, and other important business meetings that will enable them to conduct audits based on the same information as that available to directors. Corporate auditors will also routinely review important documents related to management decision making.
(3) The Company will establish a Corporate Auditors’ Office that will be staffed with full-time employees. Evaluations and transfers of Corporate Auditors’ Office employees will require the approval of corporate auditors. If the number of full-time employees required for audit operations is insufficient, or if they lack the requisite expertise, etc., and if corporate auditors acknowledge that special circumstances hinder the effectiveness of audits, corporate auditors will be able to make the necessary requests to the representative director or the board of directors.
(4) Per a corporate auditor audit regulation, corporate auditors will be able to ask directors and persons from the internal audit department and elsewhere to report or explain the state of management within the Epson Group, including subsidiaries, and will be able to view supporting materials. Corporate auditors will, where necessary, be able to ask subsidiary company directors, auditors, internal audit groups, and other personnel to report the state of management within their respective companies.
(5) Corporate auditors shall strive to enhance the effectiveness of audits by holding regular discussions with the internal audit department and with independent public accountants.
(6) Corporate auditors will directly assess business operations by holding regular meetings with representative directors.
(7) The expenses required to execute the duties of corporate auditors will be properly budgeted for in advance.
38
In addition, expenses required to execute the duties of corporate auditors when emergency or extraordinary audits are needed will be promptly paid in advance or refunded on each occasion.
(2) Internal audits Epson’s internal compliance system guards against potential legal and internal regulatory violations in departmental operations, and the internal audit organization, with a staff of 20, directly reports to the president the results of routine internal audits, including those conducted at Epson subsidiaries. The audit organization evaluates the effectiveness of the governance process and requests improvements where needed. (3) Outside directors and outside corporate auditors View on independence The Epson board of directors has established criteria concerning the independence of outside directors. In compliance with these criteria, it selects candidates for outside directors and outside corporate auditors who do not have potential conflicts of interest with general shareholders. The outside directors and the outside auditors that are currently engaged all meet the independence criteria. The criteria concerning the independence of outside directors are listed below. Outside director independence criteria Epson does not select as candidates for outside director persons to whom any of the following apply: (1) A person who receives significant business1 from Epson or a person who has within the last five years been
employed as an executive officer2 of a company that receives significant business from Epson (2) A person who is a major business partner3 of Epson or a person who has within the last five years been
employed as an executive officer of a company that is a major business partner of Epson (3) A consultant, an accounting professional such as a certified public accountant, or a legal professional such
as an attorney who, in the last three years, has received from Epson a large sum of money4 or other property for reasons other than director remuneration (including any person who has belonged to or been employed as an executive officer or the like with a company, union or other group that has received such property in the last three years)
(4) A person who is a major Epson shareholder5 or a person who, within the last five years, has been an executive officer or corporate auditor of a company that is a major Epson shareholder
(5) A person who is employed as an executive officer or corporate auditor of a company or other group in which Epson is a major shareholder
(6) A person who has belonged within the last 10 years to an auditing company that has conducted a statutory audit of Epson
(7) A person who has belonged to Epson’s managing underwriter within the last 10 years (8) A person who has received a large donation6 from Epson (a person who belongs to a legal entity, union or
other group that has received a large donation from Epson and has been employed therein as an executive officer or the equivalent)
(9) A person from a company that employs a former Epson employee as an outside director (10) The spouse or other immediate family member of a person to whom any of items (1) through (9) apply Notes 1A “person who receives significant business from Epson” is a person or supplier who has received payments
amounting to 2% or more of the person’s or supplier’s annual consolidated sales for any fiscal year in the last three years.
2An “executive officer” is an employee in a senior executive management position, including executive, managing director, operating officer, or general manager or higher position.
3A “person who is a major business partner of Epson” is a person or customer who has furnished Epson with payments amounting to 2% or more of Epson’s annual consolidated sales for any fiscal year in the last three years.
4A “large sum of money” is, in the case of an individual, an amount which, on average in any of the last three years, is equal to ¥10,000,000 or more, or, in the case of a group, equivalent to 2% or more of the group’s total revenue.
5 “Major shareholder” means a person who owns, either directly or indirectly, 10% or more of the outstanding voting rights.

39
6A “large donation” is a donation in an amount which, on average in any of the last three years, exceeds the greater of ¥10,000,000 or 30% of the group’s total annual expenses.
Outside directors Epson’s board has two outside directors. No special interests exist between the Company and the outside directors. Outside Director Toshiharu Aoki was an executive at Nippon Telegraph and Telephone Corporation and at NTT Data Corporation. Epson has not had business transactions with either Nippon Telegraph and Telephone Corporation or NTT Data Corporation for the past three years, and neither company is considered a major supplier under Epson’s outside director independence criteria. Outside Director Hideaki Omiya is Chairman of Mitsubishi Heavy Industries, Ltd. Although Epson and Mitsubishi Heavy Industries have bought and sold semiconductor fabrication equipment and had other business transactions within the past three years, Mitsubishi Heavy Industries is not considered a major supplier under Epson’s outside director independence criteria, as the value of transactions is less than 0.1% of the consolidated revenue of either company. Outside corporate auditors Each of Epson’s three outside corporate auditors draws on a wealth of experience and keen insight when conducting audits, and offers frank opinions to the board of directors. No special interests exist between the Company and any of the outside corporate auditors. Outside corporate auditor Yoshiro Yamamoto is a former Fuji Bank, Ltd. (presently Mizuho Corporate Bank, Ltd.) executive who has been retired from the bank for more than 10 years. He was invited to become an auditor because he fits the needs of the Company and for no other reason, such as a recommendation by Fuji Bank, Ltd. Net interest-bearing liabilities account for only a small percentage of the Company’s total assets, and the Company’s dependence on bank loans is low. Furthermore, the Company deals with multiple financial institutions and does not depend on Mizuho Corporate Bank, Ltd. for a high proportion of its borrowing. There is therefore no special relationship between the Company and Mizuho Corporate Bank, Ltd., and Mizuho Corporate Bank, Ltd. does not influence Epson’s decision making. Outside corporate auditor Kenji Miyahara was an executive at Sumitomo Corporation. Epson has not had business transactions with Sumitomo Corporation over the last three years. Outside corporate auditor Michihiro Nara is an attorney, but the Company has never engaged him or the law office to which he belongs to perform duties under an advisory agreement or under any other separate agreement, nor does it plan to do so in the future. There is no particular system of coordination between outside corporate auditors and audit functions in the Group; however, corporate auditors take the initiative to consult with the internal audit organization and independent public accountants. Each time an issue is identified by an audit, details are passed on to the outside corporate auditors to keep them informed as appropriate. Moreover, corporate auditors participate in the Compliance Committee, which supervises compliance programs, and they conduct inquiries at departments where a significant incident involving internal control has occurred. Corporate auditors are thus kept abreast of operational issues and the status of measures to address those issues. (4) Director remuneration Basic policy Directors serve to enhance corporate value, both in the immediate and long terms, and Epson has designed its system of director remuneration to provide them with incentives to improve business performance. The monthly salaries of directors are decided by the board of directors after deliberation by the Compensation Committee and in consideration of Epson’s business performance. Director bonuses are paid only if the Company has achieved a level of profit that increases corporate value. The desired level of profit is predefined by the board of directors after deliberation by the Compensation Committee, and the board of directors submits to the general shareholders for approval a proposal for the total amount of director bonuses to be paid in a given period, the amount to be commensurate with the level of performance with respect to profit. Furthermore, a portion of the monthly salaries of directors is paid as Epson stock so that remuneration is linked to share price, and to serve as an incentive for improving business performance in the long term.

40
Remuneration paid Category Total remuneration
(millions of yen) Remuneration breakdown
(millions of yen) Number of individuals
Basic salary Bonuses Directors (including total for outside directors)
456
(26)
356
(26)
99
(-)
13
(2)
Corporate auditors (including total for outside corporate auditors)
106
(44)
106
(44)
-
(-)
7
(3)
Total 563 463 99 20 Notes 1. The number of individuals above includes three directors and two corporate auditors who retired at the
closing of the general shareholders’ meeting on June 24, 2014. 2. Epson introduced a stock performance (stock-based) component to the remuneration system to link
remuneration more closely to share price, so Epson stock accounts for a portion of the basic salary. 3. A resolution passed at the general shareholders’ meeting of June 26, 2001, established the maximum base
remuneration at ¥70 million per month for directors and at ¥12 million per month for corporate auditors. 4. The remuneration paid includes ¥99 million in director bonuses (bonuses to be paid to the eight directors,
excluding outside directors), which were approved at the June 25, 2015 regular general shareholders’ meeting. There is no bonus system for corporate auditors.
5. The directors who retired at the closing of the general shareholders’ meeting held on June 24, 2014 were paid a retirement benefit of ¥41 million based on the resolution of the general shareholders’ meeting held on June 23, 2006, on the payment of director retirement benefits.
6. Stock options are not granted. (5) Stock holdings Balance sheet total of stocks held for reasons other than pure investment 22 companies ¥15,925 million Issuing company, number, and balance sheet total of stocks held for reasons other than pure investment
Previous fiscal year
Company Shares (stock) Balance sheet total (millions of yen) Reason held
NGK Insulators, Ltd. 3,757,000 8,077 Maintain and strengthen business ties
Mizuho Financial Group, Inc. 15,008,880 3,061 Maintain and strengthen business ties
Seiko Holdings Corporation 1,644,080 675 Maintain and strengthen business ties
The Hachijuni Bank, Ltd. 489,500 287 Maintain and strengthen business ties
Iwasaki Electric Co., Ltd. 1,000,000 253 Maintain and strengthen business ties
Hakuto Co., Ltd. 190,000 183 Maintain and strengthen business ties

41
Company Shares (stock) Balance sheet total (millions of yen) Reason held
Marubun Corporation. 332,640 178 Maintain and strengthen business ties
King Jim Co., Ltd. 221,980 158 Maintain and strengthen business ties
Otsuka Corporation 10,000 134 Maintain and strengthen business ties
Joshin Denki Co., Ltd. 70,000 57 Maintain and strengthen business ties
Pixelworks, Inc. 100,000 57 Maintain and strengthen business ties
Nippon BS Broadcasting Corporation
16,600 30 Maintain and strengthen business ties
Current Fiscal year
Company Shares (stock) Balance sheet total (millions of yen) Reason held
NGK Insulators, Ltd. 3,757,000 9,636 Maintain and strengthen business ties
Mizuho Financial Group, Inc. 15,008,880 3,168 Maintain and strengthen business ties
Seiko Holdings Corporation 1,644,080 996 Maintain and strengthen business ties
The Hachijuni Bank, Ltd. 489,500 415 Maintain and strengthen business ties
Hakuto Co., Ltd. 190,000 272 Maintain and strengthen business ties
Marubun Corporation 332,640 263 Maintain and strengthen business ties
King Jim Co., Ltd. 221,980 180 Maintain and strengthen business ties
Otsuka Corporation 30,000 153 Maintain and strengthen business ties
Joshin Denki Co., Ltd. 70,000 66 Maintain and strengthen business ties
Pixelworks, Inc. 100,000 60 Maintain and strengthen business ties

42
Company Shares (stock) Balance sheet total (millions of yen) Reason held
Nippon BS Broadcasting Corporation
33,200 41 Maintain and strengthen business ties
Stocks held for pure investment None (6) Accounting audits (a) Names and other details of corporate public accountants performing audits
Name of CPA Audit company No. of successive years performing audits
Designated and Engagement Partner, Certified Public Accountant
Hidetoshi Watanabe
Ernst & Young ShinNihon LLC 2
Designated and Engagement Partner, Certified Public Accountant
Seiji Yamamoto
Ernst & Young ShinNihon LLC 2
Designated and Engagement Partner, Certified Public Accountant
Takahiro Yamazaki
Ernst & Young ShinNihon LLC 4
(b) Composition of auditing team The auditing team comprises 43 staff including 15 certified public accountants, eight junior accountants, and 20 other accounting staff. (7) Outline of contract limiting liability The Company’s contract with the outside directors and outside corporate auditors is based on Article 427, Paragraph 1, of the Japanese Companies Act, and the contract stipulations determining the liability for damages on Article 423, Paragraph 1, of the same law. Said contract also stipulates that the limit of liability for damages shall be the legal maximum. Limited liability is recognized only in cases where the outside directors and the outside corporate auditors performed their duties in good faith and were not grossly negligent. (8) Number of directors Epson’s Articles of Incorporation determine the maximum number of directors to be ten. (9) Election and retirement of directors According to its Articles of Incorporation, directors of the Company can be elected by a majority vote by at least one third of shareholders with voting rights, and not through cumulative voting. Provisions regarding the retirement of directors do not vary from the provisions of the Japanese Companies Act. (10) Items for approval at the General Shareholders’ Meeting that can be determined by the board of
directors Treasury stock acquisition The Company’s Articles of Incorporation allow the Company to acquire treasury stock through stock market trade and other means by resolution of the board of directors. This enables a more flexible capital policy in response to a changing business environment.

43
Director and auditor exemption from liability When liability falls under the requirements stipulated in Article 426, Paragraph 1, of the Japanese Companies Act, the Company’s Articles of Incorporation allow the Company to exempt the directors and auditors from liability for damages in Article 423, Paragraph 1, of the Japanese Companies Act up to the amount remaining after the legal minimum liability is deducted from the total liability amount by resolution of the board of directors. This allows the directors to fully apply themselves to their expected task of building an organization capable of aggressive business expansion, and allows the corporate auditors to fulfill their functions accordingly. Interim dividend The Company’s Articles of Incorporation allow the Company to declare an interim dividend with a date of record of September 30 every year by resolution of the board of directors. This provides the Company with flexibility in paying dividends to shareholders. (11) Special resolution requirements of the General Shareholders’ Meeting The Company’s Articles of Incorporation set forth the requirements for a special resolution of the general shareholders’ meeting stipulated in Article 309, Paragraph 2, of the Japanese Companies Act as a two-thirds majority vote by at least one third of shareholders with voting rights. This policy is intended to ensure the smooth operation of the general shareholders’ meeting by relaxing the quorum requirements for special resolutions at the general shareholders’ meeting.
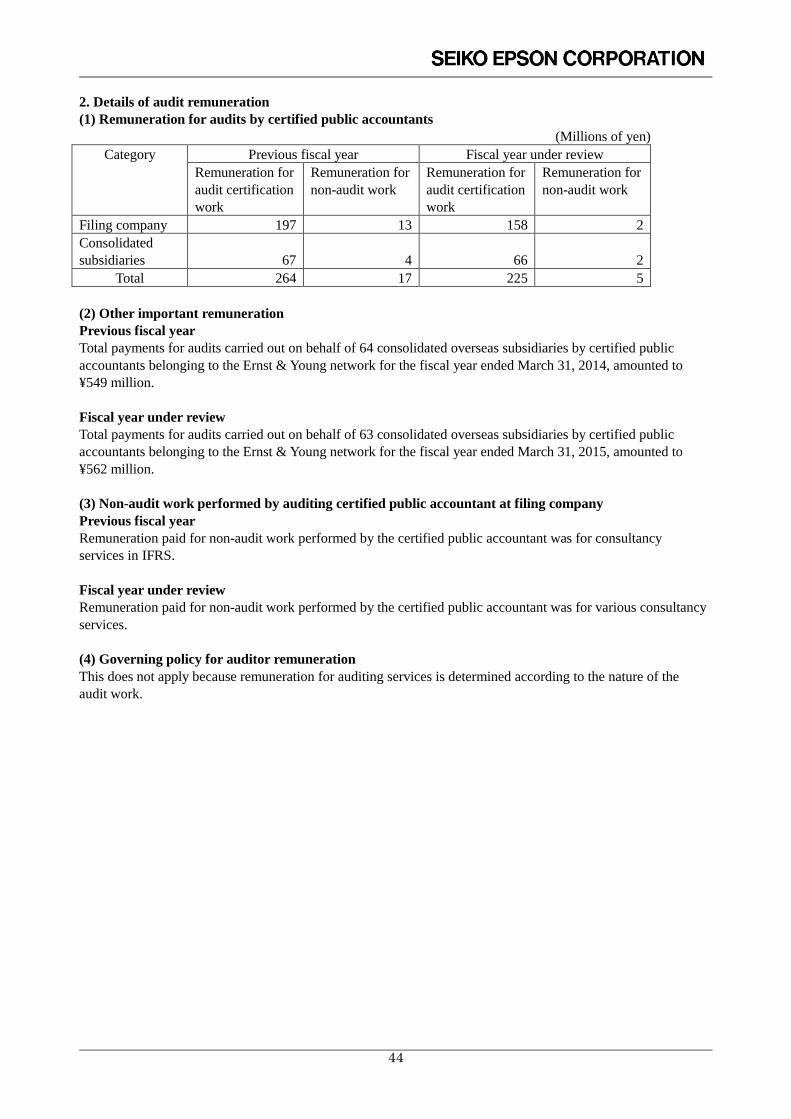
44
2. Details of audit remuneration (1) Remuneration for audits by certified public accountants (Millions of yen)
Category Previous fiscal year Fiscal year under review Remuneration for audit certification work
Remuneration for non-audit work
Remuneration for audit certification work
Remuneration for non-audit work
Filing company 197 13 158 2 Consolidated subsidiaries 67 4 66 2
Total 264 17 225 5 (2) Other important remuneration Previous fiscal year Total payments for audits carried out on behalf of 64 consolidated overseas subsidiaries by certified public accountants belonging to the Ernst & Young network for the fiscal year ended March 31, 2014, amounted to ¥549 million. Fiscal year under review Total payments for audits carried out on behalf of 63 consolidated overseas subsidiaries by certified public accountants belonging to the Ernst & Young network for the fiscal year ended March 31, 2015, amounted to ¥562 million. (3) Non-audit work performed by auditing certified public accountant at filing company Previous fiscal year Remuneration paid for non-audit work performed by the certified public accountant was for consultancy services in IFRS. Fiscal year under review Remuneration paid for non-audit work performed by the certified public accountant was for various consultancy services. (4) Governing policy for auditor remuneration This does not apply because remuneration for auditing services is determined according to the nature of the audit work.

45
3. Basic policy regarding company control At its meeting on April 30, 2008, Epson’s board of directors agreed on a basic policy governing persons who control our financial and business policy decisions (hereinafter the “basic policy”). (1) Overview Epson believes that its shareholders should be determined through free trade on the market. Therefore, the decision as to whether to accept a takeover offer that would allow another party to acquire a controlling share of Epson and thus gain power over the Company’s financial and business decisions should ultimately be put before the shareholders. To ensure and enhance the corporate value and common interests of shareholders, Epson believes it is essential for Epson’s directors, managers, and employees to work as a team to create value, to pursue the Epson tradition of creativity and challenge, and to earn and keep the trust of its customers. Not all large-scale acquisitions of shares enhance the value of the company whose shares are being acquired, nor do they always serve the common interests of shareholders. Epson recognizes the need to use all necessary and appropriate means to protect the Company’s corporate value and the common interests of its shareholders against persons seeking to improperly acquire large numbers of shares in an attempt to gain control over decisions concerning the Company’s financial and business policies. (2) Summary of measures in support of the basic policy 1) Specific actions in support of the basic policy
Under the Updated SE15 Second-Half Mid-Range Business Plan (FY2013–FY2015), the Company remains firmly committed to the strategies outlined in the SE15 Long-Range Corporate Vision but has adopted new tactics and a different emphasis. Under the updated basic policy, Epson will pursue a basic strategy of managing its businesses so that they create steady profit while avoiding any over-emphasis on revenue growth. The top priority will be steady income and cash flow. Going forward, Epson will transform itself into a company that once again posts strong growth by focusing its management resources in areas where it can capitalize on its unique strengths, by expanding its business segments, and by building stronger new businesses that will support Company growth in the future.
2) Efforts to deter parties who are deemed inappropriate based on Epson’s basic policy in gaining control over
the Company’s financial and business policy decision making Aiming to ensure and enhance corporate value and the common interests of its shareholders, Epson
introduced a series of measures to prevent large-scale acquisition of Epson shares. The measures were approved at the June 2008 general meeting of shareholders and updated at the June 2011 general meeting of shareholders. The old measures were formally reworded and shareholders approved their updating at the June 24, 2014 general meeting of shareholders. (The updated measures are called “the Plan,” below.)
The purpose of the Plan is to prevent large-scale acquisitions of Epson stock certificates that do not enhance corporate value or that are not in the common interests of shareholders by having shareholders decide whether to allow such acquisitions and by giving the Epson board of directors the time and information they need to present shareholders with an alternative proposal and enable the board to discuss and negotiate with the acquirer on behalf of shareholders. Specifically, a party that intends to acquire 20% or more of stock certificates outstanding or to stage a takeover bid shall be required to submit in advance to the Epson board of directors a statement of intent as well as sufficient and necessary information for decision making on the part of shareholders and for evaluation and consideration by a special committee. The party shall also be required to comply with the procedures defined in the Plan. Furthermore, the Plan allows for the activation of provisions to halt the acquisition in question if, for example, it is not conducted in line with the Plan or it is deemed contrary to Epson’s value as a company or the common interest of its shareholders.
To prevent the Epson board of directors from making arbitrary decisions about using anti-takeover measures, the decision to invoke preventive measures is subject to the assessment of a special committee made up of highly independent external parties. Actions of the special committee shall include examination of stock acquisition details, requesting information from the Epson board of directors regarding alternative proposals, disclosing information to shareholders, and negotiating with parties intending to make acquisitions. The special committee shall advise the Epson board of directors regarding the necessity of anti-takeover measures, and the Epson board of directors shall promptly accept or reject a resolution to invoke preventive measures, paying the utmost consideration to that advice.

46
(3) Decisions made by the Epson board of directors regarding specific actions and the justification for
those decisions The actions described in (2) 1) above were specifically formulated to enhance both Epson’s corporate value and the common interests of its shareholders in a continuous and sustained manner. These actions support the basic policy. As well as having been introduced and updated in order to ensure and enhance corporate value and the common interests of shareholders, the Plan is in accordance with the basic policy outlined in (1) above. Specifically, the Plan guarantees fairness and objectivity, is reasonable, and supports Epson’s corporate value and the common interests of its shareholders because, among other things, a) it was introduced (and updated) after being approved by shareholders at the general shareholders’ meeting; b) it contains provisions for reasonable and objective implementation; c) a special committee comprising members with a high degree of independence from Epson management was established and activation of the Plan is subject to the assessment of that special committee; d) the special committee may solicit expert opinions from third parties at Epson’s expense; and e) the Plan was determined to be valid for approximately three years and may be abolished by the board of directors at any time. The Plan is not for keeping Epson executive officers in their posts.

47
Management Directors, statutory auditors and executive officers of the Company as of the date when the annual securities report (yukashoken-houkokusho) was submitted and their functions are listed below.
Name Position Current function Minoru Usui President
(Representative Director)
Noriyuki Hama Senior Managing Director (Representative Director)
General Administrative Manager, Management Control Division, and General Administrative Manager, Compliance Office
Shigeki Inoue Managing Director General Administrative Manager, Business Infrastructure Development Division
Yoneharu Fukushima Managing Director Chief Operating Officer, Robotics Solutions Operations Division, and General Administrative Manager, Corporate Research & Development Division
Koichi Kubota
Managing Director Chief Operating Officer, Printer Operations Division
Motonori Okumura Director General Administrative Manager, Imaging Products Key Component Research & Engineering Division
Junichi Watanabe Director Chief Operating Officer, Visual Products Operations Division, and Deputy General Administrative Manager, Business Infrastructure Development Division
Masayuki Kawana Director General Administrative Manager, Human Resources Division, and President, Orient Watch Co., Ltd.
Toshiharu Aoki Outside Director Hideaki Omiya Outside Director Kenji Kubota Standing Statutory
Auditor

48
Seiichi Hirano Standing Statutory Auditor
Yoshiro Yamamoto Outside Statutory Auditor
Kenji Miyahara Outside Statutory Auditor
Michihiro Nara Outside Statutory Auditor
John Lang Managing
Executive Officer President and Chief
Executive Officer, Epson America, Inc.
Tadaaki Hagata Managing Executive Officer
President, Epson Precision (Philippines), Inc.
Kiyofumi Koike Executive Officer Chairman, Epson (China) Co., Ltd.
Yasukazu Kitamatsu Executive Officer Deputy General Administrative Manager, Corporate Research & Development Division
Hideki Shimada Executive Officer Deputy Chief Operating Officer, Printer Operations Division
Masayuki Kitamura Executive Officer Chief Operating Officer, Microdevices Operations Division
Akihiro Fukaishi Executive Officer Deputy Chief Operating Officer, Professional Printing Operations Division
Sunao Murata Executive Officer Chief Operating Officer, Professional Printing Operations Division
Yoshiyuki Moriyama Executive Officer Chief Operating Officer, Wearable Products Operations Division
Toshiya Takahata Executive Officer General Administrative Manager, Intellectual Property Division
Tsuyoshi Kitahara Executive Officer Deputy General Administrative Manager, Corporate Research & Development Division
Naoyuki Saeki Executive Officer President, Epson Sales Japan Corporation
Nobuyuki Shimotome Executive Officer Deputy General Administrative Manager, Corporate Research & Development Division
Kazuyoshi Yamamoto Executive Officer President, Epson Europe B.V.

49
Index to Consolidated Financial Statements Seiko Epson Corporation and Subsidiaries
Consolidated Statement of Financial Position .............................................................................. 50
Consolidated Statement of Comprehensive Income ...................................................................... 52
Consolidated Statement of Changes in Equity.............................................................................. 54
Consolidated Statement of Cash Flows ........................................................................................ 56
Notes to Consolidated Financial Statements ................................................................................. 57
Report of Independent Auditors ................................................................................................. 116

50
Consolidated Statement of Financial Position Years ended March 31, 2014 and 2015:
Thousands ofU.S. dollars
Notes March 31,2014
March 31,2015
March 31,2015
Assets Current assets Cash and cash equivalents 8,35 211,510 245,330 2,041,524 Trade and other receivables 9,35 154,309 167,482 1,393,708 Inventories 10 181,581 220,426 1,834,284 Income tax receivables 2,284 1,963 16,335 Other financial assets 11,35 505 3,544 29,491 Other current assets 12 10,452 11,539 96,050 Subtotal 560,645 650,287 5,411,392 Non-current assets held for sale - 96 799 Total current assets 560,645 650,383 5,412,191 Non-current assets Property, plant and equipment 13,15 222,556 227,257 1,891,129 Intangible assets 14 18,947 19,170 159,524 Investment property 17 10,273 4,758 39,593 Investments accounted for using the equity method
3,858 3,232 26,895
Net defined benefit assets 23 10 7 58 Other financial assets 11,35 21,881 25,345 210,909 Other non-current assets 12 2,931 5,958 49,615 Deferred tax assets 18 67,786 70,168 583,906 Total non-current assets 348,245 355,898 2,961,629 Total assets 908,890 1,006,282 8,373,820
Millions of yen

51
Thousands ofU.S. dollars
Notes March 31,2014
March 31,2015
March 31,2015
Liabilities and equity Liabilities Current liabilities Trade and other payables 19,35 123,463 140,047 1,165,407 Income tax payables 13,689 8,384 69,767 Other financial liabilities 20,35 82,471 75,745 630,315 Provisions 21 22,397 24,322 202,396 Other current liabilities 22 94,064 106,942 889,941 Total current liabilities 336,087 355,442 2,957,826 Non-current liabilities Other financial liabilities 20,35 141,942 112,466 935,890 Net defined benefit liabilities 23 56,362 31,234 259,915 Provisions 21 5,401 6,141 51,102 Other non-current liabilities 22 3,698 2,977 24,801 Deferred tax liabilities 18 640 711 5,916 Total non-current liabilities 208,045 153,531 1,277,624 Total liabilities 544,132 508,973 4,235,450 Equity Share capital 24 53,204 53,204 442,739 Capital surplus 24 84,321 84,321 701,680 Treasury shares 24 (20,457) (20,464) (170,292) Other components of equity 24 49,716 83,073 691,297 Retained earnings 195,587 294,191 2,448,123 Equity attributable to owners of the parent company 362,371 494,325 4,113,547
Non-controlling interests 2,385 2,982 24,823 Total equity 364,757 497,308 4,138,370 Total liabilities and equity 908,890 1,006,282 8,373,820
Millions of yen

52
Consolidated Statement of Comprehensive Income
Years ended March 31, 2014 and 2015:
Thousands of U.S.dollars
Notes 2014 2015
Revenue 7,26 1,008,407 1,086,341 9,040,034
Cost of sales 10,13,14
(645,818) (690,416) (5,745,335)
Gross profit 362,589 395,924 3,294,699
Selling, general and administrative expenses13,14,
27 (272,501) (294,648) (2,451,926)
Other operating income 29 5,998 39,907 332,087Other operating expense 13,30 (16,537) (9,802) (81,576)
Profit from operating activities 79,549 131,380 1,093,284Finance income 31 2,685 3,268 27,194Finance costs 31 (4,428) (2,320) (19,296)Share of profit of investments accounted for using theequity method 170 207 1,722
Profit before tax 77,977 132,536 1,102,904Income taxes 18 9,345 (18,631) (155,047)
Profit from continuing operations 87,322 113,904 947,857Loss from discontinued operations 32 (2,880) (1,118) (9,312)
Profit for the period 84,442 112,785 938,545Other comprehensive income
Items that will not be reclassified subsequently to profit or loss, net of tax
Remeasurement of net defined benefit liabilities (assets) 33 13,086 (1,512) (12,582)Net gain (loss) on revaluation of financial assetsmeasured at FVTOCI (Note)
33 2,785 2,121 17,641
Subtotal 15,871 608 5,059 Items that may be reclassified subsequently to profit or loss, net of tax
Exchange differences on translation of foreignoperations
33 19,378 30,113 250,605
Net changes in fair value of cash flow hedges 33 632 1,718 14,296Share of other comprehensive income of investmentsaccounted for using the equity method
33 154 257 2,138
Subtotal 20,166 32,089 267,039Total other comprehensive income, net of tax 36,038 32,698 272,098 Total comprehensive income for the period 120,480 145,483 1,210,643
(Note) FVTOCI: Fair Value Through Other Comprehensive Income
Millions of yen
Year endedMarch 31,
Year endedMarch 31,
2015
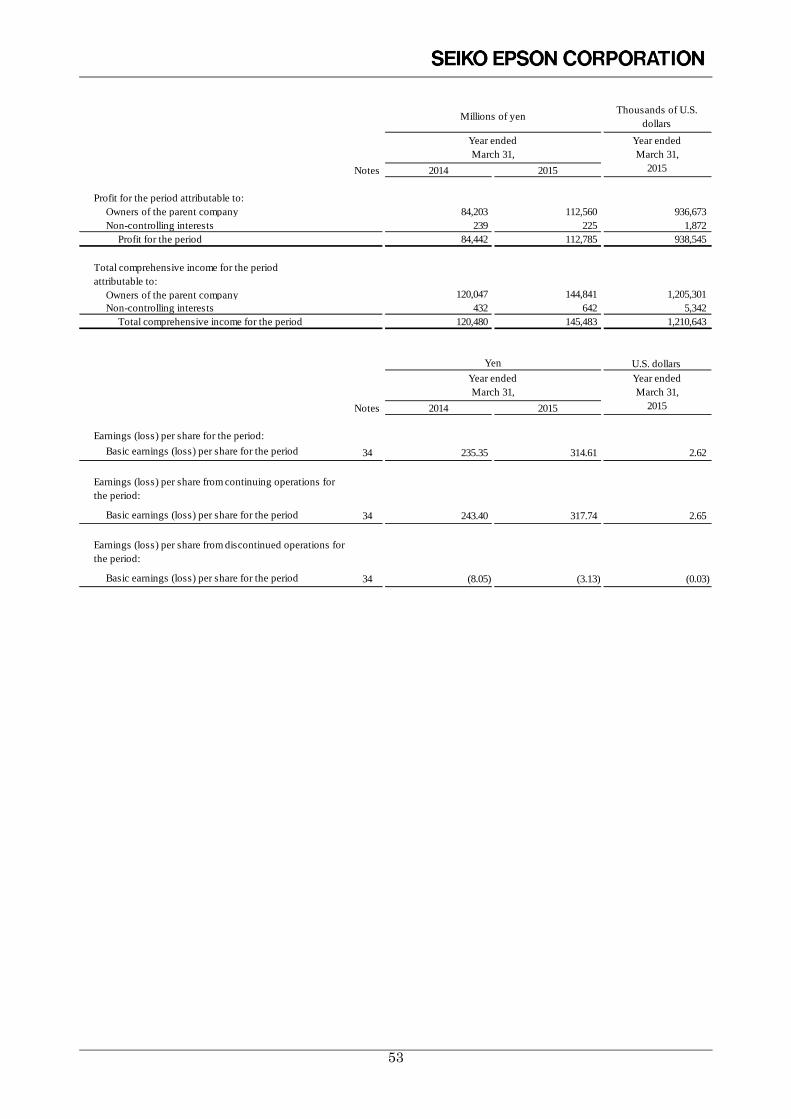
53
Thousands of U.S.dollars
Notes 2014 2015
Profit for the period attributable to:Owners of the parent company 84,203 112,560 936,673Non-controlling interests 239 225 1,872
Profit for the period 84,442 112,785 938,545
Total comprehensive income for the periodattributable to:
Owners of the parent company 120,047 144,841 1,205,301Non-controlling interests 432 642 5,342
Total comprehensive income for the period 120,480 145,483 1,210,643
U.S. dollars
Notes 2014 2015
Earnings (loss) per share for the period:Basic earnings (loss) per share for the period 34 235.35 314.61 2.62
Earnings (loss) per share from continuing operations forthe period:
Basic earnings (loss) per share for the period 34 243.40 317.74 2.65
Earnings (loss) per share from discontinued operations forthe period:
Basic earnings (loss) per share for the period 34 (8.05) (3.13) (0.03)
Millions of yen
Year endedMarch 31,
Year endedMarch 31,
2015
YenYear endedMarch 31,
Year endedMarch 31,
2015

54
Consolidated Statement of Changes in Equity Years ended March 31, 2014 and 2015:
NotesRemeasurement of netdefined benefitliabilities (assets)
Net gain (loss) onrevaluation of financialassets measured atFVTOCI (Note)
Exchange differenceson translation offoreign operations
Net changes in fairvalue of cash flowhedges
Total othercomponents of equity
As of April 1, 2013 53,204 84,321 (20,453) - 2,467 25,785 (1,295) 26,958 101,876 245,905 2,063 247,969Profit (loss) for the period - - - - - - - - 84,203 84,203 239 84,442Other comprehensive income (loss) - - - 13,086 2,864 19,260 632 35,844 - 35,844 193 36,038
Total comprehensive income (loss) for theperiod
- - - 13,086 2,864 19,260 632 35,844 84,203 120,047 432 120,480
Acquisition of treasury shares 24 - - (4) - - - - - - (4) - (4)Dividends 25 - - - - - - - - (3,577) (3,577) (110) (3,688)Acquisition of subsidiary - - - - - - - - - - - -Transfer from other components of equityto retained earnings
- - - (13,086) - - - (13,086) 13,086 - - -
Total transactions with the owners - - (4) (13,086) - - - (13,086) 9,508 (3,581) (110) (3,692)As of March 31, 2014 53,204 84,321 (20,457) - 5,332 45,046 (662) 49,716 195,587 362,371 2,385 364,757
(Note) FVTOCI: Fair Value Through Other Comprehensive Income
Millions of yen
Equity attributable to owners of the parent company
Non-controllinginterests
Total equity
Share capital Capital surplus Treasury shares
Other components of equity
Retainedearnings
Total equityattributable to ownersof the parentcompany
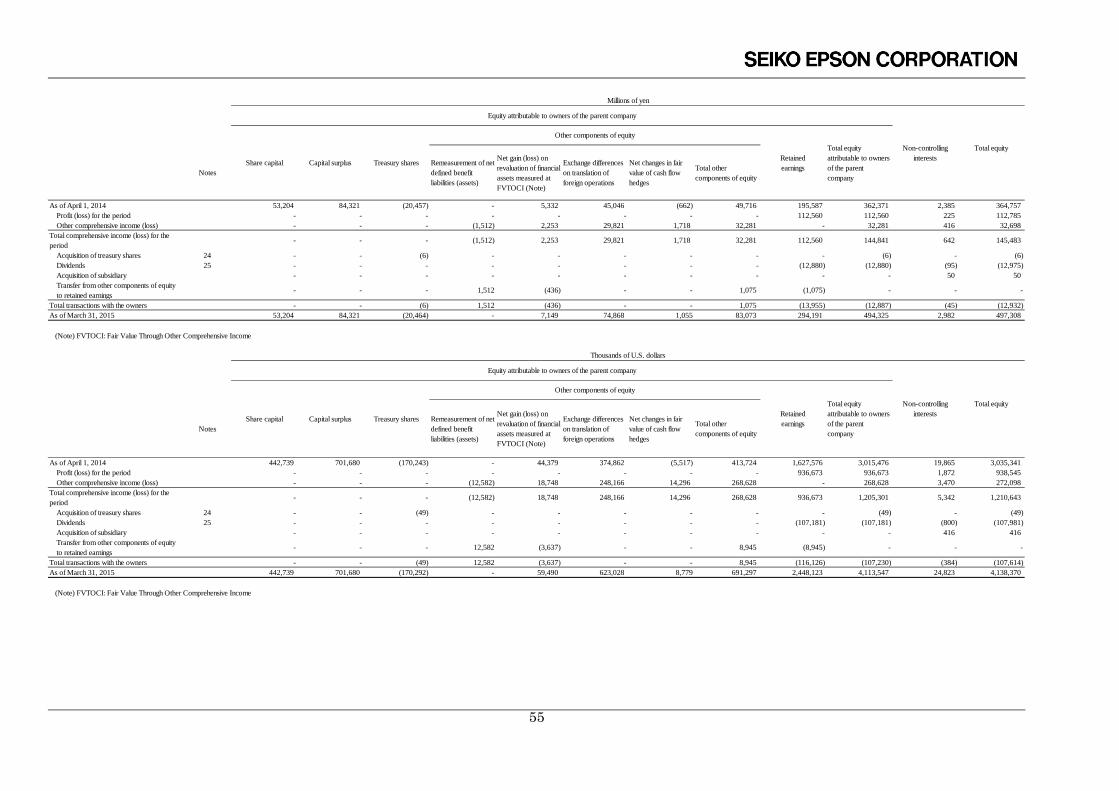
55
NotesRemeasurement of netdefined benefitliabilities (assets)
Net gain (loss) onrevaluation of financialassets measured atFVTOCI (Note)
Exchange differenceson translation offoreign operations
Net changes in fairvalue of cash flowhedges
Total othercomponents of equity
As of April 1, 2014 53,204 84,321 (20,457) - 5,332 45,046 (662) 49,716 195,587 362,371 2,385 364,757Profit (loss) for the period - - - - - - - - 112,560 112,560 225 112,785Other comprehensive income (loss) - - - (1,512) 2,253 29,821 1,718 32,281 - 32,281 416 32,698
Total comprehensive income (loss) for theperiod
- - - (1,512) 2,253 29,821 1,718 32,281 112,560 144,841 642 145,483
Acquisition of treasury shares 24 - - (6) - - - - - - (6) - (6)Dividends 25 - - - - - - - - (12,880) (12,880) (95) (12,975)Acquisition of subsidiary - - - - - - - - - - 50 50Transfer from other components of equityto retained earnings
- - - 1,512 (436) - - 1,075 (1,075) - - -
Total transactions with the owners - - (6) 1,512 (436) - - 1,075 (13,955) (12,887) (45) (12,932)As of March 31, 2015 53,204 84,321 (20,464) - 7,149 74,868 1,055 83,073 294,191 494,325 2,982 497,308
(Note) FVTOCI: Fair Value Through Other Comprehensive Income
NotesRemeasurement of netdefined benefitliabilities (assets)
Net gain (loss) onrevaluation of financialassets measured atFVTOCI (Note)
Exchange differenceson translation offoreign operations
Net changes in fairvalue of cash flowhedges
Total othercomponents of equity
As of April 1, 2014 442,739 701,680 (170,243) - 44,379 374,862 (5,517) 413,724 1,627,576 3,015,476 19,865 3,035,341Profit (loss) for the period - - - - - - - - 936,673 936,673 1,872 938,545Other comprehensive income (loss) - - - (12,582) 18,748 248,166 14,296 268,628 - 268,628 3,470 272,098
Total comprehensive income (loss) for theperiod
- - - (12,582) 18,748 248,166 14,296 268,628 936,673 1,205,301 5,342 1,210,643
Acquisition of treasury shares 24 - - (49) - - - - - - (49) - (49)Dividends 25 - - - - - - - - (107,181) (107,181) (800) (107,981)Acquisition of subsidiary - - - - - - - - - - 416 416Transfer from other components of equityto retained earnings
- - - 12,582 (3,637) - - 8,945 (8,945) - - -
Total transactions with the owners - - (49) 12,582 (3,637) - - 8,945 (116,126) (107,230) (384) (107,614)As of March 31, 2015 442,739 701,680 (170,292) - 59,490 623,028 8,779 691,297 2,448,123 4,113,547 24,823 4,138,370
(Note) FVTOCI: Fair Value Through Other Comprehensive Income
Thousands of U.S. dollars
Equity attributable to owners of the parent company
Non-controllinginterests
Total equity
Share capital Capital surplus Treasury shares
Other components of equity
Retainedearnings
Total equityattributable to ownersof the parentcompany
Millions of yen
Equity attributable to owners of the parent company
Non-controllinginterests
Total equity
Share capital Capital surplus Treasury shares
Other components of equity
Retainedearnings
Total equityattributable to ownersof the parentcompany

56
Consolidated Statement of Cash Flows Years ended March 31, 2014 and 2015:
Thousands of U.S. dollarsYear ended March 31,
Notes 2014 2015 2015Cash flows from operating activities
Profit for the period 84,442 112,785 938,545Depreciation and amortisation 41,375 44,907 373,695Impairment loss 4,429 3,563 29,649Finance (income) costs, net 1,742 (948) (7,898)Share of (profit) loss of investments accounted for using the equitymethod
(170) (207) (1,722)
Loss (gain) on sales and disposal of property, plant and equipment,intangible assets and investment property, net
650 (4,288) (35,682)
Income taxes (9,345) 18,631 155,047Decrease (increase) in trade receivables (7,225) (2,279) (18,964)Decrease (increase) in inventories (1,650) (19,252) (160,206)Increase (decrease) in trade payables 12,148 21 174Increase (decrease) in net defined benefit liabilities (4,830) (25,355) (210,992)Other, net 8,685 8,842 73,570Subtotal 130,251 136,419 1,135,216Interest and dividend income received 2,099 2,481 20,645Interest expenses paid (2,693) (1,552) (12,915)Payments for loss on litigation (4,068) (859) (7,148)Income taxes paid (10,729) (27,660) (230,181)Net cash provided by (used in) operating activities 114,859 108,828 905,617
Cash flows from investing activitiesProceeds from sales of investment securities 14 249 2,072Purchase of property, plant and equipment (33,725) (37,045) (308,271)Proceeds from sales of property, plant and equipment 564 272 2,263Purchase of intangible assets (8,261) (5,738) (47,749)Proceeds from sales of intangible assets 36 29 241Proceeds from sales of investment property 251 14,012 116,601Purchase of investments in subsidiaries - (1,097) (9,128)Other, net (124) (3,417) (28,434)Net cash provided by (used in) investing activities (41,244) (32,735) (272,405)
Cash flows from financing activitiesNet increase (decrease) in current borrowings 2,503 (30,167) (251,036)Repayments of non-current borrowings (75,000) (2,000) (16,670)Proceeds from issuance of bonds issued 20,000 10,000 83,215Redemption of bonds issued - (20,000) (166,430)Payments of lease obligations (379) (241) (2,005)Dividends paid 25 (3,577) (12,880) (107,181)Dividends paid to non-controlling interests (110) (95) (790)Purchase of treasury shares (4) (6) (49)Net cash provided by (used in) financing activities (56,567) (55,392) (460,946)
Effect of exchange rate changes on cash and cash equivalents 9,808 13,118 109,169Net increase (decrease) in cash and cash equivalents 26,856 33,819 281,435Cash and cash equivalents at beginning of period 8 184,654 211,510 1,760,089Cash and cash equivalents at end of period 8 211,510 245,330 2,041,524
Millions of yenYear ended March 31,

57
Notes to Consolidated Financial Statements 1. Reporting Entity Seiko Epson Corporation (the “Company”) is a stock corporation domiciled in Japan. The addresses of the Company’s registered head office and principal business offices are available on the Company’s website (http://www.epson.jp). The details of businesses and principal business activities of the Company and its affiliates (“Epson”) are stated in “7. Segment Information.” 2. Basis of Preparation (1) Compliance with IFRS Epson’s consolidated financial statements are prepared in accordance with International Financial Reporting Standards (hereinafter referred to as “IFRS”) as issued by the International Accounting Standards Board which are applied based on the provision of Article 93 of the Ordinance on Terminology, Forms and Preparation Methods of Consolidated Financial Statements, as Epson meets the criteria of a “Specified company” defined under Article 1-2, Paragraph 1, Item 2 of the Ordinance on Terminology, Forms and Preparation Methods of Consolidated Financial Statements.
(2) Basis of Measurement Except for the financial instruments stated in “3. Significant Accounting Policies,” Epson’s consolidated financial statements are prepared on the cost basis.
(3) Functional Currency and Presentation Currency Epson’s consolidated financial statements are presented in Japanese yen (hereinafter referred to as “yen” or “¥”), which is the functional currency of the Company. The units are in millions of yen unless otherwise noted, and figures less than one million yen are rounded down. The translations of Japanese yen amounts into U.S. dollar amounts are included solely for the convenience of readers outside Japan and have been made at the rate of ¥120.17 to U.S. $1 as of March 31, 2015.
(4) Reporting Period of Subsidiaries The fiscal year end date of certain overseas subsidiaries is December 31, and Epson consolidates financial results of those subsidiaries in conformity with the provisional settlement of accounts as of the consolidated fiscal year end. 3. Significant Accounting Policies (1) Basis of Consolidation The consolidated financial statements include financial statements of Epson, and interests in investments in associates and joint ventures. (A) Subsidiaries A subsidiary is an entity that is controlled by Epson. Epson has control over the entity if it is exposed, or has rights, to variable returns from its involvement with the investee and has the ability to affect those returns through its power over the investee. The acquisition date of a subsidiary is the date on which Epson obtains control of the subsidiary, and the subsidiary is included in the consolidation from the date of acquisition until the date on which Epson loses control. All intergroup balances, transactions, unrealised profit or loss arising from intercompany transaction are eliminated on consolidation. Comprehensive income for subsidiaries is attributed to owners of the parent company and non-controlling interests even if this results in the non-controlling interests having a deficit balance. (B) Associates An associate is an entity over which Epson has significant influence, including the power to participate in the financial and operating policy decisions of the investee. Investments in associates are accounted for using the equity method from the date on which Epson has the significant influence until the date on which it ceases to have the significant influence.

58
(C) Joint Ventures Joint venture is a joint arrangement whereby Epson and the other parties that have joint control of the arrangement which is the contractually agreed sharing of control of an arrangement, which exists only when decisions about the activities that significantly affect the investee’s returns require the unanimous consent of the parties sharing control, have rights to the net assets of the arrangement. Epson accounts for that investment using the equity method. (2) Business Combinations Business combinations are accounted for using the acquisition method. Consideration transferred in a business combination is measured as the sum of the acquisition-date fair value of the assets transferred, the liabilities assumed, all non-controlling interests and equity instruments issued by the Company in exchange for control over an acquiree. Any excess of the consideration of acquisition over the fair value of identifiable assets and liabilities is recognised as goodwill in the consolidated statement of financial position. If the consideration of acquisition is lower than the fair value of the identifiable assets and liabilities, the difference is immediately recognised as profit in the consolidated statement of comprehensive income. Acquisition related costs incurred are recognised as expenses. The additional acquisition of non-controlling interests after obtaining control is accounted for as a capital transaction and no goodwill is recognised with respect to such transaction. (3) Foreign Currency Translation Consolidated financial statements of Epson are presented in Japanese yen, which is the functional currency of the Company. Each company in Epson specifies its own functional currency and measures transactions based on it. Foreign currency transactions are translated into the functional currency at the rates of exchange prevailing at the dates of transactions or an approximation of the rate. Monetary assets and liabilities denominated in foreign currencies are translated into the functional currency at the rates of exchange prevailing at the fiscal year end date. Differences arising from the translation and settlement are recognised as profit or loss. However, exchange differences arising from the translation of financial instruments designated as hedging instruments for net investments in foreign operations (foreign subsidiaries), financial assets measured at fair value through other comprehensive income, and cash flow hedges are recognised as other comprehensive income. The assets and liabilities of foreign operations are translated into Japanese yen at the rates of exchange prevailing at the fiscal year end date, while income and expenses of foreign operations are translated into Japanese yen at the rates of exchange prevailing at the dates of transactions or an approximation to the rate. The resulting translation differences are recognised as other comprehensive income. In cases where foreign operations are disposed of, the cumulative amount of translation differences related to the foreign operations is recognised as profit or loss in the period of disposition. (4) Financial Instruments Epson accounts for financial instruments in accordance with IFRS 9 “Financial Instruments” (announced in November 2009, revised in October 2010), which Epson has early adopted. (A) Financial Assets
(i) Initial Recognition and Measurement Financial assets are classified into financial assets measured at fair value and amortised cost at initial recognition. Financial assets are classified as financial assets measured at amortised cost if both of the following conditions are met. Otherwise, they are classified as financial assets measured at fair value.
(a) The asset is held within a business model whose objective is to hold assets in order to collect contractual cash flows. (b) The contractual terms of the financial asset give rise on specified dates to cash flows that are solely payments of principal and interest on the principal amount outstanding.
For financial assets measured at fair value, each equity instrument is designated as measured at fair value through profit or loss or as measured at fair value through other comprehensive income, except for equity instruments held for trading purposes that must be measured at fair value through profit or loss. Such designations are applied continuously. All financial assets are initially measured at fair value plus transaction costs that are directly attributable to the financial assets, except when classified in the category of financial assets measured at fair value through profit or loss. Epson recognises trade and other receivables on the date they are originated. All other financial assets are recognised on the trade date when Epson becomes a party to the contractual provisions of the instrument.

59
(ii) Subsequent Measurement After initial recognition, financial assets are measured based on the classification as follows:
(a) Financial Assets Measured at Amortised Cost Financial assets measured at amortised cost are measured at amortised cost using the effective interest method. (b) Other Financial Assets Financial assets other than those measured at amortised cost are measured at fair value. Changes in fair value of financial assets measured at fair value are recognised as profit or loss. However, changes in fair value of equity instruments designated as measured at fair value through other comprehensive income are recognised as other comprehensive income and the amount in other comprehensive income is transferred to retained earnings when equity instruments are derecognised or the decline in its fair value is significant. Dividends on the financial assets are recognised in profit or loss for each fiscal year.
(iii) Derecognition Financial assets are derecognised when the contractual rights to the cash flows from them expire or when they are transferred in transactions in which substantially all the risks and rewards of ownership are transferred.
(B) Impairment of Financial Assets At the end of each fiscal year, Epson assesses whether there is any objective evidence that financial assets measured at amortised cost are impaired. Evidence of impairment includes significant financial difficulty of the borrower or a group of borrowers, a default or delinquency in interest or principal payments, and bankruptcy of the borrower. Epson assesses whether objective evidence of impairment exists individually for financial assets that are individually significant and collectively for financial assets that are not individually significant. If there is any objective evidence that impairment losses on financial assets measured at amortised cost have been incurred, the amount of the loss is measured as the difference between the asset’s carrying amount and the present value of estimated future cash flows. When impairment is recognised, the carrying amount of the financial asset is reduced by an allowance account for credit losses and impairment losses are recognised in profit or loss. The carrying amount of financial assets measured at amortised cost is directly reduced for the impairment when they are expected to become uncollectible in the future and all collaterals are implemented or transferred to Epson. If the amount of the impairment losses provided decreases due to an event occurring after the impairment was recognised, the previously recognised impairment losses are reversed into profit through the allowance account for credit losses. (C) Financial Liabilities
(i) Initial Recognition and Measurement Financial liabilities are classified into financial liabilities measured at fair value through profit or loss and financial liabilities measured at amortised cost. Epson determines the classification at initial recognition. All financial liabilities are measured at fair value at initial recognition. However, financial liabilities measured at amortised cost are measured at cost after deducting transaction costs that are directly attributable to the financial liabilities. (ii) Subsequent Measurement After initial recognition, financial liabilities are measured based on the classification as follows:
(a) Financial Liabilities Measured at Fair Value through Profit or Loss Financial liabilities measured at fair value through profit or loss include financial liabilities designated as measured at fair value through profit or loss at initial recognition. (b) Financial Liabilities Measured at Amortised Cost After initial recognition, financial liabilities measured at amortised cost are measured at amortised cost using the effective interest method. Amortisation under the effective interest method and gains or losses on derecognition are recognised as profit or loss in the consolidated statement of comprehensive income.
(iii) Derecognition Financial liabilities are derecognised when the obligation is discharged, canceled or expired.

60
(D) Offsetting of Financial Assets and Financial Liabilities Financial assets and financial liabilities are offset and presented as a net amount in the consolidated statement of financial position only when there is a legally enforceable right to set off the recognised amounts and Epson intends either to settle on a net basis or to realize the asset and settle the liability simultaneously. (E) Derivatives Accounting Epson utilizes derivatives, including forward foreign exchange contracts and non-deliverable forwards, to hedge foreign exchange and interest rate risks. These derivatives are initially measured at fair value when the contract is entered into, and are subsequently remeasured at fair value. Changes in fair value of derivatives are recognised as profit or loss in the consolidated statement of comprehensive income. However, the gains or losses on hedging instruments relating to the effective portion of cash flow hedges and hedges of net investments in foreign operations are recognised as other comprehensive income in the consolidated statement of comprehensive income. (F) Hedge Accounting At the inception of a hedge, Epson formally designates and documents the hedging relationship to which hedge accounting is applied and the objectives and strategies of risk management for undertaking the hedge. The documentation includes identification of hedging instruments, the hedged items or transactions, the nature of the risks being hedged and how the hedging instrument’s effectiveness is assessed in offsetting the exposure to changes in the hedged item’s fair value or cash flows attributable to the hedged risks. Even though these hedges are expected to be highly effective in offsetting changes in fair value or cash flows, they are assessed on an ongoing basis and determined actually to have been highly effective throughout the financial reporting periods for which the hedges were designated. Hedges that meet the requirements for hedge accounting are classified in the following categories.
(i) Fair Value Hedge Changes in fair value of derivatives are recognised as profit or loss in the consolidated statement of comprehensive income. Regarding changes in fair value of hedged items attributable to the hedged risks, the carrying amount of the hedged item is adjusted and the change is recognised as profit or loss in the consolidated statement of comprehensive income. (ii) Cash Flow Hedge The effective portion of gains or losses on hedging instruments is recognised as other comprehensive income in the consolidated statement of comprehensive income, while the ineffective portion is recognised immediately as profit or loss in the consolidated statement of comprehensive income. The amounts of hedging instruments recognised in other comprehensive income are reclassified to profit or loss when the transactions of the hedged items affect profit or loss. In cases where hedged items result in the recognition of non-financial assets or liabilities, the amounts recognised as other comprehensive income are accounted for as adjustments to the initial carrying amount of non-financial assets or liabilities. When forecast transactions or firm commitments are no longer expected to occur, any related cumulative gains or losses that have been recognised in other components of equity as other comprehensive income are reclassified to profit or loss. When hedging instruments expire, are sold, terminated or exercised without the replacement or rollover of other hedging instruments, or when the hedge designation is revoked, amounts that have been recognised in other components of equity through other comprehensive income continue to be recognised in other component of equity until the forecast transactions or firm commitments occur. (iii) Hedge of Net Investment in Foreign Operations The hedge of net investment in foreign operations is accounted for similarly to a cash flow hedge. The effective portion of gains or losses on hedging instruments is recognised as other comprehensive income in the consolidated statement of comprehensive income, while the ineffective portion is recognised as profit or loss in the consolidated statement of comprehensive income. At the time of the disposal of the foreign operations, any related cumulative gains or losses that have been recognised in other components of equity as other comprehensive income are reclassified to profit or loss.
(G) Fair Value of Financial Instruments Fair value of financial instruments that are traded in active financial markets at the fiscal year end refers to quoted market prices or dealer quotations. If there is no active market, fair value of financial instruments is determined using appropriate valuation models.

61
(5) Cash and Cash Equivalents Cash and cash equivalents consist of cash on hand, demand deposits, and short-term investments that are readily convertible to known amounts of cash and subject to insignificant risk of change in value and due within three months from the date of acquisition. (6) Inventories The cost of inventories includes all costs of purchase, costs of conversion and other costs incurred in bringing the inventories to their present location and condition. Inventories are measured at the lower of cost or net realizable value, and the costs are determined by using the weighted-average method. Net realizable value is determined as the estimated selling price in the ordinary course of business less the estimated costs of completion and estimated costs necessary to make the sale. (7) Property, Plant and Equipment Property, plant, and equipment is measured by using the cost model and is stated at cost less accumulated depreciation and accumulated impairment losses. The cost includes any costs directly attributable to the acquisition of the asset and dismantlement, removal and restoration costs, as well as borrowing costs eligible for capitalisation. Except for assets that are not subject to depreciation such as land, assets are depreciated using the straight-line method over their estimated useful lives. The estimated useful lives of major asset items were as follows: • Buildings and structures: 10 to 35 years • Machinery and vehicles: 2 to 12 years The estimated useful lives, depreciation method and residual value are reviewed at each fiscal year end and if there are any changes made to the estimated useful lives, depreciation method and residual value, such changes are accounted for on a prospective basis as changes in estimate. (8) Intangible Assets (A) Goodwill Goodwill is measured at cost less accumulated impairment losses. Goodwill is not amortised. It is allocated to cash-generating units that are identified according to locations and types of businesses and tested for impairment annually or whenever there is any indication of impairment. Impairment losses on goodwill are recognised as profit or loss in the consolidated statement of comprehensive income and not reversed in subsequent periods. (B) Intangible Assets other than Goodwill Intangible assets are measured by using the cost model and are stated at cost less accumulated amortisation and accumulated impairment losses. Intangible assets acquired separately are measured at cost at the initial recognition, and the costs of intangible assets acquired through business combinations are recognised at fair value at the acquisition date. Expenditures on internally generated intangible assets are recognised as expenses in the period incurred, except for development expense that satisfy the capitalisation criteria. Intangible assets with finite useful lives are amortised using the straight-line method over their estimated useful lives and are tested for impairment whenever there is any indication of impairment. The estimated useful lives and amortisation method of intangible assets with finite useful lives are reviewed at fiscal year end, and the effect of any changes in estimate would be accounted for on a prospective basis. The estimated useful life of major intangible assets with finite useful lives was as follows: • Software: 3 to 5 years Intangible assets with indefinite useful lives and intangible assets that are not ready to use are not amortised, but they are tested for impairment individually or by cash-generating unit annually or whenever there is any indication of impairment. (9) Leases Leases are classified as finance leases whenever substantially all the risks and rewards incidental to ownership are transferred to Epson. All other leases are classified as operating leases. In finance lease transactions, leased assets and lease obligations are recognised in the consolidated statement of financial position at the lower of the fair value of the leased property or the present value of the minimum lease payments, each determined at the inception of the lease. Lease payments are apportioned between the finance cost and the reduction of the lease obligations based on the effective interest method. Leased assets are depreciated using the straight-line method over the shorter of their estimated useful lives or lease terms.

62
In operating lease transactions, lease payments are recognised as an expense using the straight-line method over the lease terms in the consolidated statement of comprehensive income. Contingent rents are recognised as an expense in the period in which they are incurred. Determining whether an arrangement is, or contains, a lease is based on the substance of the arrangement in accordance with the terms of that, whether fulfilment of the arrangement is dependent on the use of a specific asset or assets (the asset) and the arrangement conveys a right to use the asset, even if the arrangement does not take the legal form of a lease. (10) Investment Property Investment property is property held to earn rentals or for capital appreciation or both. Investment property is measured by using the cost model and is stated at cost less accumulated depreciation and accumulated impairment losses. The estimated useful life of major investment property is 35 years. (11) Impairment of Non-financial Assets Epson assesses for each fiscal year whether there is any indication that an asset may be impaired. If any such indication exists, or in cases where the impairment test is required each fiscal year, the recoverable amount of the asset is estimated. If the recoverable amount cannot be estimated for each asset, it is estimated by the cash-generating unit to which the asset belongs. The recoverable amount of an asset or a cash-generating unit is determined at the higher of its fair value less sales costs or its value in use. If the carrying amount of the asset or cash-generating unit exceeds the recoverable amount, impairment losses are recognised and the carrying amount is reduced to the recoverable amount. In determining the value in use, estimated future cash flows are discounted to the present value, using pretax discount rates that reflect current market assessments of the time value of money and the risks specific to the asset. Epson assesses whether there is any indication that impairment losses recognised in prior years for an asset other than goodwill may no longer exist or may have decreased, such as any changes in assumptions used for the determination of the recoverable amount. If any such indication exists, the recoverable amount of the asset or cash- generating unit is estimated. If the recoverable amount exceeds the carrying amount of the asset or cash-generating unit, impairment losses are reversed up to the lower of the estimated recoverable amount or the carrying amount (net of depreciation) that would have been determined if no impairment losses had been recognised in prior years. (12) Non-current Assets Held-for-Sale and Discontinued Operations An asset or asset group whose value is expected to be recovered through a sales transaction rather than through continuing use is classified into a non-current asset and disposal group held-for-sale when the following conditions are met: it is highly probable that the asset or asset group will be sold within one year, the asset or asset group is available for immediate sale in its present condition, and Epson management commits to the sale plan. In such cases, the non-current asset is not depreciated or amortised and is measured at the lower of its carrying amount or its fair value less sales costs. Assets and asset groups that have already been disposed of or that are classified as held-for-sale are recognised as discontinued operations when they meet any of the following: • Separate major line of business or geographical area of operations • Part of a single co-ordinated plan to dispose of a separate major line of business or geographical area of operations • Subsidiary acquired exclusively with a view to resale (13) Post-employment Benefits Epson sponsors defined benefit plans and defined contribution plans as post-employment benefits plans. For each defined benefit plan, Epson calculates the present value of defined benefit obligations, related current service cost and past service cost using the projected unit credit method. For a discount rate, a discount period is determined based on the period until the expected date of benefit payment in each fiscal year, and the discount rate is determined by reference to market yields for the period corresponding to the discount period at the fiscal year end date on high quality corporate bonds. Net of liabilities or assets for defined benefit plans are calculated by the present value of the defined benefit obligation, deducting the fair value of any plan assets (including adjustments for the asset ceiling for defined benefit plans and minimum funding requirements, if necessary). Net interest costs derived from net of liabilities or assets for defined benefit plans are recognised as finance costs. Remeasurements of net of liabilities or assets for defined benefit plans are recognised in full as other comprehensive income in the period when they are incurred and transferred to retained earnings immediately. Past service costs are recognised as profit or loss at the earlier of when a plan amendment or scale down occurs and when any related restructuring costs or termination benefits are recognised. The expenses for post-employment benefits for defined contribution plans are recognised as expenses at the time of contribution.

63
(14) Provisions Epson recognises provisions when it has legal obligations or constructive obligations resulting from prior events and when it is probable that the obligations are required to be settled and the amount of the obligations can be estimated reliably. Where the effect of the time value of money is material, the amount of provisions is measured at the present value of the expenditures expected to be required to settle the obligations. (15) Revenue (A) Sale of Goods Epson sells information-related equipment, devices and precision products, and sensing and industrial solutions. Revenue from the sale of these goods is recognised when the significant risks and rewards of ownership of the goods transfer to the buyers, Epson retains neither continuing managerial involvement nor effective control over the goods sold, it is probable that the future economic benefits will flow to Epson, and the amount of revenue and the corresponding costs can be measured reliably. Therefore, revenue is usually recognised at the time of delivery of goods to customers. In addition, revenue is recognised at fair value of the consideration received or receivable less discounts and rebates. (B) Interest Income Interest income is recognised using the effective interest rate method. (C) Dividend Income Dividend income is recognised when the shareholder’s right to receive payment is established. (D) Royalties Royalties are recognised on an accrual basis in accordance with the substance of the relevant agreement. (E) Rendering of Services Revenues arising from rendering of services are recognised by reference to the stage of completion of the transaction as of the fiscal year end date when the service is provided. (16) Government Grants A government grant is recognised at fair value when there is a reasonable assurance that the entity will comply with the conditions attaching to it, and that the grant will be received. Government grants that are related to expense items are recognised in profit on a systematic basis over the periods in which the entity recognises as expenses the related costs for which the grants are intended to compensate, and unexpired grants are recognised in liabilities as deferred income. With regard to government grants related to assets, the amount of the grants is deducted from the cost of the assets. (17) Borrowing Costs With respect to assets that require a substantial period of time to get ready for their intended use or sale, the borrowing costs that are directly attributable to the acquisition, construction or production of the assets are capitalized as part of the cost of the assets. Other borrowing costs are recognised as an expense in the period when they are incurred. (18) Income Taxes Income taxes in the consolidated statement of comprehensive income are presented as the total of current tax expense and deferred tax expense. Current tax expense is measured at the amount that is expected to be paid to or refunded from the taxation authorities. For the calculation of the tax amount, Epson uses the tax rates and tax laws that have been enacted or substantively enacted by the fiscal year end date. The current tax expense is recognised in profit or loss, except for taxes arising from items that are recognised in other comprehensive income or directly in equity and taxes arising from business combinations. Deferred tax expense is calculated based on the temporary differences between the tax base and accounting bases for assets and liabilities at the fiscal year end date. Deferred tax assets are recognised for deductible temporary differences, carryforward of unused tax credits and unused tax losses to the extent that it is probable that future taxable profit will be available against which they can be utilized. Deferred tax liabilities are recognised for all taxable temporary differences.
64
The deferred tax assets or liabilities are not recognised for the following temporary differences: • The initial recognition of goodwill • The initial recognition of assets or liabilities in transactions that are not business combinations and affect neither accounting profit nor taxable profit or tax loss at the time of transaction • Deductible temporary differences arising from investments in subsidiaries and associates, and interests in joint ventures to the extent that it is probable that the temporary differences will not reverse in the foreseeable future and it is not probable that future taxable profits will be available against which they can be utilized • Taxable temporary differences arising from investments in subsidiaries and associates, and interests in joint ventures to the extent that the timing of the reversal of the temporary difference is controlled and it is probable that the temporary differences will not reverse in the foreseeable future. Deferred tax assets and liabilities are measured at the tax rates that are expected to apply to the fiscal year when the asset is realized or the liability is settled, based on tax rates that have been enacted or substantively enacted by the fiscal year end date. (19) Treasury Shares Treasury shares are recognised at cost and deducted from equity. No profit or loss is recognised on the purchase, sale or cancellation of the treasury shares. Any difference between the carrying amount and the consideration paid is recognised in capital surplus. (20) Earnings per Share Basic earnings per share are calculated by dividing profit or loss attributable to ordinary shareholders of the parent company by the weighted-average number of ordinary shares outstanding during the year, adjusted by the number of treasury shares. (21) Dividends Year-end dividend distributions to the shareholders of the Company are recognised as liabilities in the period in which the distribution is approved by the Annual Shareholders’ Meeting. Interim dividend distributions are recognised as liabilities in the period in which the distribution is approved by Epson’s Board of Directors. (22) Contingencies (A) Contingent Liabilities Epson discloses contingent liabilities in the notes to consolidated financial statements if it has possible obligations at the fiscal year end date but their existence cannot be confirmed at that date, or if it has present obligations as a result of past events but which those obligations do not meet the recognition criteria of a provision. (B) Contingent Assets Epson discloses contingent assets in the notes to consolidated financial statements if an inflow of future economic benefits to Epson is probable, but not virtually certain at the fiscal year end date. (23) Reclassification Certain reclassifications have been made to the prior year amounts to conform to the current year presentation.

65
4. Significant Accounting Estimates and Judgments The preparation of Epson’s consolidated financial statements includes management estimates and assumptions in order to measure income, expenses, assets and liabilities, and disclosed contingencies as of the fiscal year end date. These estimates and assumptions are based on the best judgment of management in light of historical experience and various factors deemed to be reasonable as of the fiscal year end date. Given their nature, actual results may differ from those estimates and assumptions. The estimates and assumptions are continuously reviewed by management. The effects of a change in estimates and assumptions are recognised in the period of the change and subsequent periods. Among the above estimates and assumptions, the following were items that may have a material effect on the amounts recognised in Epson’s consolidated financial statements: (1) Impairment of Property, Plant and Equipment, Goodwill, Intangible Assets and Investment Property Epson performs an impairment test for property, plant and equipment, goodwill, intangible assets and investment property when there is any indication that the recoverable amount has fallen below the carrying amount of the assets. The impairment test is performed by comparing the carrying amount and the recoverable amount of assets. If the recoverable amount falls below the carrying amount, impairment losses are recognised. The recoverable amount is mainly calculated based on the discounted cash flow model. Certain assumptions are made for the useful lives and the future cash flows of the assets, discount rates and long-term growth rates. These assumptions are based on the best estimates and judgments of management, but they could be affected by variable and uncertain future economic conditions. Any changes in these assumptions could have a material impact on Epson’s consolidated financial statements in future periods. The method for calculating the recoverable amount is stated in “13. Property, Plant and Equipment.” (2) Post-employment Benefits Epson has several types of post-employment benefit plans, including defined benefit plans. The present value of defined benefit obligations on each of these plans and the related service costs and others are calculated based on actuarial assumptions. These actuarial assumptions require estimates and judgments on variables, such as discount rates. The actuarial assumptions are determined based on the best estimates and judgments of management, but they could be affected by variable and uncertain future economic conditions. Any changes in these assumptions could have a material impact on Epson’s consolidated financial statements in future periods. These actuarial assumptions and related sensitivity analysis are stated in “23. Post-employment Benefits.” (3) Provisions Epson recognises various provisions, including provisions for product warranties and provisions for loss on litigation, in the consolidated statement of financial position. These provisions are recognised based on the best estimates of the expenditures required to settle the obligations, taking into account risks and uncertainty related to the obligations as of the fiscal year end date. Expenditures necessary for settling the obligations are calculated by taking all possible future results into account; however, they may be affected by unexpected events or changes in conditions which may have a material impact on Epson’s consolidated financial statements in future periods. The nature and amount of recognised provisions are stated in “21. Provisions.” (4) Income Taxes Epson, which conducts business around the world, makes reasonable estimates of income tax to be paid to local tax authorities in accordance with local laws and regulations, and recognises income taxes payable and current tax expense based on these estimates. Calculating income taxes payable and current tax expense requires estimates and judgments on various factors, including, for example, the interpretation of tax regulations by taxable entities and the tax authority in the jurisdiction or experience of prior tax investigation. Therefore, there may be differences between the amount recognised as income taxes payable and current tax expense and the amount of actual income taxes payable and current tax expense. These differences may have a material impact on Epson’s consolidated financial statements in future periods. In addition, deferred tax assets are recognised to the extent that it is probable that taxable income will be available against which deductible temporary differences can be utilised. In recognizing the deferred tax assets, Epson judges

66
the possibility of future taxable income and reasonably estimate the timing and amount of future taxable income based on the business plan. The timing and amount of taxable income may be affected by variable and uncertain future economic conditions, and changes could have a material impact on Epson’s consolidated financial statements in future periods. The content and amounts related to income taxes are stated in “18. Income Taxes.” (5) Contingencies With regard to contingencies, any items that may have a material impact on business in the future are disclosed in light of all the available evidence as of the fiscal year end date and by taking into account the probability of these contingencies and their impact on financial reporting. The content of contingencies is stated in “39. Contingencies.” 5. Changes in Accounting Policies The following are the accounting standards and interpretations applied by Epson from fiscal year 2014 ended March 31, 2015. These standards and interpretations did not have a material impact on the consolidated financial statements of Epson.
IFRS Summaries of new or amended IFRS standards or interpretations
IFRS 10 Consolidated Financial Statements Accounting for investments held by investment entities IFRS 12 Disclosure of Interests in Other
Entities Additional disclosure for investments held by investment entities
IAS 32 Financial Instruments: Presentation
Clarification of criteria for offsetting financial assets and liabilities and addition of application guidance
IAS 36 Impairment of Assets Disclosure of recoverable amounts for non-financial assets
IAS 39 Financial Instruments: Recognition and Measurement
Exception to the requirement for the discontinuation of hedge accounting
IFRIC 21 Levies Recognition of liabilities related to levies 6. New Accounting Standards Not Yet Adopted Basis of preparation by the date of approval of the consolidated financial statements, new accounting standards, amended standards and new interpretations that have been issued, but have not been early adopted by Epson are as follows. The implications from adoption of these standards and interpretations are assessed by Epson; however, based on the Company’s evaluation, none of them will have a material impact on its operating results and financial condition.
IFRS Mandatory adoption
(from the year beginning)
Timing of adoption by
Epson Description of new and revised standards
IFRS 9 Financial Instruments
January 1, 2018 To be determined Amendments to hedge accounting Limited changes to classification and measurement of financial assets, and introduction of an expected credit loss impairment model
IFRS 15 Revenue from Contracts with Customers
January 1, 2017 To be determined Amendments to accounting treatment for recognising revenue

67
7. Segment Information (1) Outline of Reportable Segments The reportable segments of Epson are determined based on the operating segments that are components of Epson about which separate financial information is available and are evaluated regularly by the Board of Directors in deciding how to allocate resources and in assessing performance. Epson is mainly engaged in the manufacture and sale of “Information-related equipment”, “Devices & precision products” and “Sensing & industrial solutions”. The reportable segments of Epson are composed of three segments. They are determined by types of products, nature of products, and markets. Epson conducts development, manufacturing and sales within its reportable segments as follows:
Reportable segments Main products Information-related equipment
Inkjet printers, page printers, color image scanners, commercial inkjet printers, serial impact dot matrix printers, printers for use in POS systems, inkjet label printers and related consumables, 3LCD projectors, HTPS-TFT panels for 3LCD projectors, label printers, smart glasses, personal computers and others.
Devices & precision products
Crystal units, crystal oscillators, quartz sensors, CMOS LSIs, watches, watch movements, metal powders, surface finishing and others.
Sensing & industrial solutions
Industrial robots, IC handlers, industrial inkjet printing systems, sensing systems and others.

68
(2) Revenues and Performances for Reportable Segments Revenues and performances for reportable segments were as follows. Transactions between the segments were mainly based on prevailing market prices. FY2013: Year ended March 31, 2014
Millions of yen Reportable segments
Other
(Note 2)
Adjustments (Note 3)
Consolidated Information- related equipment
Devices & precision products
Sensing & industrial solutions
Subtotal
Revenue External revenue 840,783 143,905 15,964 1,000,653 892 6,862 1,008,407 Inter-segment revenue 444 4,873 210 5,529 441 (5,970) - Total revenue 841,228 148,779 16,174 1,006,182 1,333 891 1,008,407
Segment profit (loss) (Business profit (loss)) (Note 1)
123,778 10,857 (9,975) 124,661 (260) (34,312) 90,087
Other operating income (expense) (10,538)
Profit from operating activities 79,549
Finance income (costs), net (1,742)
Share of profit of investments accounted for using the equity method
170
Profit before tax 77,977 Other items Reportable segments
Other (Note 2)
Adjustments
Consolidated
Information-related equipment
Devices & precision products
Sensing & industrial solutions
Subtotal
Depreciation and amortisation expense (27,365) (7,638) (728) (35,732) (21) (4,957) (40,711)
Impairment losses on other than financial assets
(200) (106) (359) (665)
- (3,763) (4,429)
Segment assets 434,296 123,742 11,876 569,915 845 338,129 908,890 Capital expenditures 26,452 7,984 696 35,132 10 3,846 38,989
(Note 1) Segment profit (loss) (Business profit (loss)) is calculated by subtracting cost of sales and selling, general and administrative expenses from revenue. (Note 2) “Other” consists of the intra-group services. (Note 3) Adjustments to business profit of (¥34,312) million comprised “Eliminations” of ¥145 million and “Corporate expenses” of (¥34,458) million. The corporate expenses included expenses relating to research and development for new businesses and basic technology, and general corporate expenses which are not attributed to reportable segments.

69
FY2014: Year ended March 31, 2015 Millions of yen Reportable segments
Other (Note 2)
Adjustments
(Note 3)
Consolidated
Information-related equipment
Devices & precision products
Sensing & industrial solutions
Subtotal
Revenue External revenue 906,701 150,292 23,182 1,080,176 808 5,356 1,086,341 Inter-segment revenue 594 6,004 213 6,813 581 (7,395) - Total revenue 907,296 156,297 23,396 1,086,989 1,390 (2,038) 1,086,341
Segment profit (loss) (Business profit (loss)) (Note 1)
133,665 14,842 (9,036) 139,471 (318) (37,877) 101,275
Other operating income (expense) 30,104
Profit from operating activities 131,380 Finance income (costs), net 948
Share of profit of investments accounted for using the equity method
207
Profit before tax 132,536
Other items Reportable segments
Other
(Note 2)
Adjustments
Consolidated
Information-related equipment
Devices & precision products
Sensing & industrial solutions
Subtotal
Depreciation and amortisation expense (31,424) (7,769) (668) (39,862) (20) (4,595) (44,478) Impairment losses on other than financial assets
(120) (346) (243) (710) - (2,852) (3,563)
Segment assets 488,289 127,714 14,710 630,714 564 375,003 1,006,282 Capital expenditures 24,028 7,152 1,737 32,918 11 8,181 41,112
(Note 1) Segment profit (loss) (Business profit (loss)) is calculated by subtracting cost of sales and selling, general and administrative expenses from revenue. (Note 2) “Other” consists of the intra-group services. (Note 3) Adjustments to business profit of (¥37,877) million comprised “Eliminations” of ¥335 million and “Corporate expenses” of (¥38,213) million. The corporate expenses included expenses relating to research and development for new businesses and basic technology, and general corporate expenses which are not attributed to reportable segments.

70
FY2014: Year ended March 31, 2015 Thousands of U.S. dollars Reportable segments
Other
(Note 2)
Adjustments (Note 3)
Consolidated Information-related equipment
Devices & precision products
Sensing & industrial solutions
Subtotal
Revenue External revenue 7,545,145 1,250,670 192,918 8,988,733 6,732 44,569 9,040,034 Inter-segment revenue 4,960 49,962 1,772 56,694 4,834 (61,528) -
Total revenue 7,550,105 1,300,632 194,690 9,045,427 11,566 (16,959) 9,040,034
Segment profit (loss) (Business profit (loss)) (Note 1)
1,112,299 123,508 (75,193) 1,160,614 (2,646) (315,195) 842,773
Other operating income (expense) 250,511
Profit from operating activities 1,093,284 Finance income (costs), net 7,898
Share of profit of investments accounted for using the equity method
1,722
Profit before tax 1,102,904
Other items Reportable segments
Other (Note 2)
Adjustments
Consolidated
Information-related equipment
Devices & precision products
Sensing & industrial solutions
Subtotal
Depreciation and amortisation expense (261,505) (64,650) (5,558) (331,713) (166) (38,246) (370,125)
Impairment losses on other than financial assets
(1,007) (2,879) (2,022) (5,908) - (23,741) (29,649)
Segment assets 4,063,328 1,062,777 122,409 5,248,514 4,693 3,120,613 8,373,820 Capital expenditures 250,920 64,500 9,669 325,089 99 52,834 378,022 (Note 1) Segment profit (loss) (Business profit (loss)) is calculated by subtracting cost of sales and selling, general and administrative expenses from revenue. (Note 2) “Other” consists of the intra-group services. (Note 3) Adjustments to business profit of ($315,195) thousand comprised “Eliminations” of $2,796 thousand and “Corporate expenses” of ($317,991) thousand. The corporate expenses included expenses relating to research and development for new businesses and basic technology, and general corporate expenses which are not attributed to reportable segments.

71
(3) Geographic Information The regional breakdowns of non-current assets and external revenues as of each fiscal year end were as follows: Non-current Assets
Millions of yen Thousands of U.S. dollars
March 31, March 31, 2014 2015 2015
Japan 175,034 163,689 1,362,145 The Americas 4,840 6,776 56,386 China(including Hong Kong) 23,498 26,464 220,221 Other 55,193 63,447 528,004
Total 258,567 260,377 2,166,756 (Note) Non-current assets, excluding other financial assets, deferred tax assets and retirement benefits assets, are segmented by the location of the assets. External Revenue
Millions of yen Thousands of U.S. dollars
Year ended March 31, Year ended March 31, 2014 2015 2015
Japan 280,936 276,238 2,298,726 The United States 177,935 205,215 1,707,705 China(including Hong Kong and Macao) 132,504
148,176
1,233,053
Other 417,031 456,710 3,800,550 Total 1,008,407 1,086,341 9,040,034
(Note) Revenue is segmented by country based on the location of the customers. (4) Major Customers Information Epson had no transactions with a single external customer amounting to 10% or more of total external revenue.

72
8. Cash and Cash Equivalents The breakdown of “Cash and cash equivalents” was as follows:
9. Trade and Other Receivables The breakdown of “Trade and other receivables” was as follows:
Trade and other receivables are presented net of the allowance account for credit losses in the consolidated statement of financial position. Trade and other receivables are classified as financial assets measured at amortised cost.
10. Inventories The breakdown of “Inventories” was as follows:
The amount of inventories included in cost of sales recognised as an expense totaled (¥639,595) million and (¥676,128) million (($5,626,429) thousand) for the years ended March 31, 2014 and 2015, respectively. Losses recognised as cost of sales as a result of valuations for the years ended March 31, 2014 and 2015 were (¥27,542) million and (¥32,138) million (($267,437) thousand), respectively. In addition, Epson has no inventories pledged as collateral.
Millions of yen Thousands of U.S. dollars
March 31, March 31, 2014 2015 2015 Cash and deposits 118,510 111,330 926,437 Short-term investments 93,000 134,000 1,115,087 Total 211,510 245,330 2,041,524
Millions of yen Thousands of U.S. dollars
March 31 March 31, 2014 2015 2015 Notes and trade receivables 145,311 156,440 1,301,822 Other receivables 10,495 12,563 104,543 Allowance account for credit losses (1,497) (1,521) (12,657) Total 154,309 167,482 1,393,708
Millions of yen Thousands of U.S. dollars
March 31 March 31, 2014 2015 2015 Merchandise and finished goods 109,708 140,825 1,171,881 Work in process 49,994 54,360 452,359 Raw materials 16,979 19,250 160,189 Supplies 4,898 5,989 49,855 Total 181,581 220,426 1,834,284

73
11. Other Financial Assets (1) The breakdown of “Other financial assets”
Derivative assets are classified as financial assets measured at fair value through profit or loss, excluding a case where hedge accounting is applied. Equity securities held for other than trading purposes are classified as financial assets measured at fair value through other comprehensive income, and time deposits and bonds receivable are classified as financial assets measured at amortised cost. (2) Names of major equity securities measured at fair value through other comprehensive income, their fair values and dividends received
Millions of yen
Thousands of U.S. dollars
March 31, 2014 March 31, 2015 March 31, 2015
Fair value Dividends received Fair value Dividends
received Fair value Dividends received
NGK Insulators, Ltd. 8,077 75 9,636 93 80,186 773 Mizuho Financial Group, Inc. 3,061 90 3,168 105 26,362 873
Equity securities are held mainly for strengthening relationships with investees. Therefore, they are designated as financial assets measured at fair value through other comprehensive income.
Millions of yen Thousands of U.S. dollars
March 31 March 31, 2014 2015 2015 Derivative assets 169 3,181 26,470 Equity securities 16,784 19,639 163,426 Bonds receivable 103 108 898 Time deposits 69 44 366 Other 5,520 5,980 49,772 Allowance account for credit losses (260) (64) (532) Total 22,386 28,889 240,400
Current assets 505 3,544 29,491 Non-current assets 21,881 25,345 210,909 Total 22,386 28,889 240,400

74
12. Other Assets The breakdown of “Other current assets” and “Other non-current assets” was as follows:
Millions of yen Thousands of U.S. dollars
March 31 March 31, 2014 2015 2015 Prepaid expense 8,854 13,620 113,339 Advances to suppliers 1,582 1,954 16,260 Other 2,947 1,922 16,066 Total 13,384 17,497 145,665
Current assets 10,452 11,539 96,050 Non-current assets 2,931 5,958 49,615 Total 13,384 17,497 145,665

75
13. Property, Plant and Equipment (1) Schedule of Property, Plant and Equipment The schedules of the cost, accumulated depreciation and accumulated impairment losses, and carrying amount of “Property, plant and equipment” were as follows:
CostLand, buildingsand structures
Machinery,equipment andvehicles
Tools, furnitureand fixtures
Constructionin progress
Other Total
As of April 1, 2013 462,245 440,929 164,656 4,447 2,407 1,074,686Individual acquisition 1,117 2,883 7,194 21,774 219 33,189Transfer from(to) investmentproperty
2,924 - - - - 2,924
Sale or disposal (2,561) (19,599) (15,651) (67) (127) (38,006)Exchange differences ontranslation of foreign operations
4,382 7,741 7,807 260 17 20,209
Transfer from constructionin progress
3,393 10,770 6,431 (20,595) - -
Other (630) (2,048) 30 (636) 43 (3,241)As of March 31, 2014 470,871 440,677 170,468 5,184 2,561 1,089,762Individual acquisition 810 6,682 7,613 24,001 580 39,687Acquisition of subsidiary 1,416 44 145 - - 1,606Transfer to(from) investmentproperty
(9,462) - - - - (9,462)
Transfer to(from) non-currentassets held for sale
(396) - - - - (396)
Sale or disposal (7,057) (14,268) (12,145) (45) (12) (33,529)Exchange differences ontranslation of foreign operations
6,968 14,422 14,004 334 4 35,734
Transfer from constructionin progress
5,332 14,134 5,714 (25,206) 24 -
Other (13) (1,641) (1,190) (125) (19) (2,989)As of March 31, 2015 468,469 460,050 184,611 4,143 3,137 1,120,412
CostLand, buildingsand structures
Machinery,equipment andvehicles
Tools, furnitureand fixtures
Constructionin progress
Other Total
As of March 31, 2014 3,918,373 3,667,113 1,418,557 43,138 21,312 9,068,493Individual acquisition 6,740 55,604 63,351 199,725 4,837 330,257Acquisition of subsidiary 11,792 366 1,206 - - 13,364Transfer to(from) investmentproperty
(78,738) - - - - - (78,738)
Transfer to(from) non-currentassets held for sale
(3,295) - - - - - (3,295)
Sale or disposal (58,725) (118,731) (101,065) (374) (118) (279,013)Exchange differences ontranslation of foreign operations
57,984 120,013 116,534 2,779 52 297,362
Transfer from constructionin progress
44,370 117,616 47,549 (209,752) 217 -
Other (116) (13,655) (9,884) (1,040) (177) (24,872)As of March 31, 2015 3,898,385 3,828,326 1,536,248 34,476 26,123 9,323,558
Millions of yen
Thousands of U.S. dollars

76
Accumulated Depreciation andAccumulated Impairment Losses
Land, buildingsand structures
Machinery,equipment andvehicles
Tools, furnitureand fixtures
Constructionin progress
Other Total
As of April 1, 2013 (322,777) (384,099) (142,914) - (1,009) (850,800)Depreciation expense (Note) (9,922) (13,266) (12,259) - (7) (35,456)Impairment losses (2,939) (306) (256) (5) - (3,508)Transfer to(from) investmentproperty
(2,924) - - - - (2,924)
Sale or disposal 2,348 19,377 15,255 4 9 36,994Exchange differences ontranslation of foreign operations
(2,257) (5,645) (6,447) - (16) (14,365)
Other 709 2,103 141 - (98) 2,855As of March 31, 2014 (337,763) (381,837) (146,481) (0) (1,122) (867,205)Depreciation expense (Note) (9,398) (14,186) (14,129) - (9) (37,724)Impairment losses (2,960) (249) (135) - - (3,345)Acquisition of subsidiary (765) (43) (128) - - (937)Transfer from(to) investmentproperty
6,175 - - - - 6,175
Transfer from(to) non-currentassets held for sale
300 - - - - 300
Sale or disposal 6,830 13,725 11,910 0 5 32,472Exchange differences ontranslation of foreign operations
(3,185) (10,445) (11,674) - (2) (25,307)
Other (35) 1,595 1,010 - (152) 2,417As of March 31, 2015 (340,803) (391,441) (159,629) - (1,280) (893,155)
Accumulated Depreciation andAccumulated Impairment Losses
Land, buildingsand structures
Machinery,equipment andvehicles
Tools, furnitureand fixtures
Constructionin progress
Other Total
As of March 31, 2014 (2,810,709) (3,177,473) (1,218,948) 0 (9,354) (7,216,484)Depreciation expense (Note) (78,205) (118,049) (117,575) - (92) (313,921)Impairment losses (24,640) (2,072) (1,123) - - (27,835)Acquisition of subsidiary (6,375) (357) (1,065) - - (7,797)Transfer from(to) investmentproperty
51,385 - - - - 51,385
Transfer from(to) non-currentassets held for sale
2,496 - - - - 2,496
Sale or disposal 56,836 114,213 99,109 0 59 270,217Exchange differences ontranslation of foreign operations
(26,504) (86,918) (97,145) - (26) (210,593)
Other (291) 13,263 8,388 - (1,257) 20,103As of March 31, 2015 (2,836,007) (3,257,393) (1,328,359) - (10,670) (7,432,429)
Millions of yen
Thousands of U.S. dollars
(Note)Depreciation expense for property, plant and equipment was included in cost of sales and selling, general and administrative expenses in the consolidated statement of comprehensive income.

77
Carrying AmountLand, buildingsand structures
Machinery, equipment and vehicles
Tools, furnitureand fixtures
Constructionin progress Other Total
As of April 1, 2013 139,468 56,829 21,741 4,447 1,397 223,885As of March 31, 2014 133,107 58,839 23,986 5,183 1,438 222,556As of March 31, 2015 127,665 68,609 24,982 4,143 1,856 227,257
Carrying AmountLand, buildingsand structures
Machinery, equipment and vehicles
Tools, furnitureand fixtures
Constructionin progress Other Total
As of March 31, 2014 1,107,664 489,640 199,609 43,138 11,958 1,852,009As of March 31, 2015 1,062,378 570,933 207,889 34,476 15,453 1,891,129
Millions of yen
Thousands of U.S. dollars
The carrying amount of property, plant and equipment includes the carrying amount of the following leased assets:
Leased AssetsLand, buildingsand structures
Machinery, equipment and vehicles
Tools, furnitureand fixtures Total
As of April 1, 2013 684 75 183 943As of March 31, 2014 223 62 116 402As of March 31, 2015 109 98 76 284
Leased AssetsLand, buildingsand structures
Machinery, equipment and vehicles
Tools, furnitureand fixtures Total
As of March 31, 2014 1,865 515 965 3,345As of March 31, 2015 916 815 632 2,363
Thousands of U.S. dollars
Millions of yen
(2) Impairment Losses Epson’s business assets are generally grouped by business segment under the Company’s management accounting system, and their cash flows are continuously monitored. Assets planned to be sold and idle assets are separately assessed for impairment on the individual asset level. Impairment losses recognised in the years ended March 31, 2014 and 2015, represent the losses related to idle assets that Epson has no plan to use in the future, and the carrying amount was reduced to the recoverable amounts. They were recognised as other operating expense in the consolidated statement of comprehensive income. The recoverable amounts of these assets are determined using their fair values less disposal cost, which were assessed on the basis of reasonable estimates such as a valuation by an external real estate appraiser.

78
14. Intangible Assets The schedules of the cost, accumulated amortisation and accumulated impairment losses, and carrying amount of “Intangible assets” were as follows:
Cost Software Patent rightsProduct
development assets
Goodwill Other Total
As of April 1, 2013 35,870 14,080 4,559 1,841 4,059 60,411Individual acquisition 4,912 1,455 1,710 - 215 8,294Sale or disposal (4,356) - (14) - (111) (4,481)Exchange differences on translation of foreign operations
676 - - 6 258 941
Other 519 - - - (18) 500As of March 31, 2014 37,622 15,536 6,255 1,848 4,403 65,666Individual acquisition 4,149 770 1,338 - 124 6,383Acquisition of subsidiary 125 - 161 402 0 689Sale or disposal (2,385) - - - (32) (2,417)Exchange differences on translation of foreign operations
892 - 1 75 (57) 912
Other 1,181 - (336) - (333) 511As of March 31, 2015 41,586 16,306 7,421 2,326 4,104 71,744
Cost Software Patent rightsProduct
development assets
Goodwill Other Total
As of March 31, 2014 313,073 129,283 52,051 15,378 36,657 546,442Individual acquisition 34,526 6,408 11,134 - 1,048 53,116Acquisition of subsidiary 1,040 - 1,340 3,353 0 5,733Sale or disposal (19,846) - - - (267) (20,113)Exchange differences on translation of foreign operations
7,422 - 8 624 (465) 7,589
Other 9,844 - (2,779) - (2,812) 4,253As of March 31, 2015 346,059 135,691 61,754 19,355 34,161 597,020
Millions of yen
Thousands of U.S. dollars

79
Accumulated Amortisation and Accumulated Impairment Losses
Software Patent rightsProduct
development assets
Goodwill Other Total
As of April 1, 2013 (28,497) (11,281) (2,397) - (2,207) (44,383)Amortisation expense (Note) (2,903) (937) (1,071) - (577) (5,490)Impairment losses (14) - (72) - (107) (194)Sale or disposal 4,221 - 0 - 92 4,313Exchange differences on translation of foreign operations
(557) - - - (163) (721)
Other (252) - - - 8 (243)As of March 31, 2014 (28,005) (12,219) (3,541) - (2,953) (46,719)Amortisation expense (Note) (3,839) (1,036) (1,380) - (556) (6,813)Impairment losses (3) - (77) - (5) (86)Acquisition of subsidiary (114) - (112) - - (227)Sale or disposal 2,343 - - - 5 2,349Exchange differences on translation of foreign operations
(582) - (18) - (0) (600)
Other (476) - - - - (476)As of March 31, 2015 (30,678) (13,255) (5,130) - (3,509) (52,574)
Accumulated Amortisation and Accumulated Impairment Losses
Software Patent rightsProduct
development assets
Goodwill Other Total
As of March 31, 2014 (233,044) (101,680) (29,466) - (24,584) (388,774)Amortisation expense (Note) (31,938) (8,622) (11,502) - (4,632) (56,694)Impairment losses (24) - (640) - (51) (715)Acquisition of subsidiary (956) - (932) - - (1,888)Sale or disposal 19,497 - - - 50 19,547Exchange differences on translation of foreign operations
(4,843) - (149) - (0) (4,992)
Other (3,980) - - - - (3,980)As of March 31, 2015 (255,288) (110,302) (42,689) - (29,217) (437,496)
Millions of yen
Thousands of U.S. dollars
(Note) Amortisation expense for intangible assets was included in cost of sales and selling, general and administrative expenses in the consolidated statement of comprehensive income.
Carrying Amount Software Patent rightsProduct
development assets
Goodwill Other Total
As of April 1, 2013 7,372 2,798 2,162 1,841 1,852 16,027As of March 31, 2014 9,617 3,316 2,714 1,848 1,450 18,947As of March 31, 2015 10,907 3,050 2,291 2,326 594 19,170
Carrying Amount Software Patent rightsProduct
development assets
Goodwill Other Total
As of March 31, 2014 80,029 27,603 22,585 15,378 12,073 157,668As of March 31, 2015 90,771 25,389 19,065 19,355 4,944 159,524
Thousands of U.S. dollars
Millions of yen

80
15. Finance Lease Transactions Epson leases industrial uninterruptible power supply, host computers and computer terminals as a lessee. The total of future minimum lease payments, future finance costs and their present value for leased assets recognised based on the finance lease contracts by maturity were as follows:
Millions of yen Thousands of U.S. dollars
March 31, March 31, 2014 2015 2015 Not later than 1 year
Total of future minimum lease payments 237 72 598 Future finance costs (5) (2) (16) Present value 232 70 582
Later than 1 year and not later than 5 years
Total of future minimum lease payments 110 111 932 Future finance costs (2) (2) (17) Present value 108 108 915
Later than 5 years
Total of future minimum lease payments - 0 0 Future finance costs - (0) (0) Present value - 0 0
Total
Total of future minimum lease payments 348 185 1,530 Future finance costs (7) (4) (33) Present value 340 180 1,497

81
16. Operating Lease Transactions (1) Future Minimum Lease Payments under Non-cancellable Operating Leases The total of future minimum lease payments under non-cancellable operating leases was as follows:
(2) Total of Minimum Lease Payments and Contingent Rents The total of minimum lease payments and contingent rents of operating lease contracts recognised as an expense was as follows:
Millions of yen Thousands of U.S. dollars
March 31, March 31, 2014 2015 2015 Not later than 1 year 3,083 4,497 37,421 Later than 1 year and not later than 5 years 6,861 8,663 72,099 Later than 5 years 1,487 1,529 12,723 Total 11,432 14,690 122,243
Millions of yen Thousands of U.S. dollars
Year ended March 31,
Year ended March 31,
2014 2015 2015 Total of minimum lease payments 7,136 7,399 61,571 Contingent rents 269 114 948

82
17. Investment Property (1) Schedule of Investment Property The schedule of the carrying amount of “Investment property” was as follows:
(2) Fair Value The carrying amount and the fair value of “Investment property” were as follows:
Millions of yen Thousands of U.S. dollars
March 31, 2014 March 31, 2015 March 31, 2015
Carrying Amount Fair Value Carrying
Amount Fair Value Carrying Amount Fair Value
Investment property 10,273 11,236 4,758 4,380 39,593 36,448
The fair value of investment property is determined on the basis of a valuation conducted by an external real estate appraiser. The valuation is made in accordance with the income approach using Level 3 inputs which include the future cash flow.
Millions of yen Thousands of U.S. dollars
Year ended March 31,
Year ended March 31,
2014 2015 2015 Balance at the beginning of the year 11,583 10,273 85,487 Expenditure after acquisition 41 459 3,819 Transfer from(to) property, plant and equipment (0) 3,286 27,353 Depreciation expense (336) (170) (1,414) Impairment losses (726) (126) (1,048) Sale or disposal (288) (8,972) (74,653) Exchange differences on translation of foreign operations - 6 49 Balance at the end of the year 10,273 4,758 39,593 Breakdown of “Balance at the beginning of the year” Cost 18,065 11,491 95,614 Accumulated depreciation and accumulated impairment losses
(6,481) (1,217) (10,127)
Total 11,583 10,273 85,487 Breakdown of “Balance at the end of the year” Cost 11,491 11,595 96,487 Accumulated depreciation and accumulated impairment losses
(1,217) (6,837) (56,894)
Total 10,273 4,758 39,593
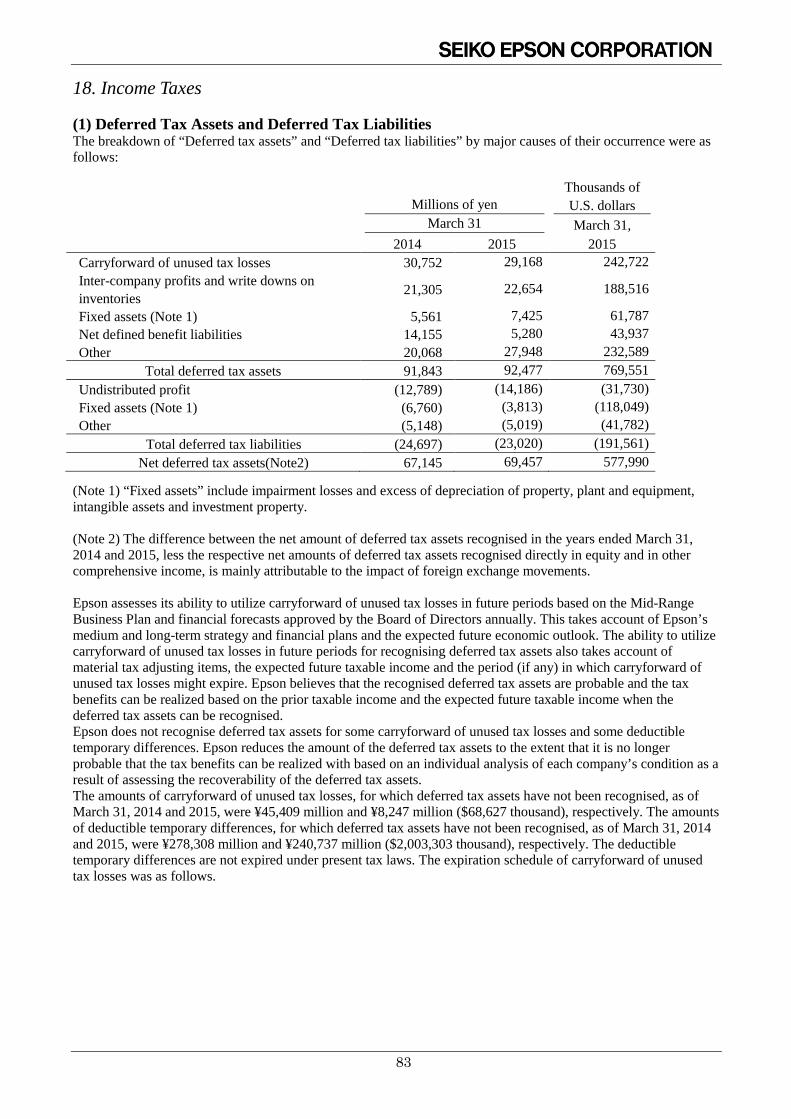
83
18. Income Taxes (1) Deferred Tax Assets and Deferred Tax Liabilities The breakdown of “Deferred tax assets” and “Deferred tax liabilities” by major causes of their occurrence were as follows:
(Note 1) “Fixed assets” include impairment losses and excess of depreciation of property, plant and equipment, intangible assets and investment property. (Note 2) The difference between the net amount of deferred tax assets recognised in the years ended March 31, 2014 and 2015, less the respective net amounts of deferred tax assets recognised directly in equity and in other comprehensive income, is mainly attributable to the impact of foreign exchange movements. Epson assesses its ability to utilize carryforward of unused tax losses in future periods based on the Mid-Range Business Plan and financial forecasts approved by the Board of Directors annually. This takes account of Epson’s medium and long-term strategy and financial plans and the expected future economic outlook. The ability to utilize carryforward of unused tax losses in future periods for recognising deferred tax assets also takes account of material tax adjusting items, the expected future taxable income and the period (if any) in which carryforward of unused tax losses might expire. Epson believes that the recognised deferred tax assets are probable and the tax benefits can be realized based on the prior taxable income and the expected future taxable income when the deferred tax assets can be recognised. Epson does not recognise deferred tax assets for some carryforward of unused tax losses and some deductible temporary differences. Epson reduces the amount of the deferred tax assets to the extent that it is no longer probable that the tax benefits can be realized with based on an individual analysis of each company’s condition as a result of assessing the recoverability of the deferred tax assets. The amounts of carryforward of unused tax losses, for which deferred tax assets have not been recognised, as of March 31, 2014 and 2015, were ¥45,409 million and ¥8,247 million ($68,627 thousand), respectively. The amounts of deductible temporary differences, for which deferred tax assets have not been recognised, as of March 31, 2014 and 2015, were ¥278,308 million and ¥240,737 million ($2,003,303 thousand), respectively. The deductible temporary differences are not expired under present tax laws. The expiration schedule of carryforward of unused tax losses was as follows.
Millions of yen Thousands of U.S. dollars
March 31 March 31, 2014 2015 2015 Carryforward of unused tax losses 30,752 29,168 242,722 Inter-company profits and write downs on inventories 21,305 22,654 188,516
Fixed assets (Note 1) 5,561 7,425 61,787 Net defined benefit liabilities 14,155 5,280 43,937 Other 20,068 27,948 232,589
Total deferred tax assets 91,843 92,477 769,551 Undistributed profit (12,789) (14,186) (31,730) Fixed assets (Note 1) (6,760) (3,813) (118,049) Other (5,148) (5,019) (41,782)
Total deferred tax liabilities (24,697) (23,020) (191,561) Net deferred tax assets(Note2) 67,145 69,457 577,990

84
Epson has no taxable temporary differences associated with investments in subsidiaries for which deferred tax liabilities have not been recognised as of March 31, 2014 and 2015. (2) Tax Expense “Tax expense” recognised as an expense was as follows:
Deferred tax expense increased by ¥2,199 million and ¥3,424 million ($28,492 thousand) due to the effect of changes in Japanese applicable tax rates for the years ended March 31, 2014 and 2015, respectively. Deferred tax expense includes the benefit arising from a previously unrecognised tax loss, tax credit or temporary difference of a prior period. These benefits that reduce deferred tax expense was ¥32,191 million and ¥13,253 million ($110,285 thousand) for the years ended March 31, 2014 and 2015, respectively. In addition, deferred tax expense includes benefits arising from the reversal of previous write-downs of deferred tax assets. These effects that increased deferred tax expense was ¥9,656 million for the year ended March 31, 2014. (3) Reconciliation of the Effective Tax Rate The breakdown of major items that caused differences between the effective statutory tax rate and the actual tax rate was as follows. Epson is subject mainly to corporate tax, inhabitant tax, and enterprise tax, and the effective statutory tax rates calculated based on these taxes were 37.8% and 35.4% for the years ended March 31, 2014 and 2015, respectively. The Special Corporation Tax for Reconstruction has been abolished in this fiscal year. Foreign subsidiaries are subject to income tax at their locations. %
Year ended March 31, 2014
Year ended March 31, 2015
Effective statutory tax rate 37.8 35.4 Different tax rates applied to foreign subsidiaries (4.7) (5.4) Expenses not deductible for tax purposes (1.4) (0.8) Reassessment of recoverability of deferred tax assets (54.6) (18.8) Other 10.9 3.7 Actual tax rate (12.0) 14.1
Millions of yen Thousands of U.S. dollars
March 31 March 31, 2014 2015 2015 1st year 646 - - 2nd year 10 - - 3rd year 97 - - 4th year 792 - - 5th year and thereafter 43,861 8,247 68,627
Total 45,409 8,247 68,627
Millions of yen Thousands of U.S. dollars
Year ended March 31
Year ended March 31,
2014 2015 2015 Current tax expense (18,464) (23,216) (193,192) Deferred tax expense 27,810 4,584 38,145
Total 9,345 (18,631) (155,047)

85
19. Trade and Other Payables The breakdown of “Trade and other payables” was as follows:
Trade and other payables are classified as financial liabilities measured at amortised cost.
Millions of yen Thousands of U.S. dollars
March 31, March 31, 2014 2015 2015 Notes and trade payables 72,821 80,359 668,710 Other payables 50,642 59,688 496,697 Total 123,463 140,047 1,165,407
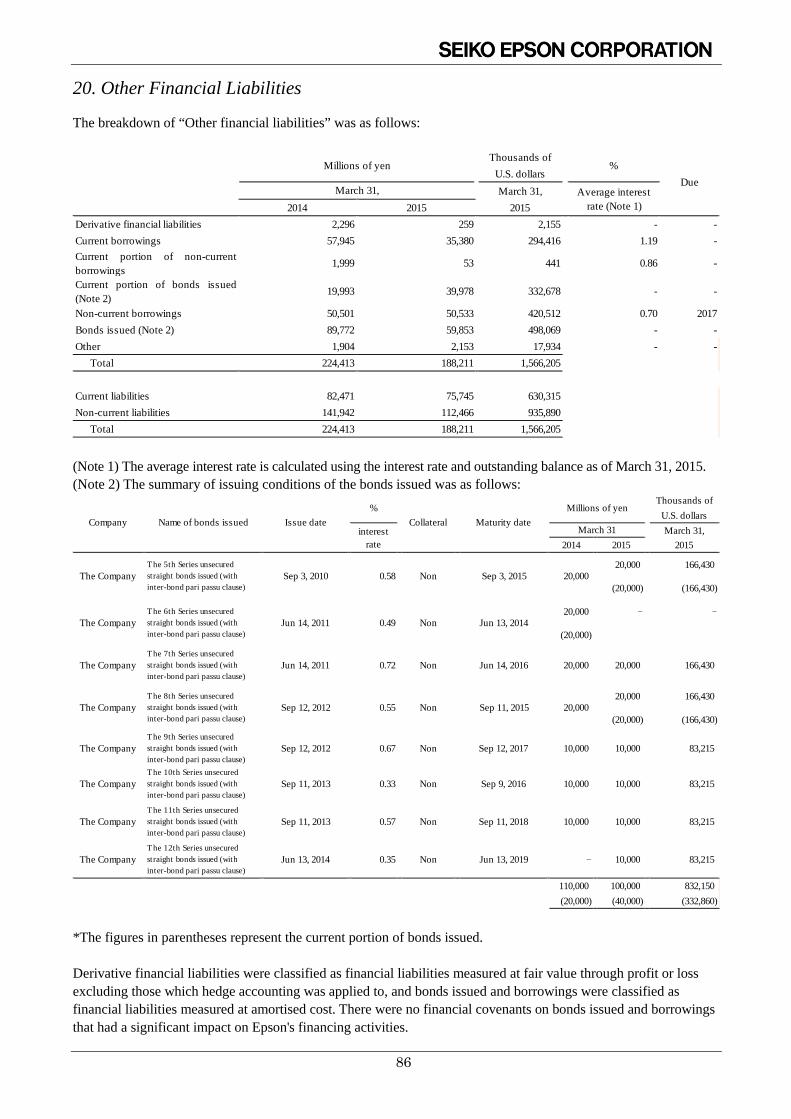
86
20. Other Financial Liabilities The breakdown of “Other financial liabilities” was as follows:
Thousands ofU.S. dollarsMarch 31,
2014 2015 2015Derivative financial liabilities 2,296 259 2,155 - -Current borrowings 57,945 35,380 294,416 1.19 -Current portion of non-currentborrowings
1,999 53 441 0.86 -
Current portion of bonds issued(Note 2)
19,993 39,978 332,678 - -
Non-current borrowings 50,501 50,533 420,512 0.70 2017Bonds issued (Note 2) 89,772 59,853 498,069 - -Other 1,904 2,153 17,934 - - Total 224,413 188,211 1,566,205
Current liabilities 82,471 75,745 630,315Non-current liabilities 141,942 112,466 935,890 Total 224,413 188,211 1,566,205
DueMarch 31, Average interest
rate (Note 1)
Millions of yen %
(Note 1) The average interest rate is calculated using the interest rate and outstanding balance as of March 31, 2015. (Note 2) The summary of issuing conditions of the bonds issued was as follows:
Thousands ofU.S. dollarsMarch 31,
2014 2015 2015
20,000 166,430
(20,000) (166,430)
20,000 - -
(20,000)
The CompanyThe 7th Series unsecuredstraight bonds issued (withinter-bond pari passu clause)
Jun 14, 2011 0.72 Non Jun 14, 2016 20,000 20,000 166,430
20,000 166,430
(20,000) (166,430)
The CompanyThe 9th Series unsecuredstraight bonds issued (withinter-bond pari passu clause)
Sep 12, 2012 0.67 Non Sep 12, 2017 10,000 10,000 83,215
The CompanyThe 10th Series unsecuredstraight bonds issued (withinter-bond pari passu clause)
Sep 11, 2013 0.33 Non Sep 9, 2016 10,000 10,000 83,215
The CompanyThe 11th Series unsecuredstraight bonds issued (withinter-bond pari passu clause)
Sep 11, 2013 0.57 Non Sep 11, 2018 10,000 10,000 83,215
The CompanyThe 12th Series unsecuredstraight bonds issued (withinter-bond pari passu clause)
Jun 13, 2014 0.35 Non Jun 13, 2019 - 10,000 83,215
110,000 100,000 832,150(20,000) (40,000) (332,860)
Millions of yen
Non
Company Issue dateName of bonds issued Collateral Maturity date%
March 31interestrate
The CompanyThe 5th Series unsecuredstraight bonds issued (withinter-bond pari passu clause)
Sep 3, 2010 0.58
The CompanyThe 8th Series unsecuredstraight bonds issued (withinter-bond pari passu clause)
Sep 12, 2012 0.55
The CompanyThe 6th Series unsecuredstraight bonds issued (withinter-bond pari passu clause)
Jun 14, 2011 0.49
Non Sep 11, 2015 20,000
20,000Sep 3, 2015
Non Jun 13, 2014
*The figures in parentheses represent the current portion of bonds issued. Derivative financial liabilities were classified as financial liabilities measured at fair value through profit or loss excluding those which hedge accounting was applied to, and bonds issued and borrowings were classified as financial liabilities measured at amortised cost. There were no financial covenants on bonds issued and borrowings that had a significant impact on Epson's financing activities.

87
21. Provisions The breakdown and the schedule of “Provisions” were as follows: FY2013: Year ended March 31, 2014
Provision for productwarranties
Provision forrebates
Asset retirementobligations
Provision forloss on
litigation
Otherprovisions
Total
As of April 1, 2013 8,276 6,543 1,166 2,676 4,325 22,988Arising during the year 9,458 6,359 322 592 4,128 20,861Utilised (8,054) (6,543) (91) (298) (3,570) (18,558)Unused amounts reversed (164) - - (1) (55) (220)Exchange differences ontranslation of foreignoperations
583 1,083 33 483 543 2,727
As of March 31, 2014 10,100 7,443 1,431 3,452 5,371 27,799
Current liabilities 9,597 7,443 36 917 4,401 22,397Non-current liabilities 502 - 1,394 2,534 969 5,401 Total 10,100 7,443 1,431 3,452 5,371 27,799
FY2014: Year ended March 31, 2015
Provision for productwarranties
Provision forrebates
Asset retirementobligations
Provision forloss on
litigation
Otherprovisions
Total
As of April 1, 2014 10,100 7,443 1,431 3,452 5,371 27,799Arising during the year 10,699 7,973 102 1,076 6,429 26,280Utilised (9,788) (7,443) (76) (916) (4,482) (22,707)Unused amounts reversed (324) - - - (691) (1,016)Exchange differences ontranslation of foreignoperations
690 (149) 17 (285) (164) 108
As of March 31, 2015 11,376 7,823 1,474 3,326 6,461 30,463
Current liabilities 10,043 7,823 30 866 5,558 24,322Non-current liabilities 1,333 - 1,443 2,460 902 6,141 Total 11,376 7,823 1,474 3,326 6,461 30,463
FY2014: Year ended March 31, 2015
Provision for productwarranties
Provision forrebates
Asset retirementobligations
Provision forloss on
litigation
Otherprovisions
Total
As of April 1, 2014 84,047 61,937 11,908 28,725 44,713 231,330Arising during the year 89,024 66,338 848 8,945 53,535 218,690Utilised (81,451) (61,937) (632) (7,622) (37,315) (188,957)Unused amounts reversed (2,696) - - - (5,758) (8,454)Exchange differences ontranslation of foreignoperations
5,741 (1,239) 141 (2,371) (1,383) 889
As of March 31, 2015 94,665 65,099 12,265 27,677 53,792 253,498
Current liabilities 83,573 65,099 249 7,206 46,269 202,396Non-current liabilities 11,092 - 12,016 20,471 7,523 51,102 Total 94,665 65,099 12,265 27,677 53,792 253,498
Millions of yen
Millions of yen
Thousands of U.S. dollars

88
(1) Provision for product warranties Epson recognises an accrual for estimated future warranty costs based on the rate of historical service contract expenses to sales. Other specific warranty provisions are made for those products where future warranty expenses can be specifically estimated. Most of these expenses are expected to be incurred in the next fiscal year. (2) Provision for rebates Epson recognises provisions for rebates, related to sales made on or prior to the fiscal year end, that are paid to distributors or customers based on direct outcomes such as the sales performance or early payment. These expenses are expected to be paid in the next fiscal year.
(3) Asset retirement obligations Epson recognises a provision for retirement costs of property, plant and equipment for which Epson is required to bear, and which derive from the acquisition, construction, development or normal use of such assets to the amount that it is probable that Epson will pay in light of historical experience. These expenses are expected to be paid mainly after one year or more. However, they may be affected by future business plans.
(4) Provision for loss on litigation Epson recognises a provision for loss on litigation based on the estimated future compensation payment and litigation expenses which need to be provided at each fiscal year end. These expenses are expected to be paid mainly after one year or more.
22. Other Liabilities The breakdown of “Other current liabilities” and “Other non-current liabilities” was as follows:
Millions of yen Thousands of U.S. dollars
March 31, March 31, 2014 2015 2015 Accrued expense 26,859 26,916 223,982 Accrued bonus to employees 25,984 34,124 283,964 Accrued employee’s unused paid vacations 24,496 25,069 208,612 Other 20,421 23,809 198,184
Total 97,763 109,920 914,742 Current liabilities 94,064 106,942 889,941 Non-current liabilities 3,698 2,977 24,801
Total 97,763 109,920 914,742

89
23. Post-employment Benefits The Company and some Japanese subsidiaries have the following defined benefit plans: defined benefit corporate pension plans and lump-sum severance plans. In addition, they also have defined contribution plans. Some overseas subsidiaries have defined benefit plans and defined contribution plans. Epson’s major defined benefit plans are administrated by the Corporate Pension Fund (the “Fund”) in accordance with the Defined-Benefit Corporate Pension Act (Act No. 50 of 2001). The benefits of defined benefit plans are determined based on conditions, such as years of service, the salary proportional method based on average employee salaries for services or final base salaries for retirement benefits and a funded method based on the points employees have earned for each year of service. The Fund has a Board of Representatives consisting of representatives of the Company and its Japanese subsidiaries and representatives of the plan participants in accordance with the rules of the Fund. The Board of Representatives is responsible for changes in the rules of the Fund, dismissal of the board members including members who execute operations related to the administration and investment of pension reserves for the Fund, and resolutions of the business report and the closing of account. (1) Schedule of Defined Benefit Obligations The schedule of the defined benefit obligations was as follows:
Millions of yen Thousands of U.S. dollars
Year ended March 31,
Year ended March 31,
2014 2015 2015 Balance at the beginning of the year 290,201 293,895 2,445,660
Service cost 11,169 10,687 88,932 Interest cost 4,605 4,337 36,090 Remeasurement
Actuarial gains and losses arising from changes in demographic assumptions (1,863) 2,749 22,875
Actuarial gains and losses arising from changes in financial assumptions (2,682) 19,492 162,203
Past service cost and losses (gains) arising from settlements (58) (30,071) (250,237)
Exchange differences on translation of foreign operations 5,252 1,175 9,779
Benefits paid (12,730) (9,229) (76,799) Balance at the end of the year 293,895 293,035 2,438,503

90
(2) Schedule of Plan Assets The schedule of the plan assets was as follows. Epson’s major defined benefit plans are regulated by maintaining a balance between the pension obligations and plan assets through reviewing the financial condition of the fund that affects future benefits. Epson plans to pay contributions of ¥7,784 million ($64,774 thousand) for the year ending March 31, 2016.
(3) Schedule of Right to Reimbursement As Epson’s major defined benefit plans are corporate defined benefit pension plans, there are no contributions from third parties. (4) Effect of Asset Ceiling There was no effect from the asset ceiling. (5) Reconciliation of Defined Benefit Obligations and Plan Assets The reconciliation of the defined benefit obligations and plan assets to the net defined benefit liabilities or assets recognised in the consolidated statement of financial position were as follows:
Millions of yen Thousands of U.S. dollars
Year ended March 31,
Year ended March 31,
2014 2015 2015 Balance at the beginning of the year 218,116 237,543 1,976,724
Interest income 3,362 3,807 31,672 Remeasurement
Return on plan assets 11,472 20,257 168,569 Exchange differences on translation of foreign operations 2,339 396 3,313
Contributions by the employer 11,948 7,345 61,121 Contributions by plan participants 1,647 1,223 10,177 Benefits paid (11,343) (8,764) (72,930)
Balance at the end of the year 237,543 261,808 2,178,646
Millions of yen Thousands of U.S. dollars
March 31, March 31, 2014 2015 2015 Funded defined benefit obligations 288,220 286,837 2,386,925 Plan assets (237,543) (261,808) (2,178,646)
Subtotal 50,676 25,029 208,279 Unfunded defined benefit obligations 5,675 6,198 51,578 Net defined benefit liabilities or assets recognised in the consolidated statement of financial position
56,351 31,227 259,857
Net defined benefit liabilities 56,362 31,234 259,915 Net defined benefit assets (10) (7) (58) Net defined benefit liabilities and assets recognised in the consolidated statement of financial position
56,351 31,227 259,857

91
(6) Breakdown of Plan Assets The breakdown of plan assets by major category was as follows:
(Note 1) A certain interest rate and principal for the general accounts of life insurance companies are guaranteed by life insurance companies. (Note 2)In plan assets, there are no transferable financial instruments, real estate held by Epson or other assets used by Epson. The investment strategy for Epson’s plan assets was as follows: Epson’s plan assets under defined benefit plans are managed in accordance with the rules of the Fund for securing stable returns in the middle- and long-term in order to ensure the redemption of the defined benefit obligations. Epson sets a best qualified asset mix policy through performing pension ALM, which is combined management of assets and liabilities” by an external agency to secure stable returns.Epson invests plan assets consistently with the asset mix policy which includes setting of the risk, target rate of return and composition ratio of plan assets by asset category
Millions of yen Thousands of U.S. dollars
March 31, March 31, 2014 2015 2015 Investments quoted in active markets Equity securities 18,495 24,580 204,543 Bonds receivable 134 117 973 Alternative investments 19,909 20,934 174,203 Cash and deposits 3,185 4,433 36,889 Other 2,374 3,666 30,533
Total 44,100 53,732 447,141 Investments unquoted in active markets Pooled funds (Equity securities) 32,587 40,690 338,603 Pooled funds (Bonds receivable) 66,274 69,875 581,467 General accounts of life insurance companies (Note 1) 82,716 84,780 705,511
Alternative investments 11,865 12,729 105,924 Total 193,443 208,075 1,731,505

92
(7) Matters Related to Actuarial Assumptions The major item of actuarial assumptions was as follows: % March 31, 2014 March 31, 2015 Discount rate 1.7 1.3
The valuation of defined benefit obligations reflects judgments on uncertain future events. The sensitivities of defined benefit obligations due to changes of 1% in the discount rate as of March 31, 2015 were as follows. Each of these sensitivities assumes that other variables remain fixed. Negative figures show a decrease in the defined benefit obligations, while positive figures show an increase.
The weighted-average duration of the defined benefit obligations at March 31, 2015 was 15.5 years. (8) Defined Contribution Plans Expenses for the defined contribution plans were ¥14,388 million and ¥17,875 million ($148,747 thousand) for the years ended March 31, 2014 and 2015, respectively.
Millions of yen Thousands of U.S. dollars
March 31, March 31, 2015 2015 Discount rate (1% increase) (47,049) (391,520) Discount rate (1% decrease) 54,928 457,085
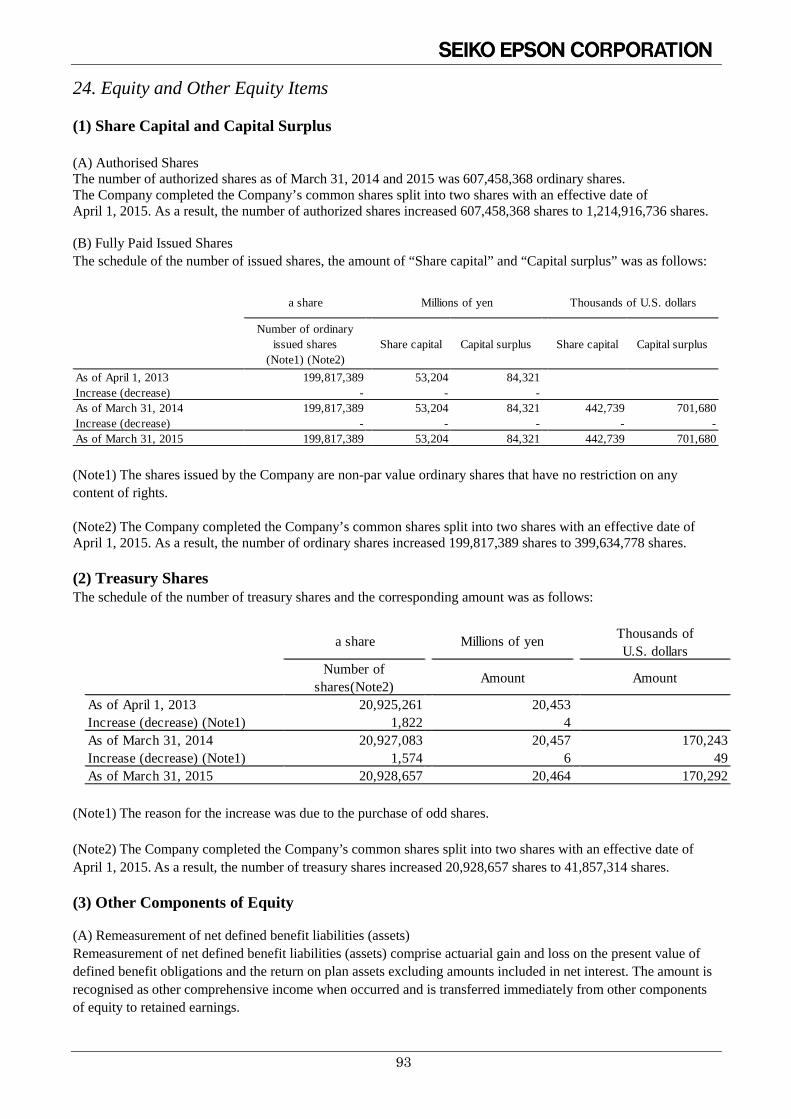
93
24. Equity and Other Equity Items (1) Share Capital and Capital Surplus (A) Authorised Shares The number of authorized shares as of March 31, 2014 and 2015 was 607,458,368 ordinary shares. The Company completed the Company’s common shares split into two shares with an effective date of April 1, 2015. As a result, the number of authorized shares increased 607,458,368 shares to 1,214,916,736 shares. (B) Fully Paid Issued Shares The schedule of the number of issued shares, the amount of “Share capital” and “Capital surplus” was as follows:
Number of ordinaryissued shares
(Note1) (Note2)Share capital Capital surplus Share capital Capital surplus
As of April 1, 2013 199,817,389 53,204 84,321Increase (decrease) - - -As of March 31, 2014 199,817,389 53,204 84,321 442,739 701,680Increase (decrease) - - - - -As of March 31, 2015 199,817,389 53,204 84,321 442,739 701,680
Thousands of U.S. dollarsMillions of yena share
(Note1) The shares issued by the Company are non-par value ordinary shares that have no restriction on any content of rights. (Note2) The Company completed the Company’s common shares split into two shares with an effective date of April 1, 2015. As a result, the number of ordinary shares increased 199,817,389 shares to 399,634,778 shares.
(2) Treasury Shares The schedule of the number of treasury shares and the corresponding amount was as follows:
Thousands ofU.S. dollars
Number ofshares(Note2) Amount Amount
As of April 1, 2013 20,925,261 20,453Increase (decrease) (Note1) 1,822 4As of March 31, 2014 20,927,083 20,457 170,243Increase (decrease) (Note1) 1,574 6 49As of March 31, 2015 20,928,657 20,464 170,292
a share Millions of yen
(Note1) The reason for the increase was due to the purchase of odd shares. (Note2) The Company completed the Company’s common shares split into two shares with an effective date of April 1, 2015. As a result, the number of treasury shares increased 20,928,657 shares to 41,857,314 shares.
(3) Other Components of Equity (A) Remeasurement of net defined benefit liabilities (assets) Remeasurement of net defined benefit liabilities (assets) comprise actuarial gain and loss on the present value of defined benefit obligations and the return on plan assets excluding amounts included in net interest. The amount is recognised as other comprehensive income when occurred and is transferred immediately from other components of equity to retained earnings.

94
(B) Net gain (loss) on revaluation of financial assets measured at fair value through other comprehensive income This is the valuation difference in fair value of financial assets measured at fair value through other comprehensive income. (C) Exchange differences on translation of foreign operations This is a foreign currency translation difference that occurs when consolidating financial statements of foreign operations are prepared in foreign currencies. (D) Net changes in fair value of cash flow hedges Epson uses derivatives for hedging to avoid the risk of fluctuation in future cash flows. This is the effective portion of changes in fair value of derivative transactions designated as cash flow hedges.

95
25. Dividends Dividends paid were as follows: FY2013: Year ended March 31, 2014
Millions of yen Yen
(Resolution) Total dividends Dividendsper share
FY2014: Year ended March 31, 2015
Millions of yen Yen
(Resolution) Total dividends Dividendsper share
FY2014: Year ended March 31, 2015Thousands of U.S.
dollars U.S. dollars
(Resolution) Total dividends Dividendsper share
September 30, 2014 December 5, 2014
March 31, 2014 June 25, 2014
Board of Directors(October 31, 2014) Ordinary shares 52,110 0.29
Annual Shareholders Meeting(June 24, 2014) Ordinary shares 55,071 0.30
September 30, 2014 December 5, 2014
Class of shares Basis date Effective date
March 31, 2014 June 25, 2014
Board of Directors(October 31, 2014) Ordinary shares 6,261 35
Annual Shareholders Meeting(June 24, 2014) Ordinary shares 6,618 37
13 September 30, 2013 December 6, 2013
Class of shares Basis date Effective date
7 March 31, 2013 June 25, 2013
Board of Directors(October 31, 2013) Ordinary shares 2,325
Class of shares Basis date Effective date
Annual Shareholders Meeting(June 24, 2013) Ordinary shares 1,252
Dividends whose basis dates were during the years ended March 31, 2014 and 2015, but whose effective dates were subsequent to March 31, 2014 and 2015 were as follows: FY2013: Year ended March 31, 2014
Millions of yen Yen
(Resolution) Total dividends Dividendsper share
FY2014: Year ended March 31, 2015
Millions of yen Yen
(Resolution) Total dividends Dividendsper share
FY2014: Year ended March 31, 2015Thousands of U.S.
dollars U.S. dollars
(Resolution) Total dividends Dividendsper share
March 31, 2015 June 26, 2015Annual Shareholders Meeting(June 25, 2015) Ordinary shares 119,089 0.66
March 31, 2015 June 26, 2015
Class of shares Basis date Effective date
Annual Shareholders Meeting(June 25, 2015) Ordinary shares 14,311 80
March 31, 2014 June 25, 2014
Class of shares Basis date Effective date
Ordinary shares 6,618 37
Class of shares Basis date Effective date
Annual Shareholders Meeting(June 24, 2014)

96
26. Revenue The breakdown of “Revenue” was as follows:
27. Selling, General and Administrative Expenses The breakdown of “Selling, general and administrative expenses” was as follows:
28. Employee Benefit Expenses The employee benefit expenses included in the consolidated statement of comprehensive income were as follows:
Millions of yen Thousands of U.S. dollars
Year ended March 31,
Year ended March 31,
2014 2015 2015 Sale of goods 992,826 1,071,687 8,918,091 Royalty income 10,331 8,201 68,244 Other 5,250 6,452 53,699
Total 1,008,407 1,086,341 9,040,034
Millions of yen Thousands of U.S. dollars
Year ended March 31,
Year ended March 31,
2014 2015 2015 Employee benefit expense (88,925) (94,749) (788,458) Research and development expense (48,535) (47,837) (398,077) Promotion expense (24,106) (28,722) (239,011) Service contract expense (19,006) (20,109) (167,337) Advertising expense (16,215) (19,823) (164,957) Transportation expense (14,786) (18,162) (151,135) Other (60,926) (65,245) (542,951)
Total (272,501) (294,648) (2,451,926)
Millions of yen Thousands of U.S. dollars
Year ended March 31,
Year ended March 31,
2014 2015 2015 Salaries and wages (191,346) (206,796) (1,720,862) Legal welfare expense (20,130) (19,660) (163,601) Welfare expense (9,328) (10,653) (88,649) Expenses of post-employment benefits
Expense for defined contribution plans (14,388) (17,875) (148,747) Expense for defined benefit plans (1,277) (12,303) (102,398)
Total (236,471) (267,289) (2,224,257)

97
29. Other Operating Income The breakdown of “Other operating income” was as follows:
(Note)As a result of a revision to the defined benefit plan, Epson recognised a ¥30,071 million ($250,237thousand) decline in expenses associated with past service costs at the Company and certain domestic subsidiaries. This resulted in a ¥30,071 million ($250,237 thousand) increase in other operating income for the year ended March 31, 2015. 30. Other Operating Expense The breakdown of “Other operating expense” was as follows:
Millions of yen Thousands of U.S. dollars
Year ended March 31
Year ended March 31,
2014 2015 2015 Income from a revision of the defined benefit plan (Note) - 30,071 250,237
Gains on sales of property, plant and equipment, intangible assets and investment property 359 5,270 43,854
Other 5,638 4,564 37,996 Total 5,998 39,907 332,087
Millions of yen Thousands of U.S. dollars
Year ended March 31
Year ended March 31,
2014 2015 2015 Impairment losses (4,429) (3,563) (29,649) Foreign exchange losses (9,230) (2,595) (21,594) Other (2,877) (3,643) (30,333)
Total (16,537) (9,802) (81,576)

98
31. Finance Income and Finance Costs The breakdowns of “Finance income” and “Finance costs” were as follows:
(Note) The increase or decrease in the fair value of currency derivatives is included in the foreign exchange gains (losses).
Finance Income Millions of yen Thousands of U.S. dollars
Year ended March 31
Year ended March 31,
2014 2015 2015 Interest income 1,394 2,159 17,966 Dividend income 225 278 2,313 Foreign exchange gains (Note) - 567 4,718 Other 1,065 263 2,197
Total 2,685 3,268 27,194
Finance Costs Millions of yen Thousands of U.S. dollars
Year ended March 31
Year ended March 31,
2014 2015 2015 Interest expense (2,955) (1,559) (12,973) Foreign exchange losses (Note) (179) - - Employee benefit expense (1,241) (531) (4,418) Other (51) (229) (1,905)
Total (4,428) (2,320) (19,296)
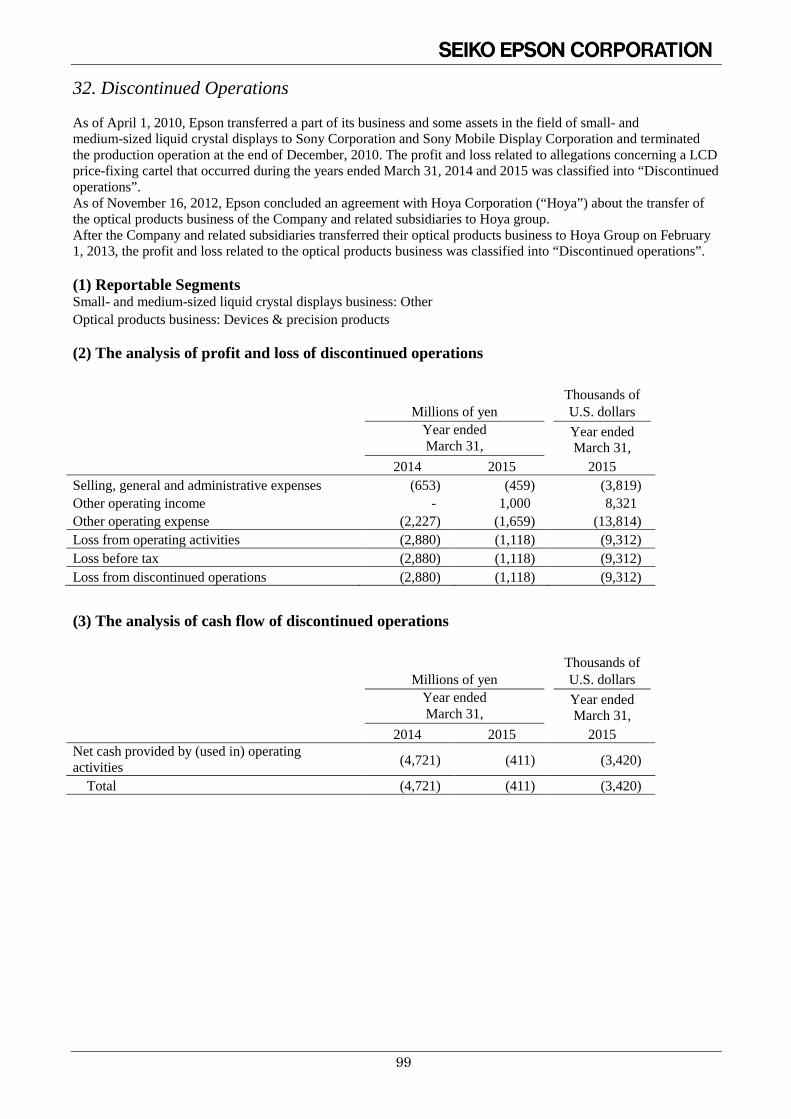
99
32. Discontinued Operations As of April 1, 2010, Epson transferred a part of its business and some assets in the field of small- and medium-sized liquid crystal displays to Sony Corporation and Sony Mobile Display Corporation and terminated the production operation at the end of December, 2010. The profit and loss related to allegations concerning a LCD price-fixing cartel that occurred during the years ended March 31, 2014 and 2015 was classified into “Discontinued operations”. As of November 16, 2012, Epson concluded an agreement with Hoya Corporation (“Hoya”) about the transfer of the optical products business of the Company and related subsidiaries to Hoya group. After the Company and related subsidiaries transferred their optical products business to Hoya Group on February 1, 2013, the profit and loss related to the optical products business was classified into “Discontinued operations”. (1) Reportable Segments Small- and medium-sized liquid crystal displays business: Other Optical products business: Devices & precision products (2) The analysis of profit and loss of discontinued operations
(3) The analysis of cash flow of discontinued operations
Millions of yen Thousands of U.S. dollars
Year ended March 31,
Year ended March 31,
2014 2015 2015 Selling, general and administrative expenses (653) (459) (3,819) Other operating income - 1,000 8,321 Other operating expense (2,227) (1,659) (13,814) Loss from operating activities (2,880) (1,118) (9,312) Loss before tax (2,880) (1,118) (9,312) Loss from discontinued operations (2,880) (1,118) (9,312)
Millions of yen Thousands of U.S. dollars
Year ended March 31,
Year ended March 31,
2014 2015 2015 Net cash provided by (used in) operating activities (4,721) (411) (3,420)
Total (4,721) (411) (3,420)

100
33. Other Comprehensive Income The amount arising during the year, reclassification adjustments to profit or loss and tax effects for each component of “Other comprehensive income” were as follows: FY2013: Year ended March 31, 2014
Amount arising Reclassificationadjustments
Before taxeffects
Tax effects Net oftax effects
Remeasurement of net defined benefit liabilities (assets) 13,228 - 13,228 (142) 13,086Net gain (loss) on revaluation of financial assetsmeasured at FVTOCI (Note)
4,606 - 4,606 (1,821) 2,785
Exchange differences on translation of foreign operations 19,513 (134) 19,378 - 19,378Net changes in fair value of cash flow hedges 946 106 1,052 (420) 632Share of other comprehensive income of investmentsaccounted for using the equity method
154 - 154 - 154
Total 38,449 (27) 38,421 (2,383) 36,038
(Note) FVTOCI: Fair Value Through Other Comprehensive Income
FY2014: Year ended March 31, 2015
Amount arising Reclassificationadjustments
Before taxeffects
Tax effects Net oftax effects
Remeasurement of net defined benefit liabilities (assets) (1,016) - (1,016) (496) (1,512)Net gain (loss) on revaluation of financial assetsmeasured at FVTOCI (Note)
2,244 - 2,244 (123) 2,121
Exchange differences on translation of foreign operations 31,219 (1,106) 30,113 - 30,113Net changes in fair value of cash flow hedges 2,418 149 2,568 (850) 1,718Share of other comprehensive income of investmentsaccounted for using the equity method
257 - 257 - 257
Total 35,124 (956) 34,167 (1,469) 32,698
FY2014: Year ended March 31, 2015
Amount arising Reclassificationadjustments
Before taxeffects
Tax effects Net oftax effects
Remeasurement of net defined benefit liabilities (assets) (8,454) - (8,454) (4,128) (12,582)Net gain (loss) on revaluation of financial assetsmeasured at FVTOCI (Note)
18,673 - 18,673 (1,032) 17,641
Exchange differences on translation of foreign operations 259,808 (9,203) 250,605 - 250,605Net changes in fair value of cash flow hedges 20,120 1,240 21,360 (7,064) 14,296Share of other comprehensive income of investmentsaccounted for using the equity method
2,138 - 2,138 - 2,138
Total 292,285 (7,963) 284,322 (12,224) 272,098
(Note) FVTOCI: Fair Value Through Other Comprehensive Income
Millions of yen
Millions of yen
Thousands of U.S. dollars
(Note) FVTOCI: Fair Value Through Other Comprehensive Income

101
34. Earnings per Share Basis of calculating basic earnings per share
(1) Profit attributable to ordinary shareholders of the parent company
(2) Weighted-average number of ordinary shares outstanding during the year
Thousands of shares
Year ended March 31, 2014 Year ended March 31,
2015
Weighted-average number of ordinary shares 357,783 357,779
(Note) The Company completed the Company’s ordinary shares split into two shares with an effective date of April 1, 2015 based on the resolution by the Company’s Board of Directors on January 30, 2015. Basic earnings per share was calculated under the assumption that the share splits took effect at the beginning of the previous fiscal year.
Millions of yen Thousands of U.S. dollars
Year ended March 31
Year ended March 31,
2014 2015 2015 Profit from continuing operations attributable to owners of the parent company 87,083 113,678 945,985
Loss from discontinued operations attributable to owners of the parent company (2,880) (1,118) (9,312)
Profit used for calculation of basic earnings per share 84,203 112,560 936,673

102
35. Financial Instruments (1) Capital Management Epson selects the most effective fund management method focusing on the preservation of funds in view of safeness and flexibility. In addition, Epson obtains financing from bank loans and bonds issued. Epson has a policy not to transact derivatives for speculation purposes, but for avoiding the risks stated below. Epson manages net interest-bearing debt, where cash and cash equivalents are deducted from interest-bearing debt, and capital (equity attributable to owners of the parent company). The amounts were as follows:
Millions of yen Thousands of U.S. dollars
March 31, March 31, 2014 2015 2015 Interest-bearing debt 220,553 185,978 1,547,613 Cash and cash equivalents (211,510) (245,330) (2,041,524) Net interest-bearing debt 9,042 (59,351) (493,911) Capital (equity attributable to owners of the parent company) 362,371 494,325 4,113,547
Epson monitors financial indicators in order to maintain a well-balanced capital structure that ensures an appropriate return on equity and a sound and flexible financial condition for future investment. Epson monitor credit ratings for financial soundness and flexibility, and ROE (return on equity) for profitability, while focusing on changes in the domestic and overseas environment. (2) Financial Risk Management Epson is exposed to financial risks (credit risks, liquidity risks, foreign exchange risks, interest rate risks, and market price fluctuation risks) in the process of its business activities; and it manages risks based on a specific policy in order to avoid or reduce said risks. The results of risk management are quarterly reported by the financial and general accounting department to the Executive Committee of the Company. Epson’s policy limits derivatives to transactions for the purpose of mitigating risks from transactions based on actual demand. Therefore, Epson do not transact derivatives for speculation purposes or trading purposes.

103
(3) Credit Risk Receivables, such as notes and trade receivables, resulting from the operating activities of Epson are exposed to customer credit risks. Epson holds mainly bonds receivable as investments of surplus funds and equity securities of customers and suppliers to strengthen relationships with them; those securities are exposed to the issuers’ credit risks. In addition, through derivative transactions that Epson conducts in order to hedge foreign exchange fluctuation risks and interest rate fluctuation risks, Epson is exposed to the credit risks of the financial institutions which are counterparties to these transactions. In principle, Epson sets credit lines or transaction conditions with respect to trade receivables for counterparties based on Epson’s Credit Control Regulation in order to prevent credit risks relating to counterparties. In addition, the receivable balances of counterparties are monitored in order to mitigate the credit risks. The financial and general accounting department of the Company regularly monitors the status of the occurrence and collection of bad debts, and reports them to the Executive Committee of the Company. There is no over-concentrated credit risk for a single customer. With regard to the investment of cash surpluses and derivatives, Epson invests in bonds receivable and other financial instruments with a certain credit rating and transacts with financial institutions with a high credit rating in principle in order to prevent credit risks based on Epson’s Capital Management Regulation. In addition, the financial and general accounting department of the Company regularly monitors the performances of these transactions and reports the results to the Executive Committee of the Company. The analysis of the aging of “Trade and other receivables” that are past due but not impaired as of March 31, 2015 was as follows. It includes amounts considered recoverable by credit insurance and collateral.
Epson uses an allowance account for credit losses to record impairment losses on the uncollectible amounts of individually significant trade receivables at the end of the reporting period and to record impairment losses on trade receivables that are not individually significant at an amount based on the historical loan loss ratio at the end of the reporting period. The allowance account for credit losses against the financial assets is included in “Trade and other receivables” in the consolidated statement of financial position. The schedule of the allowance account for credit losses of “Trade and other receivables” was as follows:
(Note) Trade and other receivables for which impairment was recognised individually at March 31, 2014 and 2015 were ¥250 million and ¥52 million ($432 thousand), respectively; and their corresponding allowance account for credit losses were ¥250 million and ¥52 million ($432 thousand), respectively.
Millions of yen Thousands of U.S. dollars
March 31, March 31, 2015 2015 Within 30 days 9,174 76,368 Over 30 days, within 60 days 713 5,933 Over 60 days, within 90 days 229 1,905 Over 90 days 752 6,257 Total 10,871 90,463
Millions of yen Thousands of U.S. dollars
March 31 March 31, 2014 2015 2015 Balance at the beginning of the year 1,454 1,758 14,629 Addition (Note) 455 478 3,961 Decrease (utilised) (160) (483) (4,019) Decrease (reversal) (158) (311) (2,588) Other 167 145 1,206 Balance at the end of the year 1,758 1,586 13,189

104
(4) Liquidity Risk Epson raises funds by borrowings and bonds issued; however, these liabilities are exposed to the liquidity risk that it would not be able to repay liabilities on the due date due to the deterioration of the financing environment. Epson establishes a financing plan based on the annual business plan and the financial and general accounting department of the Company regularly monitors and collects information on the balance of liquidity-in-hand and interest-bearing debt and reports it to the Executive Committee of the Company. In addition, Epson manages liquidity risks with the balance of liquidity-in-hand maintained at a proper level by working out the financing plan on a timely basis, and by taking into consideration the financial environment. The financial liability balance (including derivative financial instruments) by maturity was as follows: FY2013: As of March 31, 2014
Carryingamount
Contractualcash flow
Due within1 year
Due after 1year through
2 years
Due after 2years through
3 years
Due after 3years through
4 years
Due after 4years through
5 years
Due after5 years
Trade and other payables 123,463 123,463 123,463 - - - - - Borrowings 110,446 110,445 59,945 - 500 50,000 - - Bonds issued 109,765 110,000 20,000 40,000 30,000 10,000 10,000 - Lease obligations 340 343 235 56 33 14 4 - Other 1,563 1,563 3 182 60 22 37 1,256 Total 345,580 345,816 203,648 40,239 30,593 60,036 10,042 1,256
Derivative financial liabilities Foreign exchange forward contract 2,296 2,296 2,296 - - - - - Total 2,296 2,296 2,296 - - - - -
FY2014: As of March 31, 2015
Carryingamount
Contractualcash flow
Due within1 year
Due after 1year through 2 years
Due after 2years through3 years
Due after 3years through4 years
Due after 4years through 5 years
Due after5 years
Trade and other payables 140,047 140,047 140,047 - - - - - Borrowings 85,966 85,966 35,433 533 50,000 - - - Bonds issued 99,831 100,000 40,000 30,000 10,000 10,000 10,000 - Lease obligations 180 185 72 51 31 18 9 0 Other 1,973 1,973 3 98 108 419 185 1,158 Total 327,999 328,172 215,557 30,682 60,140 10,438 10,194 1,159
Derivative financial liabilities Foreign exchange forward contract 259 259 259 - - - - - Total 259 259 259 - - - - -
FY2014: As of March 31, 2015
Carryingamount
Contractualcash flow
Due within1 year
Due after 1year through 2 years
Due after 2years through3 years
Due after 3years through4 years
Due after 4years through 5 years
Due after5 years
Trade and other payables 1,165,407 1,165,407 1,165,407 - - - - - Borrowings 715,369 715,369 294,857 4,435 416,077 - - - Bonds issued 830,747 832,145 332,861 249,646 83,215 83,215 83,208 - Lease obligations 1,497 1,539 635 424 257 149 74 0 Other 16,437 16,437 26 816 908 3,496 1,547 9,644 Total 2,729,457 2,730,897 1,793,786 255,321 500,457 86,860 84,829 9,644
Derivative financial liabilities Foreign exchange forward contract 2,155 2,155 2,155 - - - - - Total 2,155 2,155 2,155 - - - - -
Millions of yen
Non-derivative financial liabilities
Millions of yen
Non-derivative financial liabilities
Thousands of U.S. dollars
Non-derivative financial liabilities

105
(5) Foreign Exchange Risk Epson operates businesses globally and, therefore, is exposed to the following risks due to foreign exchange fluctuation: (A) The risk that the profit or loss and cash flow in each functional currency of Epson is influenced by foreign exchange fluctuation as a result of external transactions and intergroup transactions, including the payment and receipt of dividends, in currencies that are different from each functional currency of Epson. (B) The risk that the equity of Epson is influenced by foreign exchange fluctuation when equity denominated in each functional currency of Epson is translated into Japanese yen and consolidated. (C) The risk that the profit or loss of Epson is influenced by foreign exchange fluctuation when profit or loss denominated in each functional currency of Epson is translated into Japanese yen and consolidated. Epson hedges against risk (A) using derivatives or foreign currency-denominated interest-bearing debt when future cash flow is projected or when receivables and payables are fixed. As a rule, the net of foreign currency-denominated operating receivables and payables is hedged mainly using forward foreign exchange contracts. Epson does not hedge against risk (B) and (C), in principle. In order to mitigate risks mentioned above resulting from the foreign exchange fluctuation, in accordance with Epson’s Foreign Exchange Management Regulation, Epson establishes a foreign currency hedge policy based on the current conditions and forecast of the foreign exchange market, implements the aforementioned hedges under the supervision of the Foreign Exchange Management Committee of the Company. The financial and general accounting department of the Company regularly reports the performances to the Executive Committee of the Company. The breakdown of currency derivatives was follows: Derivative transactions to which hedge accounting is not applied
Contractamount
Over oneyear
Fair value Contractamount
Over oneyear
Fair value Contractamount
Over oneyear
Fair value
Foreign exchange forward contractBuying 2,571 - 72 3,238 - (52) 26,945 - (432)Selling 37,357 - (1,080) 34,957 - 1,383 290,905 - 11,508
Non-Deliverable ForwardSelling 3,297 - (48) 2,940 - 36 24,465 - 299 Total 43,226 - (1,055) 41,136 - 1,367 342,315 - 11,375
Derivative transactions to which hedge accounting is applied
Contractamount
Over oneyear
Fair value Contractamount
Over oneyear
Fair value Contractamount
Over oneyear
Fair value(Note)
Foreign exchange forward contractSelling 40,101 - (898) 37,030 - 1,557 308,155 - 12,948
Non-Deliverable ForwardSelling 6,615 - (105) 8,172 - (44) 68,003 - (366) Total 46,716 - (1,004) 45,203 - 1,512 376,158 - 12,582
Millions of yen Thousands of U.S. dollars
March 31, March 31,2014 2015 2015
Millions of yen Thousands of U.S. dollars
March 31, March 31,2014 2015 2015
(Note) Cash flow hedge is applied, and derivative transactions are measured at fair value in the consolidated statement of financial position.

106
Foreign Exchange Sensitivity Analysis In cases where each currency other than the functional currency that denominates the financial instruments held by Epson as of March 31, 2015 increases by 10% in value against the functional currency, the impact on profit before tax in the consolidated statement of comprehensive income was as follows. The impact from the translation of functional currency-denominated financial instruments, and assets, liabilities, income and expenses of foreign operations into Japanese yen is not included. Also, it is based on the assumption that currencies other than the currencies used for the calculation do not fluctuate.
(6) Interest Rate Risk Epson’s interest rate risk arises from cash equivalents and interest-bearing debt. Borrowings and bonds issued with floating rates are subject to the effects of changes in future cash flows caused by the fluctuation of market interest rates; while, borrowings and bonds issued with fixed rates are subject to the effects of changes in the fair value caused by the fluctuation of market interest rates. In response to the fluctuation of market interest rates, Epson reduces the interest rate risk by implementing an interest rate swap and adjusting appropriate proportion of financing between floating rates and fixed rates. In accordance with Epson’s Capital Management Regulation, the interest rate swap is approved by the finance officer of the Company. Interest Rate Sensitivity Analysis In cases where the interest rate of financial instruments held by Epson as of March 31, 2015 increases by 100bp, the impact on profit before tax in the consolidated statement of comprehensive income was as follows: The analysis included financial instruments affected by interest rate fluctuation and based on the assumption that other factors, including the impacts of foreign exchange fluctuation, were constant.
(7) Market Price Fluctuation Risk With respect to equity securities, Epson regularly assesses the fair value and financial conditions of the issuers, and reviews the portfolio held by taking into account the relationship with counterparty entities in accordance with Epson’s Securities Operation Regulation. Epson intends to hold equity instruments not for short-term trading but for long-term investment. Therefore, Epson does not sell the instruments actively. The equity price fluctuation risks are calculated based on the price of equity instruments at the fiscal year end. In cases where the equity price changes by 5% in value, the impact on other comprehensive income before tax effects as of March 31, 2015 was ¥986 million ($8,205 thousand) due to the changes in the fair value.
Millions of yen Thousands of U.S. dollars
March 31, March 31, 2015 2015 Profit before tax 1,389 11,558
Millions of yen Thousands of U.S. dollars
March 31, March 31, 2015 2015 Profit before tax 700 5,825

107
(8) Fair Value of Financial Instruments (A) Fair value measurement The fair values of financial assets and liabilities are determined as follows: (Derivatives) The fair values are calculated based on prices obtained from financial institutions. (Equity securities and bonds receivable) When market values for equity securities and bonds receivable are available, such values are used as the fair values. The fair values of the equity securities and bonds receivable whose market values are unavailable are measured by using the discounted cash flow method, price comparison method based on the prices of similar types of securities and bonds and other valuation methods. (Borrowings) As current borrowings are settled on a short-term basis, the fair values approximate their carrying amounts. For non-current borrowings with floating rates, it is assumed that the fair value is equal to the carrying amounts, because the rates are affected in the short term by fluctuations in market interest rates, and because Epson’s credit status has not greatly changed since they were implemented. The fair values of non-current borrowings with fixed rates are calculated by the total sum of the principal and interest discounted using the interest rates that would be applied if similar new borrowings were conducted. (Bonds issued) The fair values of bonds issued are determined based on market prices. (Lease obligations) The fair values are calculated based on the present value of the total amount discounted by the interest rate corresponding to the period to maturity and the credit risk per each lease obligation classified per certain period. (Other) Other financial instruments are settled mainly on a short-term basis, and the fair values approximate the carrying amounts.

108
(B) Fair values of financial instruments The carrying amounts and the fair values of the financial instruments were as follows:
Carryingamount
Fair value Carryingamount
Fair value Carryingamount
Fair value
Financial assets measured atfair value
Derivative financial assets 169 169 3,181 3,181 26,470 26,470Equity securities 16,784 16,784 19,639 19,639 163,426 163,426
Financial assets measured atamortised cost
Cash and cash equivalents 211,510 211,510 245,330 245,330 2,041,524 2,041,524Trade and other receivables 154,309 154,309 167,482 167,482 1,393,708 1,393,708Bonds receivable 103 103 108 108 898 898Other receivables 5,329 5,329 5,960 5,960 49,606 49,606
Financial liabilities measured atfair value
Derivative financial liabilities 2,296 2,296 259 259 2,155 2,155Financial liabilities measured atamortised cost
Trade and other payables 123,463 123,463 140,047 140,047 1,165,407 1,165,407Interest-bearing debt
Borrowings 110,446 110,631 85,966 86,118 715,369 716,634Bonds issued 109,765 110,588 99,831 100,466 830,747 836,032Lease obligations 340 340 180 180 1,497 1,497
Other payables 1,563 1,563 1,973 1,973 16,437 16,437
Millions of yen Thousands of U.S. dollars
March 31, March 31,2014 2015 2015

109
(C) Fair value hierarchy The fair value hierarchy of financial instruments is categorized from Level 1 to Level 3 as follows: Level 1: Fair value measured at quoted prices in active markets for identical assets or liabilities Level 2: Fair value calculated using inputs other than quoted prices included within Level 1 that are observable, either directly or indirectly Level 3: Fair value calculated using valuation techniques including inputs unobservable input for the assets and liabilities Epson does not have any financial instruments for which there is significant measurement uncertainty and subjectivity which needs to subdivide each level stated above for disclosure. The transfers between levels in the fair value hierarchy are deemed to have occurred at the end of the reporting period. Classification by hierarchy regarding financial assets and liabilities measured at fair value FY2013: As of March 31, 2014
Level 1 Level 2 Level 3 TotalFinancial assets Derivative financial assets - 169 - 169 Equity securities 14,178 - 2,606 16,784
Total 14,178 169 2,606 16,953Financial liabilities
- 2,296 - 2,296Total - 2,296 - 2,296
FY2014: As of March 31, 2015
Level 1 Level 2 Level 3 TotalFinancial assets Derivative financial assets - 3,181 - 3,181 Equity securities 17,232 - 2,406 19,639
Total 17,232 3,181 2,406 22,821Financial liabilities
- 259 - 259Total - 259 - 259
FY2014: As of March 31, 2015
Level 1 Level 2 Level 3 TotalFinancial assets Derivative financial assets - 26,470 - 26,470 Equity securities 143,405 - 20,021 163,426
Total 143,405 26,470 20,021 189,896Financial liabilities
- 2,155 - 2,155Total - 2,155 - 2,155
Millions of yen
Derivative financial liabilities
Millions of yen
Derivative financial liabilities
Thousands of U.S. dollars
Derivative financial liabilities
There were no transfers of financial instruments between Level 1 and Level 2 of the fair value hierarchy during the years ended March 31, 2014 and 2015.

110
Classification by hierarchy regarding financial assets and liabilities not measured at fair value FY2013: As of March 31, 2014
Level 1 Level 2 Level 3 TotalFinancial assets Bonds receivable - 103 - 103
Total - 103 - 103Financial liabilities Borrowings - 110,631 - 110,631 Bonds issued - 110,588 - 110,588 Lease obligations - - 340 340
Total - 221,219 340 221,560
FY2014: As of March 31, 2015
Level 1 Level 2 Level 3 TotalFinancial assets Bonds receivable - 108 - 108
Total - 108 - 108Financial liabilities Borrowings - 86,118 - 86,118 Bonds issued - 100,466 - 100,466 Lease obligations - - 180 180
Total - 186,584 180 186,765
FY2014: As of March 31, 2015
Level 1 Level 2 Level 3 TotalFinancial assets Bonds receivable - 898 - 898
Total - 898 - 898Financial liabilities Borrowings - 716,634 - 716,634 Bonds issued - 836,032 - 836,032 Lease obligations - - 1,497 1,497
Total - 1,552,666 1,497 1,554,163
Millions of yen
Millions of yen
Thousands of U.S. dollars
The movement of financial instruments categorized within Level 3 of the fair value hierarchy was as follows:
Millions of yen Thousands of U.S. dollars
Year ended March 31,
Year ended March 31,
2014 2015 2015 Balance at the beginning of the year 2,731 2,606 21,685 Gains and losses Other comprehensive income (125) (174) (1,456) Sales - (25) (208) Other - 0 0 Balance at the end of the year 2,606 2,406 20,021

111
36. Principal Subsidiaries Principal subsidiaries as of March 31, 2015 were as follows:
Company name Location Main business Ownership percentage of
voting rights (%) (Note)
Epson Sales Japan Corporation Shinjuku-ku, Tokyo
Sales of information-related equipment and sensing and industrial solutions
100.0
Epson Direct Corporation Matsumoto-shi, Nagano Sales of information-related equipment
100.0 (100.0)
Orient Watch Co., Ltd. Chiyoda-ku, Tokyo Sales of devices and precision products 100.0
Miyazaki Epson Corporation Miyazaki-shi, Miyazaki Manufacture of devices and precision products 100.0
Tohoku Epson Corporation Sakata-shi, Yamagata
Manufacture of information-related equipment, devices and precision products
100.0
Akita Epson Corporation Yuzawa-shi, Akita
Manufacture of information-related equipment, devices and precision products, and sensing and industrial solutions
100.0
Epson Atmix Corporation Hachinohe-shi, Aomori Manufacture and sales of devices and precision products 100.0
U.S. Epson, Inc. Long Beach, U.S.A. Holding company 100.0
Epson America, Inc. Long Beach, U.S.A.
Regional headquarters, Sales of information-related equipment and sensing and industrial solutions
100.0 (100.0)
Epson Electronics America, Inc. San Jose, U.S.A. Sales of devices and precision
products 100.0
(100.0)
Epson Portland Inc. Portland, U.S.A. Manufacture of information-related equipment
100.0 (100.0)
Epson El Paso, Inc. El Paso, U.S.A. Distribution of information-related equipment
100.0 (100.0)
Epson Europe B.V. Amsterdam, the Netherlands Regional headquarters, Sales of information-related equipment
100.0
Epson (U.K.) Ltd. Hemel Hempstead, UK Sales of information-related equipment
100.0 (100.0)
Epson Deutschland GmbH Dusseldorf, Germany
Sales of information-related equipment and sensing and industrial solutions
100.0 (100.0)
Epson Europe Electronics GmbH Munich, Germany Sales of devices and precision
products 100.0
(100.0)
Epson France S.A. Levallois-Perret, France Sales of information-related equipment
100.0 (100.0)
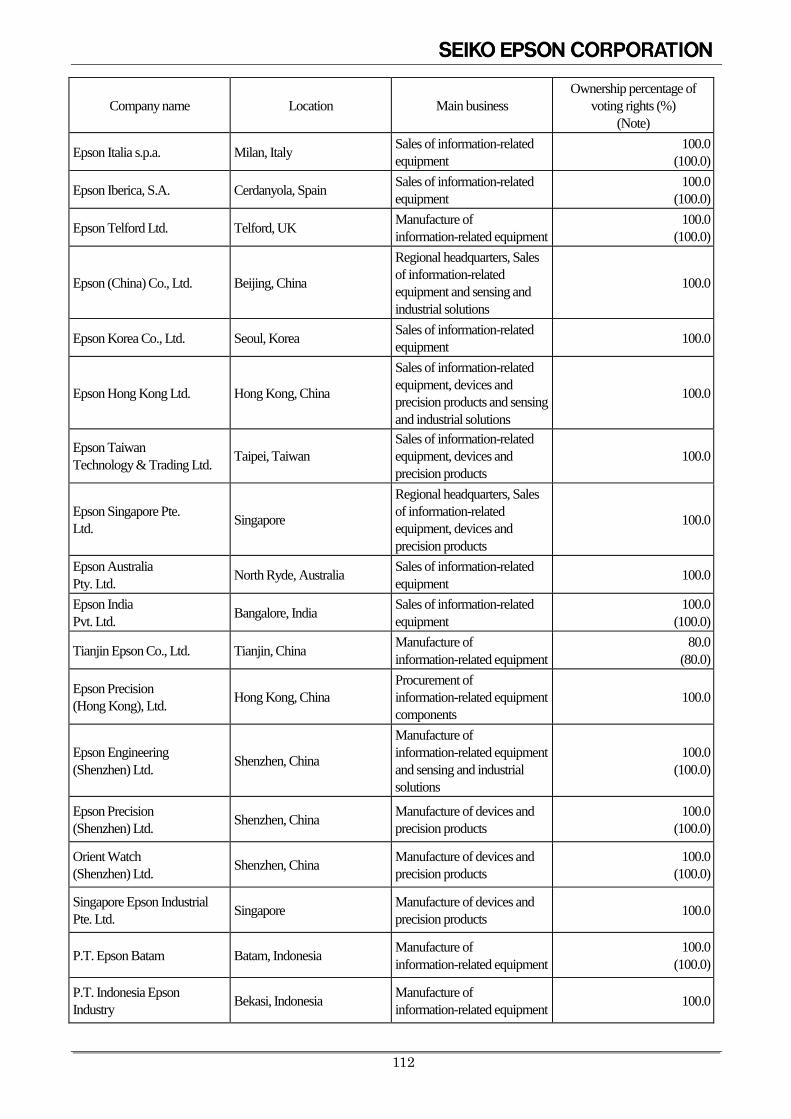
112
Company name Location Main business Ownership percentage of
voting rights (%) (Note)
Epson Italia s.p.a. Milan, Italy Sales of information-related equipment
100.0 (100.0)
Epson Iberica, S.A. Cerdanyola, Spain Sales of information-related equipment
100.0 (100.0)
Epson Telford Ltd. Telford, UK Manufacture of information-related equipment
100.0 (100.0)
Epson (China) Co., Ltd. Beijing, China
Regional headquarters, Sales of information-related equipment and sensing and industrial solutions
100.0
Epson Korea Co., Ltd. Seoul, Korea Sales of information-related equipment 100.0
Epson Hong Kong Ltd. Hong Kong, China
Sales of information-related equipment, devices and precision products and sensing and industrial solutions
100.0
Epson Taiwan Technology & Trading Ltd. Taipei, Taiwan
Sales of information-related equipment, devices and precision products
100.0
Epson Singapore Pte. Ltd. Singapore
Regional headquarters, Sales of information-related equipment, devices and precision products
100.0
Epson Australia Pty. Ltd. North Ryde, Australia Sales of information-related
equipment 100.0
Epson India Pvt. Ltd. Bangalore, India Sales of information-related
equipment 100.0
(100.0)
Tianjin Epson Co., Ltd. Tianjin, China Manufacture of information-related equipment
80.0 (80.0)
Epson Precision (Hong Kong), Ltd. Hong Kong, China
Procurement of information-related equipment components
100.0
Epson Engineering (Shenzhen) Ltd. Shenzhen, China
Manufacture of information-related equipment and sensing and industrial solutions
100.0 (100.0)
Epson Precision (Shenzhen) Ltd. Shenzhen, China Manufacture of devices and
precision products 100.0
(100.0)
Orient Watch (Shenzhen) Ltd. Shenzhen, China Manufacture of devices and
precision products 100.0
(100.0)
Singapore Epson Industrial Pte. Ltd. Singapore Manufacture of devices and
precision products 100.0
P.T. Epson Batam Batam, Indonesia Manufacture of information-related equipment
100.0 (100.0)
P.T. Indonesia Epson Industry Bekasi, Indonesia Manufacture of
information-related equipment 100.0

113
Company name Location Main business Ownership percentage of
voting rights (%) (Note)
Epson Precision (Philippines), Inc. Lipa, Philippines Manufacture of
information-related equipment 100.0
Epson Precision Malaysia Sdn. Bhd. Kuala Lumpur, Malaysia Manufacture of devices and
precision products 100.0
Epson Precision (Johor) Sdn. Bhd. Johor, Malaysia Manufacture of devices and
precision products 100.0
(100.0) (Note) Ownership percentage of voting rights indicated inside parentheses refers to indirect ownership percentage.
37. Related Parties Transactions between the Company and its subsidiaries, which are related parties of the Company, have been eliminated in consolidation and are not disclosed in this note. There were no significant transactions between the Company, its subsidiaries and other related parties. The remuneration of directors and other members of key management personnel was as follows:
(Note 1) Epson introduced a stock performance (stock-based) remuneration system to link remuneration more closely to share price, so a certain portion of short-term remuneration is allotted for the purchase of Epson Stock. (Note 2) A director who retired at the closing of the general shareholders’ meeting held on June 24, 2014 receipted a retirement benefit of ¥41 million based on the resolution of the general shareholders’ meeting held on June 23, 2006, on the payment of director retirement benefits.
Millions of yen Thousands of U.S. dollars
Year ended March 31
Year ended March 31,
2014 2015 2015 Short-term remuneration 564 563 4,685

114
38. Commitments Commitments for the acquisition of assets were as follows:
39. Contingencies Material litigation In general, litigation has uncertainties and it is difficult to make reliable judgments for the possibility of an outflow of resources embodying economic benefits and to estimate the financial effect. Provisions are not recognised either if an outflow of resources embodying economic benefits is not probable or to estimate the financial effect is not practicable. Epson was contending the following material actions. (1) The liquid crystal display price-fixing cartel The civil actions have been brought against the Company and certain of its consolidated subsidiaries by multiple customers in the U.S, regarding allegations of involvement in a liquid crystal display price-fixing cartel. Moreover, the Company and certain of its consolidated subsidiaries are currently under investigation by the European Commission and other anti-monopoly-related authorities.
(2) The civil action on copyright fee of ink-jet printers Verwertungsgesellschaf Wort (“VG Wort”), the organization for collecting copyright fees on behalf of copyright holders, has brought a civil action against Epson Deutschland GmbH(“EDG”), a consolidated subsidiary of the Company, to seek payment of copyright fees on single-function printers. The claim was dismissed by the supreme court. The plaintiff, however, unsatisfied with this ruling, appealed to the Federal Constitutional Court of Germany. In December 2010, the Federal Constitutional Court ruled that the ruling of the supreme court violates rights set forth in Article 14 of the constitutional law of Germany. It thus dismissed the ruling of the supreme court and referred the case back to the supreme court for review. In July 2011, the supreme court referred the case to the Court of Justice of the European Union, and an inquiry was begun in October 2012. In June 2013, the Court of Justice of the European Union ruled that EU member states can impose levies on printer and PC manufacturers in order to compensate copyrights holders for unauthorized reproduction of their work. In response to this, the supreme court judged that printer and PC are liable to copyright levies, in July 2014. The specific copyright rates are under consideration again by the high court of the Germany. In June 2010, Epson Europe B.V. (“EEB”), a consolidated subsidiary of the Company, brought a civil suit against La SCRL Reprobel (“Reprobel”), a Belgium-based group that collects copyright royalties, seeking restitution for copyright royalties for multifunction printers. After that, Reprobel also brought a civil suit against EEB. As a result, these two lawsuits were adjoined. EEB’s claims were rejected at the first trial, but EEB, dissatisfied with the decision, intends to appeal.
Millions of yen Thousands of U.S. dollars
March 31 March 31, 2014 2015 2015 Acquisition of property, plant and equipment 6,167 4,706 39,169 Acquisition of intangible assets 927 1,519 12,640
Total 7,094 6,226 51,809
115
40. Subsequent Events Share splits The Company completed the Company’s ordinary shares split as below with an effective date of April 1, 2015 based on the resolution by the Company’s Board of Directors on January 30, 2015. (1) Purpose of share splits The Company, in the light of recent share price trends, aims to make it easier for investors to invest in the Company and expand its investor base by reducing the investment unit amount of the Company’s shares and enhancing the liquidity of its ordinary shares. (2) Method of share splits Each share of the Company’s ordinary shares held by registered shareholders as of the basis date of March 31, 2015, was split into two shares on the effective date of April 1, 2015. (3) Increase in number of ordinary shares due to share split Ordinary shares: 199,817,389 shares Earnings per share was calculated under the assumption that the share splits took effect at the beginning of the previous fiscal year.
41. Approval of Consolidated Financial Statements The consolidated financial statements were approved by Minoru Usui (President and Representative Director) and Noriyuki Hama (Senior Managing Director and General Administrative Manager, Management Control Division) on June 25, 2015.

116
Report of Independent Auditors

117
Additional Information 1. Principal subsidiaries and affiliates
Company name Location Paid-in capital or amount invested
Main business Ownership
percentage of voting rights (%)
Relationship between parent company and subsidiary
Consolidated subsidiaries
Epson Sales Japan Corporation *
Shinjuku-ku, Tokyo
4,000 (million JPY)
Sales of information-related equipment and sensing and industrial solutions
100.0
Sales of the Company’s products, Interlocking directors, Financial assistance, Rental of assets
Epson Direct Corporation
Matsumoto-shi, Nagano
150 (million JPY)
Sales of information-related equipment
100.0 (100.0)
Sales of PCs, etc., Rental of assets
Orient Watch Co., Ltd. Chiyoda-ku, Tokyo
100 (million JPY)
Sales of devices and precision products
100.0
Sales of watches, Financial assistance, Rental and borrowing of assets
Miyazaki Epson Corporation
Miyazaki-shi, Miyazaki
100 (million JPY)
Manufacture of devices and precision products
100.0 Manufacture of crystal devices
Tohoku Epson Corporation
Sakata-shi, Yamagata
100 (million JPY)
Manufacture of information-related equipment, devices and precision products
100.0
Manufacture of printer components and semiconductors, Interlocking directors
Akita Epson Corporation
Yuzawa-shi, Akita
80 (million JPY)
Manufacture of information-related equipment, devices and precision products, and sensing and industrial solutions
100.0
Manufacture of printer components, crystal devices, and sensing systems, Financial assistance, Borrowing of assets
Epson Atmix Corporation
Hachinohe-shi, Aomori
450 (million JPY)
Manufacture and sales of devices and precision products
100.0
Manufacture and sales of metal powders, etc., Financial assistance, Rental of assets
U.S. Epson, Inc. *
Long Beach, U.S.A.
111,941 (thousand USD)
Holding company 100.0 Holding company in Americas, Interlocking directors
Epson America, Inc. *
Long Beach, U.S.A.
40,000 (thousand USD)
Regional headquarters, Sales of information-related equipment and sensing and industrial solutions
100.0 (100.0)
Regional headquarters in Americas, Sales of printers and other PC peripherals and sales of factory automation products, Interlocking directors
Epson Electronics America, Inc.
San Jose, U.S.A.
10,000 (thousand USD)
Sales of devices and precision products
100.0 (100.0)
Sales of electronic devices
Epson Portland Inc. Portland, U.S.A.
31,150 (thousand USD)
Manufacture of information-related equipment
100.0 (100.0)
Manufacture of printer consumables, Interlocking directors
Epson El Paso, Inc.
El Paso, U.S.A.
51,000 (thousand USD)
Distribution of information-related equipment
100.0 (100.0)
Distribution of printer consumables, Interlocking directors

118
Company name Location Paid-in capital or amount invested
Main business Ownership
percentage of voting rights (%)
Relationship between parent company and subsidiary
Epson Europe B.V. *
Amsterdam, the Netherlands
95,000 (thousand EUR)
Regional headquarters, Sales of information-related equipment
100.0
Regional headquarters in Europe, Sales of printers and other PC peripherals, Interlocking directors, Guaranty of liabilities
Epson (U.K.) Ltd. Hemel Hempstead, UK
1,600 (thousand GBP)
Sales of information-related equipment
100.0 (100.0)
Sales of printers and other PC peripherals, Interlocking directors, Guaranty of liabilities
Epson Deutschland GmbH
Dusseldorf, Germany
5,200 (thousand EUR)
Sales of information-related equipment and sensing and industrial solutions
100.0 (100.0)
Sales of printers and other PC peripherals, and sales of factory automation products, Guaranty of liabilities
Epson Europe Electronics GmbH
Munich, Germany
2,000 (thousand EUR)
Sales of devices and precision products
100.0 (100.0)
Sales of electronic devices, Interlocking directors, Guaranty of liabilities
Epson France S.A. Levallois- Perret, France
4,000 (thousand EUR)
Sales of information-related equipment
100.0 (100.0)
Sales of printers and other PC peripherals
Epson Italia s.p.a. Milan, Italy
3,000 (thousand EUR)
Sales of information-related equipment
100.0 (100.0)
Sales of printers and other PC peripherals, Guaranty of liabilities
Epson Iberica, S.A. Cerdanyola, Spain
1,900 (thousand EUR)
Sales of information-related equipment
100.0 (100.0)
Sales of printers and other PC peripherals, Guaranty of liabilities,
Epson Telford Ltd. Telford, UK 8,000
(thousand GBP)
Manufacture of information-related equipment
100.0 (100.0)
Manufacture of printer consumables, Interlocking directors
Epson (China) Co., Ltd. *
Beijing, China
1,211 (million CNY)
Regional headquarters, Sales of information-related equipment and sensing and industrial solutions
100.0
Regional headquarters in China, Sales of printers and other PC peripherals and factory automation products, Interlocking directors
Epson Korea Co., Ltd. Seoul, Korea
1,466 (million KRW)
Sales of information-related equipment
100.0 Sales of printers and other PC peripherals
Epson Hong Kong Ltd. Hong Kong, China
2,000 (thousand HKD)
Sales of information-related equipment, devices and precision products and sensing and industrial solutions
100.0
Sales of printers and other PC peripherals, electronic devices and factory automation products
Epson Taiwan Technology & Trading Ltd.
Taipei, Taiwan
25,000 (thousand TWD)
Sales of information-related equipment, devices and precision products
100.0
Sales of printers and other PC peripherals, and sales of electronic devices, Guaranty of liabilities

119
Company name Location Paid-in capital or amount invested
Main business Ownership
percentage of voting rights (%)
Relationship between parent company and subsidiary
Epson Singapore Pte. Ltd.
Singapore 200
(thousand SGD)
Regional headquarters, Sales of information-related equipment, devices and precision products
100.0
Regional headquarters in Asia-Pacific, Sales of printers and other PC peripherals, and
sales of electronic devices, Interlocking directors, Guaranty of liabilities
Epson Australia Pty. Ltd.
North Ryde, Australia
1,000 (thousand AUD)
Sales of information-related equipment
100.0 Sales of printers and other PC peripherals, Guaranty of liabilities
Epson India Pvt. Ltd.
Bangalore, India
108,628 (thousand INR)
Sales of information-related equipment
100.0 (100.0)
Sales of printers and other PC peripherals, Interlocking directors, Guaranty of liabilities
Tianjin Epson Co., Ltd. Tianjin, China
172,083 (thousand CNY)
Manufacture of information-related equipment
80.0 (80.0)
Manufacture of printer consumables, etc., Interlocking directors
Epson Precision (Hong Kong), Ltd. *
Hong Kong, China
81,602 (thousand USD)
Procurement of information-related equipment components
100.0
Procurement of printer and 3LCD projector components,
Epson Engineering (Shenzhen) Ltd. *
Shenzhen, China
56,641 (thousand USD)
Manufacture of information-related equipment and sensing and industrial solutions
100.0 (100.0)
Manufacture of printers, 3LCD projectors, liquid crystal panels and factory automation products, etc., Interlocking directors
Epson Precision (Shenzhen) Ltd.
Shenzhen, China
25,000 (thousand USD)
Manufacture of devices and precision products
100.0 (100.0)
Manufacture of watches, etc., Interlocking directors
Orient Watch (Shenzhen) Ltd.
Shenzhen, China
37,748 (thousand CNY)
Manufacture of devices and precision products
100.0 (100.0)
Manufacture of watches, etc.,
Singapore Epson Industrial Pte. Ltd.
Singapore 71,700
(thousand SGD)
Manufacture of devices and precision products
100.0
Manufacture of semiconductors, and surface finishing, Interlocking directors, Guaranty of liabilities
P.T. Epson Batam Batam, Indonesia
7,000 (thousand USD)
Manufacture of information-related equipment
100.0 (100.0)
Manufacture of printer consumables, Interlocking directors Guaranty of liabilities
P.T. Indonesia Epson Industry *
Bekasi, Indonesia
23,000 (thousand USD
Manufacture of information-related equipment
100.0 Manufacture of printers, Interlocking directors, Guaranty of liabilities
Epson Precision (Philippines), Inc. *
Lipa, Philippines
157,533 (thousand USD)
Manufacture of information-related equipment
100.0
Manufacture of printers and 3LCD projectors, Interlocking directors, Guaranty of liabilities
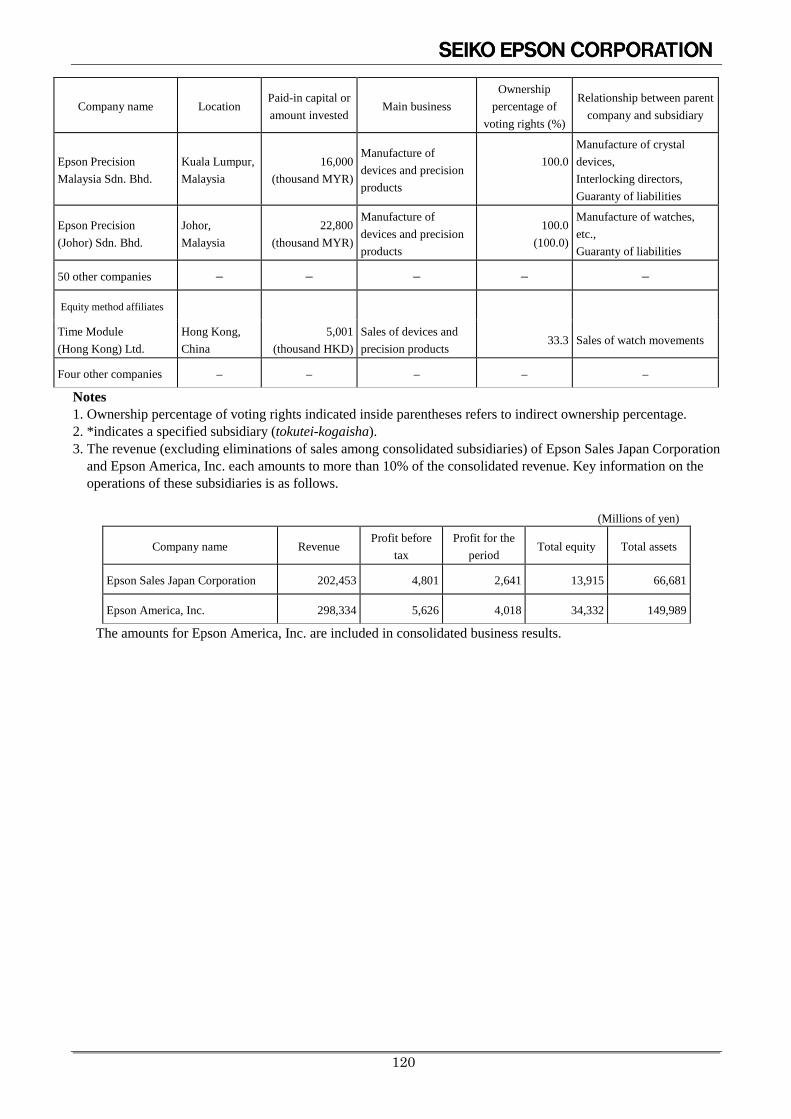
120
Company name Location Paid-in capital or amount invested
Main business Ownership
percentage of voting rights (%)
Relationship between parent company and subsidiary
Epson Precision Malaysia Sdn. Bhd.
Kuala Lumpur, Malaysia
16,000 (thousand MYR)
Manufacture of devices and precision products
100.0
Manufacture of crystal devices, Interlocking directors, Guaranty of liabilities
Epson Precision (Johor) Sdn. Bhd.
Johor, Malaysia
22,800 (thousand MYR)
Manufacture of devices and precision products
100.0 (100.0)
Manufacture of watches, etc., Guaranty of liabilities
50 other companies – – – – –
Equity method affiliates
Time Module (Hong Kong) Ltd.
Hong Kong, China
5,001 (thousand HKD)
Sales of devices and precision products
33.3 Sales of watch movements
Four other companies – – – – –
Notes 1. Ownership percentage of voting rights indicated inside parentheses refers to indirect ownership percentage. 2. *indicates a specified subsidiary (tokutei-kogaisha). 3. The revenue (excluding eliminations of sales among consolidated subsidiaries) of Epson Sales Japan Corporation
and Epson America, Inc. each amounts to more than 10% of the consolidated revenue. Key information on the operations of these subsidiaries is as follows.
(Millions of yen)
Company name Revenue Profit before
tax Profit for the
period Total equity Total assets
Epson Sales Japan Corporation 202,453 4,801 2,641 13,915 66,681
Epson America, Inc. 298,334 5,626 4,018 34,332 149,989
The amounts for Epson America, Inc. are included in consolidated business results.

121
2. Distribution of ownership among shareholders
As of March 31, 2014
Category
Share ownership (100 shares per unit) Shares less than one
unit (Shares)
Government and regional public
bodies
Japanese financial
institutions
Japanese securities companies
Other Japanese corporations
Foreign institutions and others
Japanese individuals and others
Total
Institutions Individuals
Number of shareholders
(Persons) – 89 37 420 521 26 47,131 48,224 -
Number of shares owned
(Units) – 492,560 72,570 282,010 511,321 125 638,561 1,997,147 102,689
Percentage of shares owned
(%) – 24.66 3.63 14.12 25.60 0.01 31.98 100.00 -
Notes 1. 20,928,657 shares of treasury stock are included as 209,286 units under “Japanese individuals and others” and 57
shares under “Shares less than one unit.” 2. Three units in the name of Japan Securities Depository Center, Inc. are included under “Other Japanese
corporations.”

122
3. Major shareholders As of March 31, 2015
Name Address Number of shares held Shareholding ratio (%)
Sanko Kigyo Kabushiki Kaisha
6-1 Ginza 5-chome, Chuo-ku, Tokyo 10,000,000 5.00
Japan Trustee Services Bank, Ltd. (Trustee Account)
8-11, Harumi 1-chome, Chuo-ku, Tokyo 7,851,000 3.92
The Master Trust Bank of Japan, Ltd. (Trust account)
11-3 Hamamatsu-cho 2-chome, Minato-ku, Tokyo 7,793,200 3.90
Seiko Holdings Corporation
5-11 Ginza 4-chome, Chuo-ku, Tokyo 6,000,000 3.00
Yasuo Hattori Minato-ku, Tokyo 5,966,306 2.98
Noboru Hattori Minato-ku, Tokyo 5,599,968 2.80 The Dai-ichi Life Insurance Company, Limited (Standing proxy: Trust & Custody Services Bank, Ltd.)
13-1, Yurakucho 1-chome, Chiyoda-ku, Tokyo (8-12, Harumi 1-chome, Chuo-ku, Tokyo)
4,368,000 2.18
Mizuho Trust & Banking Co., Ltd., Retirement benefit trust, Mizuho Bank, Ltd. account, Beneficiary of the re-trust, Trust & Custody Services Bank, Ltd.
Harumi Island Triton Square Office Tower Z, 8-12, Harumi 1-chome, Chuo-ku, Tokyo
4,076,900 2.04
Seiko Epson Corporation Employees’ Shareholding Association
3-5, Owa 3-chome, Suwa-shi, Nagano 3,886,158 1.94
NGK INSULATORS, LTD.
2-56, Suda-cho, Mizuho-ku, Nagoya-shi, Aichi 3,450,000 1.72
Total - 58,991,532 29.52 Notes: 1. Although the Company holds 20,928,657 shares of treasury stock, the Company is excluded from the above list of major shareholders. (The ratio of the treasury shares held by the Company to the total number of shares issued is 10.47%.) 2. The shares held by Mizuho Trust & Banking Co., Ltd., Retirement benefit trust, Mizuho Bank, Ltd. account, Beneficiary of the re-trust, Trust & Custody Services Bank, Ltd., were contributed by Mizuho Bank, Ltd. to the trust assets of the Retirement benefit trust. 3. Mizuho Bank, Ltd. and its joint holders submitted a Report of Change to the Director of the Kanto Local Finance Bureau as of May 22, 2014, claiming that they hold the Company’s shares as follows as of May 15, 2014. However, we have not been able to confirm the number of shares they held at the end of the fiscal year under review. Therefore, they are not included in the above major shareholders.

123
Name Address Number of shares held Shareholding ratio (%)
Mizuho Bank, Ltd. 5-5, Marunouchi 1-chome, Chiyoda-ku, Tokyo 6,947,000 3.48
Mizuho Trust & Banking Co., Ltd.
2-1, Yaesu 1-chome, Chuo-ku, Tokyo 2,696,800 1.35
Mizuho Asset Management Co., Ltd.
5-27, Mita 3-chome, Minato-ku, Tokyo 459,500 0.23
Total - 10,103,300 5.06

124
4. Epson stock price (1) High and low stock prices for the previous five years
Year 69th year 70th year 71st year 72nd year 73rd year
Fiscal year March 2011 March 2012 March 2013 March 2014 Mar 2015
High (¥) 1,700 1,499 1,183 3,390 5,970
□2,333
Low (¥) 1,032 881 431 795 2,752
□2,120 Notes 1. High and low stock prices noted above are based on Tokyo Stock Exchange (First Section) data. 2. The □ mark indicates the highest and lowest ex-rights prices after a stock split (the 2-for-1 stock split
implemented on April 1, 2015). (2) High and low stock prices for the previous six months
Month October 2014 November December January 2015 February March
High (¥) 5,280 5,790 5,970 5,090 4,505 4,885
□2,333
Low (¥) 4,495 5,030 4,940 4,775 4,055 4,405
□2,120 Notes
1. High and low stock prices noted above are based on Tokyo Stock Exchange (First Section) data. 2. The □ mark indicates the highest and lowest ex-rights prices after a stock split (the 2-for-1 stock split
implemented on April 1, 2015).

125
5. Corporate data and investor information (1) Company name Seiko Epson Corporation (2) Founded May 1942 (3) Head office 3-5 Owa 3-chome, Suwa, Nagano 392-8502, Japan
Tel: +81-266-52-3131(main) (4) Tokyo office Shinjuku NS Building, 4-1 Nishi-shinjuku 2-chome,
Shinjuku-ku, Tokyo 163-0811, Japan Tel: +81-3-3348-8531(main)
(5) Investor information Closing of accounts March 31 Regular general shareholders’ meeting June Date for confirmation to shareholders of the cash dividend payment date March 31 Date for confirmation to shareholders of the interim cash dividend payment date September 30 Transfer agent Mitsubishi UFJ Trust and Banking Corporation 4-5, Marunouchi 1-chome, Chiyoda-ku, Tokyo Agent’s business address Stock Transfer Agency Department Mitsubishi UFJ Trust and Banking Corporation 10-11, Higashisuna 7-chome, Koto-ku, Tokyo Tel: +81-3-6701-5000 http://www.tr.mufg.jp/english/ Intermediary offices Head Office and Branches of Mitsubishi UFJ Trust and
Banking Corporation Posting of public notices Public notices will be posted electronically. In the event of
accidents or other circumstances preventing the electronic posting of information, such information will be made available through the Nihon Keizai Shimbun newspaper (Japanese)
Web address http://www.pronexus.co.jp/koukoku/6724/6724.html
(Japanese)

3-3-5 Owa, Suwa, Nagano 392-8502, Japantel: +81-266-52-3131http://global.epson.com