developing segment-specific business models for
TRANSCRIPT

Developing segment-specific business models for agricultural crop protection distributors in
South Africa
PJ Nienaber
orcid.org 0000-0002-2105-349X
Mini-dissertation accepted in partial fulfilment of the requirements for the degree Master in Business
Administration at the North-West University
Supervisor: Prof CA Bisschoff
Graduation: June 2021
Student number: 33483132

ii
ACKNOWLEDGEMENTS
“For me and my house, we will serve the Lord”. No words will ever demonstrate the appreciation
for the love and blessing You Lord has bestowed upon me during this journey, for allowing loved
ones and friends to support me. Thank You for Your guidance and blessing to them during this
time.
The completion of this dissertation and the MBA have required immense effort, patience,
support, advice, and the love of those closest to me, you all know who you are and the role you
played. I want to thank you all for being a rock, a motivator, an advisor, a guiding light, my
strength, and my support. Without you all, I would not have been able to pursue and complete
the MBA. Special mention to my wife (Janca) and children (Rick, Markus, and Caira).
To Rudolph Geldenhuys, my mentor, my advisor, my friend, and the one who persuaded me to
follow this journey, who has guided and directed me during these studies, and specifically your
guidance in the dissertation.
To my promotor, Prof. Christo Bisschoff, thank you for your patience and guidance during this
process and for being available always when needed, going the extra mile.
A special word of appreciation to the management of InteliChem Group, as well as InteliGro
Board of Directors, for the financial assistance to complete the MBA programme and their loyal
support, especially during trying times. This was a tough but most enriching experience.
iii
ABSTRACT
Agriculture faces several challenges these days, most notably is the worldwide key challenge
of providing sustainable food supply and agricultural systems to a population that is expected
to grow to 10 billion by the year 2050 (FAO, 2017a). The report clearly states that “business as
usual” by all stakeholders should be critically assessed to address major transformation in
agricultural systems, rural economies, and natural resource management. The Crop Protection
Distribution has seen significant changes, ranging from consolidation in suppliers, consolidation
in growers due to continued sustainability pressure, including commodity prices and increased
input costs, to accelerated adoption of technology. This caused a significant threat to the Crop
Protection Distribution profitability, sustainability, and challenges what value they present to
growers. We have seen dozens of Crop Protection Distributors and cooperatives exiting the
market. Research in the segment-specific business models in the Crop Protection Distribution
Industry is limited, specifically in South Africa. In Lithuania researchers propose that a that the
business model that focusses on product production accompanied by limited service is no
longer suitable. They draw attention to the fact that the product plus service business model
should be implemented. Compared to South Africa, who has a traditional channel business
model of extensive service plus product through Independent Affiliated Commissioned Agents
which was adopted in the early 1990s. This approach is no longer applicable to this study. This
study analysed and developed segment-specific business models for Crop Protection
Distributors in South Africa, based on the needs and wants of the growers in each of those
segments.
Keywords: Crop protection, business models, B2B, B2C, E-Commerce, value innovation.

iv
TABLE OF CONTENTS
ACKNOWLEDGEMENTS ......................................................................... ii
ABSTRACT ............................................................................................. iii
LIST OF TABLES .................................................................................. viii
LIST OF FIGURES ................................................................................. xii
LIST OF ABBREVIATIONS ................................................................... xiii
CHAPTER 1: INTRODUCTION AND CONTEXTUALISATION OF
STUDY ....................................................................................... 1
1.1 INTRODUCTION .................................................................................................. 1
1.2 PROBLEM STATEMENT ..................................................................................... 3
1.3 RESEARCH QUESTIONS AND RESEARCH OBJECTIVES ............................... 5
1.3.1 Primary research question ................................................................................. 5
1.3.2 Primary research objective ................................................................................ 5
1.3.3 Secondary research objective ........................................................................... 5
1.4 RESEARCH PROPOSITIONS .............................................................................. 6
1.5 CONCEPTUAL FRAMEWORK ............................................................................ 6
1.6 RESEARCH METHODOLOGY............................................................................. 7
1.6.1 Introduction ......................................................................................................... 7
1.6.2 Research design and method of data collection ............................................ 11
1.6.2.1 Research design ........................................................................................ 11
1.6.2.2 Research strategy ...................................................................................... 12
1.6.2.3 Data collection ........................................................................................... 12
1.6.2.4 Reliability and validity of research .............................................................. 14
1.6.2.5 The sampling process ................................................................................ 15
1.6.2.6 Sampling strategy ...................................................................................... 16
1.6.3 The decision on a suitable sample size .......................................................... 17
1.6.4 Determining the Sample Size Required ........................................................... 18
1.7 DEMARCATION OF STUDY .............................................................................. 19
1.7.1 Geographical considerations of the unit of analysis ..................................... 19
v
1.7.2 Permission to access client base: ................................................................... 19
1.8 SUMMARY ......................................................................................................... 19
CHAPTER 2: CHALLENGES AND TRENDS IN CROP PROTECTION
INDUSTRY ............................................................................... 21
2.1 INTRODUCTION ................................................................................................ 21
2.2 PROBLEM STATEMENT ................................................................................... 23
2.3 RESEARCH PROPOSITIONS ............................................................................ 24
2.4 RESEARCH METHODOLOGY........................................................................... 24
2.5 LITERATURE STUDY ........................................................................................ 26
2.5.1 Challenges facing Crop Protection Industry ................................................... 26
2.5.2 Challenges facing Agricultural Crop Protection Distributors ........................ 28
2.5.2.1 The paradigm of trust in the Channel ......................................................... 29
2.5.2.2 Crop protection distribution trends ............................................................. 30
2.5.2.3 Challenges impacting Profitability .............................................................. 31
2.5.2.4 Conclusion ................................................................................................. 33
2.5.3 Crop Protection Industry: Post COVID-19 ....................................................... 33
2.5.4 Business Model as a Concept .......................................................................... 36
2.5.4.1 Clarifying the Business Model Concept ...................................................... 37
2.5.4.2 Understanding and sharing ........................................................................ 39
2.5.4.3 Analysing ................................................................................................... 39
2.5.4.4 Managing ................................................................................................... 39
2.5.4.5 Prospect .................................................................................................... 40
2.5.5 Current Business Models in Crop Protection Distribution in
South Africa ...................................................................................................... 41
2.5.5.1 The Crop Protection Distributor .................................................................. 42
2.5.6 Value Innovation: the link towards a Blue Ocean Strategy ............................ 45
2.6 SUMMARY ......................................................................................................... 48
CHAPTER 3: RESEARCH ANALYSIS AND RESULTS ........................ 50
3.1 RESEARCH ANALYSIS ..................................................................................... 50
3.2 RESULTS AND DISCUSSION OF RESULTS .................................................... 51
Section 1: Profile of each Grower Segment ...................................................................... 54
Section 2: Factors influencing the buying decision of each segment ............................ 73
Section 3: E-commerce Business Model Evaluation ....................................................... 83
Section 4: Segment-specific preference to information and technology ....................... 85

vi
Section 5: Frequency measure of service levels .............................................................. 86
Section 6: Value Chain Integration Analysis .................................................................... 88
3.4 SUMMARY AND CONCLUSION OF RESULTS ................................................ 89
CHAPTER 4: CONCLUSION, IMPLICATIONS AND
RECOMMENDATIONS ............................................................ 95
4.1 INTRODUCTION ................................................................................................ 95
4.2 CONCLUSION AND IMPLICATIONS ................................................................. 95
4.2.1 Research Proposition 1 and Research Proposition 2 .................................... 95
4.2.1.1 Literature study .......................................................................................... 95
4.2.1.2 Analysis of results ...................................................................................... 96
4.2.1.3 Conclusion ............................................................................................... 102
4.2.2 Research Proposition 3 .................................................................................. 102
4.2.2.1 Literature Study ....................................................................................... 103
4.2.2.2 Analysis of results .................................................................................... 104
4.2.2.3 Conclusion ............................................................................................... 105
4.2.3 Research Proposition 4 .................................................................................. 106
4.2.3.1 Literature Study ....................................................................................... 106
4.2.3.2 Analysis of results .................................................................................... 107
4.2.3.3 Conclusion ............................................................................................... 107
4.2.4 Research Proposition 5 .................................................................................. 109
4.2.4.1 Literature Study ....................................................................................... 109
4.2.4.2 Analysis of results .................................................................................... 110
4.2.4.3 Conclusion ............................................................................................... 111
4.2.5 Research Proposition 6 .................................................................................. 112
4.2.5.1 Literature Study ....................................................................................... 112
4.2.5.2 Analysis of results .................................................................................... 113
4.2.5.3 Conclusion ............................................................................................... 113
4.3 RECOMMENDATIONS .................................................................................... 113
4.3.1 Omni-channel marketing ................................................................................ 114
4.3.2 Omni-channel defined .................................................................................... 114
4.3.3 Omni-channel marketing Definition:.............................................................. 114
4.3.4 Value innovation ............................................................................................. 118
4.4 LIMITATIONS OF THE STUDY ........................................................................ 121
4.5 AREAS FOR FUTURE RESEARCH ................................................................ 121
4.6 SUMMARY ....................................................................................................... 121
vii
REFERENCES ..................................................................................... 123
APPENDICES ...................................................................................... 129
APPENDIX A: ETHICS APPROVAL ................................................................................... 129
APPENDIX B: LETTER OF CONSENT: ACCESS TO DATABASE ................................... 130
APPENDIX C: QUESTIONNAIRE ....................................................................................... 131
APPENDIX D: LANGUAGE EDITOR’S LETTER ................................................................ 145

viii
LIST OF TABLES
Research design questions
Table 1: Research Propositions ............................................................................... 6
Table 2: Basic and Applied Research (Easterby-Smith et al., 2012) ....................... 12
Table 3: Actual sample size ................................................................................... 19
Table 4: Actual sample size ................................................................................... 25
Table 5: Nine building blocks of the Business Model Concept ................................ 38
Table 6: Five dimensions of strategy ..................................................................... 46
Table 7: Six path framework .................................................................................. 46
Table 8: Red-Ocean vs Blue Ocean Strategy ........................................................ 47
Table 9: Actual sample size .................................................................................. 50
Table 10: Actual response rate................................................................................. 51
Table 11: Questionnaire format ................................................................................ 53
Corporate Agri-Business Results Tables
Table 12: Which position do you hold in the company? ............................................ 54
Table 13: Legal structure .......................................................................................... 54
Table 14: Shareholding structure ............................................................................. 55
Table 15: External shareholding % ........................................................................... 55
Table 16: Foreign entity shareholding % .................................................................. 55
Table 17: BBBEE shareholding % ............................................................................ 55
Table 18: Provinces they cultivate their crops .......................................................... 56
Table 19: Crops cultivated and hectares .................................................................. 56
Table 20: How do you finance your agricultural Crop Protection Inputs? .................. 57
Table 21: From which Agricultural Crop Protection Supplier do you procure your
crop protection products? ......................................................................... 58
Table 22: From whom do you procure your agricultural crop protection products? ... 58
ix
Table 23: Which products do you procure from the channels selected above? ........ 59
Table 24: Which of the following statements best reflect your purchasing of Crop Protection
Inputs? ..................................................................................................... 59
Mega-Sized Commercial Growers Results Tables
Table 25: Position you hold in the company or farm ................................................. 60
Table 26: Legal Structure ......................................................................................... 60
Table 27: Shareholding structure ............................................................................. 60
Table 28: External shareholding % ........................................................................... 61
Table 29: Foreign entity ownership .......................................................................... 61
Table 30: BBBEE shareholding % ............................................................................ 61
Table 31: Provinces they cultivate their crops .......................................................... 61
Table 32: Crops cultivated and hectares (Irrigated / Dryland) ................................... 62
Table 33: How do you finance the purchases of your crop protection products? ...... 63
Table 34: From which Agricultural Crop Protection Supplier do you procure your crop
protection products? ................................................................................. 64
Table 35: From whom do you procure your agricultural crop protection products? ... 65
Table 36: Which products do you procure from the channels selected above? ........ 65
Table 37: Which of the following statements best reflect your purchasing of Crop Protection
Inputs? ..................................................................................................... 66
Medium- and Large sized Commercial growers Results Tables
Table 38: Position you hold in the company or farm ................................................. 66
Table 39: Legalised structure ................................................................................... 66
Table 40: Shareholding structure ............................................................................. 67
Table 41: External ownership shareholding % .......................................................... 67
Table 42: Foreign entity ownership % ...................................................................... 67
Table 43: BBBEE shareholding % ............................................................................ 67
Table 44: Provinces they cultivate their Crops .......................................................... 68

x
Table 45: Hectares per crop cultivated (Irrigated / Dry Land) ................................... 68
Medium- and Large-sized Commercial growers Results Tables
Table 46: How do you finance the purchases of your crop protection products? ...... 69
Table 47: Procurement of Crop Protection Inputs ..................................................... 70
Table 48: From whom do you procure your agricultural crop protection products? ... 70
Table 49: Which products do you procure from the channels selected above? ........ 71
Table 50: Which of the following statements best reflect your purchasing of Crop Protection
Inputs? ..................................................................................................... 71
Summary Tables
Table 51: Summary of segmentation questions ........................................................ 72
Table 52: Procurement patterns ............................................................................... 73
Table 53: Question 18: Rate the level of service that you receive from your Crop Advisor
(previously known as agent) – rate each category (Excellent = 5, Good = 4,
Acceptable = 3, Moderate = 2, Poor = 1) .................................................. 78
Table 54: Question 19: Business Proposal: How important are the following to you as a
producer and in the decision-making process to procure Crop Protection
Products? (where 1 = least important, 7 = most important) ....................... 80
Table 55: Question 20: Price Policy: Which statement BEST describes your view on the
pricing and decision-making on procuring Crop Protection Products? (Totally
Disagree = 1, Disagree = 2, Somewhat Agree = 3, Agree = 4, Totally Agree = 5)
81
Table 56: Question 21: Looking into the future how would you prefer to purchase your Crop
Protection Products? Rate according to relevance (where 1 = lease relevant, 7 =
most relevant)........................................................................................... 82
Table 57: Question 22: Would you consider purchasing your Crop Protection Products from
an online platform (that is, Takealot)? ....................................................... 84
Table 58: Question 23: What would be your primary reason for procuring Crop Protection
Products from an online platform (i.e. Takealot)? Rate relevance (where 1 = least
relevant, 7 = most relevant) ...................................................................... 84

xi
Table 59: Question 24: How important to you is access to the latest technology (Disease
forecasting models, scout models, electronic recommendations, Omni-channel
models) from Agricultural Crop Protection Companies to support your farming
operations? (where 1 = least important, 7 = most important) .................... 85
Table 60: Question 25: Rate the relevance of the following information to you as the
grower. (Where 1 = no relevance, 7 = most relevant) ............................... 86
Table 61: Question 26: Technical / Marketing: How often do you need the services or visits
of Crop Advisors (i.e. Agents, Technical Advisors) of Agricultural Crop Protection
Suppliers? ................................................................................................ 87
Table 62: Question 27: Would you be interested in acquiring equity in your Crop Protection
Supplier (i.e. InteliGro, LAC, Nulandis, Wenkem)? ................................... 88
Table 63: Question 28: If you answered “yes” to the question above, what would be your
main consideration? ................................................................................. 88
Table 64: Profile of the three segments: Corporate Agri-business, Mega-Sized Commercial
Growers and Medium and Large Sized Commercial
Growers .................................................................................................... 90
Table 65: Successful segmentation measures ......................................................... 91
Table 66: Summary of prioritised factors per segment (above mean of 4) ................ 99
Table 67: Summary of segmentation questions ...................................................... 100
Table 68: Summary of Business Proposal Preferences per Segment..................... 101
Table 69: Summary of Pricing Policy Applied Per Segment ................................... 102
Table 70: E-Commerce option (Yes / No) ............................................................... 110
Table 71: Segment-specific primary reasons for procuring crop protection products through
e-commerce model ................................................................................. 111
Table 72: Omni-channel marketing: per segment based on the study results ......... 116
Table 73: Phase 1: Value innovation: services implementation .............................. 119
Table 74: Phase 2: Value innovation: services implementation .............................. 120

xii
LIST OF FIGURES
Figure 1: Conceptual framework of the study ............................................................ 7
Figure 2: Four paradigms for organisational analysis (Burrell & Morgan, 1979) ....... 10
Figure 3: Business model of Crop Protection Industry in South Africa ..................... 42
Figure 4: Business Model Canvas: InteliGro ............................................................ 44
Figure 5: The profit and growth consequences of the Blue Ocean strategy
(Chan Kim & Mauborgne, 2005a) ............................................................. 45
Figure 6: Corporate agri-businesses segmentation profile ....................................... 52
Figure 7: Mega-Sized Commercial Growers segmentation profile ........................... 52
Figure 8: Medium and large-sized commercial farmers segmentation profile ........... 52
Figure 9: Corporate agri-business ........................................................................... 75
Figure 10: Mega-Sized Commercial Growers ............................................................ 76
Figure 11: Medium- and large-sized Commercial growers ......................................... 77
Figure 12: Combined decision-making relevancy per segment .................................. 97
Figure 13: Rating of crop advisor service levels per segment .................................. 104
Figure 14: Future channel of procurement of Crop Protection Inputs per segment ........
(Preference) ........................................................................................... 105
Figure 15: Technology level of importance per segment ......................................... 108
Figure 16: Information per type level of importance per segment ............................ 108

xiii
LIST OF ABBREVIATIONS
BBBEE Broad-based Black Economic Empowerment
CRM Customer Relationship Management
FAO Food and Agriculture Organisation
FBN Farmers Business Network
GDP Gross Domestic Product
IT Information Technology
SMME Small, Medium and Micro Enterprises
VKB Vrystaat Koöperasie Beperk
VUCA Volatile, Uncertain, Complex, Ambiguous

1
CHAPTER 1: INTRODUCTION AND CONTEXTUALISATION OF
STUDY
1.1 INTRODUCTION
The research study has the core objective to develop segment-specific business models
for Crop Protection Distributors in South Africa, and primarily the suggestions from this
research are to be adopted and implemented by InteliGro.
The Business Model Concept, as developed by Osterwalder et al. (2005), has been
extensively researched since its inception in 2005. It is known not only to promote
continuous improvement and increased timeous reaction capacity within an organisation.
Still, it can create a competitive advantage to address the relevancy, profitability, and
sustainability of an organisation.
The Crop Protection Industry most notably faces numerous challenges, one where Crop
Protection Distributors (seen as a “middle-man” in the value chain) has seen a significant
deterioration in profit margins which threaten the very existence of Crop Protection
Distributors.
The phenomena are not limited to countries like the USA, Brazil and Australia, but has
spiralled down to the inevitable impact on the Crop Protection Distributors in South Africa.
It is noteworthy that the profit margins for some American Crop Protection Distributors in
dropped by -2% to -3%. Similarly, the percentages indicated in the USA have been found
corresponding to that of Crop Protection Distributors in South Africa. The continued
increase in the cost of product handling, increase in product prices from supplier level, and
the decrease in profit margins (growers’ low-cost provider focus) remain a challenge to
Crop Protection Distributors. They have limited room for error to stay sustainable (Sfiligoj,
2017).
We have seen dozens of Crop Protection Distributors and particular cooperatives who
have exited the industry via sale or acquisition (Sfiligoj, 2017). The significant consolidation
amongst Multi-National Crop Protection Manufacturers from the Big 6 to the Big 4, and
later the merger between two major state-owned China Crop Protection Manufacturers
’ChemChina’ and ‘Sinochem’ in September 2020 is confirmed (Jia, 2020).

2
New start-ups have popped up, such as Farm Trade and Farmers Business Network
(FBN), where these companies sell products directly to growers at a set cost via an e-
commerce model. This business model has taken the space of approximately 15% to 20%
of a specific market segment where growers focused on the lowest-cost provider (Sfiligoj,
2017).
It is assessed that the Amazon-type e-commerce model could occupy at least 10% of the
total market penetration and might fail on a large scale due to the demographics of the
market and its segments. It is further argued that this model might fail on a large scale as
Crop Protection Distributors still have an amount of knowledge and trust in agriculture
which will be required from growers.
Crop Protection Distributors are warned not to follow old business models. If they do not
adapt to the growing needs and wants of the growers who face their profitability concerns,
new start-ups like FBN will make inroads and occupy an even higher market share (Sfiligoj,
2017).
There is no doubt that e-commerce will come to agriculture, although not evident in South
Africa yet; this is a portion of the market that will be occupied similar to those experienced
by the USA. The question is not whether this model will be adopted, but rather based on
the experience in the USA and the specific segment it targeted, the question targets who
will be the first mover to take this space, and how should it be adopted, learning from the
experience in the USA. The study also aims to assess that the e-commerce model should
be implemented based on the research data obtained from the growers.
It was noted above that the profitability of the Crop Protection Distributors in South Africa
are under strain. The continued decline in the profits, 2% to 3%, one can argue that most
Crop Protection Distributors swim in a red-ocean where competition is fierce, bloody and
products and services offered are commoditised.
This study aims to advise InteliGro on how to develop a Blue Ocean Strategy following the
Six Path Framework, as well as develop a “Value Curve” which is designed to be able to
show the organisation instantly where value is created from the InteliGro product and
services in each of the segments. The “Value Curve” will then graphically illustrate the way
InteliGro or the Crop Protection Industry configures its growers’ offering.

3
A Blue Ocean Strategy alone will not suffice as any organisation is required to be able to
swim successfully in both the red-ocean as well as balance their Blue Ocean Strategy
(Chan Kim & Mauborgne, 2005a). It is thus imperative that Crop Protection Distributors
understand that in a world where new active ingredients and molecules are regarded as
super-star products, marketing has been slow and far in-between. This is, mainly due to
the regulatory environment and the excessive cost to develop one new active ingredient,
which exceeds $350 million and takes 11 years from the identification of the new molecule
until the stage where it can be marketed.
There are significant commodity and post-patent Crop Protection Products and Crop
Protection Distributors who need to adapt their service offering to create value, follow a
low-cost provider strategy in a red-ocean market, and aim to following a best-cost provider
strategy in the blue ocean. It is only through increased market share that red-ocean
strategies and reduction in logistics and handling of the product that Crop Protection
Distributors will increase profitability, should they not follow a Blue Ocean Strategy.
The research study aims to develop segment-specific business models for Crop Protection
Distributors in South Africa. We deliberate the problem statement below that the business
models for Crop Protection Industry have not changed since its inception in the early
1990s.
The market is 100% the Crop Protection Distributors to lose due to level of trust and
knowledge which exist. To remain sustainable Crop Protection Distributors (like InteliGro)
must do their part to keep their growers/customers through a successful business model
generation which is focused on addressing the growers’ needs and wants.
1.2 PROBLEM STATEMENT
The Crop Protection Distribution Industry in South Africa has not seen significant changes
since the business models established in the early 1990s. Manufacturers’ business model
was 1) to divest their direct distribution into selected distributors and 2) their marketing role
has developed to convince the Distributor to buy their products compared to other
manufacturers (Schreuder, 2002).
Crop Protection Distributors’ business model focused on the appointment of affiliated,
commission-based agents in various localities/towns, where the agent acts as an
independent contractor.

4
This contractor enters into an exclusive or semi-exclusive distribution agreement with the
Distributor, to promote, sell and distribute the products from the Distributor, who in return
has established agreements with Manufacturers. It is noted that this specific business
model, since its establishment in the early 1990s, has remained the primary model to the
end-user (producer/farmer).
Agriculture faces numerous challenges these days, most notably the worldwide key
challenge of providing a sustainable food supply with agricultural systems to a population
that is expected to grow to 10 billion by the year 2050. The report clearly states that
“business as usual” by all stakeholders should be critically assessed to address major
transformation in agricultural systems, rural economies and natural resource
management.
The global impact on agriculture will no doubt have a contributing factor and impact on
South Africa, as the research into the Crop Protection Industry is specifically limited in
South Africa.
In South Africa, there has been an increase of 64% in affiliated commission agents
(employed by Distributors). In contrast to the above, in South Africa crop-focused
producer/farmer numbers continue to decrease from 60 000 (1996), 45 000 (2002), to less
than 40 000 (2009). The projected number of remaining farmers is 15 000 by the year
2027.
Research conducted in 2016, B2B: A paradigm shift from Economic Exchange to
Behavioural Theory: a quest for better explanations and predictions indicated that a great
majority of B2B firms reach their customers through various channels of distribution.
These channels are constantly evolving.
The study aims to critically assess the current business models of Crop Protection
Distributors in South Africa as a generic template/business model. The research will then
focus on rigorous analysis of the requirements (needs and wants) of the producers/farmers
in South Africa. Based on the responses received from the research, optimal segment-
specific business models (compared to the generic business models) will be formulated
and proposed for implementation.
In the research conducted by (Schreuder, 2002) it is recommended that further research
is required into Corporate Agricultural Business service models and processes.

5
It has been mentioned that no significant changes in the current business models used by
Manufacturers and Distributors of Crop Protection Products in South Africa have occurred.
1.3 RESEARCH QUESTIONS AND RESEARCH OBJECTIVES
The problem statement above noted that the business models in the South African Crop
Protection have not adapted since its inception in the early 1990s. To ensure its
sustainability and relevance in the future, Crop Protection Distributors (LaPlaca & Da Silva,
2016) must gain a greater understanding through research to verify:
1.3.1 Primary research question
What will be the optimal business model per grower segment which should be developed
and adopted by Crop Protection Distributors in South Africa to address the requirements
(needs and wants) of the customers in those specific segments?
This primary question culminates from the three sub-research questions below:
• What are the needs and wants of the growers per segment, how do they
make their buying decisions and what are those pertinent issues that are
required to be met?
• What will the business models look like per grower segment based on their
needs and wants?
• How will Crop Protection Distributors develop and implement these segment-
specific business models in an omni-channel marketing approach?
1.3.2 Primary research objective
The primary objective of the study is to develop optimal segment-specific business models
which should be implemented by Crop Protection Distributors in South Africa.
1.3.3 Secondary research objective
The following secondary research objectives are derived from the research questions
above:
i. To identify the proper segmentation profile of customers
ii. To identify customer segmentation according to specific needs and wants

6
iii. To determine whether an e-commerce business model should be adopted
1.4 RESEARCH PROPOSITIONS
The Research Propositions supporting the deductive theory of the relationship
between practice, theory and research for this study are:
Table 1: Research Propositions
Description
Research
Proposition 1:
The needs and wants of each of the customer segments will
differ based on the demographics, size, legalised structure,
ownership % and crops cultivated.
Research
Proposition 2:
The buying decisions of Crop Protection Products for each of
the customer segments differ.
Research
Proposition 3:
The traditional business model will apply to a specific customer
segment, medium to large size commercial producers.
Research
Proposition 4:
Research data, technology and industry-related information,
play a significant role in the buying decision-making processes
in individual customer segments and are of less importance in
other customer segments.
Research
Proposition 5:
The business models will differ per customer segment based on
the needs and wants of each of the customer segments.
Research
Proposition 6:
An e-commerce business model should be implemented by
Crop Protection Distribution Companies.
1.5 CONCEPTUAL FRAMEWORK
The conceptual framework below aims to illustrate the extent to which the study seeks to
address the problem statement, the primary and secondary research objectives, and the
Research Propositions through empirical study.

7
Figure 1: Conceptual Framework of the Study
1.6 RESEARCH METHODOLOGY
1.6.1 Introduction
Research philosophy is a system of beliefs and assumptions concerning the development
of knowledge. Multiple types of assumptions are inevitable in each stage during any
research. These assumptions include human knowledge (epistemological assumptions),
realities encountered in the research process (ontological assumptions), and the extent to
which values influence the research process (axiological assumptions) (Crotty, 1998).
Research Proposition 1
• The needs and wants of each of the customer-segments will differ based on the demographics, size, legalised structure, ownership % and crops cultivated.
• Literature study
• Analysis of results
• Conclusion
Research Proposition 2
• The buying decisions of Crop Protection Products for each of the customer-segments differ.
• Literature study
• Analysis of results
• Conclusion
Research Proposition 3
• The traditional business model will apply to a specific customer-segment, medium to large size commercial producers.
• Literature Study
• Analysis of results
• Conclusion
Research Proposition 4
• Research data, technology and industry related information plays a significant role in the buying decision-making processes in certain customer segments, and are of less importance in other customer segments.
• Literature study
• Analysis of results
• Conclusion
Research Proposition 5
• The business models will differ per customer segment based on the needs and wants of each of the customer segments.
• Literature Study
• Analysis of results
• Conclusion
Research Proposition 6
• An e-commerce business model should be implemented by Crop Protection Distribution Companies
• Literature study
• Analysis of results
• Conclusion

8
These assumptions shape our understanding of our research questions, the methods we
use and how we would interpret our findings (Saunders et al., 2016).
Business and management research is a distinctive research focus where three features
are combined (Easterby-Smith et al., 2012):
• Eclectic nature: knowledge developed in different disciplines, for example,
sociology, geography, psychology, and economics and statistics, present their
own underlying assumptions.
• High levels of education represented by employees and managers who are as
well educated as those who have researched them.
• The research is expected to have a practical consequence which will lead to
direct action. Actions or needs would be addressed, specifically taking the
practicality of findings into account. The intent of the study and allowed access
would only be pursued should there be a perceived advantage to the individuals
or the organisation they represent (Saunders et al., 2016).
The nature of management research has had an empirical focus which is both theoretically
and methodologically rigorous while embracing practical relevance and applicability in the
world of practice. The nature of the business and management research can be debated
where the findings should not only address the needs to advance knowledge and
understanding, but it should also address organisational and managerial problems
(Saunders et al., 2016).
(Denyer & Tranfield, 2009) referred to the above as the so-called “relevance gap” and
stated that ignoring the “relevance gap” would be atrocious in other professional fields (i.e.
medicine, engineering). It would compare to a national scandal if science and practice
were not inextricably interlinked. Management research is conceptualised as a design
science and not social science (Saunders et al., 2016).
This relates to the idea of conceptualising management as a design science rather than
social science. From the design science perspective, the primary purpose of academic
management research is only to develop valid knowledge in support of organisational
problem-solving. The counter-argument proposes that management practice is
characterised by a wide variety of organisational phenomena that are often ambiguous.

9
Therefore it may not be suited to rule-like explanations offered by design science, and
there needs to be a balance between explanation and application (Pandza & Thorpe,
2010).
This research is undertaken within InteliGro (individual organisation), to understand the
current business model (divesting of distribution through the appointment of affiliated
commissioned agents) applicability and whether this business model is suited for different
segments. Through the study we aim to understand what the business models for each of
the customer segments should be based on their needs and wants. Furthermore, to advise
whether InteliGro should adopt different business models for each of these segments, and
to propose how those business models should look to address value innovation and value
proposition, in the quest to ensure that InteliGro remains relevant and sustainable in the
future. It was noted in the problem statement above that the business model for Crop
Protection Distributors in South Africa had not been changed since its inception in the early
1990s.
The research will follow a radical change perspective, as suggested by Burrell and
Morgan, (1979). Organisational problems or burning points are approached through
Radical Change Research to overturn the existing business models or make fundamental
changes to address value innovation and follow a blue ocean marketing strategy. Radical
change research approached organisational problems in an attempt to overturn the status
quo. This research is often viewed as visionary and utopian while being concerned with
what alternatives exist and what possibilities could be implemented to change the current
position (Burrell & Morgan, 1979).
Burrell and Morgan in their book, Sociological Paradigms and Organisational Analysis
(1979), combined the objectivist-subjectivist continuum with a regulation-radical
continuum in an attempt to create a matrix of the four major and rival “paradigms” of
organisational analysis, as seen in Figure 1.2 below. The matrix below illustrates the four
different views of the social and organisational world. This study focusses on the
combination between the functionalist - and radical structuralist paradigm. This
paradigm is best suited and used most business research projects. This study is also
concerned with rational explanations in the evaluation of current business models
(functionalist), and aims to develop a set of recommendations for new business models
to be implemented per segment. These recommendations are based on the needs and
wants of each of the customer segments (radical structuralist), while remaining focused
on the study with objectivist continuum.

10
Figure 2: Four paradigms for organisational analysis (Burrell & Morgan,
1979)
The study will follow the positivism research philosophy where typical methods include
deductive, highly structured, large samples, measurement, quantitative method of
analysis, and range of data can be analysed (Saunders et al., 2016). A positivist natural
science will be drawn (Research Propositions formulation) in the engagement of the world
we live in, as part of InteliGro and as a Crop Protection Distributor in South Africa.
As a positivist the researcher will remain neutral and detached from the research to avoid
influencing the findings (Crotty, 1998). This was achieved by using questionnaires sent
from the IT Department through the use of SurveyMonkey (Internet Questionnaire). Here
the respondents will receive an electronic link to the questionnaire, which they were
required to complete in their own time.
The use of SurveyMonkey is specific to remain external to the process of data collection.
SurveyMonkey itself collects the data, so the researcher is unable to alter the substance
of the data collected (Saunders et al., 2016). The study will also follow a highly structured
methodology to ensure replication (Gill & Johnson, 2010).
Radical humanist
Radical Structuralist
Interpretive Functionalist
Subjectivist
Radical Change
Objectivist
Regulation

11
1.6.2 Research design and method of data collection
1.6.2.1 Research design
The study will follow a literature study as well as an empirical research study, as illustrated
in the conceptual framework above.
The research approach adopted is a quantitative study in nature, where quantitative
research is described as a distinctive approach where data is collected. The relationship
between theory and the research conducted was viewed as deductive (Bryman et al.,
2014).
A quantitative research design may use a single data collection technique, such as a
questionnaire, and a corresponding quantitative analytical procedure. This is known as a
mono-method quantitative study (Saunders et al., 2016).
The researcher has considered the practical consequences of the study and moved from
basic research to applied research (refer to Table 1.2 below). At the end of the applied
research, the research is direct and can be used immediately by managers. The research
addressed important issues and was constructed in ways that can be understood by
managers and be implemented accordingly. This is the basis of applied research
(Saunders et al., 2016).

12
Table 2: Basic and Applied Research (Easterby-Smith et al., 2012)
Basic Research Applied Research
Purpose:
• Expand knowledge and processes of
business and management
• Results in universal principles relating
to the process and its relationship to
outcomes
Purpose:
• Improve understanding of particular
business or management problem
• Results in solution to the problem
• New knowledge limited to problem
• Findings of practical relevance and
value to managers in the organisation
Outcomes:
• Undertaken by people based in
universities
• Choice of topic and objectives
determined by the researcher
• Flexible time scales
Outcomes
• Undertaken by people based in a
variety of settings including
organisations and universities
• Objectives negotiated with the
originator
• Tight time scales
1.6.2.2 Research strategy
The research strategy, as defined by (Denzin & Lincoln, 2011), plans how the researcher
will aim to answer their research question. It will be the methodological link between the
research philosophy and choice of methods to collect and analyse the data. The research
strategy is discussed below, which will follow the construct of:
- Data collection
- Reliability and validity of the research
- The Sampling Process
- Sampling Strategy
- Research ethics
1.6.2.3 Data collection
The data collection will follow a survey strategy to associate with the deductive research
approach. The survey strategy is used to answer ‘what’, ‘who’, ‘where’, ‘how much’ and
‘how many’ questions (Saunders et al., 2016).
13
In this specific study, the aim is to understand what the needs and wants of the growers
are in specific segments and to develop segment-specific business models to be
implemented by Crop Protection Distributors in South Africa.
The study follows a cross-sectional design use of questionnaires. The questionnaires are
designed to follow a quantitative research approach, and will follow the construct of:
Question 1: Approval / Consent to the research
Question 2: Information about the person completing the questionnaire
Question 3 – 13: Information and segment-specific questions
Question 14 – 21: Procurement patterns and which factors influence the
decision-makers in their choice of procuring Crop Protection
Products based on the needs and wants of each of these
respondents
Question 22 – 23: To determine to what extent the respondent will consider e-
commerce and what will be the primary objective, should this
business model be considered
Question 24 – 25: Segment-specific importance to access latest technology
and information
Question 27 – 28: Which segment provides the biggest appetite to integrate
backwards with their Crop Protection Distributor and what
will be their primary objective in considering backwards
integration.
The questionnaires were compiled by reviewing past theses and dissertations, as well as
with the support of Mr R. Geldenhuys and the promotor Prof. C. A Bisschoff, to ensure that
the questionnaire is complete and will address the primary research objective. The
following literature was reviewed:
• 2017 Victor Harbor Agri-business Survey Key Findings Report (Harbour, 2018)
• The Impact Of Changes In Corn Prices On Pesticide Demand (Vermeulen,
2008)
• Agricultural Sample Survey 2010 (Africa, 2018)
• An Investigation Into Global Distribution Systems In The Crop Protection
Industry And The Development Of Distribution System Management Models For
Particular Application in South Africa And Australia (Schreuder, 2002)

14
• Inclusive Business Models (FAO, 2017b)
• Business Characteristics and Business Model Classification in Urban
Agriculture (LIU, 2015)
• Technology Transfer as a Driver of Innovative Entrepreneurship in Agriculture
and the Agri-Food Industry (Chania, 2015)
• Business Model for Sustainable SMME Pig Farming in the Central Free State of
South Africa
• Farmer Survey (Kingsley, 2016)
The questionnaires will be developed and formulated in Word format and transferred to
SurveyMonkey, which is an internet research site designed specifically for internet
questionnaires and data collection. The link to the questionnaires will be sent from the IT
Department of the InteliChem Group to all the respondents. See Appendix A for the sample
of the questionnaires sent out.
Once the questionnaires have been completed, the data will be exported from
SurveyMonkey to an Excel format. This document will then be sent to the North-West
University’s Department of Statistical Consultation Services, to analyse the data obtained.
The analysis, once completed, was sent to the researcher to interpret the results as part
of the study.
1.6.2.4 Reliability and validity of research
Reliability and validity are crucial to the quality of the quantitative research in the social
sciences and the judgements made. Reliability was judged against the replication and
consistency of the research.
The research will only be considered reliable if the research design and study can be
replicated, and the same findings could be achieved. It would be found that the study could
be replicated should the same questionnaire be sent to various growers in South Africa.
The findings would be the same as it relates to those growers’ specific needs and wants,
as based on their profile, demographics, size and crops cultivated.
The validity of the research is addressed through the appropriateness of the measures
used, the accuracy of the analysis of the results and the interpretation of the findings
(Saunders et al., 2016).

15
1) Internal validity: would be addressed where the questionnaires aim to obtain
relevant segmentation data, as well as real and causal relationships between
factors which impact the decision-makers in their procurement of Crop Protection
Products per segment. These differ based on their needs and wants and can
develop segment-specific business models. These relationships will be analysed
and associated with an analytical factor commonly associated with positivist and
quantitative research, which is the design of this study.
2) External validity: this study aims to address external validity through the data
collected and analysed, along with the subsequent segment-specific business
models to be developed for Crop Protection Distributors in South Africa. It will
not only be applicable and adopted by InteliGro, but aim to be a model for specific
segments which can be adopted by all Crop Protection Distributors in South
Africa. These business models will be developed based on the needs and wants
of those growers in that specific segment.
1.6.2.5 The sampling process
In selecting a sample to study, it should represent the full set of cases/population in a way
that is meaningful and which we can justify (Becker 1998).
The selected sample relates to the target population highlighted from the research
questions and objectives. The target population is defined as the actual focus or target of
research enquiry (Kervin 1999). In this research, the target population is the customers of
InteliGro, which is 2 018 active customer accounts. The focus of the study is to obtain a
rigorous analysis of the business models which should be adopted, based on the needs
and wants of the InteliGro customer segments, and compare it to current business models
adopted by InteliGro.
The population above consists only of commercial farmers cultivating crops (for example
citrus, grapes, vegetables, summer row crops, small grain, potatoes and minor crops). The
study focuses on new business models for input suppliers like InteliGro (National
Distributor of Crop Protection, specialised plant nutrition, biological solutions and
technology products) and Villa Crop Protection (National manufacturer of Generic Crop
Chemical Products).

16
The study and selection will aim to include commercial farmers cultivating the same crops
in different provinces (such as a citrus farmer in Limpopo’s response to the questionnaire
and future requirements might differ from a citrus farmer in Eastern Cape and/or Western
Cape). Geographical information and patterns were assessed to strengthen the required
new business model per segment, per commercial farmer demographics and cultivated
crops.
The study aims to provide insight into determining what new business models should be
used for the following type of commercial farmers:
Segment 1: Corporate Agricultural Businesses (where commercial farmers are
integrated into the value chain, either forward or backward
integration)
Segment 2: Mega-Sized Commercial Growers (the basis of turnover,
differentiation in crops cultivated, legalised structure, the
investigation into integration)
Segment 3: Medium and Large Sized Commercial Growers (the basis of
turnover, limited differentiation in crops cultivated, and no
integration into value chain)
1.6.2.6 Sampling strategy
The study followed a probability sampling strategy which is most commonly associated
with survey research strategies. This study aims to make inferences from the sample
selected about the population of growers to answer our Primary Research Questions and
to meet the primary and secondary research objectives (Saunders et al., 2016).
The probability sampling process can be divided into four stages:
1) Identify a suitable sampling frame: customers in the InteliGro Database, which is
demographically located throughout South Africa, this customer base was
selected based on our research question and objectives.
2) Determine what the suitable sample size should be.
3) Selection of the most appropriate sampling technique and start to select the
sample.
4) Ensure that the sample is representative of the target population, so the sample
at least addresses growers from each of the segments which we will be focusing
on.
17
It is of utmost importance that the sampling frame for any probability sample should
represent a complete list of all the cases in the target population from which the sample
was selected. The target population, as highlighted above is the Customer Database of
InteliGro, a single organisation who is a National Crop Protection Distributor in South
Africa.
As highlighted by (Edwards et al., 2002), when the sampling frame is from an existing
database, one should be cautious that the database is often incomplete, the information
might be dated.
In address the concerns noted by Edwards et al. (2002), the sample selected was sent to
the various Crop Solutions Specialists who serve these growers, to obtain the correct
information (such as the name of the producer and e-mail address) before any of the
questionnaires was dispatched to the sample.
1.6.3 The decision on a suitable sample size
To draw conclusions and to develop segment-specific business models, the
generalisations about the target population from the data collected must be statistically
probable. The sample size chosen was based on:
• The level of confidence we need in the data collected: we need to achieve a
95% certainty that the characteristics found in the data represent 100% of the
population in that segment and a margin of error which we can tolerate.
• The types of analyses we are going to undertake, in particular as seen below
from Section 1 to Section 6 in the results, where many statistical techniques were
used in each of the sections.
• The size of the target population.
The sampling frame was derived from the target population where the growers in the
database were reduced to:
1) Exclude own Crop Solution Specialist accounts
2) All-cash sales
3) All sales below R500 000 to any grower for the period of 1 August 2019 to 31
July 2020.
The sampling frame then constituted 697 growers.

18
The sampling frame was then categorised to determine the relevancy of the sampling
frame to include all the categories (for example, Corporate Agri-Business, Mega-Sized
Commercial Growers, Medium - and Large Sized Commercial growers).
The following sample frame per category was derived:
Corporate Agri-Business: 55 growers
Mega-Sized Commercial Growers: 113 growers
Medium and Large Sized Commercial Growers: 529 growers
1.6.4 Determining the Sample Size Required
Probability sampling requires that the sample size be large enough to have the required
confidence in the data collected. Based on the literature of research methods as presented
above, we need a 95% certainty that our business model development for specific
segments is accurate. This corresponds with a z-score of 1.96. An estimate that the margin
of error should be within acceptable limits, a 5% of the true percentage. This requires one
to estimate what the response rate will be of the sample selected. The sample size
required was calculated as follows:
n = r% x q% x [z / e%]2
where:
n = minimum sample size
r% = Percentage belonging to the specified category (697 / 2081) = 33.5%
q% = Percentage not belonging to the specified category ((2081 – 697)/
2081) = 66.5%
z = level of confidence required (@95% = z: 1.96)
e = margin of error (5%)
Total accounts in InteliGro Database = 2 081
n = 33.5 x 66.5 x [1.96 / 5]2
n = 342
The minimum sample rate will be used as guidance where the actual sample size is shown
in the table below.

19
Table 3: Actual sample size
Corporate Agri-
Business
Mega-Sized
Commercial
Growers
Medium and Large
Sized Commercial
Growers
Total
Sample 55 113 250 418
Sampling Frame 55 113 529 697
Sampling % 100% 100% 47% - systematic
random
The sampling technique used and determined as the most appropriate, only referred to
the Medium and Large Sized Commercial Growers category. Here the researcher adopted
a systematic random approach by starting at a random point in the database and then
selected every second grower in this segment from the sample frame.
1.7 DEMARCATION OF STUDY
1.7.1 Geographical considerations of the unit of analysis
The unit of analysis consists of the Client base of InteliGro, numbering 2081 commercial
growers throughout South Africa, including all the provinces. The study uses a cross-
sectional internet questionnaire which was be sent from InteliChem’s IT Department to all
the growers in the sample selected, to their personal or business e-mail accounts. The
respondent will have the opportunity to access the questionnaire via the internet through
the portal provided by SurveyMonkey.
1.7.2 Permission to access client base:
InteliGro permission has been granted as they are involved in the funding of this study
(See Appendix).
1.8 SUMMARY
The study will follow the positivism research philosophy where typical methods include
deductive, highly structured, large samples, measurement, quantitative method of
analysis, and the range of data can be analysed (Saunders et al., 2016).

20
The research approach adopted is a quantitative study in nature, using the mono-method
quantitative study. Considering the practical consequences of the research, the research
is constructed more towards applied research, specifically to be implemented and
presented in such a manner which can be used by managers in an organisation.
Internal and external validity limitation and concerns were adequately addressed in the
demarcation and sampling strategy. This enables the researcher to not form any biases or
involvement, which may impact the quality of the research results.

21
CHAPTER 2: CHALLENGES AND TRENDS IN CROP
PROTECTION INDUSTRY
2.1 INTRODUCTION
The literature study below aims to provide a framework of the challenges and trends in
agriculture, the Crop Protection Industry, Crop Protection Distribution, and Business
Models implemented in the Crop Protection Distribution Industry. The literature study also
provides an insight into looking forward past the COVID-19 pandemic in the Crop
Protection Industry, and what will be required for companies to remain sustainable. The
literature study will continue to focus on providing a possible solution looking into value
innovation as a concept for Crop Protection Distributors who struggle to maintain profit
margins as they continue to decline and threaten their profitability.
The introduction below will focus on the paradigm of why agriculture is in a worse shape
than we think. The impact of climate change has been well documented. The impact
thereof has been on the agenda of basically every well-known forum in the world, and has
been on the agenda and focus of the World Food and Agriculture Organisation for more
than a decade. Much has been done to turn the devastating impact of our industrialisation
era to be greener and more environment-friendly, to slow down the impact of climate
change.
We are still experiencing the effect of climate change on water and water-management
practices. It will continue to shape agriculture and particularly its production stage, where
water will influence the selection of a specific crop, cultivar and the technology employed
(Ungerer et al., 2018).
Agricultural production and the impact on land use has been a major role player in the
levels of anthropogenic emissions of greenhouse gasses. Record levels are recorded
according to the most recent assessment report of the Intergovernmental Panel on Climate
Change. The impact of climate change is expected to be the most adverse in the low- to
middle-income countries, not assisting the current demand on food supply to feed the
growing population, especially in those countries where food insecurity is ranked at the top
(FAO, 2017c).

22
Deglobalisation is a reality due to the trade wars experienced between China and the USA.
The USA is aiming to move supply chains out of China back into the USA, in order to find
lower alternatives or to use automation to reduce costs. China is seeking to move out of
its dependence on the USA dollar grip and clean up its environment while focusing on their
new middle-class consumers (the predominantly USA dominated technology markets).
Each of these countries plays a significant role in the global economy, and various
countries are linked with either or both. For the Crop Protection Industry, China plays a
massive role in the production of raw synthetic agrichemical material. At the same time,
the environmental clean-up has caused disruptive supply chain management in agriculture
on an on-off basis. The trade wars are by no means over, and the impact of this
relationship will affect agriculture (Budzynski, 2020).
Some of the most pressing matters focused on in all major agendas impacting the future
of agriculture include (FAO, 2017c):
a) The food crisis which is looming, where we aim to address food insecurity and
address the demand to feed a growing population which has been estimated to
reach 10 billion by the year 2050.
b) The economic insecurity of the United States due to the trade wars and
deglobalisation. The trade wars not only had an impact on the sales volume but
also the price. The prices for soybeans averaged at $10 to $12 per bushel. With
the ongoing trade wars, this price declined by 15% to 30% over the period to
$8.71 per bushel.
c) The ongoing closure of food processing facilities and local businesses which was
caused by the COVID-19 pandemic. The worldwide impact of the pandemic on
the economy and especially those developing/emerging countries, which
includes South Africa.
d) High rates of food waste aiding the threat and intensifying food insecurity. The
Food and Agriculture Organisation (FAO) of the United States estimated that a
total of 1.3 billion tonnes of food is wasted globally per annum, which represents
one-third of all the food which is produced for human consumption.

23
e) Disruptions in trade networks and the fluctuation in the global demand for
agricultural products. This concerns the green revolution and the added pressure
to produce residue-free food with reduced Active Chemical Ingredients to
effectively implement Integrated Pest Management Practices. The closure of
Crop Protection Formulation companies in China due to non-compliance to the
new environmental laws have placed immense pressure on the trade networks
for Crop Protection. The COVID-19 pandemic also did not provide us with relief,
where the closure of certain businesses and ports had a massive impact on the
supply.
f) We noticed the economic depreciation worldwide. We continue to notice it not
only in South Africa due to the climate changes and prolonged drought
experienced in certain areas, but worldwide, where the farming debt increases
by 20% per annum over the past decade and producers need to grow more on
the same land to remain sustainable.
g) Today the global debt is amounting to $250 trillion, which represents 320% of
the GDP. The extreme price appreciation of new technology and new farming
equipment at levels of more than double inflation cripples the producer. Without
the adoption of the latest technology and new implements (with specific
reference to precision agriculture), they will not be able to produce more food
more efficiently and cost-effective.
h) The prices for agricultural land are levitating above what the farm’s economy can
justify, due to acquisitive farmers diluting their respective balance sheets.
Meanwhile, those who are non-farmers are looking for investment into farms that
provide a significant return with low risk.
2.2 PROBLEM STATEMENT
It is clear from the introduction that the challenges in agriculture will require the strategic
ideation of all input suppliers and growers to combine efforts to ensure that growers
produce more on less arable land, more efficiently and profitably. For strategic ideation to
occur, input suppliers (like Crop Protection Suppliers) need to continually seek
opportunities for collaboration with growers to understand their needs and wants.

24
Collaboration and a new model which needs to be investigated guarantees
recommendations provided for product supplied, as well as collaboration with the growers
on the procurement of bulk supply/containers. The value creation for Crop Protection
Distributors will be of utmost importance should they wish to remain sustainable. The value
that is created needs to be communicated and articulated that it indeed addresses the
needs and wants of the growers.
2.3 RESEARCH PROPOSITIONS
The Research Propositions formulated in Chapter 1 is supported with the introduction and
the problem statement above. It is aimed at the needs and wants of growers for each
specific segment, which will differ based on their demographics, size, profile, legalised
structure, owner/management decision-making and crops cultivated. Their needs and
wants differentiation will be reflected in the buying decisions factors they deem most
important, which will be segment-specific.
The Research Proposition is that the factors and challenges noted above will influence
each segment differently, as some of them will be subsistence-based and others
significantly cost-focused.
2.4 RESEARCH METHODOLOGY
In the introduction in Chapter 1 of the research methodology, we explained that the
research will follow a radical change perspective according to (Burrell & Morgan, 1979)
and will follow a positivism research philosophy, where typical methods include deductive,
highly structured, large samples, measurement, quantitative method of analysis, and
range of data can be analysed (Saunders et al., 2016). As a positivist natural science will
be drawn (Research Propositions formulation) in the engagement of the world we live in,
as part of InteliGro and as a Crop Protection Distributor in South Africa which is seen in
the conceptual framework.
The research approach adopted and aligned with the positivism research philosophy is a
quantitative study in nature, and the single data collection technique (through the use of
cross-sectional questionnaires) will be a mono-method quantitative study (Saunders et
al., 2016).

25
The data collection will be done using cross-sectional questionnaires which will be
distributed to the sample selected through the internet source SurveyMonkey.
Reliability and validity are crucial to the quality of the quantitative research in the social
sciences and the judgements made. Reliability is only judged against the replication and
consistency of the study.
The validity is addressed by determining the appropriateness of the measures used, the
accuracy of the analysis of the results, and the interpretation of the findings (Saunders et
al., 2016).
The sampling process provided insight that the sample for the study will be represented
by the full set of cases/population in a way that is meaningful and which can be justified in
accordance to (Bekker, 1998).
The sampling strategy followed was chosen to be a probability sampling process where
we moved through the four stages to ensure the completeness of the sampling strategy.
The sample frame derived from the population was critically assessed against the basis
that it does contain all the elements required to make assumptions based on the probability
of the sample selected.
The sample size was calculated to achieve a 95% probability that the characteristics found
in the data represent 100% of the population. The margin of error tolerated was, as
suggested by the literature, 5%. The minimum sample size calculated amounted to 324.
However, we explained that the sample size was calculated at 418. This sample
represents the minimum sample rate, which was used as guidline to determine the actual
sample size (see Table 4):
Table 4: Actual sample size
Corporate Agri-
Business
Mega-Sized
Commercial
Growers
Medium and Large
Sized Commercial
Growers
Total
Sample 55 113 250 418
Sampling Frame 55 113 529 697
Sampling % 100% 100% 47% - systematic
random

26
The sampling technique used and determined as the most appropriate, only referred to
the Medium and Large Sized Commercial Growers category. We adopted a systematic
random technique, where every second grower in this segment was chosen randomly from
the sample frame.
2.5 LITERATURE STUDY
The purpose of scientific investigation is to advance our knowledge and understanding of
the world around us. In conducting scientific investigations, researchers, particularly
scientists studying physical phenomena, progress through a hierarchy of types of
research: descriptive, explanatory, predictive and control (Vidickiene & Gedminiate-
Raudone, 2018).
2.5.1 Challenges facing Crop Protection Industry
Agriculture faces several challenges these days. Most notable is the worldwide key
challenge of providing sustainable food supply and agricultural systems to a population
that is expected to grow to 10 billion by the year 2050 (FAO, 2017a). The report provides
further insights into the top ten challenges in achieving food security and nutrition for all
and making agriculture sustainable.
The report clearly states that “business as usual” by all stakeholders should be critically
assessed to address major transformation in agricultural systems, rural economies, and
natural resource management.
Management of our natural resources adds to the challenge as we are required to produce
more food on the 3.5% arable land (1.5 million hectares of land used for farming)(FAO,
2017a). Commodity prices are currently at a low, where corn prices in 2008 were $8 per
bushel, while in 2016, they were $3 per bushel (Sfiligoj, 2017). These prices result in
further pressure on producers not only to produce more but to do so in a sustainable,
profitable manner. Climate change is also a growing risk determinant to Corporate
Agricultural Businesses (Vidickiene & Gedminiate-Raudone, 2018).
Precision Agriculture and the adoption of technology in agriculture has received immense
focus by input suppliers and is identified as a significant trend. Precision Agriculture, as an
Integrated Pest Management Control tool, can meet much of the increasing environmental,
economic, market and public pressures on arable agriculture (Stafford, 2000).
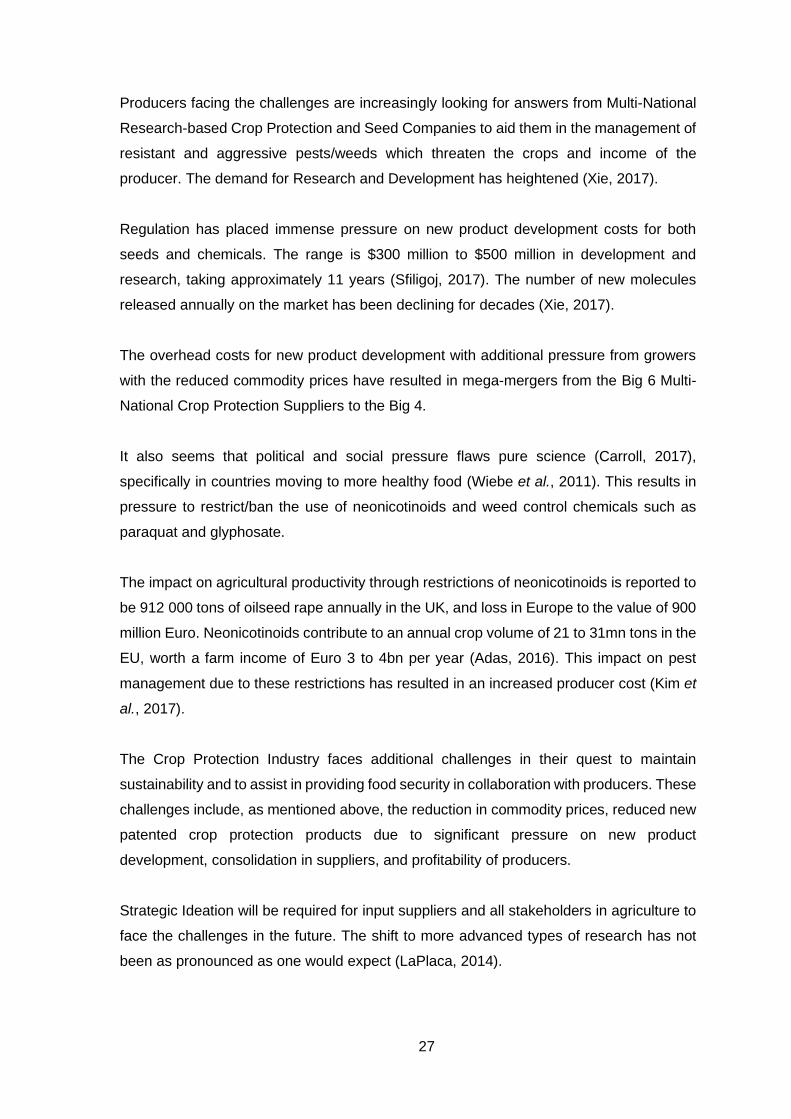
27
Producers facing the challenges are increasingly looking for answers from Multi-National
Research-based Crop Protection and Seed Companies to aid them in the management of
resistant and aggressive pests/weeds which threaten the crops and income of the
producer. The demand for Research and Development has heightened (Xie, 2017).
Regulation has placed immense pressure on new product development costs for both
seeds and chemicals. The range is $300 million to $500 million in development and
research, taking approximately 11 years (Sfiligoj, 2017). The number of new molecules
released annually on the market has been declining for decades (Xie, 2017).
The overhead costs for new product development with additional pressure from growers
with the reduced commodity prices have resulted in mega-mergers from the Big 6 Multi-
National Crop Protection Suppliers to the Big 4.
It also seems that political and social pressure flaws pure science (Carroll, 2017),
specifically in countries moving to more healthy food (Wiebe et al., 2011). This results in
pressure to restrict/ban the use of neonicotinoids and weed control chemicals such as
paraquat and glyphosate.
The impact on agricultural productivity through restrictions of neonicotinoids is reported to
be 912 000 tons of oilseed rape annually in the UK, and loss in Europe to the value of 900
million Euro. Neonicotinoids contribute to an annual crop volume of 21 to 31mn tons in the
EU, worth a farm income of Euro 3 to 4bn per year (Adas, 2016). This impact on pest
management due to these restrictions has resulted in an increased producer cost (Kim et
al., 2017).
The Crop Protection Industry faces additional challenges in their quest to maintain
sustainability and to assist in providing food security in collaboration with producers. These
challenges include, as mentioned above, the reduction in commodity prices, reduced new
patented crop protection products due to significant pressure on new product
development, consolidation in suppliers, and profitability of producers.
Strategic Ideation will be required for input suppliers and all stakeholders in agriculture to
face the challenges in the future. The shift to more advanced types of research has not
been as pronounced as one would expect (LaPlaca, 2014).

28
Improved understanding and predictive capabilities will reduce errors in strategic ideation
and marketing. This will improve the overall marketing effectiveness, sustainability and
what will be required by input suppliers in the future relating to B2B marketing (LaPlaca &
Da Silva, 2016).
The dynamic in agriculture in the next century will require significant thought and detailed
research. It must address the need to supply more food on the same arable land for a
growing population, comply with regulatory requirements on product development and
restrictions on neonicotinoids and other weed chemicals, absorb costs for new product
development, as well as assist producers in adopting precision agriculture and required
technology.
The global impact on agriculture will no doubt be a contributing factor and have an impact
on South Africa, as the research into the Crop Protection Industry is specifically limited in
South Africa.
2.5.2 Challenges facing Agricultural Crop Protection Distributors
The Crop Protection Industry faces additional challenges to remain sustainable and to
assist in the quest to provide food security in collaboration with producers. These
challenges include, as mentioned above, the reduction in commodity prices, reduced new
patented crop protection products due to significant pressure on new product
development, consolidation in suppliers, and profitability of producers.
It is necessary to know that while the post-war era of discovery and commercialisation was
a period of continuous innovation to understand the dilemma. No new mode of action has
been introduced to the market for the past 30 years. Neither product innovation based on
a long-term research project with uncertain outcomes nor strategic vision were primary
concerns, unlike competitive costs structures (Teicher, 2018).
The agrarian sector only experienced a real revolution in developing countries due to the
widespread mechanization, electrification, irrigations and chemisation of agricultural
processes (Clienies-Ross & Hildyard, 2013).
In the uncertain and globally competitive world of crop protection, it is noted that
companies and organisations who do not focus and prioritise strategic vision, will no longer
exist in the future and will be replaced by those who have prioritised strategic vision.

29
It is stated that the Crop Protection Industry (combining conventional chemical as well as
biological) will be required, like the agile computer industry, to shift focus from product to
implementation, and this will be based on strategic ideation (Teicher, 2018).
The opinion of Vidickiene and Gedminaite-Raudone (voiced in their article Challenges for
Agricultural Policy in the Service-Driven Economic System) is that companies who
prioritise and address strategic ideation should respond to the challenges of the post-
industrial society in agriculture by gradually changing the focus on product-driven business
models into a service-driven business model.
Research has been conducted in 2016, B2B: A paradigm shift from Economic Exchange
to Behavioural Theory: a quest for better explanations and predictions (LaPlaca & Da
Silva, 2016), in their research they indicate that a great majority of B2B firms reach their
customers through various channels of distribution which are continually evolving (Olsson
et al., 2013).
2.5.2.1 The paradigm of trust in the channel
Research is required to be updated into different channels and possibilities. Independent
channel (seen in distributors employing affiliated commission agents) performance is
impacted by the trust. Olsson et al. (2013) has shown that despite increasing levels of
disintermediation, distributors can obtain value from their business partners by adapting
to changing market conditions.
The introduction above and problem statement indicated that the South African Crop
Protection Distribution had not seen any significant changes in its current business model,
where affiliated commissioned agents are employed and are the direct channel to the
producer.
It should also be noted that the entry to the market for this specific sector is of ease and
the growth in the number of affiliated agents, according to Croplife, is increasing with little
to no significant degree or qualification, other than successful online completion of the
AVCASA course. This does place doubt in the quality and profile of some of the affiliated
commissioned agents in the industry. Lisa Heacox states in an article called Future
Direction for Ag Retail (Heacox, 2017) that distributors in the next few years need to take
their affiliated commission agents, and their status as a trusted business advisor, to new
and higher levels in several areas.

30
Distributors and affiliated commission agents will need to get producers away from
focusing only on increasing the yield per hectare, but also on the return of that crop (i.e.
develop a mindset of return on investment) (Heacox, 2017). Through focused return on
investment initiatives of farms, the producers will become increasingly profitable and
address insecurity regarding sustainability.
The role of trust in various channels of distribution needs to be studied and understood,
as it evolves with time and across different geographies and carries differing degrees of
importance, depending upon the cultural context in question (LaPlaca & Da Silva, 2016).
2.5.2.2 Crop protection distribution trends
In the article by Eric Sfiligoj in Agrow, 26 September 2017 (Sfiligoj, 2017), he mentioned
that dozens of retailers, particularly cooperatives, have recently exited the industry via sale
or acquisition. The pressure on the producers’ productivity, pressure on supplier level in
line with the drop in commodity prices to reduce prices of their products, have had an
impact on distributors where profit margins have dropped to 2% to 3%. If you are working
on a 1% profit margin, there is not a lot of room for error (Sfiligoj, 2017).
In this age of rapidly changing and advancing technologies, Crop Protection Distributors
should remain innovative to stay ahead. They should not only understand these challenges
but should balance between adapting their existing strategies and practices to
maintain/grow profitability. The interactions with manufacturers have become increasingly
intricate. Increased pressure from producers to demonstrate value and a change in the
agricultural landscape (through producer and Manufacturer consolidations) are only a few
which require Crop Protection Distributors to balance (ProAgrica, 2020).
In the recent research in Ag Retail Trends (ProAgrica, 2019), ProAgrica accessed 27 000
trade connections through a survey inviting participants to open answers which reflected
their true feelings. The following trends stood out from the survey, which includes the
market, the supply chain, and data and analytics:
• Retailer profitability: Supporting Sfiligoj above, the leading concern remains the
challenging trading environment, which resulted in pressure to lower prices and
reduce margins. Of the respondents, 31% listed this trend as one of their biggest
concerns going into 2020.

31
• Workforce shortages: It is reported that the lack of skilled labour is a concern,
where 24% of the respondents indicated that this is one of their biggest problems.
It is noteworthy that some questions surround the ease of entry to the Crop
Protection Industry through affiliated commissioned agents who do possess the
required skills, knowledge and experience for the profession, and meet the needs
of the producers.
Finding affiliated commissioned agents who possess advanced skills and the
required profile is becoming increasingly difficult. We have also experienced in
South Africa the shortage of trained B.Sc. Agriculture candidates (“Technical
Specialists”), specifically in the Crop Protection Industry, to provide the required
technical support to producers and affiliated commissioned agents. The
competition for both Technical Specialists and the preferred profile affiliated
commissioned agents is extreme.
• Producers’ profitability: Producers are required to make tough decisions in their
ability to spend with their Crop Protection Distributor, which resulted from the more
robust competition in the market, reduced instruments, and restricted access to
cash flow. The phenomena created a great deal of uncertainty in the market, where
Crop Protection Distributors’ customer profile is ever-changing. Without a
customer, there is no business model or sustainability.
• Technology: How to keep up with the pace: There is a continuous growth in
precision agriculture technologies, and it is found amongst respondents that it is
difficult to understand which of these technologies add value to the producer. There
is pressure for Crop Protection Distributors to encourage their producers to
leverage the technology to improve communication. Anxiety exists once again as
to which technologies should be used and how they engage with producers to use
the technology to the benefit all stakeholders.
2.5.2.3 Challenges impacting profitability
The report from ProAgrica published in 2020, Understanding the Barriers and
Opportunities for Profitability of Ag Retail, show the following elements threaten the
profitability of Crop Protection Distributors:

32
• Rebate Management: The intricate relationship within the agri-business supply
chain (manufacturer and Distributor) has resulted in an increased complexity to
understand the root causes of the barriers which exist in rebate management.
Rebates have become a significant portion of the Crop Protection Distributors’
profitability, and today more is expected from the Crop Protection Distributor in
terms of each manufacturer's requirements, processes, and rules. Existing
challenges are time-consuming, and require intensified human interaction in the
tracking and analysing of the data for each of these rebates. The above challenges
result in the inability for Crop Protection Distributors to make real-time decisions,
as well as decrease operational efficiency and possible loss of rebate income due
to inaccuracies (ProAgrica, 2020).
• Inventory Management: The continued increase of investment in infrastructure,
logistics and payroll are one of the concerns to balance profitability. These efforts
are necessary to ensure product placement at the correct time for producers to
access. Producers are increasingly cutting costs to maintain their profitability.
Inventory management through accurate forecasts for the product, based on
seasonal demands, has remained a challenge and is at best 70% accurate. Joint
pressure from manufacturers to increase their sales through their dedicated
channels, combined with the inaccurate forecasts, results in inventory being carried
over and baring financial costs to Crop Protection Distributors (ProAgrica, 2020).
• Data Analysis: Crop Protection Distributors operate in a volatile industry with
numerous external factors. Attention should be paid to the details in data to reduce
business risks and address profitability. Crop Protection Distributors should be able
to work with and interpret multiple layers of data to remain profitable and improve
the producers' return on investment (Heacox, 2017). Proper data analytics in Crop
Protection Distribution has resulted in a lack of visibility into business-critical data,
inability to identify revenue-growth opportunities, access to customer information
as it is held by the affiliated commissioned agent, strategic decisions based on
inaccurate data, and failure to track affiliated commissioned agents’ performance
(ProAgrica, 2020).

33
2.5.2.4 Conclusion
Supporting Delisi and Sfiligoj above, Frabotta indicated that there should be an increase
and heightened use of the good agricultural practice, reliance on prescriptive agronomic
recommendations, use of data-based farming and precision farming applications. Through
the combined use of the above, less-developed agrarian systems can be revolutionised.
Quoting and adjusting Darwin, Frabotta continues to indicate that adverse climate and
devious currency fluctuations will have an impact on all businesses, and only the nimblest
of companies will survive (Frabotta, 2015).
It is stated that there seems to be a lack of research on business service models and
processes in agriculture. The “new producers” -generation is currently seeking alternative
business models to address their sustainability, needs and requirements (Vidickiene &
Gedminiate-Raudone, 2018).
2.5.3 Crop Protection Industry: Post COVID-19
The global pandemic has caused significant disruptions in the food value chain which only
seems to impact Crop Input Companies in quarter 4 of 2020 or even early 2021. There
has been a real product demand delay which results from two factors, namely (1) robust
inventory which is currently in the value chain, and (2) the timing of the production cycles
in the Northern and Southern Hemispheres which was favourable (Frabotta, 2020a).
The coronavirus had an immense impact on labour, demand trends from consumers and
growers alike, logistical constraints and the consumers’ ability to spend on food due to the
downturn of the worldwide economy, especially those in developing countries and
emerging economies. The agricultural sector was favoured as part of the essential
industries around the world compared to the hospitality industry. The economic impact on
Agricultural suppliers, Distributors and growers might be delayed (Frabotta, 2020a).
It would seem for now that the data is positive for Agricultural Companies, indicating that
66% of companies have met or exceeded their budget as reported in the 2020 Agri-
business Global State of the Industry Survey (Frabotta, 2020a).

34
This corresponds to similar reports in the South African Agricultural Sector, where exports
in Q3 increased 5% year on year and recorded a record US $3.2 billion. The growth in the
exports was mainly presented by citrus, wine, maize, nuts, deciduous fruit and sugar cane
(Sihlobo, 2020).
While the views of the economy are more pessimistic compared to the individual company
performances noted above, there is one major thing that the respondents in the survey
noted, which is that consolidations, mergers and acquisitions and expansions can wait.
New product development appears to be unscathed where companies project to develop
new product lines with an increased focus on biological solutions, which is not unfamiliar,
given the results the agricultural sector has achieved. It should be noted that the biological
product segment is the fastest-growing input segment concerning the Crop Protection
Industry (Frabotta, 2020a).
Concerning the supply chains, early supply chain interruptions due to the pandemic were
isolated as Crop Protection input suppliers already adopted and focused on backward
integration and just-in-time delivery systems. This appeared to mitigate the risk of supply-
chain disruption. These strategies continue to accelerate and would seem to be part of the
“new normal” (Frabotta, 2020a).
Labour availability has been affected the most in this sector, and respondents indicated
that most of them will continue to operate in some form of reduced capacity to comply with
the management of the pandemic. The survey also indicated, in conjunction with the labour
availability matter, that more than half of the respondents will either invest in automation
or explore automation in the future (Frabotta, 2020a).
In the article published on the 5th of December by David Frabotta A Look Back with an Eye
Forward: How 2020 will affect 2021 in Global Agri-business, he noted that it is important
to force some perspective on a changing world to understand which parts of the Agri-
business will normalise in 2021 and which parts of the Agri-business might be changed
forever (Frabotta, 2020b).

35
Frabotta continues and draws attention to the supply and demand dynamics, where he
emphasised that the supply and capacity are out of sync with the demand for Crop
Protection Products. Here the increased commoditisation of key active ingredients, erosion
of prices and decreased margins for both Crop Protection Manufacturers and Distributors
will continue to the end of the continuum.
There will be less opportunistic buying and selling going into 2021, and both
manufacturers, as well as Distributors, will need to work on longer lead times with less
predictability in demand cycles (Frabotta, 2020b).
Concerning Backward Integration and Strategic Sourcing, we noted that in July 2020 as
part of the survey, most respondents indicated that backward integration had been a focus
long before the pandemic. A new paradigm exists where companies seek business
relationships promoting transparency, reliability, shared risk, and ease of doing business,
compared to price-based transactional relationships. The paradigm encourages the
companies to collaborate, share strategic growth plans as well as operational details in the
quest to share goals within an aligned culture (Frabotta, 2020b).
It was noted above that the Biological Crop Protection Segment had experienced the most
significant growth compared to other product segments. The article further supports this
view with the inclusion of biological fertilizers and biological stimulants in the view earlier
expressed. Soil health, plant microbiome and ways to reduce abiotic and biotic stressors
have received an increased research focus. It is the view of the writer of this article that,
although we identified consolidation earlier as a “stop sign” in July 2020, this segment will
in 2021 continue to consolidate with traditional Chemical Research-based Multi-National
Crop Protection Manufactures. The most notable recent consolidation was Syngenta
acquiring Valagro and AMVAC acquiring Agrinos, both these companies are focused in
the bio-stimulant segment.
Consumer demand, regulatory changes, worker safety on farms and environmental
stewardship continue to drive the increased aim to understand these products and to adopt
them on farm level. (Frabotta, 2020b) We have noticed the phenomena in companies
worldwide through Corporate Governance, and the importance of the Triple P (Profit,
Planet, and People) bottom line reporting required.

36
The ongoing balance specified in the Crop Protection Industry has become a significant
issue where consumers continue to demand more socially responsible products in a more
transparent production and information availability manner.
Consumers continue, specifically new generations who enter the workforce (Generation
Z), to become more engaged in how their food is produced and how these companies
support social implications (Frabotta, 2020b).
We noted above that automation will accelerate into 2021, and we have identified that
precision agriculture will play a significant role in the quest for food security, where growers
will be able to do more with less. The continued uncertainty in the labour market will
continue to drive the adoption of automation and precision agriculture into 2021. Imagery,
automation, and robotics have seen advances and are finally merged into useful
applications that will change application frequency and volumes concerning Crop
Protection Product Application (Frabotta, 2020b).
Regulatory challenges noted in the Crop Protection Industry Challenges will continue into
2021 with the EU leading the tightened restrictions of many active crop protection
ingredients. The new initiative, Farm to Fork, outlines sustainability goals in the attempt to
reduce pesticide use by 50% in the year 2030, as well as flatten the curve concerning the
use of mineral fertilizers by 20% (Frabotta, 2020b).
2.5.4 Business Model as a Concept
The Business Model as a concept has received abundant research attention since its
inception by Osterwalder, Pigneur, and Tucci in 2005. Academics, students, and
managers on different levels have emphasised the importance of the Business Model
Concept as a critical tool for the success and sustainability of an organisation (Rasuli et
al., 2015).
It is noted that there are many definitions in the literature about the Business Model
Concept. However, Osterwalder, Pigneur, and Tucci in 2005 proposed the following highly
cited, comprehensive definition where they divided the concept between the business
model, strategy, and process modelling:

37
“A business model is a conceptual tool containing a set of objects, concepts, and
relationships to express the business logic of a specific firm. Therefore we must consider
which concepts and relationships allow a simplified description and representation of what
value is provided to customers, how this is done and with which financial consequences.”
(Osterwalder et al., 2005).
Below follows the discussion of the Business Model Concept and its place in an
organisation to understand the importance thereof, and to link its applicability to the study
to develop segment-specific business models for Crop Protection Distributors in South
Africa.
2.5.4.1 Clarifying the Business Model Concept
The debate between strategy and business models in literature sometimes refers to it as
interchangeable (Magretta, 2002), while others refer to it jointly as those who offer
competitive advantage (Stähler, 2002). The strategy involves competition compared to the
business model focus on nine Business Blocks to create value, with a more rigorous in-
depth view of what the company has to offer, compared to the strategy which has an
external focus to competition aligned.
Thus, the business model focuses on giving detail to the elements and the relationship
which provides the outline of how this organisation creates and markets value. The debate
between the different strategy and business models include execution and
implementation, and is viewed as the “domain of strategy”. In contrast, the business model
is viewed as “how the business works”.
This, in particular, has drawn some concern to the implementation and execution of the
business model, where a good business model can fail due to poor management and
implementation skills. In contrast, the contrary (a poor business model can succeed due
to good management and implementation skills) is also applicable (Osterwalder et al.,
2005).
(Osterwalder et al., 2005) continues to clarify the Business Model Concept against
Enterprise Modelling and Business Process Modelling, both focusing on efficiency
improvement within the organisation (internal). However, it needs to be clearly understood
that the Business Model Concept’s main purpose is to find and design a promising
business concept (the nine building blocks of the Business Model Concept).

38
Osterwalder, Pigneur, and Tucci proposed the following definition for the business model
supporting their literature synthesis:
“A business model is a conceptual tool that contains a set of elements and their
relationships and allows expressing the business logic of a specific firm. It is a description
of the value the company offers to one or several segments of customers and of the
architecture of the firm and its network of partners for creating, marketing, and by delivering
value and relationship capital, to generate profitable and sustainable revenue streams.”
With specific reference to the study, the highlighted keywords “value”, “one or several
segments of customers”, and “generate profitable and sustainable revenue streams”,
which in the opinion of the author hereof, fundamentality supports the primary research
question.
The nine building blocks of the Business Model Concept are illustrated in the table below
(Osterwalder et al., 2005).
Table 5: Nine building blocks of the Business Model Concept
These nine building blocks were developed in 2009 by the well-known Business Model
Canvas, which presents the above on one canvas which describes the complete vision of
how the company or organisation creates, delivers, and captures value.

39
The literature study will now focus on the categories where the Business Model Concept
contributes significantly to an organisation:
• Understanding and sharing
• Analysing
• Managing
• Prospects (Osterwalder et al., 2005)
2.5.4.2 Understanding and sharing
Although a business model represents the simplification of an organisation’s business
concept, it is rarely described conceptually. Conceptually defining the business model
helps improve the understanding amongst all role players in a clear manner.
The visual representation of a business model not only improves understanding but also
helps to improve the communication and sharing of the business logic (Osterwalder et al.,
2005).
2.5.4.3 Analysing
The Business Model Concept can significantly contribute by assisting in analysing the
business logic of an organisation. With specific reference to the measurement of the
efficiency to improve management, track and observe to address internal and external
challenges and changes which continuously evolve, and to compare over time how
effective your own organisation’s business model performs against the business models
implemented by your competitors (Osterwalder et al., 2005).
2.5.4.4 Managing
The success of a business model relies inherently on the interaction amongst various
elements within an organisation, structured to optimise the value to be created. The
Business Model Concept assists in the improvement of management to react to changes
in the business environment and to align strategies, their organisation and adopt
technology timeously. The visualisation of the business model clearly illustrates the
interaction of the elements. When changes should occur, they inevitably assist in the
identification of how these elements would be required to be adapted.

40
Chesbrough and Rosenbloom (2000) have identified that business models act as a
mediator between technology and economic value, to develop and improve current
methods of doing business.
The Business Model Concept, as explained above, not only improves understanding
amongst all role players, but also enables decision-makers to be more informed, help
define measures, and improve their ability to make decisions to the benefit of the
organisation’s profitability and sustainability (Osterwalder et al., 2005).
2.5.4.5 Prospect
We discussed the concept of continuous improvement and increased timeous reaction
capacity within an organisation. Osterwalder et al. (2005) continue to explain that the
Business Model Concept (formal and modular approach) will improve and foster
innovation.
They continue to explain that the building blocks can be used as a box of Lego Blocks
(Burgi & Victor, 2004) were the architects using the business model “lego blocks” can build
completely new business models to create competitive advantage.
Allen’s Law of Excess of Diversity in Evolutionary Theory (Allen, 2001) has the idea that a
sustainable and successful evolutionary strategy is only created in an environment where
an amount of internal diversity, superior to that of their environment, exists.
Allen continues to argue that the agents involved in the diverse superior strategy would
have required stock of potential strategies which can be evaluated in unprecedented or
unpredictable environmental changes, and then implemented as and when needed.
Osterwalder et al. (2005) apply this to the Business Model Concept to indicate that an
organisation should hence follow Allen’s law and have a stockpile of Business Models
ready to be implemented in the future to address sustainability.
This stockpile of Business Models can be simulated and tested with little endangerment of
the organisation (in a low-risk environment), which will enable organisations and managers
to improve their preparation for the uncertainty of the future and the business environment.

41
2.5.5 Current Business Models in Crop Protection Distribution in South Africa
The Crop Protection Distributors’ business model focused on the appointment of affiliated
commission-based agents in various localities/towns. Here the agent acts as an
independent contractor and enters into an exclusive or semi-exclusive distribution
agreement with the Distributor, to promote, sell and distribute the products from the
Distributor, who in return has established agreements with manufacturers. It is noteworthy
that this specific business model, since its establishment in the early 1990s, has remained
the primary model for the end-user (producer/farmer).
It has been noted in the literature above that not much has changed in agriculture for the
past 30 years. The same applies to South Africa, and more particularly, the business model
used for Crop Protection Distribution. F.A Schreuder noted in his research that in 2002
South African manufacturers of Crop Protection Products used 46 independent distributors
through the assistance of 600 affiliated commission agents (Schreuder, 2002).
Currently, as per the CropLife SA website, there are 32 independent distributors and 986
affiliated commission agents. We have thus seen a slight consolidation in independent
distributors. However, the number of affiliated commission agents has grown by 64%
(Croplife South Africa, 2019).
In contrast to the growth in affiliated commission agents, the number of commercial
producers in South Africa has continued to decline from 60 000 in 1996, to 45 000 in 2002,
and to less than 40 000 in 2009 (Hall, 2011). It is expected that this number decline further
to approximately 15 000 by the year 2027.
The business model in the Crop Protection Industry can be visualised and illustrated in the
figure below.

42
Figure 3: Business model of Crop Protection Industry in South Africa
2.5.5.1 The Crop Protection Distributor
The roles and responsibility of the Crop Protection Distributors are mainly to conclude (first
and foremost with Multi-National Crop Protection Manufacturers) a distribution agreement
to access their products. The second focus will be to support the Multi-National Crop
Protection Portfolio with a Generic Crop Protection Portfolio, to complement and complete
the Crop Protection Product Portfolio available to growers.
The more options and research-based focused a Crop Protection Distributor product
portfolio is, the more attractive they become to Independent Affiliated Commissioned
Agents to join the Crop Protection Distributor.
Most Crop Protection Distributors focused solely on the Crop Protection portfolio with little
to no diversification in the product portfolio concerning Fertilizers, Specialised Fertilizers,
Bio Inoculants, Bio Pesticides, and Bio-Stimulants (with specific reference to some
Regional and National Crop Protection Distributors). Instead of focusing on the various
product segments to ensure diversification, some Crop Protection Distributors divested
their control to multiple manufacturers for support.
Multi-National Crop Protection
Manufacturers
Generic Crop Protection
Manufacturers
Geographical / Regional Crop
Protection Distributor
Independent Affiliated
Commissioned Agent (area focused)
Regional and / or Crop Focused in
Selected Provinces
National Crop Protection Distributor
Independent Affiliated
Commissioned Agent (area focused)
National Footprint with representation
in all crops cultivated

43
Those Crop Protection Distributors who aimed to innovate and differentiate the product
portfolio, supporting the phenomena of increased Biological focus seen worldwide, has
seen more success compared to those following a traditional Crop Protection Product
Portfolio with the divestment of other product segments to suppliers.
The divestment of other product segments to suppliers might create disjuncture amongst
Crop Protection Distributors and the suppliers to the extent of shared vision, goals,
company objectives and serving interest phenomena, compared to growers/customer-
centricity.
In the figure above, we noted Regional and National Crop Protection Distributors, the main
differences exist in geographical operational activities. This model was first and foremost
created by Multi-National Crop Protection Manufacturers who divested their power of
distribution into Regional Crop Protection Distributors in the early 1990s, except for
Wenkem, who at that stage was the only National Crop Protection Distributor. Since the
early 1990s, three additional Crop Protection Distributors joined Wenkem as National Crop
Protection Distributors namely, AECI Plant Health, InteliGro, and Laeveld Agrochem.
Crop Protection Distributors’ responsibilities include procurement and financing of working
capital, appropriate training, technical support, administration support, logistical efficiency,
regulatory compliance, product portfolio management and availability, as well as strategic
direction and innovation.
Crop Protection Distributors appoint Independent Affiliated Commissioned Agents on a
profit-sharing base. The majority of the profit share (80/20, 70/30 split) resonates in the
form of commission towards the Independent Affiliated Commissioned Agents. This model
continues to be the business model adopted in the earlier 1990s regarding revenue or
profit distribution. Crop Protection Manufacturers, before the divestment of their product
distribution to selected Regional Crop Protection Distributors, used to appoint their own
“salary-based” representatives.
The model of salary-based representatives was aimed to be implemented by various Crop
Protection Distributors since the 1990s, with minimal success in the past decade due to
the ease of entry into the market and move to other Crop Protection Distributors. Entry into
market share was the aim of each of the various Crop Protection Distributors, to improve
scalability in product negotiations (to decrease prices), increase mass and attempt to
increase profit margins.

44
This model has, unfortunately, as noted in the literature above, not been successful
worldwide and those competing in this section will continue to be seen as “swimming in
the red-ocean”.
The current business model of InteliGro is illustrated in the Business Model Canvas below
(Osterwalder et al., 2005):
Figure 4: Business Model Canvas: InteliGro
The business model above will be assessed for the study against the analysis of the results
of each of the grower segments. This is done to determine its feasibility and if changes will
be required to be made to this business model to address the needs and wants of the
growers in the various segments, or whether this business model predominantly resonates
within a specific segment (Research Proposition 3).

45
2.5.6 Value Innovation: the link towards a Blue Ocean Strategy
Value innovation has been defined by Chan Kim and Mauborgne in 1997 as companies
who do not focus on beating or matching their rivals, but instead aim at employing a
strategic logic to make their competitors irrelevant (Chan et al., 1997). These companies
focused on getting out of the existing market boundaries (Red Ocean) through the creation
of significant value for their customers, which kept them ahead of their competitors (Chan
et al., 2005a).
In the latter research done by Chan et al. (2005) where they follow-up their journal article
in the quest to link value innovation to the blue-ocean strategy, they argue that “Value
Innovation is the cornerstone of the blue-ocean strategy”. The phenomena of both value
innovation and Blue Ocean Strategy exists where value innovation Companies launched
the business in the event to create blue ocean strategies, which accounted for 14% of the
total new business launches. Out of these 14% new launches, they generated 38% of the
total revenues across the study and a phenomenal 61% of the total profits. Thus, the secret
lies not in the value of revenue generation, but profit generation (see Figure 1.5 below).
Figure 5: The profit and growth consequences of the Blue Ocean strategy
(Chan et al., 2005a)
It is noted that the conventional strategic logic and the logic applied to value innovations
have five dimensions of strategy, which differ significantly. They are (1) Industry
Assumptions, (2) Strategic Focus, (3) Customers, (4) Assets and Capabilities, and (5)
Product and Service Offerings (see Table 1.5 below).
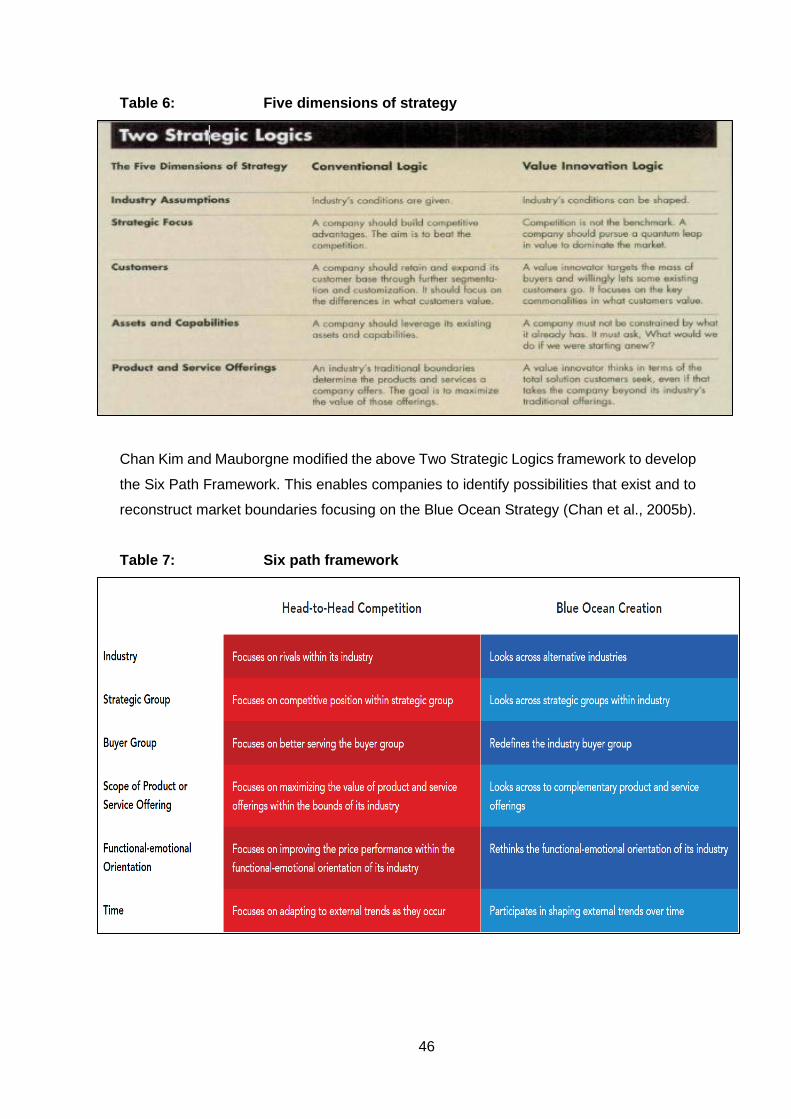
46
Table 6: Five dimensions of strategy
Chan Kim and Mauborgne modified the above Two Strategic Logics framework to develop
the Six Path Framework. This enables companies to identify possibilities that exist and to
reconstruct market boundaries focusing on the Blue Ocean Strategy (Chan et al., 2005b).
Table 7: Six path framework

47
To obtain a competitive advantage, those following a Blue Ocean Strategy will enable the
company to create uncontested market space, make the competition irrelevant, create and
capture new demand, break the value-cost trade-off, and align the complete system of the
company’s activities in the pursuit of differentiation and low-cost (such as the best-cost
provider strategy).
The table below provides a brief illustration of the difference between the Red Ocean and
Blue Ocean Strategy (Kim et al., 2005).
Table 8: Red-Ocean vs Blue Ocean Strategy
It was noted in the Introduction of Chapter 1 that the profitability of the Crop Protection
Distributors in South Africa is under strain. With the continued decline in the profits of 2%
to 3%, one can argue that most Crop Protection Distributors swim in a red-ocean where
competition is fierce, bloody and products and services offered are commoditised. The
study will aim to advise InteliGro on how to develop a blue-ocean strategy following the
Six Path Framework, as well as develop a “Value Curve” which is designed to be able to
show the organisation instantly where value is created from the InteliGro product and
services in each of the segments. The “Value Curve” will then graphically illustrate the way
InteliGro or the Crop Protection Industry configures its growers’ offering.

48
A blue-ocean strategy alone will not suffice, as any organisation is required to be able to
swim in the red-ocean successfully while balancing their blue-ocean strategy (Chan et al.,
2005a). It will thus be imperative that Crop Protection Distributors understand that in a
world where new active ingredients and molecules as super-star products are being
marketed has been slow and far in-between. This is mainly due to the regulatory
environment and the excessive cost to develop one new active ingredient, which exceeds
$350 million and takes 11 years from the identification of the new molecule until the stage
where it can be marketed.
There will be significant commodity and post-patent crop protection products, and Crop
Protection Distributors will need to adapt their service offering to create value, to follow a
low-cost provider strategy in a red-ocean while following a best-cost provider strategy in
the blue ocean.
It is only through increased market share that red-ocean strategies and reduction in
logistics and handling of the product that Crop Protection Distributors will increase
profitability should they not follow a Blue Ocean strategy.
Any company must remember that once they have created a blue ocean, they should aim
to prolong its profit and growth strategy. They should make themselves a target which
continually moves as they keep strategizing and keep within the blue ocean of
differentiation and value creation, to try and distance themselves from potential imitators
and through these actions discourage them, thus outlasting and out-leaping them. (Chan
et al., 2005a)
2.6 SUMMARY
This chapter provides an overview of the most notable challenges facing agriculture and
the Crop Protection Industry. The chapter continues to focus on the specific challenges for
Crop Protection Distributors and linking those challenges to the South African domain. In
the Crop Protection Distribution Industry, the focus was placed on the paradigm of trust in
the channel, explaining the role of the Crop Protection Distributors where a high level of
trust and knowledge still resonates amongst growers.

49
The chapter explains the current state of vulnerability of the Crop Protection Distributors
which threaten their existence and sustainability. This is due to continued profit erosion
based on numerous increased cost-based factors, but most notably, the change in
demographics of the growers and their needs. We also discuss the impact of COVID-19
on the Crop Protection Industry and continue to look forward to possible trends following
the pandemic.
The chapter moves towards the Business Model Concept (Osterwalder et al., 2005),
explaining the importance of the concept for the sustainability of organisations and
strategic supremacy with the link to value innovation. The current business models for
Crop Protection Distributors in South Africa are explained in detail since its inception in the
1990s and specifically included the InteliGro Business Model Canvas.
The business model will be assessed against the analysis of the results of each of the
grower segments to determine its feasibility and whether changes will be required to be
made to this business model, to address the needs and wants of the growers in the various
segments, or whether this business model predominantly resonates within a specific
segment (Research Proposition 3).
We conclude the chapter by explaining the importance of value innovation as created by
(Chan et al., 1997) and how this concept was refined into the Blue Ocean Strategy (Chan
Kim & Mauborgne, 2005a). We conclude that a blue-ocean strategy on its own will not
suffice and organisations should balance the ability to swim in both the red-ocean
successfully as well as balancing their blue-ocean strategy.
Any company must remember that once they have created a blue ocean, they should aim
to prolong its profit and growth strategy. They should further make themselves a target
which continually moves as they keep strategizing and keep within the blue ocean of
differentiation and value creation, to try and distance themselves from potential imitators
and through these actions discourage them, thus outlasting and out-leaping them.(Chan
Kim & Mauborgne, 2005a)
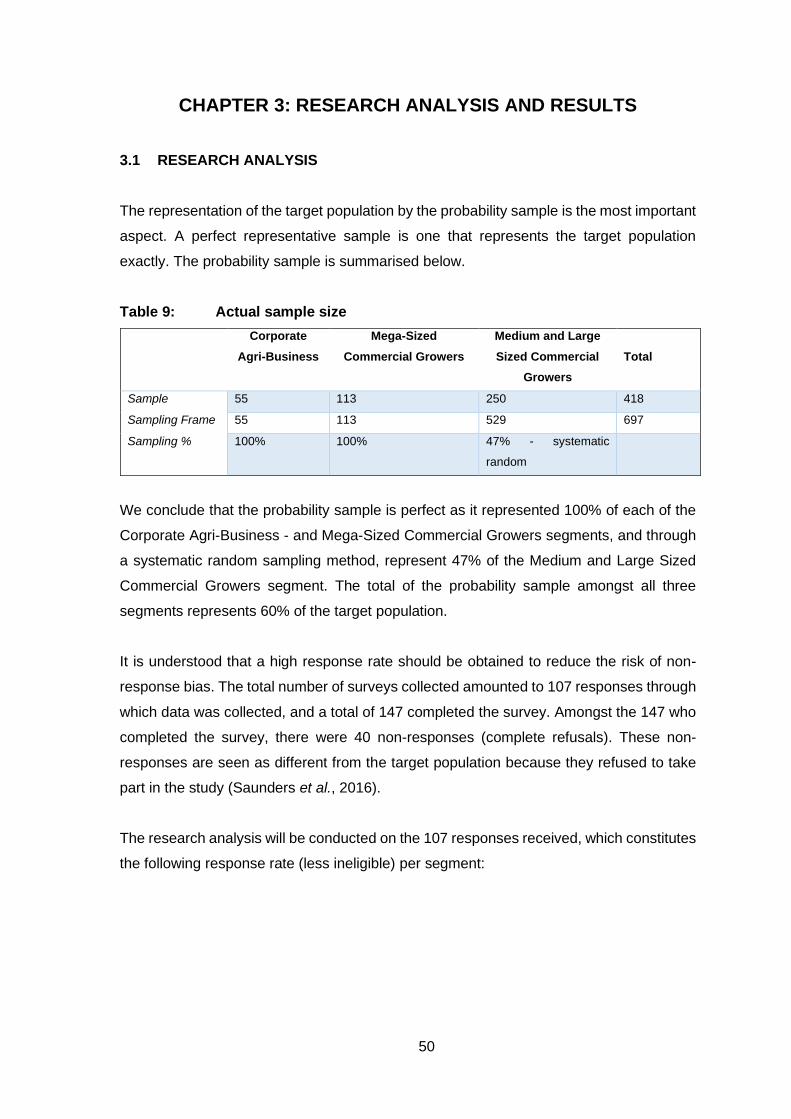
50
CHAPTER 3: RESEARCH ANALYSIS AND RESULTS
3.1 RESEARCH ANALYSIS
The representation of the target population by the probability sample is the most important
aspect. A perfect representative sample is one that represents the target population
exactly. The probability sample is summarised below.
Table 9: Actual sample size
Corporate
Agri-Business
Mega-Sized
Commercial Growers
Medium and Large
Sized Commercial
Growers
Total
Sample 55 113 250 418
Sampling Frame 55 113 529 697
Sampling % 100% 100% 47% - systematic
random
We conclude that the probability sample is perfect as it represented 100% of each of the
Corporate Agri-Business - and Mega-Sized Commercial Growers segments, and through
a systematic random sampling method, represent 47% of the Medium and Large Sized
Commercial Growers segment. The total of the probability sample amongst all three
segments represents 60% of the target population.
It is understood that a high response rate should be obtained to reduce the risk of non-
response bias. The total number of surveys collected amounted to 107 responses through
which data was collected, and a total of 147 completed the survey. Amongst the 147 who
completed the survey, there were 40 non-responses (complete refusals). These non-
responses are seen as different from the target population because they refused to take
part in the study (Saunders et al., 2016).
The research analysis will be conducted on the 107 responses received, which constitutes
the following response rate (less ineligible) per segment:

51
Table 10: Actual response rate
Corporate Agri-
Business
Mega-Sized
Commercial Growers
Medium and Large
Sized Commercial
Growers
Total
Sample 55 113 250 418
Ineligible -40
Total sample 378
Responses 12 47 48 107
Response rate 22% 42% 19% 28%
Once the questionnaires have been completed, the data will be exported from
SurveyMonkey to an Excel format. This document will then be sent to the North-West
University Department of Statistical Consultation Services to analyse the data obtained.
The analysis, once completed, was sent to the researcher to interpret the results as part
of the study.
Analysis structure as returned from the North-West University Department of Statistical
Consultation Services:
Section 1: Question 3 – 13: Frequency analysis
Section 2: Question 14 – 21: Standard deviation, means analysis
Section 3: Question 22 – 23: Frequency and standard deviation, means
analysis
Section 4: Question 24 – 25: Standard deviation, means analysis
Section 5: Question 26: Frequency analysis
Section 6: Question 27 – 28: Frequency analysis
3.2 RESULTS AND DISCUSSION OF RESULTS
The results from the surveys were segmented based on the following criteria:
1) Integration into the value chain
2) Legalised structure
3) The total value of Crop Protection Product procured on an annual basis
The following three segments were identified from the results:
Corporate Agricultural Businesses
Mega Commercial Farmers
Medium and Large Commercial Farmers

52
The study thus focuses on these three segments, and the results are explored following
the questions answered to determine what will be the preferred business model specifically
required for each of these segments.
Figure 6: Corporate agri-businesses segmentation profile
Figure 7: Mega-Sized Commercial Growers segmentation profile
Figure 8: Medium and large-sized commercial farmers segmentation
profile
• Integrated
• Integrated and differentiated
Value-chain
Integration
•Corporate Agricultural Business and / or
• any other structure
Legal strucure
> R10 million per
annum
Value of CP
products procured
• Integrated
• Integrated and differentiated
Value-chain
Integration
•Any structure except Corporate Agricultural Business
Legal strucure
< R10 million per
annum
Value of CP
products procured
•None
•Limited and exploratory
•Exploratory
Value-chain
Integration
•Any structure except Corporate Agricultural Business
Legal strucure
< R10 million per
annum
Value of CP
products procured

53
Following the above criteria, the responses (107) and data were segmented, providing the
following results:
• Corporate Agricultural Businesses: 12 questionnaires completed
• Mega Commercial Farmers: 47 questionnaires completed
• Medium and Large Commercial Farmers: 48 questionnaires completed
The questionnaire format is discussed per segment below.
Table 11: Questionnaire format
Section Questions Description and purposes
Section 1 Q3 - Q13 Determine the description, positional decision-makers,
legalised structure, ownership structure, demographics,
Crop cultivation, financing activities, Crop Protection,
Channel Procurement, Channel preference, scale, and
profile of the segment.
Section 2 Q14 - Q21 Procurement patterns and which factors influence the
decision-makers in their choice of procuring Crop
Protection based on the needs/requirements of the
segment.
Section 3 Q22 - Q23 To determine to what extent the respondents will
consider an e-commerce model per segment and what
will be their primary objective in following this business
model/channel.
Section 4 Q24 - Q25 Segment-specific importance to access latest technology
and information.
Section 5 Q26 Frequency measure of service level from Crop Protection
Distributors by specific role players.
Section 6 Q27 - Q28 Which segment provides the biggest appetite to integrate
backwards with their Crop Protection Distributors, and
what will be their primary objective to integrate
backwards.

54
Section 1: Profile of each Grower Segment
Question 3 – 13: Determine the description, positional decision-makers, legalised structure,
ownership structure, demographics, Crop cultivation, financing activities, Crop Protection
Channel Procurement, Channel preference, scale, and profile of the segment.
A: Corporate Agricultural Businesses
The results for the Corporate Agri-Business profile and segment indicate that majority
decision-making authority lies within managerial positions.
Table 12: Which position do you hold in the company?
Frequency Per cent
Farm Manager 1 8.3
General Manager 3 25.0
Input / Procurement Manager 1 8.3
Managing Director 3 25.0
Production Manager 2 16.7
Technical Manager / Director 2 16.7
Total 12 100
The data below represents those required for segmentation purposes, where 83% of the
respondents’ legalised structure constitutes Private Companies and 17% Corporate
Agricultural Businesses.
Table 13: Legal structure
Frequency Per cent
Corporate Agricultural Business 2 17.0
Private company (i.e. (Pty) Ltd) 10 83.0
Total 12 100.0
The shareholding structure of the Corporate Agri-Businesses segment presented in Table
14 to 16 indicates that this segment has a majority (67% own shareholding). Where
external shareholding exists, there is a significant investment into these entities. External
investments from foreign entities and BBBEE compliance in this segment is still limited
and exploratory.

55
Table 14: Shareholding structure
Frequency Per cent
100% own shareholding 8 67.0
External Shareholding 4 33.0
Total 12 100.0
Table 15: External shareholding %
Frequency Per cent
>50.1% 2 50.0
25.1% - 50% 2 50.0
Total 4 100.0
Table 16: Foreign entity shareholding %
Frequency Per cent
0.1% - 25.0% 1 8.3
>50.1% 1 8.3
N/A 10 83.4
Total 12 100.0
Table 17: BBBEE shareholding %
Frequency Per cent
25.1% - 50% 1 8.3
N/A 11 93.7
Total 12 100.0
Table 18 below represents to which extent the Corporate Agri-Businesses cultivate their
crops only in their geographical area or have a National Footprint (that is, operating in
more than one province). The data below indicates that only three (3) producers in this
segment cultivate their crops in more than one province (25% of total respondents), and
nine (9) producers indicate that they cultivate their crops predominantly in one province
(different geographical areas within the province).

56
Table 18: Provinces they cultivate their crops
Frequency Per cent
Gauteng 1 6.3
Kwazulu-Natal 1 6.3
Limpopo 4 25.0
Mpumalanga 1 6.3
Eastern Cape 3 18.8
Western Cape 5 31.3
Namibia 1 6.3
Total 16 100
Table 19 represents the crops cultivated, the total hectares per crop and established to
which extent the Corporate Agri-Businesses are diversified in their crops cultivated. It was
interesting to note that all the respondents in this segment cultivate irrigated, higher
marketing value crops, compared to lower value dry land Summer Row Crops, Oilseeds
and Winter Cereals.
The results below also indicate that nine (9) producers in this segment cultivated crops
which are focused on the export market and three (3) on the local market. The table below
reported results where eight (8) producers cultivated multiple crops (diversified orientation)
and four (4) producers only focused on single crops. It can be summarised that this
segment focuses on diversification (67% of respondents) and all these respondents in the
segment cultivate high-value crops.
Table 19: Crops cultivated and hectares
Potatoes - Ha Irrigated
Vegetables (Cruciferae, cucurbits, carrots) - Ha Irrigated
Pome Fruit (Apples, Pears) - Ha Irrigated
Minor crops (Blueberries) - Ha Irrigated
Tree Nuts (Pistachios, Macadamias, Pecan) - Ha Irrigated
Citrus - Ha Irrigated
Hectares Frequency Frequency Frequency Frequency Frequency Frequency
0-499 hectares 2 2 2 2 2
500 - 999 hectares 2 1 3
1000 - 1999 hectares
2000 - 2999 hectares 1
3000 - 3999 hectares 1
Total 2 3 3 2 2 6

57
Citrus - Ha Irrigated
Summer Row Crops (Maize, Sorghum, Dry Beans) - Ha Irrigated
Stone Fruit (Peaches, Plums) - Ha Irrigated
Sub-tropical (Avo's, litchis, mango's) - Ha Irrigated
Tomatoes (Table and Processed) - Ha Irrigated
Table Grapes - Ha Irrigated
Hectares Frequency Frequency Frequency Frequency Frequency Frequency
0-499 hectares 2 1 2 2
500 - 999 hectares 3 1
1000 - 1999 hectares 1 1 1
2000 - 2999 hectares 1
3000 - 3999 hectares
Total 6 1 3 3 1 1
Wine Grapes - Ha Irrigated
Winter Cereals (Wheat, Barley, Oats) - Ha Irrigated
Onions - Ha Irrigated
Hectares Frequency Frequency Frequency Total
0-499 hectares 1 1 2 19
500 - 999 hectares 1 8
1000 - 1999 hectares 3
2000 - 2999 hectares 1
3000 - 3999 hectares 1
Total 1 1 3 32
Table 20 focuses on how Corporate Agri-Businesses finance their Crop Protection Inputs.
The results below indicated that this segment can be viewed as cash-rich and they finance
their Crop Protection Inputs majority (80%) through the use of their funds while 20% is
financed through financial institutions.
Table 20: How do you finance your agricultural Crop Protection Inputs?
Type of Financing Frequency Per cent
Financial Institution / Commercial Banks (for example. Landbank, Standard Bank, Absa, FNB)
2 20.0
Own funding 8 80.0
Total 10 100.0
Table 21 represents the results where Corporate Agri-Businesses procure their Crop
Protection Products. This question aimed to establish whether this segment only focuses
on one Crop Protection Supplier or multiple Suppliers. The results below can be
summarised as follows: Corporate Agri-Businesses mainly procure from National Crop
Protection Suppliers (82.1%), and they chose various Suppliers (10 of the 12 respondents

58
procured from more than one channel), which indicates that this segment is highly
business - and reputable Crop Protection Supplier orientated.
Table 21: From which Agricultural Crop Protection Supplier do you procure your
crop protection products?
Frequency Per cent Cumulative Percentage
InteliGro 9 32.1 32.1
LAC (Laeveld Agrochem) 3 10.7 42.8
Nulandis 7 25.0 67.8
Wenkem 4 14.3 82.1
Other 5 17.9 100.0
Total 28 100.0
Question 12 was designed to determine which channel they predominantly follow when
procuring their Crop Protection Inputs, considering the traditional business model (sale via
Crop Advisor) compared to other variable options and business models which existed in
the market. The results in Table 22 below indicated that Corporate Agri-Businesses focus
on transacting with Crop Advisors and Crop Protection Suppliers, and the segment
focuses less on direct procurement from Crop Protection Manufacturers (BASF, Bayer,
UPL, Villa Crop Protection) or Corporate Agri-Business (for example, VKB, Senwes).
The respondents indicated that they prefer the channel through Crop Protection Suppliers
(60%) compared to the traditional model (sale via Crop Advisor – 26.7%). We view that
Corporate Agri-Businesses are highly business orientated and negotiations and
procurement would follow a direct involvement from Crop Protection Supplier Head Office
Staff.
Table 22: From whom do you procure your agricultural crop protection
products?
Frequency Per cent
Crop Advisor (previously known as Agent) 4 26.7
Crop Protection Supplier (i.e. Nulandis, LAC, Wenkem, InteliGro) 9 60.0
Crop Protection Manufacturer (i.e. BASF, Bayer, Corteva, Villa Crop Protection, UPL)
1 6.7
Corporate Agricultural Business (i.e. Afgri, Kaap Agri, Senwes, VKB) 1 6.7
E-commerce 0 0.0
Total 15 100.0

59
Table 22 represents results which indicate what products are procured through the
channels described in Table 22, which show a fair distribution amongst what a Crop
Protection Supplier should offer to producers in this segment. Majority respondents in
Corporate Agri-Business focused on Crop Protection Products and Specialised Plant
Nutrition (80%) and less on Granular Fertilizers. Crop Protection Suppliers should focus
their product positioning and offer to these segments.
Table 23: Which products do you procure from the channels selected above?
Frequency Per cent
Crop Protection Products (i.e. herbicides, insecticides, fungicides, nematicides)
8 32.0
Specialised Plant Nutrition (i.e. foliar feeds, bio-stimulants, fertigation) 6 24.0
Crop Protection and Specialised Plant Nutrition 6 24.0
Granular fertilizers 5 20.0
Total 25 100.0
Table 23 aims to understand what procurement policy exists in the various segments. The
results below indicated that Corporate Agri-Businesses follow own purchase decision-
making procurement policy, with no focus towards joining buying groups and little focus
towards following a tender policy. It would be considered that Corporate Agri-Businesses
are large scale, and due to their scale, they believe that their negotiations would be prudent
to procure to their best benefit.
Table 24: Which of the following statements best reflect your purchasing
of Crop Protection Inputs?
Frequency Per cent
Own purchase decision 12 85.7
Buying group 0 0.0
Tender 2 14.3
Total 14 100.0
B: Mega-Sized Commercial Growers
The results for the Mega-Sized Commercial Growers’ profile and segment indicate that
majority decision-making authority lies within managerial positions and owners (53.2%).
The owners in this segment play a significant role in the day-to-day operations and
decision-making.

60
Table 25: Position you hold in the company or farm
Frequency Per cent
Farm Manager 8 17.0
General Manager 4 8.5
Input - / Procurement Manager 1 2.1
Managing Director 14 29.8
Owner 11 23.4
Production Manager 4 8.5
Technical Manager / Director 5 10.6
Total 47 100.0
Table 26 represents that various legal structures exist in this segment, with majority Private
Companies supporting the results in Table 25 above, that decision-making authority lies
within a management and owner structure.
Table 26: Legal Structure
Frequency Per cent
Close Corporation 9 19.1
Individual 6 12.8
Partnership 2 4.3
Private company (i.e. (Pty) Ltd) 28 59.6
Trust 2 4.3
Total 47 100.0
The shareholding structure of the Mega-Sized Commercial Growers segment presented
in Table 27 to Table 30 indicates that this segment has a majority (72.3% own
shareholding). Where external shareholding exists, the shareholding % varies. External
investments from foreign entities and BBBEE compliance in this segment is limited and
exploratory.
Table 27: Shareholding structure
Frequency Per cent
100% own shareholding 38 72.3
External Shareholding 9 19.1
Total 47 100.0
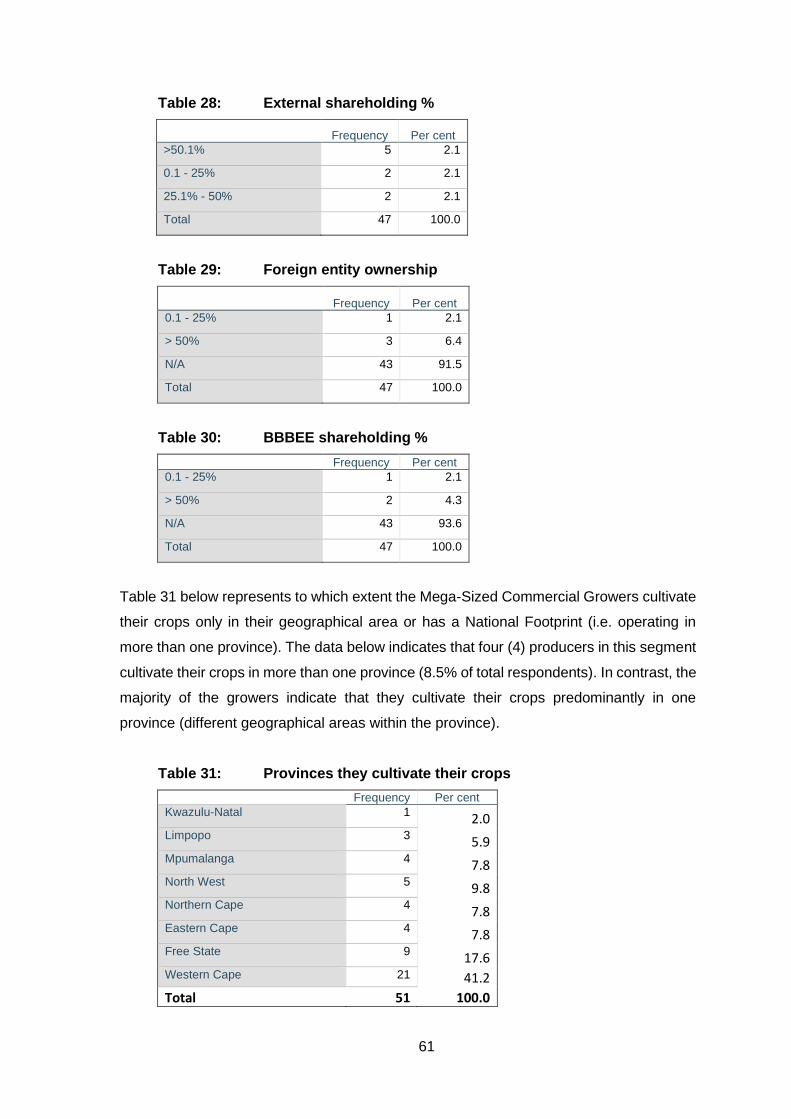
61
Table 28: External shareholding %
Frequency Per cent
>50.1% 5 2.1
0.1 - 25% 2 2.1
25.1% - 50% 2 2.1
Total 47 100.0
Table 29: Foreign entity ownership
Frequency Per cent
0.1 - 25% 1 2.1
> 50% 3 6.4
N/A 43 91.5
Total 47 100.0
Table 30: BBBEE shareholding %
Frequency Per cent
0.1 - 25% 1 2.1
> 50% 2 4.3
N/A 43 93.6
Total 47 100.0
Table 31 below represents to which extent the Mega-Sized Commercial Growers cultivate
their crops only in their geographical area or has a National Footprint (i.e. operating in
more than one province). The data below indicates that four (4) producers in this segment
cultivate their crops in more than one province (8.5% of total respondents). In contrast, the
majority of the growers indicate that they cultivate their crops predominantly in one
province (different geographical areas within the province).
Table 31: Provinces they cultivate their crops
Frequency Per cent
Kwazulu-Natal 1 2.0 Limpopo 3 5.9 Mpumalanga 4 7.8 North West 5 9.8 Northern Cape 4
7.8 Eastern Cape 4 7.8 Free State 9 17.6 Western Cape 21 41.2
Total 51 100.0

62
Table 32 represents the crops cultivated, the total hectares per crop, and established to
which extent the Mega-Sized Commercial Growers are diversified in their crops cultivated.
The table below reported results where twenty-seven (27) producers cultivated multiple
crops (diversified orientation) while twenty (20) producers only focused on single crops. It
can be summarised that this segment is operating on a large scale, focuses on
diversification (57% of respondents) and is exploring diversification.
Table 32: Crops cultivated and hectares (Irrigated / Dryland)
Potatoes - Ha Irrigated
Potatoes - Ha Dry Land
Vegetables (Cruciferae, cucurbits, carrots) - Ha Irrigated
Pome Fruit (Apples, Pears) - Ha Irrigated
Minor crops (Blueberries) - Ha Irrigated
Tree Nuts (Pistachios, Macadamias, Pecan) - Ha Irrigated
Frequency Frequency Frequency Frequency Frequency Frequency
0-499 hectares 6 1 7 7 2 5
500 - 999 hectares 2
1000 - 1999 hectares 1
Total 8 1 7 8 2 5
Oilseeds (Canola, Sunflower, Soya Beans) - Ha Irrigated
Oilseeds (Canola, Sunflower, Soya Beans) - Ha Dry Land
Citrus - Ha Irrigated
Summer Row Crops (Maize, Sorghum, Dry Beans) - Ha Irrigated
Summer Row Crops (Maize, Sorghum, Dry Beans) - Ha Dry Land
Stone Fruit (Peaches, Plums) - Ha Irrigated
Hectares Frequency Frequency Frequency Frequency Frequency Frequency
0-499 hectares 5 3 5 13 4
500 - 999 hectares 1 3 1 1
1000 - 1999 hectares 1 2 2 2 3
2000 - 2999 hectares 1 1
3000 - 3999 hectares 1 2
more than 5000 hectares 1
Total 7 8 8 17 7 5
Sub-tropical (Avo's, litchis, mango's) - Ha Irrigated
Tomatoes (Table and Processed) - Ha Irrigated
Table Grapes - Ha Irrigated
Wine Grapes - Ha Irrigated
Wine Grapes - Ha Dry Land
Winter Cereals (Wheat, Barley, Oats) - Ha Irrigated
Hectares Frequency Frequency Frequency Frequency Frequency Frequency
0-499 hectares 1 1 5 6 1 8
500 - 999 hectares 1 2
1000 - 1999 hectares 2
Total 1 2 5 6 1 12

63
Table 32: Crops cultivated and hectares (Irrigated / Dryland) (Continued)
Winter Cereals (Wheat, Barley, Oats) - Ha Dry Land
Onions - Ha Irrigated Total
Hectares Frequency Frequency Frequency
0-499 hectares 1 3 84
500 - 999 hectares 2 13
1000 - 1999 hectares 2 15
2000 - 2999 hectares 2
3000 - 3999 hectares 3
4000 - 4999 hectares 1 1
more than 5000 hectares 1
Total 6 3 119
Table 33 focuses on how Mega-Sized Commercial Growers finance their Crop Protection
Inputs. The results below indicated that this segment can be viewed as a combined
utilisation of own resources and financing through financial institutions and Corporate Agri-
Businesses, with a lesser focus on the latter financial option. They are not as cash-rich as
the Corporate Agri-Businesses sector.
Table 33: How do you finance the purchases of your crop protection products?
Type of Financing Frequency Per centage
Financial Institution / Commercial Banks (for eg. Landbank, Standard Bank, Absa, FNB)
15 31.9
Own Funding 23 48.9
Corporate Agricultural Business / Company (for eg. Afgri, BKB, Eastern Cape Co-Op, OVK, VKB, Senwes)
9 19.1
Total 47 100.0
Table 34 represents the results where Mega-Sized Commercial Growers procure their
Crop Protection Products. This question aimed to establish whether this segment only
focuses on one Crop Protection Supplier or multiple Suppliers.
The results below can be summarised as follows: This segment mainly procures from
National Crop Protection Suppliers (88.6%), and they chose various suppliers (25 of the
47 respondents procured from more than one channel), which can be viewed that this
segment is highly business - and reputable Crop Protection Supplier orientated.
This segment’s results align with the Corporate Agri-Business segment, however lower
levels of various channel procurement is noted (53% vs 83%) in this segment, which
indicates that they tend to rely more on one channel procurement than shopping around.

64
Business orientation is presented at lower levels compared to the Corporate Agri-Business
segment.
Table 34: From which Agricultural Crop Protection Supplier do you procure
your crop protection products?
Frequency Per cent Cumulative Percentage
InteliGro 46 58.2 58.2
Laeveld Agrochem 1 1.3 59.5
Nulandis 14 17.7 77.2
Wenkem 9 11.4 88.6
Other 9 11.4 100.0
Total 79 100.0
Question 12 was designed to determine which channel they predominantly follow when
procuring their Crop Protection Inputs, considering the traditional business model (sale via
Crop Advisor) compared to other variable options and business models which existed in
the market.
The results in Table 35 below indicated that Mega-Sized Commercial Growers focus on
transacting with Crop Advisors and Crop Protection Suppliers, and the segment focuses
less on direct procurement from Crop Protection Manufacturers (BASF, Bayer, UPL, Villa
Crop Protection) or Corporate Agri-Business (for example VKB, Senwes).
The respondents indicated they prefer the channel through Crop Protection Suppliers
(53.6%) compared to the traditional model (33.3% sale via Crop Advisor). Our
interpretation is that Mega-Sized Commercial Growers should be approached by both
Crop Advisor and Crop Protection Supplier Head Office Staff in the negotiations and
business proposals.

65
Table 35: From whom do you procure your agricultural crop protection
products?
Frequency Per cent
Crop Advisor (previously known as Agent) 23 33.3
Crop Protection Supplier (i.e. Nulandis, LAC, Wenkem, InteliGro) 37 53.6
Crop Protection Manufacturer (i.e. BASF, Bayer, Corteva, Villa Crop Protection, UPL)
3 4.3
Corporate Agricultural Business (i.e. Afgri, Kaap Agri, Senwes, VKB)
6 8.7
E-commerce 0 0.0
Total 69 100.0
Table 36 represents results which indicate what products are procured through the
channels represented in Table B3.11, which show a fair distribution amongst what a Crop
Protection Supplier should offer to producers in this segment. Majority respondents in
Corporate Agri-Business focused on Crop Protection Products and Specialised Plant
Nutrition (89%) and less on Granular Fertilizers. Crop Protection Suppliers should focus
their product positioning and offer to these segments.
Table 36: Which products do you procure from the channels selected
above?
Frequency Per cent
Crop Protection Products (i.e. herbicides, insecticides, fungicides, nematicides)
38 32.2
Specialised Plant Nutrition (i.e. foliar feeds, bio-stimulants, fertigation)
31 26.3
Crop Protection and Specialised Plant Nutrition 36 30.5
Granular fertilizers 13 11.0
Total 118 100.0
Table 37 aims to understand what procurement policy exists in the various segments. The
results below indicated that Mega-Sized Commercial Growers follow own purchase
decision-making procurement policy, with a limited focus towards following a tender policy
or being directed by a Buying Group. It would be considered that Mega-Sized Commercial
Growers are large scale, and due to their scale, they believe that their negotiations would
be prudent to procure to their best benefit. They, however, do differ from the Corporate
Agri-Business, where appetite still exists to form part of tender and buying group
procurement policy.

66
Table 37: Which of the following statements best reflect your purchasing
of Crop Protection Inputs?
Frequency Per cent
Own purchase decision 41 78.8
Buying group 5 9.6
Tender 6 11.5
Total 52 100.0
C: Medium and large-sized commercial farmers
The results for the Medium and Large Sized Commercial Growers’ profile and segment
indicate that majority decision-making authority lies with the owners (45.8%). The owners
in this segment play a more significant role in the day-to-day operations and decision-
making, compared to the Mega-Sized Commercial Growers’ segment where it is combined
with a formalised structure in management.
Table 38: Position you hold in the company or farm
Position Frequency Per cent
Farm Manager 6 12.5
General Manager 3 6.3
Managing Director 15 31.3
Owner 22 45.8
Production Manager 1 2.1
Technical Manager / Director 1 2.1
Total 48 100.0
Table 39 represents that various legal structures exist in this segment, with majority Private
Companies supporting the above results in Table C3.1 that decision-making authority lies
within an owner structure. The results in this segment for the legalised structure is much
more diverse compared to the Mega-Sized Commercial Growers segment.
Table 39: Legalised structure
Frequency Per cent
Close Corporation 9 18.8
Individual company 5 10.4
Partnership 6 12.5
Private company (i.e. (Pty) Ltd) 27 56.3
Trust 1 2.1
Total 48 100.0

67
The shareholding structure of the Medium and Large Sized Commercial Grower segment
presented in Table 40 to Table 43 indicates that this segment has a majority (83.1% own
shareholding). The % own shareholding represents a higher % compared to the Mega-
Sized Commercial Growers, supporting the results found in Table 38 where the owner is
the decision-maker and involved in day-to-day operation. Where external shareholding
exists, the shareholding % varies. External investments from foreign entities and BBBEE
compliance in this segment is limited and exploratory.
Table 40: Shareholding structure
Frequency Per cent
100% own shareholding 40 83.1
External shareholding 8 16.7
Total 48 100.0
Table 41: External ownership shareholding %
Frequency Per cent
>50.1% 3 4.2
0.1 - 25% 1 2.1
25.1% - 50% 4 14.6
Total 8 100.0
Table 42: Foreign entity ownership %
Frequency Per cent
0.1% - 25.0% 1 2.1
Total 1 100.0
Table 43: BBBEE shareholding %
Frequency Per cent
>50.1% 3 6.3
0.1 - 25% 2 4.2
N/A 43 89.5
Total 48 100.0
Table 44 below represents to which extent the Medium and Large Sized Commercial
Growers cultivate their crops only in their geographical area or have a National Footprint
(that is, operating in more than one province). The data below indicates that all growers
cultivate their crops in one province (different geographical areas within the province).

68
Table 44: Provinces they cultivate their Crops
Frequency Per cent
Gauteng 1 2.1
Limpopo 6 12.5
Mpumalanga 3 6.3
North West 2 4.2
Northern Cape 2 4.2
Eastern Cape 1 2.1
Free State 8 16.7
Western Cape 25 52.1
48 100.0
Table 45 represents the crops cultivated, the total hectares per crop and established to
which extent the Medium and Large Commercial Growers are diversified. The results
indicated that in this segment, 33 out of the 48 (69%) respondents focus on single-crop
cultivation with less diversification focus. Diversification is classified as exploratory in this
segment, as growers in this sector indicated that 21% had been diversified in their crop
cultivation. The total hectares in this segment is also significantly lower compared to the
previous segments, which reflect that this segment is close to scale and exploring
diversification.
Table 45: Hectares per crop cultivated (Irrigated / Dry Land)
Potatoes - Ha Irrigated
Potatoes - Ha Dry Land
Vegetables (Cruciferae, cucurbits, carrots) - Ha Irrigated
Pome Fruit (Apples, Pears) - Ha Irrigated
Minor crops (Blueberries) - Ha Irrigated
Tree Nuts (Pistachios, Macadamias, Pecan) - Ha Irrigated
Hectares Frequency Frequency Frequency Frequency Frequency Frequency
0-499 hectares 2 1 2 3 1 6
Total 2 1 2 3 1 6
Oilseeds (Canola, Sunflower, Soya Beans) - Ha Irrigated
Oilseeds (Canola, Sunflower, Soya Beans) - Ha Dry Land
Citrus - Ha Irrigated
Summer Row Crops (Maize, Sorghum, Dry Beans) - Ha Irrigated
Summer Row Crops (Maize, Sorghum, Dry Beans) - Ha Dry Land
Stone Fruit (Peaches, Plums) - Ha Irrigated
Hectares Frequency Frequency Frequency Frequency Frequency Frequency
0-499 hectares 5 6 1 7 2
500 - 999 hectares 3 3 3 4
1000 - 1999 hectares 3 2 2
2000 - 2999 hectares 2 1
4000 - 4999 hectares 1
Total 8 14 1 12 8 2

69
Sub-tropical (Avo's, litchis, mango's) - Ha Irrigated
Tomatoes (Table and Processed) - Ha Irrigated
Wine Grapes - Ha Irrigated
Wine Grapes - Ha Dry Land
Winter Cereals (Wheat, Barley, Oats) - Ha Irrigated
Winter Cereals (Wheat, Barley, Oats) - Ha Dry Land
Hectares Frequency Frequency Frequency Frequency Frequency Frequency
0-499 hectares 2 2 6 1 5 1
500 - 999 hectares 1 4
1000 - 1999 hectares 1 3 7
2000 - 2999 hectares 1 3
Total 3 2 6 1 10 15
Onions - Ha Irrigated Total
Hectares Frequency Frequency
0-499 hectares 1 54
500 - 999 hectares 18
1000 - 1999 hectares 18
2000 - 2999 hectares 7
4000 - 4999 hectares 1
Total 1 98
Table 46 focuses on how Medium and Large Sized Commercial Growers finance their
Crop Protection Inputs. The results below indicated that this segment could be viewed as
cash-tight with a significant focus on financing from Financial Institutions and Corporate
Agricultural Businesses, with a heightened focus (41.7%) on the latter financial option.
Table 46: How do you finance the purchases of your crop protection products?
Type of Financing Frequency Per centage
Financial Institution / Commercial Banks (for example. Landbank, Standard Bank, Absa, FNB)
14 29.2
Own funding 14 29.2
Corporate Agricultural Business / Company (for example. Afgri, BKB, Eastern Cape Co-Op, OVK, VKB, Senwes)
20 41.7
Total 48 100.0
Table 47 represents the results where Medium and Large Sized Commercial Growers
procure their Crop Protection Products. This question aimed to establish whether this
segment only focuses on one Crop Protection Supplier or multiple Suppliers. The results
below can be summarised as follows: This segment mainly procures from National Crop
Protection Suppliers (88.9%) and predominantly focuses on one channel (35 out of 48
respondents: 73%), which can be viewed that this segment is relationship and reputable
Crop Protection Supplier orientated. They are less business orientated compared to the
Corporate Agri-Business and Mega-Sized Commercial Growers segments.

70
Table 47: Procurement of Crop Protection Inputs
Frequency Per cent
Cumulative Percentage
InteliGro 40 63.5 63.5
Laeveld Agrochem 5 7.9 71.4
Nulandis 9 14.3 85.7
Wenkem 2 3.2 88.9
Other 7 11.1 100.0
Total 63 100
Question 12 was designed to determine which channel they predominantly follow when
procuring their Crop Protection Inputs, considering the traditional business model (sale via
Crop Advisor) compared to other variable options and business models which existed in
the market.
The results in Table 48 below indicated that Medium and Large Sized Commercial
Growers focus on transacting with Crop Advisors and Crop Protection Suppliers. The
segment focuses significantly less on direct procurement from Crop Protection
Manufacturers (BASF, Bayer, UPL, Villa Crop Protection) or Corporate Agri-Business (for
example VKB and Senwes), compared to the Corporate Agri-Business and Mega-Sized
Commercial Growers segments.
The respondents indicated that they balance the relationship between the Crop Advisor
and the Crop Protection Suppliers. We view that Medium and Large Sized Commercial
Growers should be approached by both Crop Advisor (as the main person) and Crop
Protection Supplier Head Office Staff (supporting role) in the negotiations and business
proposals. This segment indicates that there are a higher reliance and support for the
traditional business model.
Table 48: From whom do you procure your agricultural crop protection products?
Frequency Per cent
Crop Advisor (previously known as Agent) 24 45.3
Crop Protection Supplier (i.e. Nulandis, LAC, Wenkem, InteliGro) 25 47.2
Crop Protection Manufacturer (i.e. BASF, Bayer, Corteva, Villa Crop Protection, UPL)
1 1.9
Corporate Agricultural Business (i.e. Afgri, Kaap Agri, Senwes, VKB) 3 5.7
E-commerce 0 0.0
Total 53 100.0

71
Table 49 represents results which indicate what products are procured through the
channels represented in Table C3.11, which represent a fair distribution amongst what a
Crop Protection Supplier should offer to producers in this segment. Majority respondents
in Corporate Agri-Business focused on Crop Protection Products and Specialised Plant
Nutrition (85.1%) and less on Granular Fertilizers. Crop Protection Suppliers should focus
their product positioning and offer to these segments.
Table 49: Which products do you procure from the channels selected above?
Frequency Per cent
Crop Protection Products (i.e. herbicides, insecticides, fungicides, nematicides)
38 40.4
Specialised Plant Nutrition (i.e. foliar feeds, bio-stimulants, fertigation) 21 22.3
Crop Protection and Specialised Plant Nutrition 21 22.3
Granular fertilizers 14 14.9
Total 94 100.0
Table 50 aims to understand what procurement policy exists in the various segments. The
results below indicated that Medium and Large Sized Commercial Growers follow own
purchase decision-making procurement policy, with a narrow focus towards following a
tender policy or being directed by a Buying Group. The results below support our
conclusion of the value of the relationship in business decision-making compared to highly
business orientation negotiations.
Table 50: Which of the following statements best reflect your purchasing of
Crop Protection Inputs?
Frequency Per cent
Own purchase decision 45 93.8
Buying group 1 2.1
Tender 2 4.2
Total 48 100.0
The above results can be summarised in Table 51 below.

72
Table 51: Summary of segmentation questions
Category CORPORATE AGRI-BUSINESSES
MEGA-SIZED COMMERCIAL GROWERS
MEDIUM & LARGE SIZED COMMERCIAL GROWERS
Description Large scale farming with value chain integration. Corporate business structure.
Large scale farming with value chain integration. Management structure and strong owner involvement.
Medium & Large scale farming with no value chain integration. Majority of owner-managed units.
Positional decision-makers
Managerial / Director level Owner / Management Owner / Management
Legalised structure
Company / Agricultural Business
Various Various
Ownership structure
Majority 100% owned + external shareholding
Majority 100% owned - limited external shareholding
Majority 100% owned - limited external shareholding
External shareholding
Significant if applicable Varies Limited
Foreign shareholding
Varies Limited Limited
BBBEE shareholding
Varies Limited & exploratory Limited
Demographics Multiple farms in different geographical regions, mainly in one province, although multiple provinces also applicable.
Operation mainly in one province, with limited extension to other provinces - exploratory to National.
Local, geographical area.
Crop cultivation Diversified, multiple crops, majority irrigation and export orientation.
Diversified, multiple crops, sustainable.
Mainly one crop dimension. Diversification exploratory.
Finance activities Cash-rich, own funding majority & utilisation of financial institutions.
Less Cash-rich, combination of own, financial institutions and Agricultural Business (VKB, Senwes).
Cash-tight, close relationship with Agricultural Business (VKB, Senwes) and Financial Institutions.
Crop Protection Channel purchases
Majority National Distributors, multiple channels and partners.
Majority National Distributors, limited other channels and partners.
Mainly through one Crop Protection Supplier.
Channel procurement preference
Crop Protection Supplier (less dependence on Crop Advisor).
Crop Protection Supplier (Main) and Crop Advisor (Support).
Crop Advisor (Main) and Crop Protection Supplier (Support).
Technical Advice channel
Independent Varies Crop Advisor
Crop Protection purchases
> R10,0 MIO <R10,0 MIO R2,0 - R10,0 MIO
Scale MEGA. OWN DECISION-MAKING, Limited tender orientation, not part of a buying group.
LARGE TO MEGA, strong involvement by owner/managing director in decision-making, a higher trend towards tender and buying groups.
Average, own decision-making, less tender and buying group orientated.
Profile Buying decisions typically made by managers/directors rather than owners. Business orientated & strong differentiation. Buy direct from Crop Protection Supplier - negotiation customisation required.
Buying decisions typically made by owners/directors/management. Business Orientation, buying directly from Crop Protection Suppliers - an investigation into other channels - exploratory towards Manufacturers and Agricultural Businesses.
Owner= Grower= Decision maker. Entrepreneurial, Innovative, Progressive & Diversification exploration. Relational focus on Crop Advisor and Crop Protection Supplier channels.

73
Section 2: Factors influencing the buying decision of each segment
Question 17 – 21: Procurement patterns and which factors influence the decision-makers in their
choice of procuring Crop Protection based on the needs/requirements of the segment
Question 17: What are the main factors which impact your decision when procuring your
inputs from an Agricultural Crop Protection Supplier (for example, InteliGro, Nulandis,
LAC, Wenkem)? (Where Essential = 5, Extremely Important = 4, Important = 3, Somewhat
Important = 2, Not Important = 1).
Table 52: Procurement patterns
Corporate Agri-Business Mega-Sized Commercial Growers
Medium and Large Commercial Growers
Mean Standard
Deviation Rank Mean Standard
Deviation Rank Mean Standard
Deviation Rank
Relationship, trust and advice of the Crop Advisor (previously known as Agent)
3.60 0.97
11.00 4.45 0.90 2.00 4.24 1.05 2.00
Relationship, trust, brand of Crop Protection Supplier (for e.g. InteliGro, Nulandis, LAC, Wenkem)
3.80 1.03 8.00 3.66 1.05 16.00 3.52 1.06 13.00
Quality of product 4.80 0.42 1.00 4.68 0.56 1.00 4.50 0.74 1.00
Complete crop solution 3.70 1.16 9.00 4.17 1.07 7.00 3.76 1.10 11.00
Price 4.10 0.74 6.00 4.34 0.76 3.00 4.02 0.98 4.00
Multi-National Corporate Brand (Research / Reputation - i.e. from Bayer, Syngenta, Corteva)
3.20 0.63 17.00 3.02 1.09 20.00 3.05 1.25 19.00
Multi-National Corporate Brand (Product Name - for e.g. Roundup)
3.20 0.79 17.00 3.19 1.14 18.00 3.26 1.11 15.00
Generic Product (due to efficacy and price)
2.80 1.14 20.00 3.13 1.08 19.00 3.19 0.89 17.00
Advice received from Independent Advisor
3.70 0.95 9.00 4.06 0.94 10.00 3.95 1.06 7.00
Advice received from Crop Advisor (previously known as Agent)
3.30 1.25 16.00 4.06 0.99 10.00 4.21 0.84 3.00
Integrated Pest Management Practices
4.00 0.82 7.00 4.32 0.78 4.00 3.79 0.98 10.00
Market Access (Minimum Residue Profile)
4.70 0.67 2.00 4.23 1.00 5.00 3.86 1.05 8.00
Traceability of product 4.50 0.85 4.00 3.89 1.17 12.00 3.62 0.94 12.00
Logistical compliance and efficacy
4.60 0.52 3.00 4.11 0.87 8.00 3.81 0.92 9.00

74
Corporate Agri-Business Mega-Sized Commercial
Growers Medium and Large Commercial Growers
Mean Standard
Deviation Rank Mean Standard
Deviation Rank Mean Standard
Deviation Rank
Access to data (historic and current)
3.40 1.17 14.00 3.72 0.97 15.00 3.24 0.93 16.00
Funding 2.30 1.06 21.00 3.26 1.28 17.00 2.90 1.36 20.00
Technical support / expertise
3.60 1.26 11.00 4.21 0.83 6.00 4.00 0.86 6.00
Supplier Support 4.20 0.92 5.00 4.09 0.88 9.00 4.02 0.84 4.00
Empty container removal 3.10 1.60 19.00 2.87 1.38 21.00 2.60 1.25 21.00
Technology (Disease models, Data-management platform)
3.40 1.07 14.00 3.77 1.05 14.00 3.07 1.07 18.00
Biological solution 3.60 1.26 11.00 3.89 0.98 12.00 3.36 1.16 14.00
The results in the table above are consolidated based on the respondent feedback. The
mean scores were ranked based on importance level indicated in the questions. The
results above clearly indicate that significant differences exist between the Corporate Agri-
Business segment and the other two segments. There is one similarity among the three
segments, which is represented with the essential scoring of Product Quality and is rated
amongst all three segments as the essential factor when procuring inputs from Crop
Protection Suppliers.
There are eight (8) factors that are similar in importance levels between the Mega-Sized
Commercial Growers Segment and the Medium and Large Commercial Growers
segments, indicating that there are similarities between the decisions which are important
when considering procuring inputs. However, these similarities represent a scoring of 38%
out of the total 21 questions.
Per Segment Preferential Buying Decisions per Mean scoring ranked

75
Figure 9: Corporate agri-business
0.00 0.50 1.00 1.50 2.00 2.50 3.00 3.50 4.00 4.50 5.00
Funding
Generic Product (due to efficacy and price)
Empty container removal
Multi-National Corporate Brand (Research / Reputation -…
Mult-National Corporate Brand (Product Name - for e.g.…
Advice received from Crop Advisor (previously known as…
Access to data (historic and current)
Technology (Disease models, Data-management…
Relationship, trust and advice of the Crop Advisor…
Biological Solution
Technical Support / Expertise
Complete Crop Solution
Advice received from Independent Advisor
Relationship, trust, brand of Crop Protection Supplier (for…
Integrated Pest Management Practices
Price
Supplier Support
Traceability of Product
Logistical compliance and efficacy
Market Access (mainly influence product choice -…
Quality of product
Corporate Agri-Business

76
Figure 10: Mega-Sized Commercial Growers
0.00 0.50 1.00 1.50 2.00 2.50 3.00 3.50 4.00 4.50 5.00
Empty container removal
Multi-National Corporate Brand (Research / Reputation -…
Generic Product (due to efficacy and price)
Mult-National Corporate Brand (Product Name - for e.g.…
Funding
Relationship, trust, brand of Crop Protection Supplier (for…
Access to data (historic and current)
Technology (Disease models, Data-management platform,…
Traceability of Product
Biological Solution
Advice received from Independent Advisor
Advice received from Crop Advisor (previously known as…
Supplier Support
Logistical compliance and efficacy
Complete Crop Solution
Technical Support / Expertise
Market Access (mainly influence product choice -…
Integrated Pest Management Practices
Price
Relationship, trust and advice of the Crop Advisor…
Quality of product
Mega-Sized Commercial Growers

77
Figure 11: Medium- and Large-sized Commercial growers
The results represent that each segment’s needs and wants differ when considering which
factors are of importance in their procurement decision for agricultural inputs from Crop
Protection Suppliers.
0.00 0.50 1.00 1.50 2.00 2.50 3.00 3.50 4.00 4.50 5.00
Empty container removal
Funding
Multi-National Corporate Brand (Research / Reputation -…
Technology (Disease models, Data-management…
Generic Product (due to efficacy and price)
Access to data (historic and current)
Mult-National Corporate Brand (Product Name - for e.g.…
Biological Solution
Relationship, trust, brand of Crop Protection Supplier (for…
Traceability of Product
Complete Crop Solution
Integrated Pest Management Practices
Logistical compliance and efficacy
Market Access (mainly influence product choice -…
Advice received from Independent Advisor
Technical Support / Expertise
Supplier Support
Price
Advice received from Crop Advisor (previously known as…
Relationship, trust and advice of the Crop Advisor…
Quality of product
Medium- and Large Sized Commercial Growers

78
Table 53: Question 18: Rate the level of service that you receive from your Crop
Advisor (previously known as agent) – rate each category (Excellent
= 5, Good = 4, Acceptable = 3, Moderate = 2, Poor = 1)
Corporate Agri-Business Mega-Sized Commercial Growers
Medium and Large Commercial Growers
Category Mean Standard Deviation
Rank Mean Standard Deviation
Rank Mean Standard Deviation
Ranking
Technical expertise
4.00 0.94 7.00 4.36 0.76 2.00 4.45 0.59 3.00
Experience 4.20 0.63 4.00 4.30 0.86 4.00 4.50 0.55 2.00
Involvement in community
3.90 0.88 9.00 4.13 0.92 7.00 4.12 0.83 8.00
Solutions focused
4.10 0.88 5.00 4.28 0.68 5.00 4.31 0.68 5.00
Commercial Offer
4.10 0.88 5.00 4.04 0.75 9.00 4.07 0.75 9.00
Future orientation
4.00 0.94 7.00 4.17 0.84 6.00 4.19 0.74 7.00
Open, honest, trustworthy
4.50 0.53 1.00 4.51 0.69 1.00 4.55 0.67 1.00
Logistic effectiveness
4.30 0.67 2.00 4.00 0.91 10.00 4.24 0.62 6.00
Market access support
3.90 0.99 9.00 4.13 0.92 7.00 4.02 0.72 10.00
Supportive technology
3.70 1.06 11.00 3.77 1.15 11.00 3.69 1.02 11.00
Professionalism 4.30 0.67 2.00 4.36 0.79 2.00 4.33 0.72 4.00
Average 4.09 4.19
4.23
Similarities in the segments exist on four levels: solutions focused, open, honest,
trustworthy and supportive technology. Supportive technology should be noted and the
mean are between acceptable and good. This should be of concern to Crop Protection
Suppliers.
The average means score across all three segments present a good rating for the crop
advisor experience; however, a higher moderate means was presented in the Medium and
Large Commercial Growers segment. We noted in the segmentation and results for
Section 1 above that the Medium and Large Commercial Grower segment has a more
relationship-focused business orientation compared to the other segments, which is
supported by the higher average means scoring.
We have highlighted some of the concerns in orange above and will focus our
interpretation thereof below:

79
Segment: Corporate Agri-Business (Market Access Support)
Market Access Support with a ranking of 9 and means between acceptable and good. In
Question 17 (what factors impact your procurement decision) this segment’s rated market
access (Minimum Residue Profile) as their second most important factor. This presents
the scenario that there is a negative correlation between the factor influencing the decision
and the support given by the Crop Advisor.
The results above indicate a disjuncture between the expectation from the growers and
the rating given to the Crop Advisor. This proposes that the growers in this segment might
require the services of others to advise on the proper product use to manage market
access (Minimum Residue Levels). In practice, the use of Independent Advisors or
Consultants specifically by those growers who export their products is a well-known
phenomenon, with specific reference to access market information and to provide advice
on the product used to manage Minimum Residue Levels based on their specific export
market.
In Question 17, this segment ranked the advice from an Independent Advisor as 9th on
their priority factors when considering procuring Crop Protection Inputs with a ranking of
Supplier Support as their 5th priority and relationship, brand, and the trust of Crop
Protection Supplier as 7th priority. We would suggest that this segment would require the
Crop Protection Suppliers to provide them with market access support, advice and product
positioning.
Segment: Mega- and Medium and Large Sized Commercial Growers (Commercial Offer)
Both these segments scored Commercial Offer received from their Crop Advisor as good
with a means of 4.07, which ranked 9th out of 11. In Question 17 above, both these
segments rated price respectively 3rd and 4th importance in considering procuring Crop
Protection Inputs.
There is a disjuncture between the needs of these segments compared to the rating
provided to the Crop Advisor for Commercial offering. This would suggest that these
segments require either an improvement from their Crop Advisor or that other parties
should be involved in the Commercial Offer. Relationship, trust and advice received from
Crop Advisor rank in both segments as 2nd and 3rd top priority when considering procuring
Crop Protection Inputs. It would thus be advisable that Crop Protection Suppliers should
improve the commercial skills of their Crop Advisors who service these segments.

80
Table 54: Question 19: Business Proposal: How important are the following to
you as a producer and in the decision-making process to procure Crop
Protection Products? (where 1 = least important, 7 = most important)
Corporate Agri-Business Mega-Sized Commercial Growers
Medium and Large Commercial Growers
Mean Standard Deviation
Rank Mean Standard Deviation
Rank Mean Standard Deviation
Rank
Business terms 5.50 1.90 3.00 5.83 1.42 2.00 5.71 1.40 1.00
Funding initiatives 4.60 2.55 7.00 4.57 2.01 8.00 4.26 1.99 8.00
Discount on cash payment
6.00 1.49 2.00 5.57 2.02 4.00 5.60 1.59 3.00
Discount - volume 6.40 0.97 1.00 6.47 0.91 1.00 5.62 1.65 2.00
Rebates 4.50 2.68 8.00 5.21 1.92 5.00 4.76 1.88 5.00
Loyalty programmes 4.70 2.31 6.00 5.00 2.16 7.00 4.50 2.21 7.00
Bulk / container purchases
5.00 1.63 5.00 5.19 1.69 6.00 4.57 1.91 6.00
Financial solutions 3.10 1.52 9.00 4.38 1.88 9.00 4.26 2.02 9.00
Guarantee on claims made from recommendations
5.20 1.87 4.00 5.60 1.84 3.00 5.38 1.87 4.00
Average means 5.00 5.31
4.96
Differences exist between the three segments based on the business proposals which are
deemed important in procuring Crop Protection Products. The similarities between all three
segments in the means and rank in priority are more aligned compared to Question 17
and 18 above.
Highlighted above is the importance of Discounts in volume and Discount on cash payment
purchases for all three segments, with a lesser means scoring in Medium and Large
Commercial Growers, who prioritise business terms as their top consideration in the
business proposal submitted.
A new business proposal was prioritised and ranked in all three segments as 4th most
important factor at a means of 5.2, 5.6 and 5.38 respectively. It is the guarantee on claims
made from recommendations (put your money where your mouth is). This is a new concept
which does not form part of the current business models and business proposals submitted
by Crop Protection Suppliers in South Africa.
The prioritisation of funding initiatives (means 4.6, 4.57, 4.26) and financial solutions
(means 3.1, 4.38, 4.26) amongst all three segments were in the lowest quadrant of
importance, although funding initiatives (collaboration with Corporate Agricultural
Business such as VKB, Senwes, Overberg Agri) scored higher compared to financial

81
solutions (for example Cultivault and Agrisafe). It is also noted that the financial solutions
had little to no importance in the Corporate Agri-Businesses segment, but was somewhat
important in the other two segments.
Table 55: Question 20: Price Policy: Which statement BEST describes your view
on the pricing and decision-making on procuring Crop Protection
Products? (Totally Disagree = 1, Disagree = 2, Somewhat Agree = 3,
Agree = 4, Totally Agree = 5)
Corporate Agri-Business Mega-Sized Commercial Growers
Medium and Large Commercial Growers
Mean Standard
Deviation Rank Mean Standard
Deviation Rank Mean Standard
Deviation Rank
Lowest Price 3.30 1.49 4.00 3.36 1.05 4.00 3.14 1.18 4.00
Market-related 4.10 0.88 3.00 4.06 0.73 1.00 3.88 0.92 1.00
Tender policy 3.00 1.49 5.00 2.96 1.32 5.00 2.52 1.09 5.00
Customised (as negotiated)
4.30 0.82 1.00 3.81 0.97 3.00 3.48 1.19 3.00
Price Benchmarking 4.20 0.79 2.00 3.98 1.05 2.00 3.74 1.11 2.00
Average 3.78
3.63
3.35
The above results present that differences exist between the Corporate Agri-Business and
the other two segments with their view on price policy.
Similarities in the three sectors reflect where they agree that price benchmarking is one of
the factors which best describe their procurement price policy and that they somewhat
agree to disagree that a tender policy best describes their procurement price policy.
Price Benchmarking and Market-related procurement price policies best describe the
Mega-Sized Commercial - and Medium and Large Sized Commercial Growers segments,
compared to customised (as negotiated) procurement price policy for Corporate Agri-
Business.
It was interesting to note that all three segments somewhat agreed to disagree that the
lowest price best describe their procurement price policy and ranked at the 2nd lowest
quadrant of the pricing policy statements.

82
Table 56: Question 21: Looking into the future how would you prefer to
purchase your Crop Protection Products? Rate according to
relevance (where 1 = lease relevant, 7 = most relevant)
Corporate Agri-Business Mega-Sized Commercial Growers
Medium- and Large Commercial Growers
Mean Standard
Deviation Rank Mean Standard
Deviation Rank Mean Standard
Deviation Rank
Traditional Channel through Crop Advisor (previously known as Agent)
4.70 2.26 3.00 5.36 1.85 1.00 5.90 1.39 1.00
Split Advice and Product - pay separate for advice and product
5.00 2.21 2.00 3.57 2.46 4.00 3.29 2.13 4.00
Direct from Crop Protection Manufacturer (i.e. Basf, Bayer, Villa Crop Protection)
5.90 1.45 1.00 4.68 2.13 2.00 4.60 1.99 2.00
Direct from Crop Protection Supplier (i.e. InteliGro, LAC, Nulandis, Wenkem)
4.70 2.36 4.00 4.40 2.34 3.00 4.02 2.12 3.00
Direct through Buying Group 2.70 1.70 5.00 3.15 2.21 6.00 2.98 2.04 6.00
Direct from Cooperative / Agricultural Business (i.e. VKB, Senwes, Kaap Agri)
2.30 1.34 7.00 3.04 2.01 7.00 3.14 1.86 5.00
E-commerce (online platform i.e. Takealot)
2.30 1.06 6.00 3.21 2.32 5.00 2.69 2.10 7.00
The question aims to understand which model in the future should be considered in each
of these segments and what other channels exist which pose a threat to the sustainability
of Crop Protection Distributors. It should be noted that the Crop Protection Distribution is
seen as the “middle-man” in the industry and producers would always attempt to shorten
the chain to be cost-competitive and believe best prices are obtained through eliminating
the middle-man/eliminating duplicated costs in the channel.
It can be argued that manufacturers could sell directly to growers and eliminate the current
distribution channel. Business models have evolved where manufacturers sell directly to
growers. These manufacturers are usually those who are unable to establish a network
through distribution and aim to gain market share in the product, promotion, placement,
and pricing. These are typically new entrants into the market or those who have a niche
market. There are those manufacturers who do not share this profile, who have sold
directly to growers through buying groups, Tenders and Cooperative Purchases.
Manufacturers to note are Villa Crop Protection, BASF and Bayer (through their Dekalb
seed).

83
If manufacturers choose to sell directly to growers, they will now be required to close all
the market gaps, which will require additional costs to be incurred. The marketing tasks or
closing the market gaps are not eliminated and are merely shifted from Distribution to
Manufacturing (Tamilia & Charlebois, 2009).
The results above indicate that there is an appetite amongst all segments in the future to
procure their Crop Protection Products directly from the manufacturer. This poses a risk
to Crop Protection Distributors, one which cannot be underestimated or ignored.
The fact that all these segments indicated that they would consider procuring directly from
manufacturers could imply that they do not see the value of the Distribution channel, and
it would be advisable for Crop Protection Distributors to educate and demonstrate the
value proposition towards growers.
It was interesting to note that the Corporate Agri-Business segment indicated a means of
5.00 that a new model would be considered where sales should occur, where the product
procured is split from the advice. This would be a new model if adopted by Crop Protection
Distributors if this model only exists where Independent Consultants/Advisors are
appointed, and product procured from the Crop Protection Distributor.
The traditional business model employed by Crop Protection Distributors seems to follow
high relevancy from the Mega-Sized Commercial Growers segment and the Medium and
Large Sized Commercial Growers.
The e-commerce model scored a low to very low relevancy (2.3, 3.21, 2.69) amongst all
three segments as a model for future procurement of Crop Protection Products.
Section 3: E-commerce Business Model Evaluation
Question 22 – 23: To determine to what extent the respondents will consider an e-
commerce model per segment and what will be their primary objective in following this
business model/channel.

84
Table 57: Question 22: Would you consider purchasing your Crop
Protection Products from an online platform (that is, Takealot)?
Corporate Agri-Business
Mega-Sized Commercial Growers
Medium- and Large Commercial Growers
Yes No Yes No Yes No
Frequency 3.0 9.0 18.0 29.0 18.0 30.0
Per cent 25.0 75.0 38.3 61.7 37.5 62.5
The frequency based on the consideration to procure from an online platform is low
amongst all three segments, with the Mega-Sized Commercial Growers showing the
greater appetite and the Corporate Agri-Business segment the least.
Table 58: Question 23: What would be your primary reason for procuring Crop
Protection Products from an online platform (i.e. Takealot)? Rate
relevance (where 1 = least relevant, 7 = most relevant)
Corporate Agri-Business Mega-Sized Commercial Growers
Medium and Large Sized Commercial Growers
Mean Standard
Deviation Rank Mean Standard
Deviation Rank Mean Standard
Deviation Rank
Bargain-hunting 3.60 2.63 3.00 3.70 2.61 2.00 3.29 2.55 3.00
Transaction (product focus)
4.00 2.36 2.00 3.65 2.57 4.00 3.51 2.33 2.00
Benchmarking 4.10 2.38 1.00 4.11 2.65 1.00 3.83 2.57 1.00
Convenience 3.40 2.17 4.00 3.67 2.58 3.00 3.22 2.34 4.00
Current channel / model not optimal
1.90 1.10 6.00 2.64 2.14 6.00 2.39 1.91 6.00
Other value chain activities (i.e. insurance, technology, seed, fertilizer)
2.70 2.06 5.00 3.00 2.27 5.00 2.88 2.03 5.00
The question aims to address the factors which are important should an e-commerce
model be implemented as a business model for Crop Protection Distributors. We already
noted that the response to the model has less preference for the traditional models in each
of the segments, scoring a frequency below 40%. This is also supported by means of 1.9,
2.14, and 2.39 answered for the current channel/model not optimal across all three
segments.
The results above for all the questions from a means are all low compared to the most
relevant scoring means of 7. Should this model be accepted and implemented in the future
by Crop Protection Distributors the purpose thereof, according to the respondents (all three
segments agree), is that it would be most relevant and ranked below:

85
• Price benchmarking
• Bargain hunting
• Transaction/product focus (looking for a specific product)
• Convenience
Section 4: Segment-specific preference to information and technology
Question 24 – 25: Segment-specific importance to access latest technology and
information.
Table 59: Question 24: How important to you is access to the latest technology
(Disease forecasting models, scout models, electronic
recommendations, Omni-channel models) from Agricultural Crop
Protection Companies to support your farming operations? (where 1
= least important, 7 = most important)
Corporate Agri-Business
Mega-Sized Commercial
Growers
Medium and Large Commercial Growers
Mean Standard
Deviation Mean Standard
Deviation Mean Standard
Deviation
Technology 6.00 1.73 5.64 1.76 5.22 1.78
The results above indicated that technology is seen as very important to all three
segments, with relevance rating in importance ranked most important to Corporate Agri-
Business segment, then Mega-Sized Commercial Growers, and to a lesser degree
Medium and Large Commercial growers. The positioning of technology for a Crop
Protection Distributor should align with the preference in each of these segments, which
focuses on Corporate Agri-Business as primary, should new technology become available.
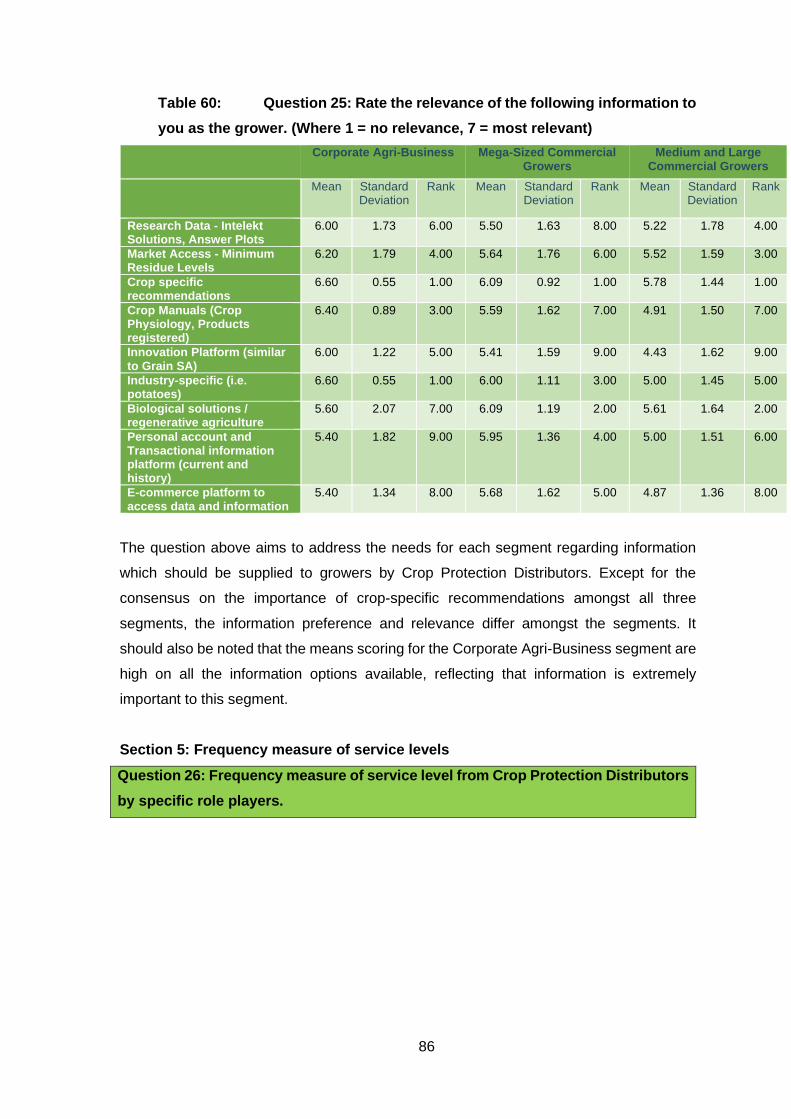
86
Table 60: Question 25: Rate the relevance of the following information to
you as the grower. (Where 1 = no relevance, 7 = most relevant)
Corporate Agri-Business Mega-Sized Commercial Growers
Medium and Large Commercial Growers
Mean Standard
Deviation Rank Mean Standard
Deviation Rank Mean Standard
Deviation Rank
Research Data - Intelekt Solutions, Answer Plots
6.00 1.73 6.00 5.50 1.63 8.00 5.22 1.78 4.00
Market Access - Minimum Residue Levels
6.20 1.79 4.00 5.64 1.76 6.00 5.52 1.59 3.00
Crop specific recommendations
6.60 0.55 1.00 6.09 0.92 1.00 5.78 1.44 1.00
Crop Manuals (Crop Physiology, Products registered)
6.40 0.89 3.00 5.59 1.62 7.00 4.91 1.50 7.00
Innovation Platform (similar to Grain SA)
6.00 1.22 5.00 5.41 1.59 9.00 4.43 1.62 9.00
Industry-specific (i.e. potatoes)
6.60 0.55 1.00 6.00 1.11 3.00 5.00 1.45 5.00
Biological solutions / regenerative agriculture
5.60 2.07 7.00 6.09 1.19 2.00 5.61 1.64 2.00
Personal account and Transactional information platform (current and history)
5.40 1.82 9.00 5.95 1.36 4.00 5.00 1.51 6.00
E-commerce platform to access data and information
5.40 1.34 8.00 5.68 1.62 5.00 4.87 1.36 8.00
The question above aims to address the needs for each segment regarding information
which should be supplied to growers by Crop Protection Distributors. Except for the
consensus on the importance of crop-specific recommendations amongst all three
segments, the information preference and relevance differ amongst the segments. It
should also be noted that the means scoring for the Corporate Agri-Business segment are
high on all the information options available, reflecting that information is extremely
important to this segment.
Section 5: Frequency measure of service levels
Question 26: Frequency measure of service level from Crop Protection Distributors
by specific role players.

87
Table 61: Question 26: Technical / Marketing: How often do you need the
services or visits of Crop Advisors (i.e. Agents, Technical Advisors)
of Agricultural Crop Protection Suppliers?
Corporate Agri-Business
Ad-hoc Annually Bi-Annual Quarterly Monthly Weekly
Two-three times
weekly
Crop Advisor 1.0 0.0 0.0 1.0 0.0 3.0 0.0
Crop Specialist 0.0 0.0 0.0 2.0 1.0 2.0 0.0
Technical Advisors / Consultants
0.0 0.0 0.0 1.0 2.0 2.0 0.0
Key Account Managers
1.0 1.0 0.0 2.0 0.0 1.0 0.0
Mega-Sized Commercial Growers
Ad-hoc Annually Bi-Annual Quarterly Monthly Weekly
Two-three times
weekly
Crop Advisor 1.0 0.0 2.0 4.0 4.0 10.0 1.0
Crop Specialist 1.0 1.0 0.0 6.0 8.0 5.0 1.0
Technical Advisors / Consultants
2.0 0.0 1.0 4.0 10.0 5.0 0.0
Key Account Managers
7.0 10.0 1.0 2.0 1.0 1.0 0.0
Medium and Large Commercial Growers
Ad-hoc Annually Bi-Annual Quarterly Monthly Weekly
Two-three times
weekly
Crop Advisor 5.0 0.0 1.0 1.0 4.0 10.0 2.0
Crop Specialist 4.0 2.0 3.0 5.0 6.0 3.0 0.0
Technical Advisors / Consultants
7.0 2.0 1.0 6.0 5.0 2.0 0.0
Key Account Managers
9.0 9.0 2.0 2.0 1.0 0.0 0.0
The results highlighted above indicate the preference of each of the segments based on
frequency per key personnel within the Crop Protection Distribution. There is do, however,
a noticeable trend where the frequency and intensity required by Corporate Agri-Business
segment are higher compared to the other two segments, with specific inclusion of
Technical Advisors and Key Account Managers. It was also noted that the traditional
channel of visits by predominantly the Crop Advisors to the growers has changed, and
there is a need to have visits from Technical Advisors and Key Account Managers.

88
Section 6: Value Chain Integration Analysis
Question 27 – 28: Which segment provides the biggest appetite to integrate
backwards with their Crop Protection Distributors, and what will be their primary
objective to integrate backwards.
Table 62: Question 27: Would you be interested in acquiring equity in your Crop
Protection Supplier (i.e. InteliGro, LAC, Nulandis, Wenkem)?
Corporate Agri-
Business Mega-Sized Commercial
Growers Medium and Large
Commercial Growers
Frequency Per cent Frequency Per cent Frequency Per cent
Yes 0.0 0.0 14.0 29.8 13.0 27.1
No 12.0 100.0 33.0 70.2 35.0 72.9
Total 12.0 12.0 47.0 100.0 48.0 100.0
The results above indicate that there is some appetite for backwards integration into the
value chain with Crop Protection Distributors from the Mega-Sized and Medium and Large
Sized Commercial Growers segments, but there is 0% interest from the Corporate Agri-
Business segment.
This would not be considered as a significant portion to add to the business models for
each of these segments and should be addressed following Grower-specific ad-hoc
requests.
Table 63: Question 28: If you answered “yes” to the question above, what would
be your main consideration?
Frequency Per cent
Integrity 15 12.7
Transparency 14 11.9
Cost synergy 15 12.7
Value chain integration 21 17.8
Gaining valuable information 11 9.3
Partnership 11 9.3
Return on Investment 18 15.3
Stronger commitment 13 11.0
Total 118 100.0

89
The responses above were consolidated amongst the Mega-Sized Commercial Growers
Segment and Medium and Large Commercial Growers Segment. All applicable options
could be selected.
The frequency for total responses per category is presented above, while the main
consideration to acquire equity in the Crop Protection Distributor is to ensure value chain
integration, followed by return on investment, cost synergy and integrity of the company.
3.4 SUMMARY AND CONCLUSION OF RESULTS
The summary and conclusion of the results will focus on whether the secondary research
objective has been met, to address them each specifically and whether the research
question can be answered.
The construct of the primary research objective has been formulated based on secondary
research objectives. Once those secondary research objectives are met through the
research results, then conclusions will be made to the extent to which the primary research
objective has been met.
The secondary research objectives reported in Chapter 1 are as follow:
• To identify the proper segmentation profile of customers (SRO 1)
• To identify customer segmentation-specific needs and wants (SRO 2)
• To determine whether the e-commerce business model should be adopted (SRO
3)
SRO 1: To identify the proper segmentation profile of customers
Section 1 of the results above summarised the profile of each of the segments identified
during this study and are presented below in the three segments: Corporate Agri-Business,
Mega-Sized Commercial Growers and Medium and Large Sized Commercial Growers.

90
Table 64: Profile of the three segments: Corporate Agri-business, Mega-Sized
Commercial Growers and Medium and Large Sized Commercial
Growers
Category CORPORATE AGRI-BUSINESS
MEGA-SIZED COMMERCIAL GROWERS
MEDIUM & LARGE SIZED COMMERCIAL GROWERS
Description Large scale farming with value chain integration. Corporate business structure.
Large scale farming with value chain integration. Management structure and strong owner involvement.
Medium & large-scale farming with no value chain integration. Majority of owner-managed units.
Market size 20 – 25% 15 – 20% 45 – 55%
CP Market Value R2.0 Billion R1.5 Billion R4.5 Billion
Positional decision-makers
Managerial / Director level Owner / Management Owner / Management
Legalised structure Company / Agricultural Business
Various Various
Ownership structure Majority 100% owned + external shareholding
Majority 100% owned - limited external shareholding
Majority 100% owned - limited external shareholding
External shareholding Significant if applicable Varies Limited
Foreign shareholding Varies Limited Limited
BBBEE shareholding Varies Limited & exploratory Limited
Demographics Multiple farms in different geographical regions, mainly in one province, although multiple provinces also applicable.
Operation mainly in one province, with limited extension to other provinces - exploratory to National.
Local, geographical area.
Crop cultivation Diversified, multiple crops, majority irrigation and export orientation.
Diversified, multiple crops, sustainable.
Mainly one crop dimension. Diversification exploratory.
Finance activities Cash-rich, own funding majority & utilisation of financial institutions.
Less Cash-rich, combination of own, financial institutions and Agricultural Business (VKB, Senwes).
Cash-tight, close relationship with Agricultural Business (VKB, Senwes) and Financial Institutions.
Crop Protection Channel purchases
Majority National Distributors, multiple channels, and partners.
Majority National Distributors, limited other channels and partners.
Mainly through one Crop Protection Supplier.
Channel procurement preference
Crop Protection Supplier (less dependence on Crop Advisor)
Crop Protection Supplier (Main) and Crop Advisor (Support)
Crop Advisor (Main) and Crop Protection Supplier (Support)
Crop Protection purchases
> R10,0 MIO <R10,0 MIO R2,0 - R10,0 MIO
Scale MEGA. OWN DECISION-MAKING, Less tender - no buying group.
LARGE TO MEGA, strong involvement by owner/managing director in decision-making, a higher trend towards tender and buying groups.
Average, own decision-making, less tender and buying group orientated.
Profile Buying decisions typically made by managers/directors rather than owners. Business orientated & strong differentiation. Buy direct from Crop Protection Supplier - negotiation required.
Buying decisions typically made by owners/directors/management. Business Orientation, buying directly from Crop Protection Suppliers - an investigation into other channels - exploratory towards manufacturers and Agricultural Businesses.
Owner= Grower= Decision maker. Entrepreneurial, Innovative, Progressive & Diversification exploration. Relational focus on Crop Advisor and Crop Protection Supplier channels.

91
The four criteria for successful segmentation are substantiality, identifiability and
measurability, accessibility, and responsiveness. The results above are evaluated
against the criterion in the table below.
Table 65: Successful segmentation measures
Criteria Measure Criteria Met
Substantiality: The
specific segments should
be large enough to
develop and maintain a
marketing mix (Lamb et
al., 2019).
Corporate Agri-Business:
Market Size: 20% to 25% and CP
market value: R2.0 Billion
Mega-Sized Commercial Growers:
Market Size: 15% to 20% & CP
market value: R1.5 Billion
Medium and Large Sized
Commercial Growers
Market Size: 45% to 55%
CP Market value: R4.5 Billion
Yes
Identifiability and
measurability
See table above for demographics,
profile, crop cultivation, legalised
structure.
Yes
Accessibility: must be
able to reach the
members
InteliGro is a National Crop
Protection Distributor with 109 Crop
Advisors. See the demographics of
segment members, those who
cultivate crops in multiple provinces
can be reached through the network.
Yes
Responsiveness Each of the segments is
homogeneous within the segment,
but is heterogeneous among the
three segments.
Yes
Based on the successful segmentation criteria and the summarised information per
segment, it can be concluded that SRO 1 was met.

92
SRO 2: To identify customer segmentation-specific needs and wants
Section 2 followed the pattern to determine the needs and wants of each of the segments
with structure questions to determine the main factors impacting each segments’ decision-
making in procuring Crop Protection Inputs.
The results represent that each segment’s needs and wants differ when considering which
factors are of importance in their procurement decision for agricultural inputs from Crop
Protection Suppliers. Only one (1) factor (Product Quality) out of the 21 factors listed were
homogeneous amongst all three segments. Eight (8) factors were homogeneous between
the Mega-Sized Commercial Growers and the Medium and Large Commercial Growers
Segments out of the 21 factors listed.
When considering the channel through which the Crop Protection Distributors should
market their products, the rating of the service level through the traditional channel (Crop
Advisors) presented the following:
The average means score across all three segments present a good rating for the crop
advisor experience; however, a higher average means was presented in the Medium and
Large Commercial Growers segment. The traditional channel with slight modification
would deem to be the appropriate channel for Medium and Large Commercial Growers.
In the Corporate Agri-business there was a disjunction between the expectation from the
growers and the rating given to the Crop Advisor. This proposes that the growers in this
segment might require the services of others to advise on the proper product use to
manage market access (Minimum Residue Levels).
In the Mega-Sized Commercial Growers and Medium and Large Commercial Growers
Segments, there is a disjuncture between the needs of these segments compared to the
rating provided to the Crop Advisor for Commercial offering. This would suggest that these
segments require either an improvement from their Crop Advisor or that other parties
should be involved in the Commercial Offer. Relationship, trust and advice received from
Crop Advisor rank in both segments as 2nd and 3rd top priority when considering procuring
Crop Protection Inputs. It would thus be advisable that Crop Protection Suppliers should
improve the commercial skills of their Crop Advisors who service these segments.

93
The channel to be used by Crop Protection Distributors to both Corporate Agri-Businesses
and Mega-Sized Commercial Growers would require a change in the traditional model. In
this regard, an increased involvement and even direct marketing strategy have been
highlighted.
By measuring the business proposal in each of the segments, we identified differences
between the three segments. Crop Protection Distributors would be able to develop and
maintain a unique and customised business proposal to each of these segments based
on their segment-specific needs and wants.
A new business proposal is a guarantee on claims made from recommendations (put your
money where your mouth is) which was identified amongst all three segments. This is a
new concept which does not form part of the current business models and business
proposals submitted by Crop Protection Suppliers in South Africa.
Price Benchmarking and Market-related procurement price policies best describe the
Mega-Sized Commercial and Medium and Large Sized Commercial Growers Segments,
compared to customised (as negotiated) procurement price policy for Corporate Agri-
Business. Crop Protection Distributors would be able to develop a pricing strategy per
segment based on the results presented.
Respondents in each of the segments were asked which model they would prefer in the
future to procure their Crop Protection Products. A new model was also suggested to be
implemented in the Corporate Agri-Business segment where the product procured is split
from the advice.
Based on the results, Crop Protection Distributors will be able to develop and maintain a
segment-specific marketing mix.
Product: Quality of product rated homogeneous amongst all three segments.
Price: Pricing policy differentiation between each segment.
Place: Channel: Different channels to be used in each of the segments,
with the traditional model remaining unchanged in the Medium and
Large Commercial Grower segment. The channels predominantly
orientate towards the Crop Protection Distributor preference;
however, future needs indicate a possible direct procurement
through Crop Protection Manufacturers.

94
Promotion: Involvement of different role players in the promotion of the product
in each of the segments. Section 5 also provided segment-specific
needs about involvement frequency.
SRO 3: To determine whether the e-commerce business model should be adopted
The frequency based on the consideration to procure from an online platform is low
amongst all three segments (below 40% of respondents), with the Mega-Sized
Commercial Growers showing the greater appetite and the Corporate Agri-Business
segment the least. The e-commerce model scored a low to very low relevancy amongst
all three segments as a model for future procurement of Crop Protection Products.
It is suggested that this model should be investigated and researched more extensively
before implementation.
Should this model be accepted and implemented in the future by Crop Protection
Distributors, they should understand that the adoption thereof would represent a small
portion of the total market size. Furthermore, if it is implemented, the purpose thereof,
according to the respondents, is that it would be most relevant for:
• Price benchmarking
• Bargain hunting
• Transaction/product focus (looking for a specific product)
• Convenience
The research objective is met, and it is suggested that future research and rigorous
investigation be done before this business model is implemented.

95
CHAPTER 4: CONCLUSION, IMPLICATIONS AND
RECOMMENDATIONS
4.1 INTRODUCTION
Chapter 3 concluded to understand to what extent this study has addressed the secondary
research objectives listed. By developing optimal segment-specific business models which
should be implemented by Crop Protection Distributors in South Africa. This addresses
the primary research objective of the study and also answers the primary research
question. This final chapter also gives attention to the Research Propositions formulated.
The Research Propositions follow the conceptual framework of literature study, analysis
of the results, and conclusion to be considered towards the business model generation.
This chapter will propose the recommended segment-specific business models which
should be implemented by InteliGro.
4.2 CONCLUSION AND IMPLICATIONS
4.2.1 Research Proposition 1 and Research Proposition 2
The Research Propositions supporting the deductive theory of the relationship
between practice, theory and research for this study are:
Research Proposition 1: The needs and wants of each of the customer segments will differ
based on the demographics, size, legalised structure, ownership %, profile, and crops
cultivated.
Research Proposition 2: The buying decisions of Crop Protection Products for each
of the customer segments differ.
4.2.1.1 Literature study
Successful businesses attribute market segmentation as a significant key to their
marketing strategy. The importance of market segmentation is signified to the extent to
which companies can tailor their marketing mix to a specific, well-defined market (Lamb et
al., 2019).

96
Some authors have viewed the consumer population as homogenous, with similar wants
and needs while other authors have viewed the population as heterogeneous, where
consumer preferences vary across socio-economic and demographic profiles (Macharia
et al., 2013).
There are three critical reasons why marketers segment markets. Firstly, it enables them
to identify groups of customers based on similar needs, assists in the analysis of the
characteristics of the customers and provides buying behavioural patterns. Secondly, the
information obtained assists in the formulation of an appropriate segment-specific
marketing strategy and mix. Thirdly, segmentation offers the opportunity to satisfy
customer wants and needs while addressing the company’s objectives (Lamb et al., 2019).
4.2.1.2 Analysis of results
The analysis of the results will first and foremost aim to address Research Proposition 2,
based on the buying decisions noted in Section 2 above, where the results in Section 1
will be combined with Section 2, in the quest to answer Research Proposition 1.

97
Figure 12: Combined decision-making relevancy per segment
The buying decisions of each of the segments are ranked below based on the results
obtained in Question 17. The following factors for each of the segments were identified
and ranked according to their importance based on their specific needs and wants. The
ranking was based on the means scoring of each of the factors in each of the segments
and listed only those above a mean of 4, which reflect “Strongly Agree” to “Essential”.
0.00 0.50 1.00 1.50 2.00 2.50 3.00 3.50 4.00 4.50 5.00
Relationship, trust and advice of the Crop Advisor…
Relationship, trust, brand of Crop Protection Supplier (for…
Quality of product
Complete Crop Solution
Price
Multi-National Corporate Brand (Research / Reputation -…
Mult-National Corporate Brand (Product Name - for e.g.…
Generic Product (due to efficacy and price)
Advice received from Independent Advisor
Advice received from Crop Advisor (previously known as…
Integrated Pest Management Practices
Market Access (mainly influence product choice -…
Traceability of Product
Logistical compliance and efficacy
Access to data (historic and current)
Funding
Technical Support / Expertise
Supplier Support
Empty container removal
Technology (Disease models, Data-management platform,…
Biological Solution
Combined Buying Decisions Relevancy
Medium- and Large Commercial Growers Mega Sized Commercial Growers Corporate Agri Business

98
Corporate Agri-Business:
Factor Mean Priority
Quality of Product: 4.8 1st
Market Access (Minimum Residue) 4.7 2nd
Logistical Compliance and Efficiency 4.6 3rd
Traceability of product 4.5 4th
Supplier Support 4.2 5th
Price 4.1 6th
Integrated Pest Management Practices 4.0 7th
Mega-Sized Commercial Growers
Factor Mean Priority
Quality of Product 4.68 1st
Relationship, trust, and advice of the Crop Advisor 4.45 2nd
Price 4.34 3rd
Integrated Pest Management Practices 4.32 4th
Market Access (Minimum Residue) 4.23 5th
Technical Support / Expertise 4.21 6th
Complete Crop Solution 4.17 7th
Logistical Compliance and Efficiency 4.11 8th
Supplier Support 4.09 9th
Advice Received from Independent Advisor 4.06 10th
Advice Received from Crop Advisor 4.06 11th
Medium- and Large Commercial Growers
Factor Mean Priority
Quality of Product 4.50 1st
Relationship, trust, and advice of Crop Advisor 4.24 2nd
Advice received from Crop Advisor 4.21 3rd
Supplier Support 4.02 4th
Price 4.02 5th
Technical Support / Expertise 4.00 6th

99
Table 66: Summary of prioritised factors per segment (above mean of 4)
Corporate Agri-Business Mega-Sized Commercial Growers Medium- and Large Commercial
Growers
Quality of Product Quality of Product Quality of Product
Market Access (Minimum
Residue Levels)
Relationship, trust, and advice of Crop
Advisor
Relationship, trust, and advice of
Crop Advisor
Logistical Compliance and
Efficiency
Price Advice received from Crop Advisor
Traceability of product Integrated Pest Management Practices Supplier Support
Supplier Support Market Access (Minimum Residue Levels) Price
Price Technical Support / Expertise Technical Support / Expertise
Integrated Pest Management
Practices
Complete Crop Solution
Logistical Compliance and Efficiency
Supplier Support
Advice received from Independent Advisor
Advice received from Crop Advisor
It is clear from the information above that each segment has its own unique importance
and relevancy in making their buying decisions when procuring Crop Protection Products.
In our conclusion of the results, we identified that SRO1 was achieved where the profile of
each of the segments identified differ based on their description, profile, decision-making
structure, ownership, crops cultivated, etc. – summarised below in each of the segments.

100
Table 67: Summary of segmentation questions
Category CORPORATE AGRI-BUSINESS
MEGA-SIZED COMMERCIAL GROWERS
MEDIUM- & LARGE SIZED COMMERCIAL GROWERS
Description Large scale farming with value chain integration. Corporate business structure.
Large scale farming with value chain integration. Management structure and strong owner involvement.
Medium & large-scale farming with no value chain integration. Majority of owner-managed units.
Market size 20 – 25% 15 – 20% 45 – 55%
CP Market Value R2.0 Billion R1.5 Billion R4.5 Billion
Positional decision-makers
Managerial / Director level
Owner / Management Owner / Management
Legalised structure Company / Agricultural Businesses
Various Various
Ownership structure Majority 100% owned + external shareholding
Majority 100% owned - limited external shareholding
Majority 100% owned - limited external shareholding
External shareholding Significant if applicable Varies Limited
Foreign shareholding Varies Limited Limited
BBBEE shareholding Varies Limited & exploratory Limited
Demographics Multiple farms in different geographical regions, mainly in one province, although multiple provinces also applicable.
Operation mainly in one province, with limited extension to other provinces - exploratory to National.
Local, geographical area.
Crop cultivation Diversified, multiple crops, majority irrigation and export orientation
Diversified, multiple crops, sustainable
Mainly one crop dimension. Diversification exploratory
Finance activities Cash-rich, own funding majority & utilisation of financial institutions.
Less cash-rich, combination of own, financial institutions and Agricultural Business (VKB, Senwes).
Cash-tight, close relationship with Agricultural Business (VKB, Senwes) and Financial Institutions.
Crop Protection Channel purchases
Majority National Distributors, multiple channels, and partners
Majority National Distributors, limited other channels and partners
Mainly through one Crop Protection Supplier
Channel procurement preference
Crop Protection Supplier (less dependence on Crop Advisor)
Crop Protection Supplier (Main) and Crop Advisor (Support)
Crop Advisor (Main) and Crop Protection Supplier (Support)
Crop Protection purchases
> R10,0 MIO <R10,0 MIO R2,0 - R10,0 MIO
Scale MEGA. OWN DECISION-MAKING, Less tender - no buying group.
LARGE TO MEGA, strong involvement by owner/managing director in decision-making, a higher trend towards tender and buying groups.
Average, own decision-making, less tender and buying group orientated.
Profile Buying decisions typically made by managers/directors rather than owners. Business orientated & strong differentiation. Buy direct from Crop Protection Supplier - negotiation required.
Buying decisions typically made by owners/directors/management. Business Orientation, buying directly from Crop Protection Suppliers - the investigation into other channels - exploratory towards manufacturers and Agricultural Businesses.
Owner= Grower= Decision maker. Entrepreneurial, Innovative, Progressive & Diversification exploration. Relational focus on Crop Advisor and Crop Protection Supplier channels.

101
Question 19 addressed the business proposal requirements and needs per segment.
Listed below is the summary of the business proposal importance where we listed those
in each segment with a mean above 5 (“Most” to “Extreme” importance).
Table 68: Summary of Business Proposal Preferences per Segment
Corporate Agri-Business Mega-Sized Commercial
Growers
Medium- and Large Commercial
Growers
Discount on Volumes Discount on Volumes Business Terms
Discount On Cash
Payments
Business Terms Discount on Volumes
Business Terms Guarantee on Claims made
from Recommendation
Discount on Cash Payments
Guarantee on Claims made
from Recommendation
Discount on Cash Payments Guarantee on Claims made from
Recommendation
Bulk Container Purchases Rebates Rebates
Bulk Container Purchases
Loyalty Programmes
Similarities exist in the offer to each of the segments from a business proposal perspective.
Differences exist in Bulk Container Purchasing preference in the Corporate Agri-Business
segment, compared to the business proposal for rebates importance in the Mega-Sized
Commercial Growers and Medium- and Large Commercial Growers Segments. An
additional consideration is given in the Mega-Sized Commercial Growers, indicating that
loyalty programmes would be the preference in this segment and should be included in
the business proposal to each of these segments. It was interesting to note that funding
initiatives and financial solutions had a high relevance in none of these segments,
compared to traditional models noted in areas where summer row crops, oilseeds and
winter cereals are cultivated.
Question 20 was formulated to determine which pricing policy implemented by each of the
segments best describe how they make their decisions based on their pricing policy, and
to test the Research Proposition whether there were any differences noted between these
segments.
The results summarised below are based on a means above or close to 4, indicating that
these segments agree with the pricing policy applied per segment.

102
Table 69: Summary of Pricing Policy Applied Per Segment
Corporate Agri-Business Mega-Sized Commercial
Growers
Medium- and Large
Commercial Growers
Customised (as negotiated) Market-related Market-related
Price Benchmarking Price Benchmarking Price Benchmarking
The results conclude that the Corporate Agri-Business would prefer a customised price
policy as negotiated, where the other two sectors value market-related pricing policy. All
three segments indicated that they would continue to value price benchmarking, which will
influence their decision.
4.2.1.3 Conclusion
Research Proposition 1: The needs and wants of each of the customer segments will
differ based on the demographics, size, legalised structure, ownership %, profile, and
crops cultivated.
It can be concluded that the needs and wants of each of the customer segments will differ
based on the demographics, size, legalised structure, ownership %, profile, and crops
cultivated. This is represented by the information gathered in the segmentation (Section
1) results and by combining it with the results found in the buying decisions of Crop
Protection Products preference identified. Concluding that both Research Proposition 1
and Research Proposition 2 was positively proved based on the sample population results.
Research Proposition 2: The buying decisions of Crop Protection Products for each of
the customer segments differ.
Similarities did exist in the business proposal preferences in each of the segments, with
minimal differences noted in the business proposal. The pricing policy implemented
amongst the segments differs only for the Corporate Agri-Business segment, compared to
the other two segments, with a robust additional focus on price benchmarking.
4.2.2 Research Proposition 3
The Research Proposition supporting the deductive theory of the relationship between
practice, theory and research for this study is:

103
Research Proposition 3: The traditional business model will apply to a specific customer
segment, medium to large size commercial producers.
4.2.2.1 Literature Study
We noted in the earlier literature study that the Crop Protection Industry is still dominated
by Distributors and theirs to lose due to the level of trust and knowledge which still exist.
Research is required to be updated in different channels and possibilities. Independent
channel (seen in Distributors employing affiliated commission agents) performance is
impacted by the trust. Olsson et al. (2013) has shown that despite increasing levels of
disintermediation, distributors can obtain value from their business partners by adapting
to changing market conditions.
The role of trust in various channels of distribution needs to be studied and understood,
as it evolves in time and across different geographies and carries differing degrees of
importance depending upon the cultural context in question (LaPlaca & Da Silva, 2016).
It is noted that the current business model in South Africa remains relevant, as seen by
the minor increase in Distributors and a significant increase in Independent Affiliated
Commissioned Agents. It would be assumed that this model would continue to be relevant
to a specific segment for the near future. Research conducted in 2016, B2B: A paradigm
shift from Economic Exchange to Behavioural Theory: a quest for better explanations and
predictions, indicated that a great majority of B2B firms reach their customers through
various channels of distribution. These channels are constantly evolving.
Value innovation was defined by Chan Kim and Mauborgne in 1997 as companies who do
not focus on beating or matching their rivals. Instead, through employing a strategic logic,
they aimed to make their competitors irrelevant (Chan Kim & Mauborgne, 1997). These
companies focused on getting out of the existing market boundaries (“red-ocean”) through
the creation of significant value to their customers which kept them ahead of their
competitors (Chan Kim & Mauborgne, 2005b).
To determine whether the current business model implemented has a certain level of
relevancy in a specific segment, we have to understand whether that segment sees the
current business model as creating value for them as growers.

104
4.2.2.2 Analysis of results
We draw our attention now to the rating of service received from their Crop Advisor
to understand the level of trust, knowledge, experience, technical expertise and
overall, for the Medium- and Large-sized Commercial Growers Segment (blue bar),
compared to the other two segments.
Figure 13: Rating of crop advisor service levels per segment
Scoring of a mean of 4 and above presents “Good” (4) to “Excellent” (5). It is clear that the
Medium- and Large Commercial Growers Segment (blue bar above) rated their Crop
Advisors the highest (“Excellent”) in the open, honest, trustworthy, experience, and
technical expertise. An overall had an average mean of 4.23, which was the highest
amongst all three segments. We conclude that the level of trust and knowledge in this
sector, primarily from the Crop Advisor, is high.
We now refer to the models in each segment which they would see to continue to exist in
the future when deciding to purchase Crop Protection Inputs.
- 0.50 1.00 1.50 2.00 2.50 3.00 3.50 4.00 4.50 5.00
Technical Expertise
Experience
Involvement in Community
Solutions focused
Commercial Offer
Future orientation
Open, honest, trustworthy
Logistic effectiveness
Market access support
Supportive technology
Professionalism
Rating of Crop Advisor Service Levels per Segment
Corporate Agri-Business Mega-sized Commercial Growers
Medium- and Large Commercial Growers

105
Figure 14: Future channel of procurement of Crop Protection Inputs per
segment (Preference)
Based on the figure above, the most relevant channel of choice for the Medium- and Large
sized Commercial growers to procure their Crop Protection Inputs would be through the
Crop Advisor – a traditional channel, compared to the Corporate Agri-Business segment
choice of direct from Crop Protection Manufacturer.
We note that the Mega-Sized Commercial Growers’ choice is a traditional channel.
However, there are strong means towards direct from Crop Protection Manufacturers and
Crop Protection Supplier as a future model. When one compares it to the mean scoring in
the level of trust, brand, reputation, and relationship of Crop Protection Supplier (e.g.
InteliGro) in their factors impacting their decision in procuring Crop Protection Inputs, we
would suggest that the negotiation and the primary relationship will be direct with Crop
Protection Supplier (i.e. InteliGro) and link up with service from Crop Advisor.
4.2.2.3 Conclusion
The results indicate that the Medium- and Large Commercial Grower Segment has the
highest level of trust and knowledge in the traditional channel (through their Crop Advisor).
They further indicated that they would continue in the future to procure their Crop
Protection Inputs through this channel, compared to the other segments. The traditional
channel and business model (although required to be tweaked concerning the business
proposal) would be the choice for the Medium- and Large Commercial Growers Segment.
0.00 1.00 2.00 3.00 4.00 5.00 6.00
Traditional Channel through Crop Advisor…
Split Advice and Product - pay separate for advice…
Direct from Crop Protection Manufacturer (i.e. Basf,…
Direct from Crop Protection Supplier (i.e. InteliGro,…
Direct through Buying Group
Direct from Cooperative / Agricultural Business (i.e.…
E-commerce (online platform i.e. Takealot)
Future channel procurment of Crop Protection Inputs per Segment
Corporate Agri-Business Mega-sized Commercial Growers
Medium- and Large sized Commercial Growers

106
4.2.3 Research Proposition 4
The Research Proposition supporting the deductive theory of the relationship between
practice, theory and research for this study is:
Research
Proposition 4:
Research data, technology and industry-related
information, play a significant role in the buying decision-
making processes in certain customer segments and are of
lesser importance in other customer segments.
4.2.3.1 Literature Study
The Fourth Industrial Revolution (4IR) has been characterised by the fusion of the digital,
biological, and physical world. There is a growing acceptance and utilisation of Artificial
Intelligence, cloud computing, robotics, Blockchain, and Internet of Things, among others.
The 4IR is now an inescapable reality which promises to benefit us all, not only from a
technological perspective, but also regarding aspects which include energy, environment,
economics, policy, consumer, and social changes as active drivers of a definite future
towards change (Ungerer et al., 2018).
The agriculture sector is set to benefit from the 4IR, to enable the agricultural sector to
transform into an “Agri-Renaissance”. Technology which will benefit growers includes
farm-management software, precision agriculture, predictive data analytics, and predictive
gene analytics. Growers will be able to monitor the health of their crops, as well as the
weather and their soil quality using robotics and drones. All these technologies are
developed to enable the growers to increase their yields, reduce their costs and improve
the nutritional value of the food they produce (Ungerer et al., 2018).
The COVID pandemic has also taught the world to look increasingly different at the
adoption of technology where Virtual Field Days and Virtual Conferences can be held
without the prior models of face-to-face field days and conferences. Especially Crop
Protection Distributors need to think differently about how they will differentiate their
solution in an ever-changing, technology-adapted world with positive appetite.

107
4.2.3.2 Analysis of results
Figure 1.15 refers to the importance of each of the segments with specific reference to
technology (i.e., disease forecasting models, electronic monitoring) in their decision-
making towards procurement of Crop Protection Inputs. The mean scoring was out of 7,
where 7 represents “Extremely important”. The results indicate that for the Corporate Agri-
Business segment, this section and service offering is extremely important to their
decision-making, followed by the Mega-Sized Commercial Growers and of less importance
to the Medium- and Large Commercial Growers.
Figure 1.16 reflects the importance of each type of information available per segment. The
mean scoring was out of 7, where 7 represents “Extremely important”. The information
pattern follows that of technology, where the Corporate Agri-Business segment rated this
information as “very important” to “Extremely important” in their decision-making process
and solution offering.
4.2.3.3 Conclusion
The business model for the Corporate Agri-Business segment should include technology
and information as of the value proposition to this segment to be adopted by Crop
Protection Distributors. Mega-Sized Commercial Growers should also include an element
towards technology and information as part of their value proposition, however, it would
be advised that this would be customised in accordance to the specific need of that grower.

108
Figure 15: Technology level of importance per segment
Figure 16: Information per type level of importance per segment
4.8 5 5.2 5.4 5.6 5.8 6 6.2
Technology importance
Technology (i.e. disease forecasting, electronic monitoring) importance per segment
Corporate Agri-Business Mega-sized Commercial Growers
Medium- and Large Commercial Growers
- 1.00 2.00 3.00 4.00 5.00 6.00 7.00
Research Data - Intelekt Solutions, Answer Plots
Market Access - Minimum Residue Levels
Crop Specific Recommendations
Crop Manuals (Crop Physiology, Products registered)
Innovation Platform (similar to Grain SA)
Industry specific (i.e. potatoes)
Biological Solutions / Regenerative Agriculture
Personal account and Transactional information…
E-commerce platform to access data and information
Information types importance per segment
Corporate Agri-Business Mega-sized Commercial Growers
Medium- and Large Commercial Growers

109
4.2.4 Research Proposition 5
The Research Proposition supporting the deductive theory of the relationship between
practice, theory and research for this study is:
Research
Proposition 5:
An e-commerce business model should be implemented by
Crop Protection Distribution Companies.
4.2.4.1 Literature Study
It was noted in Chapter 1 that new start-ups have popped up, such as Farm Trade and
Farmers Business Network (FBN), where these companies sell products directly to
growers at a set cost via an e-commerce model. The business model has taken the space
of approximately 15% to 20% of a specific market segment where growers focused on the
lowest-cost provider (Sfiligoj, 2017).
It is assessed that the Amazon-type e-commerce model could occupy at least 10% of the
total market penetration and might fail on a large scale due to the demographics of the
market and its segments. It is further argued that this model might fail on a large scale as
Crop Protection Distributors still have an amount of knowledge and trust in agriculture
which will be required from growers.
Multiple Agricultural input suppliers and role players are building their network with
farmers, whether it’s through loyalty or access through digital platforms or marketplace
access (Seraphim, 2020a). In the journal article E-commerce in agriculture – The case of
Crop Protection product purchases in a discrete choice experiment, (Fecke et al., 2018)
indicated that there are several factors influencing e-commerce activities, namely:
• Price in e-commerce: where it was found that growers are willing to buy on an e-
commerce platform should there be a significantly lower price.
• Trust in e-commerce: as a significant contributor to the willingness to buy on an e-
commerce platform, the trust in the channel and the supplier from the e-commerce
plays a significant role whether growers will buy from the e-commerce site or not.
We identified earlier that there is still a significant level of trust and knowledge in
the Crop Protection Distributor level, which will have a direct impact on the
willingness of the grower to go the e-commerce way.

110
• Service quality in e-commerce: it was noted that in line with trust, the agricultural
sector prefers personal consultation and interaction, which reduces their appetite
towards e-commerce.
• Delivery time in e-commerce: was noted as a significant factor, especially
regarding machine parts. It was Research Propositioned that, should delivery time
be improved and shortened, the willingness to accept the e-commerce model
would increase.
• Risk aversion of consumers and e-commerce: the study indicated that the risk
aversion of each consumer or grower has a direct impact on the willingness to buy
on an e-commerce platform.
• Prior experience with e-commerce: has a direct link in agriculture towards a
willingness to buy on an e-commerce platform, based on prior experience (good or
bad) (Fecke et al., 2018).
In a Croplife 100 survey dated back in 2017, respondents indicated that e-commerce was
a major threat to the Crop Protection Distribution Industry. However, in the 2019 Croplife
100 survey, 78% of the respondents indicated that it was a minor threat (Sfiligoj, 2020).
The report further states that the threat has subsided significantly because Crop Protection
Distributors have embraced the concept itself, with the launch of platforms like
CommoditAg. The success remains according to the report that Crop Protection
Distributors accessed the form of trust and knowledge (some of the concerns noted above)
and created the platform themselves with the sound recommendation, reputation, brand
and trust to mitigate the risk (Sfiligoj, 2020).
4.2.4.2 Analysis of results
Our analysis of the results supports our earlier assessment that the e-commerce space in
the market will not have a significant role, and although minimal, will only apply to a certain
segment or certain needs and wants of a grower at a specific time or period.
Table 70: E-Commerce option (Yes / No)
Corporate Agri-Business
Mega-Sized Commercial Growers
Medium- and Large Commercial Growers
Yes No Yes No Yes No
Frequency 3.0 9.0 18.0 29.0 18.0 30.0
Per cent 25.0 75.0 38.3 61.7 37.5 62.5

111
The above table presented the range of the segments in which we identified that between
25% to 38% of respondents would consider procuring products using an e-commerce
platform. We also requested the respondents to provide us with the primary reasons why
they would use such a platform to procure Crop Protection Inputs.
Table 71: Segment-specific primary reasons for procuring crop protection
products through e-commerce model
Corporate Agri-Business Mega-Sized Commercial Growers
Medium- and Large-sized Commercial growers
Mean Standard
Deviation Rank Mean Standard
Deviation Rank Mean Standard
Deviation Rank
Bargain-hunting 3.60 2.63 3.00 3.70 2.61 2.00 3.29 2.55 3.00
Transaction (product focus)
4.00 2.36 2.00 3.65 2.57 4.00 3.51 2.33 2.00
Benchmarking 4.10 2.38 1.00 4.11 2.65 1.00 3.83 2.57 1.00
Convenience 3.40 2.17 4.00 3.67 2.58 3.00 3.22 2.34 4.00
Current channel / model not optimal
1.90 1.10 6.00 2.64 2.14 6.00 2.39 1.91 6.00
Other value chain activities (i.e. insurance, technology, seed, fertilizer)
2.70 2.06 5.00 3.00 2.27 5.00 2.88 2.03 5.00
The results above for all the questions from a means are all low compared to the most
relevant scoring means of 7. Should this model be accepted and implemented in the future
by Crop Protection Distributors, the purpose thereof, according to the respondents (all
three segments agree), is that it would be most relevant and ranked below:
• Price benchmarking (price in e-commerce)
• Bargain hunting (price in e-commerce)
• Transaction/product focus (price in e-commerce)
• Convenience (delivery and service in e-commerce)
4.2.4.3 Conclusion
In a whitepaper published by (ProAgrica, 2020b), Engaging growers to Demonstrate
Value, the whitepaper paints a picture that growers’ preference is changing rapidly and
that the e-commerce model might be a phase in an ideal scenario. However, they continue
to present the case that growers are not seeking from their “trusted advisor” and suppliers
a seamless end-to-end solution of product research, advice, discovery and purchase.

112
Crop Protection Distributors who are willing to embrace digital tools, which are driven and
backed by sound agronomic and product knowledge, fostering the strength of their existing
trust relationships, and honing on local expertise, should see the application of digital tools
as the opportunity of a generation.
It would be suggested that Crop Protection Distributors (with specific reference to
InteliGro) should create an integrated, end-to-end data exchange and interaction platform
with growers which present the characteristics of online shopping. Furthermore, including
good engagement, a “banking system with a history of transactions”, access to their
agronomic data, product data, account balances, and payment records, to enable the
grower to experience a virtual contact with the Crop Protection Distributor. A platform with
these characteristics should address the concerns noted above in the journal article by
(Fecke et al., 2018).
Research Proposition 5 is partially proven, where the e-commerce platform should not
necessarily only create an environment of buying online but should include the
characteristics above.
4.2.5 Research Proposition 6
The Research Proposition supporting the deductive theory of the relationship between
practice, theory and research for this study is:
Research
Proposition 6:
The business models will differ per customer segment based
on the needs and wants of each of the customer segments.
4.2.5.1 Literature Study
Our literature study revealed that numerous challenges exist in relation to agriculture,
growers, the Crop Protection Industry and Crop Protection Distributors.
The theme of sustainability, adaptability, value innovation, technology and efficiency
amidst the challenges pulls a golden thread through the study to address food security in
an environmentally conscious, friendly and responsible manner.

113
In a VUCA (Volatile, Uncertain, Complex, Ambiguous) world, quoting Darwin, only the
smallest, most agile and most adaptable to change will be those who survive.
The profile of the consumer is ever-changing, and so the grower will be ever-changing to
address those specific needs. In that context, all input suppliers and especially Crop
Protection Distributors need to change to meet those needs and wants.
4.2.5.2 Analysis of results
Our results have identified, and the Research Propositions proved that:
• The needs and wants of each of the grower segments, namely Corporate Agri-
Business, Mega-Sized Commercial Growers and Medium- and Large-sized
Commercial growers differ based on the demographics, size, legalised structure,
ownership % and crops cultivated.
• The buying decision of Crop Protection Products and the main factors which
influence their decisions will rank differently based on priority per segment.
• The traditional business model will only apply to some extent to the Medium- and
Large Commercial Growers Segment and that work needs to be done on the
Commercial offering and business proposal in this segment.
• Research data, technology and industry information play a significant role in the
Corporate Agri-Business segment, and to a lesser extent, although still with some
applicability towards the Mega-Sized Commercial Growers.
• The e-commerce business model should be revisited to include a fully integrated
end-to-end data platform which can be implemented.
4.2.5.3 Conclusion
In conclusion, based on the Research Propositions proved above, that specific business
models should be developed for each grower segment based on that segments’ particular
needs and wants.
4.3 RECOMMENDATIONS
We have arrived at the conclusion that optimal business models should be developed that
are segment-specific based on the segment’s specific needs and wants. These business
models will be required to be implemented by Crop Protection Distributors (more
specifically InteliGro) to remain relevant in creating value for each of these segments.

114
The business models for each of the segments, comparing it with the current business
model as a basis for InteliGro, will be presented per segment in the table below and
combined with the Omni-channel marketing recommendation.
4.3.1 Omni-channel marketing
How Crop Protection Distributors engage with their growers in the future will depend to
which extent the Crop Protection Distributor will remain sustainable and relevant in the
future. Crop Protection Distributors need to show their value to growers as we have seen
in the study above. Multiple segments require different business proposals and the
decision to buy from a Crop Protection Distributor will depend on how they can address
those specific needs and wants. Crop Protection Distributors in the past (traditional
business model) engaged their growers primarily through the Crop Advisor, and possible
disparity or bias could have been formed as to the actual needs and wants of each of those
grower segments. It is noteworthy that the channels/growers continuously evolve.
It is recommended that InteliGro implement an Omni-channel marketing system, where
growers will be able to move through various channels of specific business proposals,
pricing policy, access to technology, information, factors impacting their decisions,
agronomic data, and service levels they require from whom, at any stage. The integration
of data (history, current) on one platform is crucial and an unavoidable prerequisite in the
future, from a CRM to inventory, to agronomic data to pricing (ProAgrica, 2020b).
4.3.2 Omni-channel defined
It refers to a cross-channel content strategy which creates an improved customer
experience at each channel, and through this drive improve customer relationships.
Channels refer to traditional (physical) and digital (Becker, 2016). In the case of InteliGro,
these channels will be the grower segments as defined.
4.3.3 Omni-channel Marketing Definition:
It refers to a multi-channel sales approach, where each channel works together to create
an integrated, interdependent, and consistent brand experience. The goal is for the
customer to have a seamless experience when shopping, whether it’s online, mobile,
brick-and-mortar, inspections or physical visits (Becker, 2016). The strategy
acknowledges that the grower has ready access to information.

115
• The objective of creating an Omni-channel marketing strategy is to develop grower
segment-specific business models and solutions offering to ensure direct market
access, increased market share, increased grower satisfaction and to
counter anticipated competitor strategies.
• The Omni-channel focuses on the customer-first and the segment-specific models,
which will be developed based on the specific grower’s needs and wants.
The Omni-channel marketing per segment is presented in the table below, summarised
per segment based on the study (which integrates all the data gathered during the study).

116
Table 72: Omni-channel marketing: per segment based on the study results
Category CORPORATE AGRI-BUSINESSES
MEGA-SIZED COMMERCIAL GROWERS
MEDIUM- & LARGE SIZED COMMERCIAL
GROWERS
Description Large scale farming with value chain integration. Corporate business structure.
Large scale farming with value chain integration. Management structure and strong owner involvement.
Medium- & large-scale farming with no value chain integration. Majority of owner-managed units.
Positional decision-makers Managerial / Director level Owner / Management Owner / Management
Legalised structure Company / Agricultural Businesses
Various Various
Ownership structure Majority 100% owned + external shareholding
Majority 100% owned - limited external shareholding
Majority 100% owned - limited external shareholding
External shareholding Significant if applicable Varies Limited
Foreign shareholding Varies Limited Limited
BBBEE shareholding Varies Limited & exploratory Limited
Demographics Multiple farms in different geographical regions, mainly in one province, although multiple provinces also applicable.
Operation mainly in one province, with limited extension to other provinces - exploratory to National.
Local, geographical area.
Crop cultivation Diversified, multiple crops, majority irrigation and export orientation
Diversified, multiple crops, sustainable
Mainly one crop dimensional, Diversification exploratory
Finance activities Cash-rich, own funding majority & utilisation of financial institutions.
Less cash-rich, combination of own, financial institutions and Agricultural Business (VKB, Senwes).
Cash-tight, close relationship with Agricultural Business (VKB, Senwes) and Financial Institutions.
Crop Protection Channel purchases
Majority National Distributors, multiple channels and partners
Majority National Distributors, limited other channels and partners
Mainly through one Crop Protection Supplier
Channel procurement preference
Crop Protection Supplier (less dependence on Crop Advisor)
Crop Protection Supplier (Main) and Crop Advisor (Support)
Crop Advisor (Main) and Crop Protection Supplier (Support)
Crop Protection purchases > R10,0 MIO <R10,0 MIO R2,0 - R10,0 MIO
Scale MEGA. OWN DECISION-MAKING, Less tender - no buying group.
LARGE TO MEGA, strong involvement by owner/managing director in decision-making, the higher trend towards tender and buying groups.
Average, own decision-making, less tender and buying group orientated.
Profile Buying decisions typically made by managers/directors rather than owners. Business orientated & strong differentiation. Buy direct from Crop Protection Supplier - negotiation required.
Buying decisions typically made by owners/directors/management. Business Orientation, buying directly from Crop Protection Suppliers - an investigation into other channels - exploratory towards manufacturers and Agricultural Businesses.
Owner= Grower= Decision maker. Entrepreneurial, Innovative, Progressive & Diversification exploration. Relational focus on Crop Advisor and Crop Protection Supplier channels.

117
Category CORPORATE AGRI-BUSINESSES
MEGA-SIZED COMMERCIAL GROWERS
MEDIUM- & LARGE SIZED COMMERCIAL GROWERS
Main factors for impacting buying decisions
Quality Product Quality product Quality Product
Market Access Support Relationship, trust and advice of Crop Advisor
Relationship, trust and advice of Crop Advisor
Logistical efficiency / Bulk Price Price
Traceability of product Market Access Support Technical Support / Expertise
Supplier Support Technical Support / Expertise Advice received from Independent Advisor
Price Logistical efficiency / Bulk Market Access Support
Integrated Pest Management Supplier Support Logistical efficiency / Bulk
Relationship, trust, the brand of Crop Protection Supplier
Biological Solutions Complete Crop Solution
Advice received from Independent Advisor
Traceability of Product Relationship, trust, the brand of Crop Protection Supplier
Complete Crop Solution Technology (i.e. Disease Forecasting)
Biological Solutions
Service Crop Advisor - logistics - ad-hoc
Crop Advisor - Weekly Crop Advisor - Weekly
Crop Specialist - Weekly Crop Specialist - Monthly Crop Specialist - monthly
Technical Advisors/consultants - weekly
Technical Advisors / Consultants - Monthly
Technical Advisors / Consultants - Ad-hoc
Key Account Managers - Monthly
Key Account Managers - Annually
Key Account Managers - Annually/Ad-hoc
PRICE POLICY
Customised Solution Market-Related Market-Related & price benchmarking
Price Benchmarking Price Benchmarking Price Benchmarking
BUSINESS PROPOSAL Discount on Volumes Discount on Volumes Business Terms
Discount on Cash Payments Business Terms Discount on Volumes
Business Terms Guarantee on Claims Made from Recommendation
Discount on Cash Payments
Guarantee on Claims Made from Recommendation
Rebates Guarantee on Claims Made from Recommendation
Bulk Container Purchases Bulk Container Purchases Rebates
Loyalty Programmes

118
Category CORPORATE AGRI-BUSINESSES
MEGA-SIZED COMMERCIAL GROWERS
MEDIUM- & LARGE SIZED COMMERCIAL GROWERS
Technology EXTREMELY IMPORTANT IMPORTANT SOMEWHAT IMPORTANT
Channel Crop Protection Supplier + Independent / Technical
Crop Protection Supplier + Crop Advisor
Crop Advisor + Crop Protection Supplier
Information (as per priority)
Crop Specific Recommendations
Crop Specific Recommendations
Crop Specific Recommendations
Industry-specific (i.e. potatoes)
Biological Solutions / Regenerative Agriculture
Biological Solutions / Regenerative Agriculture
Crop Manuals (Crop Physiology, Products registered)
Industry-specific (i.e. potatoes) Market Access - Minimum Residue Levels
Market Access - Minimum Residue Levels
Personal account and Transactional information platform (current and history)
Research Data - Intelekt Solutions, Answer Plots
Research Data - Intelekt Solutions, Answer Plots
E-commerce platform to access data and information
Industry-specific (i.e. potatoes)
Loyalty programs
Internal - sharing goodness NO YES YES
Suppliers – rebates NO YES YES
4.3.4 Value innovation
We highlighted in the literature study the importance of value innovation and latest updated
Blue Ocean Strategy for Crop Protection Distributors to address their major threat of
profitability. The value gap exists in the current Red-Ocean Strategy, where services and
products from Crop Protection Distributors, as well as the marketing strategy/business
model to growers, are perceived as commoditised.
Crop Protection Distributors need to demonstrate value on grower level to address the
value gap (moving from the current Red Ocean Strategy moving towards Blue Ocean
Strategy). The Blue Ocean represents value innovation and includes all those factors to
differentiate one Crop Protection Distributor from the Red Ocean competitor.
The Omni-channel marketing approach to be adopted by InteliGro is one of the
differentiating factors and Blue Ocean Strategy tools to be implemented. We continue to
propose the following for consideration to be implemented by InteliGro as additional
differentiating factors (Seraphim, 2020b):

119
Table 73: Phase 1: Value innovation: services implementation
Service Description
Technical
Assistance
Crop Inputs: Highly technical and requires proper recommendations
Output: Invest in the technical team to have the best professionals; some
companies charge for technical assistance provided while distributors give it
for free.
Product Delivery
Logistics
Input: Grower wants the product in good condition and available at the right
time
Output: Capture synergies with growers – seen in the results – bulk/logistics
is an offering expected by growers, more so in the Corporate Agri-Business
segment, but also present in the other segments.
Precision
Agriculture
Input: Product and recommendation combined
Output: Regulation and precision of crop inputs application. Use these tools to
drive operational efficiency and assertiveness in recommendations. These
services are disconnected from the offer of products. These tools need to be
used for an improved offer/recommendation.
Crop Insurance Input: Climate change and adverse factors
Output: Collaboration with crop insurance companies to provide an offer
combined with own Product/Solution offering.
Weather Stations Input: Access to data
Output: Sale of information (not equipment) and connecting information
between Distributor and Grower to mitigate risk and capture value.
The above services, presented as Phase 1, are advised to be implemented as Priority 1,
within the next 12 months to capture value innovation.

120
The next phase can be considered by InteliGro within the following 12 to 36 months.
Services to be implemented:
Table 74: Phase 2: Value innovation: services implementation
Service Description
Soil and tissue
sampling and labs
Input: Understanding the behaviour of soil and leaves
Output: Collaboration with companies to provide these services combined with
InteliGro Crop Solutions.
Custom application Input: Farmers prefer owning their traditional equipment
Output: Collaboration with aerial applications/drones to improve efficacy.
Administrative and
financial
management tools
Input: Information available at Distributor level of transactions and history of
grower
Output: Providing this data and access to growers on an online platform – see
how reliant we are on our Banks for this information.
Commercialisation
services
Input: Grower needs access to market – see the role of Cooperatives
Output: Distributors’ involvement to assist growers with selection,
classification, standardisation, and commercialisation of their products.
Marketplace Create an Integrated, end-to-end data exchange and interaction platform with
growers which presents the characteristics of online shopping, good
engagement, a “banking system with a history of transactions”, access to their
agronomic data, product data, account balances, and payment records.
Enabling the grower to experience virtual contact with the Crop Protection
Distributor. A platform with these characteristics should address the concerns
noted above in the journal article by (Fecke et al., 2018).
Intelligent irrigation Input: Management of water resources is crucial for the sustainability of our
planet and growers
Output: Collaboration with selected suppliers as an integral part of Complete
Crop Solution.
Services for
certification,
traceability, and sale
of carbon credits
Input: Opportunistic market opportunities to address consumer demand for
safer, more transparent, traceable, greener products
Output: Traceability of product for two of the segments were of critical
importance; develop a tool that demonstrates product traceability and
production sustainability.
Sensors and
Instruments for
predictive analysis
Input: Tools required to increase productivity, risk mitigation and increase
sustainable efficiency
Output: Collaboration with selected suppliers as an integral part of Crop
Solution Offering.

121
4.4 LIMITATIONS OF THE STUDY
Research in its nature is not faultless and has its limitations, as well as suggestions which
will be required to be made. These aspects should be examined to determine their possible
influence on the results presented (Burns & Bush, 2014). The limitation of the empirical
study is presented below.
Demarcation of study: This study only focused on the business model for InteliGro-specific
growers in their database and did not include all growers in South Africa.
4.5 AREAS FOR FUTURE RESEARCH
We noted above that the study is limited only to the responses received from growers
within InteliGro specifically, and that future studies should extend to the rest of South
Africa. Although we do view that the responses on the needs and wants fairly present the
views of the majority segments, some additional information might become available.
Other segments, such as Cooperative Purchases and buying groups, were not covered
during this study. It is recommended that a survey of the needs and wants of those
segments continue in the future to develop business models for Crop Protection
Distributors in those segments.
We conclude that these are only proposed business models to be implemented. Future
research would be required to determine whether these specific business models per
segment was successful or not.
4.6 SUMMARY
The study aimed to develop segment-specific business models for Crop Protection
Distributors in South Africa. The results concluded that each grower segment has a
different profile, and based on that specific profile, their needs and wants concerning
factors impacting their buying decision, rating of services provided, the importance of
access to technology and detailed information and possible future channels in the
procurement of Crop Protection Inputs differ.

122
The study was able to propose segment-specific business models for the Corporate Agri-
Business, Mega-Sized Commercial Grower and Medium- and Large-sized Commercial
Grower segments based on their specific needs and wants. These business models were
presented in a comprehensive Omni-channel marketing strategy which should be adopted
by InteliGro.
The study also concluded that, should a Crop Protection Distributor consider developing
an e-commerce platform to sell its products, it would be suggested that Crop Protection
Distributors (with specific reference to InteliGro) should rather create an integrated, end-
to-end data exchange and interaction platform with growers. Additionally, the platform
should present the characteristics of online shopping, good engagement, a “banking
system with a history of transactions”, access to their agronomic data, product data,
account balances, and payment records, to enable the grower to experience a virtual
contact with the Crop Protection Distributor. A platform with these characteristics should
address the concerns noted above in the journal article by (Fecke et al., 2018).
The study concluded in its final recommendation to InteliGro which services should be
considered to be investigated and implemented in two phases (Phase 1 focusing on the
next 12 months, and Phase 2 focusing on the next 12 to 36 months). We believe that the
recommendations would create a value innovation (Blue Ocean) Strategy for InteliGro to
address the threat of its profitability and to create an environment of uncontested
differentiation.

123
REFERENCES
Adas. 2016. The Impact Of The Neonicotinoid Withdrawal On The Eu Oilseed Rape And
Maize Industries. Gol, 1:798.
Africa, D.O.S.S. 2018. Stats Sa Set To Conduct Census Of Commercial Agriculture 2017
(Coca). Http://Www.Statssa.Gov.Za/?P=11611 Date Of Access: 8 October 2020.
Allen, P.M. 2001. A Complex Systems Approach To Learning In Adaptive Networks.
International Journal Of Innovation Management, 5(2):149-180.
Becker, M. 2016. What Is Omnichannel Marketing? A Guide For Success
Https://Emarsys.Com/Learn/Blog/Multi-Channel-Marketing-Omnichannel/ Date Of
Access: 3 October 2020.
Bryman, A., Bell, E., Hirschsohn, P., Dos Santos, A., Du Toit, J., Masenge, A. & Wagner,
C. 2014. Research Methodology: Business And Management Context. Cape
Town: Oxford University Press Southern Africa.
Budzynski, D.J. 2020. 5 Reasons Why Agriculture Is In Worse Shape Than You Think.
Https://Www.Croplife.Com/Management/5-Reasons-Why-Agriculture-Is-In-
Worse-Shape-Than-You-Think/ Date Of Access: 8 October 2020.
Burgi, P. & Victor, B. 2004. Case Study: Modeling How Their Business Really Works
Prepares Managers For Sudden Change. Strategy & Leadership, 32(2):28.
Burns, A.C. & Bush, R.F. 2014. Marketing Research. 7th. Essex: Pearson Education.
Burrell, G. & Morgan, G. 1979. Sociological Paradigms And Organisational Analysis.
London: Heinemann.
Carroll, M. 2017. Industry Leaders Concerned On Glyphosate And Industry Investment
[Personal Interview]. November 08.
Chan Kim, W. & Mauborgne, R. 1997. Value Innovation: The Strategic Logic Of High
Growth. Harvard Business Review, January-February: 103-112.
Chan Kim, W. & Mauborgne, R. 2005a. Six-Path-Framework.
Https://Www.Blueoceanstrategy.Com/Tools/Six-Paths-Framework/ Date Of
Access: 8 October 2020.
124
Chan Kim, W. & Mauborgne, R. 2005b. Value Innovation: A Leap Into The Blue Ocean.
Journal Of Business Strategy, 26(4):22-28.
Chania, M.A.I. 2015. Technology Transfer As A Driver Of Innovative Entrepreneurship.
Wageningen: European Association Of The Agricultural Economists.
Chesbrough, H. & Rosenbloom, R.S. 2000. The Role Of The Business Model In Capturing
Value From Innovation: Evidence From Xerox Corporation’s Technology Spinoff
Companies. Boston, Ma: Xerox Corporation.
Clienies-Ross, T. & Hildyard, N. 2013. The Politics In Industrial Agriculture. Abingdon:
Fram Foundation.
Crotty, M. 1998. The Foundations Of Social Research. London: Sage.
Denyer, D. & Tranfield, D. 2009. Producing A Systematic Review. In. The Sage Handbook
Of Organisational Research Methods. London: Sage. Pp. 671-689.
Denzin, N.K. & Lincoln, Y.S. 2011. Introduction: The Discipline And Practice Of Qualitative
Research. In. The Sage Handbook Of Qualitative Research. 4th Ed. London: Sage.
Pp. 1-19.
Easterby-Smith, M., Thorpe, R., Jackson, P. & Lowe, A. 2012. Management Research.
London: Sage.
Edwards, P., Roberts, I., Clarke, M., Di Giuseppe, C., Pratap, S., Wentz, R. & Kwan, I.
2002. Increasing Response Rates To Postal Questionnaires: Systematic Review.
British Medical Journal, 324:1183-1191.
Fecke, W., Danne, M. & Musshoff, O. 2018. E-Commerce In Agriculture – The Case Of
Crop Protection Product Purchases In A Discrete Choice Experiment. Computers
And Electronice In Agriculture, 151:126-135.
Food And Agricultural Organisation (Fao). 2017a. The Future Of Food And Agriculture:
Trends And Challenges. Rome: Fao
Food And Agricultural Organisation (Fao). 2017b. Inclusive Business Models. Rome: Fao.
Food And Agricultural Organisation (Fao), R. 2017c. The Future Of Food And Agriculture:
Trends And Challenges. Rome. Http://Www.Fao.Org/3/A-I6583e.Pdf Date Of
Access: 8 October 2020.

125
Frabotta, D. 2015. 10 Crop Protection Trends For 2015.
Https://Www.Agribusinessglobal.Com/Agrochemicals/10-Trends-For-2015/ Date
Of Access: 8 October.
Frabotta, D. 2020a. 2020 Agribusiness Global State Of The Industry: Coronavirus Creates
New Normal For Purchasing Terms, Automation.
Https://Www.Agribusinessglobal.Com/Agrochemicals/2020-Agribusiness-Global-
State-Of-The-Industry-Coronavirus-Creates-New-Normal-For-Purchasing-Terms-
Automation/ Date Of Access: 8 October 2020.
Frabotta, D. 2020b. 8 Ways 2020 Will Affect 2021 In Global Agribusiness.
Https://Www.Agribusinessglobal.Com/Agrochemicals/A-Look-Back-With-An-Eye-
Forward-How-2020-Will-Affect-2021-In-Global-Agribusiness/ Date Of Access: 5
December 2020.
Gill, J. & Johnson, P. 2010. Research Methods For Managers. 4th Ed. London: Sage.
Harbour, V. 2018. 2017 Victor Harbour Agribusiness Survey: Key Findings Report. Victor
Harbour: City Of Victor Harbour.
Heacox, L. 2017. The Future Direction For Ag Retail.
Https://Www.Croplife.Com/Management/Future-Direction-Ag-Retail/ Date Of
Access: 12 October 2020.
Jia, H. 2020. Merger Of Sinochem And Chemchina, Long Rumoured, Is Confirmed.
Https://Cen.Acs.Org/Business/Mergers-Acquisitions/Merger-Sinochem-
Chemchina-Long-Rumored/98/I35 Date Of Access: 11 September 2020.
Kim Chan, W. & Mauborgne, R. 2005. Red Ocean Strategy Vs Blue Ocean Strategy.
Https://Www.Blueoceanstrategy.Com/Tools/Red-Ocean-Vs-Blue-Ocean-Strategy/
Date Of Access: 8 October 2020.
Kim, R., Ruster, W. & Eggeling, H. 2017. The Cumulative Agronomic And Economic
Impact Of Glyphosate In Europe. Uk. Www.Stewardredqueen.Com Date Of
Access: 8 October 2020.
Kingsley, N.O. 2016. A Business Model For Sustainable Smme Pig Farming In The Central
Free State Of South Africa. Bloemfontein: Central University Of Technology.

126
Lamb, C.W., Hair, J.F.J., Mcdaniel, C., Boshoff, C., Terblanche, N., Elliot, R. & Klopper,
H. 2019. Segmenting And Target Markets. In: Learmont, G., Ed. Marketing. 6th Ed.
Cape Town: Oxford University Press Southern Africa. P 210.
Laplaca, P. 2014. Advancing Industrial Marketing Theory: The Need For Improved
Research. Jounal Of Business Marketing Management, 7:284-288.
Laplaca, P. & Da Silva, R.V. 2016. B2b: A Paradigm Shift From Economic. Psychology &
Marketing, 33(4):232-249.
Liu, S. 2015. Business Characteristics And Business Model Classification In Urban
Agriculture. Wageningen: Wageningen University.
Macharia, J., Collins, R. & Sun, T. 2013. Value-Based Consumer Segmentation: The Key
To Sustainable Agri Food Chains. British Food Journal, 115(9):1313-1328.
Magretta, J. 2002. Why Business Models Matter. Harvard Business Review, 80(5):86-92.
Olsson, R., Gadde, L.E. & Hulthén, K. 2013. The Changing Role Of Middlement - Strategic
Responses To Distribution Dynamics. Industrial Marketing Management, 42:1131-
1140.
Osterwalder, A., Pigneur, Y. & Tucci, C.L. 2005. Clarifying Business Models: Origins,
Present, And Future Concept. Communications Of Ais, 15:2-40.
Pandza, K. & Thorpe, R. 2010. Management As Design, But What Kind Of Design? An
Appraisal Of The Design Science Analogy For Management. British Journal Of
Management, 21(21):171-186.
Proagrica. 2019. Agribusiness Trends In 2019: What Do They Mean For Your Business
Future. (Proagrica White Papers).
Https://Proagrica.Com/Whitepapers/Agribusiness-Trends-In-2019-What-Do-They-
Mean-For-Your-Business-Future/ Date Of Access: 8 October 2020.
Proagrica. 2020a. Understaning The Barriers And Opportunities For Profitability In Ag
Retail. California. Https://Img04.En25.Com/Web/Proagrica/%7ba76304b9-6796-
4780-B2b1-
9f086a2d99a4%7d_4942_Proagrica_Profi.Pdf?Sfid=7011y00000251y4&
Cmpid=N/A|Glob|All|Profitability_Whitepaper|Pacom-2020-09-

127
Profitability_Whitepaper&Elqtrackid=20af36c0498e4aa0ac713a4afd8cd532&Elqa
id=620&Elqat=2 Date Of Access: 8 October 2020.
Proagrica. 2020b. Engaging Growers To Demonstrate Value: Proagrica.
Https://Secureforms.Proagrica.Com/Growerengagement?_Ga=2.217331094.103
5774872.1607542924-904111163.1606076517 Date Of Access: 8 October 2020.
Rasuli, B., Alipour-Hafezi, M. & Solaimani, S. 2015. Understanding Electronic Theses And
Dissertations Through A Business Model Perspective: The Case Of Irandoc Etds.
Iranian Journal Of Information Processing Management, 4(34):1455-1480.
Saunders, M., Lewis, P. & Thornhill, A. 2016. Research Methods For Business Students.
7th Ed. Essex: Pearson Education.
Schreuder, F.A. 2002. An Investigation Into Global Distribution Systems In The Crop
Protection Industry And The Development Of Distribution System Management
Models For Particular Application In South Africa And Australia. (Thesis - Phd).
Stelklenbosch: University Of Stellenbosch.
Seraphim, R. 2020a. Digital Transformation And Our Role As A Supplier Of Crop Inputs
And Technology For Farmers. Https://Www.Linkedin.Com/Pulse/Digital-
Transformation-Our-Role-Supplier-Crop-Inputs-Farmers-
Renato?Articleid=6677289780859994112 Date Of Access: 20 September 2020.
Seraphim, R. 2020b. The Brazilian Distributor Needs To Retake The Services Space Into
Its Business. Http://News.Agropages.Com/News/Newsdetail---37176.Htm Date Of
Access: 13 November 2020.
Sfiligoj, E. 2017. The Perfect Storm For Distribution Channel Change.
Https://Agrow.Agribusinessintelligence.Informa.Com/ Date Of Access: 26
September 2020.
Sfiligoj, E. 2020. Here’s Why E-Commerce Is No Longer A ‘Major Threat’ For Ag Retailers.
Https://Www.Croplife.Com/Croplife-Top-100/Heres-Why-E-Commerce-Is-No-
Longer-A-Major-Threat-For-Ag-Retailers/ Date Of Access: February, 3.
Sihlobo, W. 2020. South Africa Records A 5% Y/Y Increase In Agriculture Exports In Q3,
2020. Https://Www.Farmingportal.Co.Za/Index.Php/All-Agri-News/News-Of-The-
Day/5439-South-Africa-Records-A-5-Y-Y-Increase-In-Agriculture-Exports-In-Q3-
2020 Date Of Access: November, 23.

128
Stafford, J.V. 2000. Implementing Precision Agriculture In The 21st Century. Journal Of
Agricultural Engineering Research, 76(3):267-275.
Stähler, P. 2002. Business Models As An Unit Of Analysis For Strategizing. Proceedings
Of The International Workshop On Business Models, Lausanne, 4-5 October 2002.
Tamilia, R.D. & Charlebois, S.D. 2009. Wholesaling, The Role Of The Middleman And
Marketing Costs: Some Forgotten Concepts In Marketing Thought. Journal Of
Management Research, 1(E5):1-20.
Teicher, H. 2018. Opinion: Why The Crop Protection Industry Needs Strategic Vision.
Https://Agrow.Agribusinessintelligence.Informa.Com/ Date Of Access: 16 January
2020.
Ungerer, M., Bowmaker-Falconer, A., Oosthuizen, C., Phehane, V. & Strever, A. 2018.
The Future Of The Western Cape Agricultural Sector In The Context Of The Fourth
Industrial Revolution. Elsenburg: The Western Cape Department Of Agriculture.
Vermeulen, A.B. 2008. The Impact Of Changes In Corn Prices On Pesticide. Sandton:
Gordon Institute Of Business Science.
Vidickiene, D. & Gedminiate-Raudone, Z. 2018. Challenges For Agricultural Policy In The
Service-Driven Economic System. Economics Of Agriculture, 4(65):1545-1555.
Vidickiene, D., Gedminiate-Raudone, Z. & Simonaityté, V. 2019. Servitization Of Farming:
Business Model "Product Plus Service" In Luthuania. Lithuania: Lithuanian Institute
Of Agrarian Economics.
Wiebe, N.A., Desmarais, A. & Wittman, H. 2011. Food Sovereignty In Canada: Creating
Just And Sustainable Food Systems. Toronto: Fernwood.
Xie, C. 2017. The Increasing Demand For R&D Activities To Boost High-End Agrochemical
Cmo Industry. Https://Agrow.Agribusinessintelligence.Informa.Com/ Date Of
Access: 25 October 2020.

129
APPENDICES
APPENDIX A: ETHICS APPROVAL

130
APPENDIX B: LETTER OF CONSENT: ACCESS TO DATABASE

131
APPENDIX C: QUESTIONNAIRE

132

133

134

135

136
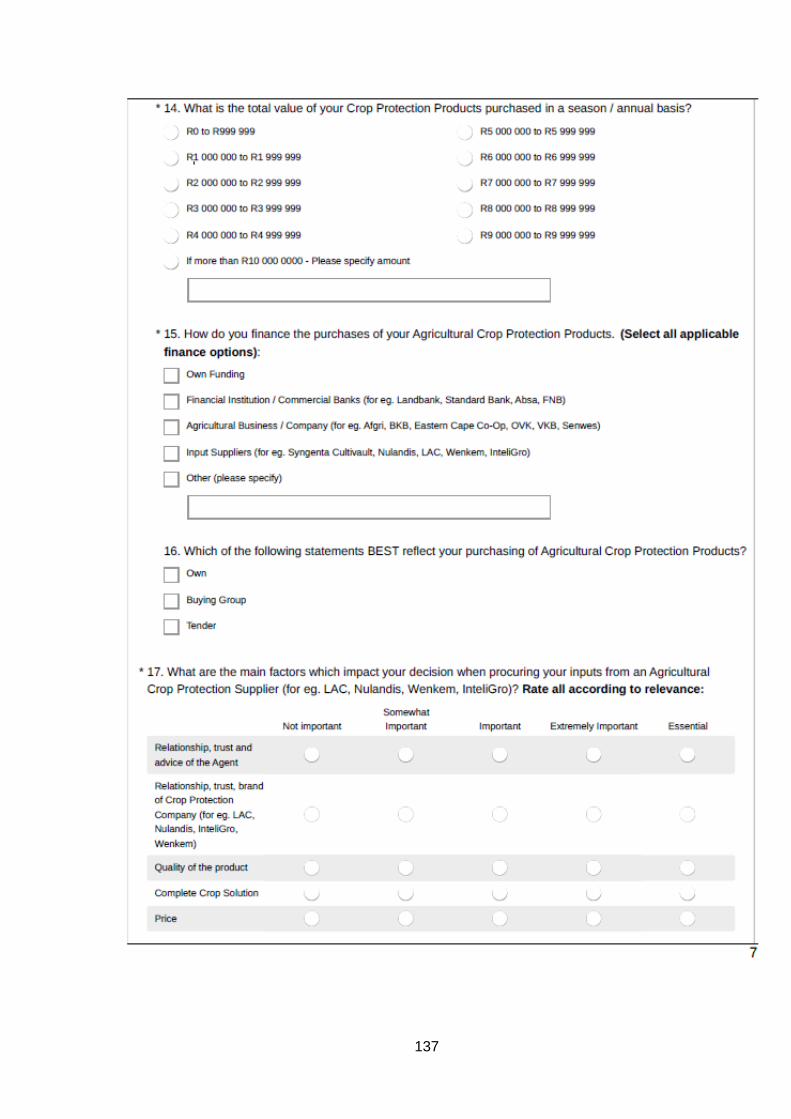
137

138

139

140

141

142

143

144

145
APPENDIX D: LANGUAGE EDITOR’S LETTER