annual general meeting of shareholders 2016 - randstad/media/files/r/randstad-ir-v2/results... ·...
TRANSCRIPT
Randstad Holding nv March 30, 2017
annual general meeting of shareholders supervisory board executive board
1

disclaimer & definitions
Certain statements in this document concern prognoses about the future financial condition, risks, investment plans and the results of operations of Randstad Holding and its operating companies, as well as certain plans and objectives. Obviously, such prognoses involve risks and a degree of uncertainty, since they concern future events and depend on circumstances that will apply then. Many factors may contribute to the actual results and developments differing from the prognoses made in this document. These factors include, but are not limited to, general economic conditions, a shortage on the job market, changes in the demand for personnel (including flexible personnel), achievement of cost savings, changes in the business mix, changes in legislation (particularly in relation to employment, staffing and tax laws), the role of industry regulators, future currency and interest fluctuations, our ability to identify relevant risks and mitigate their impact, the availability of credit on financially acceptable terms, the successful completion of company acquisitions and their subsequent integration, successful disposals of companies, and the rate of technological developments. These prognoses therefore apply only on the date on which this document was compiled. The quarterly results as presented in this press release are unaudited.
--------------------------------------------------------------------------------------------------------------
EBITA: operating profit before amortization and impairment acquisition-related intangible assets and goodwill, integration costs and one-offs.
organic growth is measured excluding the impact of currency effects, acquisitions, disposals and reclassifications.
diluted EPS is measured before amortization and impairment acquisition-related intangible assets and goodwill, integration costs and one-offs.
2
agenda
1. opening 2. review 2016 3. discharge of liability 4. shares 5. remuneration policy 6. external auditor 7. any other business 8. closing
3

agenda
1. opening 2. review 2016 3. discharge of liability 4. shares 5. remuneration 6. external auditor 7. any other business 8. closing
4

review 2016 operational performance & strategy
5
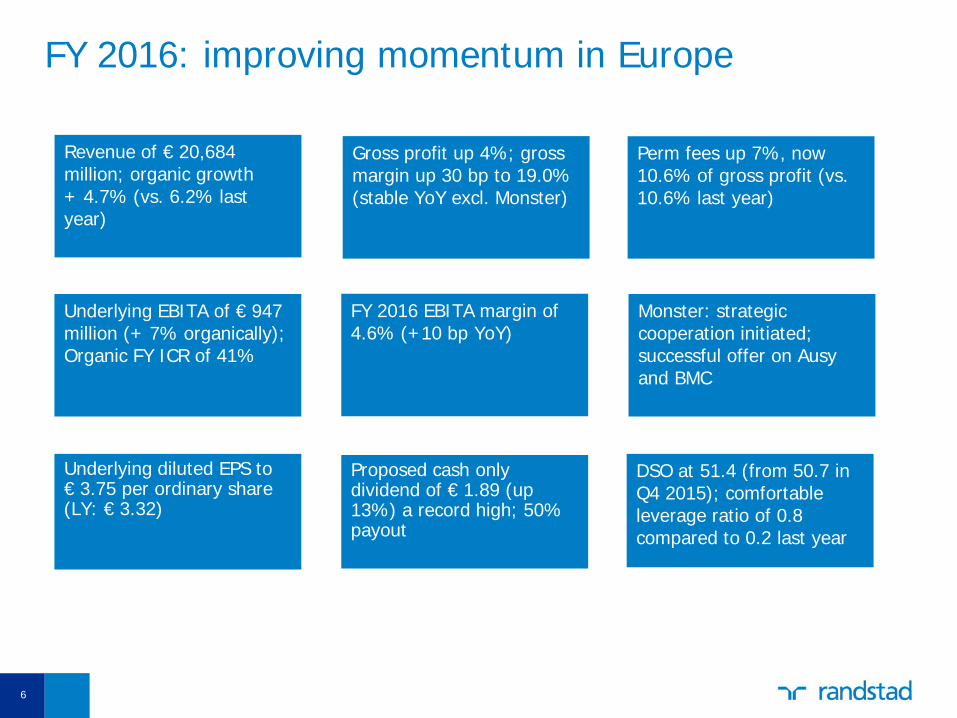
FY 2016: improving momentum in Europe
Proposed cash only dividend of € 1.89 (up 13%) a record high; 50% payout
DSO at 51.4 (from 50.7 in Q4 2015); comfortable leverage ratio of 0.8 compared to 0.2 last year
Monster: strategic cooperation initiated; successful offer on Ausy and BMC
Revenue of € 20,684 million; organic growth + 4.7% (vs. 6.2% last year)
Gross profit up 4%; gross margin up 30 bp to 19.0% (stable YoY excl. Monster)
Perm fees up 7%, now 10.6% of gross profit (vs. 10.6% last year)
Underlying EBITA of € 947 million (+ 7% organically); Organic FY ICR of 41%
FY 2016 EBITA margin of 4.6% (+10 bp YoY)
Underlying diluted EPS to € 3.75 per ordinary share (LY: € 3.32)
6

7
strong finish to 2016
YoY Randstad growth development
-15%
-5%
5%
15%
Group Europe North America Rest of World
improving growth in many European countries during 2H 2016; France, Germany, Italy & Iberia accelerating ahead of market in Q4
stable growth trends in North America throughout 2016; Canada outperforming market
strong second half growth shown in RoW
-40,0%
-30,0%
-20,0%
-10,0%
0,0%
10,0%
20,0%
30,0%
Q1'02 Q2'03 Q3'04 Q4'05 Q1'07 Q2'08 Q3'09 Q4'10 Q1'12 Q2'13 Q3'14 Q4'15
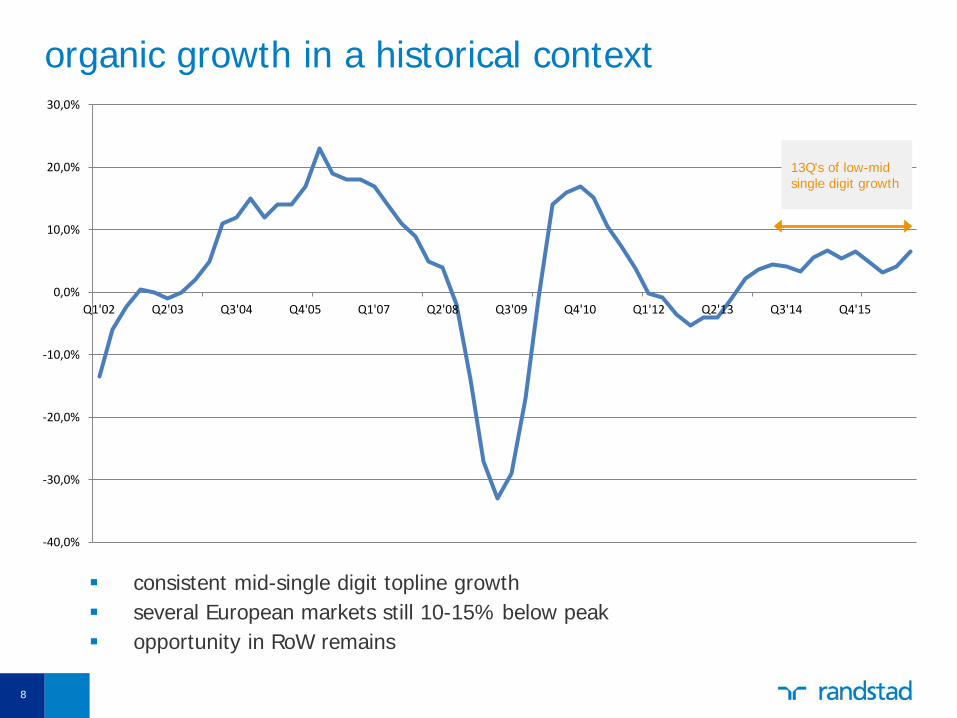
13Q's of low-mid single digit growth
organic growth in a historical context
consistent mid-single digit topline growth several European markets still 10-15% below peak opportunity in RoW remains
8
topline growth topline growth
9
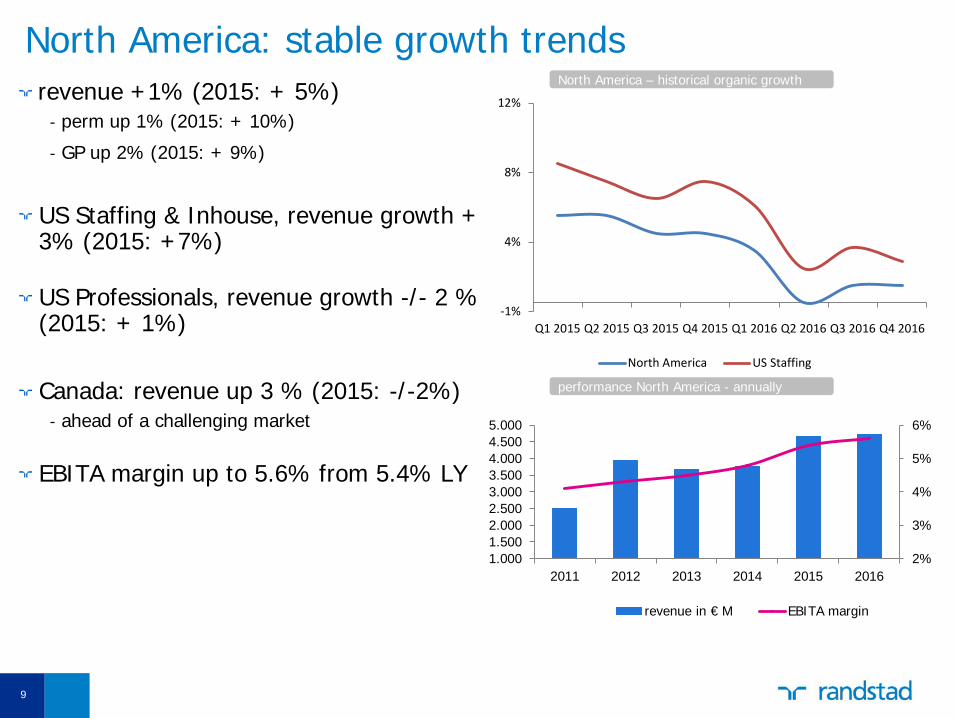
North America: stable growth trends
revenue +1% (2015: + 5%) - perm up 1% (2015: + 10%)
- GP up 2% (2015: + 9%)
US Staffing & Inhouse, revenue growth + 3% (2015: +7%)
US Professionals, revenue growth -/- 2 % (2015: + 1%)
Canada: revenue up 3 % (2015: -/-2%) - ahead of a challenging market
EBITA margin up to 5.6% from 5.4% LY
North America – historical organic growth
2%
3%
4%
5%
6%
1.0001.5002.0002.5003.0003.5004.0004.5005.000
2011 2012 2013 2014 2015 2016
revenue in € M EBITA margin
performance North America - annually
-1%
4%
8%
12%
Q1 2015 Q2 2015 Q3 2015 Q4 2015 Q1 2016 Q2 2016 Q3 2016 Q4 2016
North America US Staffing
10
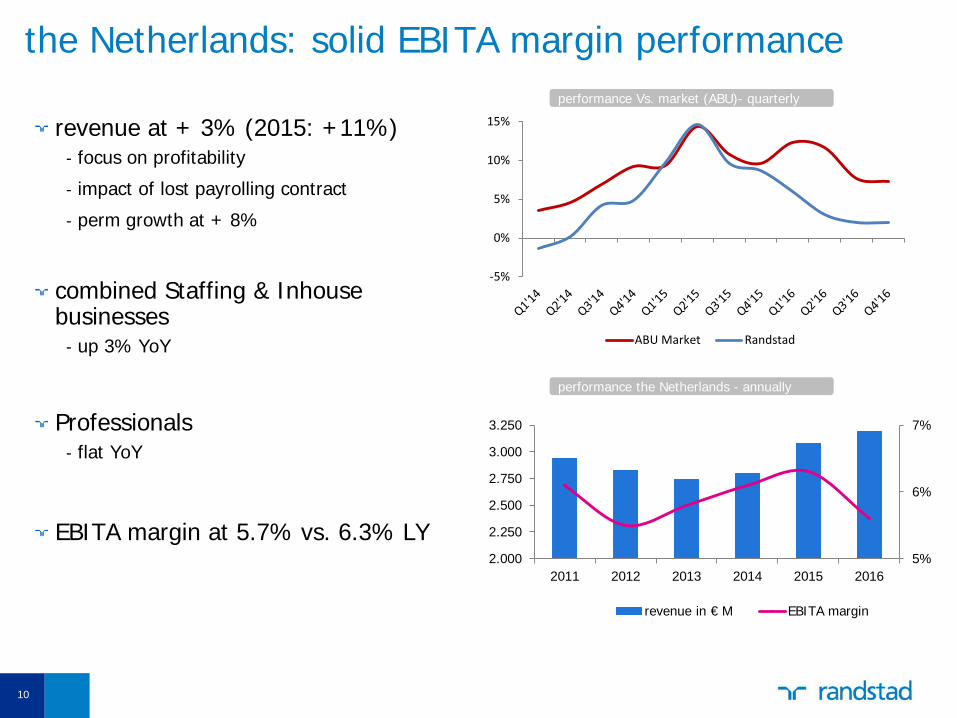
the Netherlands: solid EBITA margin performance
revenue at + 3% (2015: +11%) - focus on profitability
- impact of lost payrolling contract
- perm growth at + 8%
combined Staffing & Inhouse businesses
- up 3% YoY
Professionals - flat YoY
EBITA margin at 5.7% vs. 6.3% LY
performance Vs. market (ABU)- quarterly
5%
6%
7%
2.000
2.250
2.500
2.750
3.000
3.250
2011 2012 2013 2014 2015 2016
revenue in € M EBITA margin
performance the Netherlands - annually
-5%
0%
5%
10%
15%
ABU Market Randstad

11
France: accelerating topline through 2016
revenue up 7% YoY (2015: + 4%)
- combined Staffing & Inhouse at + 6% YoY
- Professionals at + 12% YoY
- perm grew 29%
EBITA margin at 5.5% vs. 5.2% last year
- improving profitability
performance Vs. market (Prism)- quarterly
1%
2%
3%
4%
5%
6%
1.500
2.000
2.500
3.000
3.500
4.000
2011 2012 2013 2014 2015 2016
revenue in € M EBITA margin
performance France – annually
-12%
-8%
-4%
0%
4%
8%
12%
Randstad Market (Prism)

12
Germany: strong topline growth through 2016
revenue growth + 6% YoY (2015: flat) - perm growth of +8%
gross profit up 4% - SME outgrowing large clients
EBITA margin at 4.8% vs. 4.9% LY - impacted by high sickness rate
EBITA margin performance Germany - quarterly
2%
3%
4%
5%
6%
7%
500
1.000
1.500
2.000
2.500
2011 2012 2013 2014 2015 2016
revenue in € M EBITA margin
performance Germany - annually
0%
2%
4%
6%
8%
10%
12%
Q12015
Q22015
Q32015
Q42015
Q12016
Q22016
Q32016
Q42016
Organic Rev
Organic Rev
13
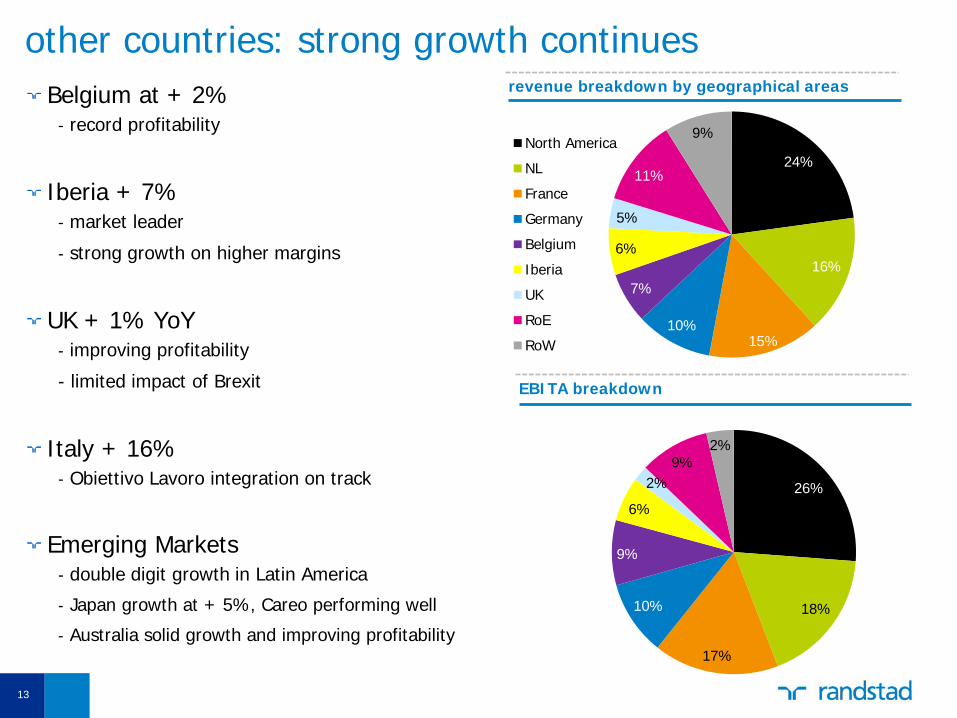
other countries: strong growth continues
Belgium at + 2% - record profitability
Iberia + 7% - market leader
- strong growth on higher margins
UK + 1% YoY - improving profitability
- limited impact of Brexit
Italy + 16% - Obiettivo Lavoro integration on track
Emerging Markets - double digit growth in Latin America
- Japan growth at + 5%, Careo performing well
- Australia solid growth and improving profitability
revenue breakdown by geographical areas
24%
16%
15% 10%
7%
6%
5%
11%
9% North America
NL
France
Germany
Belgium
Iberia
UK
RoE
RoW
EBITA breakdown
26%
18%
17%
10%
9%
6%
2% 9%
2%

2016 progress
14
• Deployment of global Sourceright strategy • Implementation of central delivery and SME approach in Staffing and sourcing centers
for Professionals • Global IT SSC infrastructure rolled out
• Roll-out of technology platforms, e.g., RiseSmart, twago • RIF: 5 new investments • HR tech opco initiatives: Big Data, Randstad Direct, Ploy
• ICR of 41% • Introduction of value based pricing
Org
TTA
ABFS
today
goals
• Successful integration of technology in talent management in main operations
Talent
Tech M&A
4.6% EBITA margin (2016)
14
strong concepts • Staffing • Inhouse • Professionals • HRS
• Proffice • Obiettivo Lavoro • Careo • Twago • Monster • AUSY • BMC
• Leverage ratio: 0.8
• Growth in MSP (+37%) and RPO (stable) • Inhouse Services maintains double-digit growth
(+10%)
• Organic revenue growth: 4.7%
• EBITA margin of 4.6% (+ 10bp YoY)
• Productivity (GP/FTE) remained stable
• About 2.2 million candidates placed
• > 180,000 permanent positions filled
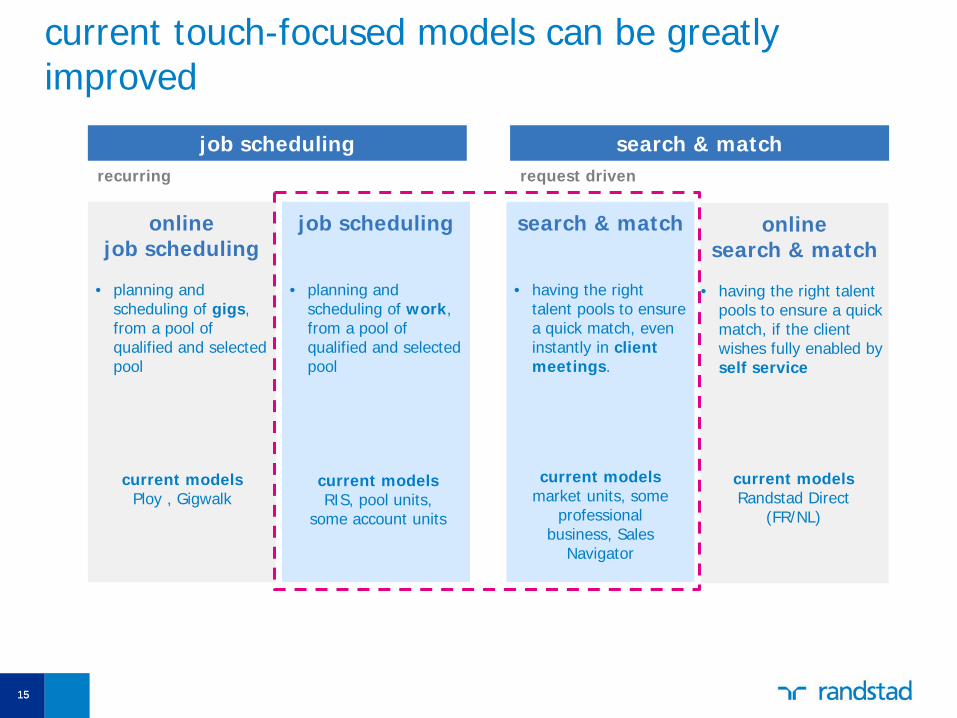
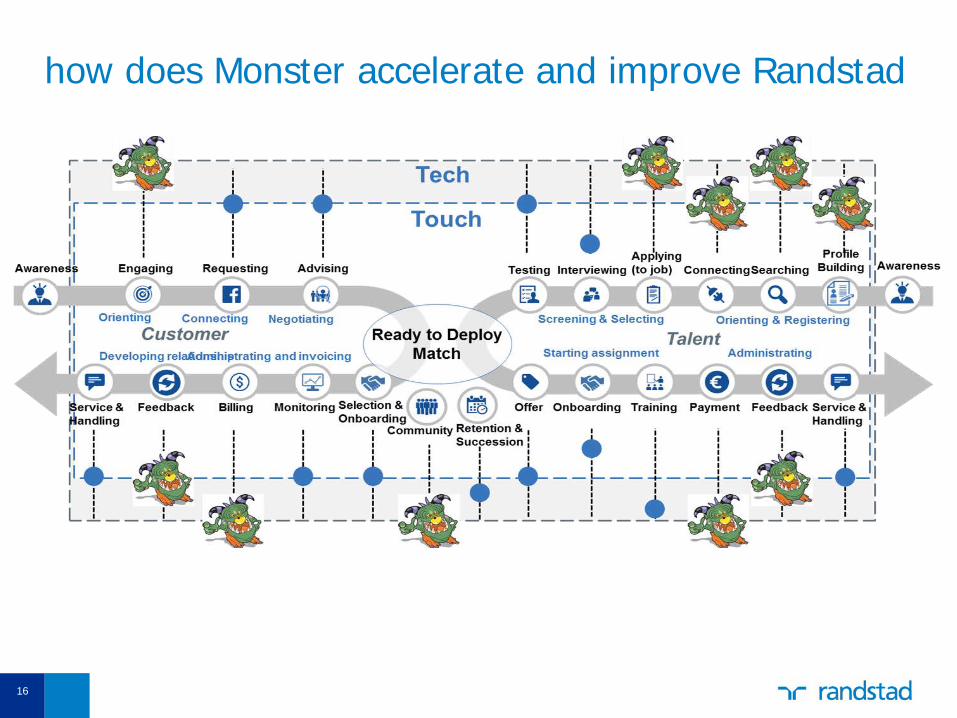
online search & match
• having the right talent
pools to ensure a quick match, if the client wishes fully enabled by self service
job scheduling
• planning and
scheduling of work, from a pool of qualified and selected pool
search & match
• having the right
talent pools to ensure a quick match, even instantly in client meetings.
online job scheduling
• planning and
scheduling of gigs, from a pool of qualified and selected pool
current touch-focused models can be greatly improved
current models Ploy , Gigwalk
current models RIS, pool units,
some account units
current models market units, some
professional business, Sales
Navigator
current models Randstad Direct
(FR/NL)
search & match request driven
job scheduling recurring
15 15
16
how does Monster accelerate and improve Randstad
16
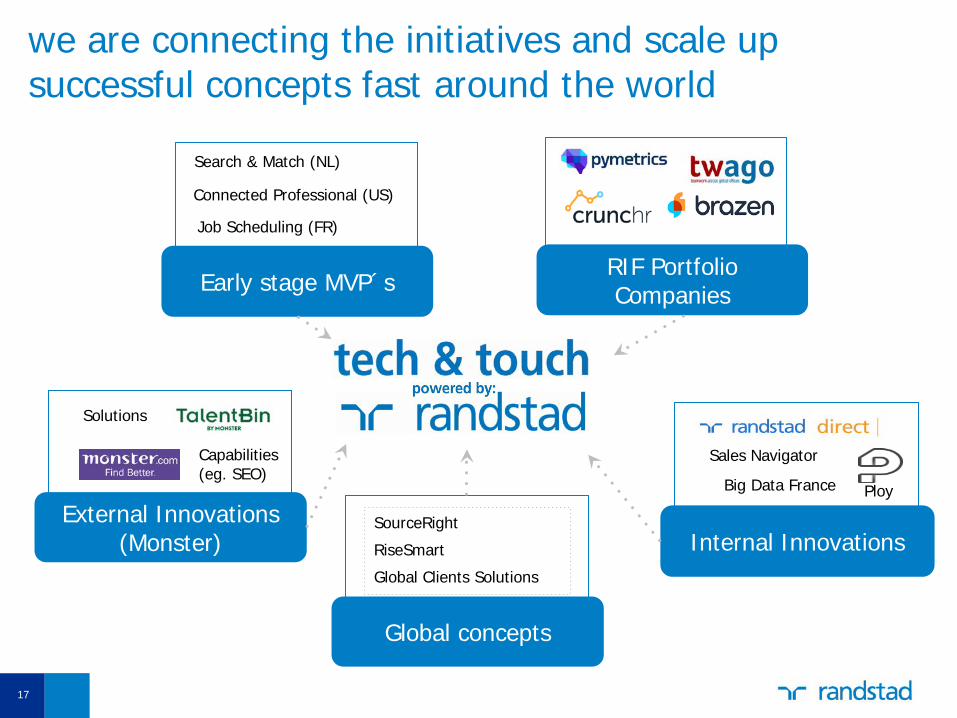
we are connecting the initiatives and scale up successful concepts fast around the world
17
RIF Portfolio Companies Early stage MVP´s
Search & Match (NL)
Job Scheduling (FR)
Connected Professional (US)
External Innovations (Monster)
Solutions
Capabilities (eg. SEO)
Internal Innovations
Sales Navigator
Big Data France Ploy
Global concepts
SourceRight
RiseSmart
Global Clients Solutions
17

Digital change is much more than technology
18
When Digital becomes Human…

19
role of Randstad in the future of work
as the most agile
integrator of tech
supporting a core human touch
we are the trusted human partner
in the technology driven
world of talent
tech & touch
review 2016 financial results
20
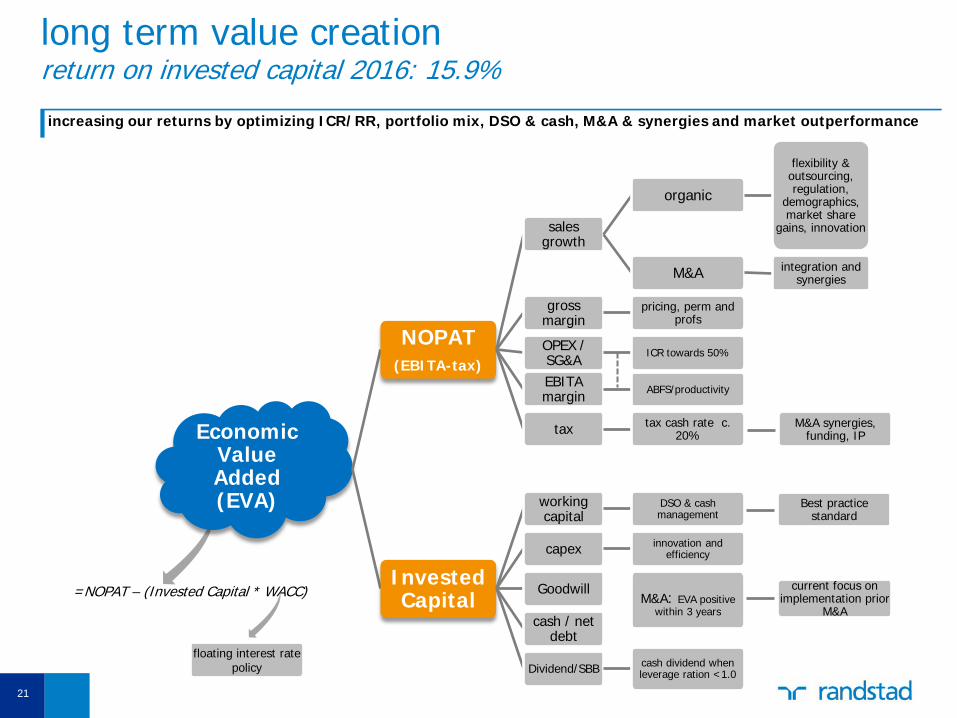
Economic Value Added (EVA)
NOPAT (EBITA-tax)
sales growth
organic
flexibility & outsourcing, regulation,
demographics, market share
gains, innovation
M&A integration and synergies
gross margin
pricing, perm and profs
OPEX / SG&A ICR towards 50%
EBITA margin ABFS/productivity
tax tax cash rate c. 20%
Invested Capital
working capital
DSO & cash management
capex innovation and efficiency
Goodwill
M&A: EVA positive within 3 years
cash / net debt
Dividend/SBB cash dividend when leverage ration <1.0
long term value creation return on invested capital 2016: 15.9% increasing our returns by optimizing ICR/RR, portfolio mix, DSO & cash, M&A & synergies and market outperformance
=NOPAT – (Invested Capital * WACC)
M&A synergies, funding, IP
Best practice standard
current focus on implementation prior
M&A
floating interest rate policy
21

key criteria when considering an aquisition
22
randstad perspective
1 strengthens our strategic position
2 provides significant value creation 3 manageability
▪ create base for growth in existing markets (support global clients, high growth markets)
▪ professionals is the preferred growth segment (profitability and market growth)
▪ increases our market share (“Big is beautiful”, density of network is critical)
▪ create an entry point into new markets through diversification
▪ acquire capabilities in outsourcing/SOW space
▪ minimum size of € 100M revenue (or at least 80 FTE’s when in small markets)
▪ DCF valuation for entire business cycle (different scenarios to be considered); Considerable cost synergies give best safety net in worst case scenario
▪ cost synergies identified and valued (including the costs to realize and possible loss of revenue)
▪ tax and revenue synergies to be treated separately from valuation
▪ EVA positive within 3 years, including post-deal tracking
▪ agreed price negotiation framework before first indicative offer
▪ management selected and approved integration plan prior to closing the transaction
▪ we have sufficient understanding of the target and its business environment (Due diligence with the involvement of all disciplines and business people)
▪ OPCO concept needs to be proven prior considering local acquisitions
▪ OPCO management able to deal with acquisition and integration and the target has a good cultural fit and strong management

successful track record of bolt-on acquisitions Randstad’s M&A criteria
Fujistaff Holdings
SFN
• a number of successful acquisitions have been made on the basis of a disciplined M&A approach • Randstad focuses its M&A efforts on targets with a minimum size of EUR 100m in revenue, and consistently assesses opportunities on the basis
of: 1) strategic fit, 2) value creation, and 3) manageability characteristics => this defines What we pursue and Why we pursue it • Randstad carefully considers How to conduct the M&A process (friendly processes, central coordination by Randstad’s dedicated M&A team,
discipline on price, thorough integration planning, continuous evaluation of past deals), and When to do the deal to safeguard the success of our M&A activity
USG People – select staffing activities
Japan – Closed Oktober 2010 • significantly increased our market
position in the Japanese HR services market.
• Randstad was previously generating revenues of €13m (FY2009) through its existing activities in Japan
• annual revenues of € 461 million and EBITDA margin 3.9% (FY20[09])
• acquisition price of c. ¥19.1bn
North America – Closed September 2011 • value creation through:
• capturing growth in NA through leading positions in key segments (inc. enhancing our professionals business and taking on the sourceright brand)
• improved geographic coverage • significant cross-selling
opportunities • efficiency improvements and
office optimizations [$30m of annual run rate pre-tax cost synergies plus $10m of recurring tax savings]
• annual revenues of $2,053m (FY2010) • acquisition price of c. $771m • immediately accretive to Randstad's
earnings per share
Europe – Closed April 2013 • increased our market position in Spain,
Italy, Poland, Switzerland, Luxembourg • provided an entrance into the Austrian
market • value creation through:
• significant cross-selling opportunities
• efficiency improvements and office optimizations
• annual revenues of €434m (FY2012) • acquisition price of c. €20m • immediately accretive to Randstad's
earnings per share
23 23

24
Aim to be top 3 in local staffing market
Strengthen professional staffing business
Progress towards EVA after 3 years
Accelerate digital strategy
*Acquisition completed in early 2017
overview M&A activity
in line ✓ ahead ✓
underway ✓ *underway ✓ *underway ✓
ahead ✓ ✓ in line ✓

€ million FY ’16 FY ’15 % Org.
revenue 20,684 19,219 +5%
gross profit 3,934 3,595 +4%
gross margin 19.0% 18.7% operating expenses* 2,987 2,733 +3% opex margin 14.4% 14.2% EBITA* 947 862 +7% EBITA margin* 4.6% 4.5% integration costs & one-offs 55 30
reported EBITA 892 832 amortization & impairment -/- 101 -/- 127 net finance costs & associates -/- 5 -/- 22 income before taxes 786 682 tax -/- 198 -/- 164 net income 588 519 adjusted*** net income** 689 608 diluted EPS*** 3.75 3.32
income statement 2016
* Before integration costs and one-offs. ** Attributable to holders of ordinary shares. *** Before amortization and impairment acquisition-related intangible assets and goodwill, integration costs and one-offs.
25

performance by revenue category
* Organic change in revenue is per working day.
Staffing in € M
FY 2016
FY 2015
*% organic
revenue 12,065 11,186 3%
EBITA 567 515 0%
EBITA margin 4.7% 4.6%
Inhouse Services in € M
FY 2016
FY 2015
*% organic
revenue 4,641 4,216 10%
EBITA 241 213 25%
EBITA margin 5.2% 5.0%
Professionals in € M
FY 2016
FY 2015
*% organic
revenue 3,978 3,816 3%
EBITA 208 196 7%
EBITA margin 5.2% 5.1%
26

gross margin bridge
YoY gross margin development
• temp margin down 10bp as mix effects offset a
more competitive market • perm placements +10 bp and HRS + 30bp
driven by the Monster acquisition
• perm fees were 10.6% of GP (vs 10.6% LY) - organic growth of 7% YoY
27
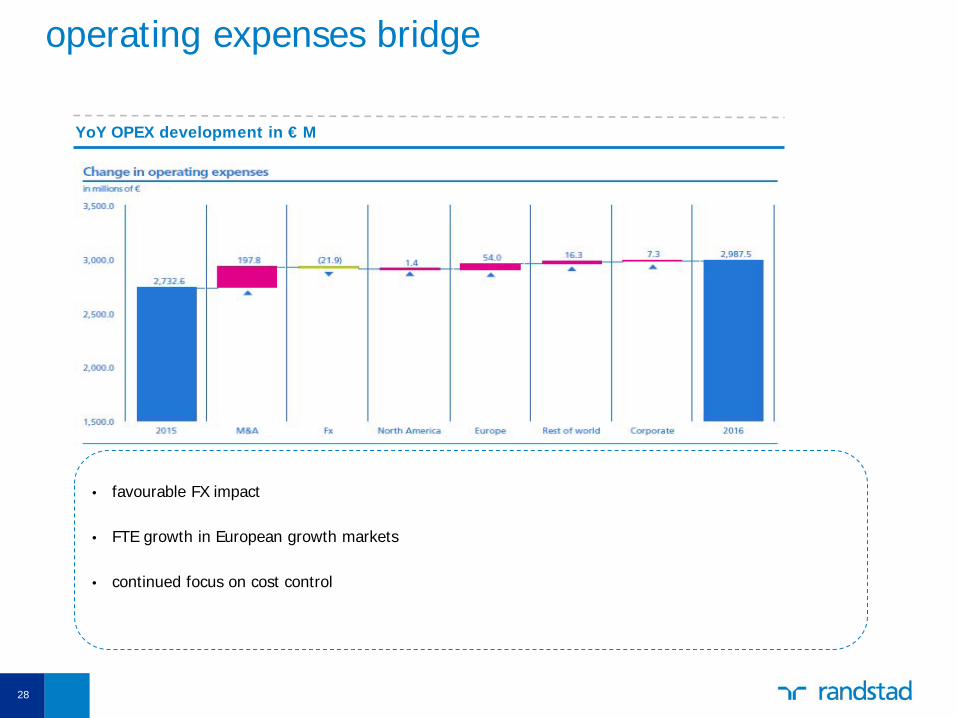
operating expenses bridge
YoY OPEX development in € M
• favourable FX impact • FTE growth in European growth markets • continued focus on cost control
28

net debt at € 793M leverage ratio at 0.8
€ million Q4, 2016 Q4, 2015
goodwill and acquisition-related intangible assets 3,286 2,603 operating working capital (OWC) 712 621 net tax assets 480 517 all other assets and liabilities* 456 293 invested capital 4,934 4,035
total equity 4,141 3,862 net debt 793 173 invested capital 4,934 4,035
DSO, Days Sales Outstanding, moving average 51.4 50.7 working capital as % of revenue over last 12 months 3.4% 3.2% leverage ratio 0.8 0.2 return on invested capital** 15.9% 18.8%
* Starting Q1 2016, we have slightly changed our presentation in this table. In prior years software was included in "goodwill and intangible assets". Software is now included in "Other assets/(liabilities)" resulting in "Goodwill and acquisition-related intangible assets", representing items resulting from acquisitions. Comparative amounts have been adjusted accordingly. ** Return on invested capital: Underlying EBITA (last 12 months) less income tax paid (last 12 months) as percentage of invested capital.
29
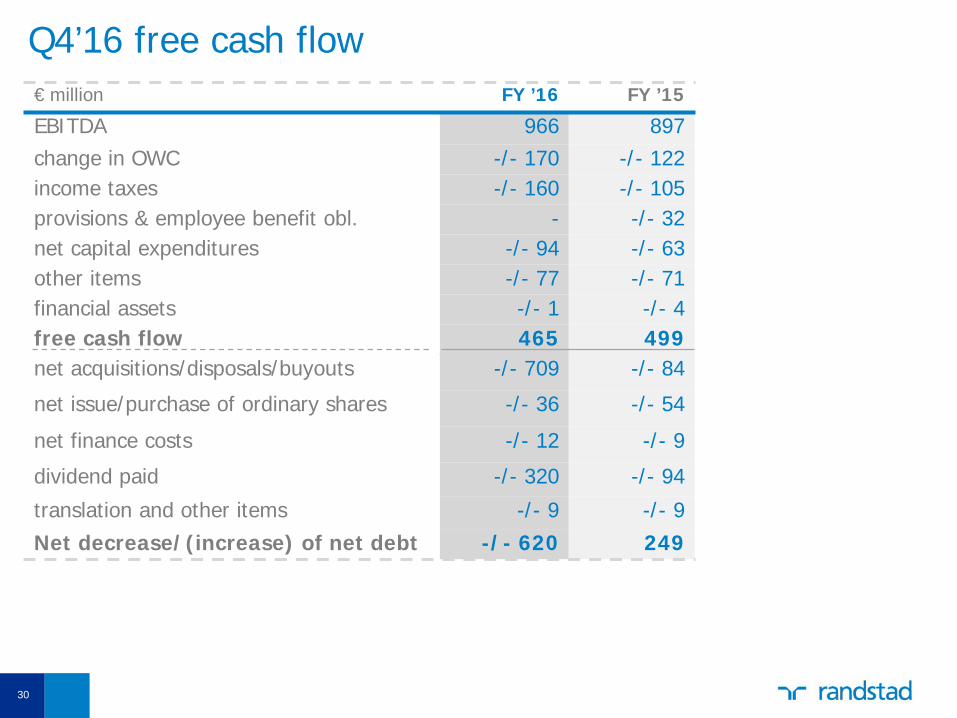
Q4’16 free cash flow € million FY ’16 FY ’15
EBITDA 966 897 change in OWC -/- 170 -/- 122 income taxes -/- 160 -/- 105 provisions & employee benefit obl. - -/- 32 net capital expenditures -/- 94 -/- 63 other items -/- 77 -/- 71 financial assets -/- 1 -/- 4 free cash flow 465 499 net acquisitions/disposals/buyouts -/- 709 -/- 84
net issue/purchase of ordinary shares -/- 36 -/- 54
net finance costs -/- 12 -/- 9
dividend paid -/- 320 -/- 94
translation and other items -/- 9 -/- 9 Net decrease/(increase) of net debt -/- 620 249
30
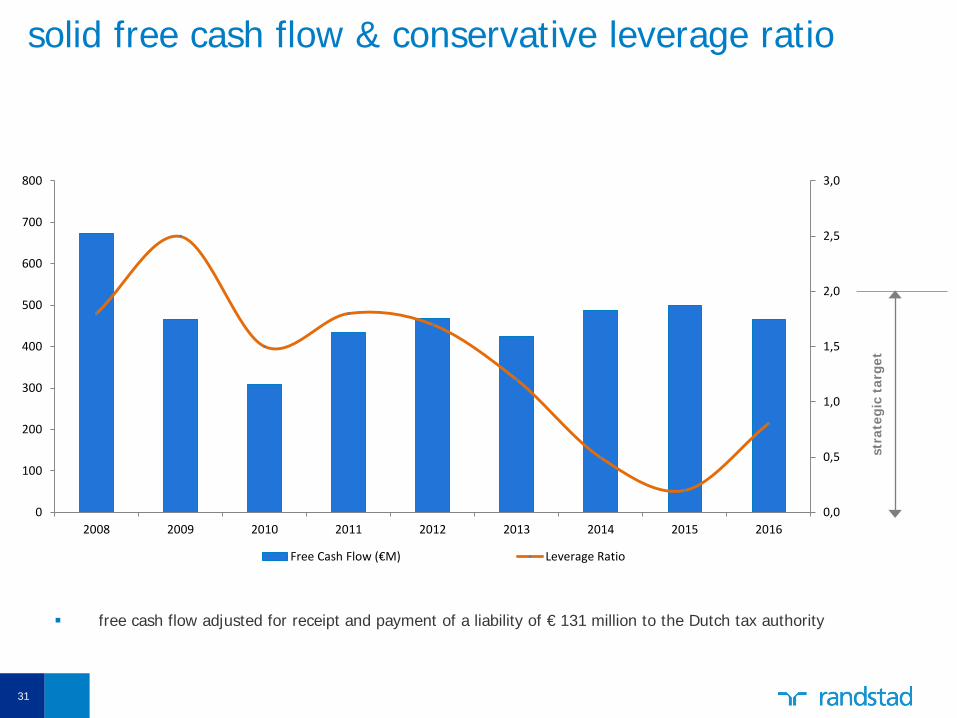
solid free cash flow & conservative leverage ratio
31
free cash flow adjusted for receipt and payment of a liability of € 131 million to the Dutch tax authority
stra
tegi
c ta
rget
0,0
0,5
1,0
1,5
2,0
2,5
3,0
0
100
200
300
400
500
600
700
800
2008 2009 2010 2011 2012 2013 2014 2015 2016
Free Cash Flow (€M) Leverage Ratio

conservative financial policy
• target leverage ratio between 0 and 2, with max leverage ratio of 3.5x EBITDA
• floating rate policy as a natural hedge against the development in operational results, and benefit from yield
• financing in place for expected long-term needs
• using our balance sheet to finance organic growth and acquisitions
32
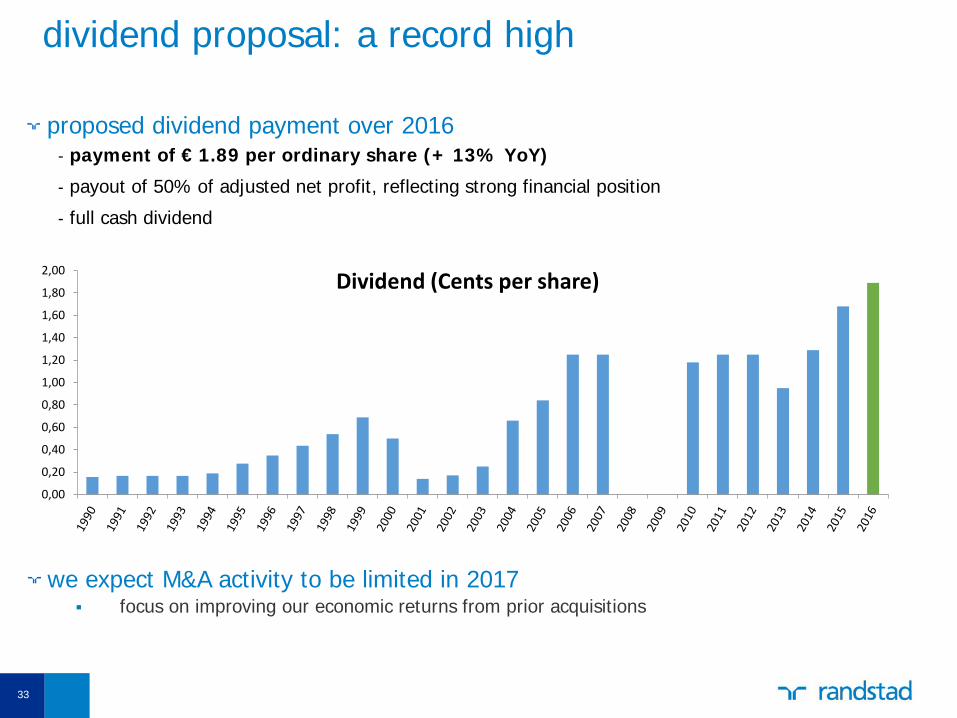
dividend proposal: a record high
proposed dividend payment over 2016 - payment of € 1.89 per ordinary share (+ 13% YoY)
- payout of 50% of adjusted net profit, reflecting strong financial position
- full cash dividend
0,00
0,20
0,40
0,60
0,80
1,00
1,20
1,40
1,60
1,80
2,00 Dividend (Cents per share)
we expect M&A activity to be limited in 2017 focus on improving our economic returns from prior acquisitions
33
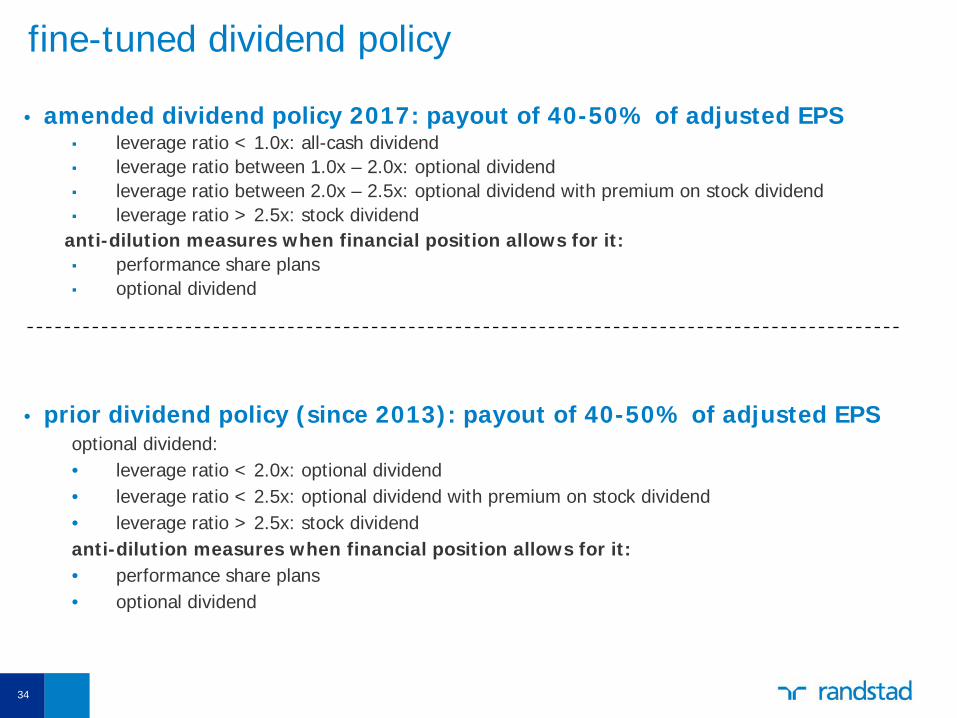
fine-tuned dividend policy
• amended dividend policy 2017: payout of 40-50% of adjusted EPS ▪ leverage ratio < 1.0x: all-cash dividend ▪ leverage ratio between 1.0x – 2.0x: optional dividend ▪ leverage ratio between 2.0x – 2.5x: optional dividend with premium on stock dividend ▪ leverage ratio > 2.5x: stock dividend
anti-dilution measures when financial position allows for it: ▪ performance share plans ▪ optional dividend
• prior dividend policy (since 2013): payout of 40-50% of adjusted EPS optional dividend: • leverage ratio < 2.0x: optional dividend • leverage ratio < 2.5x: optional dividend with premium on stock dividend • leverage ratio > 2.5x: stock dividend anti-dilution measures when financial position allows for it: • performance share plans • optional dividend
34

dividend process and timeline in 2017 • March 30, 2017: approval shareholders in AGM 2016 • April 3, 2017: ex-dividend date • April 4, 2017: record date • April 7, 2017: payment of cash dividend
35

sustainability integral part of our strategy
• progress 2016:
• pre-assurance non-financial data
• again included in the Dow Jones Sustainability Index
• process started of updating ambition and strategy
• Executive Board’s LTI 2016-2018 performance targets relating to sustainability: - Clients: Net Promoter Score (NPS) - Candidates: impact of initiatives with regard to guiding candidates
from unemployment to employment - Employees: employee engagement score - Society: involvement with key forums - Basics: 50% electricity from sustainable sources in 2018
2
36

some specific questions
• labor migration - published report ‘People to jobs, jobs to people’ on labor migration
- local initiatives of helping refugees find a job in the Netherlands, Spain, Germany, Belgium and Sweden
• living wage candidates - global HR services industry regulated by the International Labour Organization (ILO)
- defines minimum standards for staffing and recruitment
- Article 11 of ILO Convention 181:
adequate protection for the workers employed by private employment agencies must be ensured in relation to amongst others minimum wage, which is considered one of the fundamental premises of decent work
• Sustainable Development Goals (SDGs) - most impact on Goal 8: 'Promote sustained, inclusive and sustainable economic growth,
full and productive employment and decent work for all'.
- integration with our updated strategy coming years
37

MATCH
client market treatment
negotiations & contracting order intake candidate
intake recruitment
candidate market
treatment
credit management billing client order
management candidate / EW management
payroll processing procure & pay
marketing & communication processes
IT processes
KCF follows our business flow
HR management
Randstad standards (core values, business principles, tone at the top and policies)
38
planning & control
accounting & reporting
Field steering

Q & A
2. review 2016
39
2. review 2016
2b. application of the remuneration policy in 2016: - last update remuneration policy approved by the AGM in 2013 - remuneration 2016 in line with approved policy - extensive remuneration report 2016 on corporate website
40

2. review 2016
2c. proposal to adopt the financial statements 2016
41
2. review 2016
2d. explanation of the policy on reserves and dividends
42
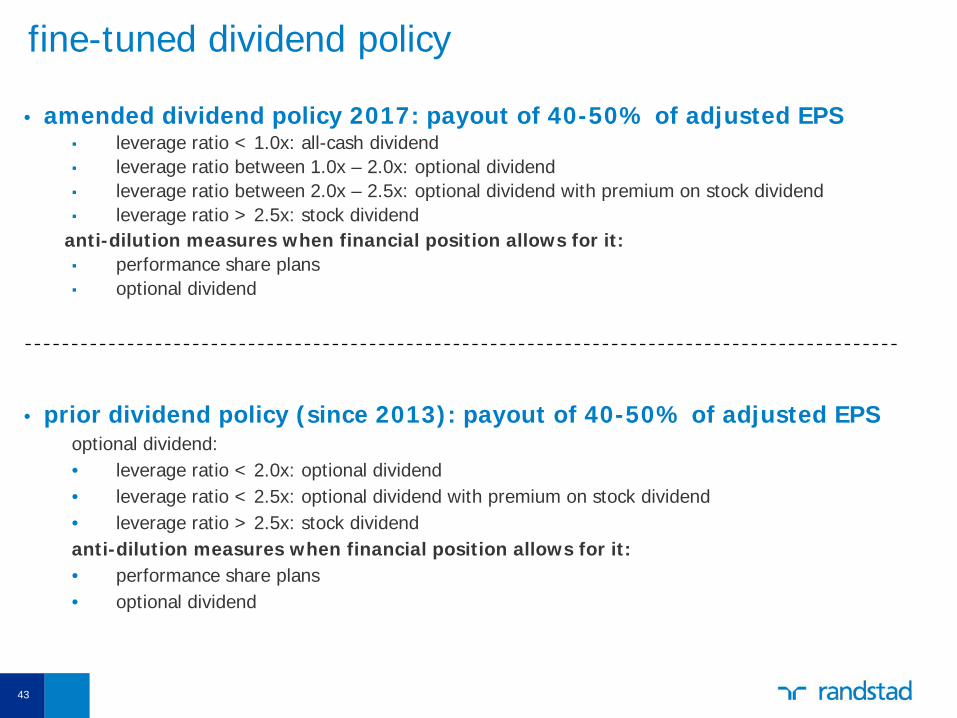
fine-tuned dividend policy
• amended dividend policy 2017: payout of 40-50% of adjusted EPS ▪ leverage ratio < 1.0x: all-cash dividend ▪ leverage ratio between 1.0x – 2.0x: optional dividend ▪ leverage ratio between 2.0x – 2.5x: optional dividend with premium on stock dividend ▪ leverage ratio > 2.5x: stock dividend
anti-dilution measures when financial position allows for it: ▪ performance share plans ▪ optional dividend
• prior dividend policy (since 2013): payout of 40-50% of adjusted EPS optional dividend: • leverage ratio < 2.0x: optional dividend • leverage ratio < 2.5x: optional dividend with premium on stock dividend • leverage ratio > 2.5x: stock dividend anti-dilution measures when financial position allows for it: • performance share plans • optional dividend
43

2e. proposal to determine the dividend over the financial year 2016 • Dividend on ordinary shares: € 1.89 per share
• full cash dividend • Dividend on preference shares B and C: € 12.6M
2. review 2016
44

dividend process and timeline in 2017 • March 30, 2017: approval shareholders in AGM 2016 • April 3, 2017: ex-dividend date • April 4, 2017: record date • April 7, 2017: payment of cash dividend
45

agenda
1. opening 2. review 2016 3. discharge of liability 4. shares 5. remuneration 6. external auditor 7. any other business 8. closing
46
3. discharge of liability
3a. discharge of liability of the members of the executive board for the management
47
3. discharge of liability
3b. discharge of liability of the members of the supervisory board for the supervision of the management
48

agenda
1. opening 2. review 2016 3. discharge of liability 4. shares 5. remuneration 6. external auditor 7. any other business 8. closing
49
4. shares
4a. proposal to extend the authority of the executive board to issue shares • valid for a period of 18 months (September 30, 2018) • approval by the supervisory board • yearly allocation of performance shares and options not more than 1% • yearly maximum authorization of 3% of the issued capital • on average over last 5 years: 0.3% issued shares • anti-dilution preference shares
50
4. shares
4b. proposal to extend the authority of the executive board to restrict or exclude the pre-emptive right to any issue of shares • valid for a period of 18 months (September 30, 2018) • approval by the supervisory board • yearly maximum authorization of 10% of the issued capital
51

4. shares
4c. proposal to authorize the executive board to repurchase ordinary shares • repurchase ordinary shares up to a maximum of 10% of the issued share
capital of ordinary shares. • valid for a period of 18 months (September 30, 2018) • ordinary shares may be acquired for a price between the nominal value and
110% of the stock market rate
52

4. shares
4d. proposal to cancel repurchased ordinary shares • cancel ordinary shares up to a maximum of 10% of the issued share capital
of ordinary shares. • valid for a period of 18 months (September 30, 2018) • date(s) for cancellation to be determined by the executive board taking into
account a mandatory 2-month opposition period for creditors • only ordinary shares held by the company may be cancelled
53
agenda
1. opening 2. review 2016 3. discharge of liability 4. shares 5. remuneration 6. external auditor 7. any other business 8. closing
54

5. remuneration
5a. proposal to amend the remuneration policy of the Executive Board key objectives
• align with the strategic direction for the transformation of Randstad
• strengthen focus on long-term sustainable value-creation
• stay focused on the values and societal aspirations of Randstad
• reward team, not individual Executive Board member achievements
55

5. remuneration
5a. proposal to amend the remuneration policy of the Executive Board base salaries
• base salary levels and targets stay unchanged
• labor market peer group expanded in line with good market practice
• AEX sanity check maintained
56

5. remuneration
5a. proposal to amend the remuneration policy of the Executive Board annual bonus
• bonus opportunity kept at current levels
• only joint targets
• flexibility in target setting and target weighting
• mandatory conversion of part of the earned bonus into shares
• share matching to stimulate maximum conversion
• share matching subject to sustainable performance of Randstad
57
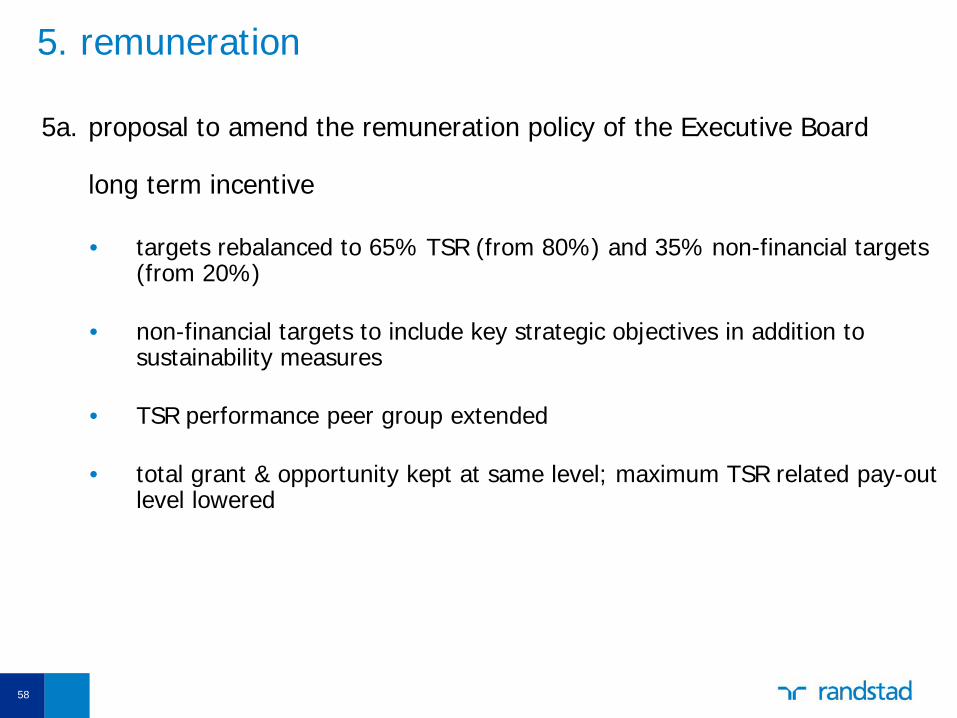
5. remuneration
5a. proposal to amend the remuneration policy of the Executive Board long term incentive
• targets rebalanced to 65% TSR (from 80%) and 35% non-financial targets
(from 20%)
• non-financial targets to include key strategic objectives in addition to sustainability measures
• TSR performance peer group extended
• total grant & opportunity kept at same level; maximum TSR related pay-out level lowered
58

5. remuneration
5a. proposal to amend the remuneration policy of the Executive Board annual bonus targets 2017
• revenue with market share validation (15% min, 25% on target, 35% max) • EBITA margin (10% min, 15% on target, 25% max) • DSO (5% min, 10% on target, 15% max) • strategic target not disclosed as sensitive (25% max) long term incentive 2017 non-financial targets in addition to TSR • net promoter score • employee engagement • professionals growth above market • perm growth above market • a target related to digital strategy
59
5. remuneration
5b. proposal approve the performance related remuneration of the Executive Board in performance shares • valid for 5 years • in line with new remuneration policy
60

agenda
1. opening 2. review 2016 3. discharge of liability 4. shares 5. remuneration 6. external auditor 7. any other business 8. closing
61
6. external auditor
6. Proposal to reappoint Deloitte Accountants BV as external auditor for the financial year 2018
• initial appointment at the AGM in 2014 for the 2015 financial year
62

agenda
1. opening 2. review 2016 3. discharge of liability 4. shares 5. remuneration 6. external auditor 7. any other business 8. closing
63
agenda
1. opening 2. review 2016 3. discharge of liability 4. shares 5. remuneration 6. external auditor 7. any other business 8. closing
64