annual general meeting of shareholders - ir.randstad.com/media/files/r/randstad-ir-v2/results... ·...
TRANSCRIPT

annual general meeting of shareholders
Randstad Holding nv March 27, 2018

|
disclaimer & definitions
Certain statements in this document concern prognoses about the future financial condition, risks, investment plans and the results of operations of randstad Holding and its operating companies, as well as certain plans and objectives. Obviously, such prognoses involve risks and a degree of uncertainty, since they concern future events and depend on circumstances that will apply then. Many factors may contribute to the actual results and developments differing from the prognoses made in this document. These factors include, but are not limited to, general economic conditions, a shortage on the job market, changes in the demand for personnel (including flexible personnel), achievement of cost savings, changes in the business mix, changes in legislation (particularly in relation to employment, staffing and tax laws), the role of industry regulators, future currency and interest fluctuations, our ability to identify relevant risks and mitigate their impact, the availability of credit on financially acceptable terms, the successful completion of company acquisitions and their subsequent integration, successful disposals of companies, and the rate of technological developments. These prognoses therefore apply only on the date on which this document was compiled. The quarterly results as presented in this press release are unaudited.
EBITA: operating profit before amortization and impairment acquisition-related intangible assets and goodwill, integration costs and one-offs.
organic growth is measured excluding the impact of currency effects, acquisitions, disposals and reclassifications.
diluted EPS is measured before amortization and impairment acquisition-related intangible assets and goodwill, integration costs and one-offs.
© Randstad 2

|
agenda
© randstad 3
1. opening
2. review 2017
3. discharge of liability
4. composition executive board
5. composition supervisory board
6. shares
7. other corporate affairs
8. external auditor
9. any other business
10. closing

|
agenda
© randstad 4
1. opening
2. review 2017
3. discharge of liability
4. composition executive board
5. composition supervisory board
6. shares
7. other corporate affairs
8. external auditor
9. any other business
10. closing

|
operational performance & strategy.
© randstad 5
review 2017

|
our purpose is to support people and organizations
in realizing their true potential.

|
FY 2017: strong conversion of robust topline.
© randstad 7
revenue of € 23,273 million
organic growth 8.3%1
gross profit up 7%2
January organic sales growth of around 7%
proposed cash dividend of € 2.76 (up 46%); regular dividend of € 2.07 and special dividend of € 0.69; record high
Monster: EBITA positive driven by cost optimization program; key strategic initiatives underway
capital allocation: conditional floor dividend and optional cash returns when leverage ratio < 1.0
topline grew 10% in Europe 1% in North America and 10% in Rest of the world
gross margin 20.2%
pricing climate stable
perm fees up 10%
FY 2017 FCF up 26% to € 586 million; leverage ratio of 0.9; full year 2017 ROIC of 16.7%
underlying EBITA of € 1,065 million ; EBITA margin 4.6% ; underlying ICR 40%
1 including Monster as of November 1, 2017 2 excluding Monster for comparability reasons

|
regional split: robust growth continues despite tougher comps.
© randstad 8
YoY Randstad organic revenue growth development
• Europe grew 10% in 2017 (vs. 6% in 2016) • North America grew 1% in 2017 (vs. 1% in 2016) • Rest of the world increased 10% in 2017 (vs. 7% in 2016) • Group grew 8% in 2017 (vs. 5% in 2016)
-10%
0%
10%
20%
Q4 2013 Q2 2014 Q4 2014 Q2 2015 Q4 2015 Q2 2016 Q4 2016 Q2 2017 Q4 2017
Group Europe North America Rest of the world

| |
topline growth accelerating vs. peers powered by integrated tech.
© Randstad 9
0%
5%
10%
15%
Randstad Peer 1 Peer 2
15%
20%
25%
30%
Randstad Peer 1 Peer 2
5%
10%
15%
Randstad Peer 1 Peer 2
-8%
-6%
-4%
-2%
0%
2%
4%
6%
8%
10%
2012 2013 2014 2015 2016 2017
Randstad Peer 1 Peer 2
organic revenue pwd growth by quarter, 2012-2017
france
italy
iberia
organic revenue pwd growth, 2017

| |
organic revenue growth in key markets france, spain, italy leading the way.
• France grew 12% (vs. 7% in 2016) • North America grew 1% (vs. 1% in 2016) • Rest of the world increased 10% (vs. 7% in 2016) • Group grew 9% (vs. 5% in 2016)
© Randstad 10
1%
11%
12%
2%
9%
13%
26%
10%
10%
11%
1%
2%
7%
3%
6%
7%
16%
-
7%
-
North America
Belgium
France
Netherlands
Germany
Iberia
Italy
Other European countries
Rest of the world
Global businesses
2017 2016*other European countries and Global Businessess not restated for 2016

|
revenue split FY 2017.
© Randstad 11
split by geographical areas split by revenue categories
18%
14%
16%
10%
7%
6%
7%
9%
8% 5%
NAM NL FR GER BEL IBE IT RoE RoW global businesses
52%
22%
20%
5%
staffing inhouse professionals global businesses

|
EBITA split FY 2017.
© Randstad 12
split by geographical areas
22%
19%
21%
11%
9%
7%
8% 6%
5%
0%
NAM NL FRGER BEL IBEIT RoE RoWglobal businesses
|

| |
strategic roadmap best people, strong concepts, excellent execution & superior brands.
© Randstad 13

|
topline growth
business mix digital opex
© Randstad 14
ebita margin outlook 2017/18.
topline growth • consensus + 4.5%
sales growth 2018 • expected market
outperformance
business mix • focus on perm/profs/inhouse/SME;
pricing
digital • ongoing investments • early signs of additional
sales growth
opex • € 90-100M annual
savings by 2019
FY 2017 EBITA margin: 4.6%
outlook 2018: further progression towards 5-6% EBITA margin

| © Randstad 15
a data world to win randstad has the largest pool of talent acquisition data.
355,625,000 104,625,000 average number of candidates in our databases
open jobs at any time
225,000 clients served every year
applications every year
placements every year
39 countries
36,520 corporate employees
€ 20.7 billion revenue
4,750 locations
the role of technology is increasing while the human role remains crucial.
1,625,000 2,625,000

| |
we are connecting the initiatives and scaling up successful concepts fast around the world.
© Randstad 16 |
global concepts • sourceright • risesmart • global clients
solutions
tech & touch local innovations • randstad direct • sales navigator • big data • horton
external innovations via M&A • monster • ausy
digital factory scale ups • data-driven sales • workforce
scheduling
RIF (15 investments) • pymetrics • montage • crunchr • brazen

| |
we are learning a new way of working to make T&T happen getting focus and proof to scale up.
© Randstad 17
1. focus tech & touch portfolio, drive with integrated team
2. build MVPs with clients/candidates/ consultants instantly learn & improve
3. think big, start small, scale fast 4. validate business cases on hard data & leading KPIs
37% 58%
5%
experiments. local MPV
mature products

| |
new technology does not resolve old problems focus on culture and values continues. • we have 36,500 ambassadors working for Randstad • high turnover rate in many countries • not Utopia; we do live in the real world, with real people – so we come across unacceptable
conduct and do investigate independently and have parted company with senior colleagues.
18

| |
our core values guide us in how we work. Our values shape our culture. They help us develop, grow and better serve our clients, candidates and other stakeholders.
to know We are experts. We know our clients, their companies, our candidates and our business. In our business it's often the details that count the most.
to serve We succeed through a spirit of excellent service, exceeding the core requirements of our industry.
to trust We are respectful. We value our relationships and treat people well.
striving for perfection We always seek to improve and innovate. We are here to delight our clients and candidates in everything we do. This gives us our edge.
simultaneous promotion of all interests We see the bigger picture and take our social responsibility seriously. Our business must always benefit society as a whole.
19

| |
our required behavior.
• tone at the top • transparency • clear and open communication • focus on integrity • good governance
20

| |
sustainability is at the heart of randstad’s business.
one of Randstad's core values is the simultaneous promotion of all interests. we play a key role in society since 1960; work is a unifying force • contributing to labor participation, social inclusion, well-being. • offering employment solutions to address growing challenges:
structural skills shortages, declining population growth, ageing workforce.
• gathering and sharing employment market information and insights to take the HR services market to a higher level.
• influencing (de)regulation in our markets.
our core business: helping people to work • 668,800 people around the world every day.
© Randstad 2018 21
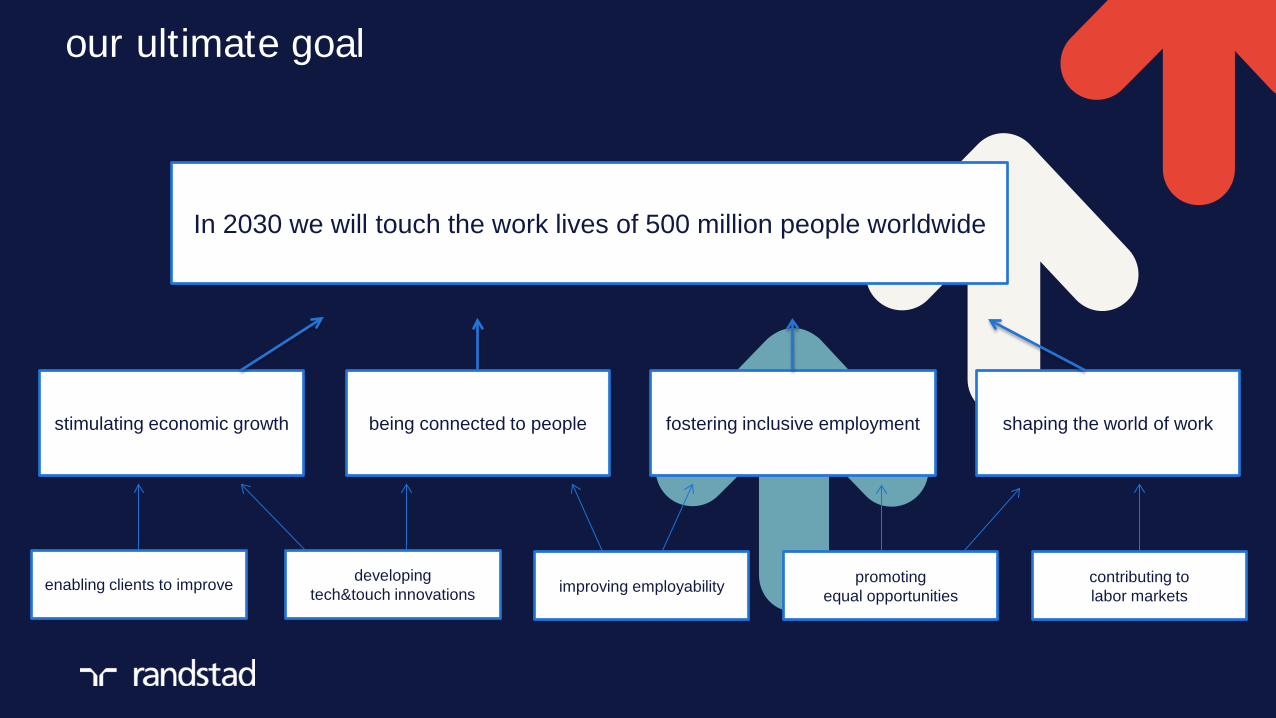
our ultimate goal
name presenter job title
In 2030 we will touch the work lives of 500 million people worldwide
enabling clients to improve
stimulating economic growth being connected to people fostering inclusive employment shaping the world of work
developing tech&touch innovations improving employability promoting
equal opportunities contributing to labor markets

|
financial results
& outlook.
© Randstad 23

| © Randstad 24
long term value creation. increasing our returns by optimizing ICR/RR, portfolio mix, DSO & cash, M&A & synergies and market outperformance
=NOPAT (Invested Capital * WACC)
floating interest rate policy
FY 2017 ROIC: 16.7% FY 2016 ROIC: 15.9%

|
income statement FY 2017
© randstad 25
€ million FY ’17 FY ’16 % org.
revenue 23,273 20,684 8% gross profit 4,708 3,934 7% gross margin 20.2% 19.0% operating expenses* 3,643 2,987 5% opex margin 15.7% 14.4% EBITA* 1,065 947 11% EBITA margin* 4.6% 4.6% integration costs & one-offs -/-72 -/-55 reported EBITA 994 892 amortization & impairment -/-134 -/-101 net finance costs & associates -/-21 -/-5 income before taxes 838 786 tax -/-207 -/-198 net income 631 588 adjusted*** net income** 756 689 diluted EPS*** 4.11 3.75
* before integration costs and one-offs. ** attributable to holders of ordinary shares. *** before amortization and impairment acquisition-related intangible assets and goodwill, integration costs and one-offs.

|
Global businesses revenue 1,184 757 11% EBITA -/-2 20 36% EBITA margin3 -/-0.2% 2.6%
performance by revenue category
© randstad 26
1 comparable Q4 2016 figures have been adjusted for Staffing and Inhouse services, related to a reallocation of revenue and costs. 2 organic change in revenue is adjusted for the number of working days. 3EBITA in % of total revenue by revenue category. 4included in organic revenue growth: Monster as of November 1, 2017; for comparability reasons, organic EBITA growth is excluding Monster.
Staffing revenue 12,184 11,400 6% EBITA 623 547 11% EBITA margin 5.1% 4.8%
Inhouse services revenue 5,185 4,461 18% EBITA 251 223 13% EBITA margin 4.8% 5.0%
Professionals revenue 4,720 4,067 4% EBITA 276 226 6% EBITA margin 5.9% 5.5%
€ million
FY 2017 FY 20161 % organic2

|
FY 2017 gross margin bridge
© randstad 27
• temp margin decreased 30bp compared to last year due to adverse mix e�ects and pricing • permanent placements had no impact, while HR Solutions had a positive impact of 160bp driven by the Monster acquisition • At Group level, the contribution from permanent placements ('perm fees') made up 9.6% (2016: 10.4%) of gross profit.

|
FY 2017 operating expenses bridge
© randstad 28
• OPEX increased by 5% organically • favorable sequential FX impact € 33M • ICR FY 2017 at 40%
2.988
3.643
535 6
87 12 14 23 11
(33)
2.500 2.550 2.600 2.650 2.700 2.750 2.800 2.850 2.900 2.950 3.000 3.050 3.100 3.150 3.200 3.250 3.300 3.350 3.400 3.450 3.500 3.550 3.600 3.650 3.700
FY 2016 FX M&A Marketing Organic EU Organic NA Organic ROW Organic globalbusinesses
Organic Corp FY 2017
2,500
3,700

|
net debt at €1,026M leverage ratio at 0.9, versus guidance of 1.0
© randstad 29
€ million Q4 2017 Q4 2016 goodwill and acquisition-related intangible assets 3,476 3,286 operating working capital (OWC) 889 712 net tax assets 357 480 all other assets and liabilities* 556 456 invested capital 5,277 4,934
total equity 4,252 4,141 net debt 1,026 793 invested capital 5,277 4,934
DSO, days sales outstanding, moving average 53.2 51.4 OWC % of revenue over last 12 months 3.8% 3.4% leverage ratio 0.9 0.8 return on invested capital* 16.7% 15.9%
* return on invested capital: underlying EBITA (last 12 months) less income tax paid (last 12 months) as percentage of invested capital.

|
FY 2017 free cash flow, up 82% YoY
© randstad 30
€ million FY ’17 FY ’16
EBITDA 1,081 966
change in OWC -/-175 -/-170
income taxes -/-186 -/-160
provisions & employee benefit obl. 8 -
net capital expenditures -/-96 -/-94
other items -/-39 -/-77
financial assets -/-7 -/-1
free cash flow 586 465
net acquisitions/disposals/buyouts -/-463 -/-709
net issue/purchase of ordinary shares -/-39 -/-36
net finance costs -/-18 -/-12
dividend paid -/-359 -/-320
translation and other items 58 -/-9
net decrease/(increase) of net debt -/-232 -/-620
* return on invested capital: underlying EBITA (last 12 months) less income tax paid (last 12 months) as percentage of invested capital.

| |
FCF stability over the past 10 years.
© Randstad 31
0,0
0,5
1,0
1,5
2,0
2,5
3,0
0
100
200
300
400
500
600
700
800
2007 2008 2009 2010 2011 2012 2013 2014 2015 2016 2017
FCF ex-CICE (€ M) CICE (€ M) leverage ratio
stra
tegi
c ta
rget

| |
acquired companies well on track
© randstad 32
aim to be top 3 in local Staffing
market
strengthen Professionals business
progress towards EVA after 3 years
accelerate digital strategy
in line
ahead
underway
ahead
underway
ahead

| © Randstad 33
M&A outlook 2018 and beyond.
tech & touch strategy
• mainly organic through digital factory
• repair Monster & global roll-out
professionals
• acceleration through Ausy (organic & bolt-on M&A)
• over time: small to mid-sized M&A
staffing
• top position in most relevant markets, ex-Japan, UK & Australia
• no priority
• focus on value creation on the basis of current footprint • no large transformational M&A going forward • limited M&A in 2018

| |
adjusted capital allocation strategy
34
maintain cash dividend policy with payout 40 – 50%; implement floor
cash dividend of € 1.62 per share
special cash dividend (preferred)
share buybacks
when leverage ratio < 1.0 => optional additional cash returns to
shareholders
adjusted capital allocation strategy
regular cash dividend: €2.07 per share, based on 50% payout ratio
special cash dividend of € 0.69 per share
leverage ratio = 0.9 (FC: 1.0), propose to return EUR 126m additional cash to shareholders over FY 2017
impact on FY 2017 payout in 2018
© Randstad
**This baseline dividend level will be maintained even when the general 40-50% payout ratio is temporarily exceeded, barring (i) seriously adverse economic conditions, (ii) material strategic changes to the sector and (iii) a material deterioration in our solvency & liquidity ratios.

| |
cash dividend proposal: up 46% including special dividend • proposed cash dividend payment over 2017
• payment of € 2.76 per ordinary share (+ 46% YoY)
• regular dividend of € 2.07 based on payout of 50% of adjusted net profit
• special dividend of € 0.69 based on proposed adjusted capital allocation strategy and leverage ratio of 0.9
35
0,00
0,50
1,00
1,50
2,00
2,50
3,00 dividend (cents per share)
Regular Dividend Special Dividend

| |
dividend process and timeline in 2018
• March 27, 2018: approval shareholders in AGM
• March 29, 2018: ex-dividend date regular cash dividend
• April 3, 2018: record date regular cash dividend
• April 5, 2018: payment of regular cash dividend
• Third quarter 2018: payment of special cash dividend (including ex-dividend and record
date)
36

| |
some specific questions
• sustainable development goals - most impact on goal 8: we promote sustained, inclusive and sustainable economic growth, full and productive employment and decent work for all - integrated in our strategy and ultimate goal towards 2030, connections made in our reporting framework and targets will be set, if feasible
• living wage - global HR services industry regulated by the International Labour Organization - “adequate protection for workers employed private employment agencies must be ensured in relation to amongst others minimum wage, which is considered one of the fundamental premises of decent work”. - Key control framework: compliance with local labor laws, including CLA/minimum wage
• human rights key for Randstad - update of assessment in 2018
37

| |
2. review 2017
Q & A
38

| |
2. review 2017
2b. main items corporate governance structure and compliance with the corporate governance code
39

| |
2. review 2017
2c. application of the remuneration policy in 2017 • last update remuneration policy approved by the AGM in 2017 • remuneration 2017 in line with approved policy • extensive remuneration report 2017 on corporate website
40

| |
2. review 2017
2d. proposal to adopt the financial statements 2017
41

© 2018 Deloitte The Netherlands
Overview of the Deloitte audit
- Unqualified auditor’s report - Management Report: information as
required by Part 9, Book 2 Dutch Civil Code and consistency financial statements
- Procedures to test compliance with Dutch Auditing Standard 720 – “The auditor’s responsibilities relating to other information”
FINANCIAL STATEMENTS AND MANAGEMENT REPORT
- Materiality determined at EUR 50 million (2016: EUR 30 million)
- Country /component level: lower materiality (max. EUR 30 million)
- Also taken into account qualitative considerations
MATERIALITY
- Auditor’s report provides information relating to: - Revenue recognition - Valuation of deferred taxes - Goodwill valuation
KEY AUDIT MATTERS - Full-scope procedures for 14
entities / subgroups - Coverage of 89% (sales) and 87%
(total assets)
SCOPE AND COVERAGE
Audit of Randstad Holding nv
2017
COMMUNICATION
- Several meetings and calls with Supervisory Board / Audit Committee
- Audit plan, management letter and year-end report

| |
2. review 2017
2d. explanation of the policy on reserves and dividends
43

| |
adjusted capital allocation strategy
44
maintain cash dividend policy with payout 40 – 50%; implement floor
cash dividend of € 1.62 per share
special cash dividend (preferred)
share buybacks
when leverage ratio < 1.0 => optional additional cash returns to
shareholders
adjusted capital allocation strategy
regular cash dividend: €2.07 per share, based on 50% payout ratio
special cash dividend of € 0.69 per share
leverage ratio = 0.9 (FC: 1.0), propose to return EUR 126m additional cash to shareholders over FY 2017
impact on FY 2017 payout in 2018
© Randstad
**This baseline dividend level will be maintained even when the general 40-50% payout ratio is temporarily exceeded, barring (i) seriously adverse economic conditions, (ii) material strategic changes to the sector and (iii) a material deterioration in our solvency & liquidity ratios.

| |
2. review 2017
2e. proposal to determine the regular dividend over the financial year 2017
45

| |
cash dividend proposal: up 46% including special dividend • proposed cash dividend payment over 2017
• payment of € 2.76 per ordinary share (+ 46% YoY)
• regular dividend of € 2.07 based on payout of 50% of adjusted net profit
• special dividend of € 0.69 based on proposed adjusted capital allocation strategy and leverage ratio of 0.9
46
0,00
0,50
1,00
1,50
2,00
2,50
3,00 dividend (cents per share)
Regular Dividend Special Dividend

| |
dividend process and timeline in 2018
• March 27, 2018: approval shareholders in AGM
• March 29, 2018: ex-dividend date regular cash dividend
• April 3, 2018: record date regular cash dividend
• April 5, 2018: payment of regular cash dividend
• Third quarter 2018: payment of special cash dividend (including ex-dividend and record
date)
47

| |
2. review 2017
2f. proposal to determine a special dividend over the financial year 2017
48

| |
agenda
© randstad 49
1. opening
2. review 2017
3. discharge of liability
4. composition executive board
5. composition supervisory board
6. shares
7. other corporate affairs
8. external auditor
9. any other business
10. closing

| |
3. discharge of liability
3a. discharge of liability of the members of the executive board for the management
50

| |
3. discharge of liability
3b. discharge of liability of the members of the supervisory board for the supervision of the management
51

| |
agenda
© randstad 52
1. opening
2. review 2017
3. discharge of liability
4. composition executive board
5. composition supervisory board
6. shares
7. other corporate affairs
8. external auditor
9. any other business
10. closing

| |
4. composition executive board
4a. proposal to reappoint Jacques van den Broek as member of the executive board • Dutch national • appointed to the Executive Board in 2004 • appointed Chairman of the Executive Board and CEO in 2014 • reappointment for a period of 4 years
53

| |
4. composition executive board
4b. proposal to reappoint Chris Heutink as member of the executive board • Dutch national • appointed to the Executive Board in 2014 • reappointment for a period of 4 years • responsible for the Netherlands, Italy, Poland, Switzerland, Austria, Hungary, Czech Republic, Slovakia, Greece, Turkey and Global Client Solutions
54

| |
4. composition executive board
4c. proposal to appoint Henry Schirmer as member of the executive board • German national • proven track record • several international finance roles across markets and categories • appointment for a period of 4 years • remuneration in line with remuneration policy
55

| |
4. composition executive board
4d. proposal to ad-hoc amend the remuneration policy of the executive board in regard to the appointment of Henry Schirmer • One-off grant of Randstad shares • Retention period of 5 years • Retransfer pro ratio in case of early leave
56

| |
agenda
© randstad 57
1. opening
2. review 2017
3. discharge of liability
4. composition executive board
5. composition supervisory board
6. shares
7. other corporate affairs
8. external auditor
9. any other business
10. closing

| |
5. composition supervisory board
5a. proposal to reappoint Frank Dorjee as member of the supervisory board • Dutch national • member of the Supervisory Board since 2014 • chairman of the Audit Committee • reappointment for a period of 4 years
58

| |
5. composition supervisory board
5b. proposal to appoint Annet Aris as member of the supervisory board • Dutch national • extensive knowledge of digital transformation • appointment for a period of 4 years • chair of the remuneration committee
59

| |
agenda
© randstad 60
1. opening
2. review 2017
3. discharge of liability
4. composition executive board
5. composition supervisory board
6. shares
7. other corporate affairs
8. external auditor
9. any other business
10. closing

| |
6. shares
6a. proposal to extend the authority of the executive board to issue shares • valid for a period of 18 months • approval by the supervisory board • yearly allocation of performance shares not more than 1% • yearly maximum authorization of 3% of the issued capital • anti-dilution preference shares
61

| |
6. shares
6b. proposal to extend the authority of the executive board to restrict or exclude the pre-emptive right to any issue of shares • valid for a period of 18 months • approval by the supervisory board • yearly maximum authorization of 3% of the issued capital
62

| |
6. shares
6c. proposal to authorize the executive board to repurchase ordinary shares • valid for a period of 18 months • maximum of 10% of the issued share capital of ordinary shares • ordinary shares may be acquired for a price between the nominal value and 110% of the closing price
63

| |
6. shares
6d. proposal to cancel repurchased ordinary shares • valid for a period of 18 months • cancel ordinary shares up to a maximum of 10% of the issued share capital of ordinary shares
• only ordinary shares held by the company may be cancelled
64

| |
agenda
© randstad 65
1. opening
2. review 2017
3. discharge of liability
4. composition executive board
5. composition supervisory board
6. shares
7. other corporate affairs
8. external auditor
9. any other business
10. closing

| |
7. amendment of articles of association
7. proposal to amend the articles of association • name change Randstad Holding nv into Randstad N.V. • modernization of articles of association • update in line with recent changes to laws and regulations
66

| |
agenda
© randstad 67
1. opening
2. review 2017
3. discharge of liability
4. composition executive board
5. composition supervisory board
6. shares
7. other corporate affairs
8. external auditor
9. any other business
10. closing

| |
8. external auditor
8. proposal to reappoint Deloitte Accountants bv as external auditor for the financial year 2019 • initial appointment at the AGM in 2014 for the 2015 financial year
68

| |
agenda
© randstad 69
1. opening
2. review 2017
3. discharge of liability
4. composition executive board
5. composition supervisory board
6. shares
7. other corporate affairs
8. external auditor
9. any other business
10. closing

| |
agenda
© randstad 70
1. opening
2. review 2017
3. discharge of liability
4. composition executive board
5. composition supervisory board
6. shares
7. other corporate affairs
8. external auditor
9. any other business
10. closing
