annual financial results - new zealand exchange · fonterra annual financial results ... for the...
TRANSCRIPT
FONTERRA ANNUAL FINANCIAL RESULTS 2014 A
ANNUAL FINANCIAL
RESULTSFOR THE YEAR ENDED
31 JULY 2014

CONTENTS
DIRECTORS’ STATEMENT 1
INCOME STATEMENT 2
STATEMENT OF COMPREHENSIVE INCOME 3
STATEMENT OF FINANCIAL POSITION 4
STATEMENT OF CHANGES IN EQUITY 5
CASH FLOW STATEMENT 6
STATEMENT OF SIGNIFICANT ACCOUNTING POLICIES 7
NOTES TO THE FINANCIAL STATEMENTS 13
INDEPENDENT AUDITORS’ REPORT 54
STATUTORY INFORMATION 55
FIVE YEAR SUMMARY 67

FONTERRA ANNUAL FINANCIAL RESULTS 2014 1
DIRECTORS’ STATEMENT FOR THE YEAR ENDED 31 JULY 2014
The Directors of Fonterra Co-operative Group Limited (Fonterra or the Company) are pleased to present to Shareholders the Annual Report¹ and financial statements for Fonterra and its subsidiaries (together the Group) and the Group’s interest in its equity accounted investees for the year ended 31 July 2014.
The Directors are responsible for presenting financial statements for each financial year which give a true and fair view of the financial position for the Company and Group and of the financial performance and cash flows for that period.
The Directors consider the financial statements of the Company and Group have been prepared using accounting policies which have been consistently applied and supported by reasonable judgements and estimates, and that all relevant financial reporting and accounting standards have been followed.
The Directors believe that proper accounting records have been kept which enable, with reasonable accuracy, the determination of the financial position of the Company and Group and facilitate compliance of the financial statements with the Financial Reporting Act 1993.
The Directors consider that they have taken adequate steps to safeguard the assets of the Company and Group, and to prevent and detect fraud and other irregularities.
The Directors hereby approve and authorise for issue the Annual Report for the year ended 31 July 2014. For and on behalf of the Board:
JOHN WILSON DAVID JACKSONCHAIRMAN DIRECTOR
23 September 2014 23 September 2014
1 This document, in conjunction with the Fonterra Annual Review 2014, constitutes the 2014 Annual Report to Shareholders of Fonterra Co-operative Group Limited.

2 FONTERRA ANNUAL FINANCIAL RESULTS 2014
INCOME STATEMENTFOR THE YEAR ENDED 31 JULY 2014
GROUP $ MILLION PARENT $ MILLION
NOTES 31 JULY 2014 31 JULY 2013 31 JULY 2014 31 JULY 2013
Revenue from sale of goods 22,275 18,643 13,243 8,649
Dividends received – – 364 264
Total revenue 22,275 18,643 13,607 8,913
Cost of goods sold 1 (19,813) (15,611) (13,243) (8,649)
Gross profit 2,462 3,032 364 264
Other operating income 139 105 58 55
Selling and marketing expenses (593) (622) (21) (13)
Distribution expenses (499) (514) – –
Administrative expenses (762) (766) (262) (240)
Other operating expenses (356) (354) (80) (56)
Net foreign exchange gains/(losses) 3 39 (7) – –
Share of profit of equity accounted investees 11 73 63 – –
Profit before net finance costs and tax 2 503 937 59 10
Finance income 4 13 25 290 276
Finance costs 4 (379) (294) (323) (251)
Net finance (costs)/income (366) (269) (33) 25
Profit before tax 137 668 26 35
Tax credit 5 42 68 141 195
Profit after tax 179 736 167 230
Profit after tax is attributable to:
Equity holders of the Parent 157 718 167 230
Non-controlling interests 22 18 – –
Profit after tax 179 736 167 230
GROUP $
31 JULY 2014 31 JULY 2013
Earnings per share:
Basic and diluted earnings per share 24 0.10 0.44
The accompanying notes form part of these financial statements.

FONTERRA ANNUAL FINANCIAL RESULTS 2014 3
STATEMENT OF COMPREHENSIVE INCOMEFOR THE YEAR ENDED 31 JULY 2014
GROUP $ MILLION PARENT $ MILLION
31 JULY 2014 31 JULY 2013 31 JULY 2014 31 JULY 2013
Profit after tax 179 736 167 230
Items that may be reclassified subsequently to profit or loss:
Cash flow hedges:
– Net fair value gains 732 116 4 10
– Transferred and reported in revenue from sale of goods (505) (317) – –
– Tax (expense)/credit on cash flow hedges (63) 56 (1) (3)
Net investment hedges:
– Net fair value gains/(losses) on hedging instruments 25 (5) – –
– Tax (expense)/credit on net investment hedges (7) 2 – –
Available-for-sale investments:
– Net fair value losses on available-for-sale investments (1) – – –
Foreign currency translation losses attributable to equity holders (207) (45) – –
Foreign currency translation reserve transferred to income statement – (7) – –
Share of equity accounted investees’ movements in reserves (11) (1) – –
Total items that may be reclassified subsequently to profit or loss (37) (201) 3 7
Items that will not be reclassified subsequently to profit or loss:
Foreign currency translation (losses)/gains attributable to non-controlling interests (4) 1 – –
Total items that will not be reclassified subsequently to profit or loss (4) 1 – –
Total other comprehensive (expense)/income recognised directly in equity (41) (200) 3 7
Total comprehensive income 138 536 170 237
Total comprehensive income is attributable to:
Equity holders of the Parent 120 517 170 237
Non-controlling interests 18 19 – –
Total comprehensive income 138 536 170 237
The accompanying notes form part of these financial statements.
4 FONTERRA ANNUAL FINANCIAL RESULTS 2014
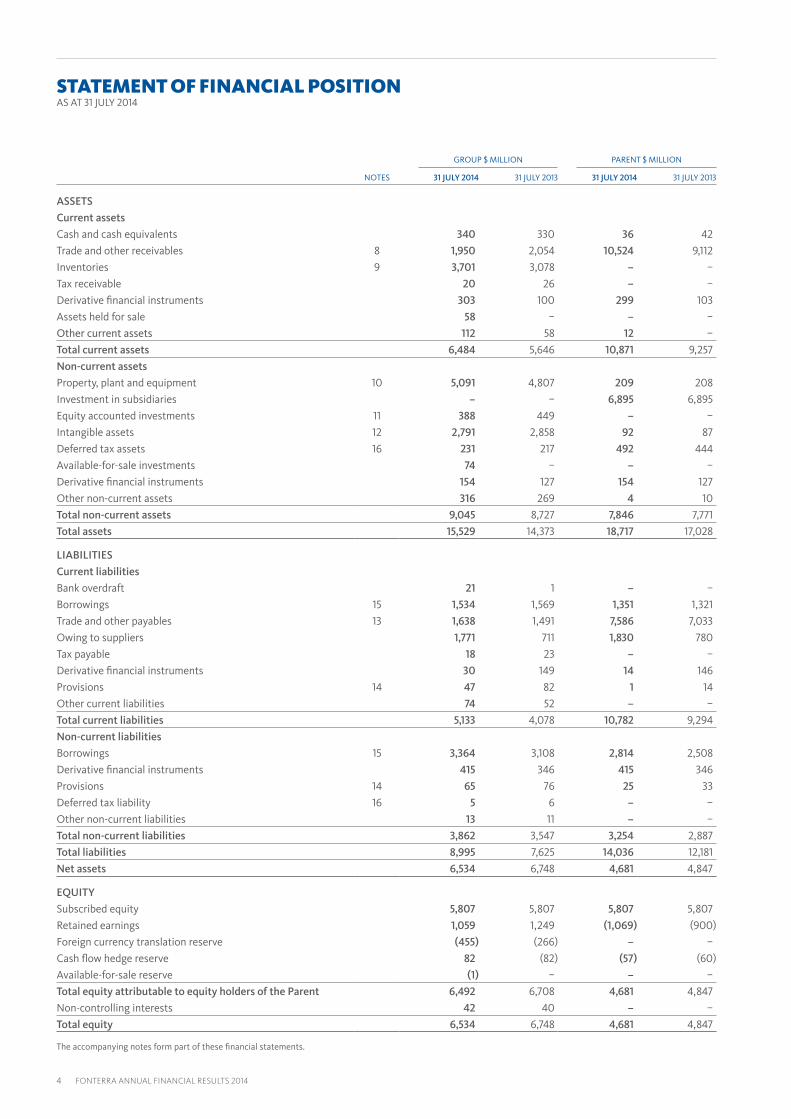
STATEMENT OF FINANCIAL POSITIONAS AT 31 JULY 2014
GROUP $ MILLION PARENT $ MILLION
NOTES 31 JULY 2014 31 JULY 2013 31 JULY 2014 31 JULY 2013
ASSETS
Current assets
Cash and cash equivalents 340 330 36 42
Trade and other receivables 8 1,950 2,054 10,524 9,112
Inventories 9 3,701 3,078 – –
Tax receivable 20 26 – –
Derivative financial instruments 303 100 299 103
Assets held for sale 58 – – –
Other current assets 112 58 12 –
Total current assets 6,484 5,646 10,871 9,257
Non-current assets
Property, plant and equipment 10 5,091 4,807 209 208
Investment in subsidiaries – – 6,895 6,895
Equity accounted investments 11 388 449 – –
Intangible assets 12 2,791 2,858 92 87
Deferred tax assets 16 231 217 492 444
Available-for-sale investments 74 – – –
Derivative financial instruments 154 127 154 127
Other non-current assets 316 269 4 10
Total non-current assets 9,045 8,727 7,846 7,771
Total assets 15,529 14,373 18,717 17,028
LIABILITIES
Current liabilities
Bank overdraft 21 1 – –
Borrowings 15 1,534 1,569 1,351 1,321
Trade and other payables 13 1,638 1,491 7,586 7,033
Owing to suppliers 1,771 711 1,830 780
Tax payable 18 23 – –
Derivative financial instruments 30 149 14 146
Provisions 14 47 82 1 14
Other current liabilities 74 52 – –
Total current liabilities 5,133 4,078 10,782 9,294
Non-current liabilities
Borrowings 15 3,364 3,108 2,814 2,508
Derivative financial instruments 415 346 415 346
Provisions 14 65 76 25 33
Deferred tax liability 16 5 6 – –
Other non-current liabilities 13 11 – –
Total non-current liabilities 3,862 3,547 3,254 2,887
Total liabilities 8,995 7,625 14,036 12,181
Net assets 6,534 6,748 4,681 4,847
EQUITY
Subscribed equity 5,807 5,807 5,807 5,807
Retained earnings 1,059 1,249 (1,069) (900)
Foreign currency translation reserve (455) (266) – –
Cash flow hedge reserve 82 (82) (57) (60)
Available-for-sale reserve (1) – – –
Total equity attributable to equity holders of the Parent 6,492 6,708 4,681 4,847
Non-controlling interests 42 40 – –
Total equity 6,534 6,748 4,681 4,847
The accompanying notes form part of these financial statements.

FONTERRA ANNUAL FINANCIAL RESULTS 2014 5
STATEMENT OF CHANGES IN EQUITYFOR THE YEAR ENDED 31 JULY 2014
ATTRIBUTABLE TO EQUITY HOLDERS OF THE PARENT
GROUP $ MILLIONSUBSCRIBED
EQUITYRETAINED
EARNINGS
FOREIGN CURRENCY
TRANSLATION RESERVE
CASH FLOW HEDGE
RESERVE
AVAILABLE-FOR-SALE RESERVE TOTAL
NON- CONTROLLING
INTERESTSTOTAL
EQUITY
As at 1 August 2013 5,807 1,249 (266) (82) – 6,708 40 6,748
Profit after tax – 157 – – – 157 22 179
Other comprehensive (expense)/income – (11) (189) 164 (1) (37) (4) (41)
Total comprehensive income/(expense) – 146 (189) 164 (1) 120 18 138
Transactions with equity holders in their capacity as equity holders:
Dividend paid to equity holders of the Parent – (336) – – – (336) – (336)
Dividend paid to non-controlling interests – – – – – – (16) (16)
As at 31 July 2014 5,807 1,059 (455) 82 (1) 6,492 42 6,534
As at 1 August 2012 5,690 1,078 (211) 63 – 6,620 35 6,655
Profit after tax – 718 – – – 718 18 736
Other comprehensive (expense)/income – (1) (55) (145) – (201) 1 (200)
Total comprehensive income/(expense) – 717 (55) (145) – 517 19 536
Transactions with equity holders in their capacity as equity holders:
Dividend paid to equity holders of the Parent – (546) – – – (546) – (546)
Equity instruments issued 611 – – – – 611 – 611
Equity instruments cancelled (475) – – – – (475) – (475)
Equity instruments surrendered (1) – – – – (1) – (1)
Equity transaction costs (18) – – – – (18) – (18)
Dividend paid to non-controlling interests – – – – – – (14) (14)
As at 31 July 2013 5,807 1,249 (266) (82) – 6,708 40 6,748
PARENT $ MILLIONSUBSCRIBED
EQUITYACCUMULATED
LOSSES
CASH FLOW HEDGE
RESERVETOTAL
EQUITY
As at 1 August 2013 5,807 (900) (60) 4,847
Profit after tax – 167 – 167
Other comprehensive income – – 3 3
Total comprehensive income – 167 3 170
Transactions with equity holders in their capacity as equity holders:
Dividend paid to equity holders – (336) – (336)
As at 31 July 2014 5,807 (1,069) (57) 4,681
As at 1 August 2012 5,690 (584) (67) 5,039
Profit after tax – 230 – 230
Other comprehensive income – – 7 7
Total comprehensive income – 230 7 237
Transactions with equity holders in their capacity as equity holders:
Dividend paid to equity holders – (546) – (546)
Equity instruments issued 611 – – 611
Equity instruments cancelled (475) – – (475)
Equity instruments surrendered (1) – – (1)
Equity transaction costs (18) – – (18)
As at 31 July 2013 5,807 (900) (60) 4,847
The accompanying notes form part of these financial statements.

6 FONTERRA ANNUAL FINANCIAL RESULTS 2014
GROUP $ MILLION PARENT $ MILLION
31 JULY 2014 31 JULY 2013 31 JULY 2014 31 JULY 2013
Cash flows from operating activitiesProfit before net finance costs and tax 503 937 59 10Adjustments for:Foreign exchange losses 11 1 – –Depreciation and amortisation 538 530 49 45Movement in provisions 132 (17) (16) (8)Other (41) (16) (363) (264)
640 498 (330) (227)(Increase)/decrease in working capital:Inventories (757) (43) – –Trade and other receivables (111) 38 1 (3)Amounts owing to suppliers 1,060 (410) 1,050 (396)Payables and accruals 111 68 – 18Other movements (28) (8) 30 –Total 275 (355) 1,081 (381)Cash generated from operations 1,418 1,080 810 (598)Net taxes paid (51) (83) – –Net cash flows from operating activities 1,367 997 810 (598)Cash flows from investing activitiesCash was provided from:
– Proceeds from sale of Group entities and other business operations 46 5 – –– Proceeds from disposal of property, plant and equipment 12 22 – –– Net loans from Group entities – – – 654– Other cash inflows 21 5 – –
Cash was applied to:– Acquisition of Group entities and other business operations (18) (49) – –– Acquisition of available-for-sale investments (78) – – –– Acquisition of property, plant and equipment (791) (701) (27) (27)– Acquisition of intangible assets (102) (147) (31) (26)– Net loans to Group entities – – (557) –– Other cash outflows (99) (3) – –
Net cash flows from investing activities (1,009) (868) (615) 601Cash flows from financing activitiesCash was provided from:
– Proceeds from borrowings 4,241 3,188 3,788 2,914– Proceeds from issue of equity instruments – 653 – 611– Proceeds for equity instruments not yet issued – – – 42– Interest received 13 26 8 13– Other cash inflows 8 3 – –
Cash was applied to:– Interest paid (332) (334) (279) (297)– Repayment of borrowings (3,894) (3,268) (3,382) (2,998)– Settlement of borrowing derivatives (24) – – –– Surrendered/cancelled equity instruments – (475) – (475)– Dividends paid to non-controlling interests (16) (14) – –– Dividends paid to equity holders of the Parent (336) (546) (336) (546)– Equity transaction costs – (18) – (18)– Other cash outflows – (1) – –
Net cash flows from financing activities (340) (786) (201) (754)Net increase/(decrease) in cash and cash equivalents 18 (657) (6) (751)Cash and cash equivalents at the beginning of the year 329 991 42 793Effect of exchange rate changes on cash balances (28) (5) – –Cash and cash equivalents at the end of the year 319 329 36 42Reconciliation of closing cash balances to the statement of financial position:Cash and cash equivalents 340 330 36 42Bank overdraft (21) (1) – –Closing cash balances 319 329 36 42
Parent undertakes financing activities for the Group. As a result receipts and payments from and to subsidiaries for operating and financing activities (including dividends) are settled on a net basis and presented in investing activities as net loans from Group entities.
CASH FLOW STATEMENTFOR THE YEAR ENDED 31 JULY 2014
The accompanying notes form part of these financial statements.
FONTERRA ANNUAL FINANCIAL RESULTS 2014 7
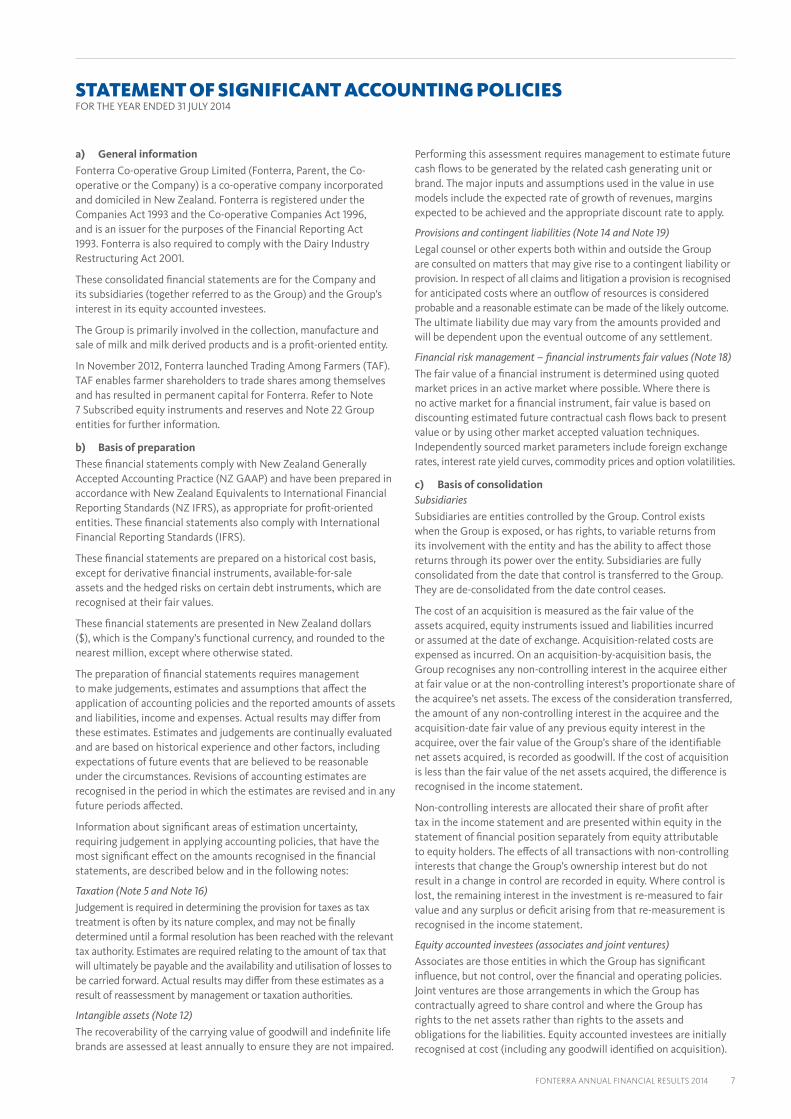
STATEMENT OF SIGNIFICANT ACCOUNTING POLICIESFOR THE YEAR ENDED 31 JULY 2014
a) General informationFonterra Co-operative Group Limited (Fonterra, Parent, the Co-operative or the Company) is a co-operative company incorporated and domiciled in New Zealand. Fonterra is registered under the Companies Act 1993 and the Co-operative Companies Act 1996, and is an issuer for the purposes of the Financial Reporting Act 1993. Fonterra is also required to comply with the Dairy Industry Restructuring Act 2001.
These consolidated financial statements are for the Company and its subsidiaries (together referred to as the Group) and the Group’s interest in its equity accounted investees.
The Group is primarily involved in the collection, manufacture and sale of milk and milk derived products and is a profit-oriented entity.
In November 2012, Fonterra launched Trading Among Farmers (TAF). TAF enables farmer shareholders to trade shares among themselves and has resulted in permanent capital for Fonterra. Refer to Note 7 Subscribed equity instruments and reserves and Note 22 Group entities for further information.
b) Basis of preparationThese financial statements comply with New Zealand Generally Accepted Accounting Practice (NZ GAAP) and have been prepared in accordance with New Zealand Equivalents to International Financial Reporting Standards (NZ IFRS), as appropriate for profit-oriented entities. These financial statements also comply with International Financial Reporting Standards (IFRS).
These financial statements are prepared on a historical cost basis, except for derivative financial instruments, available-for-sale assets and the hedged risks on certain debt instruments, which are recognised at their fair values.
These financial statements are presented in New Zealand dollars ($), which is the Company’s functional currency, and rounded to the nearest million, except where otherwise stated.
The preparation of financial statements requires management to make judgements, estimates and assumptions that affect the application of accounting policies and the reported amounts of assets and liabilities, income and expenses. Actual results may differ from these estimates. Estimates and judgements are continually evaluated and are based on historical experience and other factors, including expectations of future events that are believed to be reasonable under the circumstances. Revisions of accounting estimates are recognised in the period in which the estimates are revised and in any future periods affected.
Information about significant areas of estimation uncertainty, requiring judgement in applying accounting policies, that have the most significant effect on the amounts recognised in the financial statements, are described below and in the following notes:
Taxation (Note 5 and Note 16)Judgement is required in determining the provision for taxes as tax treatment is often by its nature complex, and may not be finally determined until a formal resolution has been reached with the relevant tax authority. Estimates are required relating to the amount of tax that will ultimately be payable and the availability and utilisation of losses to be carried forward. Actual results may differ from these estimates as a result of reassessment by management or taxation authorities.
Intangible assets (Note 12)The recoverability of the carrying value of goodwill and indefinite life brands are assessed at least annually to ensure they are not impaired.
Performing this assessment requires management to estimate future cash flows to be generated by the related cash generating unit or brand. The major inputs and assumptions used in the value in use models include the expected rate of growth of revenues, margins expected to be achieved and the appropriate discount rate to apply.
Provisions and contingent liabilities (Note 14 and Note 19)Legal counsel or other experts both within and outside the Group are consulted on matters that may give rise to a contingent liability or provision. In respect of all claims and litigation a provision is recognised for anticipated costs where an outflow of resources is considered probable and a reasonable estimate can be made of the likely outcome. The ultimate liability due may vary from the amounts provided and will be dependent upon the eventual outcome of any settlement.
Financial risk management – financial instruments fair values (Note 18)The fair value of a financial instrument is determined using quoted market prices in an active market where possible. Where there is no active market for a financial instrument, fair value is based on discounting estimated future contractual cash flows back to present value or by using other market accepted valuation techniques. Independently sourced market parameters include foreign exchange rates, interest rate yield curves, commodity prices and option volatilities.
c) Basis of consolidationSubsidiariesSubsidiaries are entities controlled by the Group. Control exists when the Group is exposed, or has rights, to variable returns from its involvement with the entity and has the ability to affect those returns through its power over the entity. Subsidiaries are fully consolidated from the date that control is transferred to the Group. They are de-consolidated from the date control ceases.
The cost of an acquisition is measured as the fair value of the assets acquired, equity instruments issued and liabilities incurred or assumed at the date of exchange. Acquisition-related costs are expensed as incurred. On an acquisition-by-acquisition basis, the Group recognises any non-controlling interest in the acquiree either at fair value or at the non-controlling interest’s proportionate share of the acquiree’s net assets. The excess of the consideration transferred, the amount of any non-controlling interest in the acquiree and the acquisition-date fair value of any previous equity interest in the acquiree, over the fair value of the Group’s share of the identifiable net assets acquired, is recorded as goodwill. If the cost of acquisition is less than the fair value of the net assets acquired, the difference is recognised in the income statement.
Non-controlling interests are allocated their share of profit after tax in the income statement and are presented within equity in the statement of financial position separately from equity attributable to equity holders. The effects of all transactions with non-controlling interests that change the Group’s ownership interest but do not result in a change in control are recorded in equity. Where control is lost, the remaining interest in the investment is re-measured to fair value and any surplus or deficit arising from that re-measurement is recognised in the income statement.
Equity accounted investees (associates and joint ventures)Associates are those entities in which the Group has significant influence, but not control, over the financial and operating policies. Joint ventures are those arrangements in which the Group has contractually agreed to share control and where the Group has rights to the net assets rather than rights to the assets and obligations for the liabilities. Equity accounted investees are initially recognised at cost (including any goodwill identified on acquisition).

8 FONTERRA ANNUAL FINANCIAL RESULTS 2014
Subsequent to initial recognition they are accounted for using the equity method in the consolidated financial statements.
The consolidated financial statements include the Group’s share of the profit or loss after tax of equity accounted investees after adjustments to align to the accounting policies of the Group, from the date that significant influence or joint control commences until the date that significant influence or joint control ceases. When the Group’s share of losses exceeds its interest in an equity accounted investee, the carrying amount of that interest is reduced to nil and no further losses are recognised except to the extent the Group has an obligation or has made payments on behalf of the investee. Dividends receivable from equity accounted investees reduce the carrying amount of the investment.
The Group determines at each reporting date whether there is any objective evidence that its investments in equity accounted investees are impaired. If this is the case, the Group calculates the amount of impairment as the difference between the recoverable amount of the investee and its carrying value, and recognises that amount in the income statement.
Transactions eliminated on consolidationIntra-group transactions, balances, and any unrealised income and expenses arising from intra-group transactions, are eliminated in preparing the consolidated financial statements. Unrealised gains arising from transactions with equity accounted investees are eliminated against the investment to the extent of the Group’s interest in the investee. Unrealised losses are eliminated in the same way as unrealised gains, but only to the extent that there is no evidence of impairment.
d) Segmental reportingOperating segments are reported in a manner consistent with the internal reporting provided to the chief operating decision maker. The Group’s chief operating decision maker has been identified as the Fonterra Management Team.
e) Subscribed equityEquity instruments comprise Co-operative shares and units in the Fonterra Shareholders’ Fund and are classified as subscribed equity. Incremental costs directly attributable to equity transactions are recognised as a deduction from subscribed equity.
Co-operative shares may only be held by a shareholder supplying milk to the Company in a season (farmer shareholder) and Fonterra Farmer Custodian Limited (the Custodian).
f) Foreign currencyForeign currency transactionsForeign currency transactions are translated into the respective functional currencies of Group entities using the exchange rate at the dates of transactions. Foreign exchange gains and losses resulting from the settlement of such transactions and from the translation, using the exchange rates at the balance date, of monetary assets and liabilities denominated in foreign currencies are recognised in the income statement, except when deferred in other comprehensive income as qualifying cash flow or qualifying net investment hedges.
Translation of the financial statements into the presentation currencyWhere the Company’s presentation currency differs from the functional currency of an entity, the assets and liabilities of the operation are translated from the functional currency into the presentation currency at the exchange rates at the balance date. The income and expenses of these entities are translated at rates approximating the exchange rates at the dates of the transactions.
Exchange differences arising on the translation of the financial statements of these entities and of borrowings and other currency instruments designated as hedges of such investments are recognised directly in the foreign currency translation reserve. When an entity is partially disposed of or sold, the exchange differences that were recorded in equity are recognised in the income statement as part of the gain or loss on sale.
g) Financial assets and liabilitiesA financial asset or liability is recognised if the Group becomes a party to the contractual provisions of the asset or liability. A financial asset or liability is recognised initially at its fair value plus, in the case of a financial asset or liability not at fair value through profit or loss, transaction costs that are directly attributable to the acquisition or issue of the instrument. Financial assets and liabilities carried at fair value through profit or loss are initially recognised at fair value and transaction costs are expensed in the income statement.
Financial assets are classified on initial recognition into the following categories: at fair value through profit or loss, held-to-maturity investments, loans and receivables, and available-for-sale. Financial liabilities are classified as either fair value through profit or loss, or financial liabilities measured at amortised cost. The classification depends on the purpose for which the financial assets and liabilities were acquired. Management determines the classification of its financial assets and liabilities at initial recognition. The Group has not had any held-to-maturity investments in the periods covered by these financial statements.
After initial recognition, financial assets are measured at their fair values, except for loans and receivables, which are measured at amortised cost less any provision for impairment. After initial recognition, financial liabilities are measured at amortised cost except for financial liabilities at fair value through profit or loss.
In the separate financial statements of the Parent, investments in subsidiaries are stated at cost, less any impairment.
Financial assets are derecognised if the Group’s contractual rights to the cash flows from the financial assets expire or if the Group transfers the financial asset to another party without retaining control or substantially all risks and rewards of the asset. Financial liabilities are derecognised if the Group’s obligations specified in the contract expire or are discharged or cancelled.
Financial assets and financial liabilities are offset and the net amount is reported in the statement of financial position when there is a legally enforceable right to offset the recognised amounts and there is an intention to settle on a net basis.
Financial assets and financial liabilities at fair value through profit or lossFinancial assets and liabilities in this category are either designated as fair value through profit or loss, or classified as held for trading. All derivatives are classified as held for trading except when they are in cash flow, fair value, or net investment hedge relationships (refer to accounting policy (m) below). Other financial assets and financial liabilities may be designated at fair value through profit or loss where this eliminates an accounting mismatch, or where they are managed on a fair value basis.
Loans and receivablesLoans and receivables are non-derivative financial assets with fixed or determinable payments that are not quoted in an active market. Trade and other receivables are classified as loans and receivables.
STATEMENT OF SIGNIFICANT ACCOUNTING POLICIES CONTINUEDFOR THE YEAR ENDED 31 JULY 2014
FONTERRA ANNUAL FINANCIAL RESULTS 2014 9
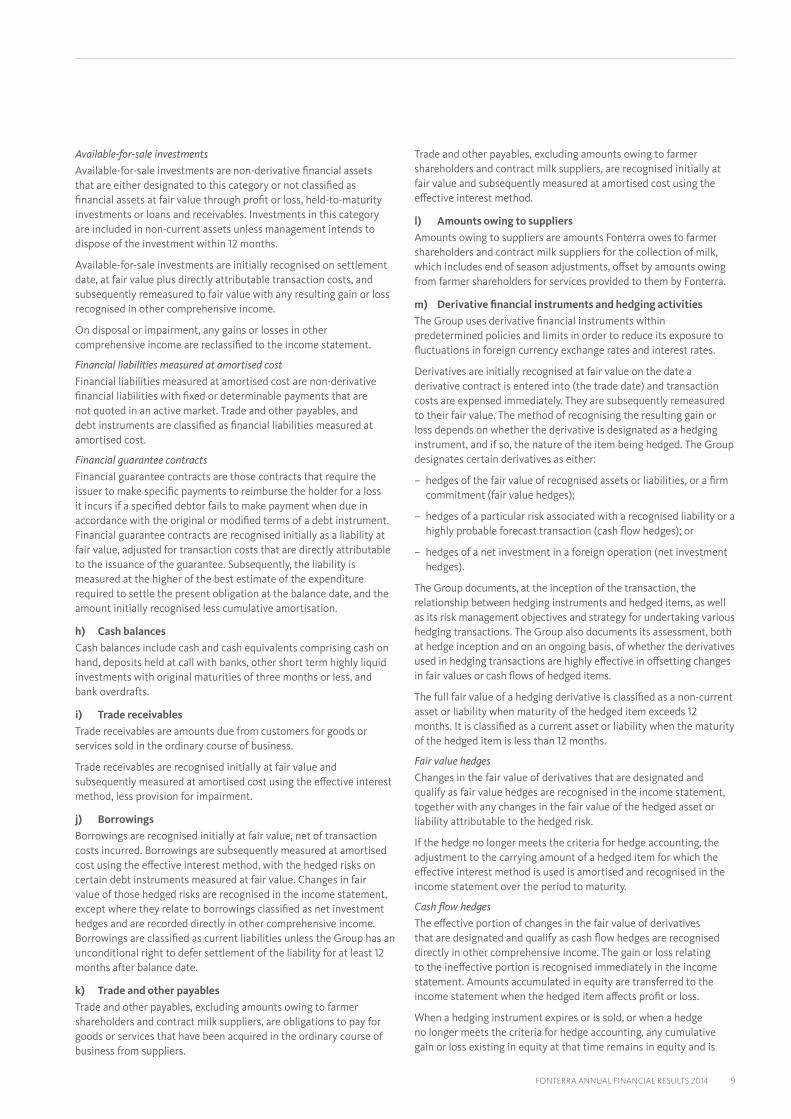
Available-for-sale investmentsAvailable-for-sale investments are non-derivative financial assets that are either designated to this category or not classified as financial assets at fair value through profit or loss, held-to-maturity investments or loans and receivables. Investments in this category are included in non-current assets unless management intends to dispose of the investment within 12 months.
Available-for-sale investments are initially recognised on settlement date, at fair value plus directly attributable transaction costs, and subsequently remeasured to fair value with any resulting gain or loss recognised in other comprehensive income.
On disposal or impairment, any gains or losses in other comprehensive income are reclassified to the income statement.
Financial liabilities measured at amortised costFinancial liabilities measured at amortised cost are non-derivative financial liabilities with fixed or determinable payments that are not quoted in an active market. Trade and other payables, and debt instruments are classified as financial liabilities measured at amortised cost.
Financial guarantee contractsFinancial guarantee contracts are those contracts that require the issuer to make specific payments to reimburse the holder for a loss it incurs if a specified debtor fails to make payment when due in accordance with the original or modified terms of a debt instrument. Financial guarantee contracts are recognised initially as a liability at fair value, adjusted for transaction costs that are directly attributable to the issuance of the guarantee. Subsequently, the liability is measured at the higher of the best estimate of the expenditure required to settle the present obligation at the balance date, and the amount initially recognised less cumulative amortisation.
h) Cash balancesCash balances include cash and cash equivalents comprising cash on hand, deposits held at call with banks, other short term highly liquid investments with original maturities of three months or less, and bank overdrafts.
i) Trade receivablesTrade receivables are amounts due from customers for goods or services sold in the ordinary course of business.
Trade receivables are recognised initially at fair value and subsequently measured at amortised cost using the effective interest method, less provision for impairment.
j) BorrowingsBorrowings are recognised initially at fair value, net of transaction costs incurred. Borrowings are subsequently measured at amortised cost using the effective interest method, with the hedged risks on certain debt instruments measured at fair value. Changes in fair value of those hedged risks are recognised in the income statement, except where they relate to borrowings classified as net investment hedges and are recorded directly in other comprehensive income. Borrowings are classified as current liabilities unless the Group has an unconditional right to defer settlement of the liability for at least 12 months after balance date.
k) Trade and other payablesTrade and other payables, excluding amounts owing to farmer shareholders and contract milk suppliers, are obligations to pay for goods or services that have been acquired in the ordinary course of business from suppliers.
Trade and other payables, excluding amounts owing to farmer shareholders and contract milk suppliers, are recognised initially at fair value and subsequently measured at amortised cost using the effective interest method.
l) Amounts owing to suppliersAmounts owing to suppliers are amounts Fonterra owes to farmer shareholders and contract milk suppliers for the collection of milk, which includes end of season adjustments, offset by amounts owing from farmer shareholders for services provided to them by Fonterra.
m) Derivative financial instruments and hedging activitiesThe Group uses derivative financial instruments within predetermined policies and limits in order to reduce its exposure to fluctuations in foreign currency exchange rates and interest rates.
Derivatives are initially recognised at fair value on the date a derivative contract is entered into (the trade date) and transaction costs are expensed immediately. They are subsequently remeasured to their fair value. The method of recognising the resulting gain or loss depends on whether the derivative is designated as a hedging instrument, and if so, the nature of the item being hedged. The Group designates certain derivatives as either:
– hedges of the fair value of recognised assets or liabilities, or a firm commitment (fair value hedges);
– hedges of a particular risk associated with a recognised liability or a highly probable forecast transaction (cash flow hedges); or
– hedges of a net investment in a foreign operation (net investment hedges).
The Group documents, at the inception of the transaction, the relationship between hedging instruments and hedged items, as well as its risk management objectives and strategy for undertaking various hedging transactions. The Group also documents its assessment, both at hedge inception and on an ongoing basis, of whether the derivatives used in hedging transactions are highly effective in offsetting changes in fair values or cash flows of hedged items.
The full fair value of a hedging derivative is classified as a non-current asset or liability when maturity of the hedged item exceeds 12 months. It is classified as a current asset or liability when the maturity of the hedged item is less than 12 months.
Fair value hedges Changes in the fair value of derivatives that are designated and qualify as fair value hedges are recognised in the income statement, together with any changes in the fair value of the hedged asset or liability attributable to the hedged risk.
If the hedge no longer meets the criteria for hedge accounting, the adjustment to the carrying amount of a hedged item for which the effective interest method is used is amortised and recognised in the income statement over the period to maturity.
Cash flow hedgesThe effective portion of changes in the fair value of derivatives that are designated and qualify as cash flow hedges are recognised directly in other comprehensive income. The gain or loss relating to the ineffective portion is recognised immediately in the income statement. Amounts accumulated in equity are transferred to the income statement when the hedged item affects profit or loss.
When a hedging instrument expires or is sold, or when a hedge no longer meets the criteria for hedge accounting, any cumulative gain or loss existing in equity at that time remains in equity and is
10 FONTERRA ANNUAL FINANCIAL RESULTS 2014
recognised when the forecast transaction is ultimately recognised in the income statement. When a forecast transaction is no longer expected to occur, the cumulative gain or loss that was reported in equity is recognised immediately in the income statement.
When the forecast transaction that is hedged results in the recognition of a non-financial asset (e.g. inventory or property, plant and equipment) the gains and losses previously deferred in equity are transferred from equity and included in the initial measurement of the cost of the asset.
Net investment hedgesHedges of net investments in foreign operations are accounted for similarly to cash flow hedges. Any gain or loss on the hedging instrument relating to the effective portion of the hedge is recognised in other comprehensive income. The gain or loss relating to the ineffective portion is recognised immediately in the income statement.
Gains and losses accumulated in equity are included in the income statement when all or part of a foreign operation is disposed of or sold.
n) InventoriesInventories are stated at the lower of cost and net realisable value on a first in first out basis.
Net realisable value is the estimated selling price in the ordinary course of business, less the costs of completion and selling expenses.
The cost of dairy product manufactured from milk supplied in New Zealand is established by using the Farmgate Milk Price as determined by the Board, applied on a monthly basis, as the cost for raw milk supplied. In the case of manufactured inventories and work in progress, cost includes all direct costs plus that portion of the fixed and variable production overhead incurred in bringing inventories into their present location and condition.
o) Property, plant and equipmentOwned assetsItems of property, plant and equipment are measured at cost less accumulated depreciation and impairment losses. Cost includes the purchase consideration and those costs directly attributable to bringing the asset to the location and condition necessary for its intended use. Costs cease to be capitalised when substantially all the activities necessary to bring an asset to the location and condition for its intended use are complete. Subsequent costs are included in the asset’s carrying amount or recognised as a separate asset, as appropriate, only when it is probable that future economic benefits associated with the item will flow to the Group and the cost of the item can be measured reliably. The carrying amount of any replaced part is derecognised. All other repairs and maintenance are charged to the income statement during the financial period in which they are incurred.
Finance costs directly attributable to the acquisition, construction or production of a qualifying asset are capitalised as part of the cost of that asset.
The assets’ residual values and useful lives are reviewed and adjusted, if appropriate, at each financial year end.
Gains and losses on disposals are determined by comparing the proceeds with the carrying amount, and are recognised in the income statement.
DepreciationDepreciation is calculated on a straight line basis to allocate the cost of the asset, less any residual value, over its estimated useful life. The range of estimated useful lives for each class of property, plant and equipment is as follows:
– Land Indefinite
– Buildings and leasehold improvements 15 – 50 years
– Plant, vehicles and equipment 3 – 25 years
Leased assetsLeases of property, plant and equipment where the Group assumes substantially all the risks and rewards of ownership are classified as finance leases.
Assets under finance leases are recognised as property, plant and equipment in the statement of financial position. They are recognised initially at their fair value, or if lower, at the present value of the minimum lease payments. A corresponding liability is established and each lease payment allocated between the liability and interest expense using the effective interest method. The assets recognised are depreciated on the same basis as equivalent property, plant and equipment.
Leases that are not finance leases are classified as operating leases and the leased assets are not recognised on the Group’s statement of financial position. Operating lease payments are recognised as an expense on a straight line basis over the term of the lease.
p) Intangible assetsGoodwillGoodwill represents the excess of the cost of an acquisition over the fair value of the Group’s share of the net identifiable assets of the acquired subsidiary or equity accounted investee at the date of acquisition. Goodwill on acquisitions of subsidiaries is included in intangible assets. Goodwill on acquisitions of equity accounted investees is included in equity accounted investments and is tested for impairment as part of the overall balance.
Goodwill is carried at cost less accumulated impairment losses. Impairment losses on goodwill are not reversed. Goodwill is tested annually for impairment or whenever events or changes in circumstances indicate that the carrying amount may not be recoverable. Gains and losses on the disposal of an entity include the carrying amount of goodwill relating to the entity sold.
Goodwill is allocated to cash-generating units for the purpose of impairment testing. The allocation is made to those cash-generating units or groups of cash-generating units that are expected to benefit from the business combination in which the goodwill arose.
Brands and other identifiable intangible assetsBrands and other intangible assets purchased by the Group are recognised if the asset is controlled through custody or legal rights and could be sold separately from the rest of the business. Brands and other intangible assets have a combination of both indefinite and finite useful lives. Items with indefinite useful lives are carried at cost less accumulated impairment losses and are tested for impairment annually or whenever there is an indication that an asset may be impaired. Items with finite useful lives are carried at cost less accumulated amortisation and accumulated impairment losses, and are amortised on a straight line basis to allocate the cost over their licence period (25 – 28 years). Assets that have been impaired are reviewed for possible reversal of impairment at each balance date.
Computer softwareAcquired computer software licences are capitalised on the basis of the costs incurred to acquire and bring to use the specific software.
Costs associated with developing or maintaining computer software programmes are recognised as an expense as incurred. Costs that are directly associated with the development of identifiable and unique software products controlled by the Group, and that will generate
STATEMENT OF SIGNIFICANT ACCOUNTING POLICIES CONTINUEDFOR THE YEAR ENDED 31 JULY 2014
FONTERRA ANNUAL FINANCIAL RESULTS 2014 11
economic benefits exceeding costs beyond one year, are recognised as intangible assets. Costs include the employee costs incurred as a result of developing software and an appropriate portion of relevant overheads.
Computer software licences and development costs recognised as assets are amortised on a straight line basis over their estimated useful lives, being three to ten years.
Research and development expenditureAll research expenditure is recognised in the income statement as incurred. Significant development expenditure is recognised as an asset when it can be demonstrated that the commercial production of the material or product, or use of the process, will commence.
Development expenditure recognised as an asset is stated at cost and amortised over the period of expected benefits on a straight line basis, not exceeding five years. Amortisation begins at the time that commercial production or use of the process commences. All other development expenditure is recognised in the income statement as incurred.
q) Impairment of financial assetsAssets carried at amortised costThe Group assesses at the end of each reporting period whether there is objective evidence that a financial asset or group of financial assets is impaired. A financial asset or a group of financial assets is impaired and impairment losses are incurred only if there is objective evidence of impairment as a result of one or more events that occurred after the initial recognition of the asset (a ‘loss event’) and that loss event (or events) has an impact on the estimated future cash flows of the financial asset or group of financial assets that can be reliably estimated.
The criteria that the Group uses to determine that there is objective evidence of an impairment loss include:
– significant financial difficulty of the customer;
– a breach of contract, such as a default or delinquency in payments;
– for economic or legal reasons relating to the customer’s financial difficulty, granting to the customer a concession that the Group would not otherwise consider;
– it becomes probable that the customer will enter bankruptcy or other financial reorganisation.
The amount of the loss is measured as the difference between the asset’s carrying amount and the present value of estimated future cash flows (excluding future credit losses that have not been incurred) discounted at the financial asset’s original effective interest rate and is recognised in the income statement.
If, in a subsequent period, the amount of the impairment loss decreases and the decrease can be related objectively to an event occurring after the impairment was recognised (such as an improvement in the debtor’s credit rating), the reversal of the previously recognised impairment loss is recognised in the income statement.
Available-for-sale financial assetsThe Group assesses at the end of each reporting period whether there is objective evidence that available-for-sale financial assets are impaired. In the case of equity investments classified as available-for-sale, objective evidence includes a significant or prolonged decline in the fair value of the investment below its cost. The determination of what is ‘significant’ or ‘prolonged’ requires judgement. In making this judgement the Group evaluates, among other factors, the duration or extent to which the fair value of an investment is less than its cost.
r) Impairment of non-financial assetsIntangible assets that have an indefinite useful life are not subject to amortisation and are tested for impairment annually or whenever there is an indication that an asset may be impaired. Other assets are tested for impairment whenever events or changes in circumstances indicate that the carrying amount may not be recoverable. If the estimated recoverable amount of an asset is less than its carrying amount, the asset is written down to its estimated recoverable amount and an impairment loss is recognised in the income statement. The recoverable amount of an asset is the higher of its fair value less costs to sell and value in use. For the purposes of assessing impairment, assets are grouped at the lowest level for which there are separately identifiable cash inflows (cash-generating units).
Non-financial assets, other than goodwill, that have been impaired are reviewed for possible reversal of the impairment at each balance date. A reversal of an impairment loss shall not exceed the carrying amount that would have been determined, net of amortisation or depreciation, had no impairment loss been recognised for the asset in prior years.
s) ProvisionsProvisions are recognised only in those circumstances where the Group has a present legal or constructive obligation as a result of a past event, when it is probable, being more likely than not, that an outflow of resources will be required to settle the obligation, and a reliable estimate of the amount can be made.
Provisions are measured at the present value of the expenditures expected to be required to settle the obligation using a pre-tax discount rate that reflects current market assessments of the time value of money and the risks specific to the obligation. The increase in the provision due to the passage of time is recognised as a finance cost in the income statement.
t) Assets held for saleA non-current asset or disposal group is classified as an asset held for sale when the carrying amount will be recovered principally through a sale transaction rather than through continuing use. The assets or disposal group are measured at the lower of carrying amount and the fair value less costs to sell. Where the asset was previously equity accounted, equity accounting ceases from the date of classification as held for sale.
u) Revenue recognitionRevenue from the sale of goods is recognised at the fair value of the consideration received or receivable, net of returns, discounts and allowances. Revenue is recognised when the amount of revenue can be reliably measured, significant risks and rewards of ownership of the inventory items have passed to the buyer, recovery of the consideration is probable, the associated costs and possible return of goods can be estimated reliably, and there is no continuing management involvement with the goods.
Dividend income is recognised when the right to receive payment is established.
v) New Zealand sourced cost of milkNew Zealand sourced cost of milk includes the cost of milk supplied by farmer shareholders, supplier premiums paid, and the cost of milk purchased from contract suppliers during the financial year. New Zealand sourced cost of milk is recognised in cost of goods sold.
New Zealand sourced cost of milk supplied by farmer shareholders comprises the volume of milksolids supplied at the Farmgate Milk Price as determined by the Board for the relevant season. In making that determination the Board takes into account the Farmgate Milk
12 FONTERRA ANNUAL FINANCIAL RESULTS 2014
Price calculated in accordance with the principles set out in the Farmgate Milk Price Manual, which is independently audited. The Farmgate Milk Price calculated in accordance with the Farmgate Milk Price Manual broadly represents the maximum sustainable amount an efficient New Zealand based manufacturer of milk powders could afford to pay for milk and still make an adequate return on capital.
The Fonterra Board has announced a Farmgate Milk Price different than that calculated in accordance with the Farmgate Milk Price Manual. Inventory, amounts owing to suppliers, and New Zealand sourced cost of milk reflect the Farmgate Milk Price determined by the Board.
w) DividendsAll Co-operative shares, including those held by the Custodian on trust for the benefit of the Fund, are eligible to receive dividends if declared by the Board. Dividends are recognised as a liability in the Group’s financial statements in the period in which they are declared by the Board.
x) Employee benefitsEmployee benefits primarily include short-term employee benefits, long-term employee benefits and defined contribution pension plans.
Short-term employee benefits include salaries, wages, annual leave and sick leave, and are expensed on an undiscounted basis as the relevant service is provided.
Long-term employee benefits are measured at the present value of expected payments required using an appropriate pre-tax discount rate.
Contributions to defined contribution pension plans are recognised as an expense in the period they are due. The Group has no further payment obligations once the contributions have been paid.
y) Finance income and costsFinance income comprises interest income on funds on deposit. Interest income is recognised as it accrues using the effective interest method.
Finance costs comprise interest expense on borrowings, unwinding of the discount on provisions, gains and losses on the revaluation of debt hedges and the hedged risks on certain debt instruments, and gains and losses relating to translation forward points on forward exchange contracts where revaluation gains and losses on those contracts are included within finance costs. Interest expense and the unwinding of the discount on provisions are recognised in the income statement using the effective interest method. Finance costs directly attributable to the acquisition, construction or production of a qualifying asset are capitalised as part of the cost of that asset.
z) TaxTax expense comprises current and deferred tax. Tax expense, including the tax consequences of distributions to farmer shareholders, is recognised in the income statement. The tax consequences of distributions to farmer shareholders are recognised in the year to which the distribution relates. Other than distributions to farmer shareholders, tax consequences of items recognised directly in equity are also recognised in equity.
Current tax is the expected tax payable or receivable on the taxable income or loss for the year, using tax rates enacted or substantively enacted at the balance date, and any adjustment to tax payable or receivable in respect of previous years.
Deferred tax is recognised, using the balance sheet method, on temporary differences arising between the tax bases of assets and liabilities and their carrying amounts in the financial statements. Deferred tax is measured at the tax rate that is expected to apply to the temporary differences when they reverse, based on laws that have been enacted or substantively enacted by the balance date.
Deferred tax is not recognised on the following temporary differences:
– the initial recognition of goodwill;
– the initial recognition of assets and liabilities in a transaction that is not a business combination and that affects neither accounting nor taxable profit; and
– differences relating to investments in subsidiaries and equity accounted investees to the extent that the timing of the reversal is controlled by the Group and it is probable that they will not reverse in the foreseeable future.
Deferred tax assets are recognised to the extent it is probable that future taxable profits will be available against which the temporary differences can be utilised.
aa) Earnings per shareThe Group presents basic and diluted earnings per share for its Co-operative shares. Basic earnings per share is calculated by dividing the profit or loss attributable to equity holders of the Company by the weighted average number of Co-operative shares outstanding during the period. Diluted earnings per share is determined by adjusting the profit or loss attributable to equity holders of the Company and the weighted average number of Co-operative shares outstanding for the effects of all dilutive potential Co-operative shares.
bb) Comparative figuresWhere a change in the presentational format of the financial statements has been made during the period, comparative figures have been restated accordingly. Where material, additional disclosure has been provided in the notes to the financial statements.
cc) New and amended International Financial Reporting Standardsi) New and amended standards adopted by the GroupThe Group adopted the following new and amended New Zealand Equivalents to International Financial Reporting Standards during the year, none of which had a material impact on the Group’s financial statements.
– Amendments to NZ IFRS 7 Financial Instruments: Disclosures, on asset and liability offsetting. The amendments introduce new disclosures of information about the significance of financial instruments to an entity. These disclosures are provided in Note 18.
– NZ IFRS 10 Consolidated Financial Statements, NZ IFRS 11 Joint Arrangements and NZ IFRS 12 Disclosure of Interests in Other Entities. Certain additional and amended disclosures are required, which are included in Note 11.
– NZ IFRS 13 Fair Value Measurement explains how to measure fair value and enhances fair value disclosures. Certain additional disclosures are required, and these are included in Note 18.
ii) New and amended standards issued but not yet effectiveNew and amended standards that could be expected to have a material impact on the Group’s financial statements, which were available for early adoption but have not been adopted, are stated below. At this time it is not possible to reasonably estimate the impact of the adoption of these standards.
– NZ IFRS 9 Financial Instruments addresses the classification, measurement and derecognition of financial assets, financial liabilities, impairment of financial assets and hedge accounting.
– NZ IFRS 15 Revenue from Contracts with Customers establishes a single comprehensive framework for revenue recognition.
There are no other new or amended standards that are issued but not yet effective that would be expected to have a material impact on the Group.
STATEMENT OF SIGNIFICANT ACCOUNTING POLICIES CONTINUEDFOR THE YEAR ENDED 31 JULY 2014

FONTERRA ANNUAL FINANCIAL RESULTS 2014 13
NOTES TO THE FINANCIAL STATEMENTSFOR THE YEAR ENDED 31 JULY 2014
NOTE PAGE
1 Cost of goods sold 14
2 Profit before net finance costs and tax 14
3 Net foreign exchange gains/(losses) 15
4 Net finance (costs)/income 15
5 Tax credit 16
6 Segment reporting 17
7 Subscribed equity instruments and reserves 21
8 Trade and other receivables 23
9 Inventories 23
10 Property, plant and equipment 24
11 Equity accounted investments 26
12 Intangible assets 27
13 Trade and other payables 28
14 Provisions 29
15 Borrowings 30
16 Deferred tax 32
17 Business combinations 32
18 Financial risk management 32
19 Contingent liabilities 46
20 Commitments 47
21 Related party transactions 47
22 Group entities 51
23 Subsequent events 53
24 Earnings per share 53

14 FONTERRA ANNUAL FINANCIAL RESULTS 2014
1 COST OF GOODS SOLD
GROUP $ MILLION PARENT $ MILLION
31 JULY 2014 31 JULY 2013 31 JULY 2014 31 JULY 2013
Opening inventory 3,078 2,981 – –
Cost of Milk:
– New Zealand sourced 13,226 8,635 13,243 8,649
– Non-New Zealand sourced 1,192 996 – –
Other purchases 6,018 6,077 – –
Closing inventory (3,701) (3,078) – –
Total cost of goods sold 19,813 15,611 13,243 8,649
Parent Cost of Milk – New Zealand sourced includes milk purchased from Fonterra Group companies of $21 million (2013: $14 million).
2 PROFIT BEFORE NET FINANCE COSTS AND TAX
GROUP $ MILLION PARENT $ MILLION
NOTES 31 JULY 2014 31 JULY 2013 31 JULY 2014 31 JULY 2013
The following items have been included in arriving at profit before net finance costs and tax:
Auditors’ remuneration:
– Fees paid for the audit or review of the financial statements 5 4 2 2
– Fees paid for other services1 1 2 – –
Operating lease expense 66 72 1 –
Depreciation of property, plant and equipment 10 437 444 22 21
Amortisation of intangible assets 12 101 86 27 24
Research and development costs 87 94 34 29
Net loss on disposal of property, plant and equipment 1 5 – –
Donations 1 2 1 2
Research and development grants received from government (5) (4) (5) (3)
Total employee benefits expense 1,717 1,735 128 124
Included in employee benefits expense are:
– Contributions to defined contribution plans 61 58 3 2
1 The Group uses the services of PricewaterhouseCoopers on assignments additional to their statutory audit duties where their expertise and experience with the Group are important and auditor independence is not impaired. Other services include advisory services $0.3 million (31 July 2013: $0.6 million) and other assurance and attestation services $0.2 million (31 July 2013: $1.4 million).
NOTES TO THE FINANCIAL STATEMENTS CONTINUEDFOR THE YEAR ENDED 31 JULY 2014
FONTERRA ANNUAL FINANCIAL RESULTS 2014 15
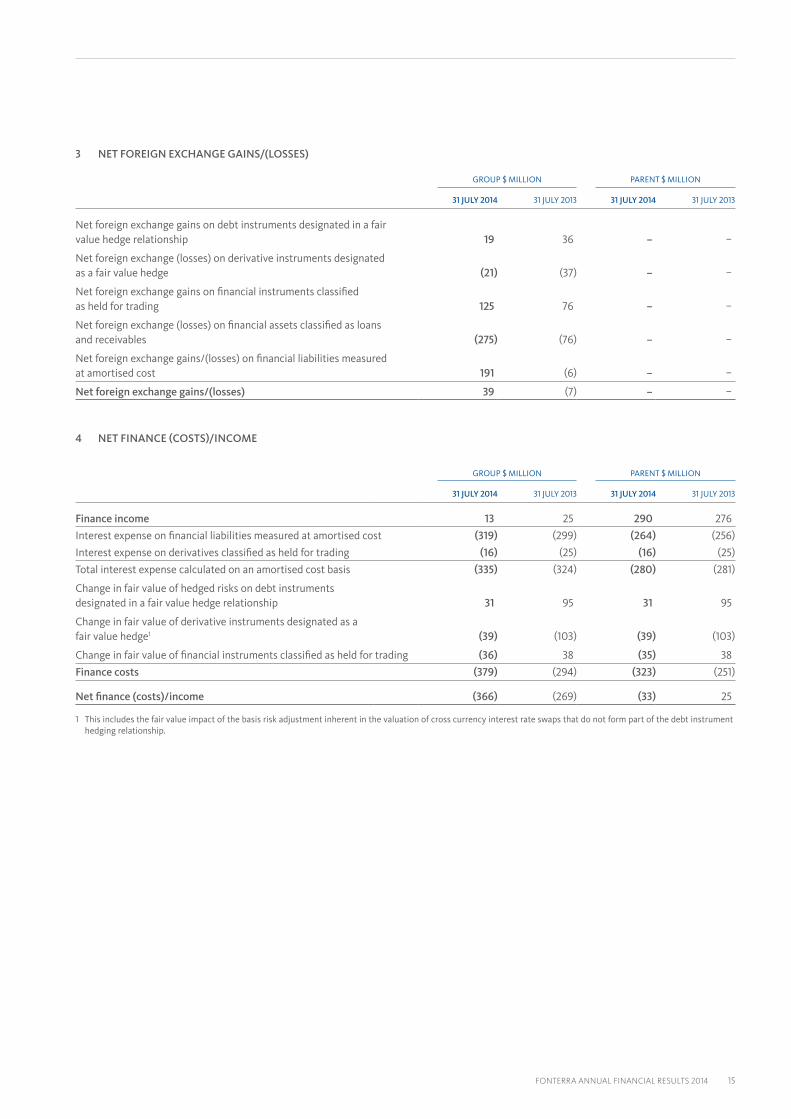
3 NET FOREIGN EXCHANGE GAINS/(LOSSES)
GROUP $ MILLION PARENT $ MILLION
31 JULY 2014 31 JULY 2013 31 JULY 2014 31 JULY 2013
Net foreign exchange gains on debt instruments designated in a fair value hedge relationship 19 36 – –
Net foreign exchange (losses) on derivative instruments designated as a fair value hedge (21) (37) – –
Net foreign exchange gains on financial instruments classified as held for trading 125 76 – –
Net foreign exchange (losses) on financial assets classified as loans and receivables (275) (76) – –
Net foreign exchange gains/(losses) on financial liabilities measured at amortised cost 191 (6) – –
Net foreign exchange gains/(losses) 39 (7) – –
4 NET FINANCE (COSTS)/INCOME
GROUP $ MILLION PARENT $ MILLION
31 JULY 2014 31 JULY 2013 31 JULY 2014 31 JULY 2013
Finance income 13 25 290 276
Interest expense on financial liabilities measured at amortised cost (319) (299) (264) (256)
Interest expense on derivatives classified as held for trading (16) (25) (16) (25)
Total interest expense calculated on an amortised cost basis (335) (324) (280) (281)
Change in fair value of hedged risks on debt instruments designated in a fair value hedge relationship 31 95 31 95
Change in fair value of derivative instruments designated as a fair value hedge1 (39) (103) (39) (103)
Change in fair value of financial instruments classified as held for trading (36) 38 (35) 38
Finance costs (379) (294) (323) (251)
Net finance (costs)/income (366) (269) (33) 25
1 This includes the fair value impact of the basis risk adjustment inherent in the valuation of cross currency interest rate swaps that do not form part of the debt instrument hedging relationship.
16 FONTERRA ANNUAL FINANCIAL RESULTS 2014
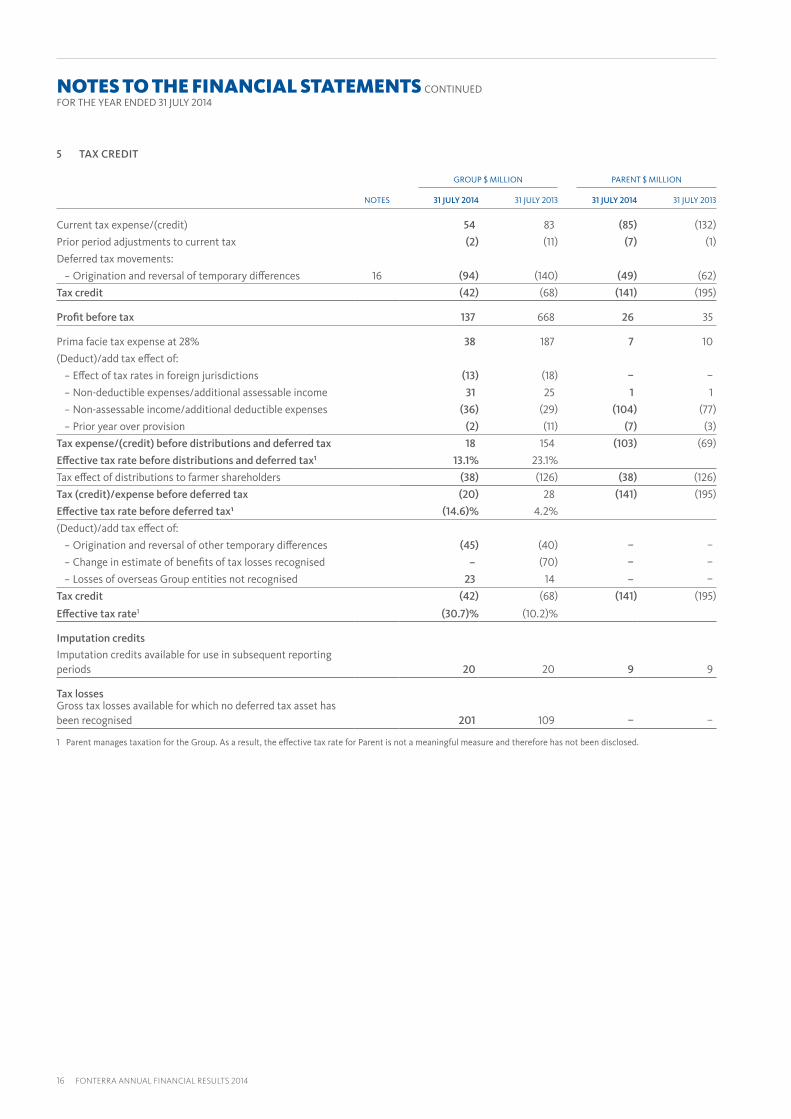
5 TAX CREDIT
GROUP $ MILLION PARENT $ MILLION
NOTES 31 JULY 2014 31 JULY 2013 31 JULY 2014 31 JULY 2013
Current tax expense/(credit) 54 83 (85) (132)
Prior period adjustments to current tax (2) (11) (7) (1)
Deferred tax movements:
− Origination and reversal of temporary differences 16 (94) (140) (49) (62)
Tax credit (42) (68) (141) (195)
Profit before tax 137 668 26 35
Prima facie tax expense at 28% 38 187 7 10
(Deduct)/add tax effect of:
− Effect of tax rates in foreign jurisdictions (13) (18) – –
− Non-deductible expenses/additional assessable income 31 25 1 1
− Non-assessable income/additional deductible expenses (36) (29) (104) (77)
− Prior year over provision (2) (11) (7) (3)
Tax expense/(credit) before distributions and deferred tax 18 154 (103) (69)
Effective tax rate before distributions and deferred tax1 13.1% 23.1%
Tax effect of distributions to farmer shareholders (38) (126) (38) (126)
Tax (credit)/expense before deferred tax (20) 28 (141) (195)
Effective tax rate before deferred tax¹ (14.6)% 4.2%
(Deduct)/add tax effect of:
− Origination and reversal of other temporary differences (45) (40) – –
− Change in estimate of benefits of tax losses recognised – (70) – –
− Losses of overseas Group entities not recognised 23 14 – –
Tax credit (42) (68) (141) (195)
Effective tax rate1 (30.7)% (10.2)%
Imputation credits
Imputation credits available for use in subsequent reporting periods 20 20 9 9
Tax lossesGross tax losses available for which no deferred tax asset has been recognised 201 109 – –
1 Parent manages taxation for the Group. As a result, the effective tax rate for Parent is not a meaningful measure and therefore has not been disclosed.
NOTES TO THE FINANCIAL STATEMENTS CONTINUEDFOR THE YEAR ENDED 31 JULY 2014
FONTERRA ANNUAL FINANCIAL RESULTS 2014 17
6 SEGMENT REPORTING
The Group operates predominantly in the international dairy industry.
The Group has four reportable segments that are defined by product type and geographic area to reflect how the Group’s operations are managed.
The reportable segments presented reflect the Group’s management and reporting structure as viewed by the Fonterra Management Team, which is the Group’s chief operating decision maker.
During the year ended 31 July 2013, transactions between segments were based on estimated market prices. During the year ended 31 July 2014, transactions between segments were based on estimated market prices adjusted for the difference between the Farmgate Milk Price calculated in accordance with the Farmgate Milk Price Manual and that determined by the Board.
REPORTABLE SEGMENT DESCRIPTION
New Zealand Milk Products (NZMP) Represents the collection, processing and distribution of New Zealand milk, global sales and marketing of New Zealand and non-New Zealand milk products (including North Asia), Global Brands & Nutrition, Co-operative Affairs and Group Services.
Oceania (formerly ANZ) Represents Fast Moving Consumer Goods (FMCG) businesses in New Zealand (including export to the Pacific Islands) and all FMCG and ingredients businesses in Australia (including Milk Supply and Manufacturing). It includes foodservice sales in Australia and New Zealand (except for foodservice sales to Quick Service Restaurants), and RD1.
Asia (formerly Asia/AME) Represents FMCG and foodservice businesses in Asia (excluding North Asia), Africa and the Middle East and China. It includes international farming ventures in China.
Latin America (Latam) Represents FMCG businesses in Chile and equity accounted investments in South America. It includes international farming ventures in South America.
18 FONTERRA ANNUAL FINANCIAL RESULTS 2014
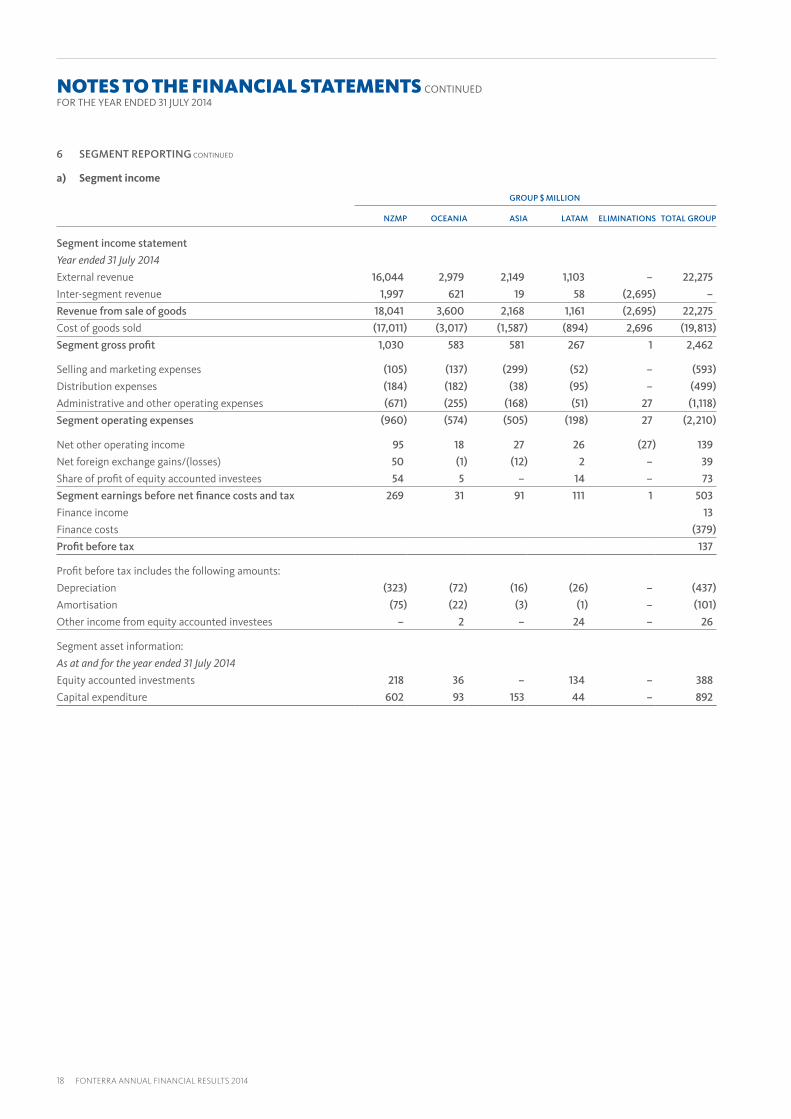
6 SEGMENT REPORTING CONTINUED
a) Segment income
GROUP $ MILLION
NZMP OCEANIA ASIA LATAM ELIMINATIONS TOTAL GROUP
Segment income statement
Year ended 31 July 2014
External revenue 16,044 2,979 2,149 1,103 – 22,275
Inter-segment revenue 1,997 621 19 58 (2,695) –
Revenue from sale of goods 18,041 3,600 2,168 1,161 (2,695) 22,275
Cost of goods sold (17,011) (3,017) (1,587) (894) 2,696 (19,813)
Segment gross profit 1,030 583 581 267 1 2,462
Selling and marketing expenses (105) (137) (299) (52) – (593)
Distribution expenses (184) (182) (38) (95) – (499)
Administrative and other operating expenses (671) (255) (168) (51) 27 (1,118)
Segment operating expenses (960) (574) (505) (198) 27 (2,210)
Net other operating income 95 18 27 26 (27) 139
Net foreign exchange gains/(losses) 50 (1) (12) 2 – 39
Share of profit of equity accounted investees 54 5 – 14 – 73
Segment earnings before net finance costs and tax 269 31 91 111 1 503
Finance income 13
Finance costs (379)
Profit before tax 137
Profit before tax includes the following amounts:
Depreciation (323) (72) (16) (26) – (437)
Amortisation (75) (22) (3) (1) – (101)
Other income from equity accounted investees – 2 – 24 – 26
Segment asset information:
As at and for the year ended 31 July 2014
Equity accounted investments 218 36 – 134 – 388
Capital expenditure 602 93 153 44 – 892
NOTES TO THE FINANCIAL STATEMENTS CONTINUEDFOR THE YEAR ENDED 31 JULY 2014

FONTERRA ANNUAL FINANCIAL RESULTS 2014 19
a) Segment income CONTINUED
GROUP $ MILLION
NZMP OCEANIA ASIA LATAM ELIMINATIONS TOTAL GROUP
Segment income statement
Year ended 31 July 2013
External revenue 12,358 3,101 2,057 1,127 – 18,643
Inter-segment revenue 1,559 644 2 8 (2,213) –
Revenue from sale of goods 13,917 3,745 2,059 1,135 (2,213) 18,643
Cost of goods sold (12,666) (2,989) (1,357) (832) 2,233 (15,611)
Segment gross profit 1,251 756 702 303 20 3,032
Selling and marketing expenses (89) (150) (324) (59) – (622)
Distribution expenses (188) (203) (42) (81) – (514)
Administrative and other operating expenses (615) (324) (153) (51) 23 (1,120)
Segment operating expenses (892) (677) (519) (191) 23 (2,256)
Net other operating income 69 11 24 24 (23) 105
Foreign exchange losses (7) – – – – (7)
Share of profit of equity accounted investees 59 3 – 1 – 63
Segment earnings before net finance costs and tax 480 93 207 137 20 937
Normalisation adjustments 14 49 2 – – 65
Normalised segment earnings before net finance costs and tax 494 142 209 137 20 1,002
Normalisation adjustments (65)
Finance income 25
Finance costs (294)
Profit before tax 668
Profit before tax includes the following amounts:
Depreciation (320) (83) (14) (27) – (444)
Amortisation (68) (13) (4) (1) – (86)
Other income from equity accounted investees 3 2 – 24 – 29
Normalisation adjustments consist of the following amounts:
Costs associated with closure of Cororooke plant in Australia – 30 – – – 30
Restructuring costs associated with the Group Strategy Right-Sizing 14 19 5 – – 38
Other – – (3) – – (3)
Total normalisation adjustments¹ 14 49 2 – – 65
Segment asset information:
As at and for the year ended 31 July 2013
Equity accounted investments 218 31 – 200 – 449
Capital expenditure 683 144 70 29 – 926
1 Of the $65 million normalisation adjustments, $47 million related to operating expenses and $18 million to cost of goods sold.

20 FONTERRA ANNUAL FINANCIAL RESULTS 2014
6 SEGMENT REPORTING CONTINUED
b) Revenue
GROUP $ MILLION
31 JULY 2014 31 JULY 2013
Entity wide products and services:
Consumer goods 4,527 4,717
Ingredients and other revenue 17,748 13,926
Revenue from sale of goods 22,275 18,643
GROUP $ MILLION
EUROPE CHINAREST OF
ASIA AUSTRALIANEW
ZEALAND USA LATAMREST OF WORLD TOTAL
Geographical segment external revenue:
Year ended 31 July 2014 946 5,537 5,787 1,666 2,162 1,014 1,802 3,361 22,275
Year ended 31 July 2013 1,096 2,500 5,216 1,850 1,986 1,415 1,984 2,596 18,643
Revenue is allocated to geographical segments on the basis of the destination of the goods sold.
c) Non-current assets
GROUP $ MILLION
NZMP OCEANIA ASIA LATAM TOTAL
NEW ZEALAND
REST OF WORLD
NEW ZEALAND AUSTRALIA
Geographical segment reportable non-current assets:
As at 31 July 2014 4,300 383 1,387 1,022 1,123 445 8,660
As at 31 July 2013 4,199 303 1,350 1,047 940 544 8,383
GROUP $ MILLION
AS AT 31 JULY 2014
AS AT 31 JULY 2013
Reconciliation of geographical segment non-current assets to total non-current assets:
Geographical segment non-current assets 8,660 8,383
Deferred tax asset 231 217
Derivative financial instruments 154 127
Total non-current assets 9,045 8,727
NOTES TO THE FINANCIAL STATEMENTS CONTINUEDFOR THE YEAR ENDED 31 JULY 2014
FONTERRA ANNUAL FINANCIAL RESULTS 2014 21
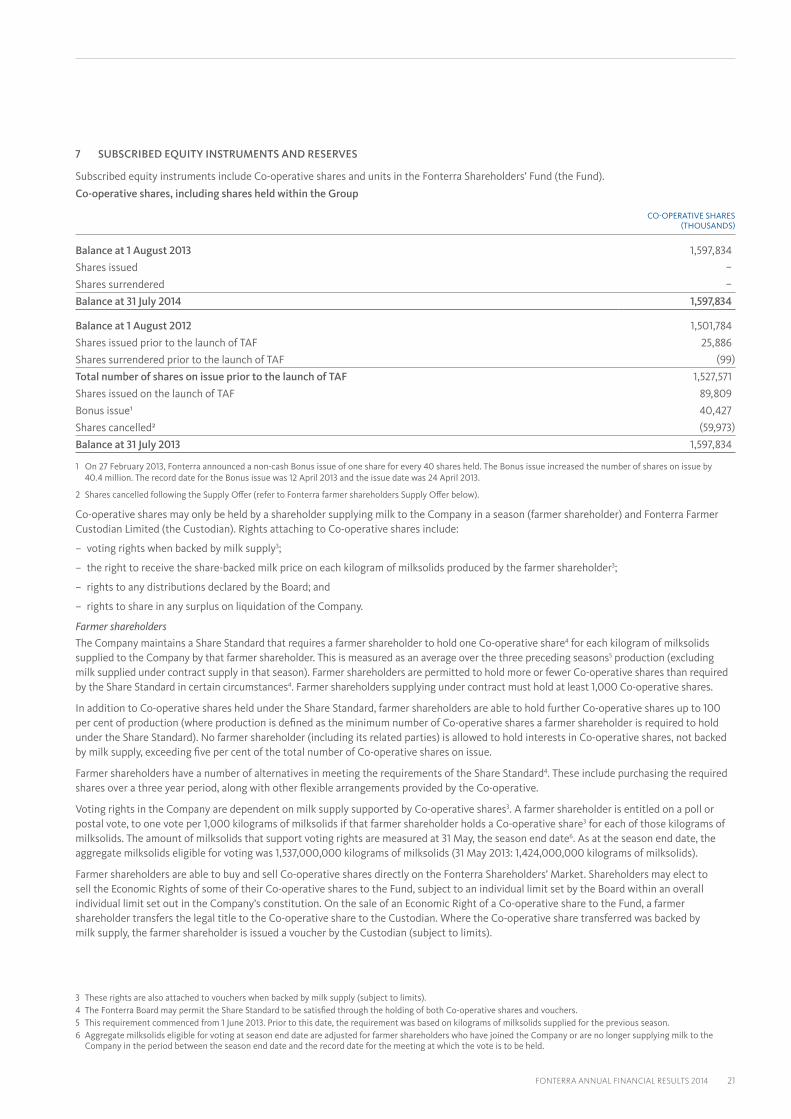
7 SUBSCRIBED EQUITY INSTRUMENTS AND RESERVES
Subscribed equity instruments include Co-operative shares and units in the Fonterra Shareholders’ Fund (the Fund).
Co-operative shares, including shares held within the Group
CO-OPERATIVE SHARES (THOUSANDS)
Balance at 1 August 2013 1,597,834
Shares issued –
Shares surrendered –
Balance at 31 July 2014 1,597,834
Balance at 1 August 2012 1,501,784
Shares issued prior to the launch of TAF 25,886
Shares surrendered prior to the launch of TAF (99)
Total number of shares on issue prior to the launch of TAF 1,527,571
Shares issued on the launch of TAF 89,809
Bonus issue¹ 40,427
Shares cancelled² (59,973)
Balance at 31 July 2013 1,597,834
1 On 27 February 2013, Fonterra announced a non-cash Bonus issue of one share for every 40 shares held. The Bonus issue increased the number of shares on issue by 40.4 million. The record date for the Bonus issue was 12 April 2013 and the issue date was 24 April 2013.
2 Shares cancelled following the Supply Offer (refer to Fonterra farmer shareholders Supply Offer below).
Co-operative shares may only be held by a shareholder supplying milk to the Company in a season (farmer shareholder) and Fonterra Farmer Custodian Limited (the Custodian). Rights attaching to Co-operative shares include:
– voting rights when backed by milk supply3;
– the right to receive the share-backed milk price on each kilogram of milksolids produced by the farmer shareholder3;
– rights to any distributions declared by the Board; and
– rights to share in any surplus on liquidation of the Company.
Farmer shareholdersThe Company maintains a Share Standard that requires a farmer shareholder to hold one Co-operative share4 for each kilogram of milksolids supplied to the Company by that farmer shareholder. This is measured as an average over the three preceding seasons5 production (excluding milk supplied under contract supply in that season). Farmer shareholders are permitted to hold more or fewer Co-operative shares than required by the Share Standard in certain circumstances4. Farmer shareholders supplying under contract must hold at least 1,000 Co-operative shares.
In addition to Co-operative shares held under the Share Standard, farmer shareholders are able to hold further Co-operative shares up to 100 per cent of production (where production is defined as the minimum number of Co-operative shares a farmer shareholder is required to hold under the Share Standard). No farmer shareholder (including its related parties) is allowed to hold interests in Co-operative shares, not backed by milk supply, exceeding five per cent of the total number of Co-operative shares on issue.
Farmer shareholders have a number of alternatives in meeting the requirements of the Share Standard4. These include purchasing the required shares over a three year period, along with other flexible arrangements provided by the Co-operative.
Voting rights in the Company are dependent on milk supply supported by Co-operative shares3. A farmer shareholder is entitled on a poll or postal vote, to one vote per 1,000 kilograms of milksolids if that farmer shareholder holds a Co-operative share3 for each of those kilograms of milksolids. The amount of milksolids that support voting rights are measured at 31 May, the season end date6. As at the season end date, the aggregate milksolids eligible for voting was 1,537,000,000 kilograms of milksolids (31 May 2013: 1,424,000,000 kilograms of milksolids).
Farmer shareholders are able to buy and sell Co-operative shares directly on the Fonterra Shareholders’ Market. Shareholders may elect to sell the Economic Rights of some of their Co-operative shares to the Fund, subject to an individual limit set by the Board within an overall individual limit set out in the Company’s constitution. On the sale of an Economic Right of a Co-operative share to the Fund, a farmer shareholder transfers the legal title to the Co-operative share to the Custodian. Where the Co-operative share transferred was backed by milk supply, the farmer shareholder is issued a voucher by the Custodian (subject to limits).
3 These rights are also attached to vouchers when backed by milk supply (subject to limits).4 The Fonterra Board may permit the Share Standard to be satisfied through the holding of both Co-operative shares and vouchers.5 This requirement commenced from 1 June 2013. Prior to this date, the requirement was based on kilograms of milksolids supplied for the previous season.6 Aggregate milksolids eligible for voting at season end date are adjusted for farmer shareholders who have joined the Company or are no longer supplying milk to the
Company in the period between the season end date and the record date for the meeting at which the vote is to be held.
22 FONTERRA ANNUAL FINANCIAL RESULTS 2014
7 SUBSCRIBED EQUITY INSTRUMENTS AND RESERVES CONTINUED
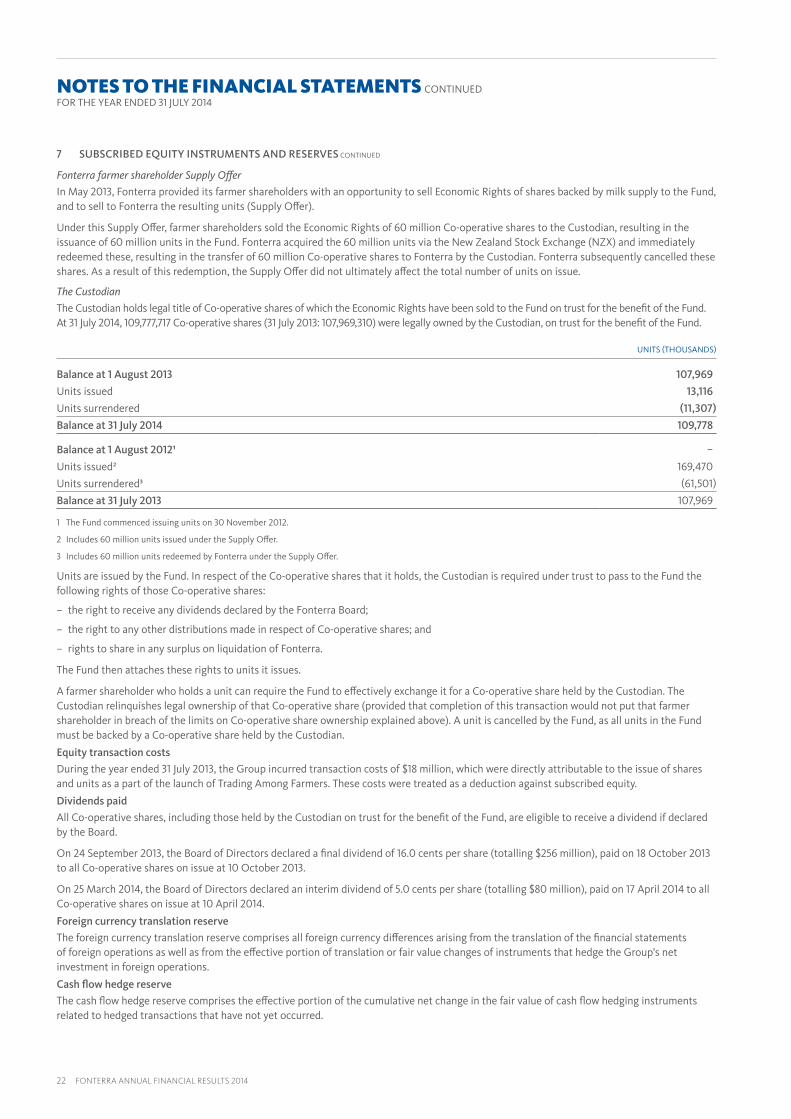
Fonterra farmer shareholder Supply OfferIn May 2013, Fonterra provided its farmer shareholders with an opportunity to sell Economic Rights of shares backed by milk supply to the Fund, and to sell to Fonterra the resulting units (Supply Offer).
Under this Supply Offer, farmer shareholders sold the Economic Rights of 60 million Co-operative shares to the Custodian, resulting in the issuance of 60 million units in the Fund. Fonterra acquired the 60 million units via the New Zealand Stock Exchange (NZX) and immediately redeemed these, resulting in the transfer of 60 million Co-operative shares to Fonterra by the Custodian. Fonterra subsequently cancelled these shares. As a result of this redemption, the Supply Offer did not ultimately affect the total number of units on issue.
The CustodianThe Custodian holds legal title of Co-operative shares of which the Economic Rights have been sold to the Fund on trust for the benefit of the Fund. At 31 July 2014, 109,777,717 Co-operative shares (31 July 2013: 107,969,310) were legally owned by the Custodian, on trust for the benefit of the Fund.
UNITS (THOUSANDS)
Balance at 1 August 2013 107,969
Units issued 13,116
Units surrendered (11,307)
Balance at 31 July 2014 109,778
Balance at 1 August 2012¹ –
Units issued² 169,470
Units surrendered³ (61,501)
Balance at 31 July 2013 107,969
1 The Fund commenced issuing units on 30 November 2012.
2 Includes 60 million units issued under the Supply Offer.
3 Includes 60 million units redeemed by Fonterra under the Supply Offer.
Units are issued by the Fund. In respect of the Co-operative shares that it holds, the Custodian is required under trust to pass to the Fund the following rights of those Co-operative shares:
– the right to receive any dividends declared by the Fonterra Board;
– the right to any other distributions made in respect of Co-operative shares; and
– rights to share in any surplus on liquidation of Fonterra.
The Fund then attaches these rights to units it issues.
A farmer shareholder who holds a unit can require the Fund to effectively exchange it for a Co-operative share held by the Custodian. The Custodian relinquishes legal ownership of that Co-operative share (provided that completion of this transaction would not put that farmer shareholder in breach of the limits on Co-operative share ownership explained above). A unit is cancelled by the Fund, as all units in the Fund must be backed by a Co-operative share held by the Custodian.
Equity transaction costs
During the year ended 31 July 2013, the Group incurred transaction costs of $18 million, which were directly attributable to the issue of shares and units as a part of the launch of Trading Among Farmers. These costs were treated as a deduction against subscribed equity.
Dividends paid
All Co-operative shares, including those held by the Custodian on trust for the benefit of the Fund, are eligible to receive a dividend if declared by the Board.
On 24 September 2013, the Board of Directors declared a final dividend of 16.0 cents per share (totalling $256 million), paid on 18 October 2013 to all Co-operative shares on issue at 10 October 2013.
On 25 March 2014, the Board of Directors declared an interim dividend of 5.0 cents per share (totalling $80 million), paid on 17 April 2014 to all Co-operative shares on issue at 10 April 2014.
Foreign currency translation reserve
The foreign currency translation reserve comprises all foreign currency differences arising from the translation of the financial statements of foreign operations as well as from the effective portion of translation or fair value changes of instruments that hedge the Group’s net investment in foreign operations.
Cash flow hedge reserve
The cash flow hedge reserve comprises the effective portion of the cumulative net change in the fair value of cash flow hedging instruments related to hedged transactions that have not yet occurred.
NOTES TO THE FINANCIAL STATEMENTS CONTINUEDFOR THE YEAR ENDED 31 JULY 2014

FONTERRA ANNUAL FINANCIAL RESULTS 2014 23
8 TRADE AND OTHER RECEIVABLES
GROUP $ MILLION PARENT $ MILLION
AS AT 31 JULY 2014
AS AT 31 JULY 2013
AS AT 31 JULY 2014
AS AT 31 JULY 2013
Trade receivables 1,775 1,870 1 2
Less: provision for impairment of trade receivables (8) (12) – –
Trade receivables net of provision for impairment 1,767 1,858 1 2
Receivables from related parties¹ 29 46 10,502 9,089
Other receivables 75 77 – –
Total receivables 1,871 1,981 10,503 9,091
Prepayments 79 73 21 21
Total trade and other receivables 1,950 2,054 10,524 9,112
1 There were no material provisions for impairment of receivables from related parties.
GROUP $ MILLION PARENT $ MILLION
31 JULY 2014 31 JULY 2013 31 JULY 2014 31 JULY 2013
Movement in the provision for impairment of trade receivables:
Opening balance 12 29 – –
Additional provisions 3 3 – –
Utilised during the year (6) (2) – –
Unused amounts reversed (1) (18) – –
Closing balance 8 12 – –
9 INVENTORIES
GROUP $ MILLION PARENT $ MILLION
AS AT 31 JULY 2014
AS AT 31 JULY 2013
AS AT 31 JULY 2014
AS AT 31 JULY 2013
Raw materials 619 630 – –
Finished goods 3,281 2,506 – –
Impairment of finished goods (199) (58) – –
Total inventories 3,701 3,078 – –
Other disclosures:
Inventories stated at net realisable value 1,387 467 – –
Amount of inventories pledged as security for liabilities – 10 – –
Amount of inventories recognised in cost of goods sold during the year 19,813 15,611 – –

24 FONTERRA ANNUAL FINANCIAL RESULTS 2014
10 PROPERTY, PLANT AND EQUIPMENT
GROUP $ MILLION
NOTES LAND
BUILDINGS AND LEASEHOLD
IMPROVEMENTS
PLANT, VEHICLES AND
EQUIPMENT
CAPITAL WORK IN
PROGRESS TOTAL
As at 31 July 2013
Cost 318 1,838 5,684 554 8,394
Accumulated depreciation and impairment – (632) (2,955) – (3,587)
Net book value 318 1,206 2,729 554 4,807
Net book value
As at 1 August 2013 318 1,206 2,729 554 4,807
Additions¹ – 8 40 740 788
Transfer from capital work in progress 11 173 596 (780) –
Depreciation charge – (83) (354) – (437)
Impairment losses – – (2) – (2)
Disposals – (1) (12) (1) (14)
Foreign currency translation (2) (20) (26) (3) (51)
As at 31 July 2014 327 1,283 2,971 510 5,091
As at 31 July 2014
Cost 327 1,986 6,175 510 8,998
Accumulated depreciation and impairment – (703) (3,204) – (3,907)
Net book value 327 1,283 2,971 510 5,091
As at 31 July 2012
Cost 320 1,652 5,322 557 7,851
Accumulated depreciation and impairment – (564) (2,718) – (3,282)
Net book value 320 1,088 2,604 557 4,569
Net book value
As at 1 August 2012 320 1,088 2,604 557 4,569
Additions¹ 2 23 50 701 776
Transfer from capital work in progress 2 193 505 (700) –
Depreciation charge – (81) (363) – (444)
Impairment losses – – (10) – (10)
Disposals (2) (3) (17) – (22)
Foreign currency translation (4) (14) (40) (4) (62)
As at 31 July 2013 318 1,206 2,729 554 4,807
1 Additions include borrowing costs of $8 million (2013: $13 million) capitalised using a weighted average interest rate of 5.97% (2013: 6.86%).
In the prior year, an impairment loss of $7 million was recognised due to the adoption of an improved effluent system by Fonterra’s China Farms operation. This impairment loss relates to the Asia segment and was recognised in cost of goods sold in the income statement. The remaining impairment loss of $3 million arose from the Group’s Strategy Right-Sizing. This loss relates to the Oceania segment and was recognised in other operating expenses in the income statement.
The net book value of property, plant and equipment subject to finance leases for the Group is $150 million (31 July 2013: $143 million). Of that balance $5 million relates to land (31 July 2013: $5 million), $115 million relates to building and leasehold improvements (31 July 2013: $110 million), and $30 million relates to plant and equipment (31 July 2013: $28 million).
NOTES TO THE FINANCIAL STATEMENTS CONTINUEDFOR THE YEAR ENDED 31 JULY 2014

FONTERRA ANNUAL FINANCIAL RESULTS 2014 25
10 PROPERTY, PLANT AND EQUIPMENT CONTINUED
PARENT $ MILLION
NOTES LAND
BUILDINGS AND LEASEHOLD
IMPROVEMENTS
PLANT, VEHICLES AND
EQUIPMENT
CAPITAL WORK IN
PROGRESS TOTAL
As at 31 July 2013
Cost 5 152 159 4 320
Accumulated depreciation and impairment – (26) (86) – (112)
Net book value 5 126 73 4 208
Net book value
As at 1 August 2013 5 126 73 4 208
Additions¹ – – – 15 15
Transfer from capital work in progress – 1 15 (16) –
Transfer from other Group entities 8 – – – 8
Depreciation charge – (5) (17) – (22)
As at 31 July 2014 13 122 71 3 209
As at 31 July 2014
Cost 13 153 170 3 339
Accumulated depreciation and impairment – (31) (99) – (130)
Net book value 13 122 71 3 209
As at 31 July 2012
Cost 5 153 141 5 304
Accumulated depreciation and impairment – (21) (73) – (94)
Net book value 5 132 68 5 210
Net book value
As at 1 August 2012 5 132 68 5 210
Additions¹ – – 1 16 17
Transfer from capital work in progress – – 20 (20) –
Transfer to intangible assets 12 – – – 3 3
Depreciation charge – (5) (16) – (21)
Disposals – (1) – – (1)
As at 31 July 2013 5 126 73 4 208
1 Additions include borrowing costs of $nil (2013: nil) capitalised using an interest rate of nil (2013: nil).
The net book value of property, plant and equipment subject to finance leases for the Parent is $131 million (31 July 2013: $137 million). Of that balance $5 million relates to land (31 July 2013: $5 million), $106 million relates to building and leasehold improvements (31 July 2013: $111 million), and $20 million relates to plant and equipment (31 July 2013: $21 million).

26 FONTERRA ANNUAL FINANCIAL RESULTS 2014
11 EQUITY ACCOUNTED INVESTMENTS
A list of equity accounted investees is included in Note 22.
As explained in Note 23, on 27 May 2014 the Group entered into agreements to realign the Latam segment’s Dairy Partners Americas (DPA) joint venture arrangements.
In late 2014, the Group’s equity accounted investments in Ecuador (Ecuajugos S.A.) and DPA’s milk powder manufacturing business (DPA Manufacturing Holdings Limited) will be sold to Nestlé. These equity accounted investments were classified as assets held for sale and had a carrying value of $58 million at 31 July 2014.
On 1 August 2014, the Group purchased additional voting equity interests in DPA Brazil (Dairy Partners Americas Brasil Limitada – from 50% to 51%, with Nestlé holding the balance) and DPA Venezuela (Lacven Corporation – from 25% to 60%, with the local partner holding the balance). The Group gained control of the entities, and these equity accounted investments of $128 million (2013: $130 million) became consolidated subsidiaries from that date.
The Group has provided financial guarantees to certain equity accounted investees as set out in Note 21.
The Group’s equity accounted investees have entered into non-cancellable operating leases, and the Group’s share of the future aggregate minimum lease payments under these leases is $7 million (31 July 2013: $7 million).
The Group’s share of capital expenditure contracted for at balance date but not recognised by equity accounted investees is $12 million (31 July 2013: $16 million).
There are no contingent liabilities relating to the Group’s interests in joint ventures.
The Group holds investments in a number of joint ventures and associates that are not individually significant to the Group. The aggregate amount of the Group’s share of these equity accounted investments is included in the table below:
GROUP $ MILLION
ASSOCIATES JOINT VENTURES TOTAL
AS AT 31 JULY 2014
AS AT 31 JULY 2013
AS AT 31 JULY 2014
AS AT 31 JULY 2013
AS AT 31 JULY 2014
AS AT 31 JULY 2013
Carrying amount of investment 7 7 381 442 388 449
Profit from continuing operations 1 1 72 62 73 63
Other comprehensive income/(expense) – – (11) (1) (11) (1)
Total comprehensive income 1 1 61 61 62 62
NOTES TO THE FINANCIAL STATEMENTS CONTINUEDFOR THE YEAR ENDED 31 JULY 2014

FONTERRA ANNUAL FINANCIAL RESULTS 2014 27
12 INTANGIBLE ASSETS
GROUP $ MILLIONPARENT
$ MILLION
NOTES GOODWILL BRANDS SOFTWARESOFTWARE
WIP OTHERTOTAL
INTANGIBLES SOFTWARE
As at 31 July 2013
Cost 972 1,530 784 217 91 3,594 245
Accumulated amortisation and impairment (2) (113) (563) – (58) (736) (158)
Net book value 970 1,417 221 217 33 2,858 87
Net book value
As at 1 August 2013 970 1,417 221 217 33 2,858 87
Additions¹ – – 3 96 5 104 34
Transfer from work in progress – – 235 (235) – – –
Transfer to other Group entities – – – – – – (2)
Amortisation – (5) (90) – (6) (101) (27)
Disposals (4) – (2) – – (6) –
Foreign currency translation (28) (30) – (5) (1) (64) –
As at 31 July 2014 938 1,382 367 73 31 2,791 92
As at 31 July 2014
Cost 940 1,500 1,007 73 94 3,614 269
Accumulated amortisation and impairment (2) (118) (640) – (63) (823) (177)
Net book value 938 1,382 367 73 31 2,791 92
As at 31 July 2012
Cost 1,010 1,555 672 218 133 3,588 211
Accumulated amortisation and impairment (2) (106) (501) – (97) (706) (134)
Net book value 1,008 1,449 171 218 36 2,882 77
Net book value
As at 1 August 2012 1,008 1,449 171 218 36 2,882 77
Additions1 – – 2 141 6 149 36
Transfer from work in progress – – 123 (123) – – (3)
Transfer from other Group entities – – – – – – 1
Amortisation – (6) (74) – (6) (86) (24)
Impairment loss – (11) – – – (11) –
Impairment loss reversal – 10 – – – 10 –
Disposals (1) (3) (1) – (3) (8) –
Foreign currency translation (37) (22) – (19) – (78) –
As at 31 July 2013 970 1,417 221 217 33 2,858 87
1 The Group has capitalised borrowing costs of $3 million (2013: $10 million) using an interest rate of 6.59% (2013: 6.86%). The Parent has capitalised borrowing costs of $1 million (2013: nil) using an interest rate of 6.59% (2013: nil).
Amortisation is recognised in other operating expenses in the income statement.
For the year ended 31 July 2013, one-off net impairment losses were $1 million. An impairment loss of $11 million was recognised as a result of certain brands being discontinued due to the Group’s strategy review. $7 million of this impairment relates to the Oceania segment and $4 million relates to the Asia segment. This impairment was recognised in selling and marketing expenses in the income statement. This was partially offset by a reversal of impairment losses recognised in previous accounting periods of $10 million, which was recognised as a result of improved performance of one of the Group’s brands. This reversal of impairment losses relates to the Asia segment, and was recognised in selling and marketing expenses in the income statement.
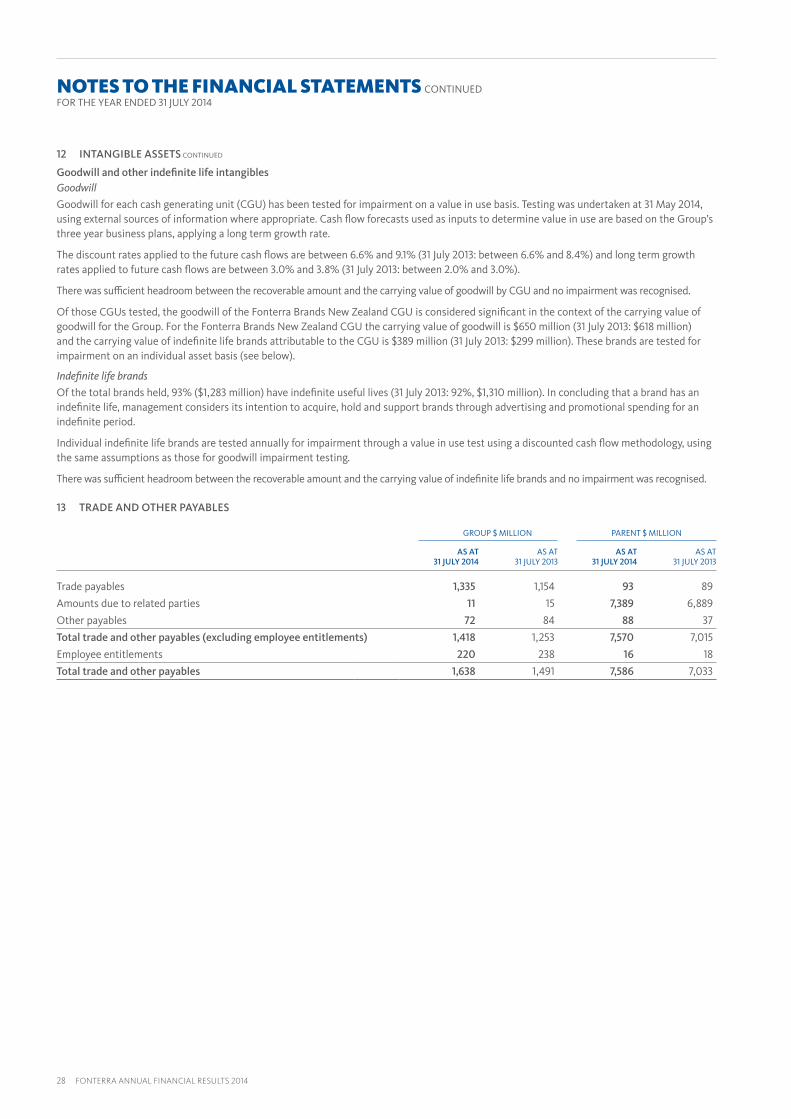
28 FONTERRA ANNUAL FINANCIAL RESULTS 2014
12 INTANGIBLE ASSETS CONTINUED
Goodwill and other indefinite life intangiblesGoodwillGoodwill for each cash generating unit (CGU) has been tested for impairment on a value in use basis. Testing was undertaken at 31 May 2014, using external sources of information where appropriate. Cash flow forecasts used as inputs to determine value in use are based on the Group’s three year business plans, applying a long term growth rate.
The discount rates applied to the future cash flows are between 6.6% and 9.1% (31 July 2013: between 6.6% and 8.4%) and long term growth rates applied to future cash flows are between 3.0% and 3.8% (31 July 2013: between 2.0% and 3.0%).
There was sufficient headroom between the recoverable amount and the carrying value of goodwill by CGU and no impairment was recognised.
Of those CGUs tested, the goodwill of the Fonterra Brands New Zealand CGU is considered significant in the context of the carrying value of goodwill for the Group. For the Fonterra Brands New Zealand CGU the carrying value of goodwill is $650 million (31 July 2013: $618 million) and the carrying value of indefinite life brands attributable to the CGU is $389 million (31 July 2013: $299 million). These brands are tested for impairment on an individual asset basis (see below).
Indefinite life brandsOf the total brands held, 93% ($1,283 million) have indefinite useful lives (31 July 2013: 92%, $1,310 million). In concluding that a brand has an indefinite life, management considers its intention to acquire, hold and support brands through advertising and promotional spending for an indefinite period.
Individual indefinite life brands are tested annually for impairment through a value in use test using a discounted cash flow methodology, using the same assumptions as those for goodwill impairment testing.
There was sufficient headroom between the recoverable amount and the carrying value of indefinite life brands and no impairment was recognised.
13 TRADE AND OTHER PAYABLES
GROUP $ MILLION PARENT $ MILLION
AS AT 31 JULY 2014
AS AT 31 JULY 2013
AS AT 31 JULY 2014
AS AT 31 JULY 2013
Trade payables 1,335 1,154 93 89
Amounts due to related parties 11 15 7,389 6,889
Other payables 72 84 88 37
Total trade and other payables (excluding employee entitlements) 1,418 1,253 7,570 7,015
Employee entitlements 220 238 16 18
Total trade and other payables 1,638 1,491 7,586 7,033
NOTES TO THE FINANCIAL STATEMENTS CONTINUEDFOR THE YEAR ENDED 31 JULY 2014

FONTERRA ANNUAL FINANCIAL RESULTS 2014 29
14 PROVISIONS
GROUP $ MILLION PARENT $ MILLION
31 JULY 2014 31 JULY 2013 31 JULY 2014 31 JULY 2013
Restructuring and rationalisation provisions
Opening balance 40 21 11 11
Additional provisions 12 46 1 13
Unused amounts reversed (9) (10) (7) (9)
Charged to income statement 3 36 (6) 4
Foreign currency translation (1) (2) – –
Utilised during the year (25) (15) (4) (4)
Closing balance 17 40 1 11
Legal claims provisions
Opening balance 32 46 32 46
Unused amounts reversed (7) (14) (7) (14)
Charged to income statement (7) (14) (7) (14)
Foreign currency translation (1) – (1) –
Closing balance 24 32 24 32
Other provisions
Opening balance 86 97 4 5
Additional provisions 26 37 3 4
Unused amounts reversed (10) (30) (5) (2)
Charged to income statement 16 7 (2) 2
Foreign currency translation (4) (1) – –
Utilised during the year (27) (17) (1) (3)
Closing balance 71 86 1 4
Total provisions 112 158 26 47
Included within the statement of financial position as follows:
Current liabilities 47 82 1 14
Non-current liabilities 65 76 25 33
Total provisions 112 158 26 47
The nature of the provisions are as follows:
– the provision for restructuring and rationalisation includes obligations relating to planned changes throughout the business to improve efficiencies and reduce costs. The value of the obligation is based on project plans and the provisions are expected to be utilised in the next year.
– the legal claims provisions include obligations relating to tax, customs and duties and legal matters arising in the normal course of business. The timing and amount of the future obligations are uncertain, as they are contingent on the outcome of a number of judicial proceedings. The amount recognised has been based on management’s best estimate of the amount that will be required to settle the obligation. The outcome of most of the obligations is not expected to be determined within the next year and therefore most of the provisions are classified as non-current.
– other provisions arise in the normal course of business. The value of the obligation is based on management’s best estimate of the amount that will be required to settle the obligation. All of the Parent’s provisions are expected to be utilised in the next year, whereas a portion of Group’s provisions are classified as non-current.
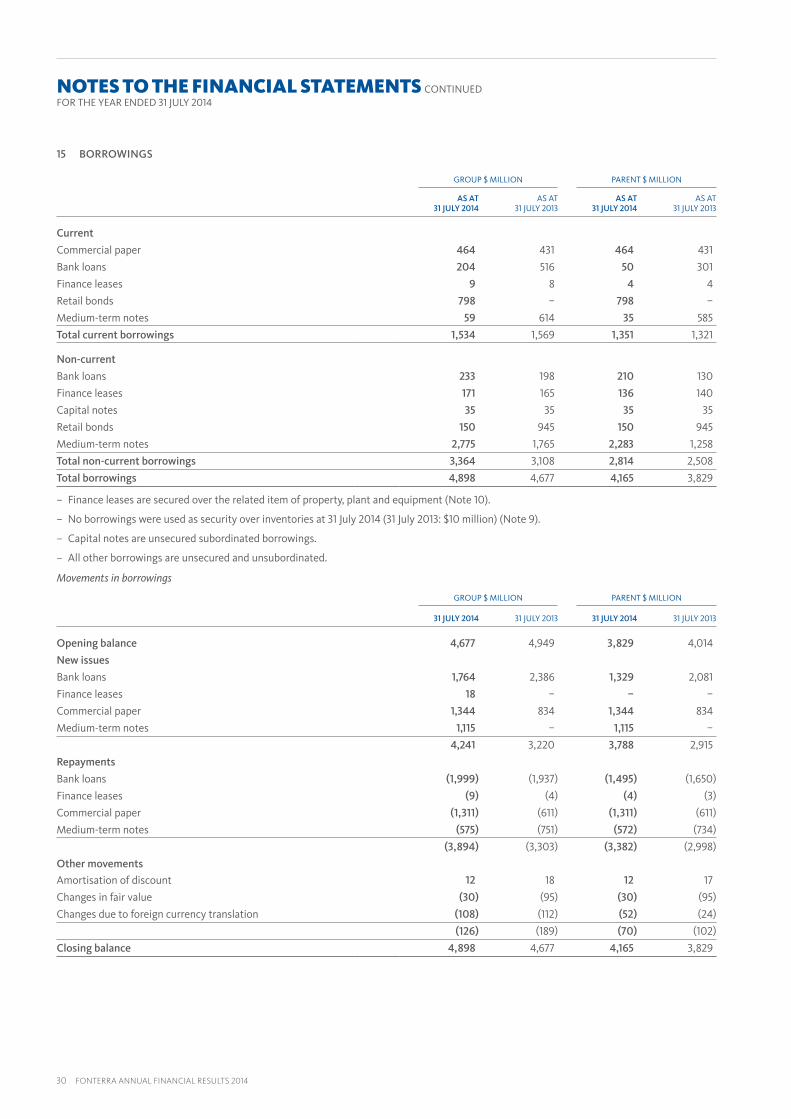
30 FONTERRA ANNUAL FINANCIAL RESULTS 2014
15 BORROWINGS
GROUP $ MILLION PARENT $ MILLION
AS AT 31 JULY 2014
AS AT 31 JULY 2013
AS AT 31 JULY 2014
AS AT 31 JULY 2013
Current
Commercial paper 464 431 464 431
Bank loans 204 516 50 301
Finance leases 9 8 4 4
Retail bonds 798 – 798 –
Medium-term notes 59 614 35 585
Total current borrowings 1,534 1,569 1,351 1,321
Non-current
Bank loans 233 198 210 130
Finance leases 171 165 136 140
Capital notes 35 35 35 35
Retail bonds 150 945 150 945
Medium-term notes 2,775 1,765 2,283 1,258
Total non-current borrowings 3,364 3,108 2,814 2,508
Total borrowings 4,898 4,677 4,165 3,829
– Finance leases are secured over the related item of property, plant and equipment (Note 10).
– No borrowings were used as security over inventories at 31 July 2014 (31 July 2013: $10 million) (Note 9).
– Capital notes are unsecured subordinated borrowings.
– All other borrowings are unsecured and unsubordinated.
Movements in borrowings
GROUP $ MILLION PARENT $ MILLION
31 JULY 2014 31 JULY 2013 31 JULY 2014 31 JULY 2013
Opening balance 4,677 4,949 3,829 4,014
New issues
Bank loans 1,764 2,386 1,329 2,081
Finance leases 18 – – –
Commercial paper 1,344 834 1,344 834
Medium-term notes 1,115 – 1,115 –
4,241 3,220 3,788 2,915
Repayments
Bank loans (1,999) (1,937) (1,495) (1,650)
Finance leases (9) (4) (4) (3)
Commercial paper (1,311) (611) (1,311) (611)
Medium-term notes (575) (751) (572) (734)
(3,894) (3,303) (3,382) (2,998)
Other movements
Amortisation of discount 12 18 12 17
Changes in fair value (30) (95) (30) (95)
Changes due to foreign currency translation (108) (112) (52) (24)
(126) (189) (70) (102)
Closing balance 4,898 4,677 4,165 3,829
NOTES TO THE FINANCIAL STATEMENTS CONTINUEDFOR THE YEAR ENDED 31 JULY 2014
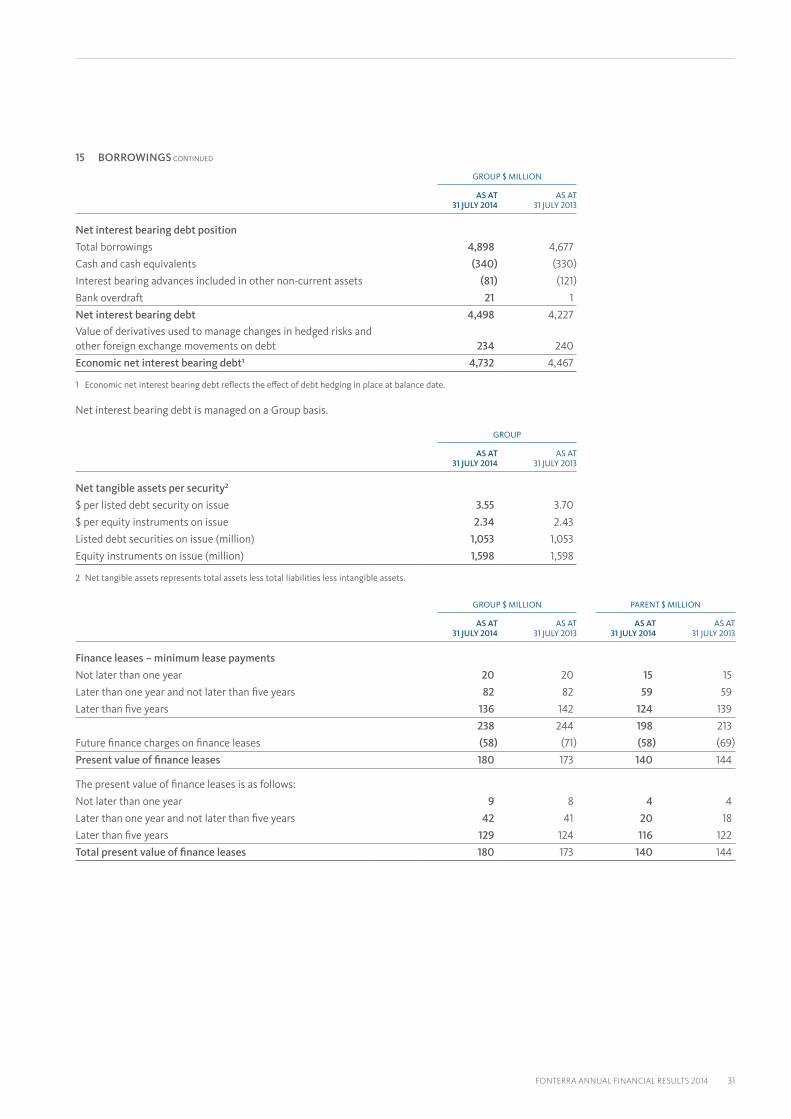
FONTERRA ANNUAL FINANCIAL RESULTS 2014 31
15 BORROWINGS CONTINUED
GROUP $ MILLION
AS AT 31 JULY 2014
AS AT 31 JULY 2013
Net interest bearing debt position
Total borrowings 4,898 4,677
Cash and cash equivalents (340) (330)
Interest bearing advances included in other non-current assets (81) (121)
Bank overdraft 21 1
Net interest bearing debt 4,498 4,227
Value of derivatives used to manage changes in hedged risks and other foreign exchange movements on debt 234 240
Economic net interest bearing debt¹ 4,732 4,467
1 Economic net interest bearing debt reflects the effect of debt hedging in place at balance date.
Net interest bearing debt is managed on a Group basis.
GROUP
AS AT 31 JULY 2014
AS AT 31 JULY 2013
Net tangible assets per security2
$ per listed debt security on issue 3.55 3.70
$ per equity instruments on issue 2.34 2.43
Listed debt securities on issue (million) 1,053 1,053
Equity instruments on issue (million) 1,598 1,598
2 Net tangible assets represents total assets less total liabilities less intangible assets.
GROUP $ MILLION PARENT $ MILLION
AS AT 31 JULY 2014
AS AT 31 JULY 2013
AS AT 31 JULY 2014
AS AT 31 JULY 2013
Finance leases – minimum lease payments
Not later than one year 20 20 15 15
Later than one year and not later than five years 82 82 59 59
Later than five years 136 142 124 139
238 244 198 213
Future finance charges on finance leases (58) (71) (58) (69)
Present value of finance leases 180 173 140 144
The present value of finance leases is as follows:
Not later than one year 9 8 4 4
Later than one year and not later than five years 42 41 20 18
Later than five years 129 124 116 122
Total present value of finance leases 180 173 140 144

32 FONTERRA ANNUAL FINANCIAL RESULTS 2014
16 DEFERRED TAX
GROUP $ MILLION PARENT $ MILLION
NOTESAS AT
31 JULY 2014AS AT
31 JULY 2013AS AT
31 JULY 2014AS AT
31 JULY 2013
Deferred tax
Property, plant and equipment (94) (67) 12 11
Intangible assets (428) (412) (26) (24)
Derivative financial instruments (55) 16 22 23
Employee entitlements 51 58 4 5
Inventories 27 28 – –
Receivables, payables and provisions 40 48 4 8
New Zealand tax losses 476 421 476 421
Offshore tax losses 202 161 – –
Other 7 (42) – –
Total deferred tax 226 211 492 444
Movements for the year
Opening balance 211 14 444 385
Recognised in the income statement 5 94 140 49 62
Recognised directly in other comprehensive income (70) 58 (1) (3)
Foreign currency translation (9) (1) – –
Closing balance 226 211 492 444
Included within the statement of financial position as follows:
Deferred tax assets 231 217 492 444
Deferred tax liabilities (5) (6) – –
Total deferred tax 226 211 492 444
Balance expected to be recovered or settled:
Within the next 12 months 233 158 31 37
After the next 12 months (7) 53 461 407
Total deferred tax 226 211 492 444
The Group has not recognised deferred tax liabilities in respect of unremitted earnings that are considered indefinitely reinvested in foreign subsidiaries. As at 31 July 2014, these earnings amount to $624 million (2013: $334 million). They could be subject to withholding and other taxes on remittance.
17 BUSINESS COMBINATIONS
There were no material business combinations during the year ended 31 July 2014 or 31 July 2013.
18 FINANCIAL RISK MANAGEMENT
Overview
Global financial and commodity markets remain volatile. The nature of Fonterra’s business is such that managing risks in the foreign exchange, interest rate, commodity, credit and liquidity markets is critical to minimising the volatility in returns to equity holders.
The Board has overall responsibility for the establishment and oversight of the Group’s financial risk management framework. The Board:
– has established financial risk management policies and procedures to identify, analyse and, where appropriate, manage the financial risks faced by the Group;
– has approved a Treasury Policy that covers appropriate financial risk limits and controls (including, but not limited to, delegated authority levels and authorised use of various financial instruments); and
– monitors financial risks and adherence to approved limits.
The Group’s overall financial risk management programme focuses primarily on maintaining a prudent financial risk profile that provides flexibility to implement the Group’s strategies, while ensuring the optimisation of the return on assets. Financial risk management is centralised, which ensures compliance with the financial risk management policies and procedures set by the Board. The Office of the Chief Financial Officer manages financial risk, including foreign exchange risk, interest rate risk, credit risk, liquidity risk and commodity price risk.
NOTES TO THE FINANCIAL STATEMENTS CONTINUEDFOR THE YEAR ENDED 31 JULY 2014

FONTERRA ANNUAL FINANCIAL RESULTS 2014 33
18 FINANCIAL RISK MANAGEMENT CONTINUED
During the year, in order to manage financial risks, the key financial risk management activities undertaken by the Group included, but were not limited to, the following:
Capital structure
Fonterra launched Trading Among Farmers (TAF) in November 2012. A key objective in establishing TAF was to support the establishment of the Fonterra Shareholders’ Market in order to eliminate redemption risk and provide a permanent capital base for the Co-operative. Equity instruments comprise Co-operative shares and units in the Fonterra Shareholders’ Fund. These are classified as subscribed equity. Further detail is given in Note 7 and the capital management section below.
Bank facility renewal
Fonterra’s banking facilities are renewed at least annually with the exception of certain facilities where renewals are required at agreed periods of more than one year. On 31 July 2014, Fonterra had $3,215 million (31 July 2013: $3,289 million) of undrawn committed facilities. For further details refer to liquidity risk below in Note 18(d).
Economic debt to debt plus equity ratio
The economic debt to debt plus equity ratio at 31 July 2014 is 42.3% (31 July 2013: 39.6%). For more details, refer to the capital management section below in Note 18(e).
a) Foreign exchange riskThe Group operates internationally and is exposed to foreign exchange risk on sales, purchases, investments and borrowings that are denominated in foreign currencies. Foreign exchange risk arises from future commercial transactions, recognised assets and liabilities and net investments in foreign operations.
The main impacts of foreign exchange movements on the Group arise from:
– transaction risk: variations in the New Zealand dollar value of the Group’s sales receipts and other cash flows; and
– translation risk: the value of the Group’s investment in foreign operations and the Group’s foreign currency debt.
The Group’s objective is to ensure foreign exchange exposure is managed in a prudent manner in order to reduce volatility on the returns to equity holders and Shareholder suppliers.
In respect of transaction hedging, the Group’s policy is to hedge 100% of the net recognised foreign currency trade receivables and foreign currency trade payables, and up to 100% of forecast cash receipts from sales for a period of up to 18 months. The level of hedging undertaken is influenced by current exchange rates and the time until the expected cash flows occur, within the limits approved by the Board. The Group seeks to designate items in a hedge relationship where it is practical to do so; therefore some derivative instruments entered into as economic hedges may not be in a designated hedge relationship for accounting purposes.
Approximately 96% (31 July 2013: 96%) of the Group’s net transaction foreign exchange exposure, before taking into consideration hedging activity, is against the United States Dollar.
In respect of translation hedging, the Group uses foreign currency denominated borrowings to hedge exposures arising from net investments in foreign operations. The Group uses forward foreign exchange contracts, currency options and cross currency interest rate swaps to hedge translation exposure arising from foreign currency debt that is not in a net investment hedge.
Of the Group’s translation exposure arising from investment in foreign operations, before taking into consideration hedging activity, approximately 32% (31 July 2013: 30%) is against the Australian Dollar, 16% (31 July 2013: 23%) is against the Singapore Dollar, and 12% (31 July 2013: 14%) is against the Chilean Peso.
Of the Group’s translation exposure arising from foreign currency debt, before taking into consideration hedging activity, approximately 39% (31 July 2013: 66%) is against the United States Dollar, 27% (31 July 2013: 1%) is against the Australian Dollar, and 21% (31 July 2013: 28%) is against the Great British Pound.
Foreign exchange sensitivityA 10% movement in the value of the New Zealand dollar against the key currencies to which the Group is exposed would result in the following post-tax, using appropriate tax rates, increase/(decrease) to equity and profit. A 10% movement in exchange rates is considered reasonably possible over the short term, given historical fluctuations in the value of the New Zealand dollar.
GROUP $ MILLION PARENT $ MILLION
31 JULY 2014 31 JULY 2013 31 JULY 2014 31 JULY 2013
EQUITY PROFIT EQUITY PROFIT EQUITY PROFIT EQUITY PROFIT
Impact of a 10% strengthening of the NZD 231 (7) 192 (21) (20) – (19) –
Impact of a 10% weakening of the NZD (210) 31 (195) 25 24 – 23 –
The Parent has no sensitivity to foreign exchange movements in the income statement, as gains and losses are passed to a subsidiary through a novation agreement.
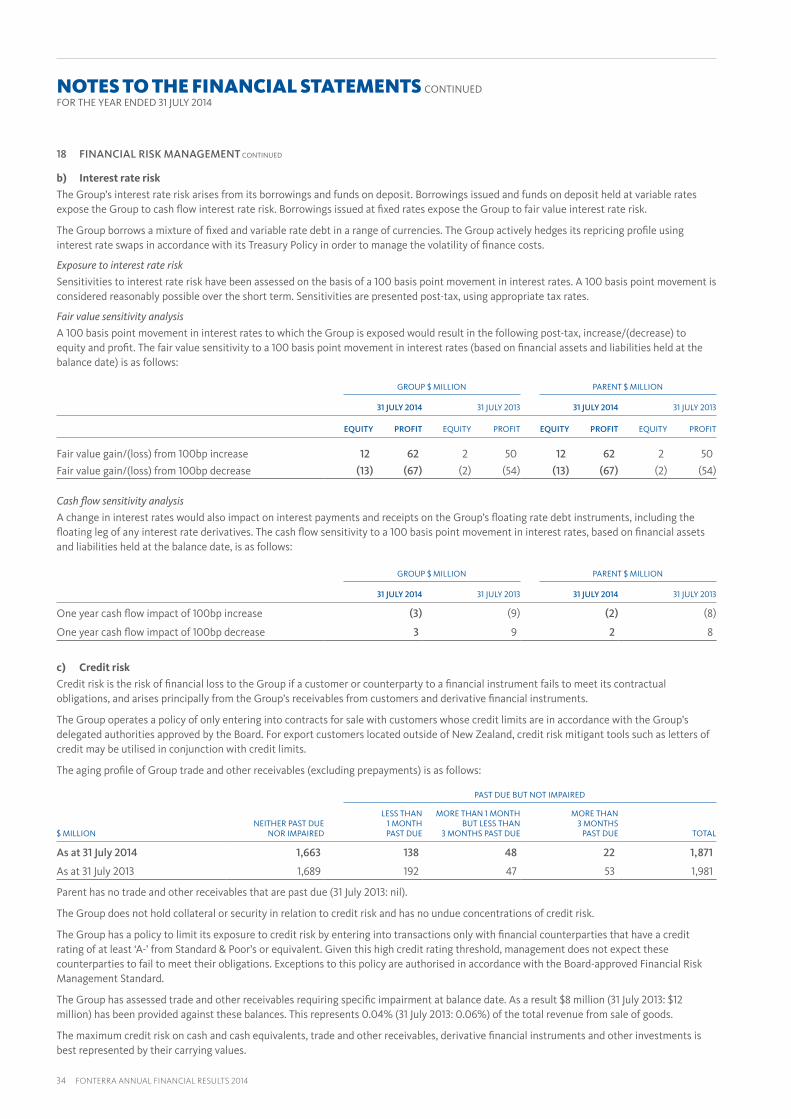
34 FONTERRA ANNUAL FINANCIAL RESULTS 2014
18 FINANCIAL RISK MANAGEMENT CONTINUED
b) Interest rate riskThe Group’s interest rate risk arises from its borrowings and funds on deposit. Borrowings issued and funds on deposit held at variable rates expose the Group to cash flow interest rate risk. Borrowings issued at fixed rates expose the Group to fair value interest rate risk.
The Group borrows a mixture of fixed and variable rate debt in a range of currencies. The Group actively hedges its repricing profile using interest rate swaps in accordance with its Treasury Policy in order to manage the volatility of finance costs.
Exposure to interest rate riskSensitivities to interest rate risk have been assessed on the basis of a 100 basis point movement in interest rates. A 100 basis point movement is considered reasonably possible over the short term. Sensitivities are presented post-tax, using appropriate tax rates.
Fair value sensitivity analysis A 100 basis point movement in interest rates to which the Group is exposed would result in the following post-tax, increase/(decrease) to equity and profit. The fair value sensitivity to a 100 basis point movement in interest rates (based on financial assets and liabilities held at the balance date) is as follows:
GROUP $ MILLION PARENT $ MILLION
31 JULY 2014 31 JULY 2013 31 JULY 2014 31 JULY 2013
EQUITY PROFIT EQUITY PROFIT EQUITY PROFIT EQUITY PROFIT
Fair value gain/(loss) from 100bp increase 12 62 2 50 12 62 2 50
Fair value gain/(loss) from 100bp decrease (13) (67) (2) (54) (13) (67) (2) (54)
Cash flow sensitivity analysis A change in interest rates would also impact on interest payments and receipts on the Group’s floating rate debt instruments, including the floating leg of any interest rate derivatives. The cash flow sensitivity to a 100 basis point movement in interest rates, based on financial assets and liabilities held at the balance date, is as follows:
GROUP $ MILLION PARENT $ MILLION
31 JULY 2014 31 JULY 2013 31 JULY 2014 31 JULY 2013
One year cash flow impact of 100bp increase (3) (9) (2) (8)
One year cash flow impact of 100bp decrease 3 9 2 8
c) Credit riskCredit risk is the risk of financial loss to the Group if a customer or counterparty to a financial instrument fails to meet its contractual obligations, and arises principally from the Group’s receivables from customers and derivative financial instruments.
The Group operates a policy of only entering into contracts for sale with customers whose credit limits are in accordance with the Group’s delegated authorities approved by the Board. For export customers located outside of New Zealand, credit risk mitigant tools such as letters of credit may be utilised in conjunction with credit limits.
The aging profile of Group trade and other receivables (excluding prepayments) is as follows:
PAST DUE BUT NOT IMPAIRED
$ MILLIONNEITHER PAST DUE
NOR IMPAIRED
LESS THAN 1 MONTH PAST DUE
MORE THAN 1 MONTH BUT LESS THAN
3 MONTHS PAST DUE
MORE THAN 3 MONTHS
PAST DUE TOTAL
As at 31 July 2014 1,663 138 48 22 1,871
As at 31 July 2013 1,689 192 47 53 1,981
Parent has no trade and other receivables that are past due (31 July 2013: nil).
The Group does not hold collateral or security in relation to credit risk and has no undue concentrations of credit risk.
The Group has a policy to limit its exposure to credit risk by entering into transactions only with financial counterparties that have a credit rating of at least ‘A-’ from Standard & Poor’s or equivalent. Given this high credit rating threshold, management does not expect these counterparties to fail to meet their obligations. Exceptions to this policy are authorised in accordance with the Board-approved Financial Risk Management Standard.
The Group has assessed trade and other receivables requiring specific impairment at balance date. As a result $8 million (31 July 2013: $12 million) has been provided against these balances. This represents 0.04% (31 July 2013: 0.06%) of the total revenue from sale of goods.
The maximum credit risk on cash and cash equivalents, trade and other receivables, derivative financial instruments and other investments is best represented by their carrying values.
NOTES TO THE FINANCIAL STATEMENTS CONTINUEDFOR THE YEAR ENDED 31 JULY 2014
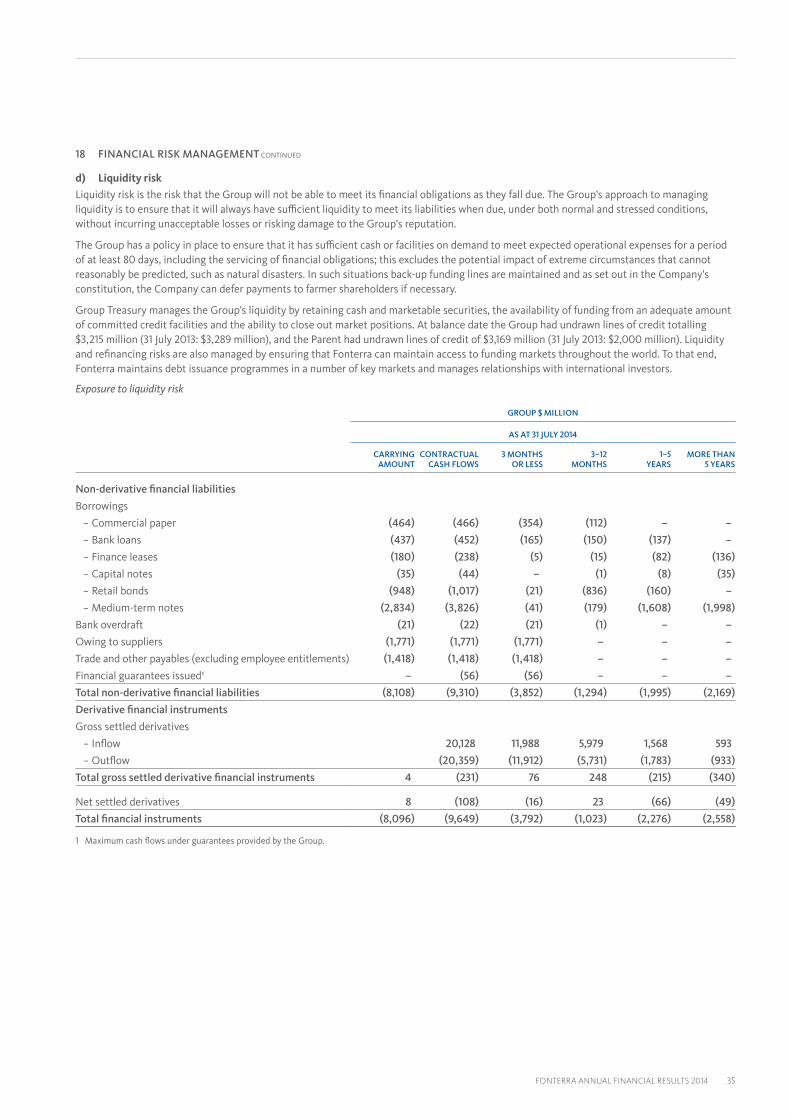
FONTERRA ANNUAL FINANCIAL RESULTS 2014 35
18 FINANCIAL RISK MANAGEMENT CONTINUED
d) Liquidity riskLiquidity risk is the risk that the Group will not be able to meet its financial obligations as they fall due. The Group’s approach to managing liquidity is to ensure that it will always have sufficient liquidity to meet its liabilities when due, under both normal and stressed conditions, without incurring unacceptable losses or risking damage to the Group’s reputation.
The Group has a policy in place to ensure that it has sufficient cash or facilities on demand to meet expected operational expenses for a period of at least 80 days, including the servicing of financial obligations; this excludes the potential impact of extreme circumstances that cannot reasonably be predicted, such as natural disasters. In such situations back-up funding lines are maintained and as set out in the Company’s constitution, the Company can defer payments to farmer shareholders if necessary.
Group Treasury manages the Group’s liquidity by retaining cash and marketable securities, the availability of funding from an adequate amount of committed credit facilities and the ability to close out market positions. At balance date the Group had undrawn lines of credit totalling $3,215 million (31 July 2013: $3,289 million), and the Parent had undrawn lines of credit of $3,169 million (31 July 2013: $2,000 million). Liquidity and refinancing risks are also managed by ensuring that Fonterra can maintain access to funding markets throughout the world. To that end, Fonterra maintains debt issuance programmes in a number of key markets and manages relationships with international investors.
Exposure to liquidity risk
GROUP $ MILLION
AS AT 31 JULY 2014
CARRYING AMOUNT
CONTRACTUAL CASH FLOWS
3 MONTHS OR LESS
3–12 MONTHS
1–5 YEARS
MORE THAN 5 YEARS
Non-derivative financial liabilities
Borrowings
− Commercial paper (464) (466) (354) (112) – –
− Bank loans (437) (452) (165) (150) (137) –
− Finance leases (180) (238) (5) (15) (82) (136)
− Capital notes (35) (44) – (1) (8) (35)
− Retail bonds (948) (1,017) (21) (836) (160) –
− Medium-term notes (2,834) (3,826) (41) (179) (1,608) (1,998)
Bank overdraft (21) (22) (21) (1) – –
Owing to suppliers (1,771) (1,771) (1,771) – – –
Trade and other payables (excluding employee entitlements) (1,418) (1,418) (1,418) – – –
Financial guarantees issued¹ – (56) (56) – – –
Total non-derivative financial liabilities (8,108) (9,310) (3,852) (1,294) (1,995) (2,169)
Derivative financial instruments
Gross settled derivatives
− Inflow 20,128 11,988 5,979 1,568 593
− Outflow (20,359) (11,912) (5,731) (1,783) (933)
Total gross settled derivative financial instruments 4 (231) 76 248 (215) (340)
Net settled derivatives 8 (108) (16) 23 (66) (49)
Total financial instruments (8,096) (9,649) (3,792) (1,023) (2,276) (2,558)
1 Maximum cash flows under guarantees provided by the Group.

36 FONTERRA ANNUAL FINANCIAL RESULTS 2014
18 FINANCIAL RISK MANAGEMENT CONTINUED
Exposure to liquidity risk
GROUP $ MILLION
AS AT 31 JULY 2013
CARRYING AMOUNT
CONTRACTUAL CASH FLOWS
3 MONTHS OR LESS
3–12 MONTHS
1–5 YEARS
MORE THAN 5 YEARS
Non-derivative financial liabilities
Borrowings
− Commercial paper (431) (432) (280) (152) – –
− Bank loans (714) (731) (414) (203) (114) –
− Finance leases (173) (244) (5) (15) (82) (142)
− Capital notes (35) (42) – (1) (6) (35)
− Retail bonds (945) (1,090) (21) (52) (1,017) –
− Medium-term notes (2,379) (3,088) (45) (708) (1,294) (1,041)
Bank overdraft (1) (1) (1) – – –
Owing to suppliers (711) (711) (711) – – –
Trade and other payables (excluding employee entitlements) (1,253) (1,212) (1,212) – – –
Financial guarantees issued¹ – (100) (100) – – –
Total non-derivative financial liabilities (6,642) (7,651) (2,789) (1,131) (2,513) (1,218)
Derivative financial instruments
Gross settled derivatives
− Inflow 19,776 9,239 8,566 1,375 596
− Outflow (20,312) (9,240) (8,565) (1,539) (968)
Total gross settled derivative financial instruments (325) (536) (1) 1 (164) (372)
Net settled derivatives 57 161 (3) 30 28 106
Total financial instruments (6,910) (8,026) (2,793) (1,100) (2,649) (1,484)
1 Maximum cash flows under guarantees provided by the Group.
NOTES TO THE FINANCIAL STATEMENTS CONTINUEDFOR THE YEAR ENDED 31 JULY 2014
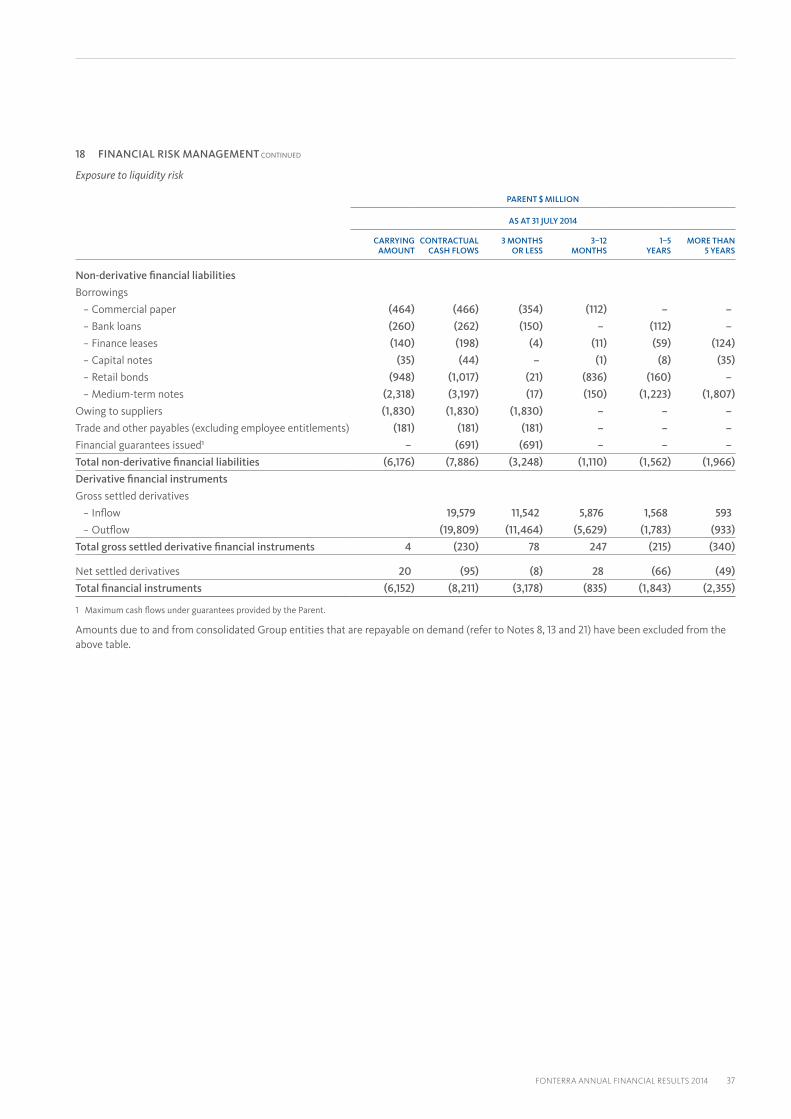
FONTERRA ANNUAL FINANCIAL RESULTS 2014 37
18 FINANCIAL RISK MANAGEMENT CONTINUED
Exposure to liquidity risk
PARENT $ MILLION
AS AT 31 JULY 2014
CARRYING AMOUNT
CONTRACTUAL CASH FLOWS
3 MONTHS OR LESS
3–12 MONTHS
1–5 YEARS
MORE THAN 5 YEARS
Non-derivative financial liabilities
Borrowings
− Commercial paper (464) (466) (354) (112) – –
− Bank loans (260) (262) (150) – (112) –
− Finance leases (140) (198) (4) (11) (59) (124)
− Capital notes (35) (44) – (1) (8) (35)
− Retail bonds (948) (1,017) (21) (836) (160) –
− Medium-term notes (2,318) (3,197) (17) (150) (1,223) (1,807)
Owing to suppliers (1,830) (1,830) (1,830) – – –
Trade and other payables (excluding employee entitlements) (181) (181) (181) – – –
Financial guarantees issued¹ – (691) (691) – – –
Total non-derivative financial liabilities (6,176) (7,886) (3,248) (1,110) (1,562) (1,966)
Derivative financial instruments
Gross settled derivatives
− Inflow 19,579 11,542 5,876 1,568 593
− Outflow (19,809) (11,464) (5,629) (1,783) (933)
Total gross settled derivative financial instruments 4 (230) 78 247 (215) (340)
Net settled derivatives 20 (95) (8) 28 (66) (49)
Total financial instruments (6,152) (8,211) (3,178) (835) (1,843) (2,355)
1 Maximum cash flows under guarantees provided by the Parent.
Amounts due to and from consolidated Group entities that are repayable on demand (refer to Notes 8, 13 and 21) have been excluded from the above table.
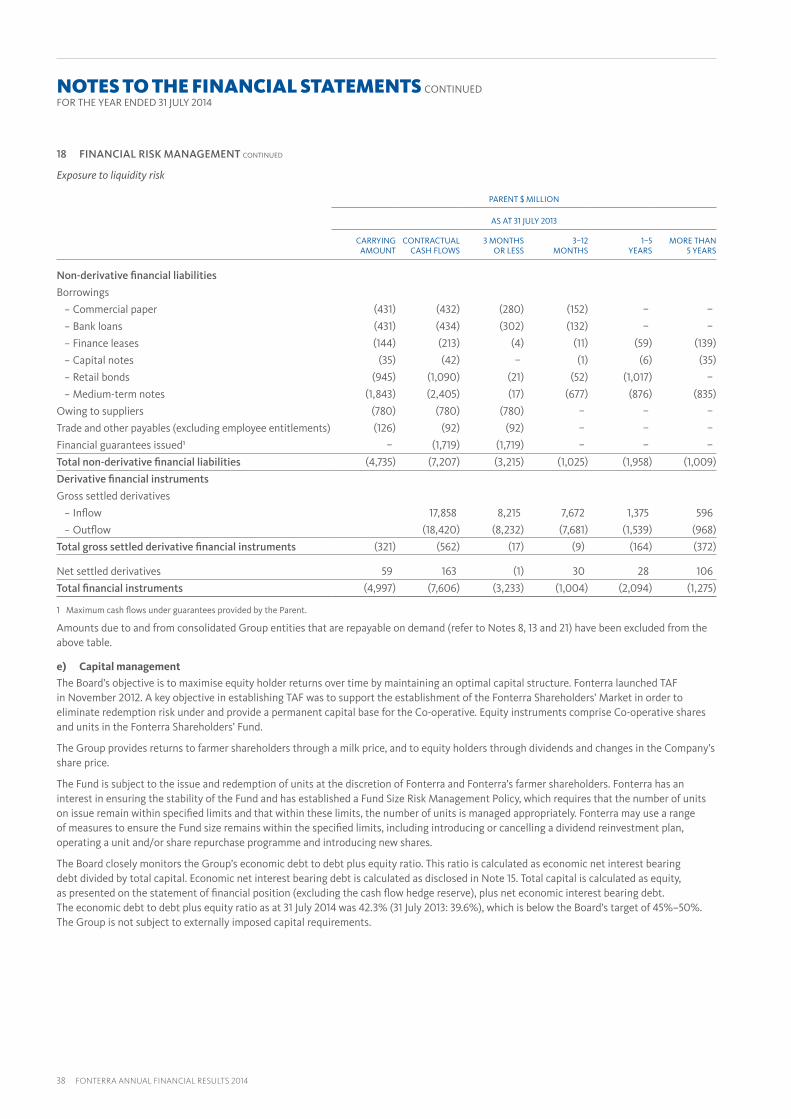
38 FONTERRA ANNUAL FINANCIAL RESULTS 2014
18 FINANCIAL RISK MANAGEMENT CONTINUED
Exposure to liquidity risk
PARENT $ MILLION
AS AT 31 JULY 2013
CARRYING AMOUNT
CONTRACTUAL CASH FLOWS
3 MONTHS OR LESS
3–12 MONTHS
1–5 YEARS
MORE THAN 5 YEARS
Non-derivative financial liabilities
Borrowings
− Commercial paper (431) (432) (280) (152) – –
− Bank loans (431) (434) (302) (132) – –
− Finance leases (144) (213) (4) (11) (59) (139)
− Capital notes (35) (42) – (1) (6) (35)
− Retail bonds (945) (1,090) (21) (52) (1,017) –
− Medium-term notes (1,843) (2,405) (17) (677) (876) (835)
Owing to suppliers (780) (780) (780) – – –
Trade and other payables (excluding employee entitlements) (126) (92) (92) – – –
Financial guarantees issued¹ – (1,719) (1,719) – – –
Total non-derivative financial liabilities (4,735) (7,207) (3,215) (1,025) (1,958) (1,009)
Derivative financial instruments
Gross settled derivatives
− Inflow 17,858 8,215 7,672 1,375 596
− Outflow (18,420) (8,232) (7,681) (1,539) (968)
Total gross settled derivative financial instruments (321) (562) (17) (9) (164) (372)
Net settled derivatives 59 163 (1) 30 28 106
Total financial instruments (4,997) (7,606) (3,233) (1,004) (2,094) (1,275)
1 Maximum cash flows under guarantees provided by the Parent.
Amounts due to and from consolidated Group entities that are repayable on demand (refer to Notes 8, 13 and 21) have been excluded from the above table.
e) Capital managementThe Board’s objective is to maximise equity holder returns over time by maintaining an optimal capital structure. Fonterra launched TAF in November 2012. A key objective in establishing TAF was to support the establishment of the Fonterra Shareholders’ Market in order to eliminate redemption risk under and provide a permanent capital base for the Co-operative. Equity instruments comprise Co-operative shares and units in the Fonterra Shareholders’ Fund.
The Group provides returns to farmer shareholders through a milk price, and to equity holders through dividends and changes in the Company’s share price.
The Fund is subject to the issue and redemption of units at the discretion of Fonterra and Fonterra’s farmer shareholders. Fonterra has an interest in ensuring the stability of the Fund and has established a Fund Size Risk Management Policy, which requires that the number of units on issue remain within specified limits and that within these limits, the number of units is managed appropriately. Fonterra may use a range of measures to ensure the Fund size remains within the specified limits, including introducing or cancelling a dividend reinvestment plan, operating a unit and/or share repurchase programme and introducing new shares.
The Board closely monitors the Group’s economic debt to debt plus equity ratio. This ratio is calculated as economic net interest bearing debt divided by total capital. Economic net interest bearing debt is calculated as disclosed in Note 15. Total capital is calculated as equity, as presented on the statement of financial position (excluding the cash flow hedge reserve), plus net economic interest bearing debt. The economic debt to debt plus equity ratio as at 31 July 2014 was 42.3% (31 July 2013: 39.6%), which is below the Board’s target of 45%–50%.The Group is not subject to externally imposed capital requirements.
NOTES TO THE FINANCIAL STATEMENTS CONTINUEDFOR THE YEAR ENDED 31 JULY 2014

FONTERRA ANNUAL FINANCIAL RESULTS 2014 39
18 FINANCIAL RISK MANAGEMENT CONTINUED
f) Dairy commodity price riskDairy commodity price risk is the risk of volatility in profit or loss from a movement in dairy commodity prices to which the Group may be exposed.
Dairy commodity price risk arises from transactions for the sale and purchase of a variety of milk and milk derived products.
The Group manages its dairy commodity price risk by adopting a product mix that management considers best reflects the demand trends in dairy product markets globally. Sales contracts for future production of varying lengths are also used to enable the Group to sell its products at prices and times that management considers will maximise revenue.
The Group has, on a limited scale, direct trading in dairy commodity derivatives. Due to the limited market for the types of dairy commodity derivatives, such activity is only a small component of management’s strategy for managing commodity price risk. Fonterra aims to use its industry knowledge to obtain the best price for future sales, so as markets for such derivatives grows, the scope of such commodity risk management activities may increase.
Commodity price risk sensitivity analysis The table below summarises the impact on dairy commodity derivatives for increases/decreases of dairy commodity prices on the Group’s post-tax profit after tax. The analysis is based on the assumption that dairy based commodity derivative prices had increased/decreased by 10% with all other variables held constant:
GROUP $ MILLION
31 JULY 2014 PROFIT
31 JULY 2013 PROFIT
Impact of 10% increase in quoted dairy commodity derivative prices (3) –
Impact of 10% decrease in quoted dairy commodity derivative prices 3 –
The Parent does not hold dairy commodity derivatives.
g) Financial instrument fair values and classificationsValuation techniques for determining fair valuesThe fair value is the price that would be received to sell an asset or paid to transfer a liability in an orderly transaction between market participants at the measurement date.
The fair values of financial assets and liabilities are calculated by reference to quoted market prices where that is possible. A market is regarded as active if quoted prices are readily and regularly available from an exchange, dealer, broker, industry group, pricing service, or regulatory agency, and those prices represent actual and regularly occurring market transactions on an arm’s length basis.
If quoted market prices are not available, the methodology used to calculate the fair values of financial assets and liabilities is to identify the expected cash flows under the terms of each specific contract and then discount these values back to the present value. These models use as their basis independently sourced market data where it is available and rely as little as possible on entity-specific estimates.
The calculation of the fair value of financial instruments reflects the impact of credit risk where appropriate.
Specific valuation techniques used to value financial instruments include:
– The fair value of forward foreign exchange contracts is determined using observable currency exchange rates, option volatilities and interest rate yield curves;
– The fair value of interest rate contracts is calculated as the present value of the estimated future cash flows based on observable interest rate yield curves;
– The fair value of commodity contracts that are not exchange traded is determined by calculating the present value of estimated future cash flows based on observable quoted prices for similar instruments;
– The fair value of borrowings and long term advances that are not exchange traded is calculated as the present value of the estimated future cash flows based on observable interest rate yield curves.
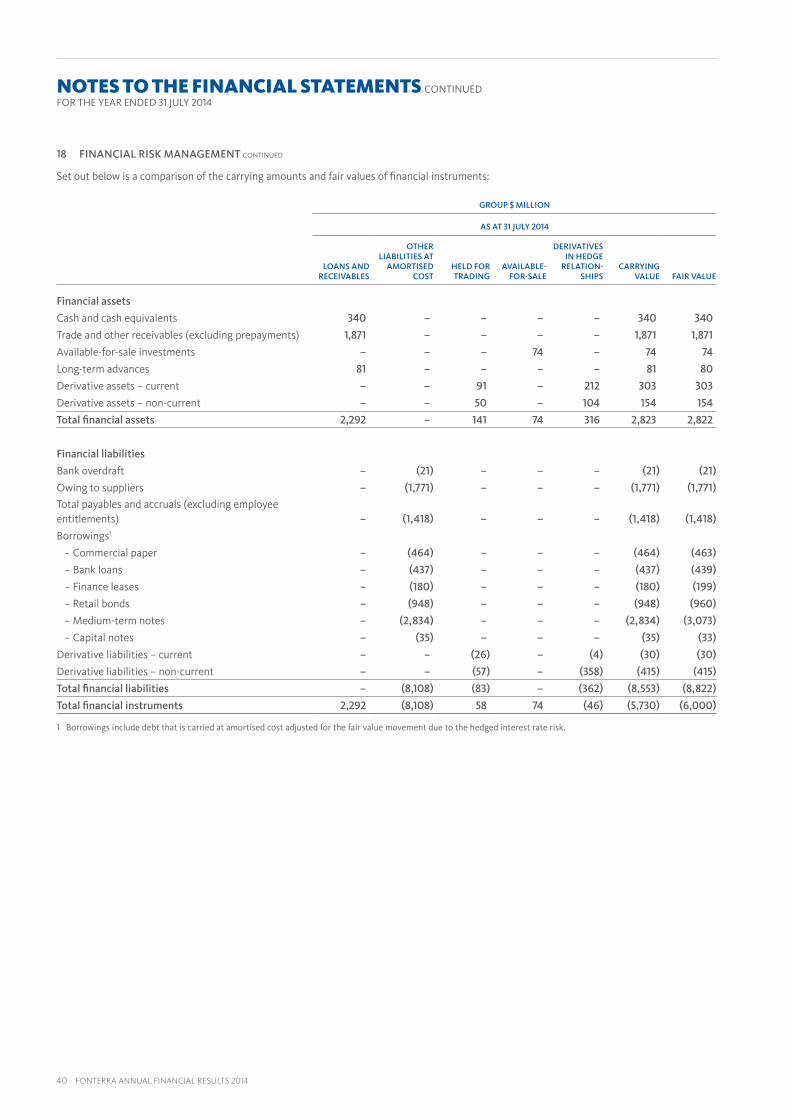
40 FONTERRA ANNUAL FINANCIAL RESULTS 2014
18 FINANCIAL RISK MANAGEMENT CONTINUED
Set out below is a comparison of the carrying amounts and fair values of financial instruments:
GROUP $ MILLION
AS AT 31 JULY 2014
LOANS AND RECEIVABLES
OTHER LIABILITIES AT
AMORTISED COST
HELD FOR TRADING
AVAILABLE-FOR-SALE
DERIVATIVES IN HEDGE
RELATION-SHIPS
CARRYING VALUE FAIR VALUE
Financial assets
Cash and cash equivalents 340 – – – – 340 340
Trade and other receivables (excluding prepayments) 1,871 – – – – 1,871 1,871
Available-for-sale investments – – – 74 – 74 74
Long-term advances 81 – – – – 81 80
Derivative assets – current – – 91 – 212 303 303
Derivative assets – non-current – – 50 – 104 154 154
Total financial assets 2,292 – 141 74 316 2,823 2,822
Financial liabilities
Bank overdraft – (21) – – – (21) (21)
Owing to suppliers – (1,771) – – – (1,771) (1,771)
Total payables and accruals (excluding employee entitlements) – (1,418) – – – (1,418) (1,418)
Borrowings1
− Commercial paper – (464) – – – (464) (463)
− Bank loans – (437) – – – (437) (439)
− Finance leases – (180) – – – (180) (199)
− Retail bonds – (948) – – – (948) (960)
− Medium-term notes – (2,834) – – – (2,834) (3,073)
− Capital notes – (35) – – – (35) (33)
Derivative liabilities – current – – (26) – (4) (30) (30)
Derivative liabilities – non-current – – (57) – (358) (415) (415)
Total financial liabilities – (8,108) (83) – (362) (8,553) (8,822)
Total financial instruments 2,292 (8,108) 58 74 (46) (5,730) (6,000)
1 Borrowings include debt that is carried at amortised cost adjusted for the fair value movement due to the hedged interest rate risk.
NOTES TO THE FINANCIAL STATEMENTS CONTINUEDFOR THE YEAR ENDED 31 JULY 2014
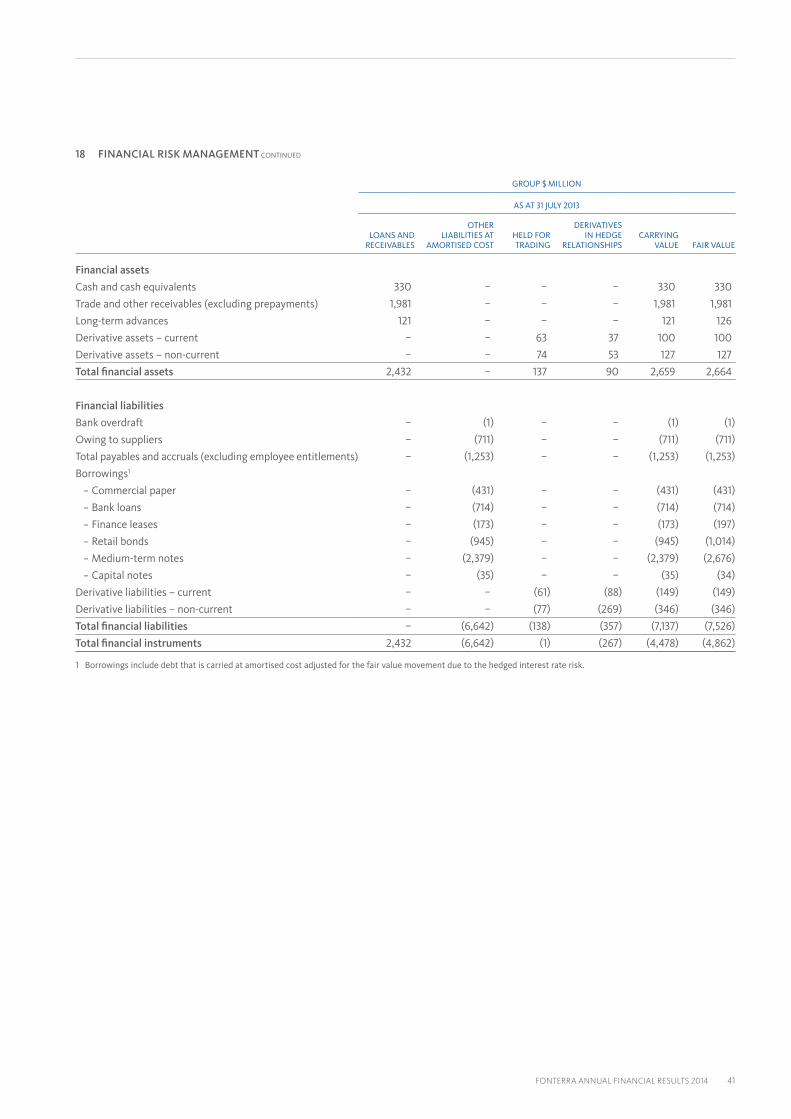
FONTERRA ANNUAL FINANCIAL RESULTS 2014 41
18 FINANCIAL RISK MANAGEMENT CONTINUED
GROUP $ MILLION
AS AT 31 JULY 2013
LOANS AND RECEIVABLES
OTHER LIABILITIES AT
AMORTISED COSTHELD FOR TRADING
DERIVATIVES IN HEDGE
RELATIONSHIPSCARRYING
VALUE FAIR VALUE
Financial assets
Cash and cash equivalents 330 – – – 330 330
Trade and other receivables (excluding prepayments) 1,981 – – – 1,981 1,981
Long-term advances 121 – – – 121 126
Derivative assets – current – – 63 37 100 100
Derivative assets – non-current – – 74 53 127 127
Total financial assets 2,432 – 137 90 2,659 2,664
Financial liabilities
Bank overdraft – (1) – – (1) (1)
Owing to suppliers – (711) – – (711) (711)
Total payables and accruals (excluding employee entitlements) – (1,253) – – (1,253) (1,253)
Borrowings1
− Commercial paper – (431) – – (431) (431)
− Bank loans – (714) – – (714) (714)
− Finance leases – (173) – – (173) (197)
− Retail bonds – (945) – – (945) (1,014)
− Medium-term notes – (2,379) – – (2,379) (2,676)
− Capital notes – (35) – – (35) (34)
Derivative liabilities – current – – (61) (88) (149) (149)
Derivative liabilities – non-current – – (77) (269) (346) (346)
Total financial liabilities – (6,642) (138) (357) (7,137) (7,526)
Total financial instruments 2,432 (6,642) (1) (267) (4,478) (4,862)
1 Borrowings include debt that is carried at amortised cost adjusted for the fair value movement due to the hedged interest rate risk.
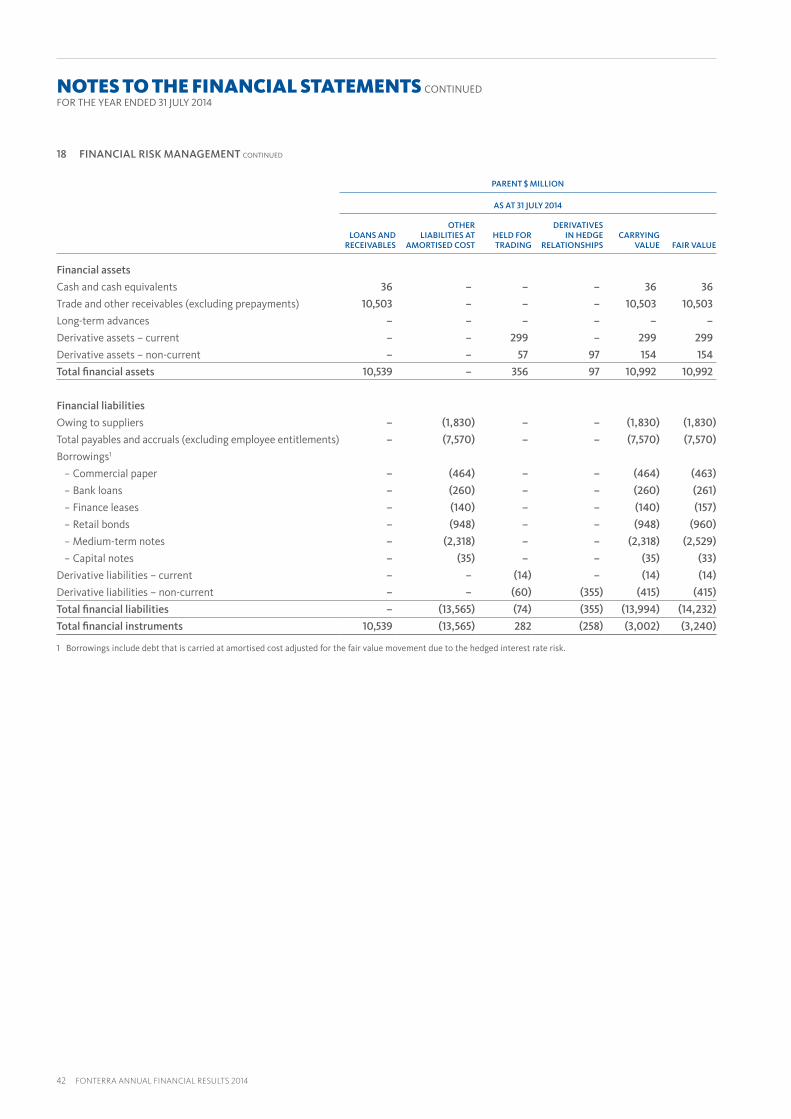
42 FONTERRA ANNUAL FINANCIAL RESULTS 2014
18 FINANCIAL RISK MANAGEMENT CONTINUED
PARENT $ MILLION
AS AT 31 JULY 2014
LOANS AND RECEIVABLES
OTHER LIABILITIES AT
AMORTISED COSTHELD FOR TRADING
DERIVATIVES IN HEDGE
RELATIONSHIPSCARRYING
VALUE FAIR VALUE
Financial assets
Cash and cash equivalents 36 – – – 36 36
Trade and other receivables (excluding prepayments) 10,503 – – – 10,503 10,503
Long-term advances – – – – – –
Derivative assets – current – – 299 – 299 299
Derivative assets – non-current – – 57 97 154 154
Total financial assets 10,539 – 356 97 10,992 10,992
Financial liabilities
Owing to suppliers – (1,830) – – (1,830) (1,830)
Total payables and accruals (excluding employee entitlements) – (7,570) – – (7,570) (7,570)
Borrowings1
− Commercial paper – (464) – – (464) (463)
− Bank loans – (260) – – (260) (261)
− Finance leases – (140) – – (140) (157)
− Retail bonds – (948) – – (948) (960)
− Medium-term notes – (2,318) – – (2,318) (2,529)
− Capital notes – (35) – – (35) (33)
Derivative liabilities – current – – (14) – (14) (14)
Derivative liabilities – non-current – – (60) (355) (415) (415)
Total financial liabilities – (13,565) (74) (355) (13,994) (14,232)
Total financial instruments 10,539 (13,565) 282 (258) (3,002) (3,240)
1 Borrowings include debt that is carried at amortised cost adjusted for the fair value movement due to the hedged interest rate risk.
NOTES TO THE FINANCIAL STATEMENTS CONTINUEDFOR THE YEAR ENDED 31 JULY 2014

FONTERRA ANNUAL FINANCIAL RESULTS 2014 43
18 FINANCIAL RISK MANAGEMENT CONTINUED
PARENT $ MILLION
AS AT 31 JULY 2013
LOANS AND RECEIVABLES
OTHER LIABILITIES AT
AMORTISED COSTHELD FOR TRADING
DERIVATIVES IN HEDGE
RELATIONSHIPSCARRYING
VALUE FAIR VALUE
Financial assets
Cash and cash equivalents 42 – – – 42 42
Trade and other receivables (excluding prepayments) 9,091 – – – 9,091 9,091
Long-term advances 3 – – – 3 3
Derivative assets – current – – 100 3 103 103
Derivative assets – non-current – – 84 43 127 127
Total financial assets 9,136 – 184 46 9,366 9,366
Financial liabilities
Owing to suppliers – (780) – – (780) (780)
Total payables and accruals (excluding employee entitlements) – (7,015) – – (7,015) (7,015)
Borrowings1
− Commercial paper – (431) – – (431) (431)
− Bank loans – (431) – – (431) (431)
− Finance leases – (144) – – (144) (165)
− Retail bonds – (945) – – (945) (1,014)
− Medium-term notes – (1,843) – – (1,843) (2,108)
− Capital notes – (35) – – (35) (34)
Derivative liabilities – current – – (118) (28) (146) (146)
Derivative liabilities – non-current – – (91) (255) (346) (346)
Total financial liabilities – (11,624) (209) (283) (12,116) (12,470)
Total financial instruments 9,136 (11,624) (25) (237) (2,750) (3,104)
1 Borrowings include debt that is carried at amortised cost adjusted for the fair value movement due to the hedged interest rate risk.
Fair value hierarchyAll financial instruments for which a fair value is recognised are categorised within the fair value hierarchy, described as follows, based on the lowest level input that is significant to the fair value measurement as a whole:
– Level 1: Quoted prices (unadjusted) in active markets for identical assets or liabilities;
– Level 2: Inputs other than quoted prices included within Level 1 that are observable for the asset or liability either directly (i.e. as prices) or indirectly (i.e. derived from prices);
– Level 3: Inputs for the assets or liabilities that are not based on observable market data (unobservable inputs).

44 FONTERRA ANNUAL FINANCIAL RESULTS 2014
18 FINANCIAL RISK MANAGEMENT CONTINUED
The following table shows the fair value hierarchy for financial instruments measured at fair value on the statement of financial position:
GROUP $ MILLION PARENT $ MILLION
AS AT 31 JULY 2014
AS AT 31 JULY 2013
AS AT 31 JULY 2014
AS AT 31 JULY 2013
Derivative assets
– Commodity derivatives 4 – – –
Derivative liabilities
– Commodity derivatives (16) (1) – –
Available-for-sale investments 74 – – –
Prices quoted in active markets (Level 1) 62 (1) – –
Derivative assets
– Commodity derivatives – 5 – –
– Foreign exchange derivatives 304 87 304 95
– Interest rate derivatives 149 135 149 135
Derivative liabilities
– Commodity derivatives – (7) – –
– Foreign exchange derivatives (11) (114) (11) (119)
– Interest rate derivatives1 (418) (373) (418) (373)
Valuation techniques based on observable market data (Level 2) 24 (267) 24 (262)
Total financial instruments at fair value 86 (268) 24 (262)
1 Includes cross currency interest rate swaps.
The following table shows the fair value hierarchy for each class of asset and liability not measured at fair value in the statement of financial position but for which fair value is disclosed:
GROUP $ MILLION PARENT $ MILLION
AS AT 31 JULY 2014
AS AT 31 JULY 2013
AS AT 31 JULY 2014
AS AT 31 JULY 2013
Prices quoted in active markets (Level 1)
Borrowings
– Retail bonds (960) (1,014) (960) (1,014)
– Capital notes (33) (34) (33) (34)
Prices quoted in active markets (Level 1) (993) (1,048) (993) (1,048)
Valuation techniques based on observable market data (Level 2)
Long-term advances 80 126 – 3
Borrowings
– Commercial paper (463) (431) (463) (431)
– Bank loans (439) (714) (261) (431)
– Medium-term notes (3,073) (2,676) (2,529) (2,108)
– Finance leases (199) (197) (157) (165)
Valuation techniques based on observable market data (Level 2) (4,094) (3,892) (3,410) (3,132)
Fonterra does not have any financial instruments measured or disclosed at fair value that fall into Level 3 of the fair value hierarchy.
The Group’s policy is to recognise transfers between the levels of the fair value hierarchy as of the date of the event or circumstances that caused the transfer.
There were no transfers between any of the items in Level 1 or Level 2 of the fair value hierarchy during any of the periods presented.
NOTES TO THE FINANCIAL STATEMENTS CONTINUEDFOR THE YEAR ENDED 31 JULY 2014
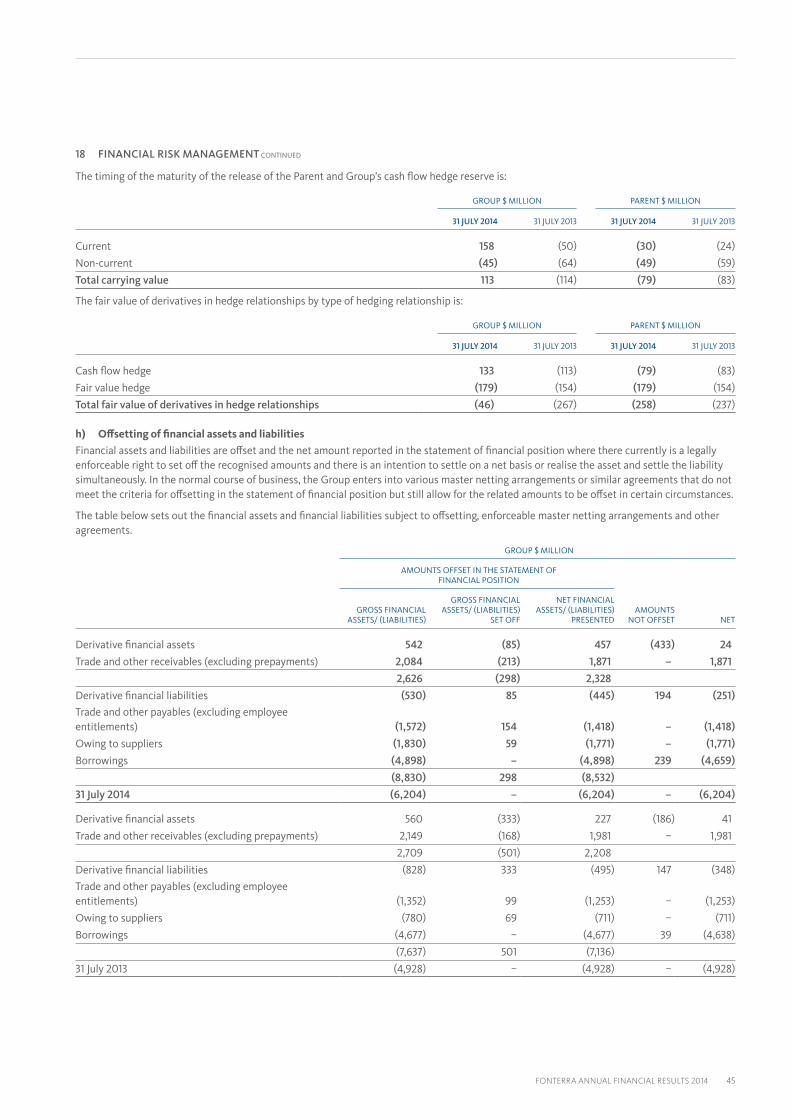
FONTERRA ANNUAL FINANCIAL RESULTS 2014 45
18 FINANCIAL RISK MANAGEMENT CONTINUED
The timing of the maturity of the release of the Parent and Group’s cash flow hedge reserve is:
GROUP $ MILLION PARENT $ MILLION
31 JULY 2014 31 JULY 2013 31 JULY 2014 31 JULY 2013
Current 158 (50) (30) (24)
Non-current (45) (64) (49) (59)
Total carrying value 113 (114) (79) (83)
The fair value of derivatives in hedge relationships by type of hedging relationship is:
GROUP $ MILLION PARENT $ MILLION
31 JULY 2014 31 JULY 2013 31 JULY 2014 31 JULY 2013
Cash flow hedge 133 (113) (79) (83)
Fair value hedge (179) (154) (179) (154)
Total fair value of derivatives in hedge relationships (46) (267) (258) (237)
h) Offsetting of financial assets and liabilitiesFinancial assets and liabilities are offset and the net amount reported in the statement of financial position where there currently is a legally enforceable right to set off the recognised amounts and there is an intention to settle on a net basis or realise the asset and settle the liability simultaneously. In the normal course of business, the Group enters into various master netting arrangements or similar agreements that do not meet the criteria for offsetting in the statement of financial position but still allow for the related amounts to be offset in certain circumstances.
The table below sets out the financial assets and financial liabilities subject to offsetting, enforceable master netting arrangements and other agreements.
GROUP $ MILLION
AMOUNTS OFFSET IN THE STATEMENT OF FINANCIAL POSITION
GROSS FINANCIAL ASSETS/ (LIABILITIES)
GROSS FINANCIAL ASSETS/ (LIABILITIES)
SET OFF
NET FINANCIAL ASSETS/ (LIABILITIES)
PRESENTEDAMOUNTS
NOT OFFSET NET
Derivative financial assets 542 (85) 457 (433) 24
Trade and other receivables (excluding prepayments) 2,084 (213) 1,871 – 1,871
2,626 (298) 2,328
Derivative financial liabilities (530) 85 (445) 194 (251)
Trade and other payables (excluding employee entitlements) (1,572) 154 (1,418) – (1,418)
Owing to suppliers (1,830) 59 (1,771) – (1,771)
Borrowings (4,898) – (4,898) 239 (4,659)
(8,830) 298 (8,532)
31 July 2014 (6,204) – (6,204) – (6,204)
Derivative financial assets 560 (333) 227 (186) 41
Trade and other receivables (excluding prepayments) 2,149 (168) 1,981 – 1,981
2,709 (501) 2,208
Derivative financial liabilities (828) 333 (495) 147 (348)
Trade and other payables (excluding employee entitlements) (1,352) 99 (1,253) – (1,253)
Owing to suppliers (780) 69 (711) – (711)
Borrowings (4,677) – (4,677) 39 (4,638)
(7,637) 501 (7,136)
31 July 2013 (4,928) – (4,928) – (4,928)

46 FONTERRA ANNUAL FINANCIAL RESULTS 2014
18 FINANCIAL RISK MANAGEMENT CONTINUED
PARENT $ MILLION
AMOUNTS OFFSET IN THE STATEMENT OF FINANCIAL POSITION
GROSS FINANCIAL ASSETS/ (LIABILITIES)
GROSS FINANCIAL ASSETS/ (LIABILITIES)
SET OFF
NET FINANCIAL ASSETS/ (LIABILITIES)
PRESENTEDAMOUNTS
NOT OFFSET NET
Derivative financial assets 490 (37) 453 (432) 21
Trade and other receivables (excluding prepayments) 11,753 (1,250) 10,503 – 10,503
12,243 (1,287) 10,956
Derivative financial liabilities (466) 37 (429) 193 (236)
Trade and other payables (excluding employee entitlements) (8,761) 1,191 (7,570) – (7,570)
Owing to suppliers (1,889) 59 (1,830) – (1,830)
Borrowings (4,165) – (4,165) 239 (3,926)
(15,281) 1,287 (13,994)
31 July 2014 (3,038) – (3,038) – (3,038)
Derivative financial assets 381 (151) 230 (186) 44
Trade and other receivables (excluding prepayments) 10,048 (957) 9,091 – 9,091
10,429 (1,108) 9,321
Derivative financial liabilities (643) 151 (492) 147 (345)
Trade and other payables (excluding employee entitlements) (7,903) 888 (7,015) – (7,015)
Owing to suppliers (849) 69 (780) – (780)
Borrowings (3,829) – (3,829) 39 (3,790)
(13,224) 1,108 (12,116)
31 July 2013 (2,795) – (2,795) – (2,795)
Amounts that do not meet the criteria for offsetting in the statement of financial position but could be settled net in certain circumstances principally relate to derivative transactions under ISDA (International Swap and Derivative Association) agreements where each party has the option to settle amounts on a net basis in the event of default of the other party.
19 CONTINGENT LIABILITIES
In the normal course of business, Fonterra, its subsidiaries and equity accounted investees are exposed to claims, legal proceedings and arbitrations that may in some cases result in costs to the Group.
In early August 2013, Fonterra publically announced a potential food safety issue with three batches of Whey Protein Concentrate (WPC80) produced at the Hautapu manufacturing site and initiated a precautionary product recall.
In late August 2013, the New Zealand Government confirmed that the Clostridium samples found in WPC80 were not Clostridium botulinum and were not toxigenic, meaning the consumers of products containing the relevant batches of WPC80 were never in danger from Clostridium botulinum.
In January 2014, Danone formally initiated legal proceedings against Fonterra in relation to the WPC80 precautionary recall.
Fonterra is working through the detail of Danone’s claims. Based on current information available and the claims made to date, Fonterra will vigorously defend its position. Uncertainty exists regarding the outcome of the proceedings. Fonterra has provided $11 million which represents the maximum contractual liability to Danone.
The warranty claims made by the purchaser of the Group’s former Western Australia dairy business are no longer outstanding, as at 31 July 2014.
The Directors believe that these claims, legal proceedings and arbitrations have been adequately provided for and disclosed by the Group and that there are no additional legal proceedings or arbitrations that are pending at the date of these financial statements that require provision or disclosure.
The Group has no other contingent liabilities as at 31 July 2014 (31 July 2013: nil).
NOTES TO THE FINANCIAL STATEMENTS CONTINUEDFOR THE YEAR ENDED 31 JULY 2014

FONTERRA ANNUAL FINANCIAL RESULTS 2014 47
20 COMMITMENTS
Property, plant and equipment and software asset expenditure commitments
Property, plant and equipment and software asset expenditure contracted for at balance date but not recognised in the financial statements are as follows:
GROUP $ MILLION PARENT $ MILLION
AS AT 31 JULY 2014
AS AT 31 JULY 2013
AS AT 31 JULY 2014
AS AT 31 JULY 2013
Buildings 124 23 – –
Plant, vehicles and equipment 238 166 3 4
Software 6 9 4 7
Total commitments 368 198 7 11
Operating lease commitments
The Group leases premises, plant and equipment. The future aggregate minimum lease payments under non-cancellable operating leases are as follows:
GROUP $ MILLION PARENT $ MILLION
AS AT 31 JULY 2014
AS AT 31 JULY 2013
AS AT 31 JULY 2014
AS AT 31 JULY 2013
Less than one year 73 76 – –
One to five years 120 142 1 1
Greater than five years 39 22 – –
Total operating lease commitments 232 240 1 1
21 RELATED PARTY TRANSACTIONS
Equity accounted investees (refer to Note 22) and key management personnel are related parties of the Group. Key management personnel comprises the Board and the Fonterra Management Team.
Transactions were entered into and year end balances arose from transactions with related parties as follows:
Key management personnel remuneration
GROUP $ MILLION PARENT $ MILLION
31 JULY 2014 31 JULY 2013 31 JULY 2014 31 JULY 2013
Short-term employee benefits 10 14 9 13
Long-term employee benefits – 1 – 1
Termination benefits 2 4 2 2
Directors’ remuneration 3 2 3 2
Total key management personnel remuneration 15 21 14 18
Revenue from the sale of goods
GROUP $ MILLION PARENT $ MILLION
31 JULY 2014 31 JULY 2013 31 JULY 2014 31 JULY 2013
Sale of goods
Equity accounted investees 77 89 – –
Other Group entities – – 13,243 8,649
Total revenue from the sale of goods 77 89 13,243 8,649
Goods sold to related parties are primarily commodity products and are provided under normal trade terms.
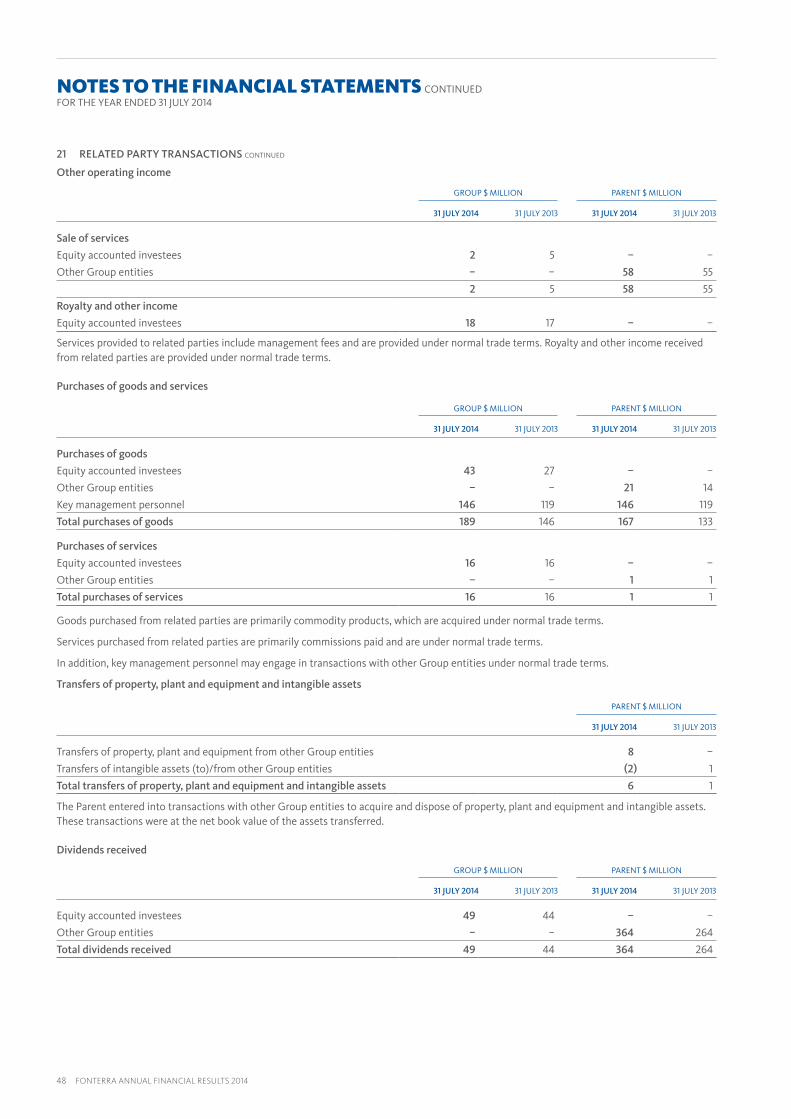
48 FONTERRA ANNUAL FINANCIAL RESULTS 2014
21 RELATED PARTY TRANSACTIONS CONTINUED
Other operating income
GROUP $ MILLION PARENT $ MILLION
31 JULY 2014 31 JULY 2013 31 JULY 2014 31 JULY 2013
Sale of services
Equity accounted investees 2 5 – –
Other Group entities – – 58 55
2 5 58 55
Royalty and other income
Equity accounted investees 18 17 – –
Services provided to related parties include management fees and are provided under normal trade terms. Royalty and other income received from related parties are provided under normal trade terms.
Purchases of goods and services
GROUP $ MILLION PARENT $ MILLION
31 JULY 2014 31 JULY 2013 31 JULY 2014 31 JULY 2013
Purchases of goods
Equity accounted investees 43 27 – –
Other Group entities – – 21 14
Key management personnel 146 119 146 119
Total purchases of goods 189 146 167 133
Purchases of services
Equity accounted investees 16 16 – –
Other Group entities – – 1 1
Total purchases of services 16 16 1 1
Goods purchased from related parties are primarily commodity products, which are acquired under normal trade terms.
Services purchased from related parties are primarily commissions paid and are under normal trade terms.
In addition, key management personnel may engage in transactions with other Group entities under normal trade terms.
Transfers of property, plant and equipment and intangible assets
PARENT $ MILLION
31 JULY 2014 31 JULY 2013
Transfers of property, plant and equipment from other Group entities 8 –
Transfers of intangible assets (to)/from other Group entities (2) 1
Total transfers of property, plant and equipment and intangible assets 6 1
The Parent entered into transactions with other Group entities to acquire and dispose of property, plant and equipment and intangible assets. These transactions were at the net book value of the assets transferred.
Dividends received
GROUP $ MILLION PARENT $ MILLION
31 JULY 2014 31 JULY 2013 31 JULY 2014 31 JULY 2013
Equity accounted investees 49 44 – –
Other Group entities – – 364 264
Total dividends received 49 44 364 264
NOTES TO THE FINANCIAL STATEMENTS CONTINUEDFOR THE YEAR ENDED 31 JULY 2014

FONTERRA ANNUAL FINANCIAL RESULTS 2014 49
21 RELATED PARTY TRANSACTIONS CONTINUED
Balances arising from the sale or purchase of goods or services
GROUP $ MILLION PARENT $ MILLION
AS AT 31 JULY 2014
AS AT 31 JULY 2013
AS AT 31 JULY 2014
AS AT 31 JULY 2013
Receivables1
Equity accounted investees 29 46 – –
Other Group entities – – 102 152
Total receivables arising from the sale or purchase of goods or services 29 46 102 152
Payables
Equity accounted investees 11 15 – –
Other Group entities – – 8 6
Key management personnel² 20 12 20 12
Total payables arising from the sale or purchase of goods or services 31 27 28 18
1 There were no material provisions for impairment on the receivables from related parties.
2 Payables to key management personnel relate to amounts owing for milk supplied to the Group by farmer shareholder Directors.
Balances arising from financing arrangements
GROUP $ MILLION PARENT $ MILLION
AS AT 31 JULY 2014
AS AT 31 JULY 2013
AS AT 31 JULY 2014
AS AT 31 JULY 2013
Receivables
Equity accounted investees 57 63 – –
Receivables from other Group entities – – 10,400 8,937
Total receivables arising from financing arrangements 57 63 10,400 8,937
Payables
Equity accounted investees 1 1 – –
Payables to other Group entities – – 7,381 6,883
Total payables arising from financing arrangements 1 1 7,381 6,883
Interest income/(expense) from financing arrangements
GROUP $ MILLION PARENT $ MILLION
31 JULY 2014 31 JULY 2013 31 JULY 2014 31 JULY 2013
Interest incomeEquity accounted investees 1 2 – –
Other Group entities – – 284 262
Total interest income arising from financing arrangements 1 2 284 262
Interest expenseOther Group entities – – 4 4
Total interest expense arising from financing arrangements – – 4 4
Loans to related parties other than equity accounted investees are unsecured and repayable in cash on demand. Loans to equity accounted investees are unsecured and repayable over varying terms of between one month and 12 years.
Financial guarantees
The Group has provided financial guarantees for several equity accounted investees. The aggregate drawn down amount of equity accounted investees’ liabilities for which the Group is jointly and severally liable is $29 million (31 July 2013: $34 million). The Parent has provided financial guarantees for other Group entities. The amounts drawn down under those guaranteed facilities are $600 million (31 July 2013: $654 million).
Transactions with related entities
As part of the administration of Trading Among Farmers, Fonterra entered into an Authorised Fund Contract to provide administrative services in relation to the Fund and meet the operating expenses of the Fund. In addition, Fonterra has agreed to provide corporate facilities, support functions and other services at no cost to the Fund.

50 FONTERRA ANNUAL FINANCIAL RESULTS 2014
21 RELATED PARTY TRANSACTIONS CONTINUED
During the reported period the following expenses were incurred and paid by Fonterra with respect to the Fund:
– audit fees paid to PwC of $40,000 (31 July 2013: $40,000); and
– equity transaction costs of nil (31 July 2013: $18 million¹).
1 Included in total equity transactions costs relating to the initial issue of units was $0.4 million paid to PwC for other assurance and advisory services.
Equity instrument transactions with key management personnelCo-operative shares
GROUP $ MILLION PARENT $ MILLION
31 JULY 2014 31 JULY 2013 31 JULY 2014 31 JULY 2013
Co-operative shares issued/(surrendered)
Issued – 9 – 9
Surrendered – (35) – (35)
Net movement – (26) – (26)
Co-operative shares issued to Directors during the year were 440,900 (31 July 2013: 1,258,644) and Co-operative share surrenders were 472,767 (31 July 2013: 4,905,445). The value of shares is based on the closing value as at 31 July 2014 of $6.20 (31 July 2013: $7.28).
UnitsGROUP $ MILLION PARENT $ MILLION
31 JULY 2014 31 JULY 2013 31 JULY 2014 31 JULY 2013
Units
Purchased 3 – 3 –
Sold – – – –
At 31 July 2014 key management personnel held 548,098 (31 July 2013: 48,467) units in the Fonterra Shareholders’ Fund.
GROUP $ MILLION PARENT $ MILLION
31 JULY 2014 31 JULY 2013 31 JULY 2014 31 JULY 2013
Dividends paid to key management personnel 4 3 4 3
Equity instrument transactions with related entities
On launch of the Fonterra Shareholders’ Fund on 30 November 2012, Fonterra issued 89,808,526 shares to the Custodian, to hold on trust for the Fund.
Under the terms of the May 2013 Supply Offer (refer to Note 7), Fonterra acquired 60 million units in the Fonterra Shareholders’ Fund at a cost of $475 million. These units were immediately redeemed, resulting in the transfer of 60 million Co-operative shares to Fonterra by the Custodian. Fonterra subsequently cancelled these shares.
Commitments
In addition to the transactions disclosed above, the Group has prospective commitments with related parties including contracts with equity accounted investees for the supply of dairy products, energy and the provision of various management services.
NOTES TO THE FINANCIAL STATEMENTS CONTINUEDFOR THE YEAR ENDED 31 JULY 2014

FONTERRA ANNUAL FINANCIAL RESULTS 2014 51
22 GROUP ENTITIES
Fonterra consolidates the Fund and the Custodian. The trustees of the Fonterra Farmer Custodian Trust own the legal title to all of the shares of the Custodian. The Fund is a unit trust with an independent trustee. In concluding that the Group controls the Fund and the Custodian, the Directors took into consideration that they form an integral part of the structure and operation of Trading Among Farmers.
All other subsidiaries and equity accounted investees are involved in the marketing, distribution, processing, technology or financing of dairy products. All Group entities have a balance date of 31 July unless otherwise indicated. Subsidiaries and equity accounted investees with different balance dates from that of the Group are due to legislative requirements in the country the entities are domiciled. Equity accounted investees may also have a different balance date due to alignment with their other investor’s balance date or to align with the milk season. The New Zealand Companies Office has given exemptions for a number of Fonterra’s subsidiaries to maintain balance dates different to that of the Group.
The Group holds investments in certain countries that have some limited restrictions on the repatriation of funds back to the Parent. This does not result in any significant restriction on the flow of funds for the Group.
The significant subsidiaries and equity accounted investees of the Group are listed below:
OWNERSHIP INTERESTS (%)
OVERSEAS SUBSIDIARIES COUNTRY OF INCORPORATION1AS AT
31 JULY 2014AS AT
31 JULY 2013
Fonterra Australia Pty Limited Australia 100 100Fonterra Brands (Australia) Pty Limited Australia 100 100New Zealand Milk (Australasia) Pty Limited Australia 100 100Fonterra (Brasil) Limitada2 Brazil 100 100Soprole S.A.2 Chile 99.9 99.9Fonterra Commercial Trading (Shanghai) Company Limited2 China 100 100Tangshan Fonterra Dairy Farm Limited2 China 85 85Fonterra (Yutian) Dairy Farm Co. Limited2 China 100 100PT Fonterra Brands Indonesia Indonesia 100 100Fonterra Brands (Japan) Limited Japan 100 100Fonterra Brands (Malaysia) Sdn Bhd Malaysia 100 100Fonterra (Ing.) Limited Mauritius 51 51Fonterra (Mexico) S.A. de C.V.2 Mexico 100 100Fonterra (Europe) Coöperatie U.A. Netherlands 100 100Fonterra Europe Manufacturing B.V. Netherlands 100 100Fonterra Brands Phils. Inc. Philippines 100 100Saudi New Zealand Milk Products Company Limited3 Saudi Arabia 100 100Fonterra Brands (Singapore) Pte Limited Singapore 100 100Fonterra Brands (New Young) Pte Limited Singapore 51 51Fonterra (SEA) Pte Limited Singapore 100 100Fonterra Brands Lanka (Private) Limited Sri Lanka 100 100Fonterra Brands (Thailand) Limited Thailand 100 100Fonterra (USA) Inc USA 100 100Fonterra Venezuela S.A. Venezuela 100 100Fonterra Brands (Viet Nam) Company Limited4 Vietnam 100 100
1 This is also the principal place of business.
2 Balance date 31 December.
3 Balance date 31 May.
4 Balance date 30 June.
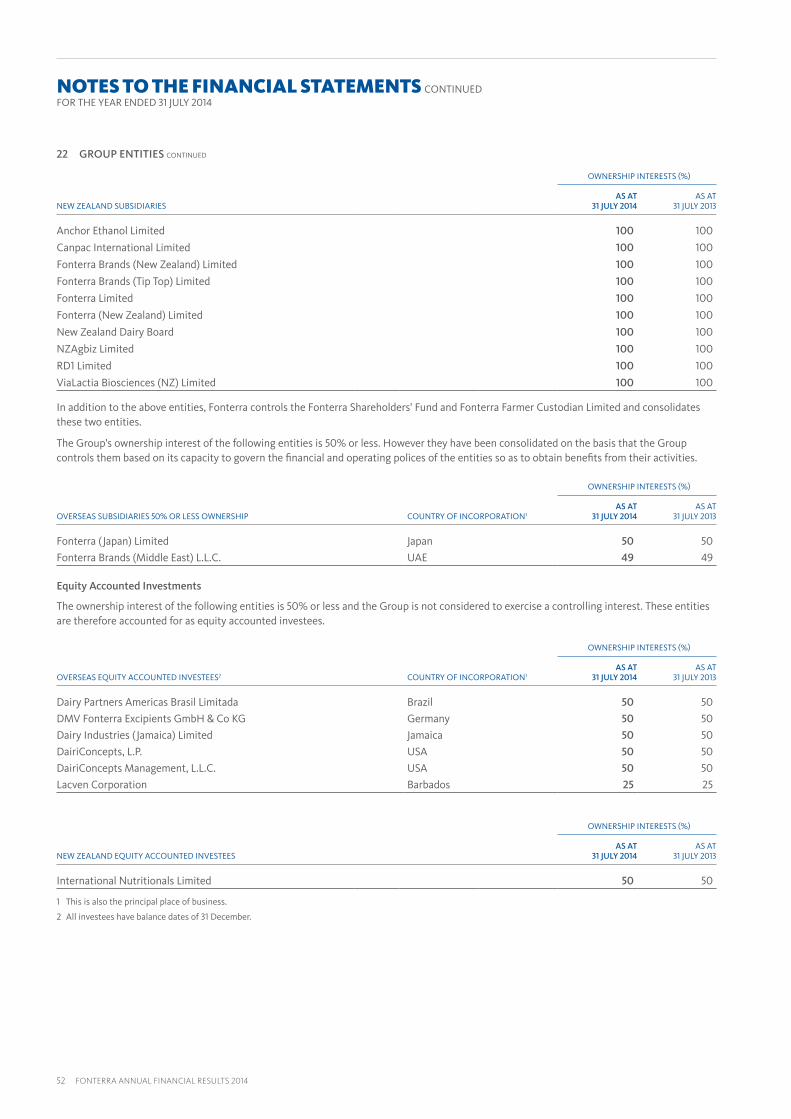
52 FONTERRA ANNUAL FINANCIAL RESULTS 2014
22 GROUP ENTITIES CONTINUED
OWNERSHIP INTERESTS (%)
NEW ZEALAND SUBSIDIARIESAS AT
31 JULY 2014AS AT
31 JULY 2013
Anchor Ethanol Limited 100 100
Canpac International Limited 100 100
Fonterra Brands (New Zealand) Limited 100 100
Fonterra Brands (Tip Top) Limited 100 100
Fonterra Limited 100 100
Fonterra (New Zealand) Limited 100 100
New Zealand Dairy Board 100 100
NZAgbiz Limited 100 100
RD1 Limited 100 100
ViaLactia Biosciences (NZ) Limited 100 100
In addition to the above entities, Fonterra controls the Fonterra Shareholders’ Fund and Fonterra Farmer Custodian Limited and consolidates these two entities.
The Group’s ownership interest of the following entities is 50% or less. However they have been consolidated on the basis that the Group controls them based on its capacity to govern the financial and operating polices of the entities so as to obtain benefits from their activities.
OWNERSHIP INTERESTS (%)
OVERSEAS SUBSIDIARIES 50% OR LESS OWNERSHIP COUNTRY OF INCORPORATION1AS AT
31 JULY 2014AS AT
31 JULY 2013
Fonterra (Japan) Limited Japan 50 50
Fonterra Brands (Middle East) L.L.C. UAE 49 49
Equity Accounted Investments
The ownership interest of the following entities is 50% or less and the Group is not considered to exercise a controlling interest. These entities are therefore accounted for as equity accounted investees.
OWNERSHIP INTERESTS (%)
OVERSEAS EQUITY ACCOUNTED INVESTEES2 COUNTRY OF INCORPORATION1AS AT
31 JULY 2014AS AT
31 JULY 2013
Dairy Partners Americas Brasil Limitada Brazil 50 50
DMV Fonterra Excipients GmbH & Co KG Germany 50 50
Dairy Industries (Jamaica) Limited Jamaica 50 50
DairiConcepts, L.P. USA 50 50
DairiConcepts Management, L.L.C. USA 50 50
Lacven Corporation Barbados 25 25
OWNERSHIP INTERESTS (%)
NEW ZEALAND EQUITY ACCOUNTED INVESTEESAS AT
31 JULY 2014AS AT
31 JULY 2013
International Nutritionals Limited 50 50
1 This is also the principal place of business.
2 All investees have balance dates of 31 December.
NOTES TO THE FINANCIAL STATEMENTS CONTINUEDFOR THE YEAR ENDED 31 JULY 2014

FONTERRA ANNUAL FINANCIAL RESULTS 2014 53
23 SUBSEQUENT EVENTS
On 23 September 2014, the Board declared a final dividend of 5.0 cents per share, to be paid on 20 October 2014 to all Co-operative shares on issue at 9 October 2014.
On 27 May 2014 the Group entered into agreements to realign Latam segment’s Dairy Partners Americas (DPA) joint venture arrangements.
In late 2014, the Group’s equity accounted investments in Ecuador (Ecuajugos S.A.) and DPA’s milk powder manufacturing business (DPA Manufacturing Holdings Limited) will be sold to Nestlé.
On 1 August 2014, the Group purchased additional voting equity interests in DPA Brazil (Dairy Partners Americas Brasil Limitada – from 50% to 51%, with Nestlé holding the balance) and DPA Venezuela (Lacven Corporation – from 25% to 60%, with the local partner holding the balance). These equity accounted investments became consolidated subsidiaries from that date.
The accounting for these business combinations has not yet been finalised, and therefore detailed disclosures for these business combinations is not presented in these financial statements.
There were no other material events subsequent to 31 July 2014 that would impact these financial statements.
24 EARNINGS PER SHARE
Earnings per share is calculated as net profit attributable to equity holders of the Company, divided by the weighted average number of Co-operative shares on issue during the year.
GROUP
31 JULY 2014 31 JULY 2013
Basic and diluted earnings per share attributable to equity holders of the Company ($) 0.10 0.44
Earnings attributable to equity holders of the Company ($ million) 157 718
Weighted average number of shares (thousands of shares) 1,597,834 1,615,311
On 27 February 2013, Fonterra announced a non-cash Bonus issue of one share for every 40 shares held. The Bonus issue increased the number of shares on issue by 40 million. The record date for the Bonus issue was 12 April 2013 and the issue date was 24 April 2013. The weighted average number of shares for the year ended 31 July 2013 was adjusted to reflect the Bonus issue as if it were effective from 1 August 2012.

54 FONTERRA ANNUAL FINANCIAL RESULTS 2014
REPORT ON THE FINANCIAL STATEMENTS
We have audited the financial statements of Fonterra Co-operative Group Limited (“the Company”) on pages 2 to 53, which comprise the statement of financial position as at 31 July 2014, the income statement, statement of comprehensive income, statement of changes in equity and cash flow statement for the year then ended, and the notes to the financial statements that include a summary of significant accounting policies and other explanatory information for both the Company and the Group. The Group comprises the Company and the entities it controlled at 31 July 2014 or from time to time during the financial year.
Directors’ Responsibility for the Financial Statements
The Directors are responsible for the preparation of these financial statements in accordance with generally accepted accounting practice in New Zealand and that give a true and fair view of the matters to which they relate and for such internal controls as the Directors determine are necessary to enable the preparation of financial statements that are free from material misstatement, whether due to fraud or error.
Auditors’ Responsibility
Our responsibility is to express an opinion on these financial statements based on our audit. We conducted our audit in accordance with International Standards on Auditing (New Zealand) and International Standards on Auditing. These standards require that we comply with relevant ethical requirements and plan and perform the audit to obtain reasonable assurance about whether the financial statements are free from material misstatement.
An audit involves performing procedures to obtain audit evidence about the amounts and disclosures in the financial statements. The procedures selected depend on the auditors’ judgement, including the assessment of the risks of material misstatement of the financial statements, whether due to fraud or error. In making those risk assessments, the auditors consider the internal controls relevant to the Company and the Group’s preparation of financial statements that give a true and fair view of the matters to which they relate, in order to design audit procedures that are appropriate in the circumstances, but not for the purpose of expressing an opinion on the effectiveness of the Company and the Group’s internal control. An audit also includes evaluating the appropriateness of accounting policies used and the reasonableness of accounting estimates, as well as evaluating the overall presentation of the financial statements.
We believe that the audit evidence we have obtained is sufficient and appropriate to provide a basis for our audit opinion.
We carry out other assignments on behalf of the Company and the Group in the areas of other audit related services, transaction and other advisory services. Partners and employees of our firm may deal with the Company and the Group on normal terms within the ordinary course of trading activities of the Company and the Group. These matters have not impaired our independence as auditors of the Company and the Group.
OpinionIn our opinion, the financial statements on pages 2 to 53:
(i) comply with generally accepted accounting practice in New Zealand; and
(ii) comply with International Financial Reporting Standards; and
(iii) give a true and fair view of the financial position of the Company and the Group as at 31 July 2014, and their financial performance and cash flows for the year then ended.
REPORT ON OTHER LEGAL AND REGULATORY REQUIREMENTS
We also report in accordance with Sections 16(1)(d) and 16(1)(e) of the Financial Reporting Act 1993. In relation to our audit of the financial statements for the year ended 31 July 2014:
(i) we have obtained all the information and explanations that we have required; and
(ii) in our opinion, proper accounting records have been kept by the Company as far as appears from an examination of those records.
RESTRICTION ON DISTRIBUTION OR USE
This report is made solely to the Company’s shareholders, as a body, in accordance with Section 205(1) of the Companies Act 1993. Our audit work has been undertaken so that we might state to the Company’s shareholders those matters which we are required to state to them in an auditors’ report and for no other purpose. To the fullest extent permitted by law, we do not accept or assume responsibility to anyone other than the Company and the Company’s shareholders, as a body, for our audit work, for this report or for the opinions we have formed.
Chartered Accountants, Auckland 23 September 2014
INDEPENDENT AUDITORS’ REPORTTO THE SHAREHOLDERS OF FONTERRA CO-OPERATIVE GROUP LIMITED

FONTERRA ANNUAL FINANCIAL RESULTS 2014 55
EQUITY SECURITIES HELD AT BALANCE DATE
In accordance with Rules of the Fonterra Shareholders Market (FSM) Rule 9.4.4(c), the following table identifies the Equity Securities in which each Director has a Relevant Interest as at 31 July 2014.
UNITS ISSUED BY THE FONTERRA SHAREHOLDERS’ FUND¹ CO-OPERATIVE SHARES
Ian Farrelly 1,432,017
John Monaghan 844,741
Ian (Blue) Read 62,843
Nicola Shadbolt 4,443 349,131
Reindert (Michael) Spaans 195,812
Jim van der Poel 525,000 2,309,863
John Wilson 4,555,175
1 Units issued by the Fonterra Shareholders’ Fund may be converted to Co-operative shares.
A “Relevant Interest” in Fonterra securities which is required to be disclosed is explicitly defined in the Securities Markets Act.
To qualify as a Farmer Elected Director under the Fonterra Constitution a person must be a shareholder, a shareholder of a company that is a shareholder, a member of a partnership that is a shareholder, or have a legal or beneficial interest, or other right or entitlement, to participate in a body corporate that is a shareholder of Fonterra.
Given the variety of ways that farmer shareholders can organise their interests, it is possible for Fonterra Elected Directors to have an interest in Fonterra shares without this being a “Relevant Interest” as defined in the Securities Markets Act.
The interests of Mr Malcolm Bailey and Mr David MacLeod in Fonterra shares at balance date did not meet the “Relevant Interest” definition applicable to the disclosure above. However, their respective interests in Fonterra shares qualify them as Elected Directors under the Fonterra Constitution. Other Fonterra Elected Directors also have interests in Fonterra shares which are not within the definition of “Relevant Interest” in the Securities Markets Act and those interests are not disclosed above.
CO-OPERATIVE STATUS
In accordance with Section 10 of the Co-operative Companies Act 1996, the Directors of Fonterra unanimously resolved on 27 August 2014 that the Company was, for the year ended 31 July 2014, a co-operative company. The opinion was based upon the fact that:
• Throughout that period the principal activities of the Company have been the activities stated in clause 1.3 of the Company’s constitution:
– the manufacture and sale of butter, cheese, dried milk, casein, or any other product derived from milk or milksolids supplied to the Company by its shareholders;
– the sale to any person of milk or milksolids supplied to the Company by its shareholders;
– the collection, treatment, and distribution for human consumption of milk or cream supplied to the Company by its shareholders.
• Each of the Company’s principal activities are co-operative activities (as defined in Section 3 of the Co-operative Companies Act 1996).
• Throughout that period not less than 60% of the voting rights attaching to shares in the Company have been held by transacting shareholders (as defined in Section 4 of the Co-operative Companies Act 1996).
REMUNERATION OF DIRECTORS
The remuneration and value of other benefits received by each Director in the 12 month period from 1 August 2013 to 31 July 2014 are scheduled below:
BOARD FEES
COMMITTEE CHAIR FEES
TRAVEL ALLOWANCE
TOTAL REMUNERATION ($)
Malcolm Bailey (Chairman of the Risk Committee) 163,906 30,775 – 194,681
Ian Farrelly 163,906 – – 163,906
Simon Israel 163,906 – 80,000¹ 243,906
David Jackson (Chairman of the Audit and Finance Committee) 163,906 30,775 – 194,681
David MacLeod 163,906 – – 163,906
John Monaghan (Chairman of the Co-operative Relations Committee) 163,906 30,775 – 194,681
Sir Ralph Norris 163,906 – – 163,906
Blue Read 163,906 – – 163,906
Nicola Shadbolt 163,906 – – 163,906
Michael Spaans 128,689 – – 128,689
Jim van der Poel 163,906 – – 163,906
John Waller (Chairman of the Milk Price Panel) 163,906 30,775 – 194,681
John Wilson (Chairman of the Board of Directors) 404,678 – – 404,678
1 The Board has approved the payment to Mr Israel of a travel allowance of $10,000 per meeting to travel to and from New Zealand to attend Board meetings.
STATUTORY INFORMATIONFOR THE YEAR ENDED 31 JULY 2014

56 FONTERRA ANNUAL FINANCIAL RESULTS 2014
SUBSIDIARY COMPANY DIRECTORS
The following companies were subsidiaries of Fonterra as at 31 July 2014. Directors as at that date are listed; those who resigned during the year are denoted with an R. Alternate Directors are denoted with an A.
616059 Limited: G A Duncan, S D T Till
Anchor Ethanol Limited: G A Duncan, P D Washer
Canpac International Limited: G A Duncan, M R Spiers
Civil Whey Distributors Limited: G A Duncan, M R Spiers
Dairy Industry Superannuation Scheme Trustee Limited: M A Apiata-Wade, B J Kerr, D M Marshall, T P McGuinness, D W C Scott, A K Williams, P D Wynen
Dairy Transport Logistics Limited: J P Coote (R), G A Hoddinott, M E Leslie
Fantastic Food Limited: J A Luskie (R), P J W McClure
Fonterra (Asia) Limited: G A Duncan, M W Smith
Fonterra (Delegated Compliance Trading Services) Limited: G A Duncan, S D T Till
Fonterra (International) Limited: G A Duncan, C E Rowe
Fonterra (Kotahi) Limited: J P Coote (R), M E Leslie
Fonterra (Middle East) Limited: G A Duncan, P D Washer
Fonterra (New Zealand) Limited: G A Duncan, C E Rowe
Fonterra (Number One) Limited: G A Duncan, S D T Till
Fonterra Brands (China Holdings) Limited: G A Duncan, K A Wickham
Fonterra Brands (New Zealand) Limited: G A Duncan, P J W McClure
Fonterra Brands (Tip Top Investments) Limited: S C Brooks, G A Duncan
Fonterra Brands (Tip Top) Limited: G A Duncan, P J W McClure
Fonterra Brands Limited: G A Duncan, J P Mason (R), L J Paravicini
Fonterra Commodities Limited: J H Allan (R), G A Duncan, I Palliser (R)
Fonterra Dairy Solutions Limited: G A Duncan, R McNickle
Fonterra Enterprises Limited: G A Duncan, J P Minkhorst
Fonterra Equities Limited: G A Duncan, S D T Till
Fonterra Farming Ventures Limited: G A Duncan, J P Minkhorst
Fonterra Finance Corporation Limited: G A Duncan, S D T Till
Fonterra Holdings (Americas) Limited: G A Duncan, K J Murray
Fonterra Holdings (Argentina) Limited: G A Duncan, K J Murray
Fonterra Holdings (Brazil) Limited: G A Duncan, K J Murray
Fonterra Holdings (Ecuador) Limited: G A Duncan, K J Murray
Fonterra Holdings (Venezuela) Limited: G A Duncan, K J Murray
Fonterra Investments (China) Limited: G A Duncan, K A Wickham
Fonterra IP Limited: G A Duncan, S D T Till
Fonterra Limited: B Connolly, G A Duncan
Fonterra Manufacturing (Americas) Limited: G A Duncan, K J Murray
Fonterra PGGRC Limited: G A Duncan, J P Minkhorst
Fonterra Research Centre Limited: G A Duncan, M W Smith
Fonterra TM Limited: G A Duncan, S D T Till
Food Solutions Group 2000 Limited: G A Duncan, S D T Till
Glencoal Energy Limited: G A Duncan, M R Spiers
GlobalDairyTrade Holdings Limited: G A Duncan, J P Mason (R), L J Paravicini
Kapiti Fine Foods Limited: S C Brooks, G A Duncan
Kotahi GP Limited: J P Coote, H M J Kean, M E Leslie, K G Winders
MIH Limited: G A Duncan, J P Minkhorst
Milktest GP Limited: P G Brown, B Greaney, C J Mortland, P J Spooner, R G Townshend, T A Winter
New Zealand Dairy Board: G A Duncan, C E Rowe
New Zealand Milk (Australasian Holdings) Limited: G A Duncan, J P Mason (R), L J Paravicini
STATUTORY INFORMATION CONTINUEDFOR THE YEAR ENDED 31 JULY 2014
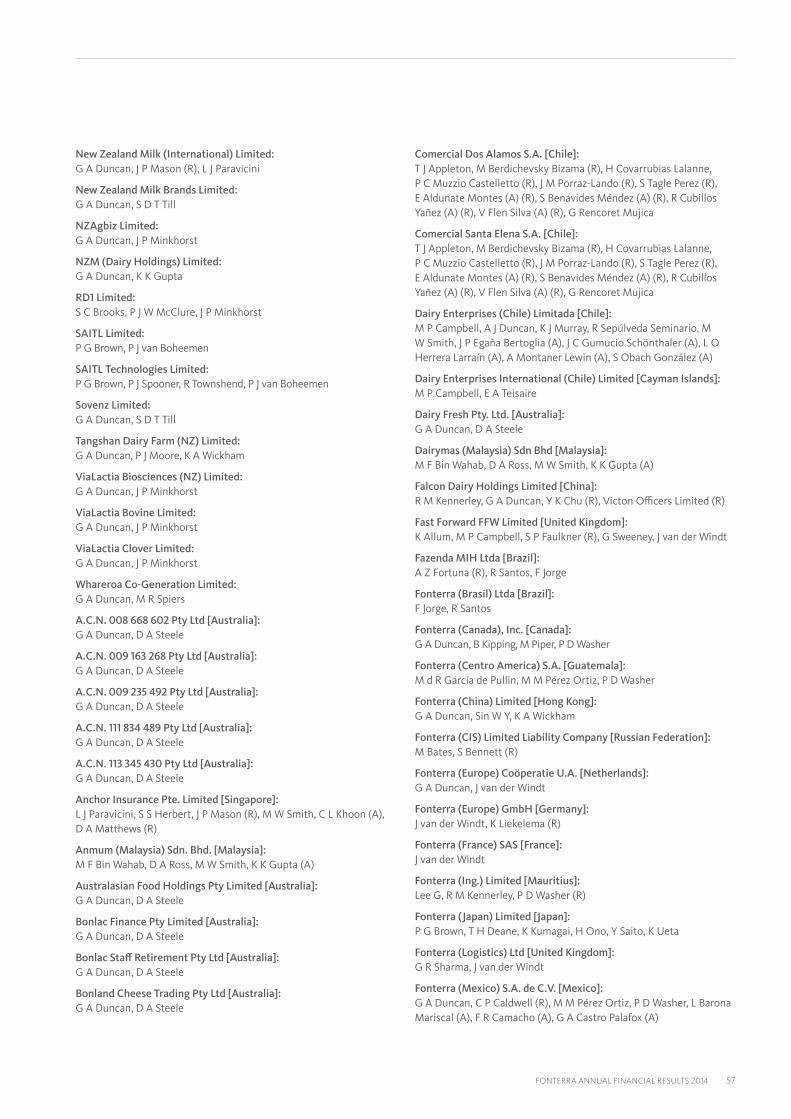
FONTERRA ANNUAL FINANCIAL RESULTS 2014 57
New Zealand Milk (International) Limited: G A Duncan, J P Mason (R), L J Paravicini
New Zealand Milk Brands Limited: G A Duncan, S D T Till
NZAgbiz Limited: G A Duncan, J P Minkhorst
NZM (Dairy Holdings) Limited: G A Duncan, K K Gupta
RD1 Limited: S C Brooks, P J W McClure, J P Minkhorst
SAITL Limited: P G Brown, P J van Boheemen
SAITL Technologies Limited: P G Brown, P J Spooner, R Townshend, P J van Boheemen
Sovenz Limited: G A Duncan, S D T Till
Tangshan Dairy Farm (NZ) Limited: G A Duncan, P J Moore, K A Wickham
ViaLactia Biosciences (NZ) Limited: G A Duncan, J P Minkhorst
ViaLactia Bovine Limited: G A Duncan, J P Minkhorst
ViaLactia Clover Limited: G A Duncan, J P Minkhorst
Whareroa Co-Generation Limited: G A Duncan, M R Spiers
A.C.N. 008 668 602 Pty Ltd [Australia]: G A Duncan, D A Steele
A.C.N. 009 163 268 Pty Ltd [Australia]: G A Duncan, D A Steele
A.C.N. 009 235 492 Pty Ltd [Australia]: G A Duncan, D A Steele
A.C.N. 111 834 489 Pty Ltd [Australia]: G A Duncan, D A Steele
A.C.N. 113 345 430 Pty Ltd [Australia]: G A Duncan, D A Steele
Anchor Insurance Pte. Limited [Singapore]: L J Paravicini, S S Herbert, J P Mason (R), M W Smith, C L Khoon (A), D A Matthews (R)
Anmum (Malaysia) Sdn. Bhd. [Malaysia]: M F Bin Wahab, D A Ross, M W Smith, K K Gupta (A)
Australasian Food Holdings Pty Limited [Australia]: G A Duncan, D A Steele
Bonlac Finance Pty Limited [Australia]: G A Duncan, D A Steele
Bonlac Staff Retirement Pty Ltd [Australia]: G A Duncan, D A Steele
Bonland Cheese Trading Pty Ltd [Australia]: G A Duncan, D A Steele
Comercial Dos Alamos S.A. [Chile]: T J Appleton, M Berdichevsky Bizama (R), H Covarrubias Lalanne, P C Muzzio Castelletto (R), J M Porraz-Lando (R), S Tagle Perez (R), E Aldunate Montes (A) (R), S Benavides Méndez (A) (R), R Cubillos Yañez (A) (R), V Flen Silva (A) (R), G Rencoret Mujica
Comercial Santa Elena S.A. [Chile]: T J Appleton, M Berdichevsky Bizama (R), H Covarrubias Lalanne, P C Muzzio Castelletto (R), J M Porraz-Lando (R), S Tagle Perez (R), E Aldunate Montes (A) (R), S Benavides Méndez (A) (R), R Cubillos Yañez (A) (R), V Flen Silva (A) (R), G Rencoret Mujica
Dairy Enterprises (Chile) Limitada [Chile]: M P Campbell, A J Duncan, K J Murray, R Sepúlveda Seminario, M W Smith, J P Egaña Bertoglia (A), J C Gumucio Schönthaler (A), L O Herrera Larraín (A), A Montaner Lewin (A), S Obach González (A)
Dairy Enterprises International (Chile) Limited [Cayman Islands]: M P Campbell, E A Teisaire
Dairy Fresh Pty. Ltd. [Australia]: G A Duncan, D A Steele
Dairymas (Malaysia) Sdn Bhd [Malaysia]: M F Bin Wahab, D A Ross, M W Smith, K K Gupta (A)
Falcon Dairy Holdings Limited [China]: R M Kennerley, G A Duncan, Y K Chu (R), Victon Officers Limited (R)
Fast Forward FFW Limited [United Kingdom]: K Allum, M P Campbell, S P Faulkner (R), G Sweeney, J van der Windt
Fazenda MIH Ltda [Brazil]: A Z Fortuna (R), R Santos, F Jorge
Fonterra (Brasil) Ltda [Brazil]: F Jorge, R Santos
Fonterra (Canada), Inc. [Canada]: G A Duncan, B Kipping, M Piper, P D Washer
Fonterra (Centro America) S.A. [Guatemala]: M d R García de Pullin, M M Pérez Ortiz, P D Washer
Fonterra (China) Limited [Hong Kong]: G A Duncan, Sin W Y, K A Wickham
Fonterra (CIS) Limited Liability Company [Russian Federation]: M Bates, S Bennett (R)
Fonterra (Europe) Coöperatie U.A. [Netherlands]: G A Duncan, J van der Windt
Fonterra (Europe) GmbH [Germany]: J van der Windt, K Liekelema (R)
Fonterra (France) SAS [France]: J van der Windt
Fonterra (Ing.) Limited [Mauritius]: Lee G, R M Kennerley, P D Washer (R)
Fonterra (Japan) Limited [Japan]: P G Brown, T H Deane, K Kumagai, H Ono, Y Saito, K Ueta
Fonterra (Logistics) Ltd [United Kingdom]: G R Sharma, J van der Windt
Fonterra (Mexico) S.A. de C.V. [Mexico]: G A Duncan, C P Caldwell (R), M M Pérez Ortiz, P D Washer, L Barona Mariscal (A), F R Camacho (A), G A Castro Palafox (A)
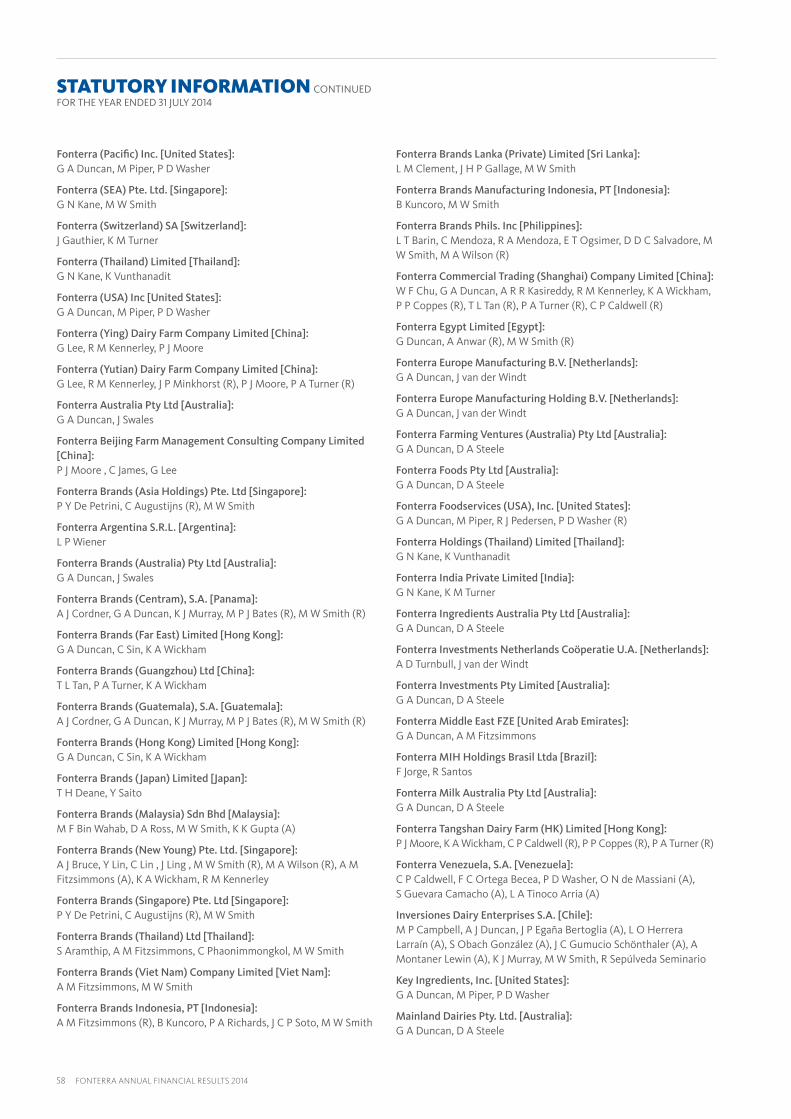
58 FONTERRA ANNUAL FINANCIAL RESULTS 2014
Fonterra (Pacific) Inc. [United States]: G A Duncan, M Piper, P D Washer
Fonterra (SEA) Pte. Ltd. [Singapore]: G N Kane, M W Smith
Fonterra (Switzerland) SA [Switzerland]: J Gauthier, K M Turner
Fonterra (Thailand) Limited [Thailand]: G N Kane, K Vunthanadit
Fonterra (USA) Inc [United States]: G A Duncan, M Piper, P D Washer
Fonterra (Ying) Dairy Farm Company Limited [China]: G Lee, R M Kennerley, P J Moore
Fonterra (Yutian) Dairy Farm Company Limited [China]: G Lee, R M Kennerley, J P Minkhorst (R), P J Moore, P A Turner (R)
Fonterra Australia Pty Ltd [Australia]: G A Duncan, J Swales
Fonterra Beijing Farm Management Consulting Company Limited [China]: P J Moore , C James, G Lee
Fonterra Brands (Asia Holdings) Pte. Ltd [Singapore]: P Y De Petrini, C Augustijns (R), M W Smith
Fonterra Argentina S.R.L. [Argentina]: L P Wiener
Fonterra Brands (Australia) Pty Ltd [Australia]: G A Duncan, J Swales
Fonterra Brands (Centram), S.A. [Panama]: A J Cordner, G A Duncan, K J Murray, M P J Bates (R), M W Smith (R)
Fonterra Brands (Far East) Limited [Hong Kong]: G A Duncan, C Sin, K A Wickham
Fonterra Brands (Guangzhou) Ltd [China]: T L Tan, P A Turner, K A Wickham
Fonterra Brands (Guatemala), S.A. [Guatemala]: A J Cordner, G A Duncan, K J Murray, M P J Bates (R), M W Smith (R)
Fonterra Brands (Hong Kong) Limited [Hong Kong]: G A Duncan, C Sin, K A Wickham
Fonterra Brands (Japan) Limited [Japan]: T H Deane, Y Saito
Fonterra Brands (Malaysia) Sdn Bhd [Malaysia]: M F Bin Wahab, D A Ross, M W Smith, K K Gupta (A)
Fonterra Brands (New Young) Pte. Ltd. [Singapore]: A J Bruce, Y Lin, C Lin , J Ling , M W Smith (R), M A Wilson (R), A M Fitzsimmons (A), K A Wickham, R M Kennerley
Fonterra Brands (Singapore) Pte. Ltd [Singapore]: P Y De Petrini, C Augustijns (R), M W Smith
Fonterra Brands (Thailand) Ltd [Thailand]: S Aramthip, A M Fitzsimmons, C Phaonimmongkol, M W Smith
Fonterra Brands (Viet Nam) Company Limited [Viet Nam]: A M Fitzsimmons, M W Smith
Fonterra Brands Indonesia, PT [Indonesia]: A M Fitzsimmons (R), B Kuncoro, P A Richards, J C P Soto, M W Smith
Fonterra Brands Lanka (Private) Limited [Sri Lanka]: L M Clement, J H P Gallage, M W Smith
Fonterra Brands Manufacturing Indonesia, PT [Indonesia]: B Kuncoro, M W Smith
Fonterra Brands Phils. Inc [Philippines]: L T Barin, C Mendoza, R A Mendoza, E T Ogsimer, D D C Salvadore, M W Smith, M A Wilson (R)
Fonterra Commercial Trading (Shanghai) Company Limited [China]: W F Chu, G A Duncan, A R R Kasireddy, R M Kennerley, K A Wickham, P P Coppes (R), T L Tan (R), P A Turner (R), C P Caldwell (R)
Fonterra Egypt Limited [Egypt]: G Duncan, A Anwar (R), M W Smith (R)
Fonterra Europe Manufacturing B.V. [Netherlands]: G A Duncan, J van der Windt
Fonterra Europe Manufacturing Holding B.V. [Netherlands]: G A Duncan, J van der Windt
Fonterra Farming Ventures (Australia) Pty Ltd [Australia]: G A Duncan, D A Steele
Fonterra Foods Pty Ltd [Australia]: G A Duncan, D A Steele
Fonterra Foodservices (USA), Inc. [United States]: G A Duncan, M Piper, R J Pedersen, P D Washer (R)
Fonterra Holdings (Thailand) Limited [Thailand]: G N Kane, K Vunthanadit
Fonterra India Private Limited [India]: G N Kane, K M Turner
Fonterra Ingredients Australia Pty Ltd [Australia]: G A Duncan, D A Steele
Fonterra Investments Netherlands Coöperatie U.A. [Netherlands]: A D Turnbull, J van der Windt
Fonterra Investments Pty Limited [Australia]: G A Duncan, D A Steele
Fonterra Middle East FZE [United Arab Emirates]: G A Duncan, A M Fitzsimmons
Fonterra MIH Holdings Brasil Ltda [Brazil]: F Jorge, R Santos
Fonterra Milk Australia Pty Ltd [Australia]: G A Duncan, D A Steele
Fonterra Tangshan Dairy Farm (HK) Limited [Hong Kong]: P J Moore, K A Wickham, C P Caldwell (R), P P Coppes (R), P A Turner (R)
Fonterra Venezuela, S.A. [Venezuela]: C P Caldwell, F C Ortega Becea, P D Washer, O N de Massiani (A), S Guevara Camacho (A), L A Tinoco Arria (A)
Inversiones Dairy Enterprises S.A. [Chile]: M P Campbell, A J Duncan, J P Egaña Bertoglia (A), L O Herrera Larraín (A), S Obach González (A), J C Gumucio Schönthaler (A), A Montaner Lewin (A), K J Murray, M W Smith, R Sepúlveda Seminario
Key Ingredients, Inc. [United States]: G A Duncan, M Piper, P D Washer
Mainland Dairies Pty. Ltd. [Australia]: G A Duncan, D A Steele
STATUTORY INFORMATION CONTINUEDFOR THE YEAR ENDED 31 JULY 2014
FONTERRA ANNUAL FINANCIAL RESULTS 2014 59
Mainland Foodservice Pty Limited [Australia]: G A Duncan, D A Steele
Milk Products Holdings (Middle East) EC [Bahrain]: M W Smith, M A Wilson (R)
Milk Products Holdings (North America) Inc. [United States]: G A Duncan, M Piper, S C Spiro (R), P D Washer
Murrumbidgee Dairy Products Pty Ltd [Australia]: G A Duncan, D A Steele
New Tai Milk Products Co Ltd [Taiwan]: K A Wickham, T H Deane (R), G N Kane, C Lee, J Lee, G Lee, M Lee, P D Washer, R M Kennerley
New Zealand Milk (Australasia) Pty Ltd [Australia]: G A Duncan, D A Steele
New Zealand Milk (Barbados) Ltd [Barbados]: G A Duncan, K J Murray, M P J Bates (R), M W Smith (R)
New Zealand Milk (LATAM) Ltd [Bermuda]: G A Duncan, K J Murray
Newdale Dairies (Private) Limited [Sri Lanka]: L M Clement, J H P Gallage, M W Smith
NZMP (AEM) Ltd [United Kingdom]: G R Sharma, W Zwaan, J van der Windt
Recombined Dairy Systems A/S [Denmark]: G R Sharma, J van der Windt, W Zwaan
Saudi New Zealand Milk Products Company Limited [Saudi Arabia]: W R Jackson
Sociedad Agrícola y Lechera Praderas Australes S.A. (“Pradesur”) [Chile]: T J Appleton, E Aldunate Montes (R), M Berdichevsky Bizama (R), H Covarrubias Lalanne, G Rencoret Mujica
Sociedad Procesadora de Leche Del Sur S.A. [Chile]: E Alcalde Undurraga, A Cussen Mackenna, J Milic Barros, K J Murray, S Obach González, J R Valente Vias, G Varela Alfonso, J M Alcalde Undurraga (A), E Huiddobro Grove (A), G Jiménez Barahona (A), J P Matus Pickering (A), A Montaner Lewin (A), S Oddo Gómez (A), J P Orellana Pavón (R), C Perez-Cotapos Subercaseaux (A)
Solid Fresh Food & Beverage (M) Sdn. Bhd. [Malaysia]: M F Bin Wahab, D A Ross, M W Smith, K K Gupta (A)
Soprole Inversiones SA [Chile]: G A Bitrán Dicowsky, M P Campbell, K J Murray, A D Turnbull, J R Valente Vias, G Varela Alfonso, A Walker Prieto, S Diez Arriagada (A), R Fernández Robinson (A) (R), C Herrera Barriga (A), E Huidobro Grove (A), R Sepúlveda Seminario (A), M Somarriva Labra (A), R Tisi Lanchares (A), M L Valdes Steeves (A)
Soprole S.A. [Chile]: G A Bitrán Dicowsky, M P Campbell, J R Valente Vias, G Varela Alfonso, A Walker Prieto, S Diez Arriagada (A) (R), R Fernández Robinson (A) (R), C Herrera Barriga (A) (R), R Sepúlveda Seminario (A) (R), R A Tisi Lanchares (A) (R)
Tangshan Fonterra Dairy Farm Ltd [China]: P J Moore, R M Kennerley, G Lee, P A Turner (R), J L Zhang
Unilac Australia Pty Ltd [Australia]: G A Duncan, D A Steele
United Milk Tasmania Pty Limited [Australia]: G A Duncan, D A Steele
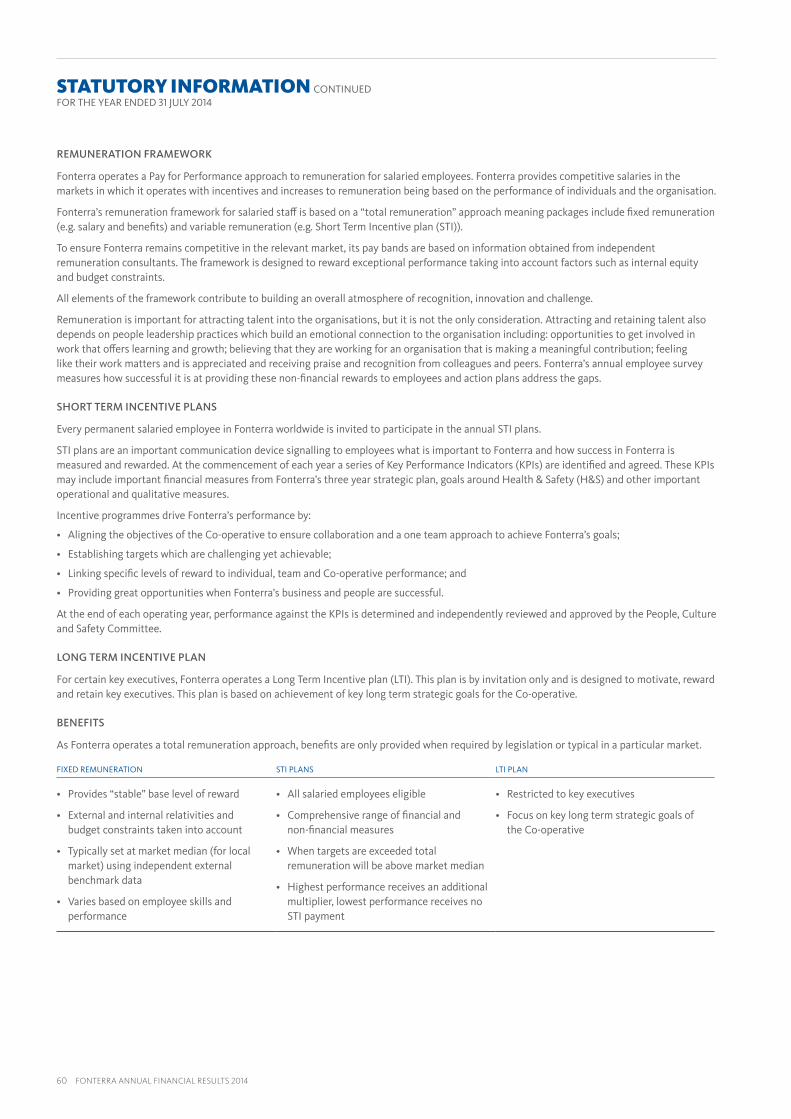
60 FONTERRA ANNUAL FINANCIAL RESULTS 2014
REMUNERATION FRAMEWORK
Fonterra operates a Pay for Performance approach to remuneration for salaried employees. Fonterra provides competitive salaries in the markets in which it operates with incentives and increases to remuneration being based on the performance of individuals and the organisation.
Fonterra’s remuneration framework for salaried staff is based on a “total remuneration” approach meaning packages include fixed remuneration (e.g. salary and benefits) and variable remuneration (e.g. Short Term Incentive plan (STI)).
To ensure Fonterra remains competitive in the relevant market, its pay bands are based on information obtained from independent remuneration consultants. The framework is designed to reward exceptional performance taking into account factors such as internal equity and budget constraints.
All elements of the framework contribute to building an overall atmosphere of recognition, innovation and challenge.
Remuneration is important for attracting talent into the organisations, but it is not the only consideration. Attracting and retaining talent also depends on people leadership practices which build an emotional connection to the organisation including: opportunities to get involved in work that offers learning and growth; believing that they are working for an organisation that is making a meaningful contribution; feeling like their work matters and is appreciated and receiving praise and recognition from colleagues and peers. Fonterra’s annual employee survey measures how successful it is at providing these non-financial rewards to employees and action plans address the gaps.
SHORT TERM INCENTIVE PLANS
Every permanent salaried employee in Fonterra worldwide is invited to participate in the annual STI plans.
STI plans are an important communication device signalling to employees what is important to Fonterra and how success in Fonterra is measured and rewarded. At the commencement of each year a series of Key Performance Indicators (KPIs) are identified and agreed. These KPIs may include important financial measures from Fonterra’s three year strategic plan, goals around Health & Safety (H&S) and other important operational and qualitative measures.
Incentive programmes drive Fonterra’s performance by:
• Aligning the objectives of the Co-operative to ensure collaboration and a one team approach to achieve Fonterra’s goals;
• Establishing targets which are challenging yet achievable;
• Linking specific levels of reward to individual, team and Co-operative performance; and
• Providing great opportunities when Fonterra’s business and people are successful.
At the end of each operating year, performance against the KPIs is determined and independently reviewed and approved by the People, Culture and Safety Committee.
LONG TERM INCENTIVE PLAN
For certain key executives, Fonterra operates a Long Term Incentive plan (LTI). This plan is by invitation only and is designed to motivate, reward and retain key executives. This plan is based on achievement of key long term strategic goals for the Co-operative.
BENEFITS
As Fonterra operates a total remuneration approach, benefits are only provided when required by legislation or typical in a particular market.
FIXED REMUNERATION STI PLANS LTI PLAN
• Provides “stable” base level of reward
• External and internal relativities and budget constraints taken into account
• Typically set at market median (for local market) using independent external benchmark data
• Varies based on employee skills and performance
• All salaried employees eligible
• Comprehensive range of financial and non-financial measures
• When targets are exceeded total remuneration will be above market median
• Highest performance receives an additional multiplier, lowest performance receives no STI payment
• Restricted to key executives
• Focus on key long term strategic goals of the Co-operative
STATUTORY INFORMATION CONTINUEDFOR THE YEAR ENDED 31 JULY 2014

FONTERRA ANNUAL FINANCIAL RESULTS 2014 61
EMPLOYEE REMUNERATION
The Group operates in a number of countries where remuneration market levels differ widely. During the year ended 31 July 2014, the number of employees, not being Directors of Fonterra, who received remuneration and the value of other benefits exceeding $100,000 was as follows:
REMUNERATION RANGE ($) NEW ZEALAND1 OFFSHORE2 CESSATIONS3 TOTAL
100,000 110,000 686 231 40 957
110,001 120,000 650 198 24 872
120,001 130,000 254 162 14 430
130,001 140,000 179 118 14 311
140,001 150,000 136 101 24 261
150,001 160,000 109 68 9 186
160,001 170,000 96 52 7 155
170,001 180,000 74 45 8 127
180,001 190,000 54 40 9 103
190,001 200,000 50 24 6 80
200,001 210,000 41 28 12 81
210,001 220,000 32 22 3 57
220,001 230,000 28 19 7 54
230,001 240,000 19 23 8 50
240,001 250,000 15 7 4 26
250,001 260,000 12 14 5 31
260,001 270,000 14 8 3 25
270,001 280,000 10 12 3 25
280,001 290,000 9 18 2 29
290,001 300,000 11 8 5 24
300,001 310,000 8 7 5 20
310,001 320,000 8 12 – 20
320,001 330,000 4 8 2 14
330,001 340,000 8 4 2 14
340,001 350,000 5 9 1 15
350,001 360,000 3 2 3 8
360,001 370,000 5 5 5 15
370,001 380,000 4 3 3 10
380,001 390,000 2 3 1 6
390,001 400,000 7 6 3 16
400,001 410,000 2 4 2 8
410,001 420,000 4 4 3 11
420,001 430,000 4 2 3 9
430,001 440,000 3 3 3 9
440,001 450,000 4 1 1 6
450,001 460,000 – 2 1 3
460,001 470,000 3 2 – 5
470,001 480,000 3 1 – 4
480,001 490,000 – 3 1 4
490,001 500,000 2 4 1 7
500,001 510,000 – 2 2 4
510,001 520,000 1 1 3 5
520,001 530,000 2 1 – 3
530,001 540,000 2 4 – 6
540,001 550,000 1 2 – 3
550,001 560,000 1 1 – 2
560,001 570,000 1 – 1 2
590,001 600,000 1 3 – 4
600,001 610,000 – 1 1 2
620,001 630,000 1 – – 1
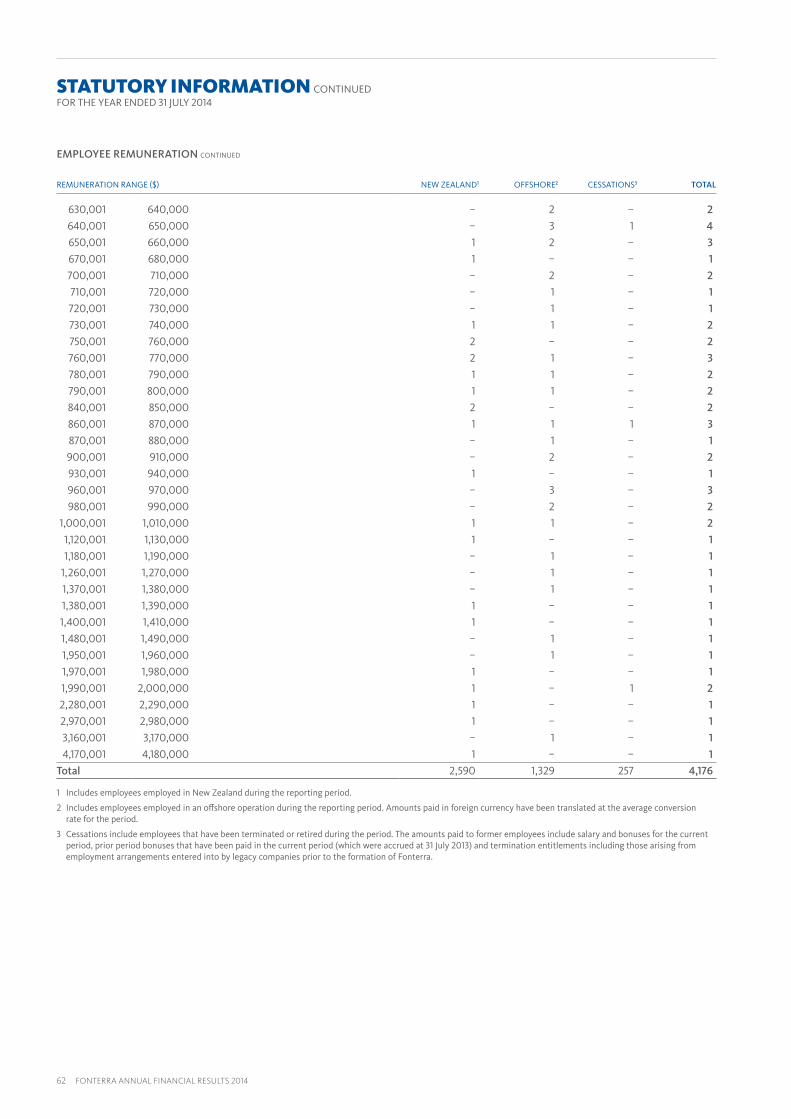
62 FONTERRA ANNUAL FINANCIAL RESULTS 2014
EMPLOYEE REMUNERATION CONTINUED
REMUNERATION RANGE ($) NEW ZEALAND1 OFFSHORE2 CESSATIONS3 TOTAL
630,001 640,000 – 2 – 2
640,001 650,000 – 3 1 4
650,001 660,000 1 2 – 3
670,001 680,000 1 – – 1
700,001 710,000 – 2 – 2
710,001 720,000 – 1 – 1
720,001 730,000 – 1 – 1
730,001 740,000 1 1 – 2
750,001 760,000 2 – – 2
760,001 770,000 2 1 – 3
780,001 790,000 1 1 – 2
790,001 800,000 1 1 – 2
840,001 850,000 2 – – 2
860,001 870,000 1 1 1 3
870,001 880,000 – 1 – 1
900,001 910,000 – 2 – 2
930,001 940,000 1 – – 1
960,001 970,000 – 3 – 3
980,001 990,000 – 2 – 2
1,000,001 1,010,000 1 1 – 2
1,120,001 1,130,000 1 – – 1
1,180,001 1,190,000 – 1 – 1
1,260,001 1,270,000 – 1 – 1
1,370,001 1,380,000 – 1 – 1
1,380,001 1,390,000 1 – – 1
1,400,001 1,410,000 1 – – 1
1,480,001 1,490,000 – 1 – 1
1,950,001 1,960,000 – 1 – 1
1,970,001 1,980,000 1 – – 1
1,990,001 2,000,000 1 – 1 2
2,280,001 2,290,000 1 – – 1
2,970,001 2,980,000 1 – – 1
3,160,001 3,170,000 – 1 – 1
4,170,001 4,180,000 1 – – 1
Total 2,590 1,329 257 4,176
1 Includes employees employed in New Zealand during the reporting period.
2 Includes employees employed in an offshore operation during the reporting period. Amounts paid in foreign currency have been translated at the average conversion rate for the period.
3 Cessations include employees that have been terminated or retired during the period. The amounts paid to former employees include salary and bonuses for the current period, prior period bonuses that have been paid in the current period (which were accrued at 31 July 2013) and termination entitlements including those arising from employment arrangements entered into by legacy companies prior to the formation of Fonterra.
STATUTORY INFORMATION CONTINUEDFOR THE YEAR ENDED 31 JULY 2014

FONTERRA ANNUAL FINANCIAL RESULTS 2014 63
CURRENT CREDIT RATING STATUS
Standard & Poor’s long term rating for Fonterra is A with a rating outlook of stable. Fitch’s long and short term default rating is AA- with a rating outlook of stable. Retail Bonds have been rated the same as the Company’s long term rating by both Standard & Poor’s and Fitch. Capital Notes which are subordinate to other Fonterra debt issued are rated A- by Standard & Poor’s and A+ by Fitch.
EXCHANGE RULINGS AND WAIVERS
NZX Limited (NZX) has ruled that Capital Notes do not constitute “equity securities” under its Listing Rules (Rules). This means that where Capital Notes are quoted on NZX’s debt market (NZDX), the Company is not required to comply with certain Rules which apply to an issuer of quoted equity securities.
NZX has granted waivers from NZDX Rule 11.1.1 to enable Fonterra to decline to accept or register transfers of Capital Notes or Retail Bonds (NZDX listed debt securities FCGHA, FCG010 and FCG020) if such transfer would result in the transferor holding or continuing to hold Capital Notes or Retail Bonds with a face value or principal amount of less than $5,000 or if such transfer is for an amount of less than $1,000 or multiple thereof. The effect of these waivers is that the minimum holding amount in respect of the Capital Notes and Retail Bonds will at all times be $5,000 in aggregate and that Retail Bonds can only be transferred in multiples of $1,000.
NZX has also granted a waiver from NZDX Rule 5.2.3 in respect of Retail Bond FCG020 to enable that Bond to be quoted on the NZDX market even though it did not meet the requirement that at least 500 members of the public held at least 25% of the Bonds being issued.
STOCK EXCHANGE LISTINGS
Fonterra’s co-operative shares are listed and quoted on the Fonterra Shareholders’ Market under the company code “FCG”. Fonterra has two issues of retail bonds listed and quoted on the NZX Debt Market (“NZDX”) under the company codes “FCG010” and “FCG020”. Fonterra also has an issue of capital notes listed and quoted on NZDX under the company code “FCGHA” and a Euro Medium Term Note Programme listed on the Luxembourg Stock Exchange.
As at 14 August 2014 there were 1,597,833,461 Fonterra Co-operative shares on issue.
ANALYSIS OF SHAREHOLDING
Analysis of Fonterra’s shareholding as at 14 August 2014:
FCG Largest Recorded Share Holdings1
NAME NUMBER OF SHARES % OF SHARES
Fonterra Farmer Custodian Limited 115,530,689 7.23
Tribrit Limited 1,011,925 0.06
Ellis-Lea Farms (2000) Limited 975,650 0.06
Plantation Road Dairies Limited 974,170 0.06
Stewart Partnership Limited 922,500 0.06
Van't Klooster Farms Limited 885,190 0.06
Feather Holdings Limited 882,974 0.06
Twin Terraces Limited 866,288 0.05
Hopkins Farming Group Limited 863,006 0.05
Moffitt Dairy Limited 853,134 0.05
Wagon Track Farm Limited 837,027 0.05
Poplar Partnership Limited 817,827 0.05
Klondyke Dairy’s Limited 816,665 0.05
MJ Adams Trust 787,384 0.05
Deegan Farms Trust 771,065 0.05
Glenarlea Farms Limited 763,478 0.05
Gardon Limited 757,437 0.05
C.K.S. Investments Limited 749,002 0.05
Ealing Land Partnership 730,343 0.05
Rangitata Dairies 727,658 0.05
1 The FSM, which reflect the rules of the NZX Main Board (NZSX), require that the Fonterra annual report contain the names and holdings of persons having the 20 largest holdings of Fonterra shares on the register of Fonterra as at a date not earlier than 2 months before the date of the publication of the annual report. The list above complies with the FSM Rules and sets out the list of 20 largest shareholders on the register as at the appropriate date. There is a separate requirement in the Rules to disclose in the annual report those persons who have a “Relevant Interest” (as defined in the Securities Markets Act) in Fonterra shares in excess of 5%, where this information has been provided to Fonterra. Accordingly, the list of the 20 largest holdings of Fonterra shares is not required to show, and does not purport to show, the top 20 holdings of “Relevant Interests” in Fonterra shares which may be owned or controlled by a person or entity and their associated entities. Other people or entities may have “Relevant Interests” in a greater number of Fonterra shares than those listed above. However, it is not possible for Fonterra to accurately determine those interests, nor is it a requirement of the rules for those interests to be reported in the annual report, except where Fonterra has been advised that a person has a relevant interest in excess of the 5% threshold.

64 FONTERRA ANNUAL FINANCIAL RESULTS 2014
Substantial Security Holders
According to notices given to the Company under the Securities Market Act 1998, as at 31 July 2014, the substantial security holders in the Company and their relevant interests are noted below. The total number of Co-operative shares on issue as at 14 August 2014 was 1,597,833,461.
SUBSTANTIAL SECURITY HOLDERSNUMBER OF
VOTING SECURITIES DATE OF NOTICE
Fonterra Farmer Custodian Limited 100,899,257 30 May 2013
FSF Management Company Limited 100,834,498 30 May 2013
FCG Fonterra Co-operative Shares
Analysis of Fonterra Co-operative Shares as at 14 August 2014:
FROM – TOHOLDER
COUNT %HOLDING
QUANTITY %
1 – 50,000 1,684 15.56 41,216,458 2.58
50,001 – 100,000 3,280 30.30 248,954,965 15.58
100,001 – 200,000 3,633 33.56 508,572,420 31.83
200,001 – 400,000 1,896 17.50 513,500,985 32.14
400,001 and over 333 3.08 285,588,633 17.87
ANALYSIS OF CAPITAL NOTE AND RETAIL BOND HOLDING
Analysis of Fonterra’s Capital Note Holding as at 14 August 2014:
FCGHA Capital Notes
FROM – TOHOLDER
COUNT %HOLDING
QUANTITY %
1 – 1,000 11 1.35 4,958 0.00
1,001 – 5,000 29 3.56 80,445 0.08
5,001 – 10,000 300 36.86 2,095,002 2.04
10,001 – 100,000 432 53.07 11,777,107 11.49
100,001 and over 42 5.16 88,561,742 86.39
100,001 and over includes Fonterra Co-operative Group Limited’s holding of 67,435,575.
Analysis of Fonterra’s Retail Bond Holding as at 14 August 2014:
FCG010 $800 million Retail Bond issue
FROM – TOHOLDER
COUNT %HOLDING
QUANTITY %
5,000 – 9,999 761 10.75 4,231,000 0.53
10,000 – 49,999 4,399 62.12 88,723,000 11.09
50,000 – 99,999 1,105 15.61 62,564,000 7.82
100,000 – 999,999 774 10.93 139,112,000 17.39
1,000,000 and over 42 0.59 505,370,000 63.17
FCG020 $150 million Retail Bond issue
FROM – TOHOLDER
COUNT %HOLDING
QUANTITY %
5,000 – 9,999 41 10.20 225,000 0.15
10,000 – 49,999 242 60.20 4,948,000 3.30
50,000 – 99,999 55 13.68 3,274,000 2.18
100,000 – 999,999 55 13.68 14,887,000 9.93
1,000,000 and over 9 2.24 126,666,000 84.44
STATUTORY INFORMATION CONTINUEDFOR THE YEAR ENDED 31 JULY 2014

FONTERRA ANNUAL FINANCIAL RESULTS 2014 65
ENTRIES IN THE INTERESTS REGISTER
Directors’ interests in transactionsGeneral disclosures of interestThe following general disclosures of interest were made in the period from 1 August 2013 to 31 July 2014:
Malcolm Bailey Director of Red Meat Profit Partnership General Partner Limited; Minority shareholder in Aginvest Holdings Limited; Director and shareholder of Etech NZ Ltd.
David Jackson Director of Mitre 10 (New Zealand) Limited.
Sir Ralph Norris Director of Fletcher Building Limited.
Michael Spaans Shareholder in Pascaro Investments Limited; a shareholder and Director of Spaans Farms Limited, and a Director of the following companies: Manuka SA (and related Rimu SA, Trebol Investments), Dairy NZ Limited and Dairy NZ Inc, National Animal Identification and Tracing (NAIT) Limited (subsequently ceased), NZ Animal Evaluation Limited (subsequently ceased), Ospri New Zealand Limited (subsequently ceased), TBFree New Zealand Limited (subsequently ceased), Innovation Waikato Limited, Waikato Innovation Park Limited, New Zealand Food Innovation (Waikato) Limited. Director of Shoof International Limited (and subsidiaries).
Jim van der Poel Cessation of interest in Harapepe Holdings, Tirnanog Farm Limited, Longbeach Dairies Ltd and shareholding interests in Liberty genetics.
John Waller Ceased to be Director of Yealands Wine Group Limited; ceased to be Chairman of the Eden Park Redevelopment Board.
During the financial year there were no notices from Directors requesting to disclose or use information received in their capacity as Directors which would not otherwise have been available to them.
Securities dealings of Directors
The following entries were made in the Interests Register during the year.
New disclosuresDirectors disclosed the following holdings of Co-operative shares during the year:
RELEVANT INTERESTS IN CO-OPERATIVE SHARES
Michael Spaans (on appointment 27 November 2013) 195,812
During the year, Directors disclosed in respect of section 148(2) of the Companies Act 1993 and/or section 19T of the Securities Markets Act 1988 that they (or their associated persons) acquired or disposed of a relevant interest in securities as follows:
Co-operative share transactions
DIRECTORNUMBER OF
SECURITIES ACQUIREDNUMBER OF
SECURITIES DISPOSED CONSIDERATION $ DATE
John Wilson1 15,666 15,666 – 8 November 2013
John Wilson1 40,764 40,764 – 25 November 2013
John Wilson 52,299 – 342,035 26 November 2013
Nicola Shadbolt 2,500 – 14,300 19 December 2013
Jim van der Poel 87,000 – 491,550 20 December 2013
Nicola Shadbolt 1,262 – 7,269 27 December 2013
Ian Farrelly 4,601 – 26,175 24 January 2014
Nicola Shadbolt 16,800 – 99,456 23 May 2014
John Monaghan 67,889 – 407,258 3 June 2014
1 Transfers between related entities.

66 FONTERRA ANNUAL FINANCIAL RESULTS 2014
ENTRIES IN THE INTERESTS REGISTER CONTINUED
Unit transactions¹
DIRECTORNUMBER OF
SECURITIES ACQUIREDNUMBER OF
SECURITIES DISPOSED CONSIDERATION $ DATE
Jim van der Poel 350,000 – 1,983,035 26 November 2013
Nicola Shadbolt 2,500 – 14,300 19 December 2013
Jim van der Poel 175,000 – 987,455 20 December 2013
Jim van der Poel 356,140 356,140 – 31 December 2013
Nicola Shadbolt 1,943 – 11,464 26 May 2014
1 Securities acquired and/or disposed of are units issued by the Fonterra Shareholders Fund which can be converted to Co-operative Group shares.
Retail Bond transactionsCurrent interests in Retail Bonds held by Directors are as follows:
DETAILS OF INTEREST
David Jackson Director of trustee company in respect of 100,000 Bonds (FCG010)
John Waller Joint trustee in respect of 200,000 Bonds (FCG010)
Capital Note transactionsThere were no transactions by Directors (or their associated persons) in Capital Notes reported during the period from 1 August 2013 to 31 July 2014. No current holdings of Capital Notes have been advised by Directors (or their associated persons).
Directors’ remuneration
The Directors’ Remuneration Committee, comprising six shareholders elected in accordance with the Constitution, makes recommendations for shareholder approval as to the level of Directors’ fees.
At the Annual Meeting of shareholders held on 27 November 2013, shareholders approved, on the recommendation of the Directors’ Remuneration Committee, the following amounts of remuneration to apply to Elected Directors from the date of that Annual Meeting of shareholders.
Chairman $405,000 p.a.
Directors $165,000 p.a.
Discretionary additional payments to the Chairmen of permanent Board Committees (except if the Chairman is the Fonterra Chairman) $31,000 p.a.
The Board has approved payment of the discretionary additional payment, at the prevailing approved rate, to the Chairmen of permanent Board Committees.
The Board has discretion to set the fees for Directors appointed under clause 12.4 of the Constitution. In the period to 31 July 2014 the Board applied the same remuneration levels as above to the Appointed Directors.
The Board has approved the payment to Mr Israel of a travel allowance of $10,000 per meeting for travel to and from New Zealand to attend Board meetings.
Fees paid by subsidiary or associate companies in respect of Fonterra Directors or employees appointed by Fonterra as Directors of those companies are payable directly to Fonterra.
Directors’ indemnity and insurance
Fonterra has given indemnities to, and has effected insurance for, Directors and executives of the Company and its related companies, in accordance with Section 162 of the Companies Act 1993, and Fonterra’s Constitution, which, except for specific matters that are expressly excluded, indemnify and insure Directors and executives against monetary losses as a result of actions undertaken by them in the course of their duties. Among the matters specifically excluded are penalties and fines that may be imposed for breaches of law.
STATUTORY INFORMATION CONTINUEDFOR THE YEAR ENDED 31 JULY 2014
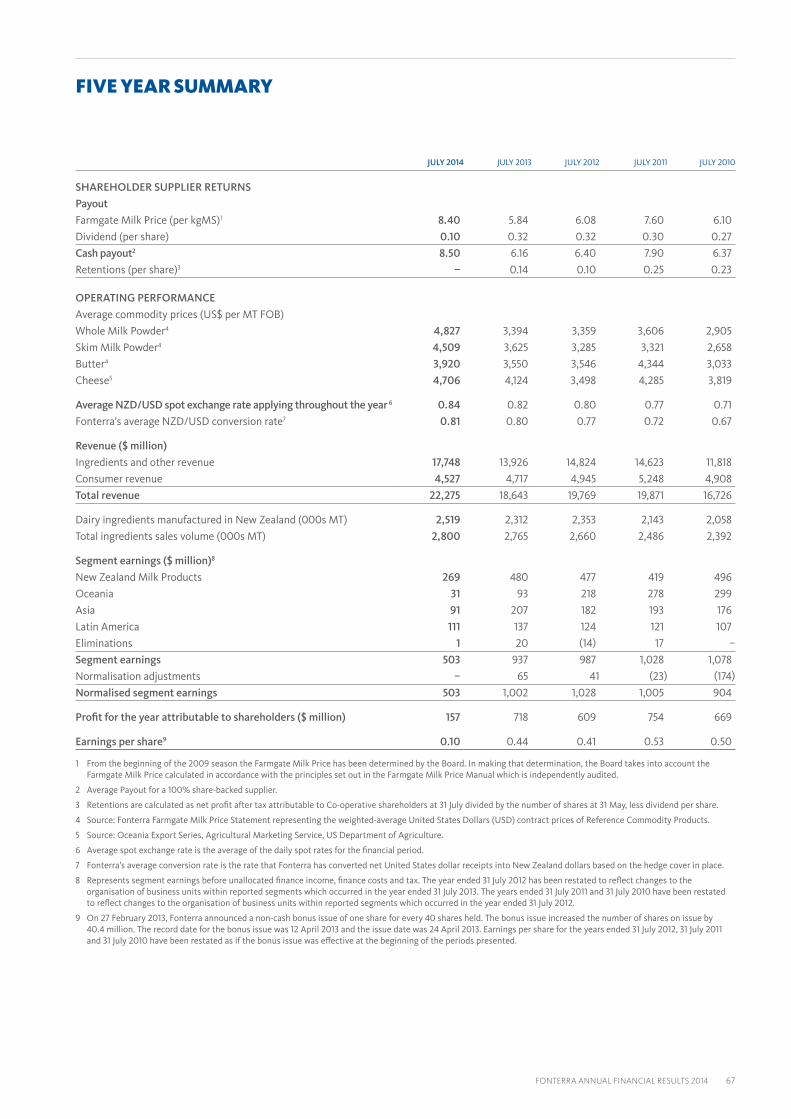
FONTERRA ANNUAL FINANCIAL RESULTS 2014 67
JULY 2014 JULY 2013 JULY 2012 JULY 2011 JULY 2010
SHAREHOLDER SUPPLIER RETURNS
Payout
Farmgate Milk Price (per kgMS)1 8.40 5.84 6.08 7.60 6.10
Dividend (per share) 0.10 0.32 0.32 0.30 0.27
Cash payout2 8.50 6.16 6.40 7.90 6.37
Retentions (per share)3 – 0.14 0.10 0.25 0.23
OPERATING PERFORMANCE
Average commodity prices (US$ per MT FOB)
Whole Milk Powder4 4,827 3,394 3,359 3,606 2,905
Skim Milk Powder4 4,509 3,625 3,285 3,321 2,658
Butter4 3,920 3,550 3,546 4,344 3,033
Cheese5 4,706 4,124 3,498 4,285 3,819
Average NZD/USD spot exchange rate applying throughout the year 6 0.84 0.82 0.80 0.77 0.71
Fonterra’s average NZD/USD conversion rate7 0.81 0.80 0.77 0.72 0.67
Revenue ($ million)
Ingredients and other revenue 17,748 13,926 14,824 14,623 11,818
Consumer revenue 4,527 4,717 4,945 5,248 4,908
Total revenue 22,275 18,643 19,769 19,871 16,726
Dairy ingredients manufactured in New Zealand (000s MT) 2,519 2,312 2,353 2,143 2,058
Total ingredients sales volume (000s MT) 2,800 2,765 2,660 2,486 2,392
Segment earnings ($ million)8
New Zealand Milk Products 269 480 477 419 496
Oceania 31 93 218 278 299
Asia 91 207 182 193 176
Latin America 111 137 124 121 107
Eliminations 1 20 (14) 17 –
Segment earnings 503 937 987 1,028 1,078
Normalisation adjustments – 65 41 (23) (174)
Normalised segment earnings 503 1,002 1,028 1,005 904
Profit for the year attributable to shareholders ($ million) 157 718 609 754 669
Earnings per share9 0.10 0.44 0.41 0.53 0.50
1 From the beginning of the 2009 season the Farmgate Milk Price has been determined by the Board. In making that determination, the Board takes into account the Farmgate Milk Price calculated in accordance with the principles set out in the Farmgate Milk Price Manual which is independently audited.
2 Average Payout for a 100% share-backed supplier.
3 Retentions are calculated as net profit after tax attributable to Co-operative shareholders at 31 July divided by the number of shares at 31 May, less dividend per share.
4 Source: Fonterra Farmgate Milk Price Statement representing the weighted-average United States Dollars (USD) contract prices of Reference Commodity Products.
5 Source: Oceania Export Series, Agricultural Marketing Service, US Department of Agriculture.
6 Average spot exchange rate is the average of the daily spot rates for the financial period.
7 Fonterra’s average conversion rate is the rate that Fonterra has converted net United States dollar receipts into New Zealand dollars based on the hedge cover in place.
8 Represents segment earnings before unallocated finance income, finance costs and tax. The year ended 31 July 2012 has been restated to reflect changes to the organisation of business units within reported segments which occurred in the year ended 31 July 2013. The years ended 31 July 2011 and 31 July 2010 have been restated to reflect changes to the organisation of business units within reported segments which occurred in the year ended 31 July 2012.
9 On 27 February 2013, Fonterra announced a non-cash bonus issue of one share for every 40 shares held. The bonus issue increased the number of shares on issue by 40.4 million. The record date for the bonus issue was 12 April 2013 and the issue date was 24 April 2013. Earnings per share for the years ended 31 July 2012, 31 July 2011 and 31 July 2010 have been restated as if the bonus issue was effective at the beginning of the periods presented.
FIVE YEAR SUMMARY
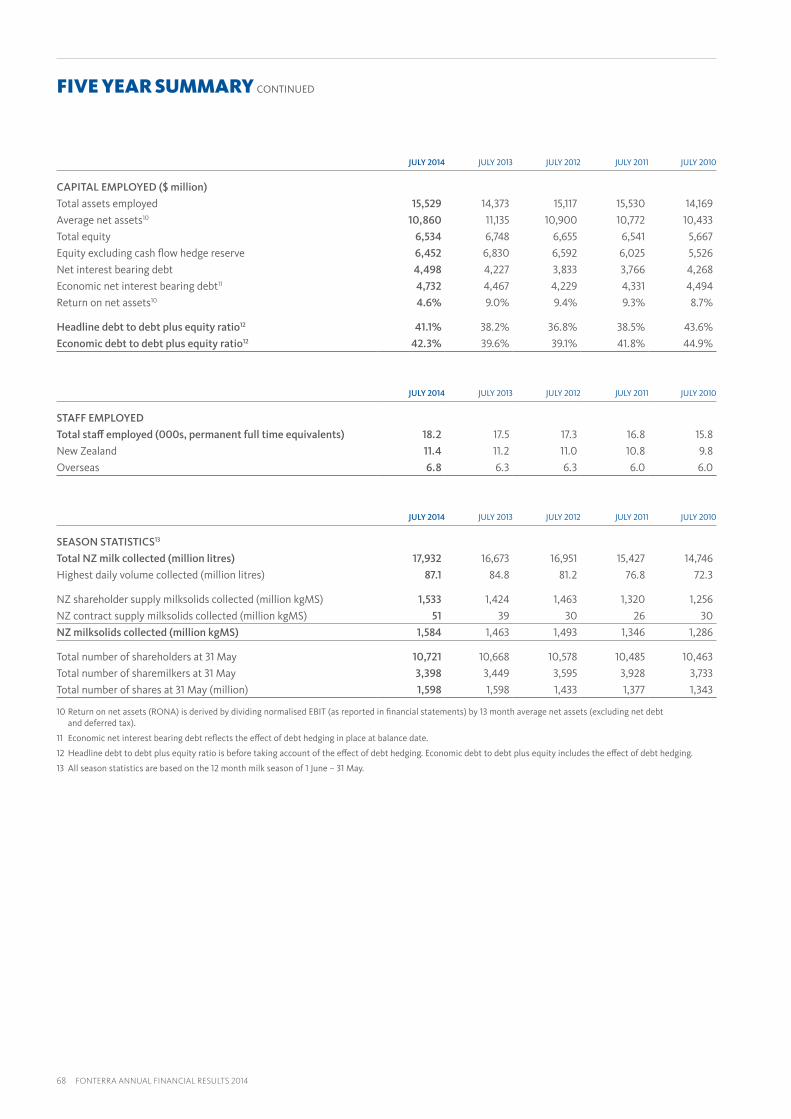
68 FONTERRA ANNUAL FINANCIAL RESULTS 2014
JULY 2014 JULY 2013 JULY 2012 JULY 2011 JULY 2010
CAPITAL EMPLOYED ($ million)
Total assets employed 15,529 14,373 15,117 15,530 14,169
Average net assets10 10,860 11,135 10,900 10,772 10,433
Total equity 6,534 6,748 6,655 6,541 5,667
Equity excluding cash flow hedge reserve 6,452 6,830 6,592 6,025 5,526
Net interest bearing debt 4,498 4,227 3,833 3,766 4,268
Economic net interest bearing debt11 4,732 4,467 4,229 4,331 4,494
Return on net assets10 4.6% 9.0% 9.4% 9.3% 8.7%
Headline debt to debt plus equity ratio12 41.1% 38.2% 36.8% 38.5% 43.6%
Economic debt to debt plus equity ratio12 42.3% 39.6% 39.1% 41.8% 44.9%
JULY 2014 JULY 2013 JULY 2012 JULY 2011 JULY 2010
STAFF EMPLOYED
Total staff employed (000s, permanent full time equivalents) 18.2 17.5 17.3 16.8 15.8
New Zealand 11.4 11.2 11.0 10.8 9.8
Overseas 6.8 6.3 6.3 6.0 6.0
JULY 2014 JULY 2013 JULY 2012 JULY 2011 JULY 2010
SEASON STATISTICS13
Total NZ milk collected (million litres) 17,932 16,673 16,951 15,427 14,746
Highest daily volume collected (million litres) 87.1 84.8 81.2 76.8 72.3
NZ shareholder supply milksolids collected (million kgMS) 1,533 1,424 1,463 1,320 1,256
NZ contract supply milksolids collected (million kgMS) 51 39 30 26 30
NZ milksolids collected (million kgMS) 1,584 1,463 1,493 1,346 1,286
Total number of shareholders at 31 May 10,721 10,668 10,578 10,485 10,463
Total number of sharemilkers at 31 May 3,398 3,449 3,595 3,928 3,733
Total number of shares at 31 May (million) 1,598 1,598 1,433 1,377 1,343
10 Return on net assets (RONA) is derived by dividing normalised EBIT (as reported in financial statements) by 13 month average net assets (excluding net debt and deferred tax).
11 Economic net interest bearing debt reflects the effect of debt hedging in place at balance date.
12 Headline debt to debt plus equity ratio is before taking account of the effect of debt hedging. Economic debt to debt plus equity includes the effect of debt hedging.
13 All season statistics are based on the 12 month milk season of 1 June – 31 May.
FIVE YEAR SUMMARY CONTINUED


Fonterra Co-operative Group Limited Private Bag 92032, Auckland 1142, New Zealand64 9 374 9000 (Phone) 64 9 374 9001 (Fax)Shareholder And Supplier Services Freephone 0800 65 65 68For global locations visit www.fonterra.com