a strong co-operative - fubon financial holding co. · pdf filea strong co-operative......
TRANSCRIPT
A STRONG CO-OPERATIVE...
FONTERRA INTERIM REPORT 2014 FONTERRA CO-OPERATIVE GROUP LIMITED

1
Volume:• Growing ingredients
and consumer volume
• Growing milk supply to meet demand
• Capacity investment to support growth
Strategy• Responding to growing
consumer demand
• Emerging markets focus
• Driving volume and value
2
Value:• Significant foodservice
growth potential
• Expanding our markets for everyday nutrition
• Growing our brand presence in key emerging markets
3
Velocity:• Accelerating capacity
investments to create optionality
• Expanding our global view as market dynamics offer new opportunities
...GETTINGEVEN STRONGER.
This is Fonterra.
Our Farmer Shareholders and our people are working together for one purpose – to bring the best of trusted dairy nutrition to the world. All for one, that’s the Co-operative way.
We began with core strengths of scale, quality and global reach. We are now going from strength to strength through our strategy to build sustainable returns by growing volumes and value. The trends we predicted yesterday are the source of our growth today. As demand keeps growing at an even faster pace, we are staying one step ahead to turn that demand into healthy, sustainable returns.
All of us together are making an even stronger Fonterra.
COnTEnTS2 / VOluME, VAluE, VElOCITy
4 / CHAIRMAN AND CHIEF EXECuTIVE’S lETTER
10 / GROuP OVERVIEW
12 / BuSINESS PERFORMANCE
20 / INTERIM FINANCIAl STATEMENTS
40 / NON-GAAP MEASuRES
41 / GlOSSARy

VOLUMEOur scale and market reach support our goal to grow volumes to meet rising demand.
MILK SOLIDS GROUP SALES VOLUME ASIA SALES VOLUME (EXCL SRI LANKA)
4% 4%Impacted by lower inventory levels as a result of prior season drought.
10%
VALUEValue is driven by consumer demand for products which meet lifestyle and health needs.
REVENUE NORMALISED EBIT INTERIM EARNINGS PER SHARE
$11.3B $403M 13CPS Fonterra refers to normalised EBIT when discussing financial performance. Refer to pages 40 and 41 for further details on non-GAAP financial measures.
2 FONTERRA INTERIM REPORT 2014

NEw ZEALAND The world’s largest milk powder
drier fires up at Darfield, our first greenfields development. Darfield Drier Two can produce more than
30 MT of Whole Milk Powder an hour and complements Darfield Drier One
which came into production in 2012 when the first stage of the $500
million project was completed.
VELOCiTyWe maximise our contribution by taking dairy to the world in the right format and in the right markets.
AUSTRALIAPurchase of the Tasmanian yoghurt business Tamar Valley Dairy has been finalised, strengthening our position in the local industry. The acquisition complements our existing yoghurt portfolio and our existing manufacturing facilities at Spreyton and Wynyard in Tasmania.
CHINA A second farming hub has been announced to be located in ying County, Shanxi Province. The hub will comprise of five single farms with a combined capacity of 16,000 milking cows. it is expected to be in production in the second half of the 2014 calendar year and is an important step to producing one billion litres of milk in China by 2020.
EUROPEOur A-ware joint venture in the netherlands taps into Europe’s significant capacity in cheese. A-ware will sell the cheese to its customers while Fonterra accesses high quality whey protein and lactose for use in advanced nutrition applications.
BRAZILOur Dairy Partners Americas joint venture with nestlé opened a $45 million dairy distribution centre, capable of handling more than 200,000 MT of dairy products destined for delivery across Brazil, an important market for Fonterra with rapid growth.
FONTERRA INTERIM REPORT 2014 3

LETTER FROM THECHAIRMAN AND CHIEF EXECuTIVE
The forecast Cash Payout comprises a forecast Farmgate Milk Price of $8.65 per kgMS and an estimated full year dividend of 10 cents per share. it compares favourably with last season’s final Cash Payout of $6.16. it reflects strong milk powder prices which, on average, are currently ahead by around US$1,200 per metric tonne compared to last season.
A strong dairy outlook and Fonterra’s plans to profit from the continued rise in global dairy demand gives the Board confidence to maintain its
65 to 75 per cent dividend payout policy. it has declared an interim dividend of five cents per share, equivalent to 50 per cent of our forecast dividend for the current financial year. This is in line with our approach in the prior year and with our expectation that earnings tend to be more heavily weighted to the first half.
Our current forecast Cash Payout represents a $13.8 billion injection into the new Zealand economy. With an estimated 50 cents in every $1 of payout spent by farmers locally, the benefits will be felt in both urban and rural communities1. Statistics new Zealand has also reported that dairy helped to drive new Zealand’s terms of trade in the December quarter to their highest levels since 1973.
The numbers confirm dairy is not only an important part of a healthy diet, but also a healthy economy.
Market trends have mirrored those we identified during our 2012 strategy refresh and they are occurring at an increasing pace. Demand from emerging markets is accelerating, especially for milk powder and this is contributing to the stronger pricing we are currently seeing. The growth we projected in ‘out-of-home’ dairy consumption (foodservice) is also occurring year-on-year, reflecting the changing lifestyles among the rising middle classes across China, parts of Asia, Africa, the Middle East and Latin America. The busier consumers’ lives become, the more they turn to easy to prepare meals or to the convenience of ‘out-of-home’ dining.
Fonterra is on track to deliver our best ever returns to our Farmer Shareholders with a forecast Cash Payout of $8.75 for the Season.
The numbers confirm dairy is not only an important part of a healthy diet, but also a healthy economy.
1 New Zealand Institute of Economic Research, Report to Fonterra and Dairy NZ – Dairy’s role in sustaining New Zealand – the sector’s contribution to the economy, December 2010.
4 FONTERRA INTERIM REPORT 2014

We also predicted that the rising purchasing power of the emerging middle classes would see families less concerned about getting basics on the table and more about the nutritional choices they can make to achieve better health. Again, we are seeing rising demand deliver volume growth, especially for our branded products which support bone and muscle health, mobility, healthier ageing and child development.
All the trends confirm to us that we are on the right track with our V3 Strategy with its focus on increasing volumes and value in everyday nutrition, advanced nutrition and foodservice.
We are consistently building our market share in growth markets through our branded and foodservice products with the aim of higher volumes delivering higher value for us over time. Even with the current constraints on margin arising from higher input costs, we continue to make good progress in maintaining and growing brand loyalty which contributes to profits and ultimately the dividend.
Six month snapshotMilk volumes collected for the Season to date increased by four per cent on the prior year to 1,120 million kgMS, with ideal production conditions in many parts of the country contributing to record volumes collected across the October–november peak period.
We processed as much of these record flows into the higher returning milk powder product streams as we could. However, our current asset footprint, coupled with the fact that the peak was longer than usual given the excellent conditions meant that around 25 per cent had to be processed into cheese, casein and other products which earned negative returns over the period. This divergence between product mix returns accounts for our strong forecast Farmgate Milk Price being lower than that calculated in the Farmgate Milk Price Manual.
Our strategy emphasises driving more milk volumes into higher value uses such as branded consumer and foodservice products. However, the dairy commodity prices constrained margins in these areas.
Passing higher costs on to customers and consumers is not always good business – and, in some markets, regulation prevents price rises. There is also the need to strike a balance between passing on costs now and setting the stage for long-term growth by building market share and customer loyalty. This is especially important when we are introducing new products or entering new product segments. Our strategy is clear that emerging markets offer very good growth opportunities for our consumer and foodservice volumes. it is important for the long-term to keep focused on building those volumes. Higher input costs have had a short-term impact on margins, but keeping our pricing competitive has enabled us to continue to build volumes in key markets like China, the Middle East and Southeast Asia.
Our Asia business maintained volume growth of 10 per cent (excluding Sri Lanka), driven by new product launches and foodservice growth. in our key markets in Asia the strength of our Anlene™, Anmum™ and Anchor™ brands allowed us to maintain or improve our market positions. Soprole also delivered volume growth.
For the Co-operative the past six months has been a period of mixed fortunes. We are poised to deliver record Farmgate Milk Price returns, achieving a 21 per cent growth in revenue to $11.3 billion. But we have also seen earnings per share 54 per cent lower at 13 cents, caused mainly by lower margins.
Being disciplined with operating expenses, which were flat for the period, contributed to our ability to offset some rising input costs.
However, volatility is a fact of life in dairy and we remain very focused on delivering a consistently strong Farmgate Milk Price as well as stable and growing earnings over the medium to long-term.
Anchor™UHTprocessinglineattheCo-operative’snew$120millionUHTmilkprocessingsiteatWaitoa.
FONTERRA INTERIM REPORT 2014 5

Farmgate Milk Price Maths in December 2013, the Board announced that it was maintaining the forecast Farmgate Milk Price at $8.30 per kgMS, which was 70 cents less than the price calculated under the Farmgate Milk Price Manual at that time.
in February 2014, the Board increased the forecast Farmgate Milk Price to $8.65 per kgMS. With the Farmgate Milk Price calculated under the Farmgate Milk Price Manual at $9.35 per kgMS, the 70 cent gap between the two prices remained.
Both the December and February decisions were made in the Co-operative’s best interests. it is not appropriate to forecast a Farmgate Milk Price that is higher than we can afford to pay and would require borrowing. That is why the Fonterra Board exercised its discretion to pay a lower price than specified in the Farmgate Milk Price Manual when it is warranted. That the Board chose to do this in the current Season does not foreshadow that it will do so in the future.
The calculation of the Farmgate Milk Price under the Farmgate Milk Price Manual is based on processing and manufacturing milk powder and related streams such as butter and anhydrous milk fat (AMF) – also called Reference Commodity Products. The choice of reference product is deliberate. it is based on the fact that powders account for more than half the global trade in dairy products, that most new investment in new Zealand has been in milk powder related assets and that in the medium-term the highest returns are expected to come from powders.
The calculation is also based on the production costs for a theoretical efficient manufacturer of Fonterra’s size and scale. This theoretical and efficient manufacturer model effectively sets up a highly competitive benchmark against which Fonterra measures its actual performance.
Using that methodology delivered a forecast $9.00 per kgMS Farmgate Milk Price in December, compared to the forecast $8.30 per kgMS by the Board. Behind the 70 cent difference is the cost of higher than usual milk flows across a longer than usual peak and the significant divergence between the returns from Reference Commodity Products and returns on
non-Reference Commodity Products such as cheese and casein.
Even with significant investments in driers in recent years, our fixed asset base, coupled with the longer peak and higher flows not only limited our options for processing milk into the highest returning products but did so over a longer than usual period. Our product mix returns reflect this reality.
During the first half of the Season, Fonterra was able to process around 75 per cent of milk flows into Reference Commodity Products but around 25 per cent was converted to non-Reference Commodity Products such as cheese and casein.
However, Reference Commodity Products prices during the period were significantly ahead of those for cheese, casein and other non-Reference Commodity Products. in some cases the selling prices were lower than the cost of the milk used to produce them. As a result, we had the 70 cent gap between the current forecast Farmgate Milk Price and the price determined by the Farmgate Milk Price Manual.
While the price gap between Reference Commodity Products and non-Reference Commodity Products has more recently narrowed, it is too late in the Season to make up for the large differential experienced earlier in the Season. As a result, the 70 cent gap currently remains. The strength of the Farmgate Milk Price Manual is that it enables this high level of transparency, something which should give confidence to Farmer Shareholders, suppliers and Unit holders alike.
The underlying basis for the Farmgate Milk Price Manual remains sound in that milk powders, butter milk powder and AMF will support the highest sustainable Farmgate Milk Price in the medium-term. That is why the vast majority of capital investment in new plants for the past decade has involved milk powder plants. Work will continue to maximise our current milk powder plants’ efficiency while accelerating planned investments to expand capacity. This strategy will, over time, reduce volatility in the earnings of our ingredients operations and help deliver the highest sustainable returns.
Our strategy is clear that emerging markets offer very good growth opportunities for our consumer and foodservice volumes. it is important for the long-term to keep focused on building those volumes.
6 FONTERRA INTERIM REPORT 2014

Ambition and ActionDairy markets are always volatile which is why we take a long-term view. Our V3 Strategy has accurately predicted growing demand for dairy trade and that in China, Southeast Asia, Latin America and areas of the Middle East and Africa, demand will outstrip supply growth. While growth in domestic milk production will increase along with consumption, imports from Fonterra and others will continue to have a significant role in meeting demand.
it has been clear from the past six months that the trends we picked in demand and demographics in our strategy are moving faster than expected. We are responding by moving faster too with initiatives to better manage price volatility and increase value so we can deliver a sustainable Farmgate Milk Price and sustainable dividends.
Progress on oPtimising global ingredients sales and oPerations
We need to ensure our Farmer Shareholders can confidently grow supply. We are also competing assertively for new suppliers. Delivering the most competitive Farmgate Milk Price, a sustainable dividend return and greater financial tools for our farmers will enable both paths to higher milk volumes.
1. Optimise our global ingredients sales and operations footprint
2. Grow significantly in everyday nutrition
3. Continue our foodservice growth momentum
4. Capture high margins in advanced nutrition
5. Enable growth by expanding beyond new Zealand to selectively invest in milk pools, matching demand with the best market opportunities.
WE HAVE FIVE PRIORITIES:
PlantManagerKarlHaystead,FonterraChairmanJohnWilsonandProgrammeManagerSarahDavenportwithsomeoftheAnchor™UHTcreamandmilkproductsthatwillbeproducedattheCo-operative’snewUHTprocessingsiteatWaitoa.
Delivering the highest sustainable Farmgate Milk Price simply means a focus on making the products in new Zealand which earn the best returns over time.
This is exactly what we have done since Fonterra was formed. We have consistently invested in growing the capacity that counts, especially in milk powders. Since 2001, we have invested $1.8 billion in capacity growth across our sites. This includes:
• $327 million invested in Edendale’s Driers Three and Four, this increased capacity by 41 MT an hour.
• $164 million invested in a third drier at Clandeboye, this added 25 MT an hour to capacity.
• Darfield One and Two Driers, which have delivered additional 45 MT an hour in capacity in an overall project worth approximately $500 million.
in December 2013, we also announced a $235 million investment in expanded drier capacity at Pahiatua which will be operating by September 2015.
The projects are in a long line of investments over a decade to more closely match our new Zealand asset footprint with the forecast demand in milk powder and the growth in milk production in new Zealand.
As a result 59 per cent of our capacity is now devoted to powders versus 44 per cent in 2004. Each year we come closer to the powders-favouring asset footprint ideal laid out in the Farmgate Milk Price Manual.
The numbers tell the story. Ten years ago (2004 financial year), we produced 0.6 million MT of Whole Milk Powder. in the 2013 financial year, we produced 1.0 million MT and forecast volumes for 2014 are closer to 1.2 million MT. Our investments have kept us closely aligned to demand.
We will continue down this path, but at a faster pace, ensuring assets come on stream ahead of expected increases in milk production.
investing ahead of the milk growth curve will give us much greater flexibility to take the best advantage of relative market prices, including during the peak. it will also accommodate growth from existing suppliers and new volume from joining suppliers.
The cost benefits of higher flexibility and a less volatile earnings profile, will outweigh any short-term risk of excess capacity. Even with fast-tracked investments, adding capacity will take time so we also have a programme in place to increase throughput in existing plants, especially the older legacy sites.
FONTERRA INTERIM REPORT 2014 7

not all capacity expansions will favour powders. Strong growth in foodservice, along with growing demand for everyday nutrition, justifies tactical investment in new plant to meet that demand. We have announced investments of approximately $262 million to support our strategy to continue our foodservice growth momentum. These investments include:
• $72 million at our Clandeboye mozzarella plant in 2013 to double the capacity of the existing plant in Canterbury to produce individual quick frozen (iQF) grated mozzarella.
• Our $32 million expansion to double our cream cheese capacity at Te Rapa in the Waikato.
• The $126 million investment in new Ultra Heat Treated (UHT) capacity in the same region.
• The $32 million expansion at Eltham to meet demand for higher value slice-on-slice cheese used in foodservice restaurants.
Progress on growing consumer and Foodservice
We continue to make good headway with our consumer and foodservice focused priorities. in Asia and Latin America we continue to focus on growth, supported by new product launches and foodservice growth. We have continued to build consumer loyalty, achieving volume growth for our Anchor™, Anlene™ and Anmum™ brands. Anchor™ UHT was successfully launched in China to meet everyday nutrition demands and the rollout of the Anmum™ paediatric formula in China is also progressing well.
We continue to drive our foodservice momentum through the capacity investments detailed above in cream cheese and UHT.
Progress on develoPing multiPle milk hubs, while growing new Zealand suPPly
We are in a competitive market for milk, so retaining and growing our new Zealand supply is always a priority. Returning the highest sustainable Farmgate Milk Price is crucial to encouraging supply growth and loyalty, as good returns enable our Farmer Shareholders to cover their rising costs and to invest in their farms and futures. Our initiatives to better manage price volatility and increase value are designed to give suppliers the confidence to grow, while our programmes to support and promote sustainable farming also enable that growth to be achieved with minimal environmental impacts.
Progress on our V3 Strategy is also crucial to supply growth because our Farmer Shareholders can see predicted demand turn into sustainable payouts. To support on-farm growth we are successfully offering more flexible supply contracts which offer staged payment options for Shares. Giving suppliers more time to fully back production with Shares gives them more financial flexibility.
This year we have also provided more financial flexibility for Farmer Shareholders by piloting a Guaranteed Milk Price (GMP) scheme enabling them the ability to lock in the price paid for a percentage of their milk. it involves 328 participants supplying 15 million kgMS for a guaranteed $7.00 per kgMS. The pilot attracted such a high level of support that applications were received to supply 37 million kgMS. Participants were scaled back to 40 per cent of their original application.
Even with the current record forecast, feedback from participating farmers to date has been they value the income
Taking this global perspective with manufacturing assets and building milk pools in the right locations is a win-win for Fonterra and our Farmer Shareholders.
Fonterrafoodserviceslice-on-slicecheeseduringproductionatEltham.
8 FONTERRA INTERIM REPORT 2014

certainty the GMP has provided from the start of the Season, enabling them to confidently make decisions around servicing debt or making capital investments on-farm. We will evaluate the pilot ahead of the new season.
Milk sourced in new Zealand will always be our top priority. Collecting, processing and selling Farmer Shareholders’ milk for the best price for the best Farmgate returns is at the very heart of the Co-operative’s principles.
it is important, however, that we also maintain our global view of both manufacturing and milk supply. We are part of a global dairy market where the dynamics are changing. it is crucial we take the global view, understand where we have a natural competitive advantage and identify opportunities to build volume and value using other milk pools.
A current example is our A-ware joint venture in the netherlands which is a new cheese and dairy ingredients plant. Europe has a natural competitive advantage in cheese. A-ware will sell the cheese to its customers while Fonterra will have access to high quality whey protein and lactose for use in advanced nutrition applications.
Taking this global perspective with manufacturing assets and building milk pools in the right locations is a win-win for Fonterra and our Farmer Shareholders. Their milk will go into the highest returning products in new Zealand where we have significant powder expertise and global market share, while milk from other attractive milk pools will also generate returns for them, paid through the dividend.
Reputation, Review, RebuildAll of our strategic priorities are being advanced against the backdrop of work being done to further strengthen our food safety and quality systems. The reviews of last year, following the precautionary recall of WPC80 product, confirmed that our systems are robust, but that we also have opportunities to make them even more so.
Recommendations from our internal management review and the independent review commissioned by the Board have been distilled into 36 initiatives across seven streams of work which are being progressed.
We take compliance with food safety regulations extremely seriously. Our customers and consumers need to know that new Zealand’s food quality and safety regulations are being robustly applied by food manufacturers and enforced by new Zealand authorities.
new Zealand, for example, has a trusted role in global food chains and we are proud to be part of that, but keeping market doors open needs constant attention as consumers look to their governments to ensure the food on their tables remains safe. We are committed to our food export sector’s need to achieve new levels of safety and traceability supported by robust regulation and government expertise.
As we come into the second half of the financial year we remain confident in our strategy and its implementation. While dairy volatility remains a fact of life, demand forecasts remain in line with our expectations.
JohnWilsonCHAiRMAn
TheoSpieringsCHiEF EXECUTiVE
FonterraCEOTheoSpieringsataFonterraMilkforSchoolscelebrationatThreeKingsSchoolinAuckland.
FONTERRA INTERIM REPORT 2014 9

GROuP OvERviEwHigher global dairy prices driven by sustained demand, especially in China and emerging markets, have enabled the Co-operative to forecast a Cash Payout of $8.75 for the Season.
The best ever returns for farmers and the new Zealand economy have been predominantly generated by the strong prices achieved by milk powders driven by strong demand for dairy products.
This included 110,000 MT exported to China alone in December 2013, creating a new record for single destination shipments in a single month.
Sustained high prices, especially for milk powders, saw revenue increase by 21 per cent to $11.3 billion, but these also led to higher input costs. Gross margin percentage fell 614 basis points to 13 per cent. normalised EBiT for the six months was 41 per cent lower than the comparative period, driven mainly by the impact of lower returns from product mix in our nZ Milk Products business. This compares to the very strong earnings in the first half of last year.
The increasing pressure on margins was also evident in our consumer and foodservice businesses. Here the balance needed to be struck between passing on rising costs immediately or continuing to build our market presence and volumes to secure long-term growth. Taking the longer-term view has constrained profitability during this run of strong commodity pricing, but we are positioning ourselves for the future with volumes in Asia up 10 per cent excluding Sri Lanka.
Operating expenses were flat, with offsetting movements across the Group. The effective tax rate has increased from 11 per cent to 19 per cent due to the lower interim dividend which created a corresponding reduction in the tax credit. net profit after tax was 53 per cent lower at $217 million.
Operating cash flow improved by $404 million to a cash outflow of $19 million. Fonterra’s production cycle typically results in a cash outflow at half year. Reduced earnings were more than offset by a positive working capital impact, the result of a larger difference between the Advance Rate paid to farmers for current Season milk and the forecast full year milk price. This difference means the cash we have received from sales in the first half is higher relative to the cash that we have paid for milk, compared to the previous year.
Our gearing ratio is 44.6 per cent compared to 40.0 per cent at 31 January 2013. The change is a result of lower earnings, the Supply Offer (which increased debt and decreased share capital), and increased investment spending, including acquiring a strategic nine per cent stake in Australian dairy company Bega.
The strong dairy outlook and Fonterra’s plans to profit from the continued rise in demand gives the Board confidence to maintain a 65 to 75 per cent payout ratio and, as a result, it has declared an interim dividend of 5.0 cents per share. This interim dividend represents 50 per cent of our forecast dividend for the current financial year, consistent with our approach in the prior year, and in line with our expectation that earnings are more heavily weighted to the first half.
10 FONTERRA INTERIM REPORT 2014
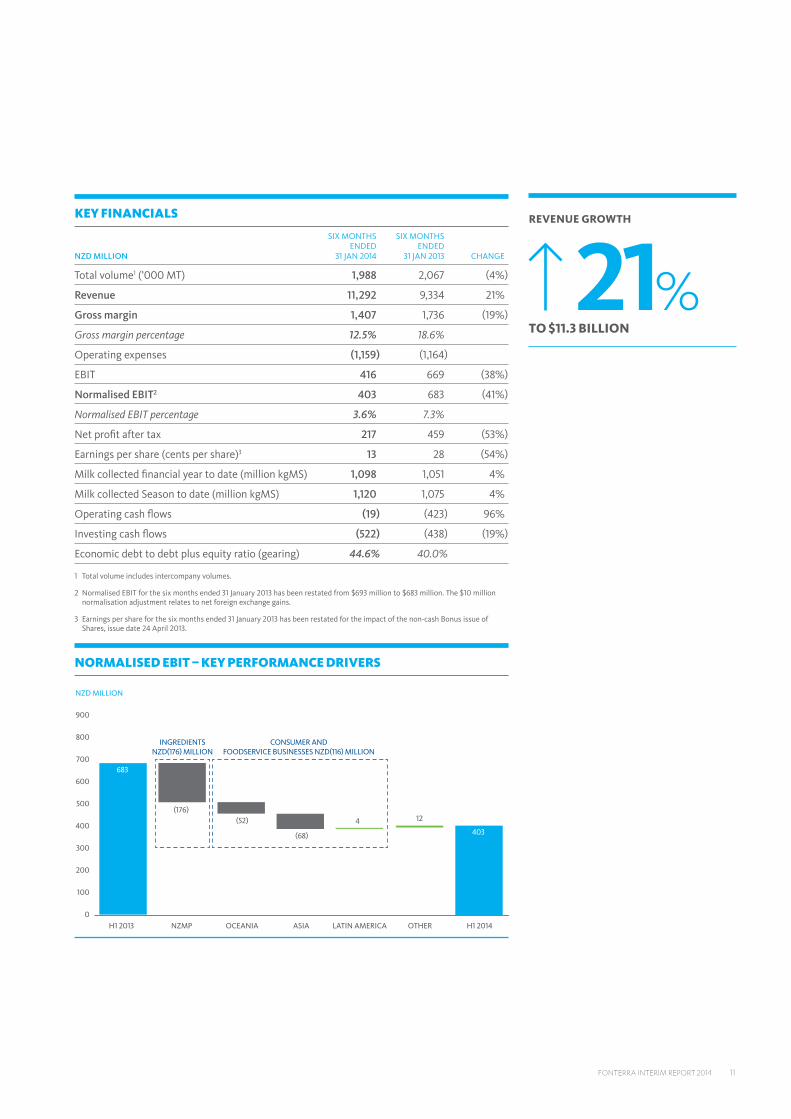
revenue growth
21%to $11.3 billion
KEy FINANCIAlS
NZDMILLION
SIX MONTHS ENDED
31 JAN 2014
SIX MONTHS ENDED
31 JAN 2013 CHANGE
Total volume1 (’000 MT) 1,988 2,067 (4%)
Revenue 11,292 9,334 21%
Grossmargin 1,407 1,736 (19%)
Gross margin percentage 12.5% 18.6%
Operating expenses (1,159) (1,164)
EBIT 416 669 (38%)
NormalisedEBIT2 403 683 (41%)
Normalised EBIT percentage 3.6% 7.3%
Net profit after tax 217 459 (53%)
Earnings per share (cents per share)3 13 28 (54%)
Milk collected financial year to date (million kgMS) 1,098 1,051 4%
Milk collected Season to date (million kgMS) 1,120 1,075 4%
Operating cash flows (19) (423) 96%
Investing cash flows (522) (438) (19%)
Economic debt to debt plus equity ratio (gearing) 44.6% 40.0%
1 Total volume includes intercompany volumes.
2 Normalised EBIT for the six months ended 31 January 2013 has been restated from $693 million to $683 million. The $10 million normalisation adjustment relates to net foreign exchange gains.
3 Earnings per share for the six months ended 31 January 2013 has been restated for the impact of the non-cash Bonus issue of Shares, issue date 24 April 2013.
NORMAlISED EBIT – KEy PERFORMANCE DRIVERS
0
100
200
300
400
500
600
700
800
900
H1 2013 NZMP OCEANIA ASIA LATIN AMERICA OTHER H1 2014
NZD MILLION
683
4034 12
(176)(52)
(68)
CONSUMER ANDFOODSERVICE BUSINESSES NZD(116) MILLION
INGREDIENTSNZD(176) MILLION
FONTERRA INTERIM REPORT 2014 11

BuSINESSpERFORMancE
VolumeMilk collection across new Zealand for the Season to 31 January 2014 reached 1,120 million kgMS, four per cent higher than the same period last year.
Rain through December and early January helped maintain milk production above last season’s level with the north island four per cent higher and the South island five per cent higher for the Season to 31 January 2014.
The record milk volumes for the first half of the Season did not translate into increased sales volume as nZ Milk Products began the year with low inventory levels as a result of the previous season’s drought. With strong demand, especially from China but also other customers globally, record volumes were shipped from new Zealand in the second quarter. However, total volumes sold for the period were lower than the prior year given reduced start of season stocks. Our ability to make and ship record volumes during the period to capture high commodity prices, reflects our ongoing investment in supply chain efficiencies.
ValueRevenue in our nZ Milk Products business was up 35 per cent as a result of strong dairy commodity prices. However this was more than offset by the increase in input costs. The Farmgate Milk Price is driven predominantly by milk powder prices and Whole Milk Powder was up 60 per cent for the six month period.
Two key factors affected the earnings of the nZ Milk Products business in the first half:
• With the strong growth in milk production volumes, we were unable to optimise production over the peak period, resulting in production inefficiencies and higher wastage.
• Strong prices for Reference Commodity Products, which inform the Farmgate Milk Price, resulted in high input costs for non-Reference Commodity Products that could not be recovered. The significant divergence between price movements of Reference Commodity Products and non-Reference Commodity Products had a negative impact on returns from product mix.
normalised ebit – key drivers
normalised EBiT for the first half was $236 million, 43 per cent lower than the same period last year. The first half saw a continuation of strong milk powder prices and high demand, however EBiT was impacted by
pressure on price relativities with the return from product mix being $116 million lower than the same period last year.
The Co-operative processes around 25 per cent of milk collected into non-Reference Commodity Product streams primarily in the form of cheese and casein. The relative increase in the price of Reference Commodity Products was significantly higher than the increase in the price of non-Reference Commodity Products. This resulted in a margin squeeze for non-Reference Commodity Products after milk input costs rose disproportionately against the sales price. in some product streams the selling price was lower than the input costs. This had a negative impact on earnings.
Product mix gross margin was $116 million lower than the same period last year due to a $560 million negative product mix impact. This included adjustments of inventory values to net realisable value, offset in part by the Farmgate Milk Price adjustment.
in December last year, the Board decided to maintain the forecast Farmgate Milk Price at $8.30 per kgMS as a result of significant stream return volatility. This decision reflected the reality that it was not possible to lift milk powder production above current levels because of the nature of Fonterra’s existing production facilities in new Zealand.
NZ MIlK pROducTsnZ Milk Products comprises the core new Zealand milk supply chain from collection, manufacturing and logistics through to the end sale of dairy products to business customers and the Fonterra regional businesses. it also includes international milk sourcing, dairy nutrition-related joint ventures and the Co-operative’s corporate activities.
1
12 FONTERRA INTERIM REPORT 2014

Maintaining the Farmgate Milk Price at 70 cents per kgMS lower than that calculated under the Farmgate Milk Price Manual helped offset the negative product mix returns. This resulted in a first half normalised EBiT being $519 million higher than had the reduction not been applied. This was due to a combination of a lower cost of goods and a reduced need to write down inventory values to expected future selling value.
The contribution from liquid milk was $75 million lower than last year as a result of actual (spot) milk prices being significantly higher than the annual forecast Farmgate Milk Price and the pricing on our long-term customer contracts.
Gross margin was also unfavourably impacted by production challenges resulting from the high levels of milk received over the peak milk period at a cost of $76 million. The high volume of milk meant we incurred production inefficiencies, had to dispose of some milk by-products and incurred increased transport costs to move milk to available processing plants. in addition, higher milk volumes in the first half resulted in the use of some factories with a less optimal product mix for longer periods than normal.
included in the result were price premiums achieved above dairy commodity prices of $116 million. While this was $5 million lower than the previous period, it was a good result in an environment of strong dairy prices.
The nZ Milk Products segment includes all of the Fonterra Group’s corporate costs which contributed to a nine per cent increase in the segment’s operating expenses. The increase was largely a result of one-off legal settlements.
investing in greater Production and asset Flexibility
increased milk volumes are welcome and reflect farmer confidence in Fonterra’s future. Work is well advanced to further increase processing capacity with Darfield Two, the world’s largest milk powder drier, being successfully commissioned in August and the Waitoa UHT facility due to be operational shortly.
Additional investments in capacity have also been announced, including a new drier at Pahiatua. There is an inevitable time lag to implement capacity growth, especially into areas that will give us greater flexibility to take advantage of relative market pricing. However, work is under way to maximise current and future capacity by accelerating planned investments.
KEy FINANCIAlS
NZDMILLION
SIX MONTHS ENDED
31 JAN 2014
SIX MONTHS ENDED
31 JAN 2013 CHANGE
Total volume1 (’000 MT) 1,441 1,474 (2%)
Revenue 9,117 6,762 35%
Grossmargin 617 797 (23%)
Gross margin percentage 6.8% 11.8%
Operating expenses (480) (442) 9%
NormalisedEBIT2 236 412 (43%)
Normalised EBIT percentage 2.6% 6.1%
1 Total volume includes intercompany volumes.
2 Normalised EBIT for the six months ended 31 January 2013 has been restated from $422 million to $412 million. The $10 million normalisation adjustment relates to net foreign exchange gains.
NORMAlISED EBIT – KEy PERFORMANCE DRIVERS
NZD MILLION
0
200
400
600
800
1,000
1,200
H1 2014OTHERPEAK PRODUCTIONCOSTS
PRICEPREMIUMS
PRODUCTMIX
H1 2013
412
(116)
(76) (5)
21
236
PRODUCTGROSS MARGIN
MILK PRICEADJUSTMENT
LIQUIDMILK
519
(560)
(75)
nZmP revenue
$9.1B
FONTERRA INTERIM REPORT 2014 13

BuSINESSpERFORMancE
VolumeTotal sales volume of 411,000 MT was down 13 per cent on the prior period, partially due to the sale of the norco liquid distribution business in the prior period. Excluding this impact, volumes were down nine per cent as a result of lower ingredients export volumes, decreased nutritional volumes, and reduced yoghurt volumes in Australia. Despite a tough trading environment, volume in new Zealand was up four per cent and revenue grew six per cent following a lift in prices to partially recover significant increases in commodity costs.
Value Oceania normalised EBiT was 53 per cent lower than the comparative period, at $46 million. This business is undergoing a significant transformation and has been impacted by strong competition, higher input costs and lower export sales out of Australia. Significant progress has been made in lowering operating costs and streamlining our brands portfolio.
normalised EBiT fell 39 per cent in Australia. The key driver was weaker gross margin performance in the everyday nutrition business, as competitive pressure constrained our ability to pass on higher input costs. The yoghurt and dairy dessert category was the largest contributor to the decrease. This category remains difficult but is a key part of our turnaround plan.
The purchase of the Tamar Valley Dairy business, including advanced production facilities, gives us the opportunity to create value through new products, and more efficient production. We also acquired a strategic nine per cent stake in Australian dairy company Bega. Fonterra has a long-standing partnership with Bega and has confidence in the strategy it is pursuing. There has recently been
Oceania encompasses consumer and ‘out-of-home’ foodservice businesses in Australia and new Zealand, and a dairy processing and manufacturing business that collects approximately 17 per cent of Australia’s milk supply. it also includes RD1, a rural supplies retailer in new Zealand.
2
OCEANIA
rd1 normalised ebit
11%
Kapiti™KikorangiBluewasthestandoutperformerthisyearatthe2014NZChampionsofCheeseAwards,winningtheNewWorldChampionFavouriteCheeseAward,votedforbytheNewZealandpublic.
14 FONTERRA INTERIM REPORT 2014

substantial consolidation activity in the Australian dairy industry and these two investments gave the Co-operative the opportunity to participate.
Our Australian ingredients business was impacted by some short-term reductions in its volume related to the WPC80 incident. This business is currently realigning its product mix with a greater focus on the export markets where it can benefit from the significant demand for dairy products.
Our consumer brands business in new Zealand felt the impact of a temporary disruption in the supply chain, higher input costs as a result of the increase in commodity prices, and a competitive environment that has made it difficult to recover those increases.
RD1 continued to perform well, delivering growth of 11 per cent in normalised EBiT over the prior period, with farmer spending boosted by the strong forecast Farmgate Milk Price.
RD1 opened three new stores in the first half as we match our footprint to the growing dairying locations around new Zealand.
Tip Top™ was negatively impacted by bad weather in January during the peak sales period combined with rising commodity costs. However, the underlying business continues to perform well, maintaining market leadership in ice cream. Our all-natural colours and flavours products have been very well received across the trade and with our customers.
KEy FINANCIAlS
NZDMILLION
SIX MONTHS ENDED
31 JAN 2014
SIX MONTHS ENDED
31 JAN 2013 CHANGE
Total volume1 (’000 MT) 411 471 (13%)
Revenue 1,825 2,018 (10%)
Grossmargin 344 423 (19%)
Gross margin percentage 18.8% 21.0%
Operating expenses (311) (357) (13%)
NormalisedEBIT 46 98 (53%)
Normalised EBIT percentage 2.5% 4.9%
1 Total volume includes intercompany volumes.
RD1storeinMatamata.
FONTERRA INTERIM REPORT 2014 15

BuSINESSpERFORMancE
VolumeWe continue to drive volume growth through our V3 Strategy with a focus on foodservice and meeting the nutritional needs of a growing emerging middle class. Volume growth of three per cent was constrained by our Sri Lanka business, which was significantly impacted by a temporary suspension of its market operations. We have implemented a sustained programme to rebuild consumer confidence and we are making good progress in that regard. Excluding Sri Lanka, volume growth was up 10 per cent across Asia.
Volume growth in ASEAn was up nine per cent mainly in foodservice and mobility, with indonesia being a key growth region. Our advanced nutrition business, comprising the Anlene™ and Anmum™ brands, had volume growth of five per cent, with strong growth in indonesia as a result of supply issues being resolved. We are investing in a blending and packaging facility in indonesia to cater for future growth.
Volumes were up 15 per cent in China driven by growth in China farms and foodservice.
Value normalised EBiT for the six months was $32 million, which was 68 per cent lower than the same period last year and 66 per cent lower on a constant currency basis. Key drivers of this were significantly higher input costs as a result of the high dairy commodity prices, a negative currency impact and the challenging market conditions in Sri Lanka. Operating costs were maintained through a strong focus on cost control where possible.
Passing on higher input costs to consumers puts volume growth at risk, so a balance had to be struck between supporting market share and reflecting current price volatility in commodities. Price increases were implemented across most of the ASEAn region, which partially offset the significant increase in input costs.
The strength of our Anlene™, Anmum™ and Anchor™ brands throughout this region has allowed us to largely maintain or improve our strong market share positions in all key markets, while we see signs of contraction in category size within some markets.
A key market for Fonterra in this region is Sri Lanka where earnings were impacted by the temporary suspension of our operations in August 2013. Sri Lanka is our largest market by volume;
ASIAAsia comprises Fonterra’s consumer and foodservice businesses in Asia, Africa, the Middle East and Greater China. Asia brands cover a wide range of consumer and customer needs ranging from everyday dairy nutrition under Anchor™, Fernleaf™ and Ratthi™, to advanced nutrition offerings under Anlene™ and Anmum™. The business also includes China farms.
3
it accounted for 27 per cent of volume in Asia (excluding China) last year. The sales volume from Sri Lanka was 33 per cent lower than last year and this had a significant impact on earnings in the first half. However, Fonterra remains committed to Sri Lanka where Anchor™ continues to be a market leader. The strength of our brand equity in this country has become apparent with most of our products having regained their previous market share levels.
Foodservice volumes grew 10 per cent in Asia (excluding China) reflecting the strength of our foodservice business model. Our chef led approach, where we work closely with customers to help them understand the benefits our products provide, continues to secure brand loyalty. This is supported by increased investment in production capacity to help meet this growing demand, and is a great example of making progress in our strategy to create long-term value in the face of short-term margin pressure.
Foodservice volume growth
10%
16 FONTERRA INTERIM REPORT 2014

in China, we have made good progress in key product launches this year, despite some initial delays as we worked through the initial recovery stages of the WPC80 precautionary recall. in August last year, our China business successfully launched Anchor™ UHT and it is now available in 1,300 stores across the yangtze River Delta with a market share of over five per cent, which is ahead of our target.
A pilot of the full range of Anmum™ paediatric formula was launched in the cities of Chengdu and Guangzhou late last year.
The team has adopted an integrated sales strategy to introduce Anmum™ infant formula in China, both online and in-store, enabling it to have a greater reach. Anmum™ is now available in more than 100 physical stores and also nationwide through T-mall, one of the country’s top e-retailers.
Good progress has also been made in the first half in expansion of our farming operations with the first farming hub now complete. in addition, we have achieved strong pricing on that milk, due to local shortages and customers recognising the importance of the quality and food safety that our farms provide.
China farms benefited from strong demand for milk and higher prices for raw milk in China. included in this is a revaluation of the animal herd which was partially offset by higher herd-related operating costs.
KEy FINANCIAlS
NZDMILLION
SIX MONTHS ENDED
31 JAN 2014
SIX MONTHS ENDED
31 JAN 2013 CHANGE
Total volume1 (’000 MT) 192 186 3%
Revenue 1,054 1,049
Grossmargin 280 362 (23%)
Gross margin percentage 26.6% 34.5%
Operating expenses (281) (280)
NormalisedEBIT 32 100 (68%)
Normalised EBIT percentage 3.0% 9.5%
1 Total volume includes intercompany volumes.
AnchorTMcontinuestobeamarketleaderinSriLanka.
FONTERRA INTERIM REPORT 2014 17

BuSINESSpERFORMancE
VolumeLatin America had volume growth of one per cent for the first half, driven by our Soprole business in Chile, which increased three per cent with volume growth in retail cheese sales and milk powder sales to the Government Health programme.
Volume growth in cheese was driven by innovations in pre-packed cheese, which have been well accepted by the market in a high growth category.
ValueThe key driver in the improved normalised EBiT from the prior year was a significant 67 per cent increase in earnings from our Dairy Partners Americas (DPA) joint venture. The largest improvement within DPA was from the chilled and liquids branded business in Venezuela which managed to reduce losses incurred as a result of high inflation impacting input costs. This was achieved through price increases across our product portfolio. These are positive improvements in what continues to be a politically and economically challenging market.
The DPA Brazil chilled and liquids business has experienced higher raw material prices and operating overheads which have not been recovered. This resulted in lower margins and profitability in a highly competitive market.
The DPA Manufacturing business also improved earnings as it achieved greater cost recoveries.
in constant currency terms Soprole achieved a 12 per cent increase in revenue. However, reported revenue was up three per cent due to the weaker Chilean peso and strong new Zealand dollar. Soprole’s normalised EBiT decreased 19 per cent to $43 million in new Zealand dollars. This was in part due to the impact of the weaker Chilean peso when translating earnings to new Zealand dollars and EBiT in constant currency was 12 per cent lower than the comparable period. Excluding the currency impact, gross margin declined despite the increase in volume and pricing, this was due to higher input milk costs and competitive pricing in the softening Chilean economy. However, the strength of the Soprole brand has meant the margin squeeze has been less pronounced than in our other consumer businesses.
lATIN AMERICALatin America encompasses Soprole, the market-leading integrated dairy business in Chile, and an investment in Dairy Partners Americas, a 50/50 joint venture with nestlé covering several markets in Latin America including Brazil, Venezuela, Ecuador, Colombia and Argentina. Latin America also includes an in-market ingredients sourcing and sales business, a foodservice business in the Caribbean and an investment in Dairy industries (Jamaica) Limited, a 50/50 joint venture with GraceKennedy Group offering a range of dairy consumer products.
4
18 FONTERRA INTERIM REPORT 2014

The cheese category is underdeveloped in Chile, with Chileans consuming less cheese than in other parts of South America, and is showing strong growth. Supermarkets have traditionally offered predominantly wheel cheese and Soprole is benefiting from consumers switching to pre-packed cheese as a result of new innovations in sliced cheese and packaging. Volume has more than doubled in the past three years.
Operating expenses have also increased as a result of higher advertising and promotion support, and higher storage and distribution costs whilst we transition to our new state-of-the-art distribution centre. This new facility means a more efficient centralised distribution model, which is expected to help drive future cost savings and allow for continued expansion in future periods.
Our Southern Cone ingredients business benefited from improved pricing for dairy ingredients and a return to profitability, while the Caribbean business had slightly lower earnings due to higher commodity prices in cheese and cream.
KEy FINANCIAlS
NZDMILLION
SIX MONTHS ENDED
31 JAN 2014
SIX MONTHS ENDED
31 JAN 2013 CHANGE
Total volume1 (’000 MT) 188 187 1%
Revenue 570 559 2%
Grossmargin 148 148
Gross margin percentage 26.0% 26.5%
Operating expenses (101) (94) 7%
NormalisedEBIT 71 67 6%
Normalised EBIT percentage 12.5% 12.0%
1 Total volume includes intercompany volumes.
soProle revenue constant currency
12%
FONTERRA INTERIM REPORT 2014 19

Contents:DIRECTORS’ STATEMENT. . . . . . . . . . . . . . . . . . . . . . . . . . . . . . . . . . . . . . . . . . . . . . . . 21 INCOME STATEMENT . . . . . . . . . . . . . . . . . . . . . . . . . . . . . . . . . . . . . . . . . . . . . . . . . . . 22STATEMENT OF COMPREHENSIVE INCOME . . . . . . . . . . . . . . . . . . . . . . . . . . . . . . 23STATEMENT OF FINANCIAL POSITION . . . . . . . . . . . . . . . . . . . . . . . . . . . . . . . . . . . 24STATEMENT OF CHANGES IN EQUITY . . . . . . . . . . . . . . . . . . . . . . . . . . . . . . . . . . . . 25CASH FLOw STATEMENT. . . . . . . . . . . . . . . . . . . . . . . . . . . . . . . . . . . . . . . . . . . . . . . . 26CONDENSED STATEMENT OF SIGNIFICANT ACCOUNTING POLICIES. . . . . . . . 27NOTES TO THE FINANCIAL STATEMENTS . . . . . . . . . . . . . . . . . . . . . . . . . . . . . . . . . 29
CONSOlIDATED inTERiM FinanciaL sTaTEMEnTsFor the six months ended 31 January 2014
20 FONTERRA INTERIM REPORT 2014

The Directors of Fonterra Co-operative Group Limited (Fonterra or the Company) are pleased to present to Shareholders the financial statements for Fonterra and its subsidiaries (together the Group) and the Group’s interest in its equity accounted investees for the six months ended 31 January 2014.
The Directors are responsible for presenting financial statements for the six months which give a true and fair view of the financial position for the Group and of the financial performance and cash flows for that period.
The Directors consider the financial statements of the Group have been prepared using accounting policies which have been consistently applied and supported by reasonable judgements and estimates, and that all relevant financial reporting and accounting standards have been followed.
The Directors believe that proper accounting records have been kept which enable, with reasonable accuracy, the determination of the financial position of the Group and facilitate compliance of the financial statements with the Financial Reporting Act 1993.
The Directors consider that they have taken adequate steps to safeguard the assets of the Group, and to prevent and detect fraud and other irregularities.
The Directors hereby approve and authorise for issue the financial statements for the six months ended 31 January 2014 presented on pages 22 to 39. For and on behalf of the Board:
JOHN WILSON DAVID JACKSON Chairman Director 25 March 2014 25 March 2014
DIRECTORS’ STATEMENT FOR THE SIX MONTHS ENDED 31 JANUARY 2014
FONTERRA INTERIM REPORT 2014 21

INCOME STATEMENTFOR THE SIX MONTHS ENDED 31 JANUARY 2014
GROUP $ MILLION
SIX MONTHS ENDED YEAR ENDED
NOTES31JAN2014
UNAUDITED31 JAN 2013
UNAUDITED31 JUL 2013
AUDITED
Revenue from sale of goods 11,292 9,334 18,643
Cost of goods sold 1 (9,885) (7,598) (15,611)
Grossprofit 1,407 1,736 3,032
Other operating income 98 58 105
Selling and marketing expenses (307) (320) (622)
Distribution expenses (251) (261) (514)
Administrative expenses (391) (378) (766)
Other operating expenses (210) (205) (354)
Net foreign exchange gains/(losses) 32 9 (7)
Share of profit of equity accounted investees 38 30 63
Profitbeforenetfinancecostsandtax 2 416 669 937
Finance income 7 16 25
Finance costs (154) (168) (294)
Netfinancecosts (147) (152) (269)
Profitbeforetax 269 517 668
Tax (expense)/credit (52) (58) 68
Profitfortheperiod 217 459 736
Profitfortheperiodisattributableto:
Equity holders of the Parent 206 449 718
Non-controlling interests 11 10 18
Profitfortheperiod 217 459 736
GROUP $
SIX MONTHS ENDED YEAR ENDED
31JAN2014UNAUDITED
RESTATED1 31 JAN 2013
UNAUDITED31 JUL 2013
AUDITED
Earningspershare:
Basic and diluted earnings per share 0.13 0.28 0.44
1 Restated for impact of the non-cash Bonus issue of Shares, issue date 24 April 2013.
The accompanying notes form part of these interim financial statements.
22 FONTERRA INTERIM REPORT 2014

STATEMENT OF COMPREHENSIVE INCOMEFOR THE SIX MONTHS ENDED 31 JANUARY 2014
GROUP $ MILLION
SIX MONTHS ENDED YEAR ENDED
31JAN2014UNAUDITED
31 JAN 2013 UNAUDITED
31 JUL 2013 AUDITED
Profitfortheperiod 217 459 736
Itemsthatmaybereclassifiedsubsequentlytoprofitorloss:
Cash flow hedges:
– Net fair value gains 276 221 116
– Transferred and reported in revenue from sale of goods (179) (185) (317)
– Tax (expense)/credit on cash flow hedges (27) (10) 56
Net investment hedges:
– Net fair value gains/(losses) on hedging instruments 3 6 (5)
– Tax (expense)/credit on net investment hedges (1) (2) 2
Available-for-sale investments:
– Net fair value losses on available-for-sale investments (2) – –
Foreign currency translation losses attributable to equity holders (98) (39) (45)
Foreign currency translation reserve transferred to income statement – (1) (7)
Share of equity accounted investees’ movements in reserves (7) – (1)
Totalitemsthatmaybereclassifiedsubsequentlytoprofitorloss (35) (10) (201)
Itemsthatwillnotbereclassifiedsubsequentlytoprofitorloss:
Foreign currency translation (losses)/gains attributable to non-controlling interests (2) – 1
Totalitemsthatwillnotbereclassifiedsubsequentlytoprofitorloss (2) – 1
Totalothercomprehensiveexpenserecogniseddirectlyinequity (37) (10) (200)
Totalcomprehensiveincomefortheperiod 180 449 536
Attributableto:
Equity holders of the Parent 171 439 517
Non-controlling interests 9 10 19
Totalcomprehensiveincomefortheperiod 180 449 536
The accompanying notes form part of these interim financial statements.
FONTERRA INTERIM REPORT 2014 23

STATEMENT OF FINANCIAl POSITIONAS AT 31 JANUARY 2014
The accompanying notes form part of these interim financial statements.
GROUP $ MILLION
AS AT
NOTES31JAN2014
UNAUDITED31 JAN 2013
UNAUDITED31 JUL 2013
AUDITED
ASSETS
Currentassets
Cash and cash equivalents 812 530 330
Trade and other receivables 2,653 2,441 2,054
Inventories 6,617 4,644 3,078
Tax receivable 32 18 26
Derivative financial instruments 10 203 356 100
Other current assets 60 68 58
Totalcurrentassets 10,377 8,057 5,646
Non-currentassets
Property, plant and equipment 4,917 4,671 4,807
Equity accounted investments 445 458 449
Intangible assets 2,799 2,876 2,858
Deferred tax assets 156 88 217
Available-for-sale investments 10 72 – –
Derivative financial instruments 10 188 142 127
Other non-current assets 317 254 269
Totalnon-currentassets 8,894 8,489 8,727
Totalassets 19,271 16,546 14,373
LIABILITIES
Currentliabilities
Bank overdraft 3 17 1
Borrowings 9 2,107 1,144 1,569
Trade and other payables 1,664 1,476 1,491
Owing to suppliers 4,216 1,599 711
Tax payable 20 20 23
Derivative financial instruments 10 76 256 149
Provisions 47 85 82
Other current liabilities 50 11 52
Totalcurrentliabilities 8,183 4,608 4,078
Non-currentliabilities
Borrowings 9 3,966 3,914 3,108
Derivative financial instruments 10 369 414 346
Provisions 75 87 76
Deferred tax liability 5 112 6
Other non-current liabilities 10 9 11
Totalnon-currentliabilities 4,425 4,536 3,547
Totalliabilities 12,608 9,144 7,625
Netassets 6,663 7,402 6,748
EQUITY
Subscribed equity 5,807 6,282 5,807
Retained earnings 1,192 1,240 1,249
Foreign currency translation reserve (362) (247) (266)
Cash flow hedge reserve (12) 89 (82)
Available-for-sale reserve (2) – –
TotalequityattributabletoequityholdersoftheParent 6,623 7,364 6,708
Non-controlling interests 40 38 40
Totalequity 6,663 7,402 6,748
24 FONTERRA INTERIM REPORT 2014

STATEMENT OF CHANGES IN EQuITyFOR THE SIX MONTHS ENDED 31 JANUARY 2014
ATTRIBUTABLE TO EQUITY HOLDERS OF THE PARENT
GROUP $ MILLIONSUBSCRIBED
EQUITYRETAINED
EARNINGS
FOREIGN CURRENCY
TRANSLATION RESERVE
CASH FLOW HEDGE
RESERVE
AVAILABLE-FOR-SALE
RESERVE TOTAL
NON- CONTROLLING
INTERESTSTOTAL
EQUITY
Asat1August2013 5,807 1,249 (266) (82) – 6,708 40 6,748
Profit for the period – 206 – – – 206 11 217
Other comprehensive (expense)/income for the period – (7) (96) 70 (2) (35) (2) (37)
Totalcomprehensiveincome/(expense)fortheperiod – 199 (96) 70 (2) 171 9 180
Transactionswithequityholdersintheircapacityasequityholders:
Dividend paid to equity holders of the Parent – (256) – – – (256) – (256)
Dividend paid to non-controlling interests – – – – – – (9) (9)
Asat31January2014(unaudited) 5,807 1,192 (362) (12) (2) 6,623 40 6,663
Asat1August2012 5,690 1,078 (211) 63 – 6,620 35 6,655
Profit for the period – 449 – – – 449 10 459
Other comprehensive (expense)/income for the period – – (36) 26 – (10) – (10)
Totalcomprehensiveincome/(expense)fortheperiod – 449 (36) 26 – 439 10 449
Transactionswithequityholdersintheircapacityasequityholders:
Dividend paid to equity holders of the Parent – (287) – – – (287) – (287)
Equity instruments issued 611 – – – – 611 – 611
Equity instruments surrendered (1) – – – – (1) – (1)
Equity transaction costs (18) – – – – (18) – (18)
Dividend paid to non-controlling interests – – – – – – (7) (7)
Asat31January2013(unaudited) 6,282 1,240 (247) 89 – 7,364 38 7,402
Asat1August2012 5,690 1,078 (211) 63 – 6,620 35 6,655
Profit for the year – 718 – – – 718 18 736
Other comprehensive (expense)/income for the year – (1) (55) (145) – (201) 1 (200)
Totalcomprehensiveincome/(expense)fortheyear – 717 (55) (145) – 517 19 536
Transactionswithequityholdersintheircapacityasequityholders:
Dividend paid to equity holders of the Parent – (546) – – – (546) – (546)
Equity instruments issued 611 – – – – 611 – 611
Equity instruments cancelled (475) – – – – (475) – (475)
Equity instruments surrendered (1) – – – – (1) – (1)
Equity transaction costs (18) – – – – (18) – (18)
Dividend paid to non-controlling interests – – – – – – (14) (14)
Asat31July2013(audited) 5,807 1,249 (266) (82) – 6,708 40 6,748
The accompanying notes form part of these interim financial statements.
FONTERRA INTERIM REPORT 2014 25

GROUP $ MILLION
SIX MONTHS ENDED YEAR ENDED
NOTES31JAN2014
UNAUDITED31 JAN 2013
UNAUDITED31 JUL 2013
AUDITED
CashflowsfromoperatingactivitiesProfit before net finance costs and tax 416 669 937Adjustments for:Foreign exchange (gains)/losses (1) 2 1Depreciation and amortisation 273 264 530Movement in provisions 313 223 (17)Other (62) (15) (16)
523 474 498(Increase)/decrease in working capital:Inventories (3,853) (1,857) (43)Trade and other receivables (729) (193) 38Amounts owing to suppliers 3,505 511 (410)Payables and accruals 176 2 68Other movements (24) 9 (8)Total (925) (1,528) (355)Cashgeneratedfromoperations 14 (385) 1,080Net taxes paid (33) (38) (83)Netcashflowsfromoperatingactivities (19) (423) 997CashflowsfrominvestingactivitiesCash was provided from:
– Proceeds from sale of Group entities and other business operations 11 5 5– Proceeds from disposal of property, plant and equipment 5 3 22– Other cash inflows – – 5
Cash was applied to:– Acquisition of Group entities and other business operations (18) (49) (49)– Acquisition of available-for-sale investments (78) – –– Acquisition of property, plant and equipment (394) (316) (701)– Acquisition of intangible assets (47) (74) (147)– Advances made to equity accounted investees – – (2)– Other cash outflows (1) (7) (1)
Netcashflowsfrominvestingactivities (522) (438) (868)CashflowsfromfinancingactivitiesCash was provided from:
– Proceeds from borrowings 9 2,093 1,292 3,188– Proceeds from issue of equity instruments – 652 653– Proceeds from settlement of borrowing derivatives 4 – 3– Interest received 7 18 26– Other cash inflows 2 – –
Cash was applied to:– Interest paid (154) (180) (334)– Repayment of borrowings 9 (638) (1,078) (3,268)– Settlement of borrowing derivatives (10) (9) –– Surrendered/cancelled equity instruments – – (475)– Dividends paid to non-controlling interests (9) (6) (14)– Dividends paid to equity holders of the Parent (256) (287) (546)– Equity transaction costs – (18) (18)– Other cash outflows – – (1)
Netcashflowsfromfinancingactivities 1,039 384 (786)Netincrease/(decrease)incashandcashequivalents 498 (477) (657)Cash and cash equivalents at the beginning of the period 329 991 991Effect of exchange rate changes on cash balances (18) (1) (5)Cashandcashequivalentsattheendoftheperiod 809 513 329Reconciliationofclosingcashbalancestothestatementoffinancialposition:Cash and cash equivalents 812 530 330Bank overdraft (3) (17) (1)Closingcashbalances 809 513 329
CASH FlOW STATEMENTFOR THE SIX MONTHS ENDED 31 JANUARY 2014
The accompanying notes form part of these interim financial statements.
26 FONTERRA INTERIM REPORT 2014

CONDENSED STATEMENT OF SIGNIFICANT ACCOuNTING POlICIESFOR THE SIX MONTHS ENDED 31 JANUARY 2014
a) General informationFonterra Co-operative Group Limited (Fonterra or the Company) is a co-operative company incorporated and domiciled in New Zealand. Fonterra is registered under the Companies Act 1993 and the Co-operative Companies Act 1996, and is an issuer for the purposes of the Financial Reporting Act 1993. Fonterra is also required to comply with the Dairy Industry Restructuring Act 2001.
These consolidated interim financial statements of Fonterra, as at and for the six months ended 31 January 2014, comprise Fonterra and its subsidiaries (together the Group) and the Group’s interest in its equity accounted investees.
The Group is primarily involved in the collection, manufacture and sale of milk and milk derived products and is a profit-oriented entity.
b) Basis of preparationThese consolidated interim financial statements comply with New Zealand Generally Accepted Accounting Practice (NZ GAAP) and have been prepared in accordance with New Zealand Equivalent to International Accounting Standard 34: Interim Financial Reporting. These consolidated interim financial statements also comply with International Accounting Standard 34: Interim Financial Reporting. These statements should be read in conjunction with the consolidated financial statements for the year ended 31 July 2013.
These consolidated interim financial statements are presented in New Zealand dollars ($), which is the Company’s functional currency. All financial information has been rounded to the nearest million, except where otherwise stated.
Interim income tax is calculated based on the best estimate of the full year effective tax rate taking into account profit before tax, the tax effect of distributions to Shareholders and the impact of recognition and de-recognition of deferred tax.
The preparation of interim financial statements requires management to make judgements, estimates and assumptions that affect the application of accounting policies and the reported amounts of assets and liabilities, income and expenses. Actual results may differ from these estimates. In preparing these consolidated interim financial statements, the significant judgements made by management in applying the Group’s accounting policies and the key sources of estimation uncertainty were the same as those applied to the consolidated financial statements for the year ended 31 July 2013.
c) Comparative figuresWhere a change in the presentational format of the financial statements has been made during the period, comparative figures have been restated accordingly. Where material, additional disclosure has been provided in the notes to these consolidated interim financial statements.
d) Accounting for forecast Milk PriceThe accounting policies for the financial statement items affected by the forecast Milk Price are set out below. These accounting policies incorporate clarifications about how the forecast Milk Price is accounted for.
Amounts owing to suppliersAmounts owing to suppliers are amounts Fonterra owe to Shareholder suppliers and contract milk suppliers for the collection of milk, which includes end of season adjustments, offset by amounts owing from Shareholder suppliers for services provided to them by Fonterra.
InventoriesInventories are stated at the lower of cost and net realisable value on a first in first out basis.
Net realisable value is the estimated selling price in the ordinary course of business, less the costs of completion and selling expenses.
The cost of dairy product manufactured from milk supplied in New Zealand is established by using the Milk Price as determined by the Board, applied on a monthly basis, as the cost for raw milk supplied. In the case of manufactured inventories and work in progress, cost includes all direct costs plus that portion of the fixed and variable production overhead incurred in bringing inventories into their present location and condition.
New Zealand sourced cost of milkNew Zealand sourced cost of milk includes the cost of milk supplied by Shareholder suppliers, supplier premiums paid, and the cost of milk purchased from contract suppliers during the financial year. New Zealand sourced cost of milk is recognised in cost of goods sold.
New Zealand sourced cost of milk supplied by Shareholder suppliers comprises the volume of milk solids supplied at the Milk Price as determined by the Board for the relevant season. In making that determination the Board takes into account the Farmgate Milk Price calculated in accordance with the principles set out in the Farmgate Milk Price Manual which is independently audited. The Farmgate Milk Price calculated in accordance with the Farmgate Milk Price Manual broadly represents the maximum sustainable amount an efficient New Zealand based manufacturer of milk powders could afford to pay for milk and still make an adequate return on capital.
The Fonterra Board has announced a forecast Milk Price different than that calculated in accordance with the Farmgate Milk Price Manual. Inventory, amounts owing to suppliers, and New Zealand sourced cost of milk reflect the forecast Milk Price determined by the Board.
e) Accounting policiesThe same accounting policies are followed in these consolidated interim financial statements as were applied in the Group’s financial statements for the year ended 31 July 2013, with the exception of the new or changed policies explained below.
Available-for-sale investmentsAn accounting policy for available-for-sale investments has been adopted, addressing a new category of investment in financial assets for the Group. Available-for-sale investments are non-derivative financial assets that are either designated to this category or not classified as financial assets at fair value through profit or loss, held-to-maturity investments or loans and receivables. Investments in this category are included in non-current assets unless management intends to dispose of the investment within 12 months.
Available-for-sale investments are initially recognised on settlement date, at fair value plus directly attributable transaction costs, and subsequently remeasured to fair value with any resulting gain or loss recognised in other comprehensive income.
On disposal or impairment, any gains or losses in other comprehensive income are reclassified to the income statement.
FONTERRA INTERIM REPORT 2014 27

e) Accounting policies continued
New and amended standards adopted by the GroupThe Group adopted the following new and amended New Zealand Equivalents to International Financial Reporting Standards (NZ IFRS) during the period, with effect from 1 August 2013, none of which had a material impact on the Group’s financial statements:
• NZIFRS10: Consolidated Financial Statements
• NZIFRS11: Joint Arrangements
• NZIFRS12: Disclosure of Interests in Other Entities
• NZIFRS13: Fair Value Measurement
• OtherminorimprovementsandamendmentstoNZIFRSandNZIAS
CONDENSED STATEMENT OF SIGNIFICANT ACCOuNTING POlICIES CONTINUEDFOR THE SIX MONTHS ENDED 31 JANUARY 2014
28 FONTERRA INTERIM REPORT 2014

1 COSTOFGOODSSOLD
GROUP $ MILLION
SIX MONTHS ENDED YEAR ENDED
31JAN2014UNAUDITED
31 JAN 2013 UNAUDITED
31 JUL 2013 AUDITED
Opening inventory 3,078 2,981 2,981
Cost of Milk:
– New Zealand sourced 9,519 5,382 8,635
– Non-New Zealand sourced 714 573 996
Other purchases 3,191 3,306 6,077
Closing inventory (6,617) (4,644) (3,078)
Totalcostofgoodssold 9,885 7,598 15,611
2 PROFITBEFORENETFINANCECOSTSANDTAx
GROUP $ MILLION
SIX MONTHS ENDED YEAR ENDED
31JAN2014UNAUDITED
31 JAN 2013 UNAUDITED
31 JUL 2013 AUDITED
The following items have been included in arriving at profit before net finance costs and tax:
Operating lease expense 34 36 72
Research and development costs 44 40 94
Donations 1 – 2
Research and development grants received from government (2) (2) (4)
Total employee benefits expense 904 892 1,735
Included in employee benefits expense are:
– Contributions to defined contribution plans 30 28 58
3 SEGMENTREPORTING
The Group operates predominantly in the international dairy industry.
The Group has four reportable segments that are defined by product type and geographic area to reflect how the Group’s operations are managed.
The reportable segments presented reflect the Group’s management and reporting structure as viewed by the Fonterra Management Team, which is the Group’s chief operating decision maker.
During the year ended 31 July 2013, transactions between segments were based on estimated market prices. During the six months ended 31 January 2014, transactions between segments were based on estimated market prices adjusted for the difference between the Milk Price calculated in accordance with the Farmgate Milk Price Manual and that determined by the Board.
REPORTABLESEGMENT DESCRIPTION
New Zealand Milk Products (NZMP) Represents the collection, processing and distribution of New Zealand milk, global sales and marketing of New Zealand and non-New Zealand milk products (including North Asia), Global Brands & Nutrition, Co-operative Affairs and Group Services.
Oceania (formerly ANZ) Represents Fast Moving Consumer Goods (FMCG) operations in New Zealand (including export to the Pacific Islands) and all FMCG and Ingredients operations in Australia (including Milk Supply and Manufacturing). It includes foodservice sales in Australia and New Zealand (except for foodservice sales to Quick Service Restaurants), and RD1.
Asia (formerly Asia/AME) Represents FMCG operations in Asia (excluding North Asia), Africa and the Middle East, and foodservice sales in Asia/AME and China. It includes international farming ventures in China.
Latin America (Latam) Represents FMCG operations in Chile and equity accounted investments in South America. It includes international farming ventures in South America.
NOTES TO THE FINANCIAl STATEMENTSFOR THE SIX MONTHS ENDED 31 JANUARY 2014
FONTERRA INTERIM REPORT 2014 29

3 SEGMENTREPORTINGCOnTinUED
a) Segment income
GROUP$MILLION
NZMP OCEANIA ASIA LATAM ELIMINATIONS TOTALGROUP
Segmentincomestatement
Six months ended 31 January 2014 (unaudited)
External revenue 8,157 1,522 1,052 561 – 11,292
Inter-segment revenue 960 303 2 9 (1,274) –
Revenuefromsaleofgoods 9,117 1,825 1,054 570 (1,274) 11,292
Cost of goods sold (8,500) (1,481) (774) (422) 1,292 (9,885)
Segmentgrossprofit 617 344 280 148 18 1,407
Selling and marketing expenses (47) (71) (161) (28) – (307)
Distribution expenses (90) (92) (24) (45) – (251)
Administrative and other operating expenses (343) (148) (96) (28) 14 (601)
Segmentoperatingexpenses (480) (311) (281) (101) 14 (1,159)
Net other operating income 52 11 35 14 (14) 98
Net foreign exchange gains/(losses) 34 – (2) – – 32
Share of profit of equity accounted investees 26 2 – 10 – 38
Segmentearningsbeforenetfinancecostsandtax 249 46 32 71 18 416
Normalisation adjustments (13) – – – – (13)
Normalisedsegmentearningsbeforenetfinancecostsandtax 236 46 32 71 18 403
Normalisation adjustments 13
Finance income 7
Finance costs (154)
Profitbeforetaxfortheperiod 269
Profit before tax for the period includes the following amounts:
Depreciation (165) (37) (8) (14) – (224)
Amortisation (37) (10) (2) – – (49)
Other income from equity accounted investees 1 1 – 14 – 16
Normalisation adjustments consist of the following amounts:
Time value of options (13) – – – – (13)
Totalnormalisationadjustments1 (13) – – – – (13)
Segment asset information:
As at and for the six months ended 31 January 2014
Equity accounted investments 221 33 – 191 – 445
Capital expenditure 252 56 91 18 – 417
1 The $13 million normalisation adjustment relates to net foreign exchange gains.
NOTES TO THE FINANCIAl STATEMENTS CONTINUEDFOR THE SIX MONTHS ENDED 31 JANUARY 2014
30 FONTERRA INTERIM REPORT 2014

GROUP $ MILLION
NZMP OCEANIA ASIA LATAM ELIMINATIONS TOTAL GROUP
Segmentincomestatement
Six months ended 31 January 2013 (unaudited)
External revenue 6,052 1,676 1,048 558 – 9,334
Inter-segment revenue 710 342 1 1 (1,054) –
Revenuefromsaleofgoods 6,762 2,018 1,049 559 (1,054) 9,334
Cost of goods sold (5,965) (1,595) (687) (411) 1,060 (7,598)
Segmentgrossprofit 797 423 362 148 6 1,736
Selling and marketing expenses (42) (79) (172) (27) – (320)
Distribution expenses (95) (107) (19) (40) – (261)
Administrative and other operating expenses (305) (171) (89) (27) 9 (583)
Segmentoperatingexpenses (442) (357) (280) (94) 9 (1,164)
Net other operating income 32 6 20 9 (9) 58
Net foreign exchange gains/(losses) 10 1 (2) – – 9
Share of profit of equity accounted investees 25 1 – 4 – 30
Segmentearningsbeforenetfinancecostsandtax 422 74 100 67 6 669
Normalisation adjustments (10) 24 – – – 14
Normalisedsegmentearningsbeforenetfinancecostsandtax 412 98 100 67 6 683
Normalisation adjustments (14)
Finance income 16
Finance costs (168)
Profitbeforetaxfortheperiod 517
Profit before tax for the period includes the following amounts:
Depreciation (164) (38) (7) (13) – (222)
Amortisation (33) (7) (2) – – (42)
Other income from equity accounted investees 1 1 – 10 – 12
Normalisation adjustments consist of the following amounts:
Costs associated with closure of Cororooke plant in Australia1 – 24 – – – 24
Time value of options2 (10) – – – – (10)
Totalnormalisationadjustments (10) 24 – – – 14
Segment asset information:
As at and for the six months ended 31 January 2013
Equity accounted investments 215 29 – 214 – 458
Capital expenditure 302 91 21 13 – 427
1 Of the $24 million normalisation adjustment, $21 million related to administrative and other operating expenses and $3 million to cost of goods sold.
2 The $10 million normalisation adjustment relates to net foreign exchange gains. This was not presented as a normalisation adjustment in the 31 January 2013 interim financial statements, but has been presented as such in these interim financial statements for consistency with the Group’s approach from 2014 onwards.
FONTERRA INTERIM REPORT 2014 31

3 SEGMENTREPORTINGCOnTinUED
a) Segment income CONTINUED
GROUP $ MILLION
NZMP OCEANIA ASIA LATAM ELIMINATIONS TOTAL GROUP
Segmentincomestatement
Year ended 31 July 2013 (audited)
External revenue 12,358 3,101 2,057 1,127 – 18,643
Inter-segment revenue 1,559 644 2 8 (2,213) –
Revenuefromsaleofgoods 13,917 3,745 2,059 1,135 (2,213) 18,643
Cost of goods sold (12,666) (2,989) (1,357) (832) 2,233 (15,611)
Segmentgrossprofit 1,251 756 702 303 20 3,032
Selling and marketing expenses (89) (150) (324) (59) – (622)
Distribution expenses (188) (203) (42) (81) – (514)
Administrative and other operating expenses (615) (324) (153) (51) 23 (1,120)
Segmentoperatingexpenses (892) (677) (519) (191) 23 (2,256)
Net other operating income 69 11 24 24 (23) 105
Foreign exchange losses (7) – – – – (7)
Share of profit of equity accounted investees 59 3 – 1 – 63
Segmentearningsbeforenetfinancecostsandtax 480 93 207 137 20 937
Normalisation adjustments 14 49 2 – – 65
Normalisedsegmentearningsbeforenetfinancecostsandtax 494 142 209 137 20 1,002
Normalisation adjustments (65)
Finance income 25
Finance costs (294)
Profitbeforetaxfortheyear 668
Profit before tax for the year includes the following amounts:
Depreciation (320) (83) (14) (27) – (444)
Amortisation (68) (13) (4) (1) – (86)
Other income from equity accounted investees 3 2 – 24 – 29
Normalisation adjustments consist of the following amounts:
Costs associated with closure of Cororooke plant in Australia – 30 – – – 30
Restructuring costs associated with the Group Strategy Right-Sizing 14 19 5 – – 38
Other – – (3) – – (3)
Totalnormalisationadjustments1 14 49 2 – – 65
Segment asset information:
As at and for the year ended 31 July 2013
Equity accounted investments 218 31 – 200 – 449
Capital expenditure 683 144 70 29 – 926
1 Of the $65 million normalisation adjustments, $47 million related to operating expenses and $18 million to cost of goods sold.
NOTES TO THE FINANCIAl STATEMENTS CONTINUEDFOR THE SIX MONTHS ENDED 31 JANUARY 2014
32 FONTERRA INTERIM REPORT 2014

b) Revenue
GROUP $ MILLION
SIX MONTHS ENDED YEAR ENDED
31JAN2014UNAUDITED
31 JAN 2013 UNAUDITED
31 JUL 2013 AUDITED
Entity wide products and services:
Consumer goods 2,263 2,406 4,717
Ingredients and other revenue 9,029 6,928 13,926
Revenuefromsaleofgoods 11,292 9,334 18,643
GROUP $ MILLION
EUROPE CHINAREST OF
ASIA AUSTRALIANEW
ZEALAND USAREST OF WORLD TOTAL
Geographical segment external revenue:
Sixmonthsended31January2014 (unaudited) 584 3,149 2,755 847 1,054 609 2,294 11,292
Six months ended 31 January 2013 (unaudited) 513 1,283 2,553 1,019 968 704 2,294 9,334
Year ended 31 July 2013 (audited) 1,096 2,500 5,216 1,850 1,986 1,415 4,580 18,643
Revenue is allocated to geographical segments on the basis of the destination of the goods sold.
c) Non-current assets
GROUP $ MILLION
NZMP OCEANIA ASIA LATAM TOTAL
NEW ZEALAND
REST OF WORLD
NEW ZEALAND AUSTRALIA
Geographical segment reportable non-current assets:
Asat31January2014 (unaudited) 4,201 357 1,377 1,051 1,052 512 8,550
As at 31 January 2013 (unaudited) 4,044 289 1,467 1,024 864 571 8,259
As at 31 July 2013 (audited) 4,199 303 1,350 1,047 940 544 8,383
GROUP $ MILLION
AS AT
31JAN2014UNAUDITED
31 JAN 2013 UNAUDITED
31 JUL 2013 AUDITED
Reconciliation of geographical segment non-current assets to total non-current assets:
Geographical segment non-current assets 8,550 8,259 8,383
Deferred tax asset 156 88 217
Derivative financial instruments 188 142 127
Totalnon-currentassets 8,894 8,489 8,727
FONTERRA INTERIM REPORT 2014 33

4 CONTINGENTLIABILITIES
In the normal course of business, Fonterra, its subsidiaries and equity accounted investees are exposed to claims, legal proceedings and arbitrations that may in some cases result in costs to the Group.
In early August 2013, Fonterra publicly announced a potential food safety issue with three batches of Whey Protein Concentrate (WPC80) produced at the Hautapu manufacturing site and initiated a precautionary product recall.
In late August 2013, the New Zealand Government confirmed that the Clostridium samples found in WPC80 were not Clostridium botulinum and were not toxigenic, meaning the consumers of products containing the relevant batches of WPC80 were never in danger from Clostridium botulinum.
In January 2014, Danone formally initiated legal proceedings against Fonterra in relation to the WPC80 precautionary recall.
Fonterra is working through the detail of Danone’s claims. Based on current information available and the claims made to date, Fonterra will vigorously defend its position. Uncertainty exists regarding the outcome of the proceedings. Fonterra has provided $11 million which represents the maximum contractual liability to Danone.
The warranty claims made by the purchaser of the Group’s former Western Australia dairy business are no longer outstanding, as at 31 January 2014.
The Directors believe that these claims, legal proceedings and arbitrations have been adequately provided for and disclosed by the Group and that there are no additional legal proceedings or arbitrations that are pending at the date of these interim financial statements that require provision or disclosure.
The Group has no other contingent liabilities as at 31 January 2014 (31 January 2013: nil; 31 July 2013: nil).
5 SUBSCRIBEDEQUITYINSTRUMENTS
Subscribed equity instruments include Co-operative Shares and Units in the Fonterra Shareholders’ Fund (the Fund).
Co-operativeShares,includingSharesheldwithintheGroup
CO-OPERATIVE SHARES (THOUSANDS)
Balanceat1August2013 1,597,834
Shares issued –
Shares surrendered –
Balanceat31January2014(unaudited) 1,597,834
Balanceat1August2012 1,501,784
Shares issued prior to the launch of TAF 25,886
Shares surrendered prior to the launch of TAF (99)
TotalnumberofSharesonissuepriortothelaunchofTAF 1,527,571
Shares issued on the launch of TAF 89,809
Balanceat31January2013(unaudited) 1,617,380
Balanceat1August2012 1,501,784
Shares issued prior to the launch of TAF 25,886
Shares surrendered prior to the launch of TAF (99)
TotalnumberofSharesonissuepriortothelaunchofTAF 1,527,571
Shares issued on the launch of TAF 89,809
Bonus issue1 40,427
Shares cancelled2 (59,973)
Balanceat31July2013(audited) 1,597,834
1 On 27 February 2013, Fonterra announced a non-cash Bonus issue of one Share for every 40 Shares held. The Bonus issue increased the number of Shares on issue by 40.4 million. The record date for the Bonus issue was 12 April 2013 and the issue date was 24 April 2013.
2 Shares cancelled following the Supply Offer (refer to Fonterra Shareholder suppliers Supply Offer below).
Co-operative Shares may only be held by a Shareholder supplying milk to the Company in a Season (Shareholder supplier) and Fonterra Farmer Custodian Limited (the Custodian). Rights attaching to Co-operative Shares include:
– voting rights when backed by milk supply1;
– the right to receive the share-backed milk price on each kilogram of milksolids produced by the Shareholder supplier1;
– rights to any distributions declared by the Board; and
– rights to share in any surplus on liquidation of the Company.
1 These rights are also attached to vouchers when backed by milk supply (subject to limits).
NOTES TO THE FINANCIAl STATEMENTS CONTINUEDFOR THE SIX MONTHS ENDED 31 JANUARY 2014
34 FONTERRA INTERIM REPORT 2014

5 SUBSCRIBEDEQUITYINSTRUMENTSCOnTinUED
Shareholder suppliersThe Company maintains a Share Standard that requires a Shareholder supplier to hold one Co-operative Share1 for each kilogram of milksolids supplied to the Company by that Shareholder supplier. This is measured as an average over the three preceding Seasons2 production (excluding milk supplied under contract supply in that Season). Shareholder suppliers are permitted to hold more or fewer Co-operative Shares than required by the Share Standard in certain circumstances1. Shareholder suppliers supplying under contract must hold at least 1,000 Co-operative Shares.
In addition to Co-operative Shares held under the Share Standard, Shareholder suppliers are able to hold further Co-operative Shares up to 100 per cent of production (where production is defined as the minimum number of Co-operative Shares a Shareholder supplier is required to hold under the Share Standard). No Shareholder supplier (including its related parties) is allowed to hold interests in Co-operative Shares, not backed by milk supply, exceeding five per cent of the total number of Co-operative Shares on issue.
New Shareholder suppliers have a number of alternatives in meeting the requirements of the Share Standard1. This includes purchasing the required Shares over a three year period, with one third of the required holding of Co-operative Shares to be held in the first Season, two thirds in the second Season, with the Share Standard to be met in the third Season.
Voting rights in the Company are dependent on milk supply supported by Co-operative Shares3. A Shareholder supplier is entitled on a poll or postal vote, to one vote per 1,000 kilograms of milksolids if that Shareholder supplier holds a Co-operative Share3 for each of those kilograms of milksolids. The amount of milksolids that support voting rights are measured at 31 May, the Season end date4. As at the Season end date, 31 May 2013, the aggregate milksolids eligible for voting was 1,424,000,000 kilograms of milksolids (31 May 2012: 1,463,000,000 kilograms of milksolids).
Shareholder suppliers are able to buy and sell Co-operative Shares directly on the Fonterra Shareholders’ Market. Shareholders may elect to sell the Economic Rights of some of their Co-operative Shares to the Fund, subject to an individual limit set by the Board within an overall individual limit set out in the Company’s constitution. On the sale of an Economic Right of a Co-operative Share to the Fund, a Shareholder supplier transfers the legal title to the Co-operative Share to the Custodian. Where the Co-operative Share transferred was backed by milk supply, the Shareholder supplier is issued a voucher by the Custodian (subject to limits).
1 The Fonterra Board may permit the Share Standard to be satisfied through the holding of both Co-operative Shares and vouchers.2 This requirement commenced from 1 June 2013. Prior to this date, the requirement was based on kilograms of milksolids supplied for the previous Season.3 These rights are also attached to vouchers when backed by milk supply (subject to limits).4 Aggregate milksolids eligible for voting at Season end date are adjusted for Shareholder suppliers who have joined the Company or are no longer supplying milk to the
Company in the period between the Season end date and the record date for the meeting at which the vote is to be held.
Fonterra Shareholder suppliers Supply OfferIn May 2013, Fonterra provided its Shareholder suppliers with an opportunity to sell Economic Rights of Shares backed by milk supply to the Fund, and to sell to Fonterra the resulting Units (Supply Offer).
Under this Supply Offer, Shareholder suppliers sold the Economic Rights of 60 million Co-operative Shares to the Custodian, resulting in the issuance of 60 million Units in the Fund. Fonterra acquired the 60 million Units via the New Zealand Stock Exchange (NZX) and immediately redeemed these, resulting in the transfer of 60 million Co-operative Shares to Fonterra by the Custodian. Fonterra subsequently cancelled these Shares. As a result of this redemption, the Supply Offer did not ultimately affect the total number of Units on issue.
The CustodianThe Custodian holds legal title of Co-operative Shares of which the Economic Rights have been sold to the Fund on trust for the benefit of the Fund. At 31 January 2014, 106,414,814 Co-operative Shares (31 January 2013: 95,689,327; 31 July 2013: 107,969,310) were legally owned by the Custodian, on trust for the benefit of the Fund.
UNITS UNITS (THOUSANDS)
Balanceat1August2013 107,969
Units issued 5,680
Units surrendered (7,234)
Balanceat31January2014(unaudited) 106,415
Balanceat1August20121 –
Units issued 95,734
Units surrendered (45)
Balanceat31January2013(unaudited) 95,689
Balanceat1August20121 –
Units issued2 169,470
Units surrendered3 (61,501)
Balanceat31July2013(audited) 107,969
1 The Fund commenced issuing Units on 30 November 2012.2 Includes 60 million Units issued under the Supply Offer.3 Includes 60 million Units redeemed by Fonterra under the Supply Offer.
FONTERRA INTERIM REPORT 2014 35

5 SUBSCRIBEDEQUITYINSTRUMENTSCOnTinUED
Units are issued by the Fund. In respect of the Co-operative Shares which it holds, the Custodian is required under trust to pass to the Fund the following rights of those Co-operative Shares:
– the right to receive any dividends declared by the Fonterra Board;
– the right to any other distributions made in respect of Co-operative Shares; and
– rights to share in any surplus on liquidation of Fonterra.
The Fund then attaches these rights to Units it issues.
A Shareholder supplier who holds a Unit can require the Fund to effectively exchange it for a Co-operative Share held by the Custodian. The Custodian relinquishes legal ownership of that Co-operative Share (provided that completion of this transaction would not put that Shareholder supplier in breach of the limits on Co-operative Share ownership explained above). A Unit is cancelled by the Fund, as all Units in the Fund must be backed by a Co-operative Share held by the Custodian.
Dividendspaid
All Co-operative Shares, including those held by the Custodian on trust for the benefit of the Fund, are eligible to receive a dividend if declared by the Board. On 24 September 2013, the Board of Directors declared a final dividend of 16.0 cents per Share (totalling $256 million), paid on 18 October 2013 to all Co-operative Shares on issue at 10 October 2013.
6 PROPERTY,PLANTANDEQUIPMENT
GROUP $ MILLION
SIX MONTHS TO YEAR ENDED
31JAN2014UNAUDITED
31 JAN 2013 UNAUDITED
31 JUL 2013 AUDITED
Additions 370 355 776
Disposals (5) (9) (22)
Capital commitments 324 267 189
7 EQUITYACCOUNTEDINvESTMENTS
The ownership interest of the following entities is 50 per cent or less and the Group is not considered to exercise a controlling interest. These entities are therefore accounted for as equity accounted investees.
OWNERSHIP INTERESTS (%)
AS AT
SIGNIFICANT EQUITY ACCOUNTED INVESTEES COUNTRY OF INCORPORATION 31JAN2014 31 JAN 2013 31 JUL 2013
DPA Manufacturing Holdings Limited1 Bermuda 50 50 50
Dairy Partners Americas Brasil Limitada1 Brazil 50 50 50
Ecuajugos S.A.1 Ecuador 50 50 50
DMV Fonterra Excipients GmbH & Co KG1 Germany 50 50 50
Dairy Industries (Jamaica) Limited1 Jamaica 50 50 50
DairiConcepts, L.P.1 USA 50 50 50
DairiConcepts Management, L.L.C.1 USA 50 50 50
Lacven Corporation1 Barbados 25 25 25
International Nutritionals Limited New Zealand 50 50 50
1 Balance date 31 December.
8 BUSINESSCOMBINATIONS
There were no material business combinations during any of the periods presented.
NOTES TO THE FINANCIAl STATEMENTS CONTINUEDFOR THE SIX MONTHS ENDED 31 JANUARY 2014
36 FONTERRA INTERIM REPORT 2014

9 BORROWINGS
GROUP $ MILLION
SIX MONTHS TO YEAR ENDED
31JAN2014UNAUDITED
31 JAN 2013 UNAUDITED
31 JUL 2013 AUDITED
Openingbalance 4,677 4,949 4,949NewissuesBank loans 1,146 1,228 2,386Finance leases 18 – –Commercial paper 679 64 834Medium-term notes 250 – –
2,093 1,292 3,220RepaymentsBank loans (141) (557) (1,937)Finance leases (4) (3) (4)Commercial paper (490) (200) (611)Medium-term notes (3) (318) (751)
(638) (1,078) (3,303)OthermovementsAmortisation of discount 6 2 18Changes in fair value (14) (30) (95)Changes due to foreign currency translation (51) (77) (112)
(59) (105) (189)Closingbalance 6,073 5,058 4,677
Included within the statement of financial position as follows:Current borrowings 2,107 1,144 1,569Non-current borrowings 3,966 3,914 3,108Totalborrowings 6,073 5,058 4,677
GROUP $ MILLION
AS AT
31JAN2014UNAUDITED
31 JAN 2013 UNAUDITED
31 JUL 2013 AUDITED
Netinterestbearingdebtposition
Total borrowings 6,073 5,058 4,677
Cash and cash equivalents (812) (530) (330)
Interest bearing advances included in other non-current assets (113) (125) (121)
Bank overdraft 3 17 1
Netinterestbearingdebt 5,151 4,420 4,227Value of derivatives used to manage changes in hedged risks and other foreign exchange movements on debt 219 464 240Economicnetinterestbearingdebt1 5,370 4,884 4,467
1 Economic net interest bearing debt reflects the effect of debt hedging in place at balance date.
GROUP
AS AT
31JAN2014UNAUDITED
31 JAN 2013 UNAUDITED
31 JUL 2013 AUDITED
Nettangibleassetspersecurity2
$ per listed debt security on issue 3.67 4.30 3.70
$ per equity instruments on issue 2.42 2.80 2.43
Listed debt securities on issue (million) 1,053 1,053 1,053Equity instruments on issue (million) 1,598 1,617 1,598
2 Net tangible assets represents total assets less total liabilities less intangible assets.
FONTERRA INTERIM REPORT 2014 37

10 FAIRvALUEANDFINANCIALINSTRUMENTS
Financial assets are classified on initial recognition into the following categories: at fair value through profit or loss, held-to-maturity investments, loans and receivables, and available-for-sale. Financial liabilities are classified as either fair value through profit or loss, or financial liabilities measured at amortised cost. The classification depends on the purpose for which the financial assets and liabilities were acquired. Management determines the classification of its financial assets and liabilities at initial recognition. The Group has not had any held-to-maturity investments in the periods covered by these financial statements.
FinancialassetsandfinancialliabilitiesatfairvaluethroughprofitorlossFinancial assets and liabilities in this category are either designated as fair value through profit or loss, or classified as held for trading. All derivatives are classified as held for trading except when they are in cash flow, fair value, or net investment hedge relationships. Other financial assets and financial liabilities may be designated at fair value through profit or loss where this eliminates an accounting mismatch, or where they are managed on a fair value basis.
Financialassetsheldasavailable-for-saleinvestmentsFinancial assets in this category are listed equity investments that are intended to be held for an indefinite period of time. The fair value of financial assets in this category is based on quoted prices in active markets.
ValuationtechniquesfordeterminingfairvaluesAll derivative instruments are measured and recognised at fair value. The fair value is the price that would be received to sell an asset or paid to transfer a liability in an orderly transaction between market participants at the measurement date.
Financial instruments are either priced with reference to a quoted market price for that instrument or by using a valuation model. Where the fair value is calculated using a valuation model, the methodology used is to calculate the expected cash flows under the terms of each specific contract and then discount these values back to the present value. These models use as their basis independently sourced market parameters including, for example, interest rate yield curves, commodity prices, option volatilities and currency rates. The calculation of fair value of any financial instrument may also require adjustment to reflect the impact of credit risk.
FairvaluedisclosuresThe fair values of financial liabilities, where the carrying value and fair value differ, are calculated by reference to quoted market prices where that is possible, and otherwise are calculated by discounting future cash flows at current market interest rates adjusted for estimated credit margins for similar financial instruments.
Set out below is a comparison of the carrying amounts and fair values of financial instruments as at 31 January 2014:
GROUP$MILLION
ASAT31JAN2014UNAUDITED
LOANSANDRECEIvABLES
OTHERAMORTISED
COSTHELDFORTRADING
AvAILABLE-FOR-SALE
DERIvATIvESINHEDGE
RELATIONSHIPSCARRYING
vALUEFAIR
vALUE
Financialassets
Cash and cash equivalents 812 – – – – 812 812
Trade and other receivables (excluding prepayments) 2,593 – – – – 2,593 2,593
Available-for-sale investments – – – 72 – 72 72
Long-term advances 113 – – – – 113 111
Derivative assets – current – – 115 – 88 203 203
Derivative assets – non-current – – 76 – 112 188 188
Totalfinancialassets 3,518 – 191 72 200 3,981 3,979
Financialliabilities
Bank overdraft – (3) – – – (3) (3)
Owing to suppliers – (4,216) – – – (4,216) (4,216)
Total payables and accruals (excluding employee entitlements) – (1,442) – – – (1,442) (1,442)
Borrowings
− Commercial paper – (625) – – – (625) (625)
− Bank loans – (1,689) – – – (1,689) (1,689)
− Finance leases – (186) – – – (186) (203)
− Retail bonds – (947) – – – (947) (978)
− Medium-term notes – (2,591) – – – (2,591) (2,815)
− Capital notes – (35) – – – (35) (34)
Derivative liabilities – current – – (33) – (43) (76) (76)
Derivative liabilities – non-current – – (54) – (315) (369) (369)
Totalfinancialliabilities – (11,734) (87) – (358) (12,179) (12,450)
Totalfinancialinstruments 3,518 (11,734) 104 72 (158) (8,198) (8,471)
NOTES TO THE FINANCIAl STATEMENTS CONTINUEDFOR THE SIX MONTHS ENDED 31 JANUARY 2014
38 FONTERRA INTERIM REPORT 2014
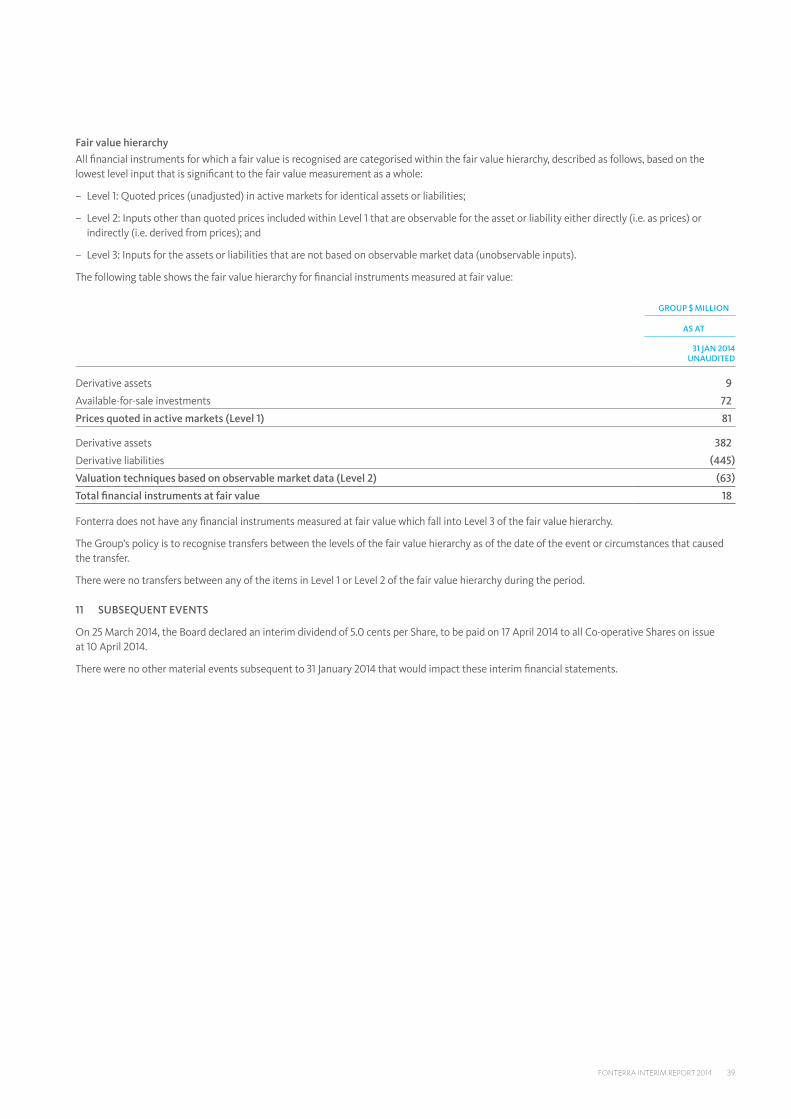
Fairvaluehierarchy
All financial instruments for which a fair value is recognised are categorised within the fair value hierarchy, described as follows, based on the lowest level input that is significant to the fair value measurement as a whole:
– Level 1: Quoted prices (unadjusted) in active markets for identical assets or liabilities;
– Level 2: Inputs other than quoted prices included within Level 1 that are observable for the asset or liability either directly (i.e. as prices) or indirectly (i.e. derived from prices); and
– Level 3: Inputs for the assets or liabilities that are not based on observable market data (unobservable inputs).
The following table shows the fair value hierarchy for financial instruments measured at fair value:
GROUP$MILLION
ASAT
31JAN2014UNAUDITED
Derivative assets 9
Available-for-sale investments 72
Pricesquotedinactivemarkets(Level1) 81
Derivative assets 382
Derivative liabilities (445)
valuationtechniquesbasedonobservablemarketdata(Level2) (63)
Totalfinancialinstrumentsatfairvalue 18
Fonterra does not have any financial instruments measured at fair value which fall into Level 3 of the fair value hierarchy.
The Group’s policy is to recognise transfers between the levels of the fair value hierarchy as of the date of the event or circumstances that caused the transfer.
There were no transfers between any of the items in Level 1 or Level 2 of the fair value hierarchy during the period.
11 SUBSEQUENTEvENTS
On 25 March 2014, the Board declared an interim dividend of 5.0 cents per Share, to be paid on 17 April 2014 to all Co-operative Shares on issue at 10 April 2014.
There were no other material events subsequent to 31 January 2014 that would impact these interim financial statements.
FONTERRA INTERIM REPORT 2014 39

NON-GAAP MEASuRES
Fonterra uses several non-GAAP measures when discussing financial performance. For further details and definitions of non-GAAP measures used by Fonterra, refer to the Glossary on page 41. These are non-GAAP measures and are not prepared in accordance with NZ IFRS.
Management believes that these measures provide useful information as they provide valuable insight on the underlying performance of the business. They may be used internally to evaluate the underlying performance of business units and to analyse trends. These measures are not uniformly defined or utilised by all companies. Accordingly, these measures may not be comparable with similarly titled measures used by other companies. Non-GAAP financial measures should not be viewed in isolation nor considered as a substitute for measures reported in accordance with NZ IFRS.
Reconciliations for the NZ IFRS measures to certain non-GAAP measures referred to by Fonterra are detailed below:
ReconciliationfromtheNZIFRSmeasureofprofitfortheperiodtoFonterra’snormalisedEBITDA
GROUP $ MILLION
SIX MONTHS ENDED YEAR ENDED
31JAN2014 31 JAN 2013 31 JUL 2013
Profitfortheperiod 217 459 736
Add: Depreciation 224 222 444
Add: Amortisation 49 42 86
Add: Net finance costs 147 152 269
Add/(less): Taxation expense/(credit) 52 58 (68)
TotalEBITDA 689 933 1,467
Add: Costs associated with closure of Cororooke plant in Australia – 24 30
Add: Costs associated with Group Strategy Right-Sizing – – 38
Less: Time value of options1 (13) (10) –
Less: Other – – (3)
Totalnormalisationadjustments (13) 14 65
NormalisedEBITDA 676 947 1,532
1 This was not presented as a normalisation adjustment in previous periods. Previous periods have been restated to incorporate time value of options as a normalisation adjustment for consistency with the Group’s approach from 2014 onwards.
ReconciliationfromtheNZIFRSmeasureofprofitfortheperiodtoFonterra’snormalisedEBIT
GROUP $ MILLION
SIX MONTHS ENDED YEAR ENDED
31JAN2014 31 JAN 2013 31 JUL 2013
Profitfortheperiod 217 459 736
Add: Net finance costs 147 152 269
Add/(less): Taxation expense/(credit) 52 58 (68)
TotalEBIT 416 669 937
(Less)/add: Normalisation adjustments (as detailed above) (13) 14 65
TotalnormalisedEBIT 403 683 1,002
ReconciliationfromtheNZIFRSmeasureofprofitfortheperiodtoFonterra’snormalisedearningspershare
GROUP $ MILLION
SIX MONTHS ENDED YEAR ENDED
31JAN2014 31 JAN 2013 31 JUL 2013
Profitfortheperiod 217 459 736
(Less)/add: Normalisation adjustments (as detailed above) (13) 14 65
Add/(less): Tax on normalisation adjustments 4 (4) (17)
Totalnormalisedearnings 208 469 784
Less: Share attributable to non-controlling interests (11) (10) (20)
Net normalised earnings attributable to equity holders of the Parent 197 459 764
Weighted average number of Shares (thousands of Shares) 1,597,834 1,553,615 1,615,311
Normalisedearningspershare($) 0.12 0.30 0.47
40 FONTERRA INTERIM REPORT 2014

GlOSSARy
NON-GAAPMEASURES
Fonterra refers to non-GAAP financial measures throughout the Interim Report, and these measures are not prepared in accordance with NZ IFRS. The definitions below explain how Fonterra calculates the non-GAAP measures referred to throughout the Interim Report.
Averagenetassets is calculated as net interest bearing debt and total equity less deferred tax averaged over a rolling 13 month period.
Constantcurrency means a measure that eliminates the effect of exchange rate movements. Constant currency variances are calculated by taking the current period financial measure in local currency less the prior period financial measure in local currency and dividing this by prior period financial measure in local currency using the prior period local currency to the New Zealand dollar exchange rate.
Contributionmargin is calculated as segmental gross profit less distribution, selling and marketing expenses.
EBIT means earnings before interest and tax (EBIT) and is calculated as profit for the period before net finance costs and tax.
EBITmargin is calculated as profit for the period before net finance costs and tax and divided by revenue.
EBITDA means earnings before interest, tax, depreciation and amortisation and is calculated as profit for the period before net finance costs, tax, depreciation and amortisation.
Economicdebttodebtplusequityratio
is calculated as net interest bearing debt divided by net interest bearing debt plus equity. Net interest bearing debt includes the effect of debt hedging, and equity excludes the cash flow hedge reserve.
FarmgateMilkPrice means the base price that Fonterra pays for milk supplied to it in New Zealand for a season. The season refers to the 12 month milk season of 1 June to 31 May.
Nettangibleassets means total assets less total liabilities less intangible assets.
Normalisationadjustments means transactions that are unusual by nature or size so that they materially reduce the ability of users of the financial results to understand the ongoing performance of the Group or operating segment to which they relate. Unusual transactions by nature are the result of a specific event or set of circumstances that are outside the control of the business, or relate to the major acquisitions or disposals of an asset/group of assets or business. Unusual transactions by size are those that are unusually large in a particular accounting period that is not expected to repeat regularly to the same extent in future periods.
NormalisedEBIT means profit for the period before net finance costs, tax and normalisation adjustments.
NormalisedEBITmargin means profit for the period before net finance costs, tax and normalisation adjustments divided by revenue.
NormalisedEBITDA means profit for the period before net finance costs, tax, depreciation, amortisation and normalisation adjustments.
Normalisedsegmentearnings means segmental profit for the period before depreciation, amortisation, net finance costs, tax expense, and normalisation adjustments.
Payout means the total cash payment to Shareholder suppliers. It is the sum of the Farmgate Milk Price (kgMS) and the dividend per share. Both of these components have established policies and procedures in place on how these are determined.
Retentions means net profit after tax attributable to Shareholder suppliers divided by the number of Shares at 31 May, less dividend per share.
ReturnonCapitalEmployed means normalised EBIT divided by capital employed. Capital employed is calculated as monthly average net assets excluding net debt, derivatives, taxes, and investments (other than equity accounted investments).
Segmentearnings means segmental profit for the period before net finance costs, tax and normalisation adjustments.
FONTERRA INTERIM REPORT 2014 41

DIRECTORyFONTERRA CO-OPERATIVE GROUP LIMITED
PRIVATE BAG 92032 AUCKLAND 1142 NEW ZEALAND
64 9 374 9000 (PHONE) 64 9 374 9001 (FAX)
SHAREHOLDER AND SUPPLIER SERVICES FREEPHONE 0800 65 65 68
FOR GLOBAL LOCATIONS VISIT WWW.FONTERRA.COM

This document is printed on an environmentally responsible paper produced using elemental chlorine free (ECF)FSC® certified mixed source pulp, sourced from well managed and legally harvested forests, and manufactured under the strict ISO14001 environmental management system. COVER PHOTO: Fonterra Darfield site.