fonterra financial statements & statutory information · 2018-11-30 · fonterra annual report...
TRANSCRIPT
FONTERRAFINANCIAL STATEMENTS &STATUTORY INFORMATION
For the Year Ended 31 July 2012

FONTERRA ANNUAL REPORT 2012 1
PAGE
Directors’ Statement 2
Income Statement 3
Statement of Comprehensive Income 4
Statement of Financial Position 5
Statement of Changes in Equity 6
Cash Flow Statement 7
Statement of Significant Accounting Policies 8
Notes to the Financial Statements 14
Independent Auditors’ Report 55
Statutory Information 56
CONTENTS
2 FONTERRA ANNUAL REPORT 2012
The Directors of Fonterra Co-operative Group Limited (Fonterra or the Company) are pleased to present to Shareholders the financial statements for Fonterra and its subsidiaries (together the Group) and the Group’s interest in its equity accounted investees for the year ended 31 July 2012.
The Directors are responsible for presenting financial statements for each financial year which give a true and fair view of the financial position for the Company and Group and of the financial performance and cash flows for that period.
The Directors consider the financial statements of the Company and Group have been prepared using accounting policies which have been consistently applied and supported by reasonable judgements and estimates, and that all relevant financial reporting and accounting standards have been followed.
The Directors believe that proper accounting records have been kept which enable, with reasonable accuracy, the determination of the financial position of the Company and Group and facilitate compliance of the financial statements with the Financial Reporting Act 1993.
The Directors consider that they have taken adequate steps to safeguard the assets of the Company and Group, and to prevent and detect fraud and other irregularities.
The Directors hereby approve and authorise for issue the financial statements for the year ended 31 July 2012 presented on pages 3 to 54. For and on behalf of the Board:
DAVID JACKSON
Director
25 September 2012
SIR HENRY VAN DER HEYDEN
Chairman
25 September 2012
DIRECTORS’ STATEMENT FOR THE YEAR ENDED 31 JULY 2012

FONTERRA ANNUAL REPORT 2012 3
The accompanying notes form part of these financial statements.
INCOME STATEMENTFOR THE YEAR ENDED 31 JULY 2012
GROUP $ MILLION PARENT $ MILLION
NOTES 31 JULY 2012 31 JULY 2011 31 JULY 2012 31 JULY 2011
Revenue from sale of goods 19,769 19,871 9,050 10,257
Dividends received – – 114 495
Total revenue 19,769 19,871 9,164 10,752
Cost of goods sold 1 (16,721) (16,861) (9,050) (10,257)
Gross profit 3,048 3,010 114 495
Other operating income 132 165 56 53
Selling and marketing expenses (568) (596) (10) (12)
Distribution expenses (501) (487) – –
Administrative expenses (784) (700) (241) (218)
Other operating expenses (385) (336) (73) (66)
Net foreign exchange losses 3 (7) (91) – –
Operating profit/(loss) 2 935 965 (154) 252
Finance income 4 30 32 263 375
Finance costs 4 (340) (438) (287) (372)
Net finance (costs)/income (310) (406) (24) 3
Share of profit of equity accounted investees 52 63 – –
Profit/(loss) before tax 677 622 (178) 255
Tax (expense)/credit 5 (53) 149 226 183
Profit for the year 624 771 48 438
Profit for the year is attributable to:
Shareholders of the Parent 609 754 48 438
Non-controlling interests 15 17 – –
Profit for the year 624 771 48 438
GROUP $
31 JULY 2012 31 JULY 2011
Earnings per share:
Basic and diluted earnings per share 25 0.42 0.55
4 FONTERRA ANNUAL REPORT 2012
The accompanying notes form part of these financial statements.
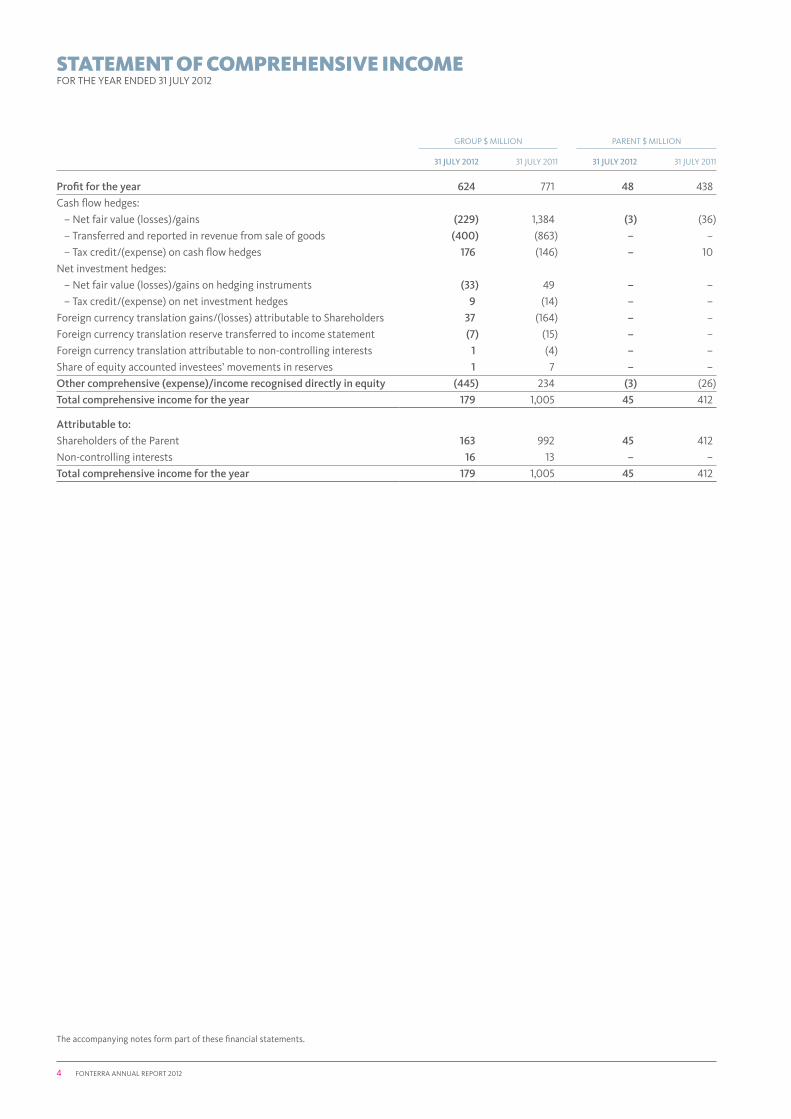
STATEMENT OF COMPREHENSIVE INCOMEFOR THE YEAR ENDED 31 JULY 2012
GROUP $ MILLION PARENT $ MILLION
31 JULY 2012 31 JULY 2011 31 JULY 2012 31 JULY 2011
Profit for the year 624 771 48 438
Cash flow hedges:
– Net fair value (losses)/gains (229) 1,384 (3) (36)
– Transferred and reported in revenue from sale of goods (400) (863) – –
– Tax credit/(expense) on cash flow hedges 176 (146) – 10
Net investment hedges:
– Net fair value (losses)/gains on hedging instruments (33) 49 – –
– Tax credit/(expense) on net investment hedges 9 (14) – –
Foreign currency translation gains/(losses) attributable to Shareholders 37 (164) – –
Foreign currency translation reserve transferred to income statement (7) (15) – –
Foreign currency translation attributable to non-controlling interests 1 (4) – –
Share of equity accounted investees’ movements in reserves 1 7 – –
Other comprehensive (expense)/income recognised directly in equity (445) 234 (3) (26)
Total comprehensive income for the year 179 1,005 45 412
Attributable to:
Shareholders of the Parent 163 992 45 412
Non-controlling interests 16 13 – –
Total comprehensive income for the year 179 1,005 45 412
FONTERRA ANNUAL REPORT 2012 5
The accompanying notes form part of these financial statements.
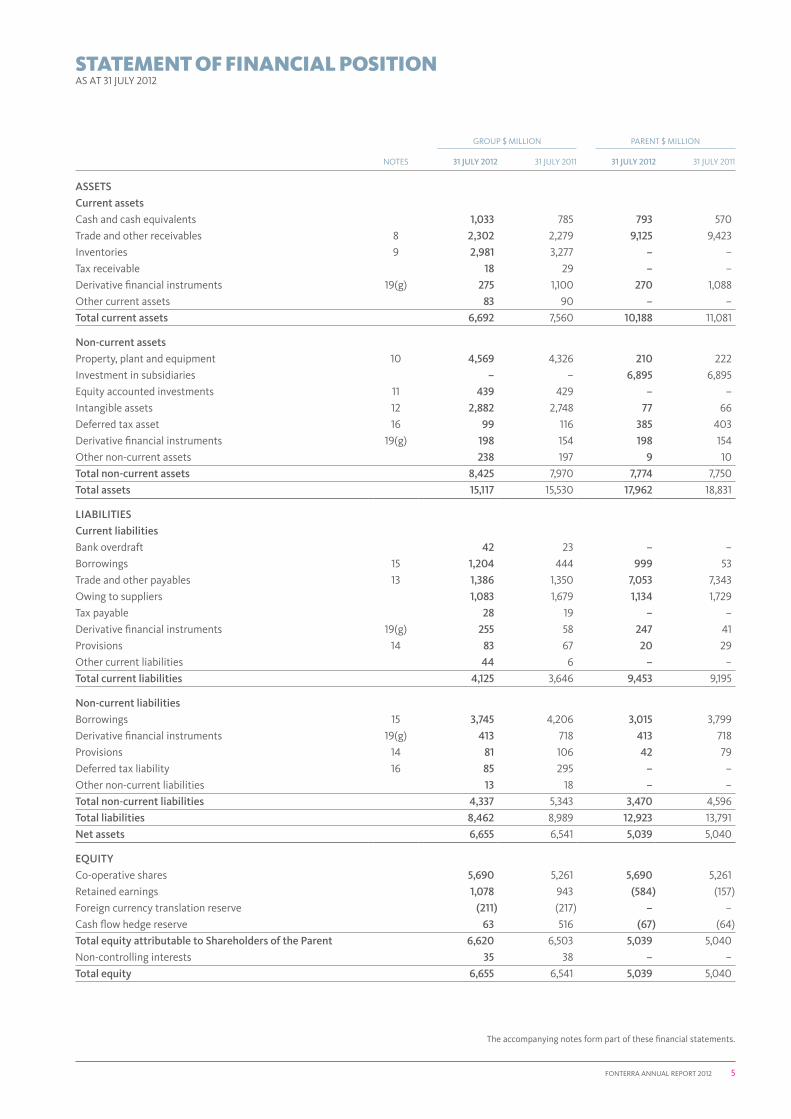
STATEMENT OF FINANCIAL POSITIONAS AT 31 JULY 2012
GROUP $ MILLION PARENT $ MILLION
NOTES 31 JULY 2012 31 JULY 2011 31 JULY 2012 31 JULY 2011
ASSETS
Current assets
Cash and cash equivalents 1,033 785 793 570
Trade and other receivables 8 2,302 2,279 9,125 9,423
Inventories 9 2,981 3,277 – –
Tax receivable 18 29 – –
Derivative financial instruments 19(g) 275 1,100 270 1,088
Other current assets 83 90 – –
Total current assets 6,692 7,560 10,188 11,081
Non-current assets
Property, plant and equipment 10 4,569 4,326 210 222
Investment in subsidiaries – – 6,895 6,895
Equity accounted investments 11 439 429 – –
Intangible assets 12 2,882 2,748 77 66
Deferred tax asset 16 99 116 385 403
Derivative financial instruments 19(g) 198 154 198 154
Other non-current assets 238 197 9 10
Total non-current assets 8,425 7,970 7,774 7,750
Total assets 15,117 15,530 17,962 18,831
LIABILITIES
Current liabilities
Bank overdraft 42 23 – –
Borrowings 15 1,204 444 999 53
Trade and other payables 13 1,386 1,350 7,053 7,343
Owing to suppliers 1,083 1,679 1,134 1,729
Tax payable 28 19 – –
Derivative financial instruments 19(g) 255 58 247 41
Provisions 14 83 67 20 29
Other current liabilities 44 6 – –
Total current liabilities 4,125 3,646 9,453 9,195
Non-current liabilities
Borrowings 15 3,745 4,206 3,015 3,799
Derivative financial instruments 19(g) 413 718 413 718
Provisions 14 81 106 42 79
Deferred tax liability 16 85 295 – –
Other non-current liabilities 13 18 – –
Total non-current liabilities 4,337 5,343 3,470 4,596
Total liabilities 8,462 8,989 12,923 13,791
Net assets 6,655 6,541 5,039 5,040
EQUITY
Co-operative shares 5,690 5,261 5,690 5,261
Retained earnings 1,078 943 (584) (157)
Foreign currency translation reserve (211) (217) – –
Cash flow hedge reserve 63 516 (67) (64)
Total equity attributable to Shareholders of the Parent 6,620 6,503 5,039 5,040
Non-controlling interests 35 38 – –
Total equity 6,655 6,541 5,039 5,040

6 FONTERRA ANNUAL REPORT 2012
The accompanying notes form part of these financial statements.
STATEMENT OF CHANGES IN EQUITYFOR THE YEAR ENDED 31 JULY 2012
ATTRIBUTABLE TO SHAREHOLDERS OF THE PARENT
GROUP $ MILLIONCO-OPERATIVE
SHARESRETAINED
EARNINGS
FOREIGN CURRENCY
TRANSLATION RESERVE
CASH FLOW HEDGE
RESERVE TOTAL
NON- CONTROLLING
INTERESTSTOTAL
EQUITY
As at 1 August 2010 5,016 547 (73) 141 5,631 36 5,667
Profit for the year – 754 – – 754 17 771
Other comprehensive income/(expense) for the year – 7 (144) 375 238 (4) 234
Total comprehensive income/(expense) for the year – 761 (144) 375 992 13 1,005
Transactions with Shareholders in their capacity as Shareholders:
Dividends paid to Shareholders of the Parent – (365) – – (365) – (365)
Co-operative shares issued 404 – – – 404 – 404
Co-operative shares surrendered (159) – – – (159) – (159)
Dividends paid to non-controlling interests – – – – – (11) (11)
As at 31 July 2011 5,261 943 (217) 516 6,503 38 6,541
As at 1 August 2011 5,261 943 (217) 516 6,503 38 6,541
Profit for the year – 609 – – 609 15 624
Other comprehensive income/(expense) for the year – 1 6 (453) (446) 1 (445)
Total comprehensive income/(expense) for the year – 610 6 (453) 163 16 179
Transactions with Shareholders in their capacity as Shareholders:
Dividends paid to Shareholders of the Parent – (475) – – (475) – (475)
Co-operative shares issued 584 – – – 584 – 584
Co-operative shares surrendered (155) – – – (155) – (155)
Dividends paid to non-controlling interests – – – – – (19) (19)
As at 31 July 2012 5,690 1,078 (211) 63 6,620 35 6,655
PARENT $ MILLIONCO-OPERATIVE
SHARESRETAINED
EARNINGS
CASH FLOW HEDGE
RESERVETOTAL
EQUITY
As at 1 August 2010 5,016 (230) (38) 4,748
Profit for the year – 438 – 438
Other comprehensive expense for the year – – (26) (26)
Total comprehensive income/(expense) for the year – 438 (26) 412
Transactions with Shareholders in their capacity as Shareholders:
Dividends paid to Shareholders – (365) – (365)
Co-operative shares issued 404 – – 404
Co-operative shares surrendered (159) – – (159)
As at 31 July 2011 5,261 (157) (64) 5,040
As at 1 August 2011 5,261 (157) (64) 5,040
Profit for the year – 48 – 48
Other comprehensive expense for the year – – (3) (3)
Total comprehensive income/(expense) for the year – 48 (3) 45
Transactions with Shareholders in their capacity as Shareholders:
Dividends paid to Shareholders of the Parent – (475) – (475)
Co-operative shares issued 584 – – 584
Co-operative shares surrendered (155) – – (155)
As at 31 July 2012 5,690 (584) (67) 5,039

FONTERRA ANNUAL REPORT 2012 7
The accompanying notes form part of these financial statements.
GROUP $ MILLION PARENT $ MILLION
NOTES 31 JULY 2012 31 JULY 2011 31 JULY 2012 31 JULY 2011
Cash flows from operating activities
Cash was provided from:
− Receipts from customers 20,045 19,490 9,104 10,311
− Dividends received 37 63 – –
− Tax received 11 5 – –
Cash was applied to:
− Payments to creditors and employees (7,905) (7,528) (299) (280)
− Payments for milk purchased (10,721) (10,780) (9,593) (9,632)
− Tax paid (77) (66) – –
Net cash flows from operating activities 17 1,390 1,184 (788) 399
Cash flows from investing activities
Cash was provided from:
− Proceeds from disposal of property, plant and equipment 11 9 – –
− Proceeds from settlement of net investment hedges 26 20 – –
− Proceeds from sale of Group entities and other business operations – 184 – –
− Net loans from Group entities – – 1,435 507
Cash was applied to:
− Acquisition of property, plant and equipment (673) (488) (19) (25)
− Acquisition of intangible assets (184) (135) (25) (27)
− Outflows on settlement of net investment hedges (2) (23) – –
− Acquisition of Group entities and other business operations – (55) – –
− Advances made to equity accounted investees (4) – – –
Net cash flows from investing activities (826) (488) 1,391 455
Cash flows from financing activities
Cash was provided from:
− Proceeds from borrowings 2,215 3,648 1,206 1,535
− Proceeds from issue of Co-operative shares 505 368 505 368
− Proceeds for Co-operative shares not yet issued 44 25 44 25
− Proceeds from settlement of borrowing derivatives 13 21 – –
− Interest received 31 32 18 20
Cash was applied to:
− Interest paid (406) (397) (309) (353)
− Repayment of borrowings (2,097) (3,548) (1,214) (1,699)
− Outflows on settlement of borrowing derivatives (5) (46) – –
− Surrender of Co-operative shares (155) (160) (155) (160)
− Dividends paid to non-controlling interests (19) (11) – –
− Dividends paid to Shareholders of the Parent (475) (365) (475) (365)
Net cash flows from financing activities (349) (433) (380) (629)
Net increase in cash and cash equivalents 215 263 223 225
Cash and cash equivalents at the beginning of the year 762 534 570 345
Effect of exchange rate changes on cash balances 14 (35) – –
Cash and cash equivalents at the end of the year 991 762 793 570
Reconciliation of closing cash balances to the statement of financial position:
Cash and cash equivalents 1,033 785 793 570
Bank overdraft (42) (23) – –
Closing cash balances 991 762 793 570
Parent undertakes financing activities for the Group. As a result receipts and payments from and to subsidiaries for operating and financing activities (including dividends) are settled on a net basis and presented in investing activities as net loans from Group entities.
CASH FLOW STATEMENTFOR THE YEAR ENDED 31 JULY 2012

8 FONTERRA ANNUAL REPORT 2012
STATEMENT OF SIGNIFICANT ACCOUNTING POLICIESFOR THE YEAR ENDED 31 JULY 2012
a) General informationFonterra Co-operative Group Limited (Fonterra, Parent, the Co-operative or the Company) is a co-operative company incorporated and domiciled in New Zealand. Fonterra is registered under the Companies Act 1993 and the Co-operative Companies Act 1996, and is an issuer for the purposes of the Financial Reporting Act 1993. Fonterra is also required to comply with the Dairy Industry Restructuring Act 2001.
The consolidated financial statements are for the Company, its subsidiaries (together referred to as the Group) and the Group’s interests in its equity accounted investees.
The Group is primarily involved in the collection, manufacture and sale of milk and milk derived products and is a profit-oriented entity.
On 30 June 2010, Shareholders approved changes to the Company’s constitution that will allow the Board to take steps to implement changes to Fonterra’s capital structure that would permit trading of shares among Shareholders. This was re-affirmed in the Special Meeting held on 25 June 2012. Refer to Note 7 for further information.
b) Basis of preparationThese financial statements comply with New Zealand Generally Accepted Accounting Practice (NZ GAAP), and have been prepared in accordance with New Zealand Equivalents to International Financial Reporting Standards (NZ IFRS), as appropriate for profit-oriented entities. These financial statements also comply with International Financial Reporting Standards (IFRS).
These financial statements are prepared on a historical cost basis except for derivative financial instruments and the hedged risks on certain debt instruments, which are recognised at their fair values.
These financial statements are presented in New Zealand dollars ($), which is the Company’s functional and presentation currency, and rounded to the nearest million.
The preparation of financial statements requires management to make judgements, estimates and assumptions that affect the application of accounting policies and the reported amounts of assets, liabilities, income and expenses. Actual results may differ from these estimates. Estimates and judgements are continually evaluated and are based on historical experience and other factors, including expectations of future events that are believed to be reasonable under the circumstances. Revisions of accounting estimates are recognised in the period in which the estimates are revised and in any future periods affected.
Information about significant areas of estimation uncertainty, requiring judgement in applying accounting policies, that have the most significant effect on the amounts recognised in the financial statements, are described in the following notes:
– Note 14 Provisions
– Note 19 Financial risk management – fair value of certain financial instruments
c) Basis of consolidation
Subsidiaries
Subsidiaries are entities controlled by the Group. Control exists when the Group has the power to govern the financial and operating policies of an entity so as to obtain benefits from its activities. The existence and effect of potential voting rights that are currently exercisable or convertible are considered when assessing whether the Group controls another entity. Subsidiaries are fully consolidated from the date that control is transferred to the Group. They are de-consolidated from the date control ceases.
The cost of an acquisition is measured as the fair value of the assets given, equity instruments issued and liabilities incurred or assumed at the date of exchange. Acquisition-related costs are expensed as incurred. On an acquisition-by-acquisition basis, the Group recognises any non-controlling interest in the acquiree either at fair value or at the non-controlling interest’s proportionate share of the acquiree’s net assets. The excess of the consideration transferred, the amount of any non-controlling interest in the acquiree and the acquisition-date fair value of any previous equity interest in the acquiree, over the fair value of the Group’s share of the identifiable net assets acquired, is recorded as goodwill. If the cost of acquisition is less than the fair value of the net assets acquired, the difference is recognised in the income statement.
Non-controlling interests are allocated their share of profit for the year in the income statement and are presented within equity in the statement of financial position, separately from equity attributable to Shareholders. The effects of all transactions with non-controlling interests that change the Group’s ownership interest but do not result in a change in control are recorded in equity. Where control is lost, the remaining interest in the investment is re-measured to fair value and any surplus or deficit arising from that re-measurement is recognised in the income statement.
Equity accounted investees (associates and jointly controlled entities)
Associates are those entities in which the Group has significant influence, but not control, over the financial and operating policies. Jointly controlled entities are those entities over whose activities the Group has joint control, established by contractual agreement and requiring unanimous consent for strategic, financial and operating decisions. Equity accounted investees are initially recognised at cost (including any goodwill identified on acquisition). Subsequent to initial recognition they are accounted for using the equity method in the consolidated financial statements.
The consolidated financial statements include the Group’s share of the profit or loss after tax of equity accounted investees, after adjustments to align to the accounting policies of the Group, from the date that significant influence or joint control commences until the date that significant influence or joint control ceases. When the Group’s share of losses exceeds its interest in an equity accounted investee, the carrying amount of that interest is reduced to nil and no further losses are recognised except to the extent the Group has an obligation or has made payments on behalf of the investee. Dividends receivable from equity accounted investees reduce the carrying amount of the investment.

FONTERRA ANNUAL REPORT 2012 9
The Group determines at each reporting date whether there is any objective evidence that its investments in equity accounted investees are impaired. If this is the case, the Group calculates the amount of impairment as the difference between the recoverable amount of the investee and its carrying value, and recognises that amount in the income statement.
Transactions eliminated on consolidation
Intra-group transactions, balances, and any unrealised income and expenses arising from intra-group transactions, are eliminated in preparing the consolidated financial statements. Unrealised gains arising from transactions with equity accounted investees are eliminated against the investment to the extent of the Group’s interest in the investee. Unrealised losses are eliminated in the same way as unrealised gains, but only to the extent that there is no evidence of impairment.
d) Foreign currency
Foreign currency transactions
Foreign currency transactions are translated into the respective functional currencies of Group entities using the exchange rate at the dates of transactions. Foreign exchange gains and losses resulting from the settlement of such transactions and from the translation, using the exchange rates at the balance date, of monetary assets and liabilities denominated in foreign currencies are recognised in the income statement, except when deferred in other comprehensive income as qualifying cash flow or qualifying net investment hedges.
Translation of the financial statements into the presentation currency
Where the Company’s presentation currency differs from the functional currency of an entity, the assets and liabilities of the operation are translated from the functional currency into the presentation currency at the exchange rates at the balance date. The income and expenses of these entities are translated at rates approximating the exchange rates at the dates of the transactions. Exchange differences arising on the translation of the financial statements of these entities and of borrowings and other currency instruments designated as hedges of such investments are recognised directly in the foreign currency translation reserve. When an entity is partially disposed of or sold, the exchange differences that were recorded in equity are recognised in the income statement as part of the gain or loss on sale.
e) Financial assets and liabilitiesA financial asset or liability is recognised if the Group becomes a party to the contractual provisions of the asset or liability. A financial asset or liability is recognised initially at its fair value plus, in the case of a financial asset or liability not at fair value through profit or loss, transaction costs that are directly attributable to the acquisition or issue of the instrument. Financial assets and liabilities carried at fair value through profit or loss are initially recognised at fair value and transaction costs are expensed in the income statement.
After initial recognition, financial assets are measured at their fair values except for loans and receivables and held-to-maturity investments, which are measured at amortised cost less any provision for impairment. After initial recognition, financial liabilities are measured at amortised cost method except for financial liabilities at fair value through profit or loss.
In the separate financial statements of the Parent, investments in subsidiaries are stated at cost, less any impairment.
Financial assets are derecognised if the Group’s contractual rights to the cash flows from the financial assets expire or if the Group transfers the financial asset to another party without retaining control or substantially all risks and rewards of the asset. Financial liabilities are derecognised if the Group’s obligations specified in the contract expire or are discharged or cancelled.
Financial assets and financial liabilities are offset and the net amount is reported in the statement of financial position when there is a legally enforceable right to offset the recognised amounts and there is an intention to settle on a net basis.
Financial assets are classified on initial recognition into the following categories: at fair value through profit or loss, held-to-maturity investments, loans and receivables, and available-for-sale. Financial liabilities are classified as either fair value through profit or loss, or financial liabilities measured at amortised cost. The classification depends on the purpose for which the financial assets and liabilities were acquired. Management determines the classification of its financial assets and liabilities at initial recognition. The Group has not had any held-to-maturity investments or available-for-sale financial assets in the periods covered by these financial statements.
Financial assets and financial liabilities at fair value through profit or loss
Financial assets and liabilities in this category are either designated as fair value through profit or loss, or classified as held for trading. All derivatives are classified as held for trading except when they are in cash flow, fair value, or net investment hedge relationships (refer to accounting policy j) below). Other financial assets and financial liabilities may be designated at fair value through profit or loss where this eliminates an accounting mismatch, or where they are managed on a fair value basis.
Loans and receivables
Loans and receivables are non-derivative financial assets with fixed or determinable payments that are not quoted in an active market. Trade and other receivables are classified as loans and receivables.
Financial liabilities measured at amortised cost
Financial liabilities measured at amortised cost are non-derivative financial liabilities with fixed or determinable payments that are not quoted in an active market. Trade and other payables, and debt instruments are classified as financial liabilities measured at amortised cost.
Financial guarantee contracts
Financial guarantee contracts are those contracts that require the issuer to make specific payments to reimburse the holder for a loss it incurs if a specified debtor fails to make payment when due in accordance with the original or modified terms of a debt instrument. Financial guarantee contracts are recognised initially as a liability at fair value, adjusted for transaction costs that are directly attributable to the issuance of the guarantee. Subsequently, the liability is measured at the higher of the best estimate of the expenditure required to settle the present obligation at the balance date, and the amount initially recognised less cumulative amortisation.

10 FONTERRA ANNUAL REPORT 2012
STATEMENT OF SIGNIFICANT ACCOUNTING POLICIES CONTINUEDFOR THE YEAR ENDED 31 JULY 2012
f) Cash balancesCash balances include cash and cash equivalents comprising cash on hand, deposits held at call with banks, other short term highly liquid investments with original maturities of three months or less, and bank overdrafts.
g) Trade receivablesTrade receivables are recognised initially at fair value and subsequently measured at amortised cost using the effective interest method, less provision for impairment.
h) BorrowingsBorrowings are recognised initially at fair value, net of transaction costs incurred. Borrowings are subsequently measured at amortised cost using the effective interest method, with the hedged risks on certain debt instruments measured at fair value. Changes in fair value of those hedged risks are recognised in the income statement, except where they relate to borrowings classified as net investment hedges and are recorded directly in other comprehensive income.
Borrowings are classified as current liabilities unless the Group has an unconditional right to defer settlement of the liability for at least 12 months after balance date.
i) Trade and other payablesTrade and other payables are carried at amortised cost.
j) Derivative financial instruments and hedging activitiesThe Group uses derivative financial instruments within predetermined policies and limits in order to reduce its exposure to fluctuations in foreign currency exchange rates and interest rates.
Derivatives are initially recognised at fair value on the date a derivative contract is entered into (the trade date) and transaction costs are expensed immediately. They are subsequently remeasured to their fair value. The method of recognising the resulting gain or loss depends on whether the derivative is designated as a hedging instrument, and if so, the nature of the item being hedged. The Group designates certain derivatives as either:
– hedges of the fair value of recognised assets or liabilities, or a firm commitment (fair value hedges);
– hedges of a particular risk associated with a recognised liability or a highly probable forecast transaction (cash flow hedges); or
– hedges of a net investment in a foreign operation (net investment hedges).
The Group documents, at the inception of the transaction, the relationship between hedging instruments and hedged items, as well as its risk management objectives and strategy for undertaking various hedging transactions. The Group also documents its assessment, both at hedge inception and on an ongoing basis, of whether the derivatives used in hedging transactions are highly effective in offsetting changes in fair values or cash flows of hedged items.
The full fair value of a hedging derivative is classified as a non-current asset or liability when maturity of the hedged item exceeds 12 months. It is classified as a current asset or liability when the maturity of the hedged item is less than 12 months.
Fair value hedges
Changes in the fair value of derivatives that are designated and qualify as fair value hedges are recognised in the income statement, together with any changes in the fair value of the hedged asset or liability attributable to the hedged risk.
If the hedge no longer meets the criteria for hedge accounting, the adjustment to the carrying amount of a hedged item for which the effective interest method is used is amortised and recognised in the income statement over the period to maturity.
Cash flow hedges
The effective portion of changes in the fair value of derivatives that are designated and qualify as cash flow hedges are recognised directly in other comprehensive income. The gain or loss relating to the ineffective portion is recognised immediately in the income statement. Amounts accumulated in equity are transferred to the income statement when the hedged item affects profit or loss.
When a hedging instrument expires or is sold, or when a hedge no longer meets the criteria for hedge accounting, any cumulative gain or loss existing in equity at that time remains in equity and is recognised when the forecast transaction is ultimately recognised in the income statement. When a forecast transaction is no longer expected to occur, the cumulative gain or loss that was reported in equity is recognised immediately in the income statement.
When the forecast transaction that is hedged results in the recognition of a non-financial asset (e.g. inventory or property, plant and equipment) the gains and losses previously deferred in equity are transferred from equity and included in the initial measurement of the cost of the asset.
Net investment hedges
Hedges of net investments in foreign operations are accounted for similarly to cash flow hedges. Any gain or loss on the hedging instrument relating to the effective portion of the hedge is recognised in other comprehensive income. The gain or loss relating to the ineffective portion is recognised immediately in the income statement.
Gains and losses accumulated in equity are included in the income statement when all or part of a foreign operation is disposed of or sold.
k) InventoriesInventories are stated at the lower of cost and net realisable value on a first in first out basis.
Net realisable value is the estimated selling price in the ordinary course of business, less the costs of completion and selling expenses.
The cost of dairy product manufactured from milk supplied in New Zealand is established by using the monthly Farmgate Milk Price as the cost for raw milk supplied. In the case of manufactured inventories and work in progress, cost includes all direct costs plus that portion of the fixed and variable production overhead incurred in bringing inventories into their present location and condition.

FONTERRA ANNUAL REPORT 2012 11
l) Property, plant and equipment
Owned assets
Items of property, plant and equipment are measured at cost less accumulated depreciation and impairment losses. Cost includes the purchase consideration and those costs directly attributable to bringing the asset to the location and condition necessary for its intended use. Costs cease to be capitalised when substantially all the activities necessary to bring an asset to the location and condition for its intended use are complete. Subsequent costs are included in the asset’s carrying amount or recognised as a separate asset, as appropriate, only when it is probable that future economic benefits associated with the item will flow to the Group and the cost of the item can be measured reliably. The carrying amount of any replaced part is derecognised. All other repairs and maintenance are charged to the income statement during the financial period in which they are incurred.
The assets’ residual values and useful lives are reviewed and adjusted, if appropriate, at each financial year end.
Gains and losses on disposals are determined by comparing the proceeds with the carrying amount, and are recognised in the income statement.
Depreciation
Depreciation is calculated on a straight line basis to allocate the cost of the asset, less any residual value, over its estimated useful life. The range of estimated useful lives for each class of property, plant and equipment is as follows:
– Land Indefinite
– Buildings and leasehold improvements 15 – 50 years
– Plant, vehicles and equipment 3 – 25 years
Leased assets
Leases of property, plant and equipment where the Group assumes substantially all the risks and rewards of ownership are classified as finance leases.
Assets under finance leases are recognised as property, plant and equipment in the statement of financial position. They are recognised initially at their fair value, or if lower, at the present value of the minimum lease payments. A corresponding liability is established and each lease payment allocated between the liability and interest expense using the effective interest method. The assets recognised are depreciated on the same basis as equivalent property, plant and equipment.
Leases that are not finance leases are classified as operating leases and the assets are not recognised on the Group’s statement of financial position. Operating lease payments are recognised as an expense on a straight line basis over the term of the lease.
m) Intangible assets
Goodwill
Goodwill represents the excess of the cost of an acquisition over the fair value of the Group’s share of the net identifiable assets of the acquired subsidiary or equity accounted investee at the date of acquisition. Goodwill on acquisitions of subsidiaries is included
in intangible assets. Goodwill on acquisitions of equity accounted investees is included in equity accounted investments and is tested for impairment as part of the overall balance.
Goodwill is carried at cost less accumulated impairment losses. Impairment losses on goodwill are not reversed. Goodwill is tested annually for impairment or whenever events or changes in circumstances indicate that the carrying amount may not be recoverable. Gains and losses on the disposal of an entity include the carrying amount of goodwill relating to the entity sold.
Goodwill is allocated to cash-generating units for the purpose of impairment testing. The allocation is made to those cash-generating units or groups of cash-generating units that are expected to benefit from the business combination in which the goodwill arose.
Brands and other identifiable intangible assets
Brands and other intangible assets purchased by the Group are recognised if the asset is controlled through custody or legal rights and could be sold separately from the rest of the business. Brands and other intangible assets have a combination of both indefinite and finite useful lives. Items with indefinite useful lives are tested for impairment annually or whenever there is an indication that an asset may be impaired and carried at cost less accumulated impairment losses. Items with finite useful lives are carried at cost less accumulated amortisation and accumulated impairment losses, and are amortised on a straight line basis to allocate the cost over their licence period (18 – 25 years). Assets that have been impaired are reviewed for possible reversal of impairment at each balance date.
Computer software
Acquired computer software licences are capitalised on the basis of the costs incurred to acquire and bring to use the specific software.
Costs associated with developing or maintaining computer software programmes are recognised as an expense as incurred. Costs that are directly associated with the development of identifiable and unique software products controlled by the Group, and that will generate economic benefits exceeding costs beyond one year, are recognised as intangible assets. Costs include the employee costs incurred as a result of developing software and an appropriate portion of relevant overheads.
Computer software licences and development costs recognised as assets are amortised over their estimated useful lives, being three to ten years.
Research and development expenditure
All research expenditure is recognised in the income statement as incurred. Significant development expenditure is recognised as an asset when it can be demonstrated that the commercial production of the material or product, or use of the process, will commence.
Development expenditure recognised as an asset is stated at cost and amortised over the period of expected benefits on a straight line basis, not exceeding five years. Amortisation begins at the time that commercial production or use of the process commences. All other development expenditure is recognised in the income statement as incurred.

12 FONTERRA ANNUAL REPORT 2012
STATEMENT OF SIGNIFICANT ACCOUNTING POLICIES CONTINUEDFOR THE YEAR ENDED 31 JULY 2012
n) Impairment of financial assets
Assets carried at amortised cost
The Group assesses at the end of each reporting period whether there is objective evidence that a financial asset or group of financial assets is impaired. A financial asset or a group of financial assets is impaired and impairment losses are incurred only if there is objective evidence of impairment as a result of one or more events that occurred after the initial recognition of the asset (a ‘loss event’) and that loss event (or events) has an impact on the estimated future cash flows of the financial asset or group of financial assets that can be reliably estimated.
The criteria that the Group uses to determine that there is objective evidence of an impairment loss include:
– significant financial difficulty of the customer;
– a breach of contract, such as a default or delinquency in payments;
– for economic or legal reasons relating to the customer’s financial difficulty, granting to the customer a concession that the Group would not otherwise consider;
– it becomes probable that the customer will enter bankruptcy or other financial reorganisation.
The amount of the loss is measured as the difference between the asset’s carrying amount and the present value of estimated future cash flows (excluding future credit losses that have not been incurred) discounted at the financial asset’s original effective interest rate and is recognised in the income statement.
If, in a subsequent period, the amount of the impairment loss decreases and the decrease can be related objectively to an event occurring after the impairment was recognised (such as an improvement in the debtor’s credit rating), the reversal of the previously recognised impairment loss is recognised in the income statement.
o) Impairment of non-financial assetsIntangible assets that have an indefinite useful life are not subject to amortisation and are tested for impairment annually or whenever there is an indication that an asset may be impaired. Other assets are tested for impairment whenever events or changes in circumstances indicate that the carrying amount may not be recoverable. If the estimated recoverable amount of an asset is less than its carrying amount, the asset is written down to its estimated recoverable amount and an impairment loss is recognised in the income statement. The recoverable amount of an asset is the higher of its fair value less costs to sell and value in use. For the purposes of assessing impairment, assets are grouped at the lowest level for which there are separately identifiable cash inflows (cash-generating units).
Non-financial assets, other than goodwill, that have been impaired are reviewed for possible reversal of the impairment at each balance date.
p) ProvisionsProvisions are recognised only in those circumstances where the Group has a present legal or constructive obligation as a result of a past event, when it is probable that an outflow of resources will be required to settle the obligation, and a reliable estimate of the amount can be made.
Provisions are measured at the present value of the expenditures expected to be required to settle the obligation using a pre-tax discount rate that reflects current market assessments of the time value of money and the risks specific to the obligation. The increase in the provision due to the passage of time is recognised as a finance cost in the income statement.
q) Co-operative sharesCo-operative shares are classified as equity. Incremental costs directly attributable to the issue of co-operative shares are recognised as a deduction from equity.
r) Revenue recognitionRevenue from the sale of goods is recognised at the fair value of the consideration received or receivable, net of returns, discounts and allowances. Revenue is recognised when the amount of revenue can be reliably measured, significant risks and rewards of ownership of the inventory items have passed to the buyer, recovery of the consideration is probable, the associated costs and possible return of goods can be estimated reliably, and there is no continuing management involvement with the goods.
Dividend income is recognised when the right to receive payment is established.
s) New Zealand sourced cost of milkNew Zealand sourced cost of milk includes milk supplied by Shareholders, Supplier Premiums paid, and milk purchased from contract suppliers during the financial year. New Zealand sourced cost of milk is recognised in cost of goods sold.
New Zealand sourced cost of milk supplied by Shareholders comprises the volume of milk solids supplied at the Farmgate Milk Price for the relevant season. The Farmgate Milk Price for each season is calculated in accordance with the principles set out in the Milk Price Manual and is independently audited. The Farmgate Milk Price broadly represents the maximum sustainable amount a New Zealand based manufacturer of milk powders could afford to pay for milk and still make an adequate return on capital.
Supplier Premiums are paid for speciality milks such as winter milk and colostrum.
t) DividendsAll shares are eligible to receive dividends if declared by the Board. Dividends are recognised as a liability in the Group’s financial statements in the period in which they are declared by the Board.
u) Employee benefitsEmployee benefits primarily include short term employee benefits, long term employee benefits and defined contribution pension plans.
Short term employee benefits include salaries, wages, annual leave and sick leave, and are expensed on an undiscounted basis as the relevant service is provided.
Long term employee benefits are measured at the present value of expected payments required using an appropriate pre-tax discount rate.
Contributions to defined contribution pension plans are recognised as an expense in the period they are due. The Group has no further payment obligations once the contributions have been paid.

FONTERRA ANNUAL REPORT 2012 13
v) Finance income and costsFinance income comprises interest income on funds on deposit. Interest income is recognised as it accrues using the effective interest method.
Finance costs comprise interest expense on borrowings, unwinding of the discount on provisions, gains and losses on the revaluation of debt hedges and the hedged risks on certain debt instruments, and gains and losses relating to translation forward points on forward exchange contracts where revaluation gains and losses on those contracts are included within finance costs. Interest expense and the unwinding of the discount on provisions are recognised in the income statement using the effective interest method. Finance costs directly attributable to the acquisition, construction or production of a qualifying asset are capitalised as part of the cost of that asset.
w) TaxTax expense comprises current and deferred tax. Tax expense, including the tax consequences of distributions to Shareholders is recognised in the income statement. The tax consequences of distributions to Shareholders are recognised in the year to which the distribution relates. Other than distributions to Shareholders, tax consequences of items recognised directly in equity are also recognised in equity.
Current tax is the expected tax payable or receivable on the taxable income or loss for the year, using tax rates enacted or substantively enacted at the balance date, and any adjustment to tax payable or receivable in respect of previous years.
Deferred tax is recognised, using the balance sheet method, on temporary differences arising between the tax bases of assets and liabilities and their carrying amounts in the financial statements. Deferred tax is measured at the tax rate that is expected to apply to the temporary differences when they reverse, based on laws that have been enacted or substantively enacted by the balance date.
Deferred tax is not recognised on the following temporary differences:
– the initial recognition of goodwill;
– the initial recognition of assets and liabilities in a transaction that is not a business combination and that affects neither accounting nor taxable profit; and
– differences relating to investments in subsidiaries and equity accounted investees to the extent that the timing of the reversal is controlled by the Group and it is probable that they will not reverse in the foreseeable future.
Deferred tax assets are recognised to the extent it is probable that future taxable profits will be available against which the temporary differences can be utilised.
x) Earnings per shareEarnings per share is calculated as net profit attributable to equity holders of the Company, divided by the weighted average number of ordinary shares on issue during the year.
y) Comparative figuresWhere a change in the presentational format of the financial statements has been made during the period, comparative figures have been restated accordingly. Where material, additional disclosure has been provided in the notes to the financial statements.
z) New and amended International Financial Reporting Standards
The accounting policies used are consistent with those used to prepare the consolidated financial statements for the year ended 31 July 2011.
i) New and amended standards adopted by the Group
The Group adopted amendments to various NZ International Financial Reporting Standards (NZ IFRSs) and FRS-44: New Zealand Additional Disclosures during the period. These amendments were introduced by the Financial Reporting Standards Board as part of the joint project with the Australian Accounting Standards Board to harmonise each jurisdiction’s accounting standards with source IFRSs. The Group also adopted revised NZ IAS 24 Related Party Disclosures during the period.
These changes have not had a material impact on the Group’s financial statements.
ii) New and amended standards issued but not yet effective
New and amended standards which could be expected to have a material impact on the Group’s financial statements, which were available for early adoption but have not been adopted, are stated below. At this time it is not possible to reasonably estimate the impact of adoption of these standards.
– NZ IFRS 9: Financial Instruments: Classification and Measurement is the first phase of the NZ IAS 39 replacement project and specifies how an entity should classify and measure financial assets and liabilities.
– NZ IFRS 10: Consolidated Financial Statements replaces the guidance on control and consolidation in NZ IAS 27 Consolidated and Separate Financial Statements.
– NZ IFRS 11: Joint Arrangements introduces criteria for determining the type of joint arrangement which focuses on the rights and obligations of the arrangement rather than the legal form.
– NZ IFRS 12: Disclosure of Interest in Other Entities introduces amended and additional disclosures about interests in other entities.
– NZ IFRS 13: Fair Value Measurement explains how to measure fair value and enhances fair value disclosures.
– Amendments to NZ IAS 19: Employee Benefits incorporates amendments to the definition of short term employee benefits.

14 FONTERRA ANNUAL REPORT 2012
NOTES TO THE FINANCIAL STATEMENTSFOR THE YEAR ENDED 31 JULY 2012
NOTES PAGE
1 Cost of goods sold 15
2 Operating profit 15
3 Net foreign exchange (losses)/gains 16
4 Net finance (costs)/income 16
5 Tax expense/(credit) 17
6 Segment reporting 18
7 Capital and reserves 22
8 Trade and other receivables 24
9 Inventories 24
10 Property, plant and equipment 25
11 Equity accounted investments 27
12 Intangible assets 28
13 Trade and other payables 29
14 Provisions 30
15 Borrowings 31
16 Deferred tax 33
17 Operating cash flows 34
18 Business combinations 34
19 Financial risk management 35
20 Contingent liabilities 48
21 Commitments 48
22 Related party transactions 49
23 Group entities 52
24 Subsequent events 54
25 Earnings per share 54

FONTERRA ANNUAL REPORT 2012 15
1 COST OF GOODS SOLD
GROUP $ MILLION PARENT $ MILLION
31 JULY 2012 31 JULY 2011 31 JULY 2012 31 JULY 2011
Opening inventory 3,277 2,870 – –
Cost of Milk:
− New Zealand sourced 9,033 10,235 9,050 10,257
− Non-New Zealand sourced 1,148 1,272 – –
Other purchases 6,244 5,761 – –
Closing inventory (2,981) (3,277) – –
Total cost of goods sold 16,721 16,861 9,050 10,257
Parent Cost of Milk – New Zealand sourced includes milk purchased from Fonterra Group companies of $17 million (2011: $22 million).
2 OPERATING PROFIT
GROUP $ MILLION PARENT $ MILLION
NOTES 31 JULY 2012 31 JULY 2011 31 JULY 2012 31 JULY 2011
The following items have been included in arriving at operating profit:
Auditors’ remuneration:
− Fees paid for the audit or review of financial statements 4 4 2 2
− Fees paid for other services1 2 2 – –
Operating lease expense 73 64 – –
Research and development costs 93 90 11 5
Gain on acquisition of business 18 – (23) – –
Net gain on disposal of investments2 – (26) – –
Net loss on disposal of property, plant and equipment 2 – 1 1
Net loss on derecognition of software 9 – 1 –
Donations 3 6 3 4
Research and development grants received from government (9) (6) (4) (3)
Total employee benefits expense 1,704 1,549 134 113
Included in employee benefits expense are
− Contributions to defined contribution plans 54 51 2 1
1 Other services include financial reporting, advisory services, financial and information technology controls assurance and other attest services.
2 On 21 March 2011, Fonterra completed the sale of its Western Australia dairy business. The transaction resulted in a pre-tax gain on sale of $26 million, which was recog-nised in other operating income, as part of the ANZ segment result. It also resulted in a tax credit of $26 million due to the derecognition of the net deferred tax liability associated with the assets and liabilities that were disposed of, which was recognised as a reduction to the tax expense for the year.

16 FONTERRA ANNUAL REPORT 2012
3 NET FOREIGN EXCHANGE (LOSSES)/GAINS
GROUP $ MILLION PARENT $ MILLION
31 JULY 2012 31 JULY 2011 31 JULY 2012 31 JULY 2011
Net foreign exchange (losses)/gains on debt instruments designated in a fair value hedge relationship (75) 262 – –
Net foreign exchange gains/(losses) on derivative instruments designated as a fair value hedge 71 (266) – –
Net foreign exchange (losses)/gains on financial instruments classified as held for trading (56) 127 – –
Net foreign exchange gains/(losses) on financial assets classified as loans and receivables 137 (403) – –
Net foreign exchange (losses)/gains on financial liabilities measured at amortised cost (77) 188 – –
Other net foreign exchange (losses)/gains (7) 1 – –
Net foreign exchange losses (7) (91) – –
4 NET FINANCE (COSTS)/INCOME
GROUP $ MILLION PARENT $ MILLION
31 JULY 2012 31 JULY 2011 31 JULY 2012 31 JULY 2011
Finance income 30 32 263 375
Interest expense on financial liabilities measured at amortised cost (333) (358) (280) (292)
Interest expense on derivatives classified as held for trading (31) (39) (31) (39)
Total interest expense calculated on an amortised cost basis (364) (397) (311) (331)
Change in fair value of forward points on cash flow hedges and net investment hedges – (1) – –
Change in fair value of hedged risks on debt instruments designated in a fair value hedge relationship (62) 6 (62) 6
Change in fair value of derivative instruments designated as a fair value hedge1 91 (33) 91 (33)
Change in fair value of financial instruments classified as held for trading (5) (13) (5) (14)
Finance costs (340) (438) (287) (372)
Net finance (costs)/income (310) (406) (24) 3
1 This includes the fair value impact of the basis risk adjustment inherent in the valuation of cross currency interest rate swaps that does not form part of the debt instrument hedging relationship.
NOTES TO THE FINANCIAL STATEMENTS CONTINUEDFOR THE YEAR ENDED 31 JULY 2012

FONTERRA ANNUAL REPORT 2012 17
5 TAX EXPENSE/(CREDIT)
GROUP $ MILLION PARENT $ MILLION
NOTES 31 JULY 2012 31 JULY 2011 31 JULY 2012 31 JULY 2011
Current tax expense/(credit) 53 38 (227) (71)
Prior period adjustments to current tax 1 (1) (17) (6)
Deferred tax movements:
− Origination and reversal of temporary differences 16 (1) (186) 18 (106)
Tax expense/(credit) 53 (149) (226) (183)
Profit/(loss) before tax 677 622 (178) 255
Prima facie tax expense at 28% (2011: 30%) 190 187 (50) 77
Add/(deduct) tax effect of:
− Effect of tax rates in foreign jurisdictions (11) (9) – –
− Non-deductible expenses/additional assessable income 21 35 3 8
− Non-assessable income/additional deductible expenses (38) (43) (68) (158)
− Losses of overseas Group entities not recognised 4 3 – –
− Prior year under/(over) provision 1 (1) 17 6
− Tax effect of distributions to Shareholders (128) (116) (128) (116)
− Origination and reversal of other temporary differences 14 (205) – –
Tax expense/(credit) 53 (149) (226) (183)
Imputation credits:
Imputation credits available for use in subsequent reporting periods 20 19 9 9
Tax losses
Gross tax losses available for which no deferred tax asset has been recognised 63 61 – –

18 FONTERRA ANNUAL REPORT 2012
6 SEGMENT REPORTING
The Group operates predominantly in the international dairy industry.
The Group has four reportable segments that are defined by product type and geographic area to reflect how the Group’s operations are managed.
The reportable segments presented reflect the Group’s management and reporting structure as viewed by the Fonterra Management Team, which is the Group’s chief operating decision maker.
Transactions between segments are based on estimated market prices.
REPORTAbLE SEGMENT DESCRIPTION
New Zealand Milk Products (formerly described as Standard & Premium Ingredients)
Represents the collection, processing and distribution of New Zealand milk, global sales and marketing of New Zealand and non New Zealand milk products, international farming, sustainability, external relations, RD1 and group functions.
ANZ Represents Fast Moving Consumer Goods (FMCG) operations in New Zealand (including export to the Pacific Islands) and all FMCG and Ingredients operations in Australia (including Milk Supply and Manufacturing). It includes foodservice sales in Australia and New Zealand (except for foodservice sales to Quick Service Restaurants).
Asia/AME Represents FMCG operations in Asia (excluding North Asia), Africa and the Middle East, and foodservice sales in Asia/AME and China.
Latam Represents FMCG operations in Chile and equity accounted investments in South America.
There have been two changes to the organisation of business units within reported segments during the year ended 31 July 2012:
– Foodservice sales to Quick Service Restaurants has been moved from ANZ to New Zealand Milk Products;
– China foodservice has been moved from New Zealand Milk Products to Asia/AME.
Comparatives have been restated to reflect these changes.
NOTES TO THE FINANCIAL STATEMENTS CONTINUEDFOR THE YEAR ENDED 31 JULY 2012

FONTERRA ANNUAL REPORT 2012 19
GROUP $ MILLION
NEW ZEALAND MILK
PRODUCTS ANZ ASIA/AME LATAM ELIMINATIONS TOTAL GROUP
Segment income statement
Year ended 31 July 2012External revenue 14,020 3,089 1,855 805 – 19,769
Inter-segment revenue 1,697 759 – – (2,456) –
Revenue from sale of goods 15,717 3,848 1,855 805 (2,456) 19,769
Cost of goods sold (14,311) (3,068) (1,224) (560) 2,442 (16,721)
Segment gross profit 1,406 780 631 245 (14) 3,048
Selling and marketing expenses (106) (127) (286) (49) – (568)
Distribution expenses (203) (204) (37) (57) – (501)
Administrative expenses (499) (173) (80) (45) 13 (784)
Other operating expenses (263) (89) (31) (12) 10 (385)
Segment operating expenses (1,071) (593) (434) (163) 23 (2,238)
Other operating income 102 7 8 38 (23) 132
Net foreign exchange gains/(losses) 9 (5) (11) – – (7)
Share of profit of equity accounted investees 45 6 – 1 – 52
Segment earnings before net finance costs and tax 491 195 194 121 (14) 987
Non-recurring items 24 9 – 8 – 41
Normalised segment earnings before net finance costs and tax 515 204 194 129 (14) 1,028
Non-recurring items (41)
Finance income 30
Finance costs (340)
Tax expense (53)
Profit for the year 624
Profit for the year includes the following amounts:
Depreciation (311) (68) (7) (24) – (410)
Amortisation (69) (9) (3) (1) – (82)
Royalty income from equity accounted investees 1 – – 16 – 17
Non-recurring items consist of the following amounts:
Impairment losses recorded in equity accounted investees – – – 8 – 8
Restructuring costs associated with the Group Strategy Refresh 23 7 – – – 30
Other 1 2 – – – 3
Total non-recurring items 24 9 – 8 – 41
Segment asset information:
As at and for the year ended 31 July 2012Equity accounted investments 225 6 – 208 – 439
Capital expenditure 645 181 19 43 – 888

20 FONTERRA ANNUAL REPORT 2012
6 SEGMENT REPORTING CONTINUED
GROUP $ MILLION
NOTES
NEW ZEALAND MILK
PRODUCTS ANZ ASIA/AME LATAM ELIMINATIONS TOTAL GROUP
Segment income statement
Year ended 31 July 2011External revenue 13,793 3,459 1,793 826 – 19,871
Inter-segment revenue 1,800 781 – 4 (2,585) –
Revenue from sale of goods 15,593 4,240 1,793 830 (2,585) 19,871
Cost of goods sold (14,381) (3,342) (1,182) (558) 2,602 (16,861)
Segment gross profit 1,212 898 611 272 17 3,010
Selling and marketing expenses (92) (151) (268) (85) – (596)
Distribution expenses (161) (238) (35) (53) – (487)
Administrative expenses (419) (159) (89) (46) 13 (700)
Other operating expenses (204) (98) (25) (17) 8 (336)
Segment operating expenses (876) (646) (417) (201) 21 (2,119)
Other operating income 118 39 2 27 (21) 165
Net foreign exchange losses (75) (13) (3) – – (91)
Share of profit of equity accounted investees 40 – – 23 – 63
Segment earnings before net finance costs and tax 419 278 193 121 17 1,028
Non-recurring items 1 (22) – (2) – (23)
Normalised segment earnings before net finance costs and tax 420 256 193 119 17 1,005
Non-recurring items 23
Finance income 32
Finance costs (438)
Tax credit 149
Profit for the year 771
Profit for the year includes the following amounts:
Depreciation (316) (72) (6) (20) – (414)
Amortisation (63) (8) (3) (1) – (75)
Royalty income from equity accounted investees – – – 21 – 21
Non-recurring items consist of the following amounts:
Impact of Christchurch earthquakes and Japan earthquake and tsunami 14 4 – – – 18
Gain on disposal of Western Australia dairy business 2 – (26) – – – (26)
Gain on acquisition of RD1 18 (23) – – – – (23)
Impact of 2010 Chilean earthquake – – – (5) – (5)
Other 10 – – 3 – 13
Total non-recurring items 1 (22) – (2) – (23)
Segment asset information:
As at and for the year ended 31 July 2011Equity accounted investments 216 – – 213 – 429
Capital expenditure 470 135 17 22 – 644
NOTES TO THE FINANCIAL STATEMENTS CONTINUEDFOR THE YEAR ENDED 31 JULY 2012

FONTERRA ANNUAL REPORT 2012 21
GROUP $ MILLION
31 JULY 2012 31 JULY 2011
Entity wide products and services:Consumer goods 4,945 5,248
Ingredients and other revenue 14,824 14,623
Revenue from sale of goods 19,769 19,871
GROUP $ MILLION
EUROPE CHINA REST OF ASIA AUSTRALIANEW
ZEALAND USAREST OF WORLD TOTAL
Geographical segment external revenue:Year ended 31 July 2012 1,169 2,031 5,676 2,300 1,928 1,445 5,220 19,769
Year ended 31 July 2011 1,269 1,877 5,735 2,664 1,560 1,566 5,200 19,871
Revenue is allocated to geographical segments on the basis of the destination of the goods sold.
GROUP $ MILLION
EUROPE CHINA REST OF ASIA AUSTRALIANEW
ZEALAND USAREST OF WORLD TOTAL
Geographical segment reportable non-current assets:As at 31 July 2012 128 123 771 1,107 5,166 127 706 8,128
As at 31 July 2011 122 63 723 1,011 4,901 124 756 7,700
GROUP $ MILLION
AS AT 31 JULY 2012
AS AT 31 JULY 2011
Reconciliation of geographical segment non-current assets to total non-current assets:Geographical segment non-current assets 8,128 7,700
Deferred tax asset 99 116
Derivative financial instruments 198 154
Total non-current assets 8,425 7,970
22 FONTERRA ANNUAL REPORT 2012
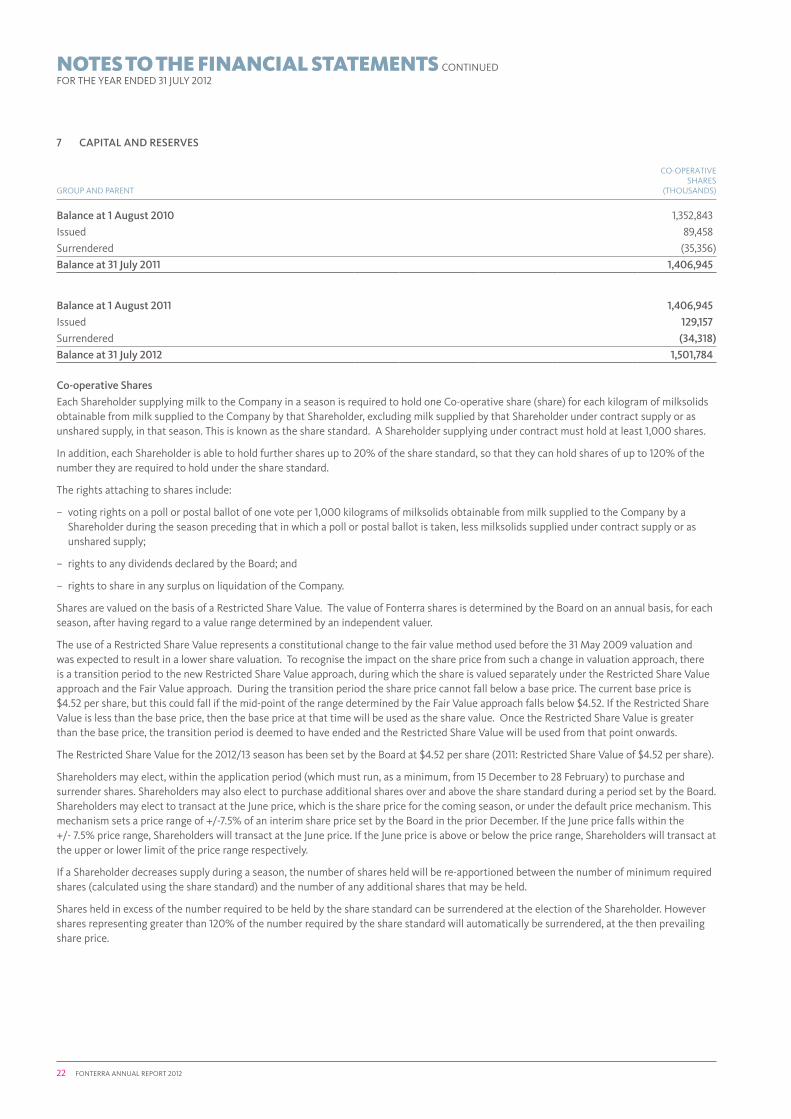
7 CAPITAL AND RESERVES
GROUP AND PARENT
CO-OPERATIVE SHARES
(THOUSANDS)
Balance at 1 August 2010 1,352,843
Issued 89,458
Surrendered (35,356)
Balance at 31 July 2011 1,406,945
Balance at 1 August 2011 1,406,945
Issued 129,157
Surrendered (34,318)
Balance at 31 July 2012 1,501,784
Co-operative Shares
Each Shareholder supplying milk to the Company in a season is required to hold one Co-operative share (share) for each kilogram of milksolids obtainable from milk supplied to the Company by that Shareholder, excluding milk supplied by that Shareholder under contract supply or as unshared supply, in that season. This is known as the share standard. A Shareholder supplying under contract must hold at least 1,000 shares.
In addition, each Shareholder is able to hold further shares up to 20% of the share standard, so that they can hold shares of up to 120% of the number they are required to hold under the share standard.
The rights attaching to shares include:
– voting rights on a poll or postal ballot of one vote per 1,000 kilograms of milksolids obtainable from milk supplied to the Company by a Shareholder during the season preceding that in which a poll or postal ballot is taken, less milksolids supplied under contract supply or as unshared supply;
– rights to any dividends declared by the Board; and
– rights to share in any surplus on liquidation of the Company.
Shares are valued on the basis of a Restricted Share Value. The value of Fonterra shares is determined by the Board on an annual basis, for each season, after having regard to a value range determined by an independent valuer.
The use of a Restricted Share Value represents a constitutional change to the fair value method used before the 31 May 2009 valuation and was expected to result in a lower share valuation. To recognise the impact on the share price from such a change in valuation approach, there is a transition period to the new Restricted Share Value approach, during which the share is valued separately under the Restricted Share Value approach and the Fair Value approach. During the transition period the share price cannot fall below a base price. The current base price is $4.52 per share, but this could fall if the mid-point of the range determined by the Fair Value approach falls below $4.52. If the Restricted Share Value is less than the base price, then the base price at that time will be used as the share value. Once the Restricted Share Value is greater than the base price, the transition period is deemed to have ended and the Restricted Share Value will be used from that point onwards.
The Restricted Share Value for the 2012/13 season has been set by the Board at $4.52 per share (2011: Restricted Share Value of $4.52 per share).
Shareholders may elect, within the application period (which must run, as a minimum, from 15 December to 28 February) to purchase and surrender shares. Shareholders may also elect to purchase additional shares over and above the share standard during a period set by the Board. Shareholders may elect to transact at the June price, which is the share price for the coming season, or under the default price mechanism. This mechanism sets a price range of +/-7.5% of an interim share price set by the Board in the prior December. If the June price falls within the +/- 7.5% price range, Shareholders will transact at the June price. If the June price is above or below the price range, Shareholders will transact at the upper or lower limit of the price range respectively.
If a Shareholder decreases supply during a season, the number of shares held will be re-apportioned between the number of minimum required shares (calculated using the share standard) and the number of any additional shares that may be held.
Shares held in excess of the number required to be held by the share standard can be surrendered at the election of the Shareholder. However shares representing greater than 120% of the number required by the share standard will automatically be surrendered, at the then prevailing share price.
NOTES TO THE FINANCIAL STATEMENTS CONTINUEDFOR THE YEAR ENDED 31 JULY 2012
FONTERRA ANNUAL REPORT 2012 23
Payment for the surrender of shares may be made at the option of the Company by:
– cash; or
– the issue of Capital Notes.
The Company also has the option to pay the surrender value in special circumstances by the issue of redeemable preference shares.
The expected cash outflow on redemption or repurchase of the shares is dependent on the share value at that time, the number of shares redeemed or repurchased and the instrument used to settle the obligation, and accordingly cannot be reliably estimated.
If a Shareholder increases supply during a season, any additional shares held will be used first to satisfy the increased minimum required shares under the share standard. If no, or insufficient, additional shares are held, the Shareholder must either:
– acquire the extra shares required under the share standard at the current season share price; or
– request unshared supply (if available).
If the Company decides to make unshared supply available, a Shareholder’s entitlement to it cannot exceed 20% of that Shareholder’s share standard for that season. If a Shareholder is granted unshared supply, they will not be required to purchase shares for the quantity elected. However, they will receive a lower milk payment for this unshared supply.
Shares acquired by Shareholders may be paid by:
– cash; or
– the redemption of any Capital Notes held (at the discretion of the Company).
On 30 June 2010 Shareholders approved constitutional changes that allow the Board to work towards implementation of capital structure changes. This was re-affirmed in the Special Meeting held on 25 June 2012. The key features are:
– the establishment of a platform to enable share trading among Shareholders at a well-discovered market price.
– the establishment of a Fonterra Shareholders’ Fund that could acquire from Shareholders the right to receive dividends and the gain/loss from any change in the underlying value of a certain amount of shares, whilst Shareholders retain voting rights and the access to milk payments attached to the shares.
There is no current year impact to the Company’s capital structure arising out of the approvals to date.
Dividends paid
All shares are eligible to receive a dividend if declared by the Board. On 21 September 2011, the Board declared a dividend of 22.0 cents per share (totalling $303 million), paid on 20 October 2011 to the Shareholders on the share register at 31 May 2011.
On 27 March 2012, the Board declared an interim dividend of 12.0 cents per share (totalling $172 million), paid on 20 April 2012 to the Shareholders on the share register at 31 March 2012.
The dividend declared after balance date is explained in Note 24.
Foreign currency translation reserve
The foreign currency translation reserve comprises all foreign currency differences arising from the translation of the financial statements of foreign operations as well as from the effective portion of translation or fair value changes of instruments that hedge the Group’s net investment in foreign operations.
Cash flow hedge reserve
The cash flow hedge reserve comprises the effective portion of the cumulative net change in the fair value of cash flow hedging instruments related to hedged transactions that have not yet occurred.
24 FONTERRA ANNUAL REPORT 2012
NOTES TO THE FINANCIAL STATEMENTS CONTINUEDFOR THE YEAR ENDED 31 JULY 2012
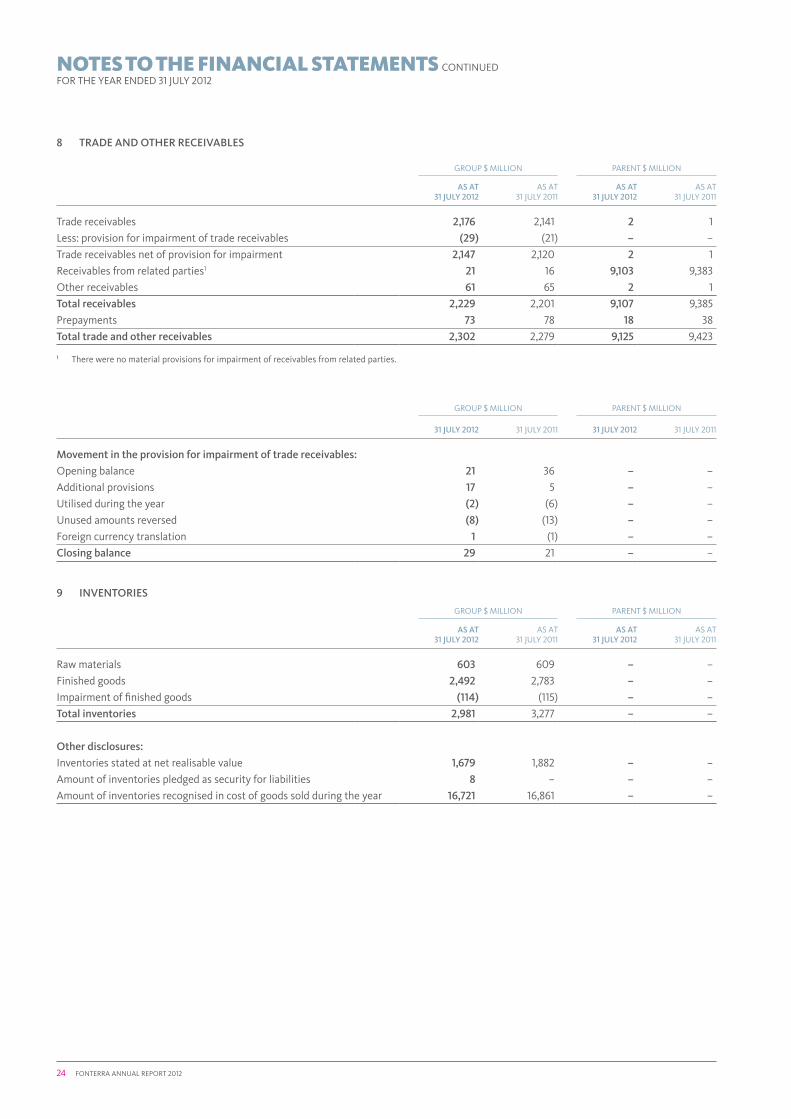
8 TRADE AND OTHER RECEIVAbLES
GROUP $ MILLION PARENT $ MILLION
AS AT 31 JULY 2012
AS AT 31 JULY 2011
AS AT 31 JULY 2012
AS AT 31 JULY 2011
Trade receivables 2,176 2,141 2 1
Less: provision for impairment of trade receivables (29) (21) – –
Trade receivables net of provision for impairment 2,147 2,120 2 1
Receivables from related parties1 21 16 9,103 9,383
Other receivables 61 65 2 1
Total receivables 2,229 2,201 9,107 9,385
Prepayments 73 78 18 38
Total trade and other receivables 2,302 2,279 9,125 9,423
1 There were no material provisions for impairment of receivables from related parties.
GROUP $ MILLION PARENT $ MILLION
31 JULY 2012 31 JULY 2011 31 JULY 2012 31 JULY 2011
Movement in the provision for impairment of trade receivables:
Opening balance 21 36 – –
Additional provisions 17 5 – –
Utilised during the year (2) (6) – –
Unused amounts reversed (8) (13) – –
Foreign currency translation 1 (1) – –
Closing balance 29 21 – –
9 INVENTORIES
GROUP $ MILLION PARENT $ MILLION
AS AT 31 JULY 2012
AS AT 31 JULY 2011
AS AT 31 JULY 2012
AS AT 31 JULY 2011
Raw materials 603 609 – –
Finished goods 2,492 2,783 – –
Impairment of finished goods (114) (115) – –
Total inventories 2,981 3,277 – –
Other disclosures:
Inventories stated at net realisable value 1,679 1,882 – –
Amount of inventories pledged as security for liabilities 8 – – –
Amount of inventories recognised in cost of goods sold during the year 16,721 16,861 – –
FONTERRA ANNUAL REPORT 2012 25
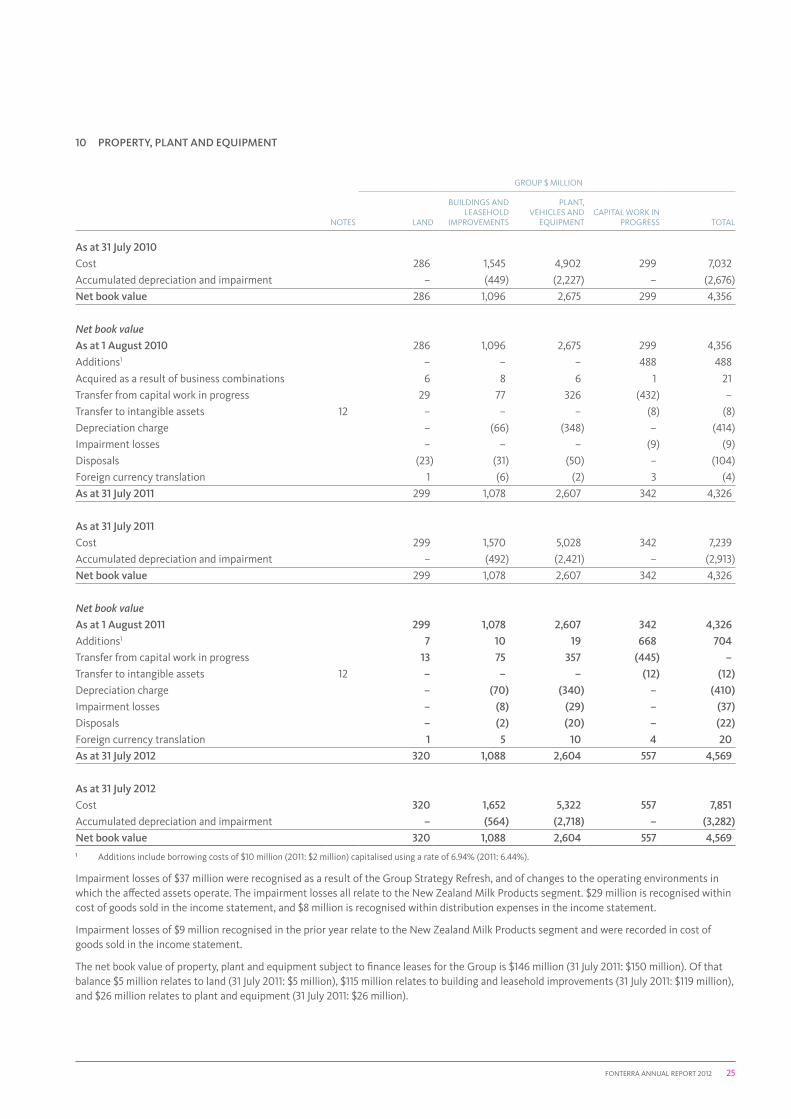
10 PROPERTY, PLANT AND EQUIPMENT
GROUP $ MILLION
NOTES LAND
BUILDINGS AND LEASEHOLD
IMPROVEMENTS
PLANT, VEHICLES AND
EQUIPMENTCAPITAL WORK IN
PROGRESS TOTAL
As at 31 July 2010
Cost 286 1,545 4,902 299 7,032
Accumulated depreciation and impairment – (449) (2,227) – (2,676)
Net book value 286 1,096 2,675 299 4,356
Net book valueAs at 1 August 2010 286 1,096 2,675 299 4,356
Additions1 – – – 488 488
Acquired as a result of business combinations 6 8 6 1 21
Transfer from capital work in progress 29 77 326 (432) –
Transfer to intangible assets 12 – – – (8) (8)
Depreciation charge – (66) (348) – (414)
Impairment losses – – – (9) (9)
Disposals (23) (31) (50) – (104)
Foreign currency translation 1 (6) (2) 3 (4)
As at 31 July 2011 299 1,078 2,607 342 4,326
As at 31 July 2011
Cost 299 1,570 5,028 342 7,239
Accumulated depreciation and impairment – (492) (2,421) – (2,913)
Net book value 299 1,078 2,607 342 4,326
Net book valueAs at 1 August 2011 299 1,078 2,607 342 4,326
Additions1 7 10 19 668 704
Transfer from capital work in progress 13 75 357 (445) –
Transfer to intangible assets 12 – – – (12) (12)
Depreciation charge – (70) (340) – (410)
Impairment losses – (8) (29) – (37)
Disposals – (2) (20) – (22)
Foreign currency translation 1 5 10 4 20
As at 31 July 2012 320 1,088 2,604 557 4,569
As at 31 July 2012
Cost 320 1,652 5,322 557 7,851
Accumulated depreciation and impairment – (564) (2,718) – (3,282)
Net book value 320 1,088 2,604 557 4,5691 Additions include borrowing costs of $10 million (2011: $2 million) capitalised using a rate of 6.94% (2011: 6.44%).
Impairment losses of $37 million were recognised as a result of the Group Strategy Refresh, and of changes to the operating environments in which the affected assets operate. The impairment losses all relate to the New Zealand Milk Products segment. $29 million is recognised within cost of goods sold in the income statement, and $8 million is recognised within distribution expenses in the income statement.
Impairment losses of $9 million recognised in the prior year relate to the New Zealand Milk Products segment and were recorded in cost of goods sold in the income statement.
The net book value of property, plant and equipment subject to finance leases for the Group is $146 million (31 July 2011: $150 million). Of that balance $5 million relates to land (31 July 2011: $5 million), $115 million relates to building and leasehold improvements (31 July 2011: $119 million), and $26 million relates to plant and equipment (31 July 2011: $26 million).
26 FONTERRA ANNUAL REPORT 2012
NOTES TO THE FINANCIAL STATEMENTS CONTINUEDFOR THE YEAR ENDED 31 JULY 2012
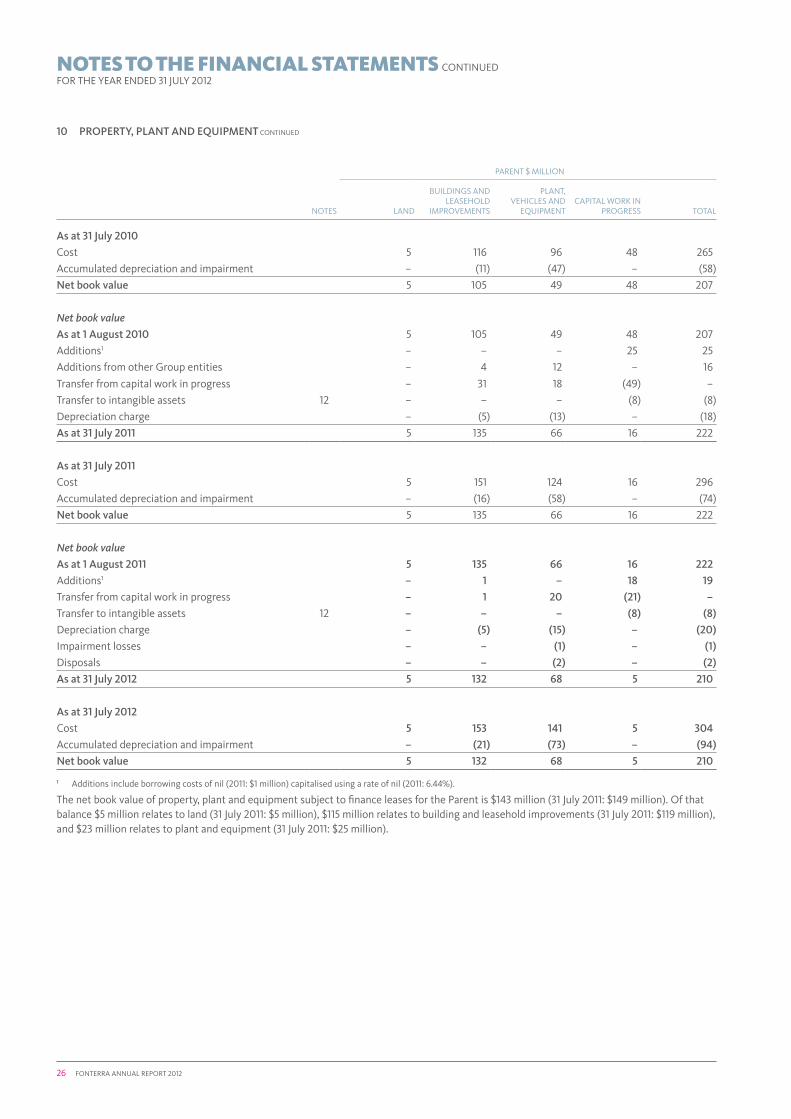
10 PROPERTY, PLANT AND EQUIPMENT CONTINUED
PARENT $ MILLION
NOTES LAND
BUILDINGS AND LEASEHOLD
IMPROVEMENTS
PLANT, VEHICLES AND
EQUIPMENTCAPITAL WORK IN
PROGRESS TOTAL
As at 31 July 2010
Cost 5 116 96 48 265
Accumulated depreciation and impairment – (11) (47) – (58)
Net book value 5 105 49 48 207
Net book valueAs at 1 August 2010 5 105 49 48 207
Additions1 – – – 25 25
Additions from other Group entities – 4 12 – 16
Transfer from capital work in progress – 31 18 (49) –
Transfer to intangible assets 12 – – – (8) (8)
Depreciation charge – (5) (13) – (18)
As at 31 July 2011 5 135 66 16 222
As at 31 July 2011
Cost 5 151 124 16 296
Accumulated depreciation and impairment – (16) (58) – (74)
Net book value 5 135 66 16 222
Net book valueAs at 1 August 2011 5 135 66 16 222
Additions1 – 1 – 18 19
Transfer from capital work in progress – 1 20 (21) –
Transfer to intangible assets 12 – – – (8) (8)
Depreciation charge – (5) (15) – (20)
Impairment losses – – (1) – (1)
Disposals – – (2) – (2)
As at 31 July 2012 5 132 68 5 210
As at 31 July 2012
Cost 5 153 141 5 304
Accumulated depreciation and impairment – (21) (73) – (94)
Net book value 5 132 68 5 210
1 Additions include borrowing costs of nil (2011: $1 million) capitalised using a rate of nil (2011: 6.44%).
The net book value of property, plant and equipment subject to finance leases for the Parent is $143 million (31 July 2011: $149 million). Of that balance $5 million relates to land (31 July 2011: $5 million), $115 million relates to building and leasehold improvements (31 July 2011: $119 million), and $23 million relates to plant and equipment (31 July 2011: $25 million).

FONTERRA ANNUAL REPORT 2012 27
11 EQUITY ACCOUNTED INVESTMENTS
A list of significant equity accounted investees is included in Note 23.
In the year ended 31 July 2011, Fonterra completed the purchase of the remaining 50% of RD1 Limited, which resulted in RD1 Limited becoming a subsidiary of Fonterra. Further details are set out in Note 18.
The Group has provided financial guarantees to certain equity accounted investees as set out in Notes 19 and 22.
The Group’s equity accounted investees have entered into non-cancellable operating leases, and the Group’s share of the future aggregate minimum lease payments under these leases is $8 million (2011: $12 million).
The Group’s share of capital expenditure contracted for at balance date but not recognised by equity accounted investees is $14 million (2011: nil).
The following amounts represent the aggregate assets, liabilities, revenue and profit of equity accounted investees:
GROUP $ MILLION
AS AT AND FOR THE YEAR ENDED
31 JULY 2012
AS AT AND FOR THE YEAR ENDED
31 JULY 2011
Assets:
Non-current assets 566 908
Current assets 859 896
Total assets 1,425 1,804
Liabilities:
Non-current liabilities (210) (415)
Current liabilities (722) (625)
Total liabilities (932) (1,040)
Net assets 493 764
Revenue 2,632 3,446
Expenses (including interest and tax) (2,557) (3,347)
Profit after tax 75 99
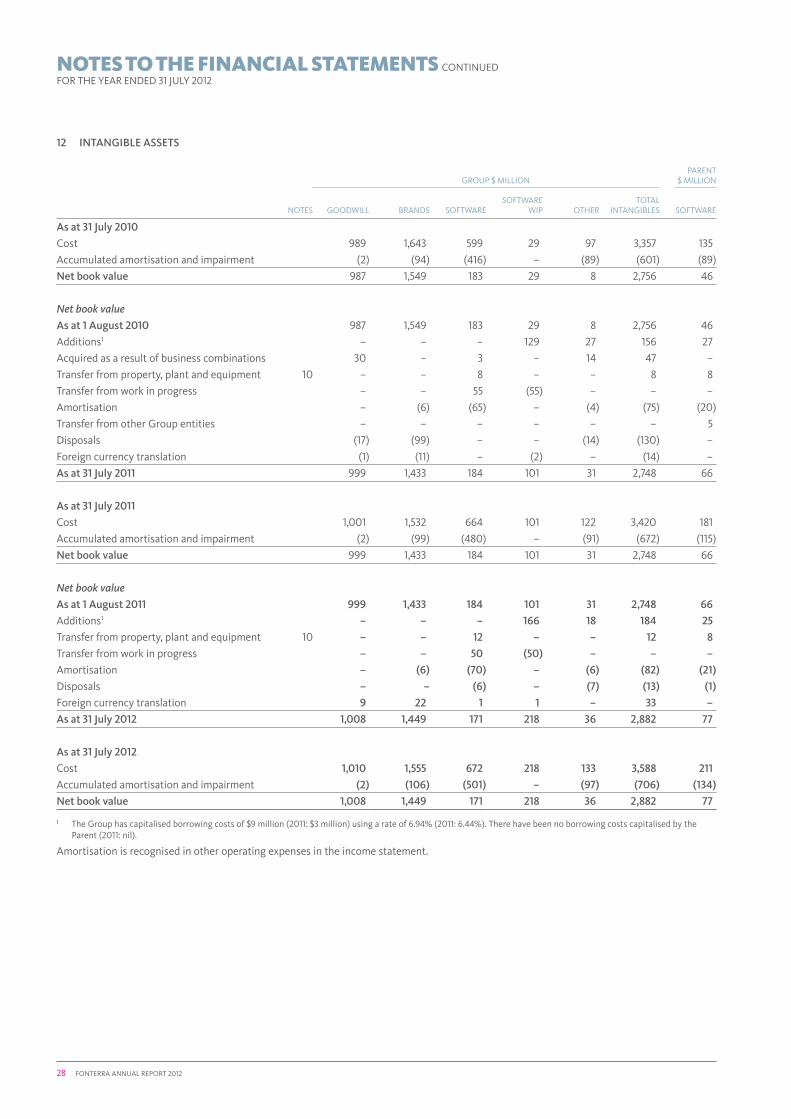
28 FONTERRA ANNUAL REPORT 2012
12 INTANGIbLE ASSETS
GROUP $ MILLIONPARENT
$ MILLION
NOTES GOODWILL BRANDS SOFTWARESOFTWARE
WIP OTHERTOTAL
INTANGIBLES SOFTWARE
As at 31 July 2010
Cost 989 1,643 599 29 97 3,357 135
Accumulated amortisation and impairment (2) (94) (416) – (89) (601) (89)
Net book value 987 1,549 183 29 8 2,756 46
Net book value As at 1 August 2010 987 1,549 183 29 8 2,756 46
Additions1 – – – 129 27 156 27
Acquired as a result of business combinations 30 – 3 – 14 47 –
Transfer from property, plant and equipment 10 – – 8 – – 8 8
Transfer from work in progress – – 55 (55) – – –
Amortisation – (6) (65) – (4) (75) (20)
Transfer from other Group entities – – – – – – 5
Disposals (17) (99) – – (14) (130) –
Foreign currency translation (1) (11) – (2) – (14) –
As at 31 July 2011 999 1,433 184 101 31 2,748 66
As at 31 July 2011
Cost 1,001 1,532 664 101 122 3,420 181
Accumulated amortisation and impairment (2) (99) (480) – (91) (672) (115)
Net book value 999 1,433 184 101 31 2,748 66
Net book value As at 1 August 2011 999 1,433 184 101 31 2,748 66
Additions1 – – – 166 18 184 25
Transfer from property, plant and equipment 10 – – 12 – – 12 8
Transfer from work in progress – – 50 (50) – – –
Amortisation – (6) (70) – (6) (82) (21)
Disposals – – (6) – (7) (13) (1)
Foreign currency translation 9 22 1 1 – 33 –
As at 31 July 2012 1,008 1,449 171 218 36 2,882 77
As at 31 July 2012
Cost 1,010 1,555 672 218 133 3,588 211
Accumulated amortisation and impairment (2) (106) (501) – (97) (706) (134)
Net book value 1,008 1,449 171 218 36 2,882 77
1 The Group has capitalised borrowing costs of $9 million (2011: $3 million) using a rate of 6.94% (2011: 6.44%). There have been no borrowing costs capitalised by the Parent (2011: nil).
Amortisation is recognised in other operating expenses in the income statement.
NOTES TO THE FINANCIAL STATEMENTS CONTINUEDFOR THE YEAR ENDED 31 JULY 2012

FONTERRA ANNUAL REPORT 2012 29
Goodwill and other indefinite life intangibles
Goodwill
Goodwill for each cash generating unit (CGU) has been tested for impairment on a fair value less costs to sell basis. Testing was undertaken in May 2012 using external sources of information where appropriate. Cash flow forecasts used as inputs to determine fair value are based on the Group’s three year plan, extrapolated for a further seven years, and then using a terminal year with a long term growth rate of between 2.0% and 3.0% (31 July 2011: between 2.0% and 3.0%). Management considers a ten year forecast period to be appropriate given the long term nature of the dairy industry. The discount rate applied to future cash flows was 9.0% (31 July 2011: 9.5%).
There was headroom between the recoverable amount and the carrying value of goodwill by CGU and no impairment was recognised. No reasonably possible change in any of these assumptions would cause the carrying value of goodwill allocated to a CGU to exceed its recoverable amount.
Of those CGUs tested, the goodwill of the Fonterra Brands New Zealand CGU is considered significant in the context of the carrying value of goodwill for the Group. For the Fonterra Brands New Zealand CGU the carrying value of goodwill is $618 million (31 July 2011: $618 million) and the carrying value of indefinite life brands attributable to the CGU is $307 million (31 July 2011: $307 million). These brands are tested for impairment on an individual asset basis (see below).
Indefinite life brands
Of the total brands held, 91% ($1,320 million) have indefinite useful lives (31 July 2011: 91%, $1,299 million). In concluding that a brand has an indefinite life, management considers its intention to acquire, hold and support brands through advertising and promotional spending for an indefinite period.
Individual indefinite life brands are tested annually for impairment through a value-in-use test using a discounted cash flow methodology.
13 TRADE AND OTHER PAYAbLES
GROUP $ MILLION PARENT $ MILLION
AS AT 31 JULY 2012
AS AT 31 JULY 2011
AS AT 31 JULY 2012
AS AT 31 JULY 2011
Trade payables 1,064 1,031 62 41
Amounts due to related parties 9 8 6,929 7,242
Other payables 66 97 40 41
Total trade and other payables (excluding employee entitlements) 1,139 1,136 7,031 7,324
Employee entitlements 247 214 22 19
Total trade and other payables 1,386 1,350 7,053 7,343
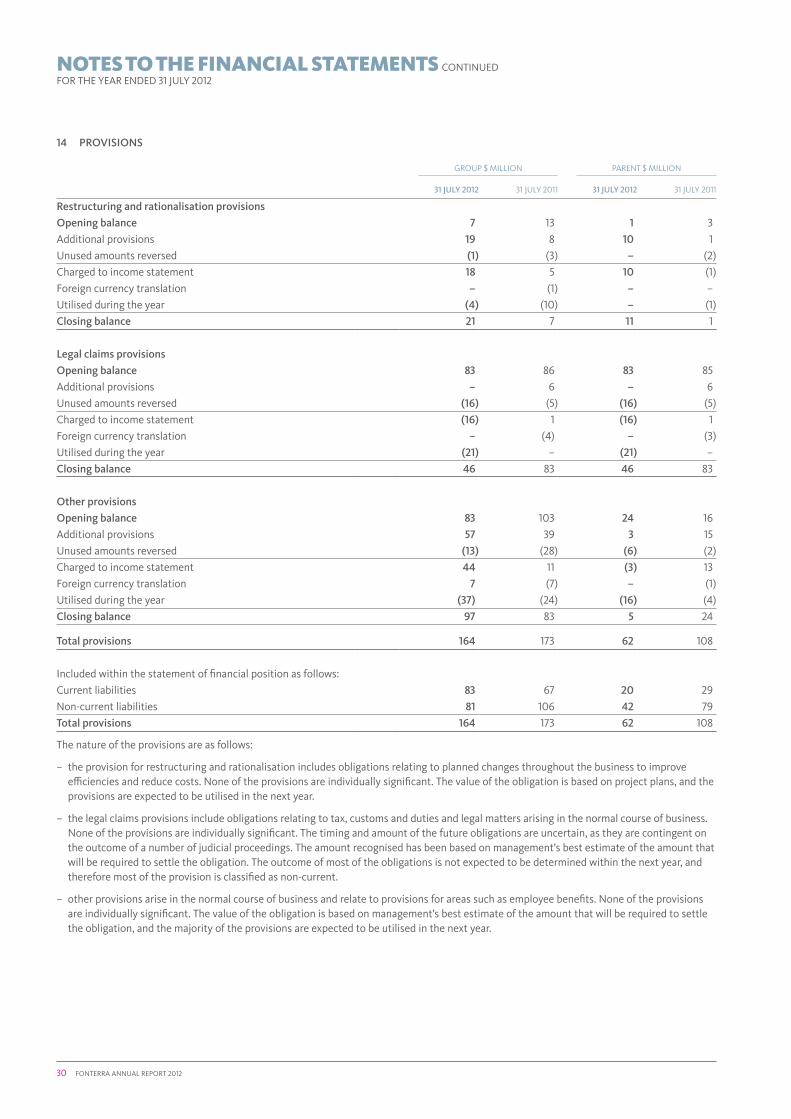
30 FONTERRA ANNUAL REPORT 2012
14 PROVISIONS
GROUP $ MILLION PARENT $ MILLION
31 JULY 2012 31 JULY 2011 31 JULY 2012 31 JULY 2011
Restructuring and rationalisation provisions
Opening balance 7 13 1 3
Additional provisions 19 8 10 1
Unused amounts reversed (1) (3) – (2)
Charged to income statement 18 5 10 (1)
Foreign currency translation – (1) – –
Utilised during the year (4) (10) – (1)
Closing balance 21 7 11 1
Legal claims provisions
Opening balance 83 86 83 85
Additional provisions – 6 – 6
Unused amounts reversed (16) (5) (16) (5)
Charged to income statement (16) 1 (16) 1
Foreign currency translation – (4) – (3)
Utilised during the year (21) – (21) –
Closing balance 46 83 46 83
Other provisions
Opening balance 83 103 24 16
Additional provisions 57 39 3 15
Unused amounts reversed (13) (28) (6) (2)
Charged to income statement 44 11 (3) 13
Foreign currency translation 7 (7) – (1)
Utilised during the year (37) (24) (16) (4)
Closing balance 97 83 5 24
Total provisions 164 173 62 108
Included within the statement of financial position as follows:
Current liabilities 83 67 20 29
Non-current liabilities 81 106 42 79
Total provisions 164 173 62 108
The nature of the provisions are as follows:
– the provision for restructuring and rationalisation includes obligations relating to planned changes throughout the business to improve efficiencies and reduce costs. None of the provisions are individually significant. The value of the obligation is based on project plans, and the provisions are expected to be utilised in the next year.
– the legal claims provisions include obligations relating to tax, customs and duties and legal matters arising in the normal course of business. None of the provisions are individually significant. The timing and amount of the future obligations are uncertain, as they are contingent on the outcome of a number of judicial proceedings. The amount recognised has been based on management’s best estimate of the amount that will be required to settle the obligation. The outcome of most of the obligations is not expected to be determined within the next year, and therefore most of the provision is classified as non-current.
– other provisions arise in the normal course of business and relate to provisions for areas such as employee benefits. None of the provisions are individually significant. The value of the obligation is based on management’s best estimate of the amount that will be required to settle the obligation, and the majority of the provisions are expected to be utilised in the next year.
NOTES TO THE FINANCIAL STATEMENTS CONTINUEDFOR THE YEAR ENDED 31 JULY 2012

FONTERRA ANNUAL REPORT 2012 31
15 bORROWINGS
GROUP $ MILLION PARENT $ MILLION
AS AT 31 JULY 2012
AS AT 31 JULY 2011
AS AT 31 JULY 2012
AS AT 31 JULY 2011
Current
Commercial paper 198 50 198 50
Bank loans 150 337 1 –
Finance leases 8 7 3 3
Medium-term notes 848 50 797 –
Total current borrowings 1,204 444 999 53
Non-current
Bank loans 124 154 – 150
Finance leases 169 172 144 147
Capital notes 35 35 35 35
Retail bonds 943 940 943 940
Medium-term notes 2,474 2,905 1,893 2,527
Total non-current borrowings 3,745 4,206 3,015 3,799
Total borrowings 4,949 4,650 4,014 3,852
– Finance leases are secured over the related item of property, plant and equipment (Note 10).
– Included within bank loans is $8 million (31 July 2011: nil) of borrowings secured over inventories (Note 9).
– Capital notes are unsecured subordinated borrowings.
– All other borrowings are unsecured and unsubordinated.
GROUP $ MILLION PARENT $ MILLION
AS AT 31 JULY 2012
AS AT 31 JULY 2011
AS AT 31 JULY 2012
AS AT 31 JULY 2011
Opening balance 4,650 4,924 3,852 4,356
New issues
Bank loans 1,394 2,298 580 569
Finance leases 2 – – –
Commercial paper 626 817 626 817
Retail bonds – – – –
Medium-term notes 193 533 – 149
2,215 3,648 1,206 1,535
Repayments
Bank loans (1,606) (2,396) (731) (555)
Finance leases (7) (9) (3) (6)
Commercial paper (480) (990) (480) (990)
Medium-term notes (4) (153) – (148)
(2,097) (3,548) (1,214) (1,699)
Other movements
Amortisation of discount 7 7 7 7
Changes in fair value 62 (6) 62 (6)
Changes due to foreign currency translation 112 (375) 101 (341)
181 (374) 170 (340)
Closing balance 4,949 4,650 4,014 3,852

32 FONTERRA ANNUAL REPORT 2012
15 bORROWINGS CONTINUED
GROUP $ MILLION
AS AT 31 JULY 2012
AS AT 31 JULY 2011
Net interest bearing debt position
Total borrowings 4,949 4,650
Cash and cash equivalents (1,033) (785)
Interest bearing advances included in other non-current assets (125) (122)
Bank overdraft 42 23
Net interest bearing debt 3,833 3,766
Value of derivatives used to manage changes in hedged risks and other foreign exchange movements on debt 396 565
Economic net interest bearing debt1 4,229 4,331
1 Economic net interest bearing debt reflects the effect of debt hedging in place at balance date.
Net interest bearing debt is managed on a Group basis.
GROUP
AS AT 31 JULY 2012
AS AT 31 JULY 2011
Net tangible assets per security1
$ per listed debt security on issue 3.58 3.60
$ per Co-operative share on issue 2.51 2.70
Listed debt securities on issue (million) 1,053 1,053
Co-operative shares on issue (million) 1,502 1,407
1 Net tangible assets represents total assets less total liabilities less intangible assets.
GROUP $ MILLION PARENT $ MILLION
AS AT 31 JULY 2012
AS AT 31 JULY 2011
AS AT 31 JULY 2012
AS AT 31 JULY 2011
Finance leases – minimum lease payments
Not later than one year 20 19 15 15
Later than one year and not later than five years 92 86 65 59
Later than five years 148 169 147 168
260 274 227 242
Future finance charges on finance leases (83) (95) (80) (92)
Present value of finance leases 177 179 147 150
The present value of finance leases is as follows:
Not later than one year 8 7 3 3
Later than one year and not later than five years 41 47 18 22
Later than five years 128 125 126 125
Total present value of finance leases 177 179 147 150
NOTES TO THE FINANCIAL STATEMENTS CONTINUEDFOR THE YEAR ENDED 31 JULY 2012

FONTERRA ANNUAL REPORT 2012 33
16 DEFERRED TAX
GROUP $ MILLION PARENT $ MILLION
NOTESAS AT
31 JULY 2012AS AT
31 JULY 2011AS AT
31 JULY 2012AS AT
31 JULY 2011
Deferred tax
Property, plant and equipment (108) (156) 9 5
Intangible assets (364) (295) (22) (18)
Derivative financial instruments (40) (236) 26 25
Employee entitlements 59 52 6 7
Inventories 37 16 – –
Receivables, payables and provisions 42 34 9 11
New Zealand tax losses 357 387 357 373
Offshore tax losses 76 39 – –
Other (45) (20) – –
Total deferred tax 14 (179) 385 403
Movements for the year
Opening balance (179) (193) 403 287
Recognised in the income statement 5 1 186 (18) 106
Recognised directly in other comprehensive income 187 (160) – 10
Foreign currency translation 5 (12) – –
Closing balance 14 (179) 385 403
Included within the statement of financial position as follows:
Deferred tax assets 99 116 385 403
Deferred tax liabilities (85) (295) – –
Total deferred tax 14 (179) 385 403
Balance expected to be recovered or settled:
Within the next 12 months 104 (119) 41 43
After the next 12 months (90) (60) 344 360
Total deferred tax 14 (179) 385 403
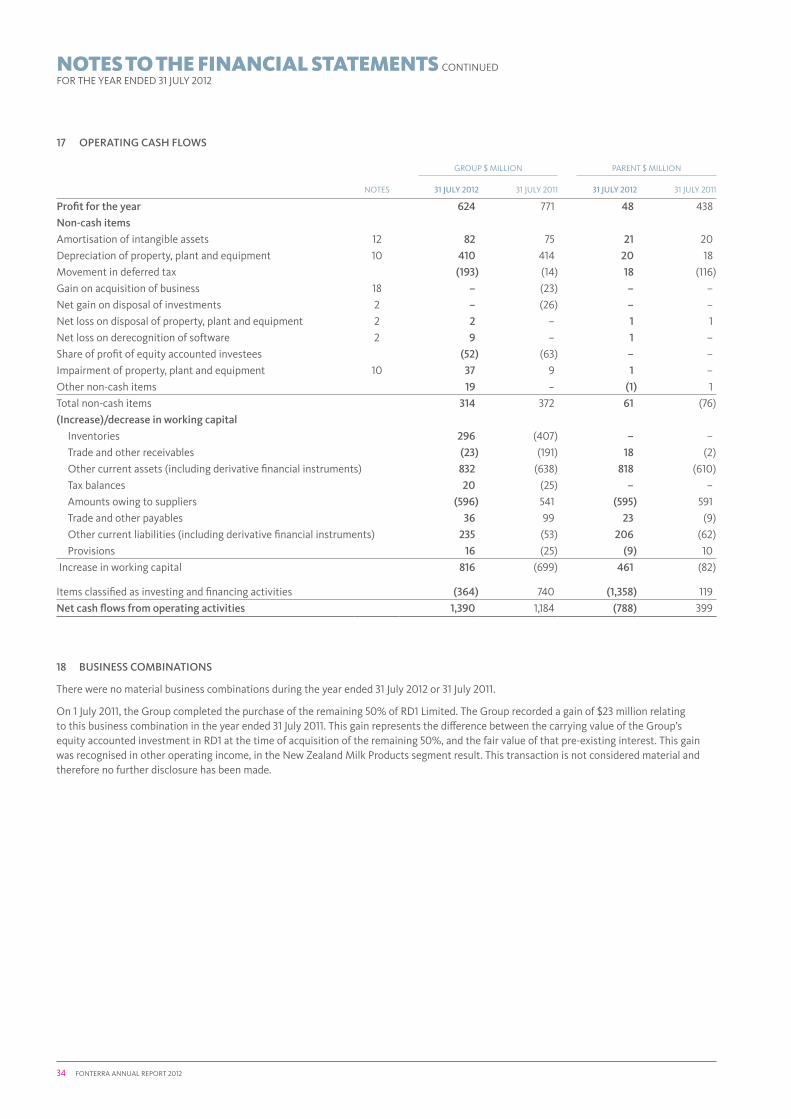
34 FONTERRA ANNUAL REPORT 2012
17 OPERATING CASH FLOWS
GROUP $ MILLION PARENT $ MILLION
NOTES 31 JULY 2012 31 JULY 2011 31 JULY 2012 31 JULY 2011
Profit for the year 624 771 48 438
Non-cash items
Amortisation of intangible assets 12 82 75 21 20
Depreciation of property, plant and equipment 10 410 414 20 18
Movement in deferred tax (193) (14) 18 (116)
Gain on acquisition of business 18 – (23) – –
Net gain on disposal of investments 2 – (26) – –
Net loss on disposal of property, plant and equipment 2 2 – 1 1
Net loss on derecognition of software 2 9 – 1 –
Share of profit of equity accounted investees (52) (63) – –
Impairment of property, plant and equipment 10 37 9 1 –
Other non-cash items 19 – (1) 1
Total non-cash items 314 372 61 (76)
(Increase)/decrease in working capital
Inventories 296 (407) – –
Trade and other receivables (23) (191) 18 (2)
Other current assets (including derivative financial instruments) 832 (638) 818 (610)
Tax balances 20 (25) – –
Amounts owing to suppliers (596) 541 (595) 591
Trade and other payables 36 99 23 (9)
Other current liabilities (including derivative financial instruments) 235 (53) 206 (62)
Provisions 16 (25) (9) 10
Increase in working capital 816 (699) 461 (82)
Items classified as investing and financing activities (364) 740 (1,358) 119
Net cash flows from operating activities 1,390 1,184 (788) 399
18 bUSINESS COMbINATIONS
There were no material business combinations during the year ended 31 July 2012 or 31 July 2011.
On 1 July 2011, the Group completed the purchase of the remaining 50% of RD1 Limited. The Group recorded a gain of $23 million relating to this business combination in the year ended 31 July 2011. This gain represents the difference between the carrying value of the Group’s equity accounted investment in RD1 at the time of acquisition of the remaining 50%, and the fair value of that pre-existing interest. This gain was recognised in other operating income, in the New Zealand Milk Products segment result. This transaction is not considered material and therefore no further disclosure has been made.
NOTES TO THE FINANCIAL STATEMENTS CONTINUEDFOR THE YEAR ENDED 31 JULY 2012
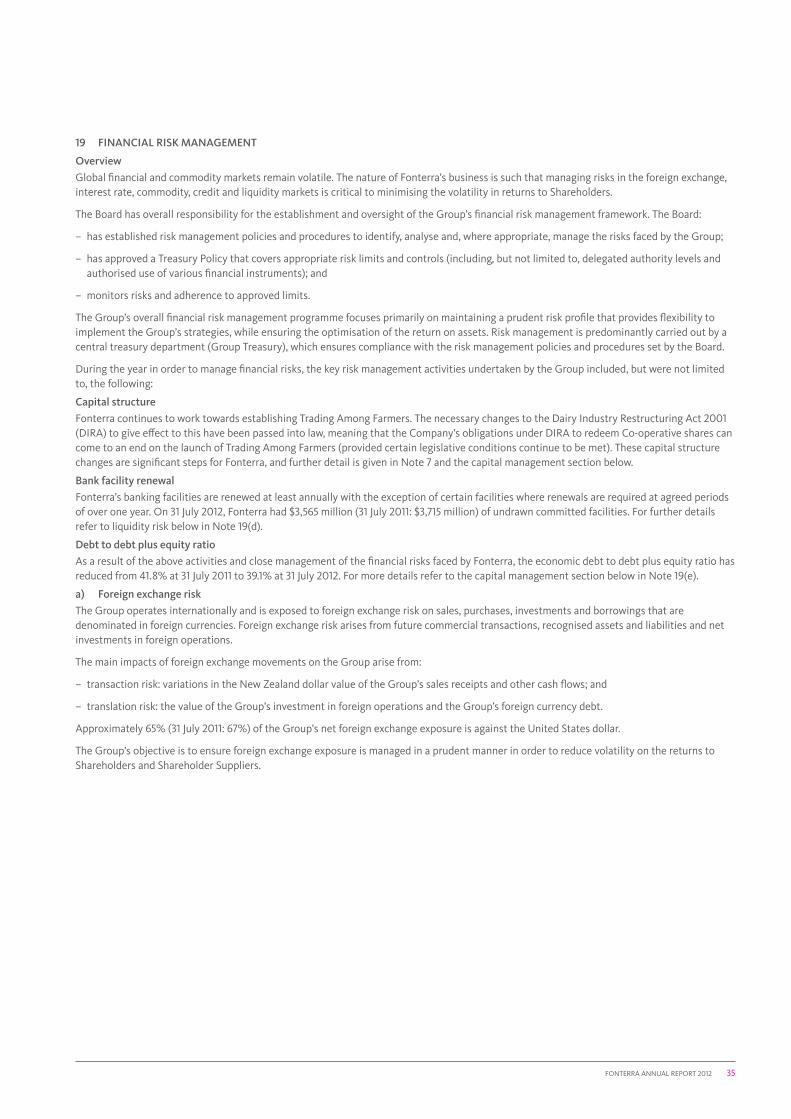
FONTERRA ANNUAL REPORT 2012 35
19 FINANCIAL RISk MANAGEMENT
Overview
Global financial and commodity markets remain volatile. The nature of Fonterra’s business is such that managing risks in the foreign exchange, interest rate, commodity, credit and liquidity markets is critical to minimising the volatility in returns to Shareholders.
The Board has overall responsibility for the establishment and oversight of the Group’s financial risk management framework. The Board:
– has established risk management policies and procedures to identify, analyse and, where appropriate, manage the risks faced by the Group;
– has approved a Treasury Policy that covers appropriate risk limits and controls (including, but not limited to, delegated authority levels and authorised use of various financial instruments); and
– monitors risks and adherence to approved limits.
The Group’s overall financial risk management programme focuses primarily on maintaining a prudent risk profile that provides flexibility to implement the Group’s strategies, while ensuring the optimisation of the return on assets. Risk management is predominantly carried out by a central treasury department (Group Treasury), which ensures compliance with the risk management policies and procedures set by the Board.
During the year in order to manage financial risks, the key risk management activities undertaken by the Group included, but were not limited to, the following:
Capital structure
Fonterra continues to work towards establishing Trading Among Farmers. The necessary changes to the Dairy Industry Restructuring Act 2001 (DIRA) to give effect to this have been passed into law, meaning that the Company’s obligations under DIRA to redeem Co-operative shares can come to an end on the launch of Trading Among Farmers (provided certain legislative conditions continue to be met). These capital structure changes are significant steps for Fonterra, and further detail is given in Note 7 and the capital management section below.
Bank facility renewal
Fonterra’s banking facilities are renewed at least annually with the exception of certain facilities where renewals are required at agreed periods of over one year. On 31 July 2012, Fonterra had $3,565 million (31 July 2011: $3,715 million) of undrawn committed facilities. For further details refer to liquidity risk below in Note 19(d).
Debt to debt plus equity ratio
As a result of the above activities and close management of the financial risks faced by Fonterra, the economic debt to debt plus equity ratio has reduced from 41.8% at 31 July 2011 to 39.1% at 31 July 2012. For more details refer to the capital management section below in Note 19(e).
a) Foreign exchange risk
The Group operates internationally and is exposed to foreign exchange risk on sales, purchases, investments and borrowings that are denominated in foreign currencies. Foreign exchange risk arises from future commercial transactions, recognised assets and liabilities and net investments in foreign operations.
The main impacts of foreign exchange movements on the Group arise from:
– transaction risk: variations in the New Zealand dollar value of the Group’s sales receipts and other cash flows; and
– translation risk: the value of the Group’s investment in foreign operations and the Group’s foreign currency debt.
Approximately 65% (31 July 2011: 67%) of the Group’s net foreign exchange exposure is against the United States dollar.
The Group’s objective is to ensure foreign exchange exposure is managed in a prudent manner in order to reduce volatility on the returns to Shareholders and Shareholder Suppliers.

36 FONTERRA ANNUAL REPORT 2012
NOTES TO THE FINANCIAL STATEMENTS CONTINUEDFOR THE YEAR ENDED 31 JULY 2012
19 FINANCIAL RISk MANAGEMENT CONTINUED
In respect of transaction hedging the Group’s policy is to hedge 100% of the net recognised foreign currency trade receivables and foreign currency trade payables, and up to 100% of forecast cash receipts from sales for a period of up to 18 months. The level of hedging undertaken is influenced by current exchange rates and the time until the expected cash flows occur, within the limits approved by the Board. The Group seeks to designate items in a hedge relationship where it is practical to do so; therefore some derivative instruments entered into as economic hedges may not be in a designated hedge relationship for accounting purposes.
In respect of translation hedging, during the year the Group amended its policy from hedging between 50% and 100% of material net translation exposures to hedge between nil and 100% of material net translation exposures. Group Treasury uses forward foreign exchange contracts, currency options and cross currency interest rate swaps to hedge its foreign exchange risk. The Group’s investments in foreign operations can be hedged by a combination of derivative instruments and borrowings in the relevant currencies.
Exposure to foreign currency risk
The significant notional unhedged exposures to foreign currencies are as follows:
GROUP $ MILLION PARENT $ MILLION
AS AT 31 JULY 2012
AS AT 31 JULY 2011
AS AT 31 JULY 2012
AS AT 31 JULY 2011
USD United States dollar 115 34 (8,264) (7,469)
EUR Euro 291 80 (123) (190)
AUD Australian dollar 2,005 1,002 (13) (654)
GBP Great Britain pound 2 3 (19) (67)
JPY Japanese yen 117 79 (1) –
BRL Brazilian real 158 199 – –
CLP Chilean peso 427 303 – (55)
CNY Chinese yuan 55 39 (51) –
SGD Singapore dollar 788 473 (3) (234)
Parent carries economic hedge derivative contracts for risks that sit elsewhere in the Group.
Included in the analysis above are derivative contracts with notional balances of $6,429 million (31 July 2011: $5,860 million) in respect of forecast and actual sale transactions.
Foreign exchange sensitivity
A 10% movement in the value of the New Zealand dollar against the key currencies to which the Group is exposed would result in the following post-tax (using appropriate tax rates) increase/(decrease) to equity and profit. A 10% movement in exchange rates is considered reasonably possible over the short term given historical fluctuations in the value of the New Zealand dollar.
GROUP $ MILLION PARENT $ MILLION
31 JULY 2012 31 JULY 2011 31 JULY 2012 31 JULY 2011
EQUITY PROFIT EQUITY PROFIT EQUITY PROFIT EQUITY PROFIT
Impact of a 10% strengthening of the NZD 13 (9) (46) 3 (19) – (37) –
Impact of a 10% weakening of the NZD 35 (10) 132 (21) 23 – 46 –
The Parent has no sensitivity to foreign exchange movements in the income statement as gains and losses are passed to a subsidiary through a novation agreement.

FONTERRA ANNUAL REPORT 2012 37
b) Interest rate risk
The Group’s interest rate risk arises from its borrowings and funds on deposit. Borrowings issued and funds on deposit held at variable rates expose the Group to cash flow interest rate risk. Borrowings issued at fixed rates expose the Group to fair value interest rate risk.
The Group borrows a mixture of fixed and variable rate debt in a range of currencies. The Group actively hedges its repricing profile using interest rate swaps in accordance with its Treasury Policy in order to manage the volatility of finance costs. The Group’s benchmark is to ensure between 20% and 55% of interest payments are fixed depending upon the maturity of the debt.
Exposure to interest rate risk
Sensitivities to interest rate risk have been assessed on the basis of a 100 basis point movement in interest rates. A 100 basis point movement is considered reasonably possible over the short term. Sensitivities are presented net of tax, using appropriate tax rates.
Fair value sensitivity analysis
A change in interest rates impacts the fair value of the Group’s interest rate derivatives and where changes in hedged risks on certain debt instruments are recognised at fair value. The fair value sensitivity to a 100 basis point movement in interest rates (based on financial assets and liabilities held at the balance date) is as follows:
GROUP $ MILLION PARENT $ MILLION
31 JULY 2012 31 JULY 2011 31 JULY 2012 31 JULY 2011
Fair value gain/(loss) from 100 bp increase 64 74 64 74
Fair value gain/(loss) from 100 bp decrease (70) (81) (70) (81)
Cash flow sensitivity analysis
A change in the interest rates would also impact on interest payments and receipts on the Group’s floating rate debt instruments (including the floating leg of any interest rate derivatives). The cash flow sensitivity to a 100 basis point movement in interest rates (based on financial assets and liabilities held at the balance date) is as follows:
GROUP $ MILLION PARENT $ MILLION
31 JULY 2012 31 JULY 2011 31 JULY 2012 31 JULY 2011
One year cash flow impact of 100 bp increase (13) (15) (13) (15)
One year cash flow impact of 100 bp decrease 13 15 12 15
c) Credit risk
Credit risk is the risk of financial loss to the Group if a customer or counterparty to a financial instrument fails to meet its contractual obligations, and arises principally from the Group’s receivables from customers and derivative financial instruments.
The Group operates a policy of only entering into contracts for sale with customers whose credit limits are in accordance with the Group’s delegated authorities approved by the Board. For export customers located outside of New Zealand credit risk mitigant tools such as letters of credit may be utilised in conjunction with credit limits.
The ageing profile of Group trade and other receivables (excluding prepayments) is as follows:
PAST DUE BUT NOT IMPAIRED
$ MILLION
NEITHER PAST DUE
NOR IMPAIRED
LESS THAN 1 MONTH PAST DUE
MORE THAN 1 MONTH
BUT LESS THAN 3 MONTHS
PAST DUE
MORE THAN 3 MONTHS PAST
DUE TOTAL
As at 31 July 2012 1,859 238 84 48 2,229
As at 31 July 2011 1,807 230 113 51 2,201
Parent has no trade and other receivables that are past due (31 July 2011: nil).
The Group does not hold collateral or security in relation to credit risk and has no undue concentrations of credit risk.

38 FONTERRA ANNUAL REPORT 2012
19 FINANCIAL RISk MANAGEMENT CONTINUED
The Group has a policy to limit its exposure to credit risk by entering into transactions only with financial counterparties that have a credit rating of at least ‘A-’ from Standard & Poor’s or equivalent. Given this high credit rating threshold, management does not expect these counterparties to fail to meet their obligations. Exceptions to this policy are authorised in accordance with the Board-approved Financial Risk Management Standard.
The Group has assessed trade and other receivables requiring specific impairment at balance date. As a result $29 million (31 July 2011: $21 million) has been provided against these balances. This represents 0.15% (31 July 2011: 0.11%) of the total revenue from sale of goods.
The maximum credit risk on cash and cash equivalents, trade and other receivables, derivative financial instruments and other investments is best represented by their carrying values.
d) Liquidity risk
Liquidity risk is the risk that the Group will not be able to meet its financial obligations as they fall due. The Group’s approach to managing liquidity is to ensure that it will always have sufficient liquidity to meet its liabilities when due, under both normal and stressed conditions, without incurring unacceptable losses or risking damage to the Group’s reputation.
The Group has a policy in place to ensure that it has sufficient cash or facilities on demand to meet expected operational expenses for a period of at least 80 days, including the servicing of financial obligations; this excludes the potential impact of extreme circumstances that cannot reasonably be predicted, such as natural disasters. In such situations back-up funding lines are maintained and as set out in the Company’s constitution, the Company can defer payments to Shareholder Suppliers if necessary.
Group Treasury manages the Group’s liquidity by retaining cash and marketable securities, the availability of funding from an adequate amount of committed credit facilities and the ability to close out market positions. At balance date the Group had undrawn lines of credit totalling $3,565 million (31 July 2011: $3,715 million), and the Parent had undrawn lines of credit of $2,080 million (31 July 2011: $2,003 million). The liquidity and refinancing risks are also managed by ensuring that Fonterra can maintain access to funding markets throughout the world. To that end, Fonterra maintains debt issuance programmes in a number of key markets and manages relationships with international investors. An illustration of this is the recent issue in Australia of AUD $150 million of medium-term notes with a maturity of ten years.
NOTES TO THE FINANCIAL STATEMENTS CONTINUEDFOR THE YEAR ENDED 31 JULY 2012
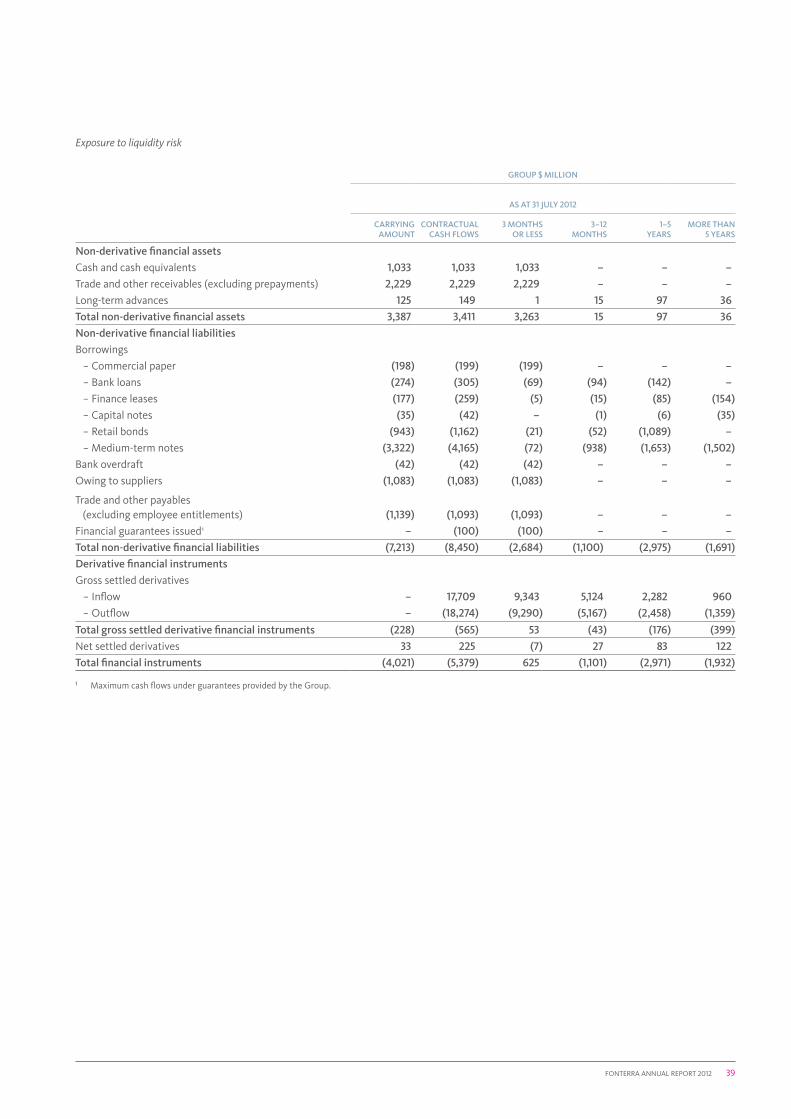
FONTERRA ANNUAL REPORT 2012 39
Exposure to liquidity risk
GROUP $ MILLION
AS AT 31 JULY 2012
CARRYING AMOUNT
CONTRACTUAL CASH FLOWS
3 MONTHS OR LESS
3–12 MONTHS
1–5 YEARS
MORE THAN 5 YEARS
Non-derivative financial assets
Cash and cash equivalents 1,033 1,033 1,033 – – –
Trade and other receivables (excluding prepayments) 2,229 2,229 2,229 – – –
Long-term advances 125 149 1 15 97 36
Total non-derivative financial assets 3,387 3,411 3,263 15 97 36
Non-derivative financial liabilities
Borrowings
− Commercial paper (198) (199) (199) – – –
− Bank loans (274) (305) (69) (94) (142) –
− Finance leases (177) (259) (5) (15) (85) (154)
− Capital notes (35) (42) – (1) (6) (35)
− Retail bonds (943) (1,162) (21) (52) (1,089) –
− Medium-term notes (3,322) (4,165) (72) (938) (1,653) (1,502)
Bank overdraft (42) (42) (42) – – –
Owing to suppliers (1,083) (1,083) (1,083) – – –
Trade and other payables (excluding employee entitlements) (1,139) (1,093) (1,093) – – –
Financial guarantees issued1 – (100) (100) – – –
Total non-derivative financial liabilities (7,213) (8,450) (2,684) (1,100) (2,975) (1,691)
Derivative financial instruments
Gross settled derivatives
− Inflow – 17,709 9,343 5,124 2,282 960
− Outflow – (18,274) (9,290) (5,167) (2,458) (1,359)
Total gross settled derivative financial instruments (228) (565) 53 (43) (176) (399)
Net settled derivatives 33 225 (7) 27 83 122
Total financial instruments (4,021) (5,379) 625 (1,101) (2,971) (1,932)
1 Maximum cash flows under guarantees provided by the Group.

40 FONTERRA ANNUAL REPORT 2012
NOTES TO THE FINANCIAL STATEMENTS CONTINUEDFOR THE YEAR ENDED 31 JULY 2012
19 FINANCIAL RISk MANAGEMENT CONTINUED
Exposure to liquidity risk
GROUP $ MILLION
AS AT 31 JULY 2011
CARRYING AMOUNT
CONTRACTUAL CASH FLOWS
3 MONTHS OR LESS
3–12 MONTHS
1–5 YEARS
MORE THAN 5 YEARS
Non-derivative financial assets
Cash and cash equivalents 785 785 785 – – –
Trade and other receivables (excluding prepayments) 2,201 2,201 2,201 – – –
Long-term advances 122 154 10 31 72 41
Total non-derivative financial assets 3,108 3,140 2,996 31 72 41
Non-derivative financial liabilities
Borrowings
− Commercial paper (50) (50) (50) – – –
− Bank loans (491) (507) (52) (301) (154) –
− Finance leases (179) (274) (5) (14) (86) (169)
− Capital notes (35) (43) – (1) (7) (35)
− Retail bonds (940) (1,234) (21) (52) (1,161) –
− Medium-term notes (2,955) (3,888) (70) (142) (2,415) (1,261)
Bank overdraft (23) (23) (23) – – –
Owing to suppliers (1,679) (1,679) (1,679) – – –
Trade and other payables (excluding employee entitlements) (1,136) (1,081) (1,081) – – –
Financial guarantees issued1 – (104) (104) – – –
Total non-derivative financial liabilities (7,488) (8,883) (3,085) (510) (3,823) (1,465)
Derivative financial instruments
Gross settled derivatives
− Inflow – 17,598 9,045 6,041 1,571 941
− Outflow – (17,467) (8,687) (5,333) (2,011) (1,436)
Total gross settled derivative financial instruments 477 131 358 708 (440) (495)
Net settled derivatives 1 234 (7) 22 74 145
Total financial instruments (3,902) (5,378) 262 251 (4,117) (1,774)
1 Maximum cash flows under guarantees provided by the Group.

FONTERRA ANNUAL REPORT 2012 41
Exposure to liquidity risk
PARENT $ MILLION
AS AT 31 JULY 2012
CARRYING AMOUNT
CONTRACTUAL CASH FLOWS
3 MONTHS OR LESS
3–12 MONTHS
1–5 YEARS
MORE THAN 5 YEARS
Non-derivative financial assets
Cash and cash equivalents 793 793 793 – – –
Trade and other receivables (excluding prepayments) 4 4 4 – – –
Long-term advances 3 4 – – 1 3
Total non-derivative financial assets 800 801 797 – 1 3
Non-derivative financial liabilities
Borrowings
− Commercial paper (198) (199) (199) – – –
− Bank loans (1) (1) (1) – – –
− Finance leases (147) (228) (4) (11) (59) (154)
− Capital notes (35) (42) – (1) (6) (35)
− Retail bonds (943) (1,162) (21) (52) (1,089) –
− Medium-term notes (2,690) (3,328) (19) (904) (1,149) (1,256)
Owing to suppliers (1,134) (1,134) (1,134) – – –
Trade and other payables (excluding employee entitlements) (102) (63) (63) – – –
Financial guarantees issued1 – (1,980) (1,980) – – –
Total non-derivative financial liabilities (5,250) (8,137) (3,421) (968) (2,303) (1,445)
Derivative financial instruments
Gross settled derivatives
− Inflow – 16,774 8,893 5,029 1,892 960
− Outflow – (17,345) (8,837) (5,071) (2,078) (1,359)
Total gross settled derivative financial instruments (226) (571) 56 (42) (186) (399)
Net settled derivatives 34 226 (7) 28 83 122
Total financial instruments (4,642) (7,681) (2,575) (982) (2,405) (1,719)
1 Maximum cash flows under guarantees provided by the Parent.
Amounts due to and from consolidated Group entities that are repayable on demand (refer to Notes 8, 13 and 22) have been excluded from the above table.

42 FONTERRA ANNUAL REPORT 2012
19 FINANCIAL RISk MANAGEMENT CONTINUED
Exposure to liquidity risk
PARENT $ MILLION
AS AT 31 JULY 2011
CARRYING AMOUNT
CONTRACTUAL CASH FLOWS
3 MONTHS OR LESS
3–12 MONTHS
1–5 YEARS
MORE THAN 5 YEARS
Non-derivative financial assets
Cash and cash equivalents 570 570 570 – – –
Trade and other receivables (excluding prepayments) 2 2 2 – – –
Long-term advances 2 3 – – – 3
Total non-derivative financial assets 574 575 572 – – 3
Non-derivative financial liabilities
Borrowings
− Commercial paper (50) (50) (50) – – –
− Bank loans (150) (155) (2) (3) (150) –
− Finance leases (150) (242) (4) (11) (59) (168)
− Capital notes (35) (43) – (1) (7) (35)
− Retail bonds (940) (1,234) (21) (52) (1,161) –
− Medium-term notes (2,527) (3,338) (19) (119) (1,941) (1,259)
Owing to suppliers (1,729) (1,729) (1,729) – – –
Trade and other payables (excluding employee entitlements) (82) (41) (41) – – –
Financial guarantees issued1 – (2,135) (2,135) – – –
Total non-derivative financial liabilities (5,663) (8,967) (4,001) (186) (3,318) (1,462)
Derivative financial instruments
Gross settled derivatives
− Inflow – 17,253 8,722 6,019 1,571 941
− Outflow – (17,118) (8,359) (5,312) (2,011) (1,436)
Total gross settled derivative financial instruments 481 135 363 707 (440) (495)
Net settled derivatives 2 234 (7) 22 74 145
Total financial instruments (4,606) (8,023) (3,073) 543 (3,684) (1,809)
1 Maximum cash flows under guarantees provided by the Parent.
Amounts due to and from consolidated Group entities that are repayable on demand (refer to Notes 8, 13 and 22) have been excluded from the above table.
e) Capital management
The Board’s objective is to maximise Shareholder returns over time by maintaining an optimal capital structure. The Group provides returns to Shareholders through a milk price, dividends, and changes in the Company’s share price. In order to maintain an appropriate capital structure, the Board may decide to retain profits within the Group.
The Board undertook a review of the capital structure in 2009, which identified a series of changes as set out in Note 7. These changes are intended to strengthen the statement of financial position, primarily by removing redemption risk and providing a framework conducive to ongoing retentions.
The Board closely monitors the Group’s debt to debt plus equity ratio. This ratio is calculated as economic net interest bearing debt divided by total capital. Economic net interest bearing debt is calculated as disclosed in Note 15. Total capital is calculated as equity, as presented on the statement of financial position (excluding the cash flow hedge reserve), plus net interest bearing debt. The economic debt to debt plus equity ratio as at 31 July 2012 was 39.1% (31 July 2011: 41.8%), which is below the Board’s target of 45%-50%.
The Group is not subject to externally imposed capital requirements.
NOTES TO THE FINANCIAL STATEMENTS CONTINUEDFOR THE YEAR ENDED 31 JULY 2012
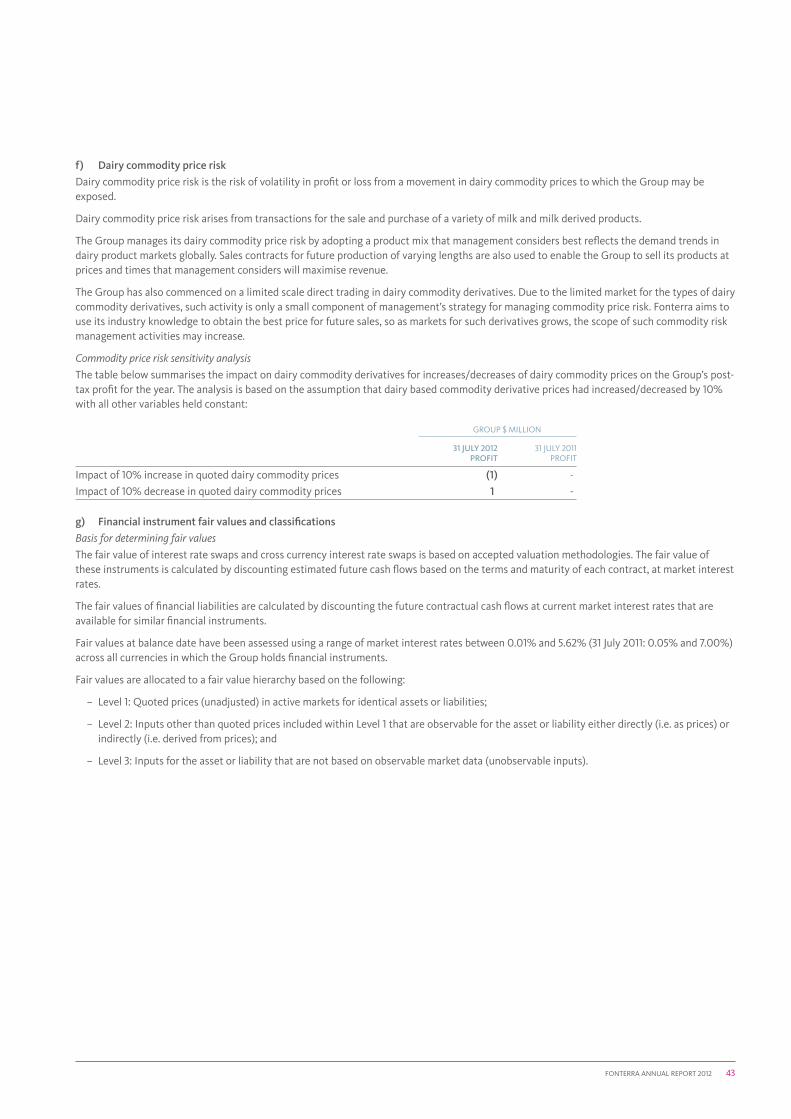
FONTERRA ANNUAL REPORT 2012 43
f) Dairy commodity price risk
Dairy commodity price risk is the risk of volatility in profit or loss from a movement in dairy commodity prices to which the Group may be exposed.
Dairy commodity price risk arises from transactions for the sale and purchase of a variety of milk and milk derived products.
The Group manages its dairy commodity price risk by adopting a product mix that management considers best reflects the demand trends in dairy product markets globally. Sales contracts for future production of varying lengths are also used to enable the Group to sell its products at prices and times that management considers will maximise revenue.
The Group has also commenced on a limited scale direct trading in dairy commodity derivatives. Due to the limited market for the types of dairy commodity derivatives, such activity is only a small component of management’s strategy for managing commodity price risk. Fonterra aims to use its industry knowledge to obtain the best price for future sales, so as markets for such derivatives grows, the scope of such commodity risk management activities may increase.
Commodity price risk sensitivity analysis
The table below summarises the impact on dairy commodity derivatives for increases/decreases of dairy commodity prices on the Group’s post-tax profit for the year. The analysis is based on the assumption that dairy based commodity derivative prices had increased/decreased by 10% with all other variables held constant:
GROUP $ MILLION
31 JULY 2012 PROFIT
31 JULY 2011 PROFIT
Impact of 10% increase in quoted dairy commodity prices (1) -
Impact of 10% decrease in quoted dairy commodity prices 1 -
g) Financial instrument fair values and classifications
Basis for determining fair values
The fair value of interest rate swaps and cross currency interest rate swaps is based on accepted valuation methodologies. The fair value of these instruments is calculated by discounting estimated future cash flows based on the terms and maturity of each contract, at market interest rates.
The fair values of financial liabilities are calculated by discounting the future contractual cash flows at current market interest rates that are available for similar financial instruments.
Fair values at balance date have been assessed using a range of market interest rates between 0.01% and 5.62% (31 July 2011: 0.05% and 7.00%) across all currencies in which the Group holds financial instruments.
Fair values are allocated to a fair value hierarchy based on the following:
– Level 1: Quoted prices (unadjusted) in active markets for identical assets or liabilities;
– Level 2: Inputs other than quoted prices included within Level 1 that are observable for the asset or liability either directly (i.e. as prices) or indirectly (i.e. derived from prices); and
– Level 3: Inputs for the asset or liability that are not based on observable market data (unobservable inputs).
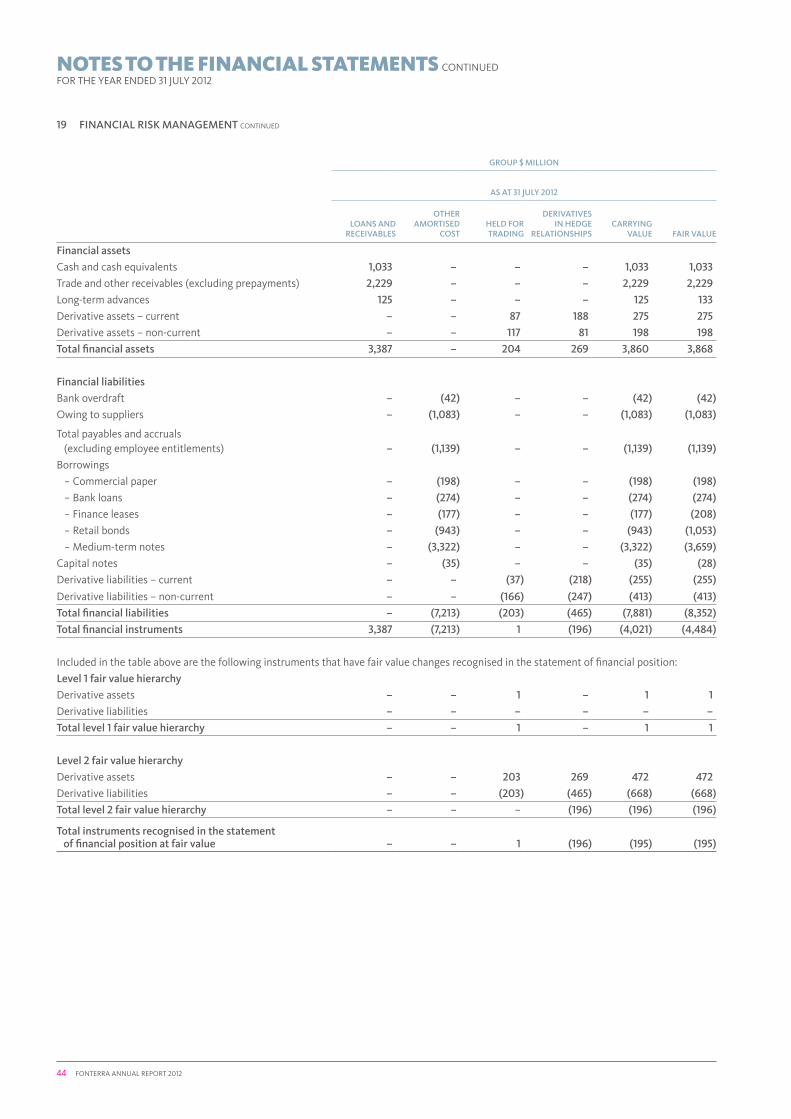
44 FONTERRA ANNUAL REPORT 2012
19 FINANCIAL RISk MANAGEMENT CONTINUED
GROUP $ MILLION
AS AT 31 JULY 2012
LOANS AND RECEIVAbLES
OTHER AMORTISED
COSTHELD FOR TRADING
DERIVATIVES IN HEDGE
RELATIONSHIPSCARRYING
VALUE FAIR VALUE
Financial assets
Cash and cash equivalents 1,033 – – – 1,033 1,033
Trade and other receivables (excluding prepayments) 2,229 – – – 2,229 2,229
Long-term advances 125 – – – 125 133
Derivative assets – current – – 87 188 275 275
Derivative assets – non-current – – 117 81 198 198
Total financial assets 3,387 – 204 269 3,860 3,868
Financial liabilities
Bank overdraft – (42) – – (42) (42)
Owing to suppliers – (1,083) – – (1,083) (1,083)
Total payables and accruals (excluding employee entitlements) – (1,139) – – (1,139) (1,139)
Borrowings
− Commercial paper – (198) – – (198) (198)
− Bank loans – (274) – – (274) (274)
− Finance leases – (177) – – (177) (208)
− Retail bonds – (943) – – (943) (1,053)
− Medium-term notes – (3,322) – – (3,322) (3,659)
Capital notes – (35) – – (35) (28)
Derivative liabilities – current – – (37) (218) (255) (255)
Derivative liabilities – non-current – – (166) (247) (413) (413)
Total financial liabilities – (7,213) (203) (465) (7,881) (8,352)
Total financial instruments 3,387 (7,213) 1 (196) (4,021) (4,484)
Included in the table above are the following instruments that have fair value changes recognised in the statement of financial position:
Level 1 fair value hierarchy
Derivative assets – – 1 – 1 1
Derivative liabilities – – – – – –
Total level 1 fair value hierarchy – – 1 – 1 1
Level 2 fair value hierarchy
Derivative assets – – 203 269 472 472
Derivative liabilities – – (203) (465) (668) (668)
Total level 2 fair value hierarchy – – – (196) (196) (196)
Total instruments recognised in the statement of financial position at fair value – – 1 (196) (195) (195)
NOTES TO THE FINANCIAL STATEMENTS CONTINUEDFOR THE YEAR ENDED 31 JULY 2012

FONTERRA ANNUAL REPORT 2012 45
GROUP $ MILLION
AS AT 31 JULY 2011
LOANS AND RECEIVABLES
OTHER AMORTISED
COSTHELD FOR TRADING
DERIVATIVES IN HEDGE
RELATIONSHIPSCARRYING
VALUE FAIR VALUE
Financial assets
Cash and cash equivalents 785 – – – 785 785
Trade and other receivables (excluding prepayments) 2,201 – – – 2,201 2,201
Long-term advances 122 – – – 122 128
Derivative assets – current – – 302 798 1,100 1,100
Derivative assets – non-current – – 32 122 154 154
Total financial assets 3,108 – 334 920 4,362 4,368
Financial liabilities
Bank overdraft – (23) – – (23) (23)
Owing to suppliers – (1,679) – – (1,679) (1,679)
Total payables and accruals (excluding employee entitlements) – (1,136) – – (1,136) (1,136)
Borrowings
− Commercial paper – (50) – – (50) (50)
− Bank loans – (491) – – (491) (491)
− Finance leases – (179) – – (179) (201)
− Retail bonds – (940) – – (940) (1,042)
− Medium-term notes – (2,955) – – (2,955) (3,238)
Capital notes – (35) – – (35) (30)
Derivative liabilities – current – – (41) (17) (58) (58)
Derivative liabilities – non-current – – (110) (608) (718) (718)
Total financial liabilities – (7,488) (151) (625) (8,264) (8,666)
Total financial instruments 3,108 (7,488) 183 295 (3,902) (4,298)
Included in the table above are the following instruments that have fair value changes recognised in the statement of financial position:
Level 1 fair value hierarchy
Derivative assets – – – – – –
Derivative liabilities – – (1) – (1) (1)
Total level 1 fair value hierarchy – – (1) – (1) (1)
Level 2 fair value hierarchy
Derivative assets – – 334 920 1,254 1,254
Derivative liabilities – – (150) (625) (775) (775)
Total level 2 fair value hierarchy – – 184 295 479 479
Total instruments recognised in the statement of financial position at fair value – – 183 295 478 478

46 FONTERRA ANNUAL REPORT 2012
19 FINANCIAL RISk MANAGEMENT CONTINUED
PARENT $ MILLION
AS AT 31 JULY 2012
LOANS AND RECEIVAbLES
OTHER AMORTISED
COSTHELD FOR TRADING
DERIVATIVES IN HEDGE
RELATIONSHIPSCARRYING
VALUE FAIR VALUE
Financial assets
Cash and cash equivalents 793 – – – 793 793
Trade and other receivables (excluding prepayments) 8,866 – – – 8,866 8,866
Long-term advances 3 – – – 3 3
Derivative assets – current – – 263 7 270 270
Derivative assets – non-current – – 137 61 198 198
Total financial assets 9,662 – 400 68 10,130 10,130
Financial liabilities
Owing to suppliers – (1,134) – – (1,134) (1,134)
Total payables and accruals (excluding employee entitlements) – (7,031) – – (7,031) (7,031)
Borrowings
− Commercial paper – (198) – – (198) (198)
− Bank loans – (1) – – (1) (1)
− Finance leases – (147) – – (147) (176)
− Retail bonds – (943) – – (943) (1,053)
− Medium-term notes – (2,690) – – (2,690) (2,992)
Capital notes – (35) – – (35) (28)
Derivative liabilities – current – – (37) (210) (247) (247)
Derivative liabilities – non-current – – (171) (242) (413) (413)
Total financial liabilities – (12,179) (208) (452) (12,839) (13,273)
Total financial instruments 9,662 (12,179) 192 (384) (2,709) (3,143)
Included in the table above are the following instruments that have fair value changes recognised in the statement of financial position:
Level 2 fair value hierarchy
Derivative assets – – 400 68 468 468
Derivative liabilities – – (208) (452) (660) (660)
Total level 2 fair value hierarchy – – 192 (384) (192) (192)
Total instruments recognised in the statement of financial position at fair value – – 192 (384) (192) (192)
NOTES TO THE FINANCIAL STATEMENTS CONTINUEDFOR THE YEAR ENDED 31 JULY 2012

FONTERRA ANNUAL REPORT 2012 47
PARENT $ MILLION
AS AT 31 JULY 2011
LOANS AND RECEIVABLES
OTHER AMORTISED
COSTHELD FOR TRADING
DERIVATIVES IN HEDGE
RELATIONSHIPSCARRYING
VALUE FAIR VALUE
Financial assets
Cash and cash equivalents 570 – – – 570 570
Trade and other receivables (excluding prepayments) 9,236 – – – 9,236 9,236
Long-term advances 2 – – – 2 2
Derivative assets – current – – 1,088 – 1,088 1,088
Derivative assets – non-current – – 110 44 154 154
Total financial assets 9,808 – 1,198 44 11,050 11,050
Financial liabilities
Owing to suppliers – (1,729) – – (1,729) (1,729)
Total payables and accruals (excluding employee entitlements) – (7,324) – – (7,324) (7,324)
Borrowings
− Commercial paper – (50) – – (50) (50)
− Bank loans – (150) – – (150) (150)
− Finance leases – (150) – – (150) (169)
− Retail bonds – (940) – – (940) (1,042)
− Medium-term notes – (2,527) – – (2,527) (2,799)
Capital notes – (35) – – (35) (30)
Derivative liabilities – current – – (41) – (41) (41)
Derivative liabilities – non-current – – (113) (605) (718) (718)
Total financial liabilities – (12,905) (154) (605) (13,664) (14,052)
Total financial instruments 9,808 (12,905) 1,044 (561) (2,614) (3,002)
Included in the table above are the following instruments that have fair value changes recognised in the statement of financial position:
Level 2 fair value hierarchy
Derivative assets – – 1,198 44 1,242 1,242
Derivative liabilities – – (154) (605) (759) (759)
Total level 2 fair value hierarchy – – 1,044 (561) 483 483
Total instruments recognised in the statement of financial position at fair value – – 1,044 (561) 483 483
GROUP $ MILLION PARENT $ MILLION
31 JULY 2012 31 JULY 2011 31 JULY 2012 31 JULY 2011
Current 143 740 (12) (13)
Non-current (55) (23) (80) (76)
Total carrying value 88 717 (92) (89)
GROUP $ MILLION PARENT $ MILLION
31 JULY 2012 31 JULY 2011 31 JULY 2012 31 JULY 2011
Cash flow hedge 96 732 (92) (97)
Fair value hedge (292) (464) (292) (464)
Net investment hedge – 27 – –
Total carrying value of derivatives in hedge relationships (196) 295 (384) (561)
The timing of the maturity of the release of the Parent and Group’s cash flow hedge reserve is:
The fair value of derivatives in hedge relationships by type of hedging relationship is:

48 FONTERRA ANNUAL REPORT 2012
NOTES TO THE FINANCIAL STATEMENTS CONTINUEDFOR THE YEAR ENDED 31 JULY 2012
20 CONTINGENT LIAbILITIES
The Group and Parent have no contingent liabilities as at 31 July 2012 (31 July 2011: nil).
In the normal course of its business, Fonterra, its subsidiaries and equity accounted investees are exposed to claims, legal proceedings and arbitrations that may in some cases result in costs to the Group. The Directors believe that these have been adequately provided for and disclosed by the Group and that there are no additional legal proceedings or arbitrations that are pending at the date of these financial statements that require provision or disclosure.
21 COMMITMENTS
Capital and intangible asset expenditure commitments
Capital and intangible asset expenditure contracted for at balance date but not recognised in the financial statements are as follows:
GROUP $ MILLION PARENT $ MILLION
AS AT 31 JULY 2012
AS AT 31 JULY 2011
AS AT 31 JULY 2012
AS AT 31 JULY 2011
Buildings 62 4 – –
Plant, vehicles and equipment 241 223 3 4
Intangible assets 5 4 3 1
Total capital commitments 308 231 6 5
Operating lease commitments
The Group leases premises, plant and equipment. The future aggregate minimum lease payments under non-cancellable operating leases are as follows:
GROUP $ MILLION PARENT $ MILLION
AS AT 31 JULY 2012
AS AT 31 JULY 2011
AS AT 31 JULY 2012
AS AT 31 JULY 2011
Less than one year 76 74 – –
One to five years 162 161 – –
Greater than five years 31 41 – –
Total operating lease commitments 269 276 – –

FONTERRA ANNUAL REPORT 2012 49
22 RELATED PARTY TRANSACTIONS
Equity accounted investees (refer to Note 23) and key management personnel are related parties of the Group. Key management personnel comprises the Board and the Fonterra Management Team.
Transactions were entered into and year end balances arose from transactions with related parties as follows:
Key management personnel remuneration
GROUP $ MILLION PARENT $ MILLION
31 JULY 2012 31 JULY 2011 31 JULY 2012 31 JULY 2011
Short-term employee benefits 12 20 11 19
Long-term employee benefits 3 5 2 4
Termination benefits 1 – 1 –
Directors’ remuneration 2 2 2 2
Total key management personnel remuneration 18 27 16 25
Revenue from the sale of goods
GROUP $ MILLION PARENT $ MILLION
31 JULY 2012 31 JULY 2011 31 JULY 2012 31 JULY 2011
Sale of goods
Equity accounted investees 76 81 – –
Other Group entities – – 9,050 10,257
76 81 9,050 10,257Goods sold to related parties are primarily commodity products and are provided under normal trade terms.
Other operating income
GROUP $ MILLION PARENT $ MILLION
31 JULY 2012 31 JULY 2011 31 JULY 2012 31 JULY 2011
Sale of services
Equity accounted investees 5 5 – –
Other Group entities – – 54 52
5 5 54 52
Royalty and other income
Equity accounted investees 20 21 – –
Services provided to related parties include management fees and are provided under normal trade terms. Royalty and other income received from related parties are provided under normal trade terms.

50 FONTERRA ANNUAL REPORT 2012
22 RELATED PARTY TRANSACTIONS CONTINUED
Purchases of goods and services
GROUP $ MILLION PARENT $ MILLION
31 JULY 2012 31 JULY 2011 31 JULY 2012 31 JULY 2011
Purchases of goods
Equity accounted investees 101 75 – –
Other Group entities – – 16 23
Key management personnel 225 247 225 247
326 322 241 270
Purchases of services
Equity accounted investees 5 2 – –
Other Group entities – – 1 3
5 2 1 3
Goods purchased from related parties are primarily commodity products, which are acquired under normal trade terms.
Services purchased from related parties are primarily commissions paid and are under normal trade terms.
In addition, key management personnel may engage in transactions with other Group entities under normal trade terms.
Transfers of property, plant & equipment and intangible assets
PARENT $ MILLION
31 JULY 2012 31 JULY 2011
Additions of property, plant & equipment from other Group entities – 16
Additions of intangible assets from other Group entities – 5
Total – 21
The Parent entered into transactions with other Group entities to acquire and dispose of property, plant and equipment and intangible assets. These transactions were at the net book value of the assets transferred.
Dividends received
GROUP $ MILLION PARENT $ MILLION
31 JULY 2012 31 JULY 2011 31 JULY 2012 31 JULY 2011
Equity accounted investees 36 63 – –
Other Group entities – – 114 495
36 63 114 495
Balances arising from the sale or purchase of goods or services
GROUP $ MILLION PARENT $ MILLION
AS AT 31 JULY 2012
AS AT 31 JULY 2011
AS AT 31 JULY 2012
AS AT 31 JULY 2011
Receivables1
Equity accounted investees 21 16 – –
Other Group entities – – 85 142
21 16 85 142
Payables
Equity accounted investees 9 8 – –
Other Group entities – – 6 6
Key management personnel2 28 41 28 41
37 49 34 471 There were no material provisions for impairment on the receivables from related parties.
2 Payables to key management personnel relate to amounts owing for milk supplied to the Group by farmer Shareholder Directors.
NOTES TO THE FINANCIAL STATEMENTS CONTINUEDFOR THE YEAR ENDED 31 JULY 2012

FONTERRA ANNUAL REPORT 2012 51
Balances arising from financing arrangements
GROUP $ MILLION PARENT $ MILLION
AS AT 31 JULY 2012
AS AT 31 JULY 2011
AS AT 31 JULY 2012
AS AT 31 JULY 2011
Receivables
Equity accounted investees 59 90 – –
Receivables from other Group entities – – 9,018 9,241
59 90 9,018 9,241
Payables
Equity accounted investees 1 – – –
Payables to other Group entities – – 6,923 7,236
Payables to key management personnel 1 1 – –
2 1 6,923 7,236
Payables to key management personnel relate to unsecured bonds held by Directors or members of the Fonterra Management Team.
Interest income/(expense) from financing arrangements
GROUP $ MILLION PARENT $ MILLION
31 JULY 2012 31 JULY 2011 31 JULY 2012 31 JULY 2011
Interest income
Equity accounted investees 3 4 – –
Other Group entities – – 247 355
3 4 247 355
Interest expense
Other Group entities – – 10 (11)
– – 10 (11)Loans to related parties other than equity accounted investees are unsecured and repayable in cash on demand. Loans to equity accounted investees are unsecured and repayable over varying terms of between two years and 14 years.
Financial guarantees
The Group has provided financial guarantees for several equity accounted investees. The aggregate drawn down amount of equity accounted investees’ liabilities for which the Group is jointly and severally liable is $39 million (31 July 2011: $38 million). The Parent has provided financial guarantees for other Group entities. The amounts drawn down under those guaranteed facilities are $760 million (31 July 2011: $626 million).
Co-operative share transactions with Directors
GROUP $ MILLION PARENT $ MILLION
31 JULY 2012 31 JULY 2011 31 JULY 2012 31 JULY 2011
Co-operative shares issued/(surrendered)
Issued 13 16 13 16
Surrendered (4) (15) (4) (15)
Net movement 9 1 9 1
Dividends paid to Directors 4 3 4 3Co-operative shares issued to Directors during the year were 2,765,815 (31 July 2011: 3,587,230) and Co-operative share surrenders were 893,273 (31 July 2011: 3,274,865).
GROUP $ MILLION PARENT $ MILLION
AS AT 31 JULY 2012
AS AT 31 JULY 2011
AS AT 31 JULY 2012
AS AT 31 JULY 2011
Balances arising from transactions with Directors
Receivable from Directors – – – –
Payable to Directors – – – –

52 FONTERRA ANNUAL REPORT 2012
NOTES TO THE FINANCIAL STATEMENTS CONTINUEDFOR THE YEAR ENDED 31 JULY 2012
22 RELATED PARTY TRANSACTIONS CONTINUED
Commitments
In addition to the transactions disclosed above, the Group has prospective commitments with related parties including contracts with equity accounted investees for the supply of dairy products, energy and the provision of various management services. These transactions are to be carried out at normal market prices and on an arm’s length basis.
23 GROUP ENTITIES
All subsidiaries and equity accounted investees are involved in the marketing, distribution, processing, technology or financing of dairy products. All Group entities have a balance date of 31 July unless otherwise indicated. Subsidiaries and equity accounted investees with different balance dates from that of the Group are due to legislative requirements in the country the entities are domiciled. Equity accounted investees may also have a different balance date due to alignment with their other investor’s balance date or to align with the milk season. The New Zealand Companies Office has given exemptions for a number of Fonterra’s subsidiaries to maintain balance dates different to that of the Group.
The Group holds investments in certain countries that have some limited restrictions on the repatriation of funds back to the Parent. This does not result in any significant restriction on the flow of funds for the Group.
The significant subsidiaries and equity accounted investees of the Group are listed below:
OWNERSHIP INTERESTS (%)
OVERSEAS SUBSIDIARIESCOUNTRY OF
INCORPORATIONAS AT
31 JULY 2012AS AT
31 JULY 2011
Fonterra Australia Pty Limited Australia 100 100
Fonterra Brands (Australia) Pty Limited Australia 100 100
Fonterra (Brasil) Limitada1 Brazil 100 100
Soprole S.A.1 Chile 99.9 99.9
Fonterra Commercial Trading (Shanghai) Company Limited1 China 100 100
Tangshan Fonterra Dairy Farm Limited China 85 85
PT Fonterra Brands Indonesia Indonesia 100 100
Fonterra Brands (Japan) Limited Japan 100 100
Fonterra Brands (Malaysia) Sdn Bhd Malaysia 100 100
Fonterra (Ing.) Limited Mauritius 51 51
Fonterra (Mexico) S.A. de C.V.1 Mexico 100 100
Fonterra (Europe) Coöperatie U.A. Netherlands 100 100
Fonterra Brands Phils. Inc. Philippines 100 100
Saudi New Zealand Milk Products Company Limited Saudi Arabia 100 100
Fonterra Brands (Singapore) Pte Limited Singapore 100 100
Fonterra Brands (New Young) Pte Limited Singapore 51 51
Fonterra (SEA) Pte Limited Singapore 100 100
Fonterra Brands Lanka (Private) Limited Sri Lanka 100 100
Fonterra Brands (Thailand) Limited Thailand 100 100
Fonterra (USA) Inc USA 100 100
Fonterra Venezuela S.A. Venezuela 100 100
Fonterra Brands (Viet Nam) Company Limited2 Vietnam 100 100
1 Balance date 31 December.
2 Balance date 30 June.

FONTERRA ANNUAL REPORT 2012 53
OWNERSHIP INTERESTS (%)
NEW ZEALAND SUBSIDIARIESAS AT
31 JULY 2012AS AT
31 JULY 2011
Anchor Ethanol Limited 100 100
Canpac International Limited 100 100
Fonterra Brands (New Zealand) Limited 100 100
Fonterra Brands (Tip Top) Limited 100 100
Fonterra Limited 100 100
Fonterra (New Zealand) Limited 100 100
New Zealand Dairy Board 100 100
NZAgbiz Limited 100 100
RD1 Limited 100 100
ViaLactia Biosciences (NZ) Limited 100 100
The ownership interest of the following entities is 50% or less. However, they have been consolidated on the basis that the Group controls them based on its capacity to govern the financing and operating policies of the entities so as to obtain benefits from their activities.
OWNERSHIP INTERESTS (%)
OVERSEAS SUBSIDIARIES 50% OR LESS OWNERSHIPCOUNTRY OF
INCORPORATIONAS AT
31 JULY 2012AS AT
31 JULY 2011
Fonterra (Japan) Limited Japan 50 50
Fonterra Brands (Middle East) L.L.C. UAE 49 49
The ownership interest of the following entities is 50% or less and the Group is not considered to exercise a controlling interest. These entities are therefore accounted for as equity accounted investees.
OWNERSHIP INTERESTS (%)
OVERSEAS EQUITY ACCOUNTED INVESTEESCOUNTRY OF
INCORPORATIONAS AT
31 JULY 2012AS AT
31 JULY 2011
DPA Manufacturing Holdings Limited1 Bermuda 50 50
Dairy Partners Americas Brasil Limitada1 Brazil 50 50
Ecuajugos S.A.1 Ecuador 50 50
DMV Fonterra Excipients GmbH & Co KG1 Germany 50 50
Dairy Industries (Jamaica) Limited1 Jamaica 50 50
DairiConcepts, L.P.1 USA 50 50
DairiConcepts Management, L.L.C.1 USA 50 50
Lactaid Holdings Limited1 Barbados 50 50
1 Balance date 31 December.
OWNERSHIP INTERESTS (%)
NEW ZEALAND EQUITY ACCOUNTED INVESTEESAS AT
31 JULY 2012AS AT
31 JULY 2011
International Nutritionals Limited1 50 50
1 Balance date 31 May.
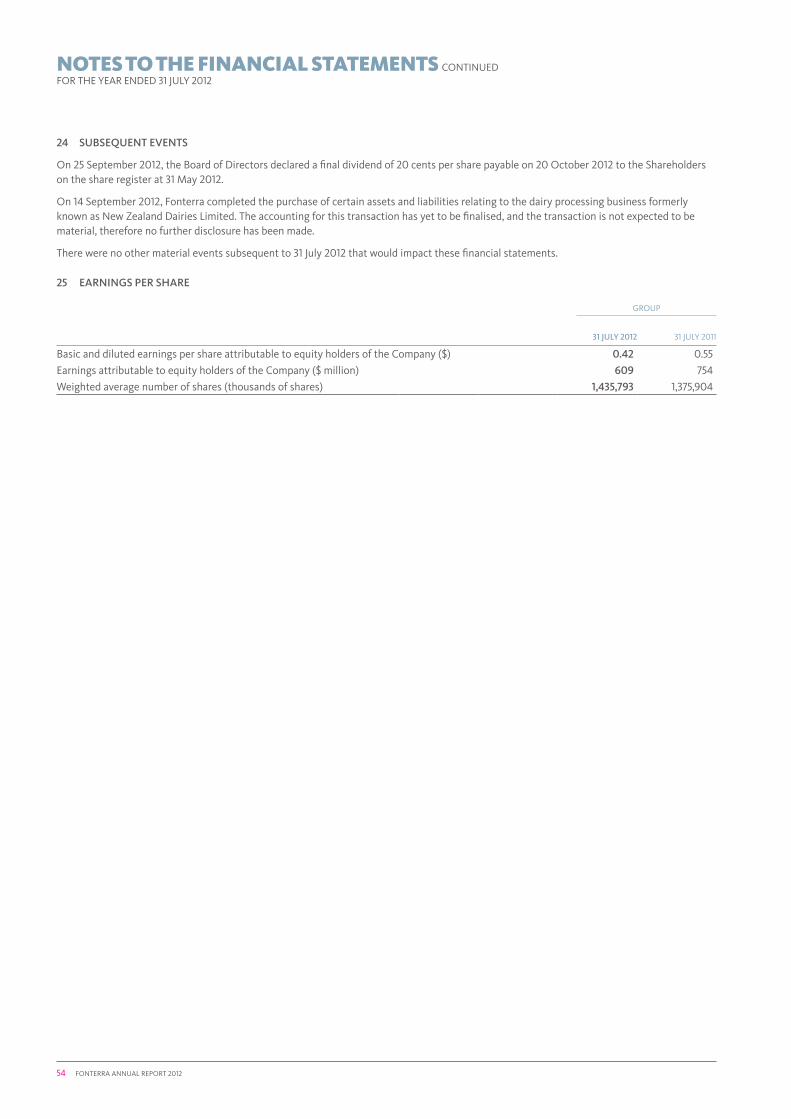
54 FONTERRA ANNUAL REPORT 2012
24 SUbSEQUENT EVENTS
On 25 September 2012, the Board of Directors declared a final dividend of 20 cents per share payable on 20 October 2012 to the Shareholders on the share register at 31 May 2012.
On 14 September 2012, Fonterra completed the purchase of certain assets and liabilities relating to the dairy processing business formerly known as New Zealand Dairies Limited. The accounting for this transaction has yet to be finalised, and the transaction is not expected to be material, therefore no further disclosure has been made.
There were no other material events subsequent to 31 July 2012 that would impact these financial statements.
25 EARNINGS PER SHARE
GROUP
31 JULY 2012 31 JULY 2011
Basic and diluted earnings per share attributable to equity holders of the Company ($) 0.42 0.55
Earnings attributable to equity holders of the Company ($ million) 609 754
Weighted average number of shares (thousands of shares) 1,435,793 1,375,904
NOTES TO THE FINANCIAL STATEMENTS CONTINUEDFOR THE YEAR ENDED 31 JULY 2012

FONTERRA ANNUAL REPORT 2012 55
INDEPENDENT AUDITORS’ REPORTTO THE SHAREHOLDERS OF FONTERRA CO-OPERATIVE GROUP LIMITED
RepoRt on the Financial StatementS
We have audited the financial statements of Fonterra Co-operative Group Limited and its subsidiaries on pages 3 to 54, which comprise the statement of financial position as at 31 July 2012, the income statement, statement of comprehensive income, statement of changes in equity and cash flow statement for the year then ended, and the notes to the financial statements that include a summary of significant accounting policies and other explanatory information for both the Company and the Group. The Group comprises the Company and the entities it controlled at 31 July 2012 or from time to time during the financial year.
Directors’ Responsibility for the Financial Statements
The Directors are responsible for the preparation of these financial statements in accordance with generally accepted accounting practice in New Zealand and that give a true and fair view of the matters to which they relate and for such internal controls as the Directors determine are necessary to enable the preparation of financial statements that are free from material misstatement, whether due to fraud or error.
auditors’ Responsibility
Our responsibility is to express an opinion on these financial statements based on our audit. We conducted our audit in accordance with International Standards on Auditing (New Zealand) and International Standards on Auditing. These standards require that we comply with relevant ethical requirements and plan and perform the audit to obtain reasonable assurance about whether the financial statements are free from material misstatement.
An audit involves performing procedures to obtain audit evidence about the amounts and disclosures in the financial statements. The procedures selected depend on the auditors’ judgement, including the assessment of the risks of material misstatement of the financial statements, whether due to fraud or error. In making those risk assessments, the auditors consider the internal controls relevant to the Company and the Group’s preparation of financial statements that give a true and fair view of the matters to which they relate, in order to design audit procedures that are appropriate in the circumstances, but not for the purpose of expressing an opinion on the effectiveness of the Company and the Group’s internal control. An audit also includes evaluating the appropriateness of accounting policies used and the reasonableness of accounting estimates, as well as evaluating the overall presentation of the financial statements.
We believe that the audit evidence we have obtained is sufficient and appropriate to provide a basis for our audit opinion.
We carry out other assignments on behalf of the Company and the Group in the areas of other audit related services and transaction and other advisory services. Partners and employees of our firm may deal with the Company and the Group on normal terms within the ordinary course of trading activities of the Company and the Group. These matters have not impaired our independence as auditors of the Company and the Group.
opinion
In our opinion, the financial statements on pages 3 to 54:
(i) comply with generally accepted accounting practice in New Zealand; and
(ii) comply with International Financial Reporting Standards; and
(iii) give a true and fair view of the financial position of the Company and the Group as at 31 July 2012, and their financial performance and cash flows for the year then ended.
Report on other legal and Regulatory Requirements
We also report in accordance with Sections 16(1)(d) and 16(1)(e) of the Financial Reporting Act 1993. In relation to our audit of the financial statements for the year ended 31 July 2012:
(i) we have obtained all the information and explanations that we have required; and
(ii) in our opinion, proper accounting records have been kept by the Company as far as appears from an examination of those records.
Restriction on Distribution or Use
This report is made solely to the Company’s shareholders, as a body, in accordance with Section 205(1) of the Companies Act 1993. Our audit work has been undertaken so that we might state to the Company’s shareholders those matters which we are required to state to them in an auditors’ report and for no other purpose. To the fullest extent permitted by law, we do not accept or assume responsibility to anyone other than the Company and the Company’s shareholders, as a body, for our audit work, for this report or for the opinions we have formed.
Chartered Accountants Auckland25 September 2012
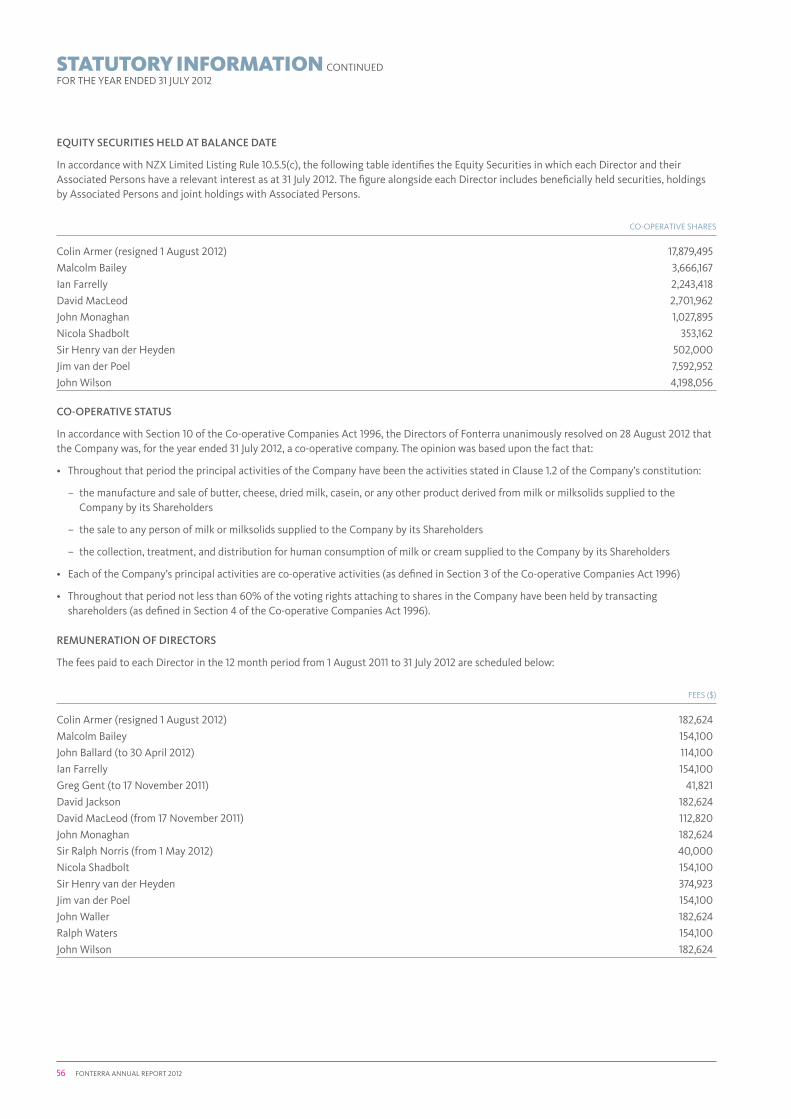
56 FONTERRA ANNUAL REPORT 2012
EQUITY SECURITIES HELD AT bALANCE DATE
In accordance with NZX Limited Listing Rule 10.5.5(c), the following table identifies the Equity Securities in which each Director and their Associated Persons have a relevant interest as at 31 July 2012. The figure alongside each Director includes beneficially held securities, holdings by Associated Persons and joint holdings with Associated Persons.
CO-OPERATIVE SHARES
Colin Armer (resigned 1 August 2012) 17,879,495
Malcolm Bailey 3,666,167
Ian Farrelly 2,243,418
David MacLeod 2,701,962
John Monaghan 1,027,895
Nicola Shadbolt 353,162
Sir Henry van der Heyden 502,000
Jim van der Poel 7,592,952
John Wilson 4,198,056
CO-OPERATIVE STATUS
In accordance with Section 10 of the Co-operative Companies Act 1996, the Directors of Fonterra unanimously resolved on 28 August 2012 that the Company was, for the year ended 31 July 2012, a co-operative company. The opinion was based upon the fact that:
• ThroughoutthatperiodtheprincipalactivitiesoftheCompanyhavebeentheactivitiesstatedinClause1.2 of the Company’s constitution:
– the manufacture and sale of butter, cheese, dried milk, casein, or any other product derived from milk or milksolids supplied to the Company by its Shareholders
– the sale to any person of milk or milksolids supplied to the Company by its Shareholders
– the collection, treatment, and distribution for human consumption of milk or cream supplied to the Company by its Shareholders
• EachoftheCompany’sprincipalactivitiesareco-operativeactivities(asdefinedinSection3 of the Co-operative Companies Act 1996)
• Throughoutthatperiodnotlessthan60% of the voting rights attaching to shares in the Company have been held by transacting shareholders (as defined in Section 4 of the Co-operative Companies Act 1996).
REMUNERATION OF DIRECTORS
The fees paid to each Director in the 12 month period from 1 August 2011 to 31 July 2012 are scheduled below:
FEES ($)
Colin Armer (resigned 1 August 2012) 182,624
Malcolm Bailey 154,100
John Ballard (to 30 April 2012) 114,100
Ian Farrelly 154,100
Greg Gent (to 17 November 2011) 41,821
David Jackson 182,624
David MacLeod (from 17 November 2011) 112,820
John Monaghan 182,624
Sir Ralph Norris (from 1 May 2012) 40,000
Nicola Shadbolt 154,100
Sir Henry van der Heyden 374,923
Jim van der Poel 154,100
John Waller 182,624
Ralph Waters 154,100
John Wilson 182,624
STATUTORY INFORMATION CONTINUEDFOR THE YEAR ENDED 31 JULY 2012

FONTERRA ANNUAL REPORT 2012 57
SUbSIDIARY COMPANY DIRECTORS
The following companies were subsidiaries of Fonterra as at 31 July 2012. Directors as at that date are listed; those who resigned during the year are denoted with an R. Alternate Directors are denoted with an A.
616059 Limited: C P Caldwell, S D T Till, S C R Deschamps (R)
Anchor Ethanol Limited: C P Caldwell, P D Washer
Canpac International Limited: C P Caldwell, B D Mealings, S J Gajzago (R)
Civil Whey Distributors Limited: C P Caldwell, B D Mealings, B P D Taylor
Dairy Industry Superannuation Scheme Trustee Limited: M A Apiata-Wade, B J Kerr, D M Marshall, T P McGuinness, D W C Scott, A K Williams, P D Wynen
Dairy Transport Logistics Limited: C P Caldwell, J P Coote, G A Hoddinott, G J Cochrane (R), K Harris (R), J P Minkhorst (R)
Fantastic Food Limited: J A Luskie, P J W McClure
Fonterra (Asia) Limited: C P Caldwell, M W Smith
Fonterra (International) Limited: C P Caldwell, C E Rowe, P D Washer (R)
Fonterra (Kotahi) Limited: C P Caldwell, J P Coote
Fonterra (Middle East) Limited: C P Caldwell, P D Washer
Fonterra (New Zealand) Limited: C P Caldwell, C E Rowe, P D Washer (R)
Fonterra (Number One) Limited: C P Caldwell, S D T Till, S C R Deschamps (R)
Fonterra Brands (China Holdings) Limited: C P Caldwell, P P Coppes, T L Tan (R)
Fonterra Brands (New Zealand) Limited: C P Caldwell, D K Mallinson
Fonterra Brands (The Pastryhouse) Limited: C P Caldwell, D K Mallinson
Fonterra Brands (Tip Top Investments) Limited: C P Caldwell, D K Mallinson
Fonterra Brands (Tip Top) Limited: C P Caldwell, D K Mallinson
Fonterra Brands Limited: C P Caldwell, J P Mason
Fonterra Commodities Limited: J H Allan, C P Caldwell, I Palliser, P D Washer (R)
Fonterra Dairy Solutions Limited: C P Caldwell, R McNickle
Fonterra Enterprises Limited: C P Caldwell, J P Minkhorst
Fonterra Equities Limited: C P Caldwell, S D T Till, S C R Deschamps (R)
Fonterra Farming Ventures Limited: C P Caldwell, J P Minkhorst
Fonterra Finance Corporation Limited: C P Caldwell, S D T Till, S C R Deschamps (R)
Fonterra Holdings (Americas) Limited: C P Caldwell, K J Murray
Fonterra Holdings (Argentina) Limited: C P Caldwell, K J Murray
Fonterra Holdings (Brazil) Limited: C P Caldwell, K J Murray
Fonterra Holdings (Ecuador) Limited: C P Caldwell, K J Murray
Fonterra Holdings (Venezuela) Limited: C P Caldwell, K J Murray
Fonterra Insurance Limited: C P Caldwell, J P Mason
Fonterra Investments (China) Limited: C P Caldwell, P P Coppes, T L Tan (R)
Fonterra IP Limited: C P Caldwell, S D T Till, S C R Deschamps (R)
Fonterra Limited: C P Caldwell, B Connolly, P D Washer (R)
Fonterra Manufacturing (Americas) Limited: C P Caldwell, K J Murray
Fonterra PGGRC Limited: C P Caldwell, J P Minkhorst
Fonterra Research Centre Limited: C P Caldwell, M W Smith
Fonterra TM Limited: C P Caldwell, S D T Till, S C R Deschamps (R)
Food Solutions Group 2000 Limited: C P Caldwell, S D T Till, S C R Deschamps (R)
Glencoal Energy Limited: C P Caldwell, B D Mealings
Global Dairy Trade Holdings Limited: C P Caldwell, J P Mason
Kapiti Fine Foods Limited: C P Caldwell, D K Mallinson
Kotahi GP Limited: C P Caldwell, J P Coote, K G Winders
MIH Limited: C P Caldwell, J P Minkhorst
New Zealand Dairy Board: C P Caldwell, C E Rowe, P D Washer (R)

58 FONTERRA ANNUAL REPORT 2012
New Zealand Milk (Australasian Holdings) Limited: C P Caldwell, J P Mason
New Zealand Milk (International) Limited: C P Caldwell, J P Mason
New Zealand Milk Brands Limited: C P Caldwell, S D T Till, S C R Deschamps (R)
NZAgbiz Limited: C P Caldwell, J P Minkhorst
NZM (Dairy Holdings) Limited: C P Caldwell, K K Gupta
RD1 Limited: J P Minkhorst, K A Wickham
SAITL Technologies Limited: P G Brown, P J Spooner, P J van Boheemen, J S Wilson
South Auckland Independent Testing Society Limited: P G Brown, P J Spooner, P J van Boheemen, J S Wilson, R D Andela (A)
Sovenz Limited: C P Caldwell, S D T Till, S C R Deschamps (R)
Tangshan Dairy Farm (NZ) Limited: C P Caldwell, P P Coppes, T L Tan (R)
ViaLactia Biosciences (NZ) Limited: C P Caldwell, J P Minkhorst
ViaLactia Bovine Limited: C P Caldwell, J P Minkhorst
ViaLactia Clover Limited: C P Caldwell, J P Minkhorst
Whareroa Co-Generation Limited: C P Caldwell, B D Mealings
A.C.N. 008 668 602 Pty Ltd [Australia]: C P Caldwell, D K Mallinson
A.C.N. 009 163 268 Pty Ltd [Australia]: C P Caldwell, D K Mallinson
A.C.N. 009 235 492 Pty Ltd [Australia]: C P Caldwell, D K Mallinson
A.C.N. 111 834 489 Pty Ltd [Australia]: C P Caldwell, D K Mallinson
A.C.N. 113 345 430 Pty Ltd [Australia]: C P Caldwell, D K Mallinson, B S Donnison (R), P L Thorn (R)
Anmum (Malaysia) Sdn. Bhd. [Malaysia]: M F Bin Wahab, D A Ross, M W Smith, K K Gupta (A)
Australasian Food Holdings Pty Limited [Australia]: C P Caldwell, D K Mallinson
Bonlac Finance Pty Limited [Australia]: C P Caldwell, D K Mallinson
Bonlac Staff Retirement Pty Ltd [Australia]: C P Caldwell, D K Mallinson
Bonland Cheese Trading Pty Ltd [Australia]: C P Caldwell, D K Mallinson
Comercial Dos Alamos S.A. [Chile]: M Berdichevsky Bizama, H Covarrubias Lalanne, P C Muzzio Castelletto, J M Porraz-Lando, S Tagle Perez, E Aldunate Montes (A), S Benavides Méndez (A), R Cubillos Yañez (A), V Flen Silva (A), G Rencoret Mujica (A), J F Silva Barroilhet (R)
Comercial Santa Elena S.A. [Chile]: M Berdichevsky Bizama, H Covarrubias Lalanne, P C Muzzio Castelletto, J M Porraz-Lando, S Tagle Perez, E Aldunate Montes (A), S Benavides Méndez (A), R Cubillos Yañez (A), V Flen Silva (A), G Rencoret Mujica (A), J F Silva Barroilhet (R)
Dairy Enterprises (Chile) Limitada [Chile]: M P Campbell, A J Duncan, K J Murray, R Sepúlveda Seminario, M W Smith, C Bussi (A), J C Gumucio Schönthaler (A), L O Herrera Larraín (A), A Montaner Lewin (A), S Obach González (A) , E A Teisaire (R)
Dairy Enterprises International (Chile) Limited [Cayman Islands]: M P Campbell, E A Teisaire
Dairy Fresh Pty. Ltd. [Australia]: C P Caldwell, D K Mallinson
Dairymas (Malaysia) Sdn Bhd [Malaysia]: M F Bin Wahab, D A Ross, M W Smith, K K Gupta (A)
Fast Forward FFW Limited [United Kingdom]: K Allum, M P Campbell, S P Faulkner, K Liekelema, M J McQuade (R)
Fazenda MIH Ltda [Brazil]: A Z Fortuna, F Jorge
Fonterra (Brasil) Ltda [Brazil]: M M Pérez Ortiz
Fonterra (Canada), Inc. [Canada]: C P Caldwell, B Kipping, G Vita
Fonterra (Centro America) S.A. [Guatemala]: M d R García de Pullin, M M Pérez Ortiz, P D Washer, B T Willis (R)
Fonterra (China) Limited [Hong Kong]: C P Caldwell, P P Coppes, T L Tan, P A Turner
Fonterra (CIS) Limited Liability Company [Russian Federation]: A Rozanov
Fonterra (Europe) Coöperatie U.A. [Netherlands]: C P Caldwell, K Liekelema, M W Smith (R)
Fonterra (Europe) GmbH [Germany]: K Liekelema
Fonterra (France) SAS [France]: K Liekelema
Fonterra (Ing.) Limited [Mauritius]: Lee G, P D Washer
Fonterra (Italy) S.P.A. [Italy]: C P Caldwell, T H D Kühn, K Liekelema, B B Anderson (R), A Lichter (R), P Pennati (R), M W Smith (R)
Fonterra (Japan) Limited [Japan]: P G Brown, C P Caldwell, R M Kennerley, K Kumagai, H Ono, K Ueta
Fonterra (Logistics) Ltd [United Kingdom]: T H D Kühn, G R Sharma
STATUTORY INFORMATION CONTINUEDFOR THE YEAR ENDED 31 JULY 2012

FONTERRA ANNUAL REPORT 2012 59
Fonterra (Mexico) S.A. de C.V. [Mexico]: C P Caldwell, M M Pérez Ortiz, P D Washer, L Barona Mariscal (A), F R Camacho (A), G A Castro Palafox (A), M I Arana Soriano (R) (A)
Fonterra (Pacific) Inc. [United States]: C P Caldwell, M W Smith, G Vita
Fonterra (SEA) Pte. Ltd. [Singapore]: G N Kane, M W Smith
Fonterra (Switzerland) SA [Switzerland]: G Roper, M W Smith
Fonterra (Thailand) Limited [Thailand]: G N Kane, K Vunthanadit
Fonterra (USA) Inc [United States]: C P Caldwell, M W Smith, G Vita
Fonterra (Yutian) Dairy Farm Company Limited [China]: J P Minkhorst, P J Moore, P A Turner
Fonterra Australia Pty Ltd [Australia]: C P Caldwell, D K Mallinson
Fonterra Brands (Asia Holdings) Pte. Ltd [Singapore]: M W Smith, M A Wilson, K K Gupta (R)
Fonterra Brands (Australia) Pty Ltd [Australia]: C P Caldwell, D K Mallinson
Fonterra Brands (Centram), S.A. [Panama]: M P J Bates, M W Smith
Fonterra Brands (Far East) Limited [Hong Kong]: M W Smith, M A Wilson, K K Gupta (R)
Fonterra Brands (Guangzhou) Ltd [China]: P P Coppes, P A Turner, K A Wickham, T L Tan (R)
Fonterra Brands (Guatemala), S.A. [Guatemala]: M P J Bates, M W Smith
Fonterra Brands (Hong Kong) Limited [Hong Kong]: A M Fitzsimmons, C Sin, M W Smith, K K Gupta (R), D A Ross (R)
Fonterra Brands (Japan) Limited [Japan]: C P Caldwell, R M Kennerley
Fonterra Brands (Malaysia) Sdn Bhd [Malaysia]: M F Bin Wahab, D A Ross, M W Smith, K K Gupta (A)
Fonterra Brands (New Young) Pte. Ltd. [Singapore]: A J Bruce, Y Lin, Lin C, Ling J, M W Smith, M A Wilson, A M Fitzsimmons (A)
Fonterra Brands (Singapore) Pte. Ltd [Singapore]: M W Smith, M A Wilson, K K Gupta (R)
Fonterra Brands (Thailand) Ltd [Thailand]: S Aramthip, A M Fitzsimmons, C Phaonimmongkol, M W Smith, M A Wilson
Fonterra Brands (Viet Nam) Company Limited [Viet Nam]: M W Smith, K K Gupta (R)
Fonterra Brands Indonesia, PT [Indonesia]: M Handoyo, M W Smith
Fonterra Brands Lanka (Private) Limited [Sri Lanka]: J H P Gallage, A R R Kasireddy, M W Smith
Fonterra Brands Phils. Inc [Philippines]: M Magtoto, R A Mendoza, C M Mendoza, E Ogsimer, H Ong, M W Smith, M A Wilson, C Guillermo (R), K K Gupta (R)
Fonterra Commercial Trading (Shanghai) Company Limited [China]: W F Chu, P P Coppes, T L Tan, P A Turner
Fonterra Egypt Limited [Egypt]: A Anwar, M W Smith
Fonterra Foods Pty Ltd [Australia]: C P Caldwell, D K Mallinson
Fonterra Foodservices (USA), Inc. [United States]: M W Smith, G Vita
Fonterra Holdings (Thailand) Limited [Thailand]: G N Kane, K Vunthanadit
Fonterra Ingredients Australia Pty Ltd [Australia]: C P Caldwell, D K Mallinson
Fonterra Investments Netherlands Coöperatie U.A. [Netherlands]: K Liekelema, A D Turnbull, J van der Windt, A A Mikhalevsky (R)
Fonterra Investments Pty Limited [Australia]: C P Caldwell, D K Mallinson
Fonterra MIH Holdings Brasil Ltda [Brazil]: A Z Fortuna, F Jorge
Fonterra Milk Australia Pty Ltd [Australia]: C P Caldwell, D K Mallinson
Fonterra Tangshan Dairy Farm (HK) Limited [Hong Kong]: C P Caldwell, P P Coppes, P A Turner
Fonterra Venezuela, S.A. [Venezuela]: C P Caldwell, F C Ortega Becea, P D Washer, O N de Massiani (A), S Guevara Camacho (A), L A Tinoco (A)
Inversiones Dairy Enterprises S.A. [Chile]: M P Campbell, A J Duncan, J C Gumucio Schönthaler, A Montaner Lewin, K J Murray, M W Smith, L O Herrera Larraín (A), R Sepúlveda Seminario (A), J P Egaña Bertoglia (A)(R), S Obach González (A)(R)
Key Ingredients, Inc. [United States]: C P Caldwell, M W Smith, G Vita
Mainland Dairies Pty. Ltd. [Australia]: C P Caldwell, D K Mallinson
Mainland Foodservice Pty Limited [Australia]: C P Caldwell, D K Mallinson
Milk Products Holdings (Middle East) EC [Bahrain]: M W Smith, M A Wilson
Milk Products Holdings (North America) Inc. [United States]: C P Caldwell, M W Smith, G Vita
Murrumbidgee Dairy Products Pty Ltd [Australia]: C P Caldwell, D K Mallinson
New Tai Milk Products Co Ltd [Taiwan]: T H Deane, G N Kane, J Lee, C Lee, Lee G, M Lee, P D Washer, T L Tan (R)
New Zealand Milk (Australasia) Pty Ltd [Australia]: C P Caldwell, D K Mallinson

60 FONTERRA ANNUAL REPORT 2012
New Zealand Milk (Barbados) Ltd [Barbados]: M P J Bates, M W Smith
New Zealand Milk (LATAM) Ltd [Bermuda]: C P Caldwell, K J Murray
Newdale Dairies (Private) Limited [Sri Lanka]: J H P Gallage, A R R Kasireddy, M W Smith
NZAgbiz Australia Pty Ltd [Australia]: C P Caldwell, D K Mallinson
NZMP (AEM) Ltd [United Kingdom]: T H D Kühn, G R Sharma
Recombined Dairy Systems A/S [Denmark]: T H D Kühn, K Liekelema, G R Sharma
Roaming Cow Dairies Pty Ltd [Australia]: C P Caldwell, D K Mallinson
Saudi New Zealand Milk Products Company Limited [Saudi Arabia]: J C Fryer
Sociedad Agrícola y Lechera Praderas Australes S.A. (“Pradesur”) [Chile]: M Berdichevsky Bizama, H Covarrubias Lalanne, J M Porraz-Lando, J F Silva Barroilhet (R)
Sociedad Procesadora de Leche Del Sur S.A. [Chile]: E Alcalde Undurraga, A Cussen Mackenna, J Milic Barros, K J Murray, S Obach González, G Varela Alfonso, J M Alcalde Undurraga (A), J P Matus Pickering (A), A Montaner Lewin (A), S Oddo Gómez (A), J P Orellana Pavón (A), C Perez-Cotapos Subercaseaux (A)
Solid Fresh Food & Beverage (M) Sdn. Bhd. [Malaysia]: M F Bin Wahab, D A Ross, M W Smith, K K Gupta (A)
Soprole Inversiones SA [Chile]: G Bitran Dicowsky, M P Campbell, J R Valente Vias, G Varela Alfonso, A Walker Prieto, S Diez Arriagada (A), R Fernández Robinson (A), C Herrera Barriga (A), R Sepúlveda Seminario (A), R Tisi Lanchares (A)
Soprole S.A. [Chile]: G Bitran Dicowsky, M P Campbell, J R Valente Vias, G Varela Alfonso, A Walker Prieto, S Diez Arriagada (A), R Fernández Robinson (A), C Herrera Barriga (A), R Sepúlveda Seminario (A), R Tisi Lanchares (A)
Tangshan Fonterra Dairy Farm Ltd [China]: P J Moore, P A Turner, Zhang J L, T L Tan (R)
Unilac Australia Pty Ltd [Australia]: C P Caldwell, D K Mallinson
United Milk Tasmania Pty Limited [Australia]: C P Caldwell, D K Mallinson
STATUTORY INFORMATION CONTINUEDFOR THE YEAR ENDED 31 JULY 2012

FONTERRA ANNUAL REPORT 2012 61
REMUNERATION FRAMEWORk
Fonterra operates a Pay for Performance approach to remuneration for salaried employees. We provide competitive salaries in the markets in which we operate with incentives and increases to remuneration being based on the performance of individuals and the organisation.
Our remuneration framework for salaried staff is based on a “total remuneration” approach meaning packages include fixed remuneration (e.g. salary and benefits) and variable remuneration (e.g. Short Term Incentive plan (STI)).
To ensure Fonterra remains competitive in the relevant market, our pay bands are based on information obtained from independent remuneration consultants. The framework is designed to reward exceptional performance taking into account factors such as internal equity and budget constraints.
All elements of the framework contribute to building an overall atmosphere of recognition, innovation and challenge.
Remuneration is important for attracting talent into the organisations, but it is not the only consideration. Attracting and retaining talent also depends on people leadership practices which build an emotional connection to the organisation including: opportunities to get involved in work that offers learning and growth; believing that they are working for an organisation that is making a meaningful contribution; feeling like their work matters and is appreciated and receiving praise and recognition from colleagues and peers. Fonterra’s annual employee survey measures how successful we are at providing these non-financial rewards to employees and action plans address the gaps.
SHORT TERM INCENTIVE (STI) PLANS
Every permanent salaried employee in Fonterra worldwide is invited to participate in the annual STI plans.
STI plans are an important communication device signalling to employees what is important to Fonterra and how success in Fonterra is measured and rewarded. At the commencement of each year a series of Key Performance Indicators (KPIs) are identified and agreed. These KPIs include important financial measures from our three year strategic plan and also include our goals around Health & Safety and other important operational and qualitative measures.
Incentive programmes drive Fonterra’s performance by:
• AligningtheobjectivesoftheCompanytoensurecollaborationandaoneteamapproachtoachieveFonterra’sgoals
• Establishingtargetswhicharechallengingyetachievable
• Linkingspecificlevelsofrewardtoindividual,teamandCompanyperformance
• ProvidinggreatopportunitieswhenFonterra’sbusinessandpeoplearesuccessful.
At the end of each operating year, performance against the KPIs is determined and independently reviewed and approved by the Appointments, Remuneration and Development Committee (AR&DC).
LONG TERM INCENTIVE PLAN (STRATOS) PLAN
For certain key executives, Fonterra operates the Stratos plan. This plan is by invitation only and is designed to motivate, reward and retain key executives. This plan is based on achievement key profitability goals for the Co-operative.
bENEFITS
As Fonterra operates a total remuneration approach benefits are only provided when required by legislation or typical in a particular market. However, Fonterra works hard with suppliers to offer employees discounted products and services. In the year ended 31 July 2012, New Zealand based salaried employees were offered discounted trauma insurance to help take care of them and their families if serious illness occurred.
fixed remuneration sti plans stratos plan
• Provides“stable”baselevelofreward
• Externalandinternalrelativitiesandbudgetconstraints taken into account
• Typicallysetatmarketmedian(forlocalmarket) using independent external benchmark data
• Variesbasedonemployeeskillsandperformance
• Allsalariedemployeeseligible
• Comprehensiverangeoffinancialand non-financial measures including H&S
• Whentargetsareexceededtotalremuneration will be above market median
• Highestperformancereceivesanadditionalmultiplier, lowest performance receives no STI payment
• Restrictedtokeyexecutives
• Focusonoverallprofitabilityofthe Co-operative
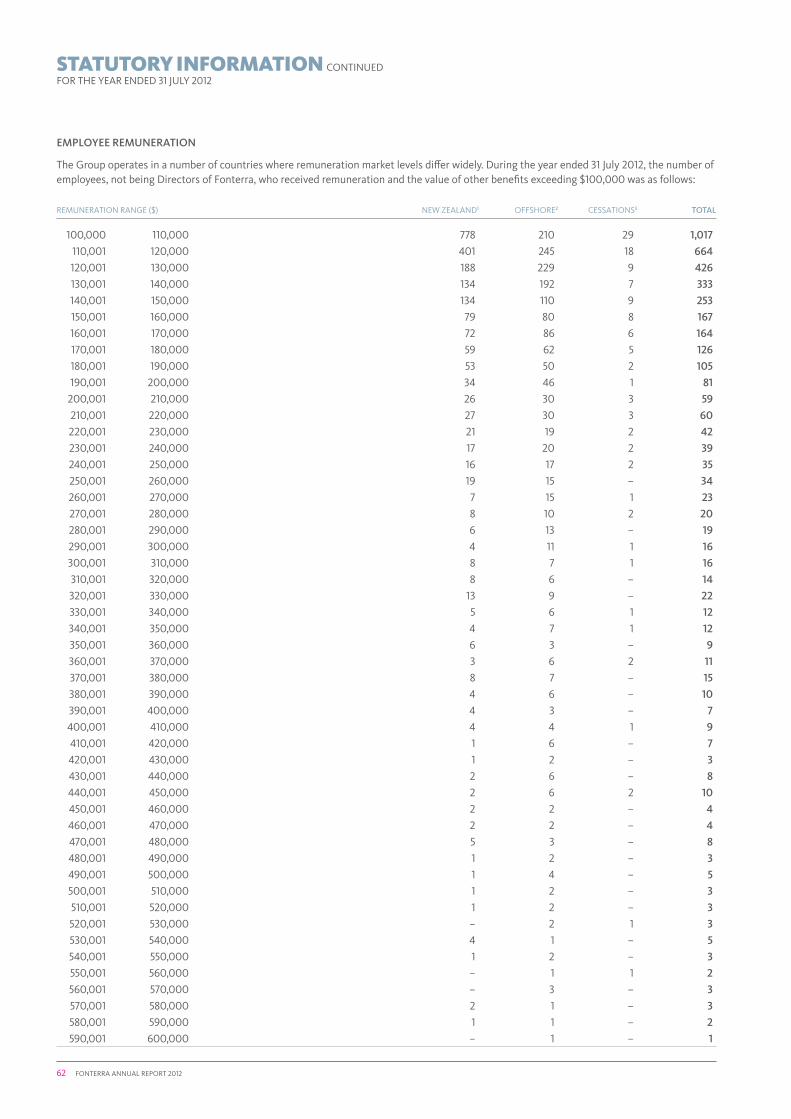
62 FONTERRA ANNUAL REPORT 2012
EMPLOYEE REMUNERATION
The Group operates in a number of countries where remuneration market levels differ widely. During the year ended 31 July 2012, the number of employees, not being Directors of Fonterra, who received remuneration and the value of other benefits exceeding $100,000 was as follows:
REMUNERATION RANGE ($) NEW ZEALAND1 OFFSHORE2 CESSATIONS3 TOTAL
100,000 110,000 778 210 29 1,017
110,001 120,000 401 245 18 664
120,001 130,000 188 229 9 426
130,001 140,000 134 192 7 333
140,001 150,000 134 110 9 253
150,001 160,000 79 80 8 167
160,001 170,000 72 86 6 164
170,001 180,000 59 62 5 126
180,001 190,000 53 50 2 105
190,001 200,000 34 46 1 81
200,001 210,000 26 30 3 59
210,001 220,000 27 30 3 60
220,001 230,000 21 19 2 42
230,001 240,000 17 20 2 39
240,001 250,000 16 17 2 35
250,001 260,000 19 15 – 34
260,001 270,000 7 15 1 23
270,001 280,000 8 10 2 20
280,001 290,000 6 13 – 19
290,001 300,000 4 11 1 16
300,001 310,000 8 7 1 16
310,001 320,000 8 6 – 14
320,001 330,000 13 9 – 22
330,001 340,000 5 6 1 12
340,001 350,000 4 7 1 12
350,001 360,000 6 3 – 9
360,001 370,000 3 6 2 11
370,001 380,000 8 7 – 15
380,001 390,000 4 6 – 10
390,001 400,000 4 3 – 7
400,001 410,000 4 4 1 9
410,001 420,000 1 6 – 7
420,001 430,000 1 2 – 3
430,001 440,000 2 6 – 8
440,001 450,000 2 6 2 10
450,001 460,000 2 2 – 4
460,001 470,000 2 2 – 4
470,001 480,000 5 3 – 8
480,001 490,000 1 2 – 3
490,001 500,000 1 4 – 5
500,001 510,000 1 2 – 3
510,001 520,000 1 2 – 3
520,001 530,000 – 2 1 3
530,001 540,000 4 1 – 5
540,001 550,000 1 2 – 3
550,001 560,000 – 1 1 2
560,001 570,000 – 3 – 3
570,001 580,000 2 1 – 3
580,001 590,000 1 1 – 2
590,001 600,000 – 1 – 1
STATUTORY INFORMATION CONTINUEDFOR THE YEAR ENDED 31 JULY 2012
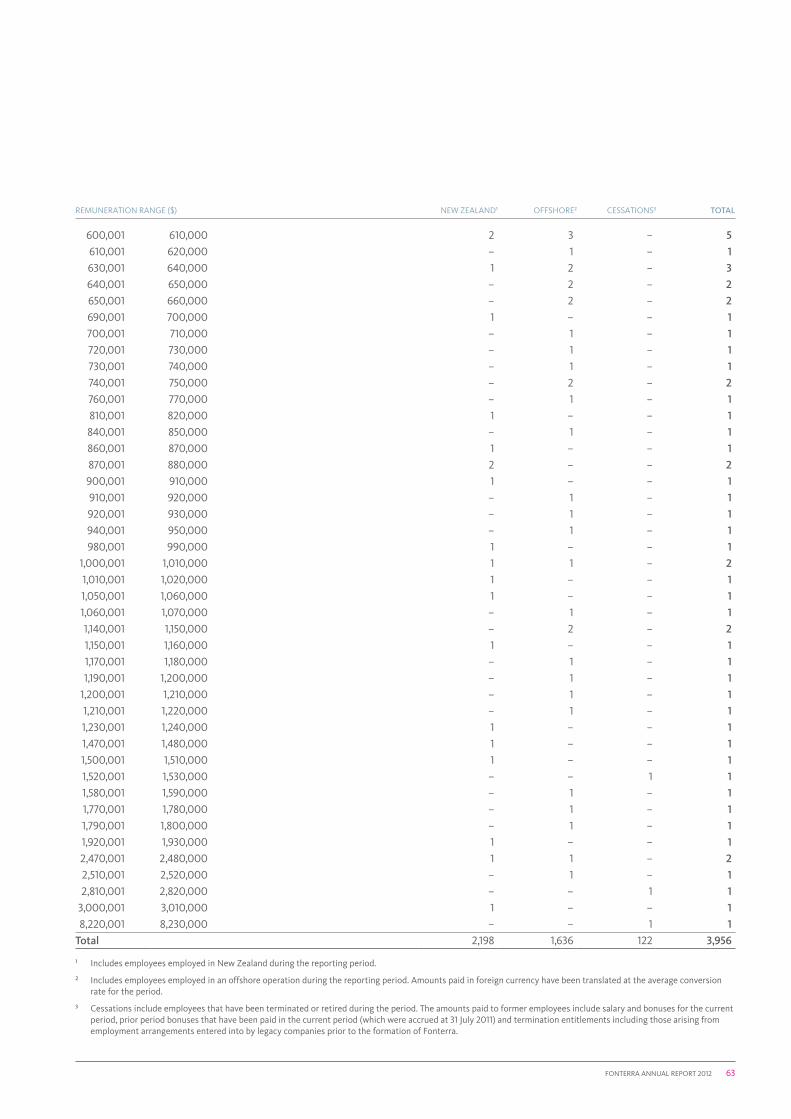
FONTERRA ANNUAL REPORT 2012 63
REMUNERATION RANGE ($) NEW ZEALAND1 OFFSHORE2 CESSATIONS3 TOTAL
600,001 610,000 2 3 – 5
610,001 620,000 – 1 – 1
630,001 640,000 1 2 – 3
640,001 650,000 – 2 – 2
650,001 660,000 – 2 – 2
690,001 700,000 1 – – 1
700,001 710,000 – 1 – 1
720,001 730,000 – 1 – 1
730,001 740,000 – 1 – 1
740,001 750,000 – 2 – 2
760,001 770,000 – 1 – 1
810,001 820,000 1 – – 1
840,001 850,000 – 1 – 1
860,001 870,000 1 – – 1
870,001 880,000 2 – – 2
900,001 910,000 1 – – 1
910,001 920,000 – 1 – 1
920,001 930,000 – 1 – 1
940,001 950,000 – 1 – 1
980,001 990,000 1 – – 1
1,000,001 1,010,000 1 1 – 2
1,010,001 1,020,000 1 – – 1
1,050,001 1,060,000 1 – – 1
1,060,001 1,070,000 – 1 – 1
1,140,001 1,150,000 – 2 – 2
1,150,001 1,160,000 1 – – 1
1,170,001 1,180,000 – 1 – 1
1,190,001 1,200,000 – 1 – 1
1,200,001 1,210,000 – 1 – 1
1,210,001 1,220,000 – 1 – 1
1,230,001 1,240,000 1 – – 1
1,470,001 1,480,000 1 – – 1
1,500,001 1,510,000 1 – – 1
1,520,001 1,530,000 – – 1 1
1,580,001 1,590,000 – 1 – 1
1,770,001 1,780,000 – 1 – 1
1,790,001 1,800,000 – 1 – 1
1,920,001 1,930,000 1 – – 1
2,470,001 2,480,000 1 1 – 2
2,510,001 2,520,000 – 1 – 1
2,810,001 2,820,000 – – 1 1
3,000,001 3,010,000 1 – – 1
8,220,001 8,230,000 – – 1 1
Total 2,198 1,636 122 3,956
1 Includes employees employed in New Zealand during the reporting period.
2 Includes employees employed in an offshore operation during the reporting period. Amounts paid in foreign currency have been translated at the average conversion rate for the period.
3 Cessations include employees that have been terminated or retired during the period. The amounts paid to former employees include salary and bonuses for the current period, prior period bonuses that have been paid in the current period (which were accrued at 31 July 2011) and termination entitlements including those arising from employment arrangements entered into by legacy companies prior to the formation of Fonterra.

64 FONTERRA ANNUAL REPORT 2012
CURRENT CREDIT RATING STATUS
Standard & Poor’s has rated the Company A+ with a rating outlook of stable. Fitch has rated the Company AA- with a rating outlook of stable. Retail Bonds have been rated the same as the Company by both Standard & Poor’s and Fitch. Capital Notes which are subordinate to other Fonterra debt issued are rated A by Standard & Poor’s and A+ by Fitch.
EXCHANGE RULINGS AND WAIVERS
NZX Limited (NZX) has ruled that Capital Notes do not constitute “equity securities” under its Listing Rules (Rules). This means that where Capital Notes are quoted on NZX’s debt market (NZDX), the Company is not required to comply with certain Rules which apply to an issuer of quoted equity securities.
NZX has granted waivers from NZDX Rule 11.1.1 to enable Fonterra to decline to accept or register transfers of Capital Notes or Retail Bonds (NZDX listed debt securities FCGHA, FCG010 and FCG020) if such transfer would result in the transferor holding or continuing to hold Capital Notes or Retail Bonds with a face value or principal amount of less than $5,000 or if such transfer is for an amount of less than $1,000 or multiple thereof. The effect of these waivers is that the minimum holding amount in respect of the Capital Notes and Retail Bonds will at all times be $5,000 in aggregate and that Retail Bonds can only be transferred in multiples of $1,000.
NZX has also granted a waiver from NZDX Rule 5.2.3 in respect of Retail Bond FCG020 to enable that Bond to be quoted on the NZDX market even though it did not meet the requirement that at least 500 members of the public held at least 25% of the Bonds being issued.
ANALYSIS OF CAPITAL NOTE AND RETAIL bOND HOLDING
Analysis of Fonterra’s Capital Note Holding as at 29 August 2012:
FCGHA Capital Notes
FROM – TOHOLDER
COUNT %HOLDING
QUANTITY %
1 – 1,000 11 1.3 4,958 0.0
1,001 – 5,000 28 3.3 79,367 0.1
5,001 – 10,000 337 39.2 2,345,524 2.3
10,001 – 100,000 441 51.2 12,241,662 11.9
100,001 and over 43 5.0 87,847,743 85.7
100,001 and over includes Fonterra Co-operative Group Limited’s holding of 67,435,575.
Analysis of Fonterra’s Retail Bond Holding as at 29 August 2012:
FCG010 $800 million Retail Bond issue
FROM – TOHOLDER
COUNT %HOLDING
QUANTITY %
1 – 999 – – – –
1,000 – 4,999 – – – –
5,000 – 9,999 943 11.4 5,393,000 0.7
10,000 – 99,999 6,406 77.6 175,645,000 22.0
100,000 and over 907 11.0 618,962,000 77.3
FCG020 $150 million Retail Bond issue
FROM – TOHOLDER
COUNT %HOLDING
QUANTITY %
1 – 999 – – – –
1,000 – 4,999 – – – –
5,000 – 9,999 44 10.3 252,000 0.2
10,000 – 99,999 318 74.7 8,693,000 5.8
100,000 and over 64 15.0 141,055,000 94.0
STATUTORY INFORMATION CONTINUEDFOR THE YEAR ENDED 31 JULY 2012

FONTERRA ANNUAL REPORT 2012 65
ENTRIES IN THE INTERESTS REGISTER
Directors’ interests in transactions
General disclosures of interest
The following general disclosures of interest were made in the period from 1 August 2011 to 31 July 2012:
Malcolm Bailey Director of Pastoral Dairy Investments Limited, and of companies in the Pastoral Dairy Investments group.
David MacLeod Director and shareholder of IGN Limited, A.J. Greaves Electrical Limited, Property Portfolio Investments Limited, NGI Limited, and P.K.W. Farms Limited; Director of Port Taranaki Limited; Councillor (Chairman) on the Taranaki Regional Council.
John Monaghan Director of Waitohi Dairy Limited; Trustee of the Wairarapa Regional Irrigation Trust. Cessation of interest as a director of Waimana Dairy Limited.
Sir Henry van der Heyden Director of Rabobank in New Zealand and Australia, and Tainui Group Holdings.
John Wilson Director of Turners and Growers Limited, and Rangitata South Irrigation Limited

66 FONTERRA ANNUAL REPORT 2012
ENTRIES IN THE INTERESTS REGISTER CONTINUED
Securities dealings of Directors
The following entries were made in the Interests Register during the year.
New disclosures
Directors disclosed the following holdings of Co-operative shares during the year:
CO-OPERATIVE SHARES
HELD BY ASSOCIATED
PERSONS
JOINTLY HELD WITH ASSOCIATED
PERSONS
David MacLeod (on appointment, 17 November 2011) 2,393,694 –
John Wilson (interest recorded 17 July 2012) 469,299 –
End of season changes
Directors disclosed the following transactions associated with 2012 end of season adjustments:
CO-OPERATIVE SHARES
HELD BY ASSOCIATED
PERSONS
JOINTLY HELD WITH ASSOCIATED
PERSONS
Colin Armer (resigned 1 August 2012)
− Purchased for cash 1,230,374 –
Malcolm Bailey
− Surrendered for cash 124,833 –
Ian Farrelly
− Purchased for cash 165,985 –
David MacLeod
− Purchased for cash 184,178 –
John Monaghan
− Purchased for cash 41,135 –
Jim van der Poel
− Purchased for cash 338,628 30,615
John Wilson
− Purchased for cash 189,570 –
− Surrendered for cash 150,721 –
In all cases the allocations or surrenders relate to the 2011/12 end of season adjustments. Adjustments related to production in the 2011/12 season were made on 22 June 2012 with deemed dates in accordance with the Constitution. The value upon allocation or surrender of these securities was $4.52 per Co-operative share.
STATUTORY INFORMATION CONTINUEDFOR THE YEAR ENDED 31 JULY 2012

FONTERRA ANNUAL REPORT 2012 67
Directors disclosed the following transactions which occurred as a result of elections made at the end of the 2011/12 season:
CO-OPERATIVE SHARES
HELD BY ASSOCIATED
PERSONS
JOINTLY HELD WITH ASSOCIATED
PERSONS
Colin Armer (resigned 1 August 2012)
− Purchased for cash 15,000 –
− Surrendered for cash 249,258 –
Malcolm Bailey
− Purchased for cash 100,415 –
David MacLeod
− Surrendered for cash 4,166 –
Sir Henry van der Heyden
− Purchased for cash 32,000 10,000
− Surrendered for cash – 2,000
John Wilson
− Surrendered for cash 208 –
Adjustments were made on 4 July 2012 with deemed dates in accordance with the Constitution. In all cases the value upon allocation or surrender of these securities was $4.52 per Co-operative share.
Retail Bond transactions
David Jackson advised the registered holder of 100,000 Retail Bonds (FCG010) in which he had an interest had changed from “David Alexander Jackson, Dianne Catherine Jackson, Peter Russell Jackson” to “Tetley Brook Trustees Limited”. David Jackson retains a relevant interest in these securities as a director of Tetley Brook Trustees Limited.
There were no other transactions in Retail Bonds reported during the period from 1 August 2011 to 31 July 2012. Current interests held by Directors are as follows:
Details of Interest
David Jackson Director of trustee company in respect of 100,000 Bonds (FCG010) John Waller Joint trustee in respect of 210,000 Bonds (FCG010)
Other Trading Activities
On 22 June 2012, 325,334 Co-operative shares which were jointly held by Colin Armer and Associated Persons were surrendered upon ceasing supply.
On 24 July 2012, Associated Persons of Colin Armer acquired interests in 240,000 Co-operative shares at $4.52 per share upon commencing supply.
On 4 July 2012, 128,256 Co-operative shares were transferred from an unrelated party to Associated Persons of David MacLeod.

68 FONTERRA ANNUAL REPORT 2012
STATUTORY INFORMATION CONTINUEDFOR THE YEAR ENDED 31 JULY 2012
INTERESTS IN THE ISSUES REGISTER CONTINUED
LOANS TO DIRECTORS
Loans were made to Associated Persons of Directors as scheduled below on 20 July 2012 by way of financial assistance, as generally available to Shareholders for the acquisition of shares issued in June 2012, relating to 2011/12 end of season adjustments and 2012/13 new season elections. The total amounts of loans are scheduled below and interest is calculated on a daily basis and compounded monthly and charged at the prevailing Fringe Benefit Tax interest rate plus a margin of 1% (initially 5.90% + 1% = 6.90%). If not repaid earlier, the amounts outstanding will be processed as a deduction from the September, paid October, milk payment and subsequent milk payments until the share debt and accrued interest charges are paid. (In accordance with an offer made by the Company on 19 September 2012 to all Shareholders who received such a loan, the repayment date may be extended to November, paid December, milk payment.) The Board approved the initial loans to Directors on 21 June 2012 and extended the repayment date on 14 September 2012.
RECIPIENT
AMOUNT LOANED
($)
AMOUNT OUTSTANDING AS AT 31 JULY 20121 ($)
Associated Persons of Colin Armer 3,894,846 –
Associated Persons of Ian Farrelly 558,807 228,268
Associated Persons of Sir Henry van der Heyden 144,640 144,941
Associated Persons of Jim van der Poel 621,656 –
1 The amount outstanding as at 31 July 2012 includes compounded interest.
DIRECTORS’ REMUNERATION
The Directors’ Remuneration Committee, comprising six shareholders elected in accordance with the Constitution, makes recommendations for shareholder approval as to the level of Directors’ fees.
At the Annual Meeting of Shareholders held on 17 November 2011, shareholders approved, on the recommendation of the Directors’ Remuneration Committee, the following amounts of remuneration to apply to Elected Directors from the date of that Annual Meeting of Shareholders.
Chairman $400,000 p.a.
Directors $160,000 p.a.
Discretionary additional payments to the Chairmen of permanent Board Committees (except if the Chairman is the Fonterra Chairman) $30,000 p.a.
The Board has approved payment of the discretionary additional payment, at the prevailing approved rate, to the Chairmen of permanent Board Committees.
The Board has discretion to set the fees for Directors appointed under clause 12.4 of the Constitution. In the period to 31 July 2012 the Board applied the same remuneration levels as above to the Appointed Directors.
In general, fees paid by subsidiary or associate companies in respect of Fonterra Directors or employees appointed by Fonterra as Directors of those companies are payable directly to Fonterra.
DIRECTORS’ INDEMNITY AND INSURANCE
Fonterra has given indemnities to, and has effected insurance for, Directors and executives of the Company and its related companies, in accordance with Section 162 of the Companies Act 1993, and Fonterra’s Constitution, which, except for specific matters that are expressly excluded, indemnify and insure Directors and executives against monetary losses as a result of actions undertaken by them in the course of their duties. Among the matters specifically excluded are penalties and fines that may be imposed for breaches of law.

FONTERRA ANNUAL REPORT 2012 69