anne pfeffer analysis of full and chopped lightning paper-a-10
TRANSCRIPT

8/3/2019 Anne Pfeffer Analysis of Full and Chopped Lightning Paper-A-10
http://slidepdf.com/reader/full/anne-pfeffer-analysis-of-full-and-chopped-lightning-paper-a-10 1/6
ANALYSIS OF FULL AND CHOPPED LIGHTNING IMPULSE
VOLTAGES FROM TRANSFORMER TESTS USING THE NEW
K-FACTOR APPROACH
A. Pfeffer1and S. Tenbohlen
1
1Institute of Power Transmission and High Voltage Technology, Universität Stuttgart,
Pfaffenwaldring 47, 70569 Stuttgart, Germany*Email: [email protected]
Abstract: The analysis of the lightning impulses is made graphical according to IEC 60060-1:
1989. A new algorithm has been proposed to analyse the parameters, front time, time to half, peak value, of full and chopped lightning impulses. The algorithm provides a procedure for obtainingthe parameters of the impulse voltages from waveforms with varying degrees of distortions in the
front part of the impulse. Oscillations or overshoot in the peak region of the impulse are suchdistortions. The new algorithm was tested in different laboratories with different programlanguages and the results were compared to the IEC 60060-1: 1989 evaluation. Investigations withthe new k-factor approach are already made with 52 TDG test data but the scientific view of real
test data is missing. Therefore, full and chopped lightning impulses of transformer tests from
manufacturers were investigated with the global and the residual filtering methods and werecompared to the IEC 60060-1: 1989 evaluation.
1. INTRODUCTION
The standard IEC 60060-1: 1989 [1] is dealing with
high voltage test techniques, general specifications andtest requirements, and therefore with the analysis of full and chopped lightning impulse voltage.
The lightning impulse voltages of transformer tests
with physically given inductances and capacities shows
impulse shapes with superimposed oscillations orovershoots. The standard defines that oscillations on
lightning impulses with frequencies above 500 kHzshould be disregarded and the peak value is definedwith the help of a drawn mean curve. This definition is
against the physical characteristics due to its sharpdefinition to disregard oscillations. A European Projectwas carried out to remove the ambiguity in theevaluation of the impulse voltages when oscillations or
an overshoot appear [6].
Breakdown tests were performed on differentmaterials, e.g. oil, air, SF6, to study the influence of
oscillations on lightning impulses. With the results afrequency dependent k-factor function was defined [7]:
=1
1 + 2 with a = 2.2, value of f in MHz (1)
Therefore, the k-factor function was used for a newalgorithm to analyse the parameters, front time, time to
half and peak voltage of full and chopped lightningimpulses and to reach more reliability with the actualbreakdown behaviour of the devices under test.
The evaluation of the so-called test voltage Ut(t) out of the recorded lightning impulse U(t) is the crucial factorof the new evaluation. The peak value of the testvoltage, Ut, lies between the extreme value of thelightning impulse with superimposed oscillations, Ue,
and the peak value of the base curve of the impulse,Ump. The k-factor varies from 1 to 0 depending on theoscillation frequency. The test voltage which is thebasis for the determination of peak value Ut, front time
T1 and time to half value T2 is defined as:
() = () + ( ) ∗ �() − () (2)
This algorithm was tested with artificial impulsevoltages in different high voltage laboratories [3]. Inthis work data of full and chopped lightning impulse
voltages from different transformer test bays wereanalysed with the new k-factor function and werecompared to the results of the IEC 60060-1: 1989evaluation.
2. NEW PARAMETER EVALUATION WITH
THE NEW K-FACTOR DEFINITION
The implementation of equation (2) is the importanttask for the new k-factor evaluation. Investigations of global filtering methods were made, that means the
filtering of the complete recorded impulse and theevaluation of the parameters from this test curve. Butthe differences of the global filtering method with theold evaluation were large. Therefore, a new approach
was suggested with a fitted base curve and a residualfiltering.
The recorded curve is fitted with a double exponentialcurve with four free parameters A, B, C and D andgives the so-called base curve Um(t):
(
) =
−(−)
− −(−)
(3)
The fitting takes the Levenberg-Marquardt algorithmand its derivatives as a basis for finding the best least
ISBN 978-0-620-44584-9
Proceedings of the 16th International Symposium on High Voltage Engineering
Copyright c 2009 SAIEE, Innes House, Johannesburg
Pg. 1 Paper A-10

8/3/2019 Anne Pfeffer Analysis of Full and Chopped Lightning Paper-A-10
http://slidepdf.com/reader/full/anne-pfeffer-analysis-of-full-and-chopped-lightning-paper-a-10 2/6
square estimation. The uncertainty of a freehand base
curve drawing is eliminated with this fitting.
The k-factor function is included in the new approachas FIR or IIR filter. The linear phase FIR filter designis available in many programming languages (e.g.
MATLAB – fir2). A typical number of coefficients inthe range from 500 to 4000 are needed to get a linear-phase response.
For the IIR filter design a dual pass filtering approachhas been implemented to get a linear phase response[4]. In this case the data has to be filtered twice, firstforward and then in reverse:
() = 0() + 1( − 1) + 1 ( − 1) (4)
The filter coefficients are simply calculated - ‘a’ is the-3dB point of the k-factor filter and Ts the sampling
interval of the recorded impulse voltage:
= √ , (5)
0 = 1 =
1 + , and (6)
1 =1 − 1 + . (7)
2.1. Residual filtering method for full lightning
impulse voltages
The procedure for parameter evaluations of fulllightning impulse voltages (LI) differs from choppedimpulses. Parameters - front time, time to half, peak
voltage - of full lightning impulse voltages areevaluated by the so-called residual filtering methodshown in Figure 1. First the base curve is fitted with
the Levenberg-Marquardt algorithm. Then the recordedimpulse subtracted with the base curve built theresidual curve. The FIR or IIR filtering is applied to theresidual curve and the test voltage impulse for
parameters evaluation is the summation of the filteredresidual curve and the base curve. The parameters of
the test voltage T’1, T’2, peak voltage Ut and overshootmagnitude β’ characterise the impulse voltage.
Figure 1: Evaluation of full lightning impulses withthe residual filtering method.
2.2. Chopped lightning impulse voltages
For tail chopped lightning impulse voltages (LIC) twodifferent methods are investigated for the parameter
evaluation. The first method is the voltage reductionratio method and the second one the residual curvemethod. The analysis of front chopped lightning
impulses will not be discussed.
Voltage Reduction ratio method: As the nameimplies the ratio of voltages is calculated to evaluatethe peak value of the test voltage, Ut. The voltage ratio
is obtained with the peak values of the correspondingfull LI and test voltage impulse, Ut, and Ue:
=
(8)
The peak value UeLIC and time to chopping Tc is built
with the original LIC. The peak value Ut is defined as:
= ∙ (9)
The time parameter T’1 and overshoot magnitude β’ aretaken from the results of the corresponding LI.
Residual curve method: The residual curve methodfor LIC uses the base curve of the corresponding fullLI and the recorded LIC. The different applied voltageof LI and LIC requires an adjustment of the peak values. Therefore, the base curve and the peak value Ue of the LI are assessed. For scaling the base curve to the
peak value of the LIC UeLIC the equation is defined as:
() =
∙ () (10)
The residual curve method works like the LI residualfiltering method. The scaled base curve and the
recorded LIC built the residual curve for filtering andthe test voltage is used to get the front time parameterT’1, peak value UtLIC and the overshoot magnitude β’.The recorded LIC is used to get the parameter Tc. This
method is more complex and the results of bothmethods are insignificant small. In this work the
differences of both methods will be discussed.
3. RESULTS
The new k-factor evaluation of the impulse voltages
from transformer manufactures varies from the resultsof the IEC 60060-1: 1989. The differences of theevaluation results serve as basis for the comparison and
rating of the new k-factor approach. For this purposedifferences of both methods are built by subtractingparameters of the new k-factor evaluation (T’1, T’2, Ut)with the old IEC 60060-1: 1989 (T1, T2, Ue) method
related to the old evaluation.
ISBN 978-0-620-44584-9
Proceedings of the 16th International Symposium on High Voltage Engineering
Copyright c 2009 SAIEE, Innes House, Johannesburg
Pg. 2 Paper A-10
8/3/2019 Anne Pfeffer Analysis of Full and Chopped Lightning Paper-A-10
http://slidepdf.com/reader/full/anne-pfeffer-analysis-of-full-and-chopped-lightning-paper-a-10 3/6
∆ =( − )
∙ 100% (11)
∆1 =(′
1 − 1)
1
∙ 100% (12)
∆2 =(′2 − 2)
2
∙ 100% (13)
3.1. Full lightning impulses
The full lightning impulses were analysed with the new
k-factor approach with the FIR and IIR filtering. In thiswork only the results of the FIR filtering method arepresented because investigations showed that themaximum differences of the two filtering method aresmall [4].
Matters of particular interests are lightning impulses
with superimposed oscillation frequencies between 300and 800 kHz and parameters close to the limit range.Conforming to the IEC standard the front time of alightning impulse lies in the range of 1.2 µs ± 30% andthe time to half by 50 µs ± 20%.
In this contribution lightning impulses of realtransformer tests were evaluated, which are close to theranges because of test circuit limitations. Theparameters of these lightning impulses lie almost closeto the upper limit range of the standard tolerance forthe front time.
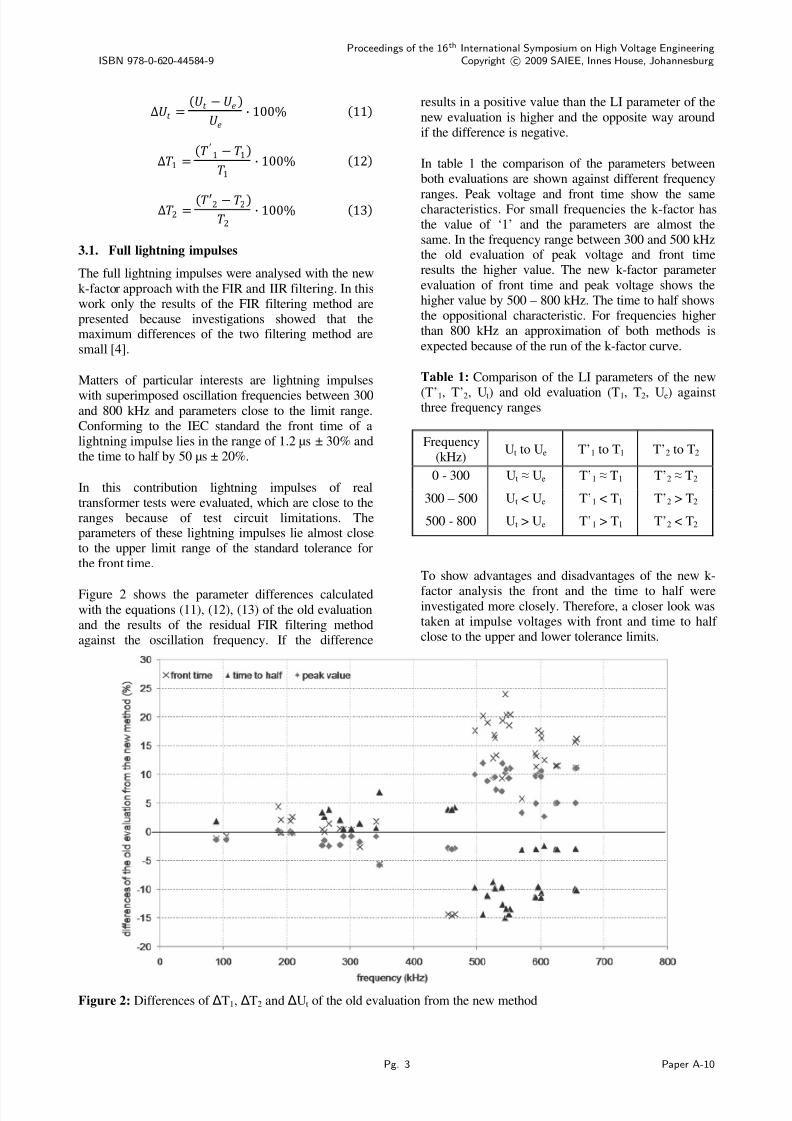
Figure 2 shows the parameter differences calculated
with the equations (11), (12), (13) of the old evaluationand the results of the residual FIR filtering methodagainst the oscillation frequency. If the difference
results in a positive value than the LI parameter of the
new evaluation is higher and the opposite way aroundif the difference is negative.
In table 1 the comparison of the parameters betweenboth evaluations are shown against different frequency
ranges. Peak voltage and front time show the samecharacteristics. For small frequencies the k-factor hasthe value of ‘1’ and the parameters are almost thesame. In the frequency range between 300 and 500 kHzthe old evaluation of peak voltage and front timeresults the higher value. The new k-factor parameter
evaluation of front time and peak voltage shows thehigher value by 500 – 800 kHz. The time to half showsthe oppositional characteristic. For frequencies higherthan 800 kHz an approximation of both methods is
expected because of the run of the k-factor curve.
Table 1: Comparison of the LI parameters of the new
(T’1, T’2, Ut) and old evaluation (T1, T2, Ue) againstthree frequency ranges
Frequency(kHz)
Ut to Ue T’1 to T1 T’2 to T2
0 - 300 Ut ≈ Ue T’1 ≈ T1 T’2 ≈ T2
300 – 500 Ut < Ue T’1 < T1 T’2 > T2
500 - 800 Ut > Ue T’1 > T1 T’2 < T2
To show advantages and disadvantages of the new k-
factor analysis the front and the time to half wereinvestigated more closely. Therefore, a closer look wastaken at impulse voltages with front and time to half close to the upper and lower tolerance limits.
Figure 2: Differences of ΔT1, ΔT2 and ΔUt of the old evaluation from the new method
ISBN 978-0-620-44584-9
Proceedings of the 16th International Symposium on High Voltage Engineering
Copyright c 2009 SAIEE, Innes House, Johannesburg
Pg. 3 Paper A-10

8/3/2019 Anne Pfeffer Analysis of Full and Chopped Lightning Paper-A-10
http://slidepdf.com/reader/full/anne-pfeffer-analysis-of-full-and-chopped-lightning-paper-a-10 4/6
Figure 3 and Figure 4 shows the front time and the time
to half values of the new k-factor approach and the oldevaluation against the frequency range.
Figure 3: Comparison of front time T1 and T’1 of LIconsidering the tolerance limits
In Table 2 the differences between upper and lower
tolerance limit are listed and the effect of a LIconforming to IEC standard is rated. In the frequencyrange of 300 – 500 kHz in the upper front time limit thefront time T’1 evaluated with the new method has a
smaller value. For higher frequency ranges (500 – 800kHz) the old front time T1 is smaller as T’1. Thus thenew method results in exceeding the upper tolerance
limit for the evaluated lightning impulses.
Table 2: Results of the front time parameters
Frequency(kHz)
T’1 to T1 tolerance
limit
T’1 conformingto standard
300 - 500 T’1 < T1 upper
500 - 800 T’1 > T1 upper -
300 - 500 T’1 < T1 lower -
500 - 800 T’1 > T1 lower
Figure 4: Comparison of time to half T2 and T’2 of LIconsidering of the tolerance limits
In Figure 4 the time to half values are shown. In the
frequency range of 300 – 500 kHz the time to half T’2
evaluated with the new method has higher values. Forhigher frequency ranges (500 – 800 kHz) the effect isreverse, but there are no severe differences between
both methods.
3.2. Tail chopped lightning impulses
The tail chopped lightning impulses were analysed withboth methods explained in chapter 2.2. The differencesto compare the new evaluations with the IEC 60060-1:
1989 are built with the equations (11) and (12) and areshown in Figure 5 and 6 against the oscillationfrequency.
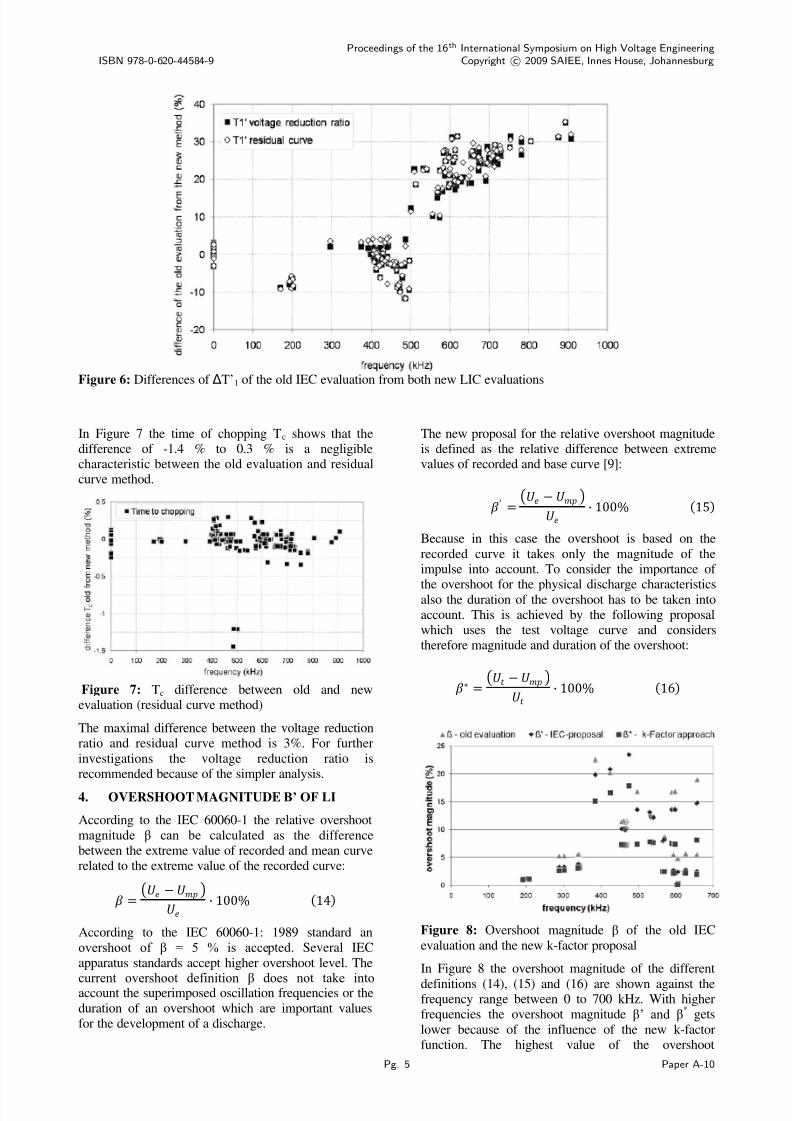
The differences from the old IEC evaluation in the
frequency range of 500 to 800 kHz are positive, i.e. T’1 is longer than T1 and Ut is higher than Ue. In thefrequency range between 400 and 500 kHz the results
vary from -13 % to 5 %. The analysis of LIC byfrequencies of 600 to 900 kHz show differences in thefront time from 20 - 35 % and in the peak voltage of 10 – 20%.
Figure 5: Differences of ΔUt of the old IEC evaluation from both new LIC evaluations
ISBN 978-0-620-44584-9
Proceedings of the 16th International Symposium on High Voltage Engineering
Copyright c 2009 SAIEE, Innes House, Johannesburg
Pg. 4 Paper A-10
8/3/2019 Anne Pfeffer Analysis of Full and Chopped Lightning Paper-A-10
http://slidepdf.com/reader/full/anne-pfeffer-analysis-of-full-and-chopped-lightning-paper-a-10 5/6

8/3/2019 Anne Pfeffer Analysis of Full and Chopped Lightning Paper-A-10
http://slidepdf.com/reader/full/anne-pfeffer-analysis-of-full-and-chopped-lightning-paper-a-10 6/6
magnitudes of the analysed lightning impulses are less
than 25% which is higher than the IEC standard allows.
Figure 8: Differences of the overshoot magnitudes of the old evaluation and the IEC proposal β-β’ and β-β
*
In Figure 9 the differences between the three overshootmagnitude definitions (14)-(15) and (14)-(16) are
shown. The level of the old overshoot magnitude β equals the new defined overshoot magnitude β’ and β*
but in most cases β differ 3 – 5 %. In the frequencyrange between 0 – 200 kHz old and new k-factorcurves are similar. The differences in the higherfrequency range (300 - 700 kHz) between β and β
*are
up to 12 %. The overshoot magnitudes β’, β*of LIC
are the same for the voltage reduction ratio methodbecause the parameters of the LI analysis are used.
In test circuits for transformer tests high inductancesand capacities cause high overshoot magnitudes. Thelevel of the accepted overshoot magnitude is still underdiscussion.
5. CONCLUSION
Principally the new k-factor evaluation is working andthe results from laboratories around the world showedcomparable results in spite of different programming
languages. For chopped lightning impulses themethods has to be adapted because of the missingpossibility to fit the base curve directly from the
recorded impulse.
The differences of the parameter values between IEC
60060-1: 1989 and new k-factor approach for lightningimpulses can be up to 25 %. For tail chopped lightningimpulses the differences are even higher. Thefrequency range between 400 to 600 kHz shows the
most changes because of the influence of the new k-factor function. Figure 3 clarifies the consequences of the new evaluation for LI close to the parameter
tolerance limits. A change of the oscillation frequencyof a few Hz in the range of 500 kHz can influence thevalue of the front time enormously. This effect can be
found again for the time to half with the contrarian
characteristic of the front time and the analysis of theimpulse voltages are more difficult.
For the chopped lightning impulse the full recordedimpulse is used for analysing. The disadvantage is thenon-direct filtering method of the recorded impulses.
The differences between old and new evaluation are up
to 35 %. This fact has to be considered for thedevelopment of transformers. Further the voltagereduction ratio method is recommended to analyse LICbecause of the easier handling.
The overshoot magnitude is still in discussion because
of the allowed level. With the new definition of β’ thek-factor function is considered. For transformer testcurves overshoot magnitudes of 30 % are possible.
The analysis from impulse tests from transformers areprincipal possible. The manufacturers have to keep inmind that the parameters are changing in the frequencyrange between 300 to 800 kHz with the influence of thek-factor function.
6. ACKNOWLEGDEMENTS
Evaluation methods of chopped lightning impulsevoltages results from discussions of the Cigré D1.33
working group “High Voltage and high current test andmeasurement techniques”.
7. REFERENCES
[1] IEC 60060-1: HV test techniques - Part 1: General
definitions and test requirements, 1989.[2] IEC 61083-2: Digital recorders for measurement in
HV impulse tests - Part 2: Evaluation of software
for the determination of the parameters of impulsewaveforms, 1996.
[3] Jari Hällström: "International comparison of
software for calculation of lightning impulse
parameters based on a new processing algorithm",International Symposium on High VoltageEngineering, Ljubljana, August 2007.
[4] Paul L. Lewin, Trung N. Tran, David J. Swaffield,
Jari K. Hällström: "Zero Phase Filtering forLightning Impulse Evaluation: A K-factor Filterfor the Revision of IEC60060-1 and -2", IEEETrans. Power Delivery, Vol. 23 Issue 1. Jan. 2008,p. 3-12.
[5] Wolfgang Hauschild, Thomas Steiner: "Evaluationof Lightning Impulse Voltage Parameters and theRevision of IEC 60060-1", contribution fordiscussion within TC42 MT4, June 2007
[6]
Sonja Berlijn, Mats Kvarngren: "Presentation of results proving the possibility to use the testvoltage factor in IEC 60060-1", Nordic Insulation
Symposium, Stockholm, June 2001.[7] Jari Hällström: "Applicability of different
implementations of K-factor filtering schemes for
the revision of IEC 60060-1 and -2", InternationalSymposium on High Voltage Engineering, Bejing,August 2005.
[8] Yi Li, Juris Rungis: "Analysis of Lightning
Impulse Voltage with Overshoot", InternationalSymposium on High Voltage Engineering, Bejing,August 2005.
[9] IEC Document: Committee Draft IEC 60060-142/224 CD (04/2007)
ISBN 978-0-620-44584-9
Proceedings of the 16th International Symposium on High Voltage Engineering
Copyright c 2009 SAIEE, Innes House, Johannesburg
Pg. 6 Paper A-10