anatomy of the u.s. wine market: challenges ... · introduction anatomy of the u.s. wine market:...
TRANSCRIPT
Introduction
Anatomy of the U.S. Wine Market: Challenges & Opportunities for Veneto Wines
Mike Veseth Professor Emeritus at the University of Puget Sound, USA
and editor of The Wine Economist
The United States is now the largest wine market in the world and an important market for wines from
the Vento. This report analyzes the U.S. wine market with special emphasis on the challenges and
opportunities for the Veneto wine industry. We begin with an anatomy of the U.S. wine market in
general, focusing on market segmentation, distribution bottlenecks and important retail sales channels.
The market for organic wines is briefly analyzed in tenns of its changing market dynamics. A SWOT
(strengths, weaknesses, opportunities, threats) analysis of the main Veneto wine categories is presented,
focusing on Pinot Grigio, Soave, Valpolicella and Prosecco. A brief conclusions summarizes the
findings.
I would like to thank Professor Vasco Boatto for inviting me to undertake this project and Professor
Luigi Galletto for his support and guidance. I also benefited from the technical assistance of Luigino
Barisan, Stefano Baldi, and Daniel McKeown. This report draws upon material I presented in two
webinar lectures that were delivered in November 2014 for the University of Padua Centro CIRVE.
Thanks to everyone who helped facilitate the webinars and to the members of the audience who
provided useful comments and questions.
Anatomy of the United States Wine Market
The U.S. wine market is very large but highly fragmented and it is important to understand and
appreciate the diverse ways that the market is segmented. Each U.S. state and the District of Columbia
sets its own policy regarding alcoholic beverages in addition to federal regulations and taxation.
1

, State Wine Excise Tax Rates (Dollars Per Gallon)
�O
tfT $1.06 ",7 WY
COOIIoi $"..
CO $0.12 .)ll
As of January I, 2013 WWW.T1xfouncb,lioo.org VTn NHO ND S�06 11 S�, .,�
HE so..S Inl
KS $0.30 ..0
OK so.n Ill'
TX $0.20 ..,}
1o.SS u11 Control State
£. .... w:T .....
'WIn. bcu Tu
O�-!::"""W","'o&,.ftloo\" ..... 'w..,-.-_ ... ,.. .... ___ •
Rln $0.60 illlI CTn $O.n ll� NJn
$0.88 "1'1 DE n
$0.'7 �"Ri MoILI sua,," ocM S IT!
.....,.,....""""' ... �.".."....� ....... �<'t�u.� ." "A""'\.(_H_'''�
�P.nU
SoIHu:: �rJJI.N.\fw.u CoiItdI oIl� l)H("" Sut� T.l� 'CA.l'dM.'oC)tl
Figure 1: Siale wille laxes
2
Figure 1 shows one aspect of this fragmentation, with excise tax rates on wine ranging from 20 cents per
gallon i.n Califomia (which has a substantial wine industry that it wishes to promote) to $3.16 in
Kentucky, a major producer of spirits. You will note that several states are identified as "control states."
This means that the state government has a monopoly on alcoholic beverage sales (much like
Systembolaget in Sweden) and taxes are collected in the form of monopoly profits.
There are also important differences in the regional wine preferences. Imported wines make up about 30
percent of total wine consumption, for example, but import penetration is not unifonn. There is a distinct
bias towards European imports on the Atlantic coast and a bias toward domestic (especially Califomia)
and New World imported wines on the Pacific coast.
,- ...... .. 10·11
u_u II-a II·n 11·10
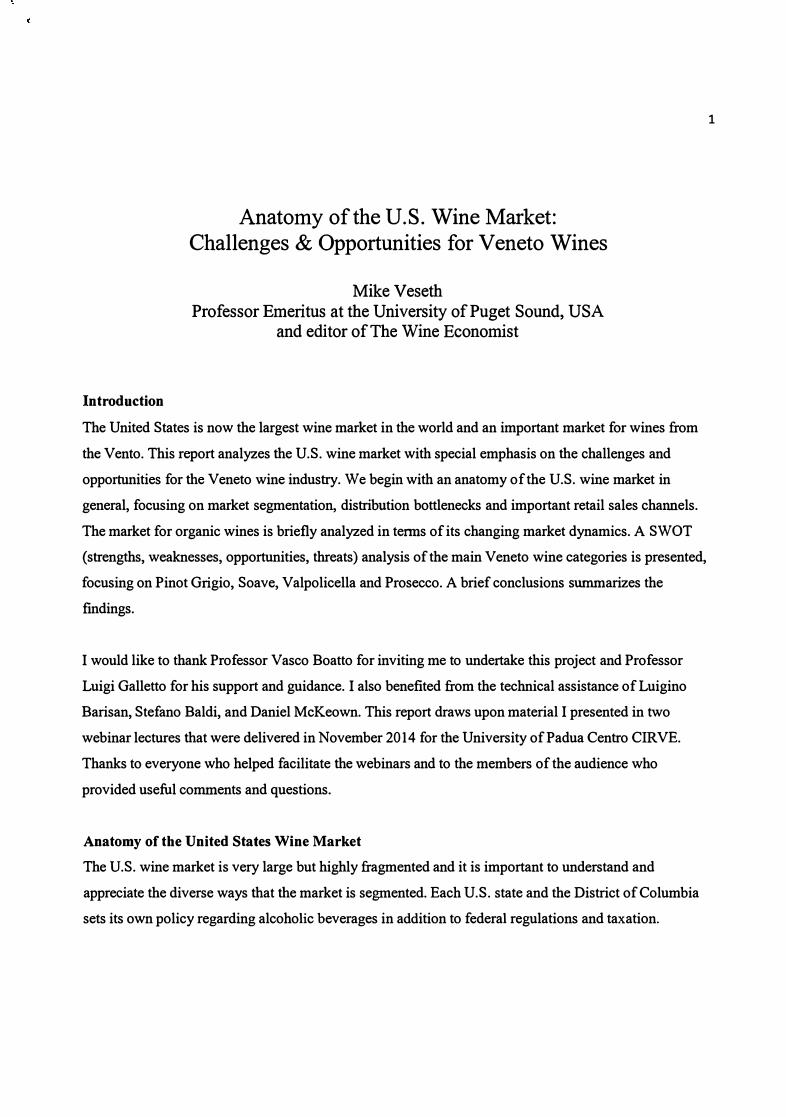
Figure 2: Per capita wine consumption by state
3
Per capita wine consumption varies considerably across the country, with the highest consumption levels
on the Atlantic and Pacific Coasts, in Florida and Illinois. Texas is also an important wine market
although Figure 2 suggests otherwise. The major metropolitan areas (Dallas, Fort Worth, San Antonio,
Austin, and Houston) are good markets, but the average is brought down by low rural area consumption.
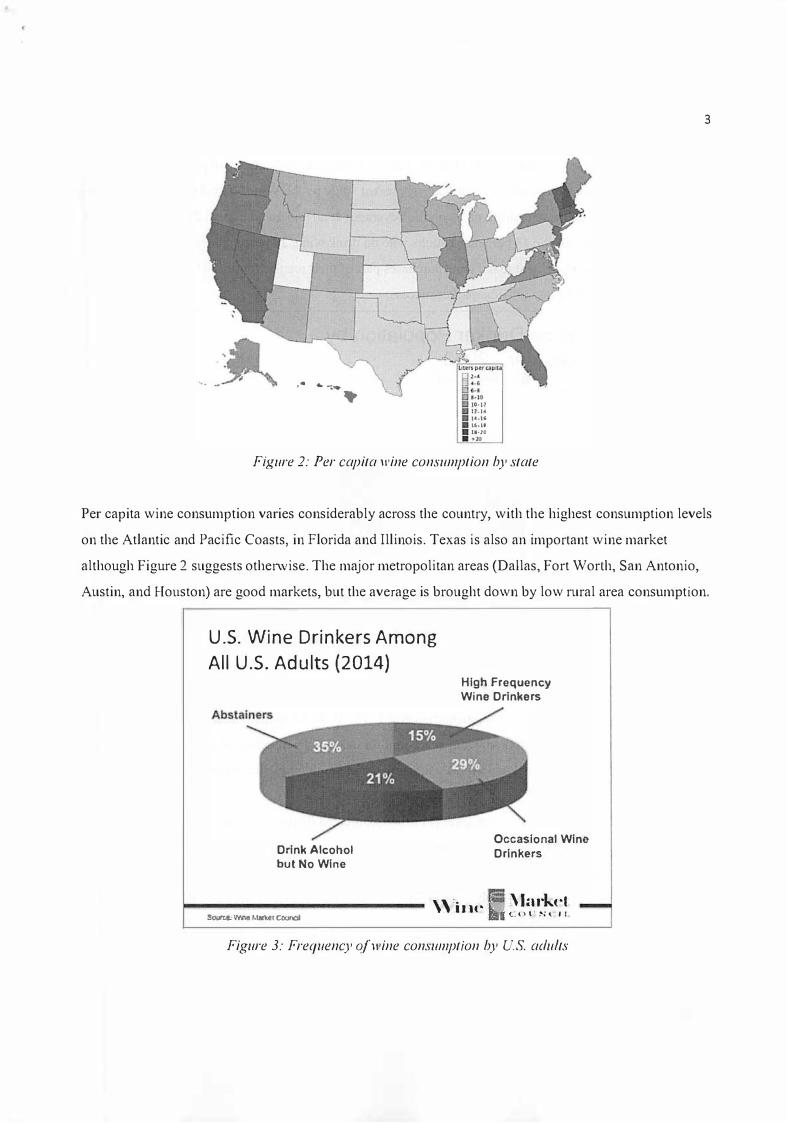
U.S. Wine Drinkers Among All U.S. Adults (2014)
Drink Alcohol but No Wine
High Frequency Wine Drinkers
Occasional Wine Drinkers
r-o-------------- �Vin(' I'i5 �!��I:�t,.! SOUKI!. Vo'rnI r.lillUt COJndI llai Figure 3: Frequency o.lwine consumption by u.s. adults
4
Although total wine consumption in the United States is high, a surprisingly small proportion of
consumers are responsible for most of the sales. A recent study by the Wine Market Council reports that
35 percent of adult consumers drink no alcoholic beverages at all and an additional 21 percent consume
alcohol but not wine. Of the 44 percent of adults who do drink wine, 29 percent are occasional
consumers and only 1 5 percent make wine purchases part of their regular routine. These regular
consumers are therefore key to wine market success.
Wine Drinker Population by
Gender - 2013 (Percentage by segment and gende-r)
59%
41'%
Occasionals
50% 50'%
High Frequency
" in!'
-Male Femak!
i\ lad,,!'! ('0 l :..� It
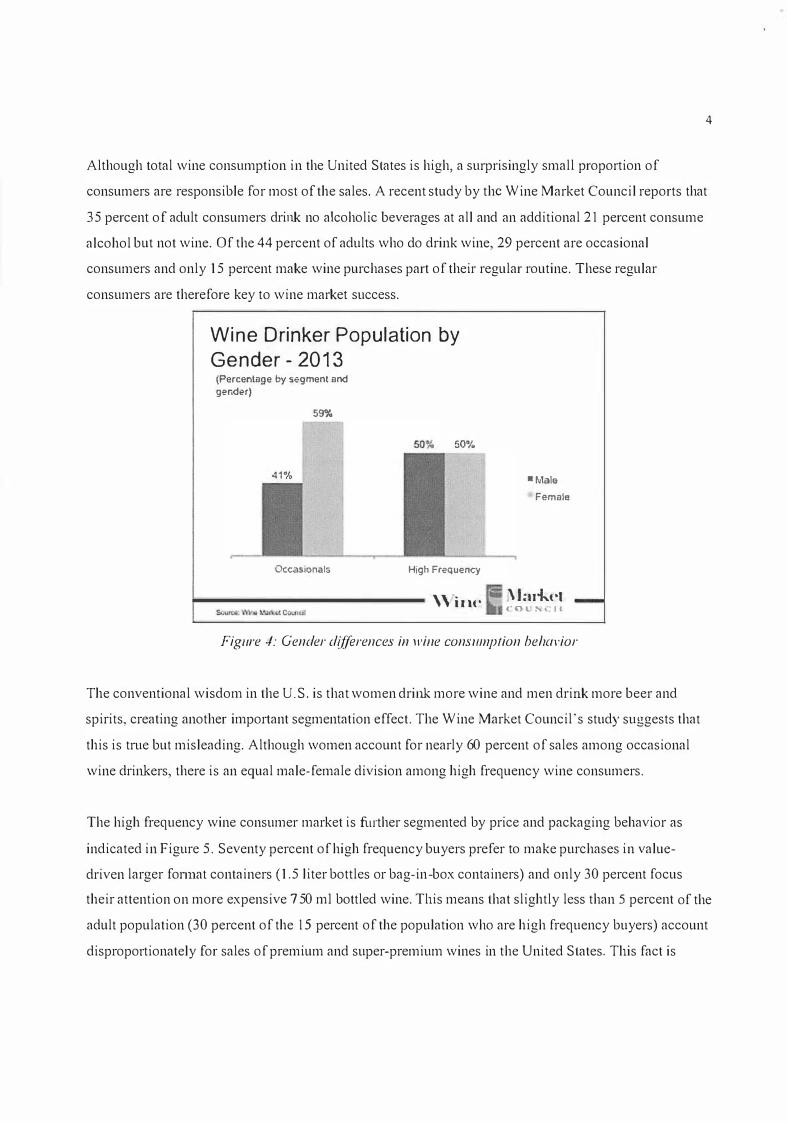
Figllre 4: Gender differences in wille conslImption behavior
The conventional wisdom in the U.S. is that women drink more wine and men drink more beer and
spirits, creating another important segmentation effect. The Wine Market Council's study suggests that
this is true but misleading. Although women account for nearly 60 percent of sales among occasional
wine drinkers, there is an equal male-female division among high frequency wine consumers.
The high frequency wine consumer market is fUlther segmented by price and packaging behavior as
indicated in Figure 5 . Seventy percent of high frequency buyers prefer to make purchases in value
driven larger format containers (1 .5 liter bottles or bag-in-box containers) and only 30 percent focus
their attention on more expensive 750 mJ bottled wine. Tllis means that slightly less than 5 percent of the
adult population (30 percent of the IS percent of the population who are high frequency buyers) account
dispropoltionately for sales of premium and super-premium wines in the United States. Tllis fact is

reinforced by Figure 6 , which indicates how important this small sub-segment of the market is to the
sales of wines in the $10 to $20 and $20 and over parts of the market.
High Frequency Wine Drinkers by Price and Package Preferences -
2013
• High end wine buyers
• Frequont box buyers
• Budget bolUe bU�fS
r------------- \Vinc' " Jar-!-,'I C"OI,! "I'C*II
Figure 5: High ji'eqllency wind drillker price and package preferences.
Focus on High End Wine Drinkers
./ Responsible for over 90% of all 750ml wine purchases over $20
./ Responsible for 40% of all 750ml wine purchases $10 to $20
./ Most influential to other HF segments
r------------- \ViIlC' i\ Ia,-!-C'I C' ... ' .... CIl
Figure 6: High end, high ji'equency wine drinker imporlance
5

Wine Drinker Population by Generation - 2013 (Percentage bV segment and generation)
-MnlenniaJ aGen X -eoomor -()I.dsr 55%
High Frequency High End
f----------- 'Virll'
Figure 7: Generational differences in key market segments
So who are the key wine consumer groups? As Figure 7 indicates, there are generational differences
within the high frequency wine consumer segment that need to be considered. While the baby boomer
generation dominates the category overall, accounting for 43 percent of sales, it is the so-called
millermial generation (those bom from about 1981 to 1996) who are 1110st important in the market for
more expensive bottles of wine, accounting for 55 percent of sales compared with 22 percent for baby
boomers in tlus market segment.
6
By now it should be obvious that the key to success in the U.S. wine market is to identify and focus on
particular market segments. With tllis in mind Constellation Brands, which claims to be the world's
number one producer of premium wines, undertook a series of studies of wine market behavior under
the title of Project Genome. The goal was to understand U.S. wine consumer "DNA" and the results of
this research were important to the company and helped guide it in intemal restructuring to focus on
prenlium and super-premium wines and also to expand its emphasis in the beer and spirits categories.
The most recent update of Project Genome is noteworthy for the increased attention it gives to particular
wine drinker types, particularly the millennia Is. Figure 8 summarizes key Project Genome findings.
GENOME SEGMENTS
�$EEICW
I lOVAIS
ENTHUSIASTS
ttl t> 26 f1I ""'"
�h � t
tt 20 t
t>22 co '"
-GM Al.(QirIrA�
B 10"l1\AOI --, !lP JlJ1'�
tt 10 '"
t> 15 '" """'"
� 13 ... ... OVERWHUMED
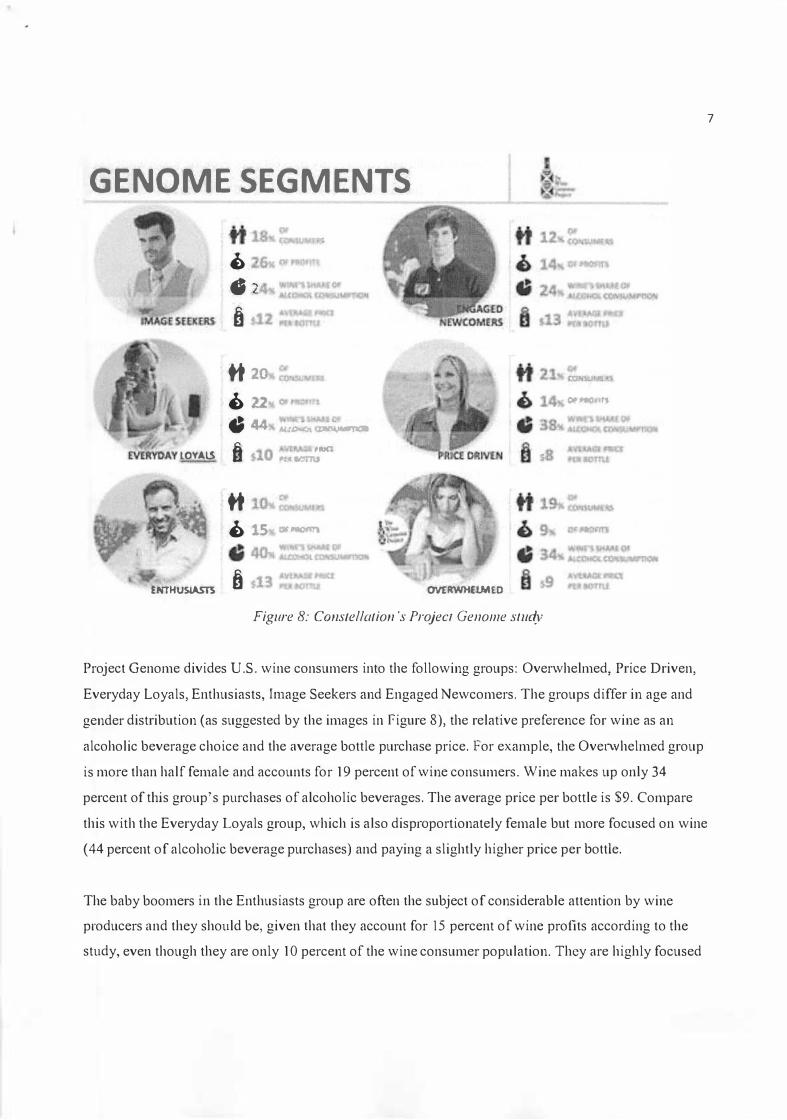
Figure 8: COllstellatioll's Project Genome sflldy
no (0'. "
Of _ ......
Of...aIIJJ
i .....
Project Genome divides U.S. wine consumers into the following groups: Overwhelmed, Price Driven,
Everyday Loyals, Enthusiasts, Image Seekers and Engaged Newcomers. The groups differ in age and
gender distribution (as suggested by the images in Figure 8), the relative preference for wine as an
alcoholic beverage choice and the average bottle purchase price. For example, the Overwhelmed group
is more than half female and accounts for 1 9 percent of wine consumers. Wine makes up only 34
percent of tb.is group's purchases of alcoholic beverages. The average price per bottle is $9. Compare
this with the Everyday Loyals group, which is also disproportionately female but more focused on wine
(44 percent of alcoholic beverage purchases) and paying a slightly higher price per hottle.
The baby boomers in the Enthusiasts group are often the subject of considerable attention by wine
producers and they should be, given that they account for 15 percent of wine profits according to the
study, even though they are only 1 0 percent of the wine consumer population. They are highly focused
7
8
on wine and pay a $13 average wine price. Enthusiasts are keenly interested in esoteric knowledge about
wine and are more likely to have undertaken wine tourism. They are interested in wines of origin and
respond to messaging that relates to heritage and terroir.
Image Seekers are a larger group of consumers and account for an even greater share of wine profits.
Their average bottle purchase price ($12 ) is almost as high as the Enthusiasts, but they are much less
committed to wine. Other beverages (craft beers, ciders and spirits) account for the majority of their
alcoholic beverage purchases. They are more driven by status and style and respond to critic scores more
than messages about terroir, for example.
Enthusiasts and Image Seeker groups figured prominently in earlier Project Genome reports, but this is
the first of these studies to identify the group called Engaged Newcomers as a key market segment.
These are the millennials who figured so prominently in the Wine Market Council study and are the
focus of much industry interest. Key Project Genome findings suggest that they pay more for wine ($13
average bottle price), but are not especially loyal to wine, which accounts for only 24 percent of their
alcoholic beverage purchases.
The Engaged Newcomers are different in many ways from other wine consumer groups. Where
Enthusiasts may respond to the traditional heritage and terroir messages and Image Seekers are perhaps
more influenced by critic scores that provide external status signals, Engaged Newcomers think of wine
in a social context. Social media and personal recommendations are important to them. They may not
care if a wine comes from a historic producer or famous region and they almost certainly do not read
critic reviews or wine magazines. But Facebook and other social media mentions may influenced them.
The key takeaway from this survey of the anatomy of the u.S. wine market is that it is highly segmented
in terms of geography and demographics and each segment has unique characteristics that must be
successfully navigated in order to achieve market success. This is one important distinguishing aspect of
the U.S wine market, but not the only one.
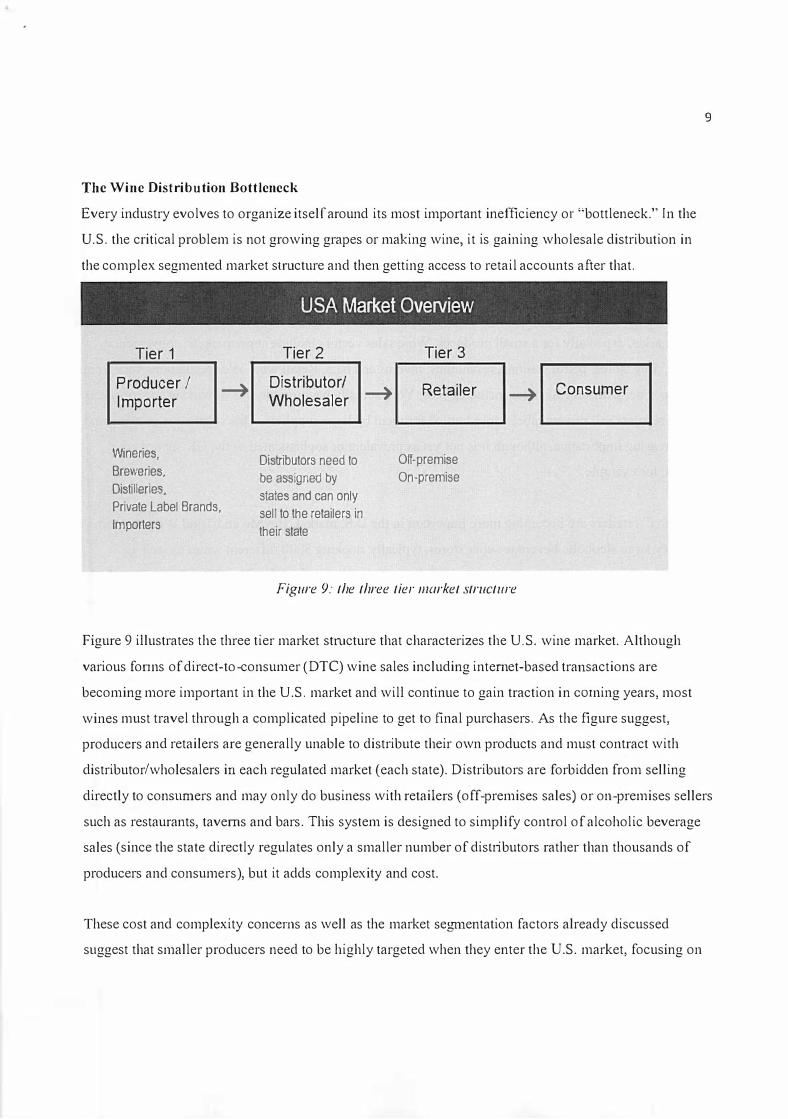
The Wine Distribution Bottleneck
Every industry evolves to organize itself around its most important inefficiency or "bottleneck." In the
U.S. the critical problem is not growing grapes or making wine, it is gaining wholesale distribution in
the complex segmented market slTUcture and then getting access to retail accounts after that.
USA Market Overview
Tier 1 Tier 2 Tier 3
Producer / --+ Distributor/ --+ Retailer Consumer
Importer Wholesaler --+
Wineries, Distributors need to Off-premise
Breweries, be assigned by On-premise
Distilleries, states and can only
Private Label Brands, sell to the retailers in
Importers their state
Figure 9: the three tier lIIarket structllre
9
Figure 9 illustrates the three tier market stmcture that characterizes the U.S. wine market. Although
various fonns of direct-to-consumer (DTC) wine sales including intemet-based transactions are
becoming more important in the U.S. market and will continue to gain traction in COIning years, most
wines must travel through a complicated pipeline to get to final purchasers. As the figure suggest,
producers and retailers are generally unable to distribute their own products and must contract with
distributor/wholesalers in each regulated market (each state) . Distributors are forbidden from selling
directly to conSlmlers and may only do business with retailers (off-premises sales) or on-premises sellers
such as restaurants, taverns and bars. This system is designed to simplify control of alcoholic beverage
sales (since the state directly regulates only a smaller number of disnibutors rather than thousands of
producers and consumers), but it adds complexity and cost.
These cost and complexity concerns as well as the market segmentation factors already discussed
suggest that smaller producers need to be highly targeted when they enter the U.S. market, focusing on
10
just a few high value targets such as New York, New Jersey, Florida and Illinois, for example, and
carefully choosing an importer-distributor who can place the wines in appropriate on- and off-premises
accounts. Some distributors handle thousands of wine SKUs while others focus very closely on
particular regions or types of wines. It is important that the match between winery and importer
distributor be a good one where both sides can benefit.
The retail wine sector is extremely complex and adds to the difficulty of successful penetration of the
U.S. market, especially for a small producer. Wine sales vectors include supermarkets, convenience
stores, drug stores, petrol stations, restaurants, taverns and bars. Retail wine sales regulations vary from
state to state, with several states including New York actually banning the sale of wine in supermarkets.
Many retailers sell private label wines bottled for them by large suppliers. This segment is growing and
of increasing importance, although it is not yet as prevalent or sophisticated as the UK supermarket
chains, for example.
"Big box" retailers are becoming more important in the U.S. market. BevMo and Total Wine & More
are very large alcoholic beverage super stores, typically stocking 8000 different wines as well as
hundreds of spirits and beers. These stores are located mainly on the Atlantic and Pacific coasts, which
we have seen are the key wine consuming areas. Both chains have initiated programs to develop special
relationships with particular wineries in order to promote their products. At this point the chains are
limited to states where regulations allow private sales of wine, spirits and beers under one roof. As
alcoholic beverage regulation liberalization continues, expect these stores to grow in number and
importance.
The largest retailer of wine is the United States is a different kind of "big box" store. Costco is a
members-only warehouse store that sells a very wide range of products, including wine where legal, to a
very affluent national consumer base. Members pay annual dues of between $55 to $110 per family for
the right to shop at huge stores and purchase quality products at relatively low mark ups. Indeed, an
analysis of Costco' s financial reports indicates that they make virtually no profit on operations, but
generate substantial earnings on membership sales. Costco is a multinational retailer, but the bulk of its
sales are still mainly derived on the U.S. market, with 550 -600 stores in major metropolitan areas.

11
Costco does not stock 8000 wines at a time like BevMo. It generally carries only about 120 to 150
wines, which is far fewer than a typical upscale supermarket. Selections are customized by region and it
is common for small lots of wines to come and go in order to provide interest and variety to the limited
overall selection. Private brand Kirkland Signature wines are very important (the founder of the Costco
wine program was trained at Tesco before coming to the United States). The CUITent best-selling wine is
a Kirkland Signature Pinot Grigio sourced from Friuli.
If finding effective distribution is the frrst step to successful penetration of the U.S. wine market,
identifying a sound retail strategy (either on- or off-premises) comes next. The third step is to generate
pull-through by promoting the wines to key people throughout the supply chain. There are many stories
of wineries who believed that getting their pallets to the warehouse loading dock would assure success
as the wines would simply sell themselves based upon excellent quality. With more than 80,000
different wine SKUs available in the U.S. market, nothing sells itself. Everything must be sold and
effective promotion strategy and consistent follow-though are important.
The U.S. Market for Organic Wines
While the small size of the U.S. market for organic wines is something of a paradox, some recent trends
suggest that it will become an increasingly important segment, with strong Italian representation.
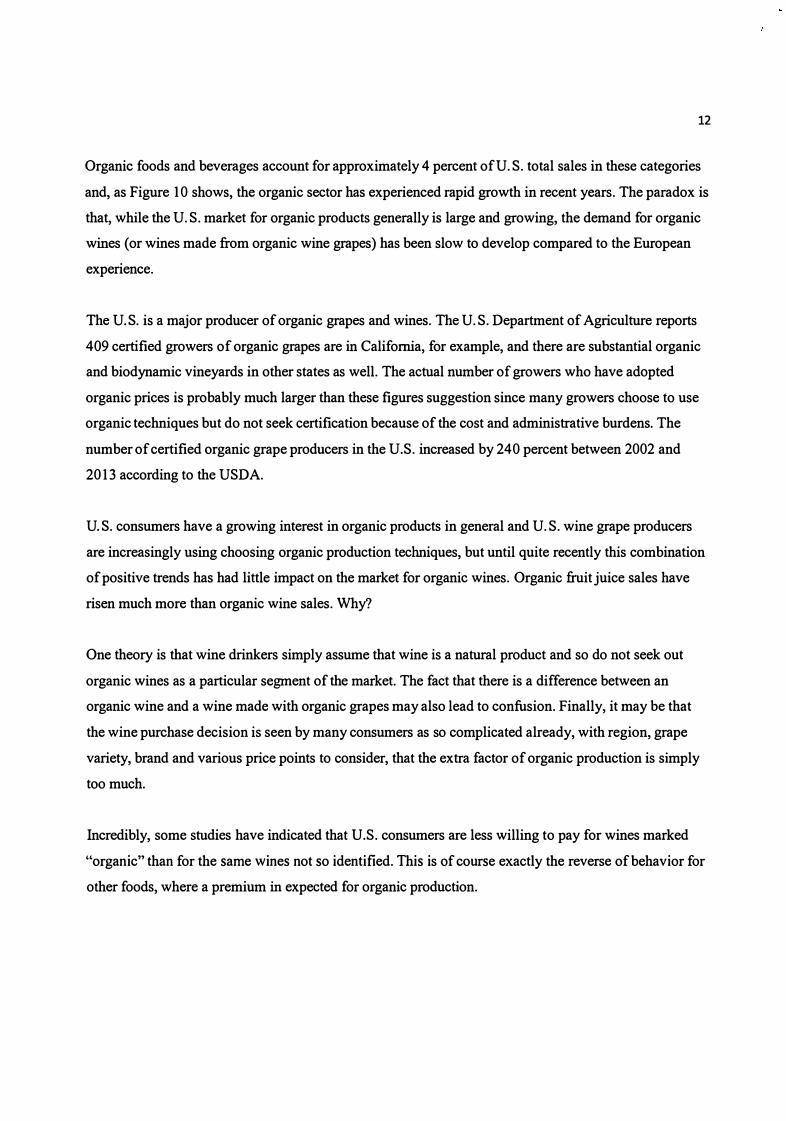
U.S. organtc food sales by category. 2005-14E
S billion 40 ,----------------.,
o 2005 06 I 07 08
Note: E=estimate.
• Fruit and vegetables
• DaJry
• Beverages
• PackagOOfprcpared loods
Breads and grains
Source: USOA, Economic Research Service using data from Nutrldon Business Journa1.
Figure 10: u.s. markel for organic foods and beverages
12
Organic foods and beverages account for approximately 4 percent of U.S. total sales in these categories
and, as Figure 10 shows, the organic sector has experienced rapid growth in recent years. The paradox is
that, while the U.S. market for organic products generally is large and growing, the demand for organic
wines (or wines made from organic wine grapes) has been slow to develop compared to the European
experience.
The U.S. is a major producer of organic grapes and wines. The U.S. Department of Agriculture reports
409 certified growers of organic grapes are in California, for example, and there are substantial organic
and biodynamic vineyards in other states as well. The actual number of growers who have adopted
organic prices is probably much larger than these figures suggestion since many growers choose to use
organic techniques but do not seek certification because of the cost and administrative burdens. The
number of certified organic grape producers in the U.S. increased by 240 percent between 2002 and
2013 according to the USDA.
U.S. consumers have a growing interest in organic products in general and U.S. wine grape producers
are increasingly using choosing organic production teclmiques, but until quite recently this combination
of positive trends has had little impact on the market for organic wines. Organic fruit juice sales have
risen much more than organic wine sales. Why?
One theory is that wine drinkers simply assume that wine is a natural product and so do not seek out
organic wines as a particular segment of the market. The fact that there is a difference between an
organic wine and a wine made with organic grapes may also lead to confusion. Finally, it may be that
the wine purchase decision is seen by many consumers as so complicated already, with region, grape
variety, brand and various price points to consider, that the extra factor of organic production is simply
too much.
Incredibly, some studies have indicated that U.S. consumers are less willing to pay for wines marked
"organic" than for the same wines not so identified. This is of course exactly the reverse of behavior for
other foods, where a premium in expected for organic production.

The good news is that there are indications of change in the market for organic wines and SOIne
important wineries are now making this market a focus. One reason is the change in wine consumer
demographics outlined earlier in the Project Genome analysis. New wine consumers, especially the
Engaged Newcomers, may be more responsive to organic messaging and products.
13
Another important factor is the changing nature of the marketplace itself. In many regions upscale
supermarket chains such as Whole Foods and Trader Joe's have become very important sales vectors for
wines and increasingly for organic wines. These stores pride themselves on their organic and natural
products and consumers expect to fmd orgallic selections tllfoughout the store. The wine wall is no
different and organic products are featured rather than being assigned to an unfavorable "alternative
product" location along with other slow-moving items such as de-alcoholized wine.
Total
afwhich,
France
Italy
New Zealand
Spain
Other countries
Red BIO WIllie BIO SparklIng BIO Total BIO wines wines wines wines
89.1 63.1 40.8 193-0
35.9% 17.5% 54.0% 33.7%
26.2% 30.6% 34·2% 29.3%
1.0% 21.7% 0.1% 7.6%
10.0% 2.8% 9·1% 7.5%
26.9'/, 27-4% 2.7% 21.9'10
Source: Nomisma Wine Monitor.
Figure 11: u.s. imports of organic wines 2013
These changes in who is buying organic wine and where the wines are purchased seems likely to shine
an increasingly bright spotlight on this market segment. This is good news for Italian organic wine
producrs. As Figure 1 1 shows, Italy is the number two source of imported organic wines in the u.s.
market, slightly behind France but far ahead of New Zealand, Spain and other countries. Is organic wine
a market of the future? It is too soon to give a definitive answer, but this market segment does seem
likely to grow as it becomes more a part of the organic products market in general.
SWOT Analysis of the Market for Vento Wines ill the United States: Introduction
What are the current performance of and fllture prospects for the major wines of the Veneto in the
complex and changing U.S. market? A SWOT analysis approach will be used to answer this question.
The strengths, weaknesses, opportunities and threats will be identified for Pinot Grigio, Soave,
Valpolicella and Prosecco.
SWOT Analysis
Figure 12: SWOT Analysis
Data Sources and Limitations
It is said that there are tluee kinds of data: incomplete, obsolete and forthcoming. The following
analysis is based on the best available information but is subject to the usual limitations. Data on
Veneto wine exports to the U.S. by region and type is difficult to compile and is therefore
incomplete. However, Luigino Barisan located reliable sources of supply-side data for some
Veneto wine export categories, which are reported here. Demand-side infolUlation on U.S. sales
comes from Nielsen surveys of the U.S. wine market, which are very detailed but account for only
part of the market. Sparkling wine is not included ill the main data (but will be reported in the
Prosecco discussion, of course) and the sales data concentrate on the main off-premises retail
channels, but do not include on-premises and celtain otller sales.
14
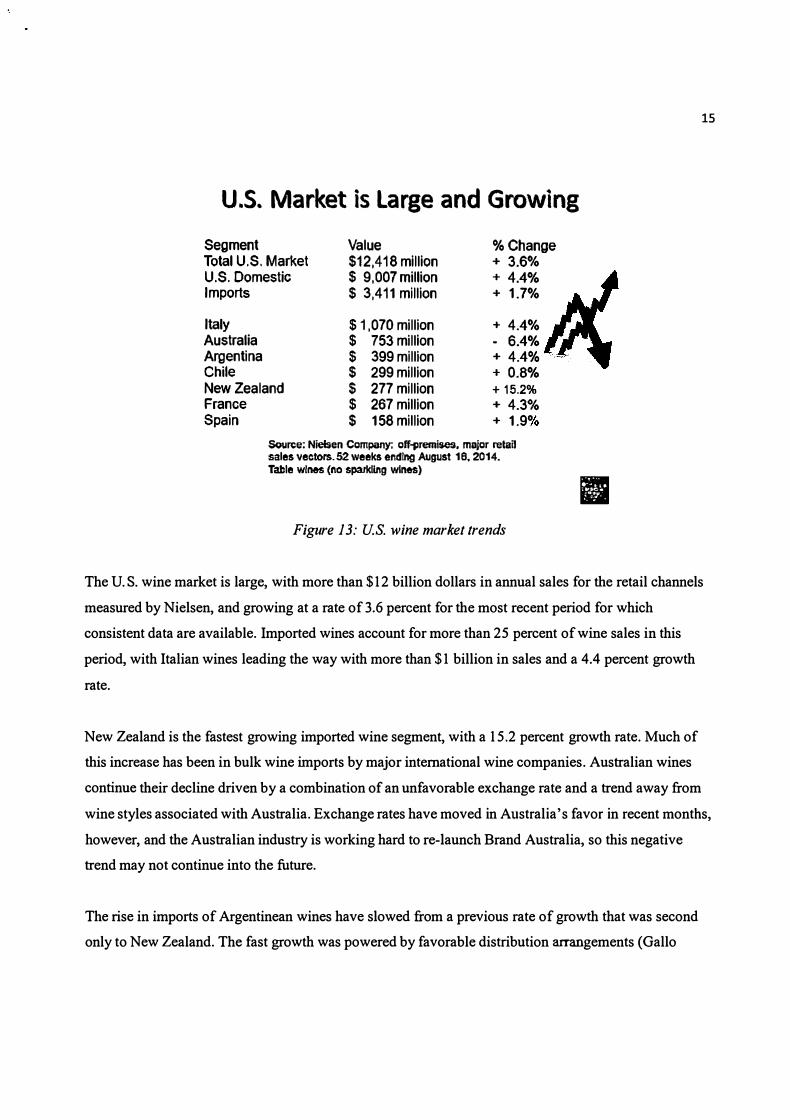
U.S. Market is Large and Growing
Segment Value % Change Total U.S. Market $12.418 million + 3.6°4 U.S. Domestic $ 9, 007 million + 4.4% Imports $ 3.411 million + 1.7°4
Italy $ 11070 million + 4.4°4 Australia $ 753 million - 6.4% Argentina $ 399 million + 4.4% Chile $ 299 million + 0.8% New Zealand $ 277 million + 15.2% France Spain
$ 267 million + 4.3°4 $ 158 million + 1.9%
So1.Iree; Nielsen Company; off-premises. major retaiJ sales vectors. 52 weeks endIng August 16,2014. Table wlnH (no sparkling wlnH)
Figure 13: U.S. wine market trends
15
II
The U.S. wine market is large, with more than $12 billion dollars in annual sales for the retail channels
measured by Nielsen, and growing at a rate of3.6 percent for the most recent period for which
consistent data are available. Imported wines account for more than 25 percent of wine sales in this
period, with Italian wines leading the way with more than $1 billion in sales and a 4 .4 percent growth
rate.
New Zealand is the fastest growing imported wine segment, with a 15 .2 percent growth rate. Much of
this increase has been in bulk wine imports by major international wine companies. Australian wines
continue their decline driven by a combination of an unfavorable exchange rate and a trend away from
wine styles associated with Australia. Exchange rates have moved in Australia's favor in recent months,
however, and the Australian industry is working hard to re-Iaunch Brand Australia, so this negative
trend may not continue into the future.
The rise in imports of Argentinean wines have slowed from a previous rate of growth that was second
only to New Zealand. The fast growth was powered by favorable distribution arrangements (Gallo

distributed two of the tlrree best-selling Argentinean brands). The recent slowdown is due in part to
politically-driven economic policies in Argentina which make exports of less expensive wines
unprofitable for many producers.
Americals Top Imported Wine Sourc�
Value Change Volume
Change (million
(USD million) (%) cases) (%) Italy , ,006.7 8 19.7 2 France 795 6 7.3 -1
Spain 206 3 4.6 -8
Australia 269 -10 10.6 -12
New Zealand 184.7 21 3.2 22
Chile 182 -8 11.4 5
Argentina 217.8 2 7.7 8
World total 2,950.2 5 54.1 -1
Source: Gomberg-Fredrikson report. Data for January 1 - July 31, 2014
Figure 14: A broader measure on wine imports
16
The Gomberg-Frederickson report recently released half-year data for total wine imports that underlines
Italy's importance and also illustrates the differences in data measurement techniques. The data in
Figure 14 include both sparkling and still wine imports and both on-premises and off-premises sales,
which accounts for France's much higher ranking in the table (due partly to the inclusion of
Champagne) and Italy's even faster growth rate (due in part to the popularity of Pro sec co). Although the
Gomberg-Fredrikson and Nielson data differ for the reasons previously explain, the importance of
Italian wine imports in the U.S. market is clear in both data sets.
An interesting and perhaps unexpected feature of the current U.S. wine market is that the growth in
expenditures is concentrated in the premium and super-premium categories as shown in Figure 15 .
About half the wine sold in retail channels monitored by Nielsen is priced below $9 and about half is
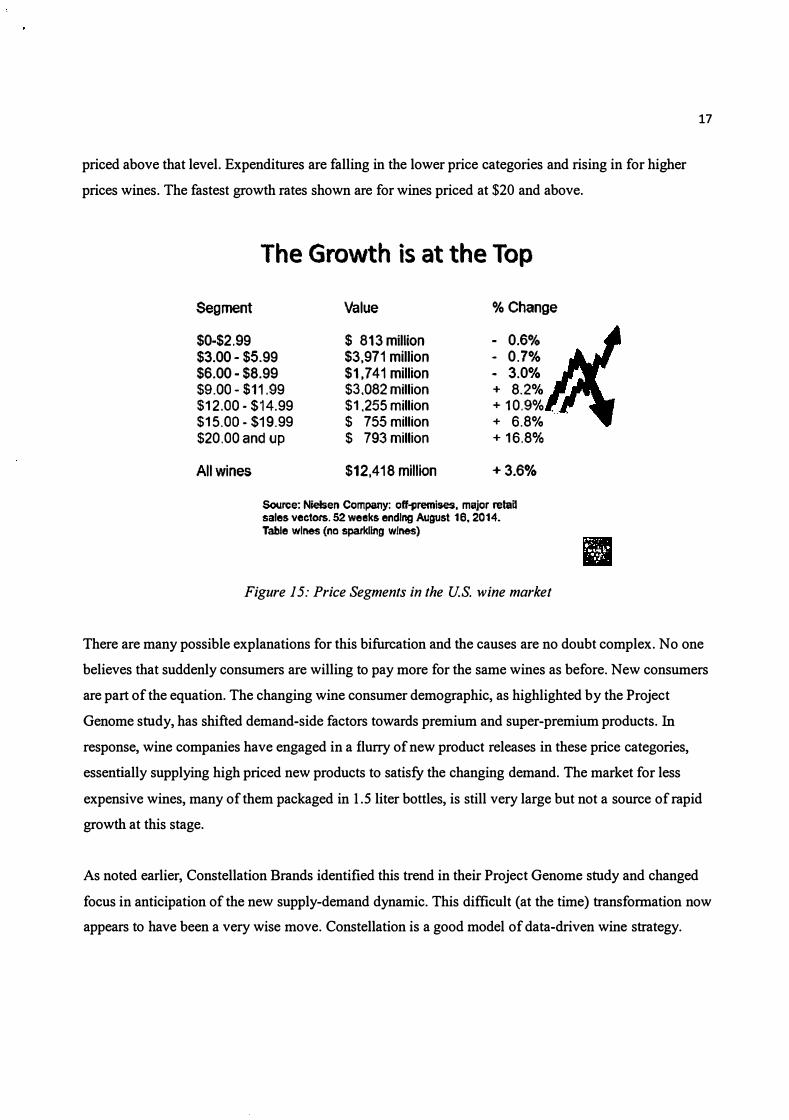
priced above that level. Expenditures are falling in the lower price categories and rising in for higher
prices wines. The fastest growth rates shown are for wines priced at $20 and above.
The Growth is at the Top
Segment Value % Change
$0-$2.99 $ 813 million - 0.60/0 $3.00 - $5.99 $3.971 million - 0.7% $6.00 - $8.99 $1,741 million - 3.0% $9.00 - $11.99 $3.082 million + 8,2°A, $12.00 - $14.99 $1.255 million + 10.9% $15.00· $19.99 $ 755 million + 6.8°'" $20.00 and up $ 793 million + 16.8%
All wines $12,418 million +3.6%
Sou�e: Nieben Company: off-premises. major retail sales vectors. 52 weeks ending August 18.2014. Table wines (no sparkling wines)
Figure 15: Price Segments in the U.S. wine market
17
There are many possible explanations for this bifurcation and the causes are no doubt complex. No one
believes that suddenly consumers are willing to pay more for the same wines as before. New consumers
are part of the equation. The changing wine consumer demographic, as highlighted by the Project
Genome study, has shifted demand-side factors towards premium and super-premium products. In response, wine companies have engaged in a flurry of new product releases in these price categories,
essentially supplying high priced new products to satisfy the changing demand. The market for less
expensive wines, many of them packaged in 1 .5 liter bottles, is still very large but not a source of rapid
growth at this stage.
As noted earlier, Constellation Brands identified this trend in their Project Genome study and changed
focus in anticipation of the new supply-demand dynamic. This difficult (at the time) transformation now
appears to have been a very wise move. Constellation is a good model of data-driven wine strategy.

Key Varietal Wine Growth Rates
Segment Value % Change Total U.S. Market $12.418 million + 3.6%
Chardonnay $ 2,387 million + 1.8°4 Cab Sauvignon $ 1,959 million + 7.8% Pinot Grigio/Gris $ 1,109 million + 5.8% Merlot $ 896 million - 3.6% Pinot Noir $ 826 million + 7.6% MoscatolMuscat $ 659 million + 8.1%
Blended wines $ 1 ,523 million + 9.7% Red blends $ 1,262 million + 10.9% White blends $ 244 million + 2.8%
Source: Nletsen Company: off-premls&s, major relall sales vectors. 52 weeks ending August 16.2014. Table wines (no sparkling wines)
Figure 16: Growth by wine grape variety
18
Figure 16 shows the differences in growth rates for various wine varieties. Chardonnay remains the
largest variety but is being overtaken by Cabernet Sauvignon. Pinot Grigio' s growth outpaces the market
overall. Merlot continues to decline in importance. Syrah/Shiraz does not appear on this list. It has
suffered a collapse that is associated with a tum away from inexpensive Australian Shiraz in the U.S.
market.
Note the surging sales of blended wines and especially red blends. Although this is a very diverse
category, the growth is led by a group of premium sweet red blends that appeal especially to younger
drinkers. Dry red blends are also popular, however, including those made with unfashionable varieties
like Merlot and Syrah. It seems that consumers will drink Merlot and Syrah in anonymous red blends
but not as varietal wines.

� BOLLA
\AlPOIJCEUA
Valpolicella
TOp Brands:
Bolla
Zenato Ripassa
Folonari
Tomassi
Santi Solane
Cesari
Source: Nielsen
Figure 24: Top Va/policella brands in lhe Us. markel
SWOT of Valpolicella
Strengths Fashionable style. Growing appreciations
for Amarone and Ripasso wines.
Weaknesses Smaller market segment dominated by
few large producers. Negative momentum
Opportunities Upmarket potential. Move beyond
existing market centers.
Threats Does the focus on Amarone and Ripasso
distract from Valpolicella?
Figure 25: Va/po/ice/lel SWOT analysis SUmlllal)1
25
26
A SWOT analysis of Val po lie ella, summarized in Figure 25 , begins with the fact that Valpolicella
presents wines in tune with the times in many ways. The Valpolicella Classico reds are an appealing
style that is increasingly popular. Ripasso and Amarone are rich, luxurious wines that fit with the current
trend toward more expensive wines. That said, total sales of these wines as tracked by Nielsen actually
declined in the period measured. The Valpolicella wines are a small market segment and must compete
with wines from other parts of Italy and other parts of the world. Competitive advantage is difficult to
achieve and harder to maintain once we look beyond the top brands with the most effective distribution.
As with other Veneto wines, opportunities exist if winemakers can go beyond the current markets and
take advantage of upmarket opportunities. The question is how to draw even more attention to high end
wines such as Ripasso and Amarone without undermining the support for Valpolicella Classico wines?
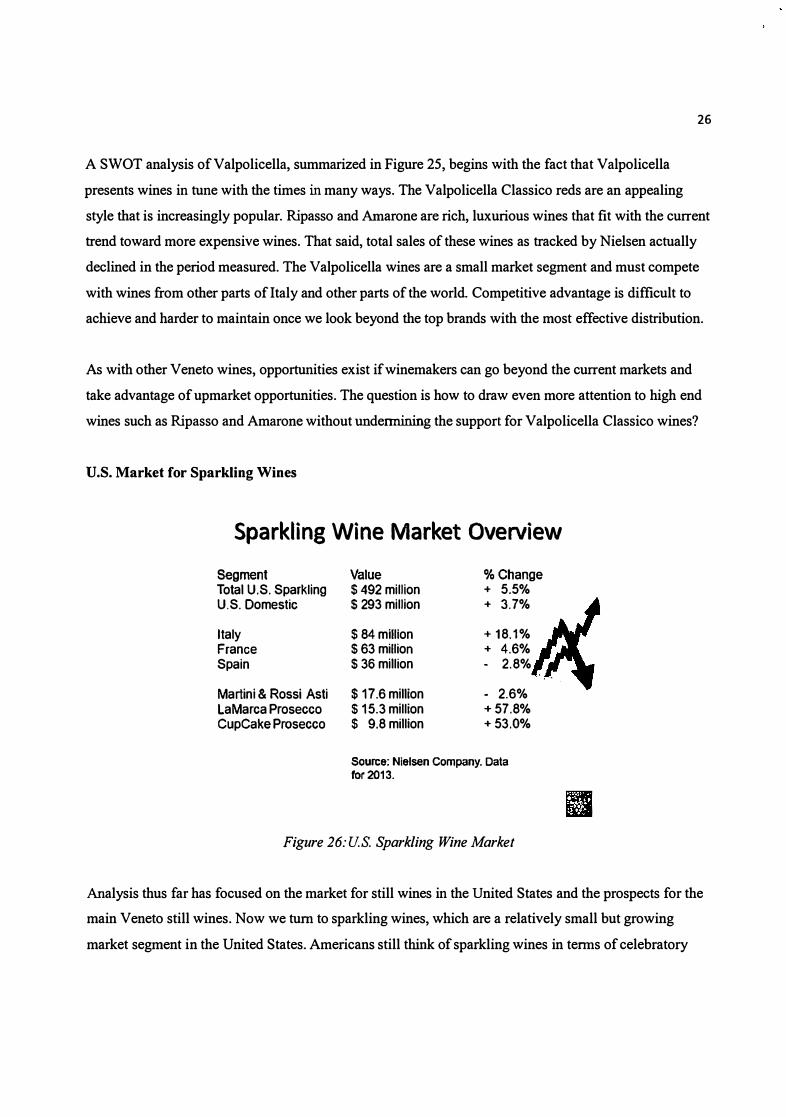
u.s. Market for Sparkling Wines
Sparkling Wine Market Overview
Segment Total U.S. Sparkling U.S. Domestic
Italy France Spain
Martini & Rossi Asti LaMarca Prosecco CupCake Prosecco
Value $492 million $293 million
$ 84 million $63 million $ 36 million
$17.6 million $15.3 million $ 9.8 million
% Change + 5.5%
+ 3.7%
+ 18.1%
+ 4.6%
- 2.8%
• 2.6%
+57.8%
+53.0%
Source: Nielsen Company. Data for 2013.
Figure 26: u.s. Sparkling Wine Market
II
Analysis thus far has focused on the market for still wines in the United States and the prospects for the
main Veneto still wines. Now we tum to sparkling wines, which are a relatively small but growing
market segment in the United States. Americans still think of sparkling wines in terms of celebratory
Veneto Exports to U.S. -------------------------------Euro}-2rii3-------------
Province Sparkling wines .80ttted wtn.s Bulk wines
Treviso
Venezia Verona
Vlcenza
Total All Countries
12,395,868 5,033,023
2,134,151 15,339,950
2,004,205 27,618,713
1,832,693 8,455,923
175,483
232,108
232,609
92,200,285 383,224,609 125,767,482
Thanks to LuJglno Bar/san for help fIIiB. . with Veneto \Vine export data. iii
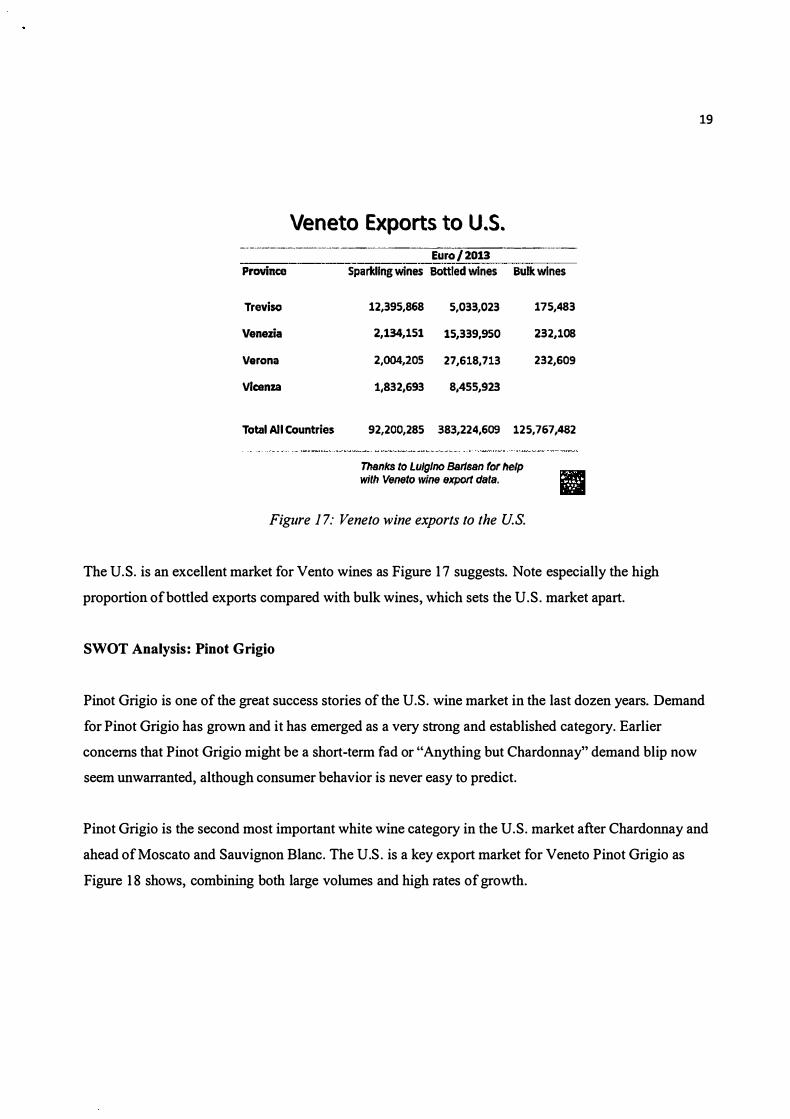
Figure 17: Veneto wine exports to the u.s.
The U. S. is an excellent market for Vento wines as Figure 17 suggests. Note especially the high
proportion of bottled exports compared with bulk wines, which sets the U.S. market apart.
SWOT Analysis: Pinot Grigio
19
Pinot Grigio is one of the great success stories of the U. S. wine market in the last dozen years. Demand
for Pinot Grigio has grown and it has emerged as a very strong and established category. Earlier
concerns that Pinot Grigio might be a short-term fad or "Anything but Chardonnay" demand blip now
seem unwarranted, although consumer behavior is never easy to predict.
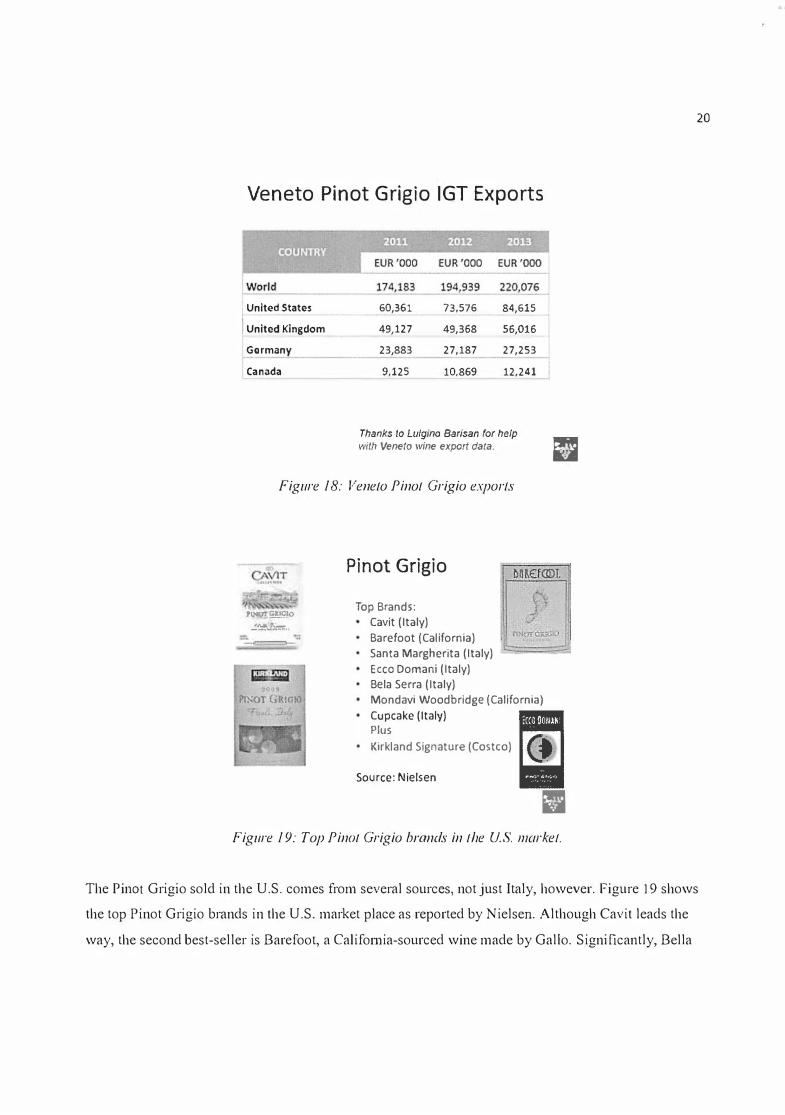
Pinot Grigio is the second most important white wine category in the U. S. market after Chardonnay and
ahead of Moscato and Sauvignon Blanc. The U.S. is a key export market for Veneto Pinot Grigio as
Figure 1 8 shows, combining both large volumes and high rates of growth.
Veneto Pinot Grigio IGT Exports
I United Stat.,
United Klngdom
Germany
I Canada
60,361 73,576 84,615
49,127 49,368 56,016
23,883 27,187 27,253
9,125 10,869 12,241
Thanks 10 Lu/glno Bar/san for help
with Veneto wine export data. ill Figure 18: Veneto Pinot Grigio exports
� ��o .!.�.:L�.
Pr.-:OT Gt(IGlO
Pinot Grigio Top Brands:
Cavit (Italy)
Barefoot (California)
Santa Margherita (Italy)
Ecce Doman; (Italy)
Bela Serra (Italy)
Mondavi Woodbridge (California)
Cupcake (Italy) i' Pills
Kirkland Signature (Costeo)
Source: Nielsen
= Figure 19: Top Pinal Grigio bl'({nds in the u.s. market.
20
The Pinal Grigio sold in the U.S. comes from several sources, not just Italy, however. Figure 19 shows
the top Pinot Grigio brands in the U.S. market place as reported by Nielsen. Although Cavit leads the
way, the second best-seller is Barefoot, a Califomia-sourced wine made by Gallo. Significantly, Bella

21
Sera and Ecco Domani are also Gallo brands, a fact that emphasizes the importance of distribution in the
U.S. market. As the largest U.S. producer (and in fact the largest wine company in the world), Gallo has
developed a very successful distribution network and its domestic and international wines have a strong
distribution advantage. Costco's Kirkland Signature Pinot Grigio is also an important element of this
category. As previously noted, it is Costco's top selling wine.
SWOT of Pinot Grigio
Strengths
Weaknesses
Opportunities
Threats
Large and growing market segment Successful brands and distribution
Generic varietal curse. Competition f rom California/Washington/Oregon
Upmarket possibilities? Santa Margherita
and the $20 glass ce il ing
The next big thing? Resurgent Australia?
II Figure 20: Pinol Grigio S WOT Summary
Figure 20 summarizes the SWOT analysis of Pi not Grigio. Pinot Grigio is a large and growing segment
of the U.S. wine market led by highly successful brands that enjoy strong distribution. Pinot Grigio
seemingly has everything going for it. But many Americans do not automatically think of Italy or the
Veneto when they think about Pinot Grigio. There is strong and growing competition from California,
Washington and to a lesser extent Oregon (where the wine is marketed as Pinot Gris). There are
moderate stocks ofPinot Grigio in California and some vineyard owners have plans to increase
plantings (replacing fading Moscato with rising Pinot Grigio in some cases).
There is an interesting opportunity for super-premium Pinot Grigio, taking advantage of the rising tide at
higher price points in the U.S. wine market. Santa Margherita has already demonstrated that Americans
are willing to pay a higher price for Pinot Grigio when it is made, packaged and marketed successfully.
22
The question is whether Santa Margherita can be successfully replicated on a broader scale? Some in the
U.S. market believe that there is a $20 "glass ceiling" for anything in the white wine category except
Chardonnay. Potential threats include the rise of production in other countries (could Australia re
emerge?) and the possibility that the long Pinot Grigio boom might turn to bust. On balance, however, it
seems that at least in the short run the strengths and opportunities outweigh the weaknesses and
challenges for these popular Veneto wines.
SWOT Analysis: Soave
� Soave
S O A V E
B O L L A.
I
10'"'1.
r��AR' �OA"r
I :-: A M A V I N SO.-\VE
� --�.�-.. .... -, .. .. -'=-":."-:.::':-:�:
Top Brands:
Bolla
Folonari
Alpha Zeta
Inami
Montressor
r-....,...--'S:;.;o�urce: Nielsen
SOAVE-. ....,
Figure 21: Top Soave branci.1 in lhe u.s. 1\1arkel
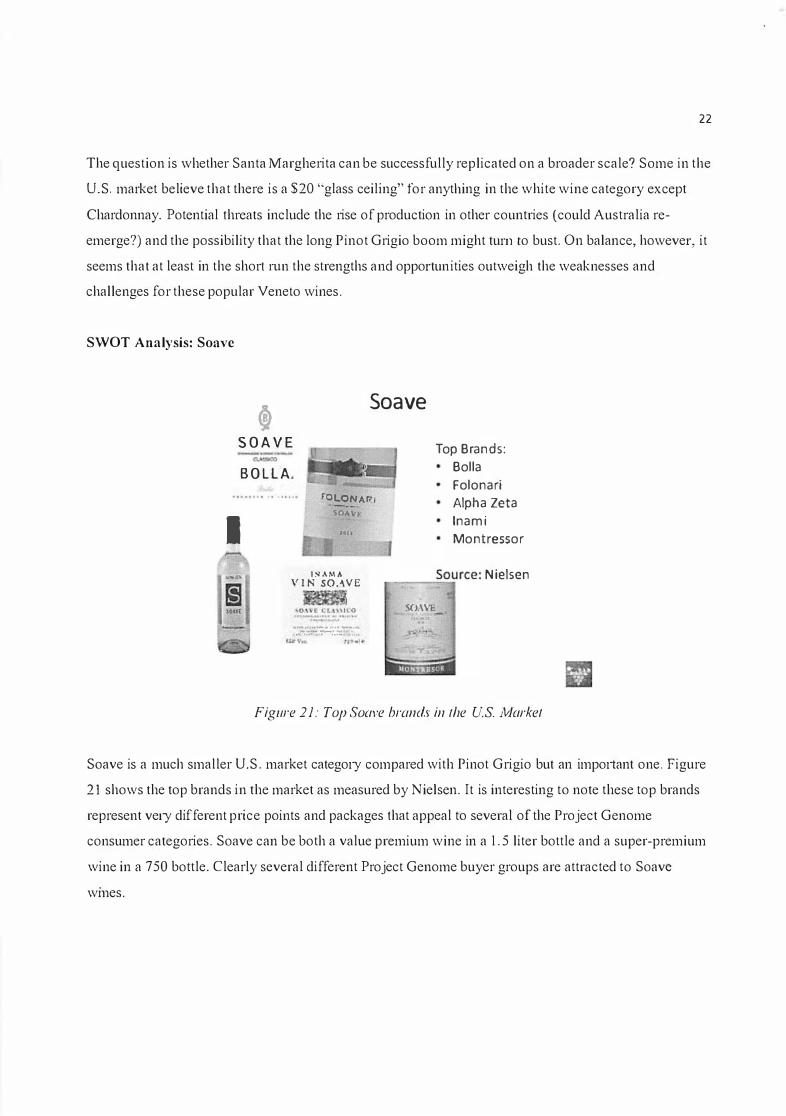
Soave is a much smaller U.S. market categolY compared with Pinot Grigio but an impol1ant one. Figure
2 1 shows the top brands in the market as measured by Nielsen. It is interesting to note these top brands
represent velY different price points and packages that appeal to several of the Project Genome
consumer categories. Soave can be both a value premium wine in a 1 . 5 liter bottle and a super-premium
wine in a 750 bottle. Clearly several different Project Genome buyer groups are attracted to Soave
wmes.
SWOT of Soave
Strengths Established category 5% + sales growth
Weaknesses Smaller market segment, highly fragmented after the top brands
Opportunities Millennials. Soave Classico Expand beyond existing m arket centers
Threats Easy to get lost in the current wave of "discovery" of new wines regions & styles
II Figure 22: Soave S WOT Summary
23
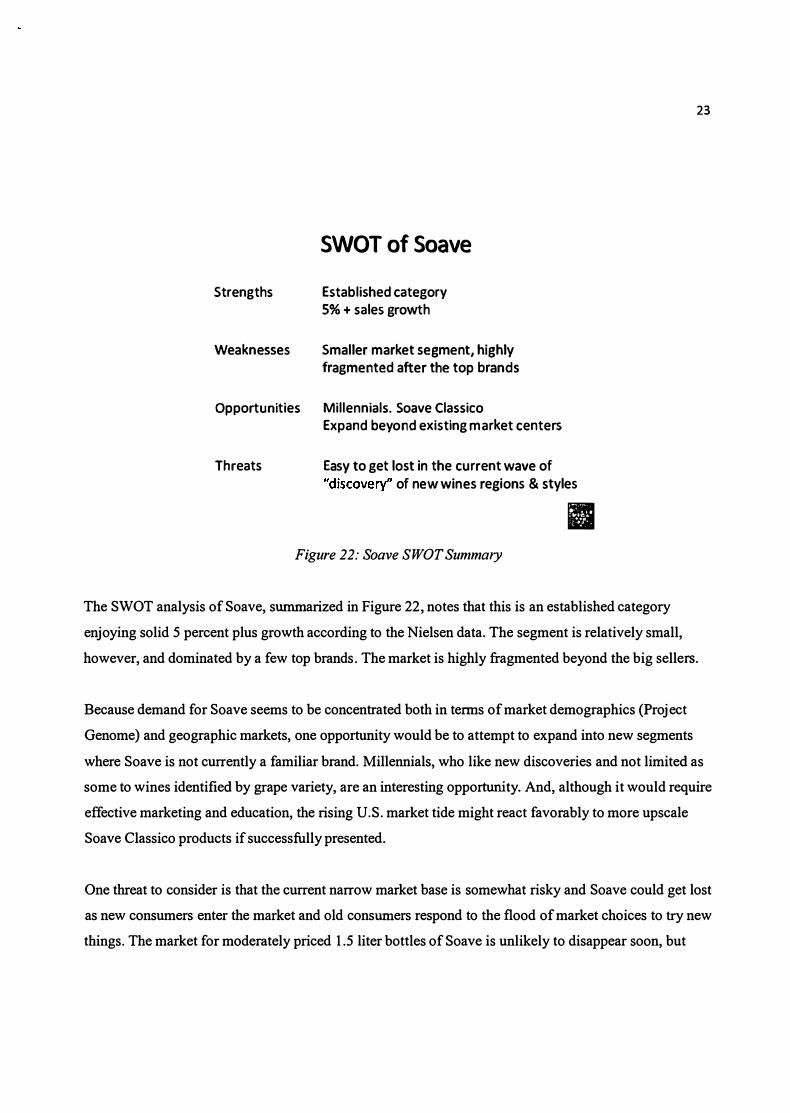
The SWOT analysis of Soave, summarized in Figure 22 , notes that this is an established category
enjoying solid 5 percent plus growth according to the Nielsen data. The segment is relatively small,
however, and dominated by a few top brands. The market is highly fragmented beyond the big sellers.
Because demand for Soave seems to be concentrated both in tenns of market demographics (project
Genome) and geographic markets, one opportunity would be to attempt to expand into new segments
where Soave is not currently a familiar brand. Millennials, who like new discoveries and not limited as
some to wines identified by grape variety, are an interesting opportunity. And, although it would require
effective marketing and education, the rising U.S. market tide might react favorably to more upscale
Soave Classico products if successfully presented.
One threat to consider is that the current narrow market base is somewhat risky and Soave could get lost
as new consumers enter the market and old consumers respond to the flood of market choices to try new
things. The market for moderately priced 1 .5 liter bottles of Soave is unlikely to disappear soon, but

maintaining growth in h_igher price categories may require some effort in the increasingly competitive
marketplace.
SWOT Analysis: Valpolicclla
Valpolicella Exports to U .S.
Amarone
Reciotto
I Valp ctasslco
Vatp Rlpasso
'--
591,093 154,760 145,003
9 2,000 4,930
212,051 23,829 49,490
452,301 21,347 30,302
Thanks 10 Lulglno aarisan for help with Veneto wine export data.
Figure 23: Va/po/icel/a Exports to the u.s.
566,059
1,203
3,316
540,211
The U.S. is an important market for the wines of the Valpolicella region, which will be discussed here
collectively even though, as Figure 23 suggests, there are clearly different drivers for the various
individual wines. The U.S. is a significant market for all the wines shown here except Reciotto, but its
relative importance (compared to the other countries shown) to Valpolicella Classico is worth noting.
24
Figure 24 shows the top Valpolicella wine brands in the U.S. market according to Nielsen. Note again
the diversity of products at the top of the market, from Bolla's high volume wines to the super-premium
products of Zenato and Cesari, for example. Valpolicella means many things to U.S. consumers and
there are strong brands in each category (with the obvious exception of Reciotto).
27
occasions (birthdays, anniversaries, weddings, and holidays) rather than as a everyday consumer
beverage. This is changing, however, and Prosecco, with its friendly style and prices is one factor in the
transfOlll1ation.
As Figure 26 indicates, the sparkling wine category is growing slightly faster than still wines, with
imported sparkling wine sales increasing faster than domestic wines. Domestic sparkling wines account
for about 60 percent of sales.
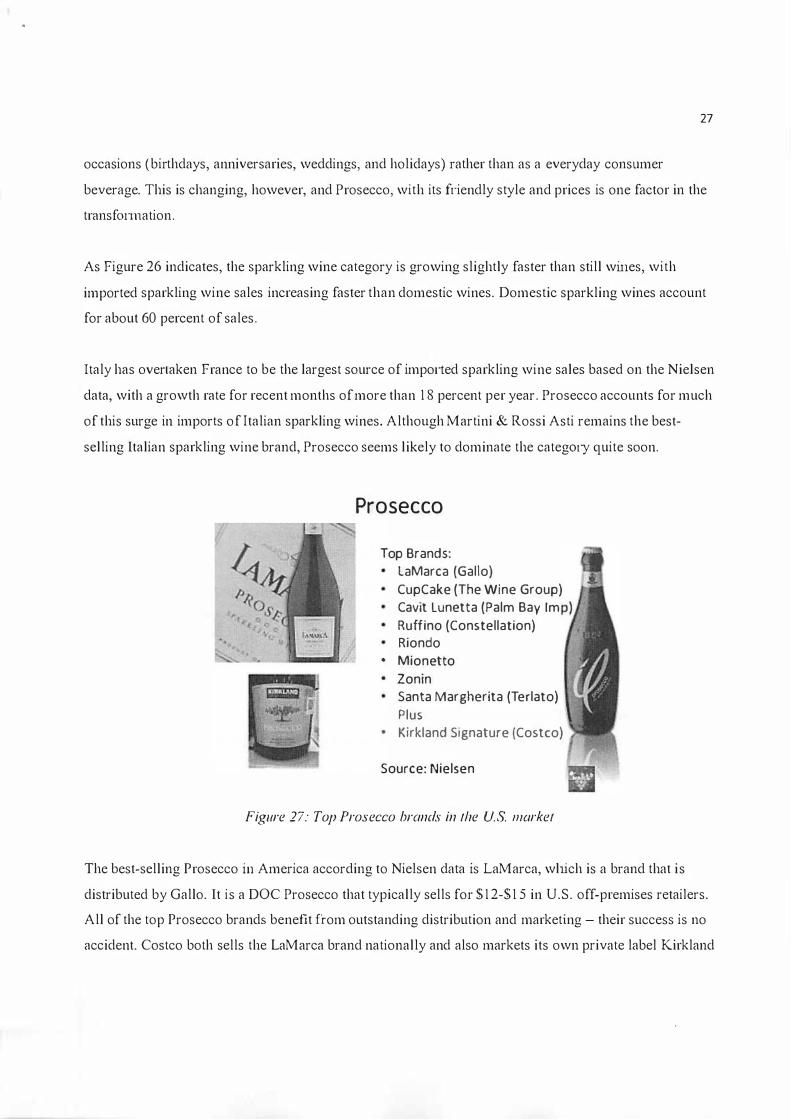
Italy has overtaken France to be the largest source of imported sparkling wine sales based on the Nielsen
data, with a growth rate for recent months of more than 1 8 percent per year. Prosecco accounts for much
of this surge in imports of Italian sparkling wines. Although Martini & Rossi Asti remains the best
selling Italian sparkling wine brand, Prosecco seems likely to dominate the categOIY quite soon.
•
Prosecco
Top Brands:
LaMarca (Gallo)
CupCake (The Wine Group)
Cavit Lunetta (Palm Bay 1m
Ruffino (Constellation) Riondo
• Mionetto
Zonin
Santa Margherita (Terlato)
Plus
Kirkland Signature (Costco)
Source: Nielsen
Figure 27: Top Prosecco brands in /he u.s. //Iorke/
The best-selling Prosecco in America according to Nielsen data is LaMarca, which is a brand that is
distributed by Gallo. It is a DOC Prosecco that typically sells for $ 1 2-$ 1 5 in U.S. off-premises retailers.
All of the top Prosecco brands benefit from outstanding distribution and marketing - their success is no
accident. Costco both sells the LaMarca brand nationally and also markets its own private label Kirkland

28
Signature Prosecco. The broad and deep distribution of Prosecco is a clear advantage and helps account
for its success. Prosecco is generally priced below Champagne in the U.S. market and have taken market
share from the French wines, but have also brought in new consumers. Most Prosecco is priced above
the cheapest domestic sparkling wines, such as the inexpensive Cook's California Champagne brand.
Prosecco shares a very competitive category with sparkling wines from California, Washington, New
Mexico (the Gruet brand) and of course France and Spain.
SWOT of Prosecco
Strengths Hot ! Hot! Hot l Prosecco has taken the
U.S. by storm. Strong brand and
distribution.
Weaknesses Sparkling category is relatively smal l in
U.S. market. How much wil l it grow?
Opportunities U pmarket potential. OOCG upgrad e?
Undermining Champagne.
Threats Champagne strikes back? Cava offensive?
Figure 28: Prosecco SWOT summary
The SWOT analysis of Prose ceo in the U.S. market is very positive. Prosecco has established a strong
brand with excellent distribution. The market is growing quickly. The U.S. sparkling wine category is
relatively small by international standards, however, and the question of how much it will grow and how
long Prosecco's boom will continue are impossible to answer with certainty.
Upmarket opportunities are enticing - can Americans be persuaded to move up to nOCG products, for
example? If so, Prosecco may further undermine Champagne's status. But Champagne is a strong brand
with substantial backing, so it is reasonable to expect a response if Prosecco continues to nibble at its
share of the sparkling wine market. Some Cava producers have also expressed the intent to capture new
29
consumers brought into this market segment by Prosecco. So expect that market environment to become
increasingly competitive in coming years.
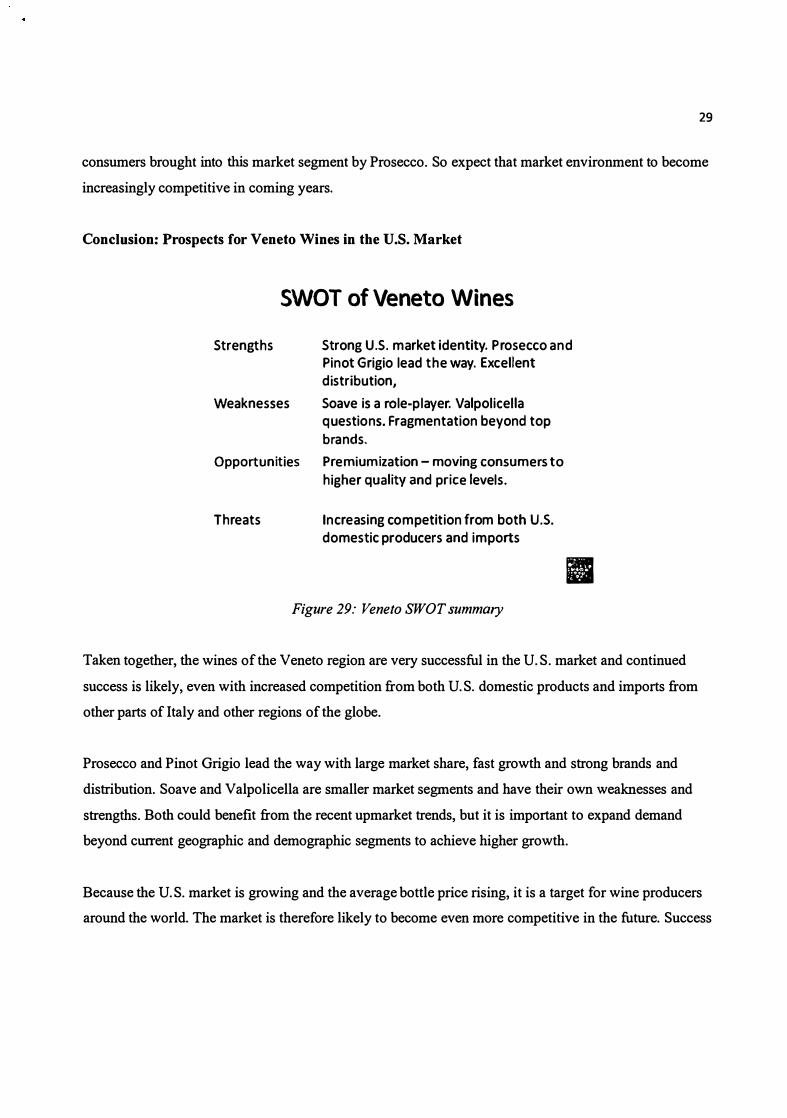
Conclusion: Prospects for Veneto Wines in the U.S. Market
SWOT of Veneto Wines
Strengths Strong U.S. market identity. P rosecco and Pinot Grigio lead the way. Excellent distribution,
Weaknesses Soave is a role-player. Valpolicella q uestions. Fragmentation beyond top
brands.
Opportunities Premiumization - moving consumers to
h igher quality and price levels.
Threats Increasing competition from both U.S. domestic producers and imports
Figure 29: Veneto SWOT summary
•
Taken together, the wines of the Veneto region are very successful in the U.S. market and continued
success is likely, even with increased competition from both U.S. domestic products and imports from
other parts of Italy and other regions of the globe.
Prosecco and Pinot Grigio lead the way with large market share, fast growth and strong brands and
distribution. Soave and Valpolicella are smaller market segments and have their own weaknesses and
strengths. Both could benefit from the recent upmarket trends, but it is important to expand demand
beyond current geographic and demographic segments to achieve higher growth.
Because the U.S. market is growing and the average bottle price rising, it is a target for wine producers
around the world. The market is therefore likely to become even more competitive in the future. Success
will go to producers who understand the complex market structure, as explained in the first part of this
report, and who can develop effective marketing and distribution strategies.
30