analytical chemistry is scientific practice that tells...
TRANSCRIPT
1
Chemistry 310; Course Mechanics
-General Information Handout
- The lab (Dr. Steehler)
- Web & IT stuff – http://web.utk.edu/~msepania/
- Getting in touch with me (email best - [email protected]); creating a listserve
- Study aids and approaches
- Testing and grading
- Your questions???
Analytical Chemistry is Scientific Practice that Tells Us
- What compounds are in a sample, chemical composition?Qualitative Analysis
- What is the concentration of a compound in a sample?Quantitative Analysis (the majority of this class)
-The chemical and physical properties of the compounds of interestare important
- Methods can be “wet chemical” or “instrumental” based- Determining what is in a sample is harder than determining if aparticular compound is in a sample
- Trace analysis is more difficult than bulk analysis
2
Chemistry 310; Section I – Basic Concepts and Error Analysis
-Chapters 0-2 will be glossed over (it should be mostly review, but you to read) and no recommended problems
- Chapters 3-5 involve error analysis, statistics, etc. (see recommended problems)
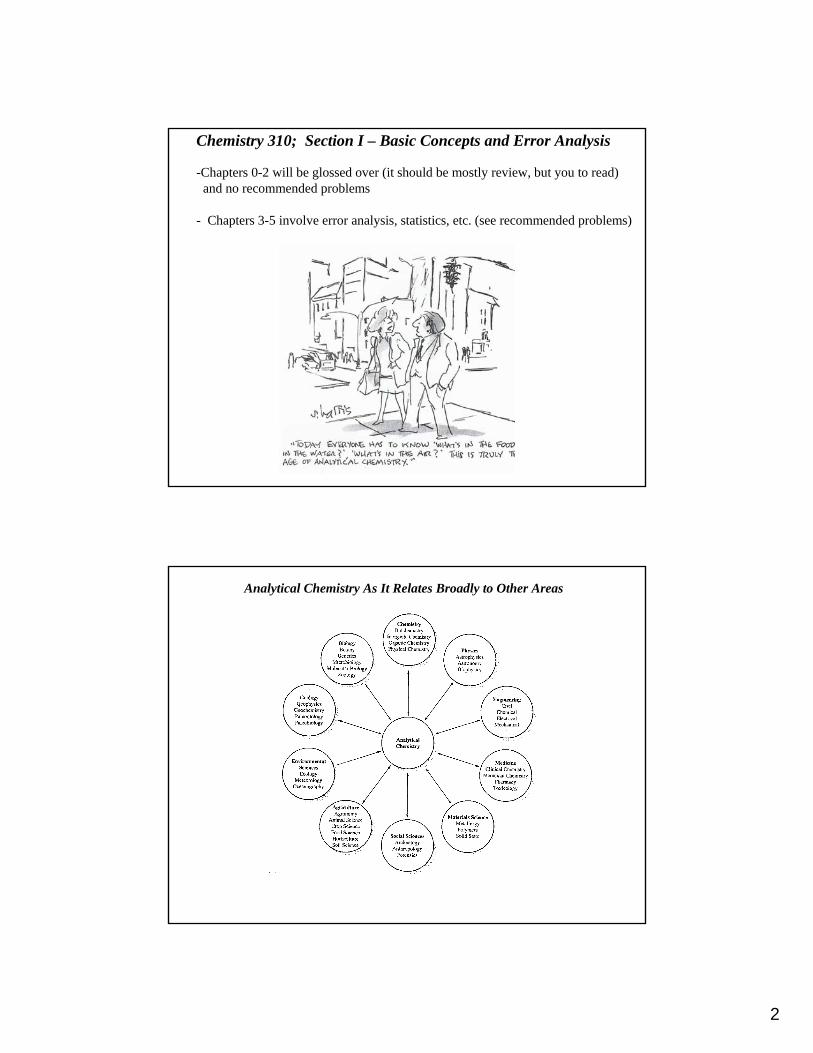
Analytical Chemistry As It Relates Broadly to Other Areas
3
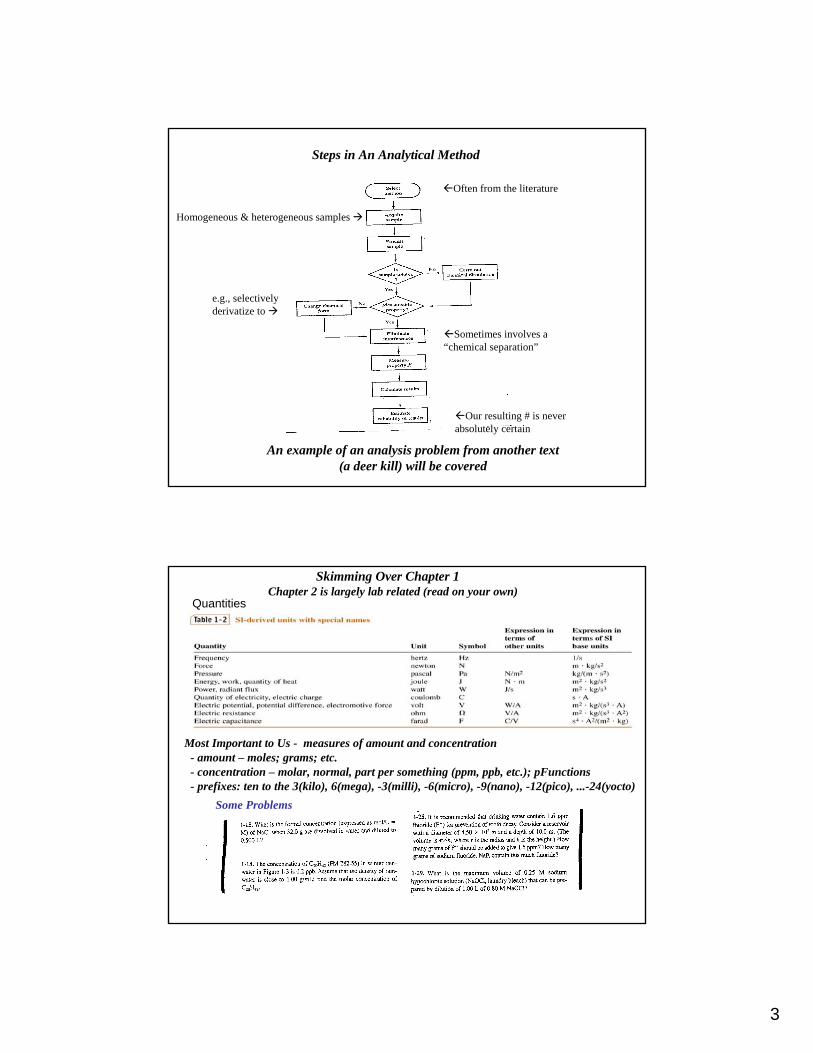
Steps in An Analytical Method
An example of an analysis problem from another text (a deer kill) will be covered
Often from the literature
Homogeneous & heterogeneous samples
Our resulting # is never absolutely certain
Sometimes involves a“chemical separation”
e.g., selectivelyderivatize to
Some Problems
Skimming Over Chapter 1
Quantities
Most Important to Us - measures of amount and concentration- amount – moles; grams; etc.- concentration – molar, normal, part per something (ppm, ppb, etc.); pFunctions- prefixes: ten to the 3(kilo), 6(mega), -3(milli), -6(micro), -9(nano), -12(pico), ...-24(yocto)
Chapter 2 is largely lab related (read on your own)
4
Chapters 3-5 – Data Treatment
Some quotes on this topic –“… because data of unknown reliability are worthless.”“Indeed, the effort involved in establishing the quality of experimental results is frequently comparable to the effort expended in obtaining them.”“… a scientist can’t afford to waste time in the pursuit of greaterreliability than is needed.”
”“
Or from the Harris text
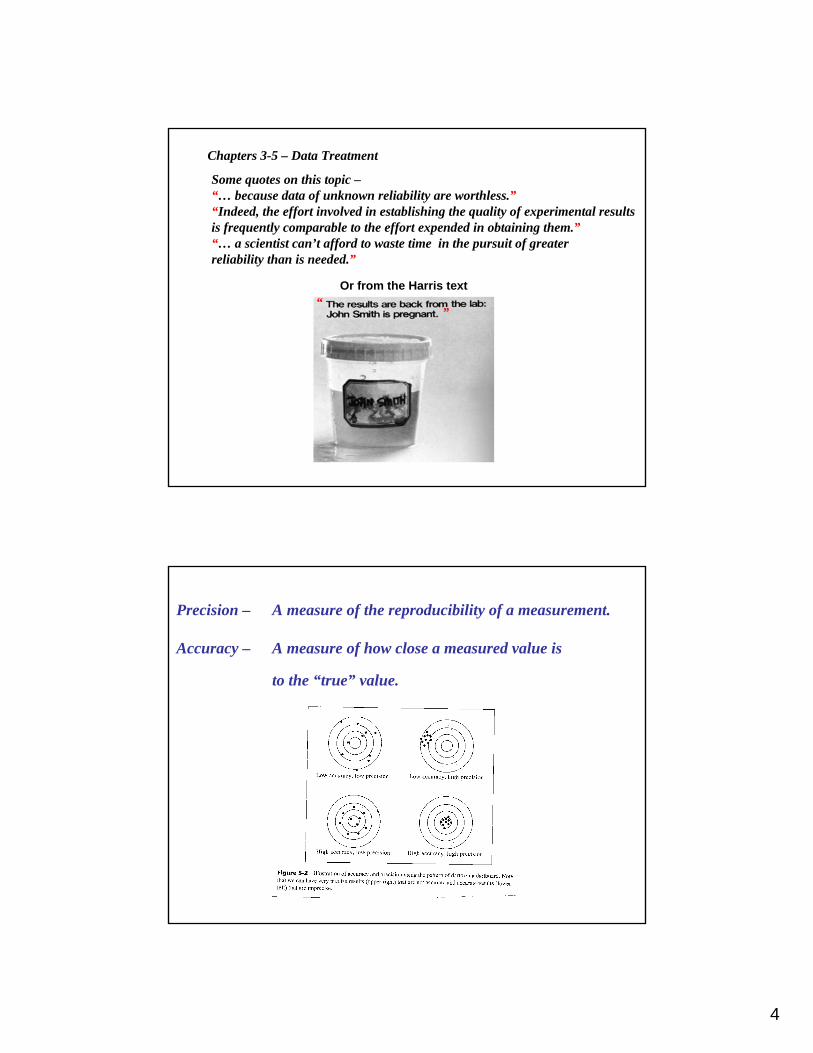
Precision – A measure of the reproducibility of a measurement.
Accuracy – A measure of how close a measured value is
to the “true” value.
5
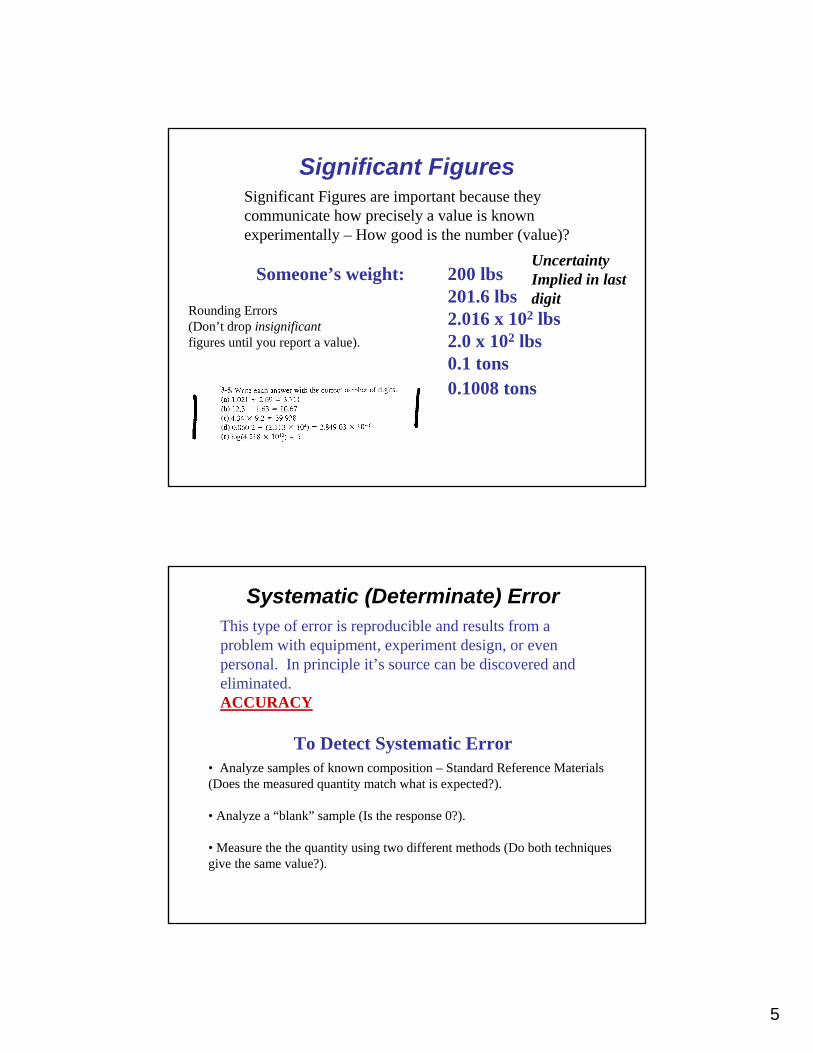
Significant FiguresSignificant Figures are important because theycommunicate how precisely a value is known experimentally – How good is the number (value)?
Someone’s weight: 200 lbs 201.6 lbs2.016 x 102 lbs2.0 x 102 lbs0.1 tons0.1008 tons
Rounding Errors (Don’t drop insignificantfigures until you report a value).
Uncertainty Implied in lastdigit
Systematic (Determinate) ErrorThis type of error is reproducible and results from a problem with equipment, experiment design, or even personal. In principle it’s source can be discovered and eliminated.ACCURACY
To Detect Systematic Error• Analyze samples of known composition – Standard Reference Materials (Does the measured quantity match what is expected?).
• Analyze a “blank” sample (Is the response 0?).
• Measure the the quantity using two different methods (Do both techniques give the same value?).
6
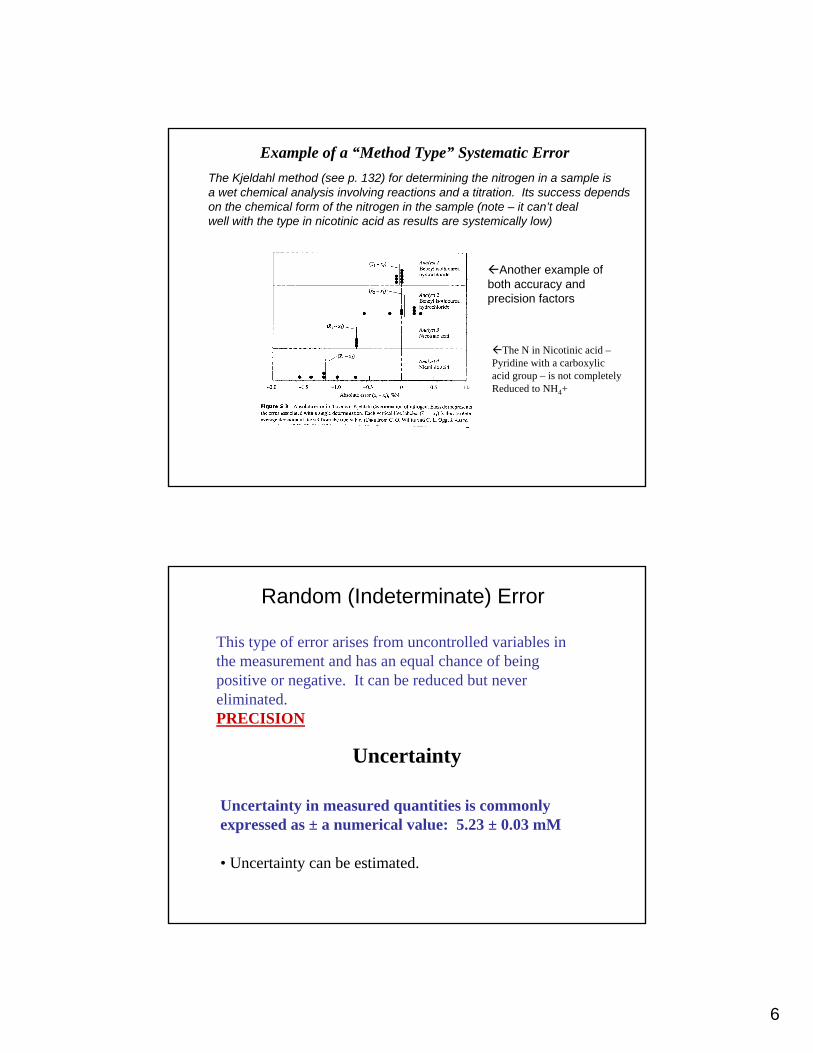
Example of a “Method Type” Systematic ErrorThe Kjeldahl method (see p. 132) for determining the nitrogen in a sample isa wet chemical analysis involving reactions and a titration. Its success depends on the chemical form of the nitrogen in the sample (note – it can’t dealwell with the type in nicotinic acid as results are systemically low)
Another example ofboth accuracy andprecision factors
The N in Nicotinic acid –Pyridine with a carboxylic acid group – is not completelyReduced to NH4+
Random (Indeterminate) Error
This type of error arises from uncontrolled variables in the measurement and has an equal chance of being positive or negative. It can be reduced but never eliminated.PRECISION
Uncertainty
Uncertainty in measured quantities is commonly expressed as ± a numerical value: 5.23 ± 0.03 mM
• Uncertainty can be estimated.
7
Absolute Uncertainty
gg 003.0003.0102.8 ⇒±
Relative Uncertainty
0004.0102.8003.0
003.0102.8 =⇒±gg
g
Percent Relative Uncertainty
%04.0%100102.8003.0
003.0102.8 =×⇒±gg
g
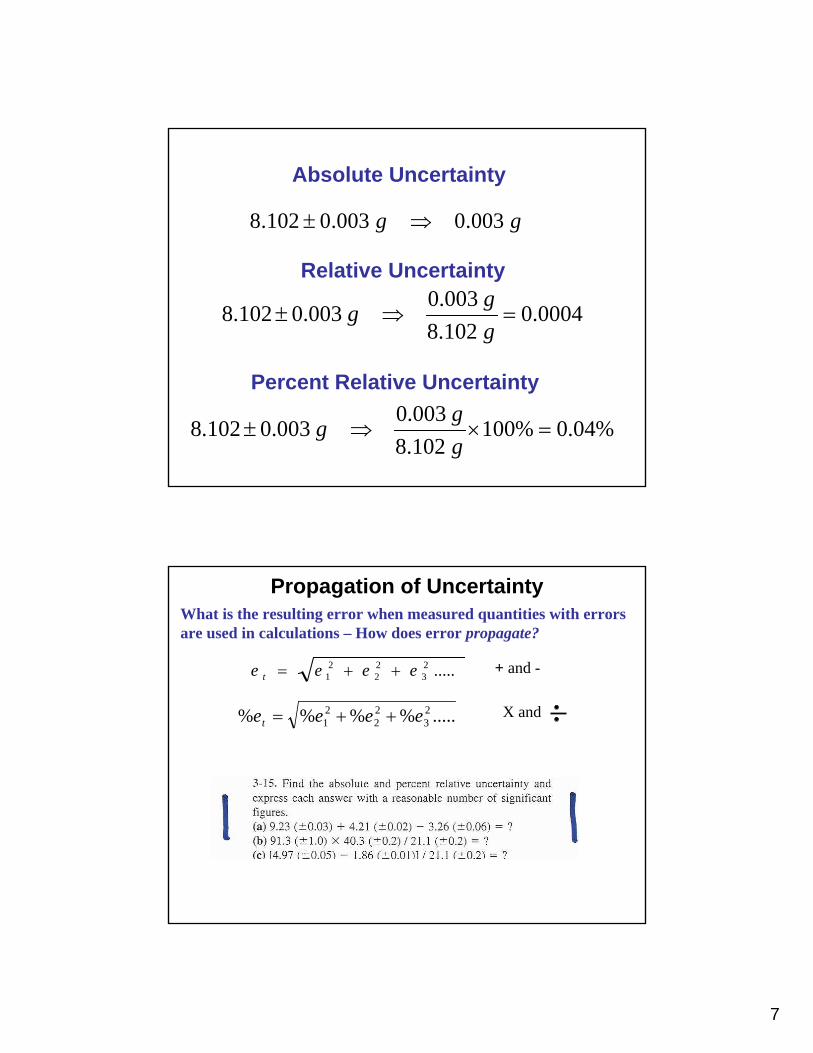
Propagation of UncertaintyWhat is the resulting error when measured quantities with errorsare used in calculations – How does error propagate?
.....23
22
21 eeee t ++= + and -
.....%%%% 23
22
21 eeeet ++= X and
8
StatisticsExperimental scientists use statistics to define, quantify, understand and reduce experimental error.
In this course we will primarily use statistics to define and quantify random (indeterminate) error associated with experiments – Precision!
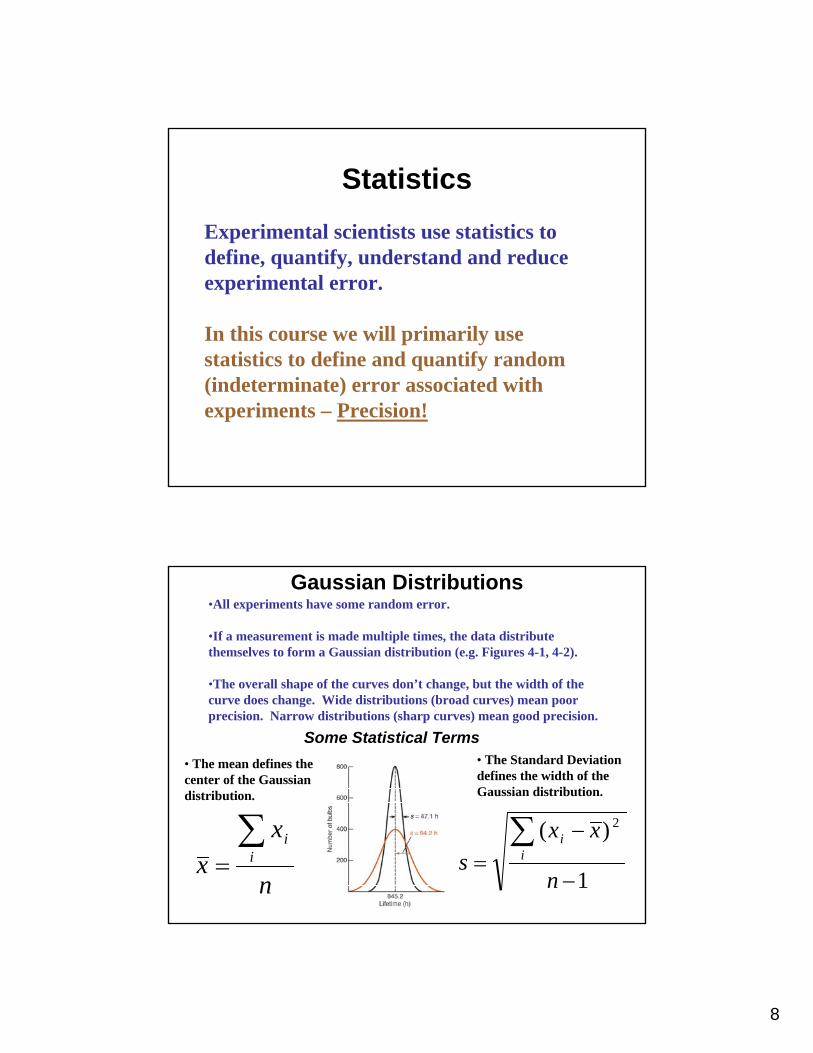
Gaussian Distributions•All experiments have some random error.
•If a measurement is made multiple times, the data distribute themselves to form a Gaussian distribution (e.g. Figures 4-1, 4-2).
•The overall shape of the curves don’t change, but the width of the curve does change. Wide distributions (broad curves) mean poor precision. Narrow distributions (sharp curves) mean good precision.
• The mean defines the center of the Gaussian distribution.
n
xx i
i∑=
• The Standard Deviation defines the width of the Gaussian distribution.
1
)( 2
−
−=∑
n
xxs i
i
Some Statistical Terms
9
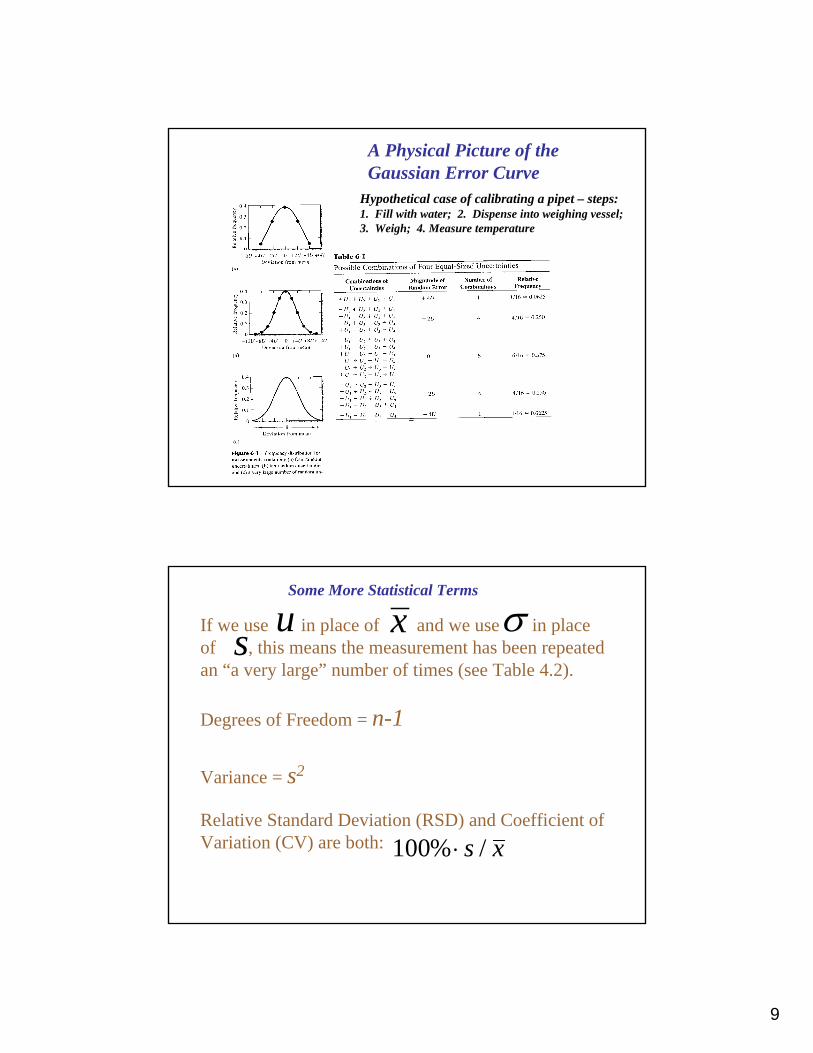
Hypothetical case of calibrating a pipet – steps:1. Fill with water; 2. Dispense into weighing vessel;3. Weigh; 4. Measure temperature
A Physical Picture of the Gaussian Error Curve
If we use in place of and we use in place of , this means the measurement has been repeated an “a very large” number of times (see Table 4.2).
Degrees of Freedom = n-1
Variance = s2
Relative Standard Deviation (RSD) and Coefficient of Variation (CV) are both:
s σu x
xs /%100 ⋅
Some More Statistical Terms
10
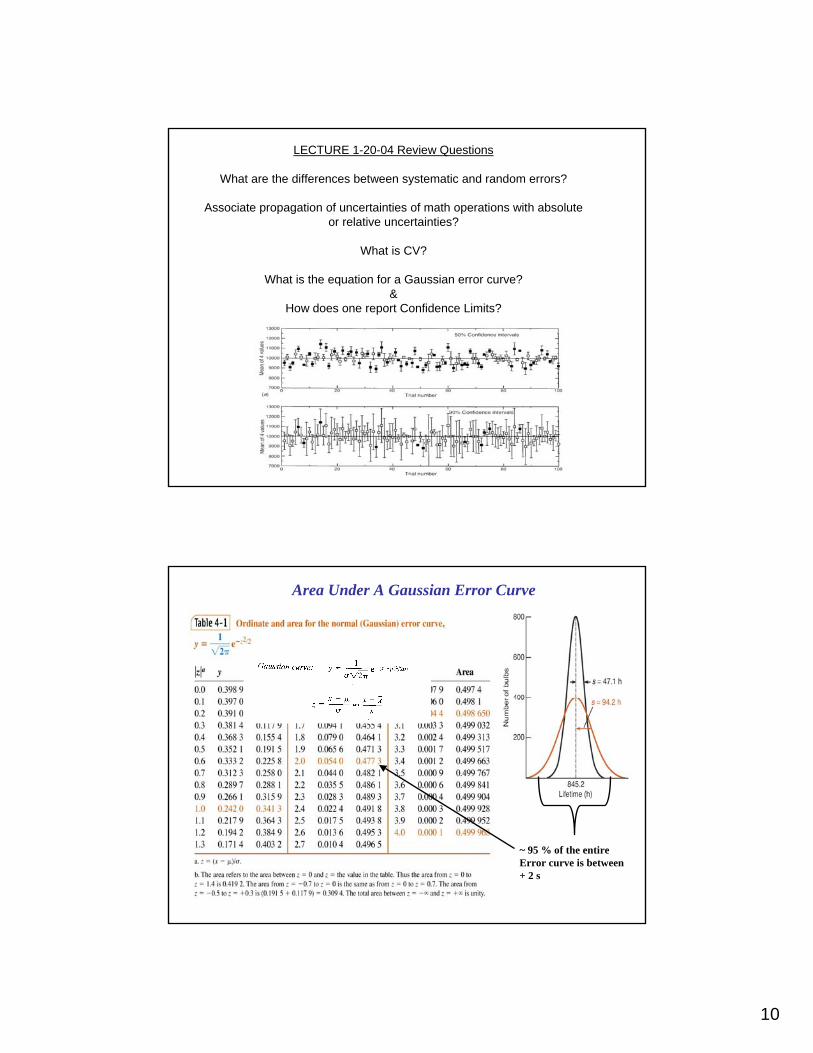
LECTURE 1-20-04 Review Questions
What are the differences between systematic and random errors?
Associate propagation of uncertainties of math operations with absoluteor relative uncertainties?
What is CV?
What is the equation for a Gaussian error curve?&
How does one report Confidence Limits?
Area Under A Gaussian Error Curve
~ 95 % of the entireError curve is between+ 2 s
11
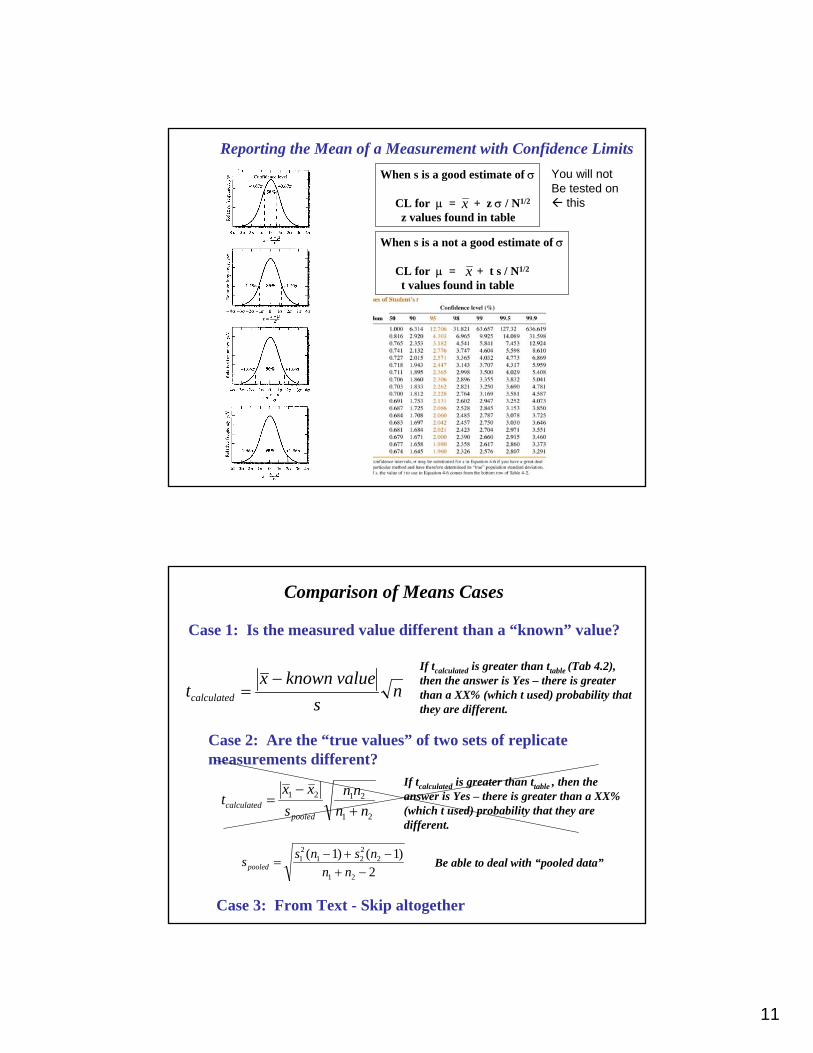
Reporting the Mean of a Measurement with Confidence Limits
When s is a not a good estimate of σ
CL for µ = + t s / N1/2
t values found in tablex
When s is a good estimate of σ
CL for µ = + z σ / N1/2
z values found in tablex
You will notBe tested on
this
Case 1: Is the measured value different than a “known” value?
If tcalculated is greater than ttable (Tab 4.2), then the answer is Yes – there is greater than a XX% (which t used) probability that they are different.
ns
valueknownxtcalculated
−=
Case 2: Are the “true values” of two sets of replicate measurements different?
Comparison of Means Cases
Case 3: From Text - Skip altogether
If tcalculated is greater than ttable , then the answer is Yes – there is greater than a XX% (which t used) probability that they are different.
21
2121
nnnn
sxx
tpooled
calculated +−
=
2)1()1(
21
2221
21
−+−+−
=nn
nsnsspooled Be able to deal with “pooled data”
12
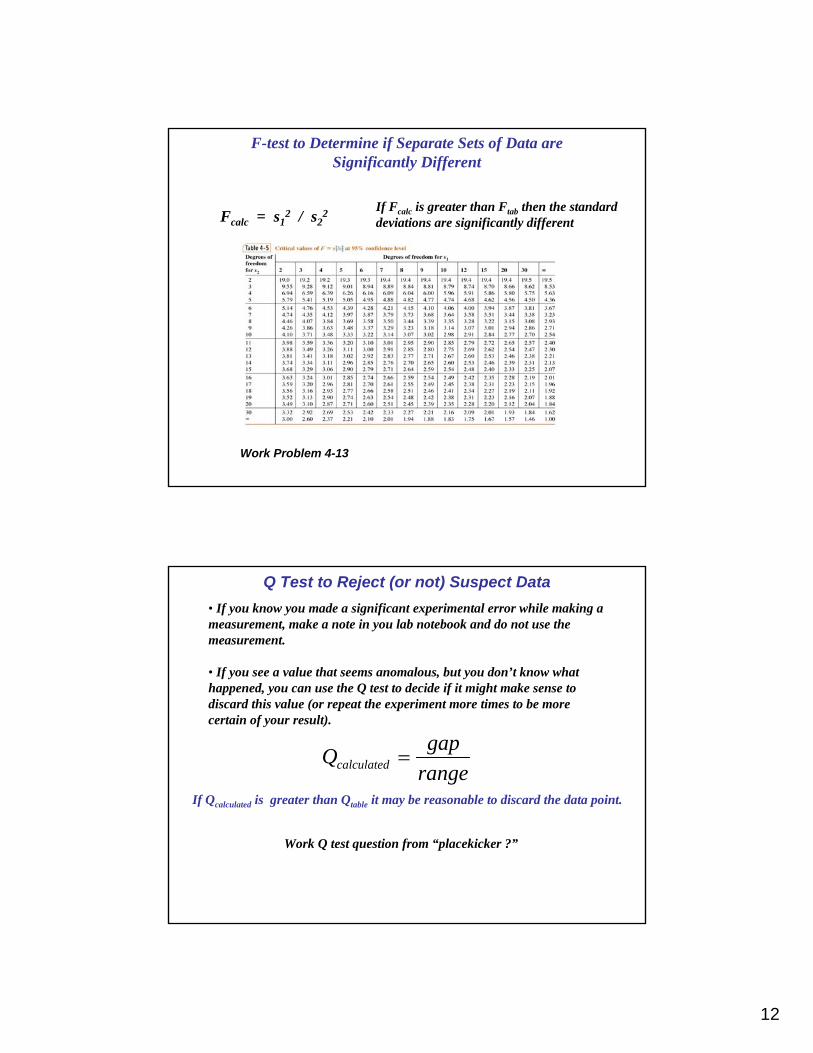
F-test to Determine if Separate Sets of Data are Significantly Different
Fcalc = s12 / s2
2 If Fcalc is greater than Ftab then the standarddeviations are significantly different
Work Problem 4-13
Q Test to Reject (or not) Suspect Data• If you know you made a significant experimental error while making a measurement, make a note in you lab notebook and do not use the measurement.
• If you see a value that seems anomalous, but you don’t know what happened, you can use the Q test to decide if it might make sense to discard this value (or repeat the experiment more times to be more certain of your result).
rangegapQcalculated =
If Qcalculated is greater than Qtable it may be reasonable to discard the data point.
Work Q test question from “placekicker ?”
13
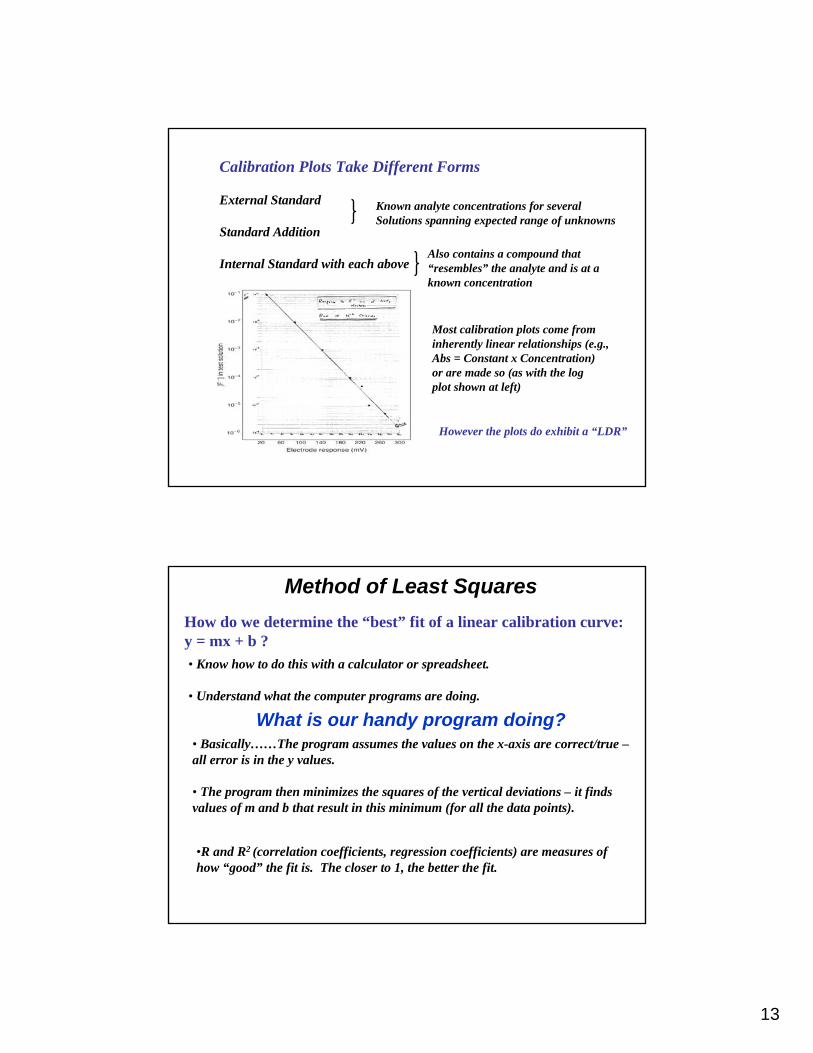
Calibration Plots Take Different Forms
External Standard
Standard Addition
Internal Standard with each above
Known analyte concentrations for severalSolutions spanning expected range of unknowns
Also contains a compound that “resembles” the analyte and is at a known concentration
Most calibration plots come from inherently linear relationships (e.g., Abs = Constant x Concentration)or are made so (as with the logplot shown at left)
However the plots do exhibit a “LDR”
Method of Least Squares
• Know how to do this with a calculator or spreadsheet.
• Understand what the computer programs are doing.
How do we determine the “best” fit of a linear calibration curve: y = mx + b ?
What is our handy program doing?• Basically……The program assumes the values on the x-axis are correct/true –all error is in the y values.
• The program then minimizes the squares of the vertical deviations – it finds values of m and b that result in this minimum (for all the data points).
•R and R2 (correlation coefficients, regression coefficients) are measures of how “good” the fit is. The closer to 1, the better the fit.
14
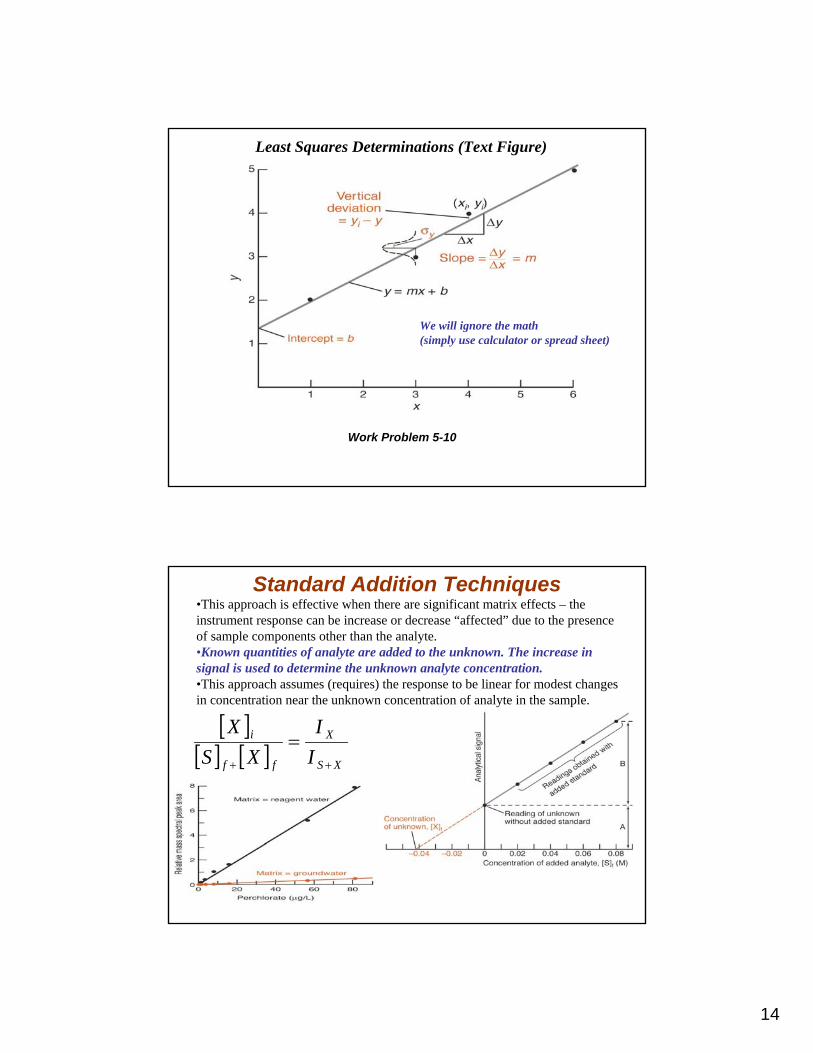
Least Squares Determinations (Text Figure)
Work Problem 5-10
We will ignore the math(simply use calculator or spread sheet)
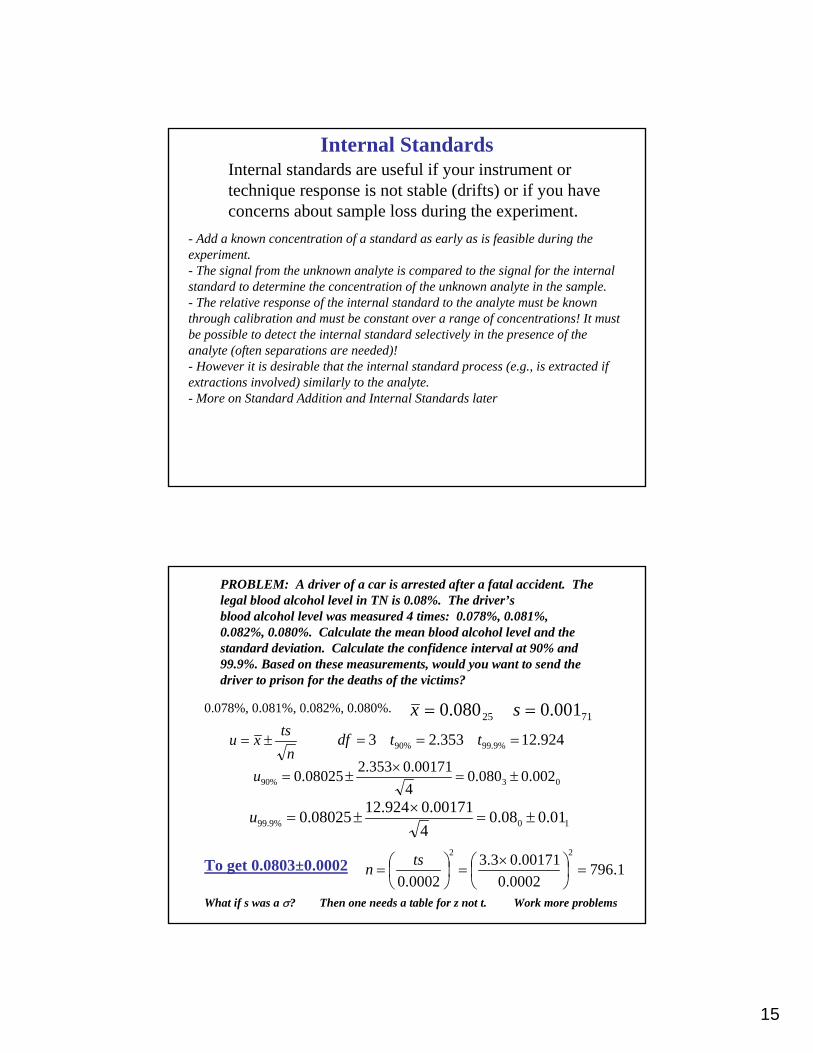
Standard Addition Techniques•This approach is effective when there are significant matrix effects – the instrument response can be increase or decrease “affected” due to the presence of sample components other than the analyte.•Known quantities of analyte are added to the unknown. The increase in signal is used to determine the unknown analyte concentration.•This approach assumes (requires) the response to be linear for modest changes in concentration near the unknown concentration of analyte in the sample.
[ ][ ] [ ] XS
X
ff
i
II
XSX
++
=
15
Internal StandardsInternal standards are useful if your instrument or technique response is not stable (drifts) or if you have concerns about sample loss during the experiment.
- Add a known concentration of a standard as early as is feasible during the experiment. - The signal from the unknown analyte is compared to the signal for the internal standard to determine the concentration of the unknown analyte in the sample. - The relative response of the internal standard to the analyte must be known through calibration and must be constant over a range of concentrations! It must be possible to detect the internal standard selectively in the presence of the analyte (often separations are needed)!- However it is desirable that the internal standard process (e.g., is extracted if extractions involved) similarly to the analyte.- More on Standard Addition and Internal Standards later
PROBLEM: A driver of a car is arrested after a fatal accident. The legal blood alcohol level in TN is 0.08%. The driver’s blood alcohol level was measured 4 times: 0.078%, 0.081%, 0.082%, 0.080%. Calculate the mean blood alcohol level and the standard deviation. Calculate the confidence interval at 90% and 99.9%. Based on these measurements, would you want to send the driver to prison for the deaths of the victims?
ntsxu ±= 924.12353.23 %9.99%90 === ttdf
03%90 002.0080.04
00171.0353.208025.0 ±=×
±=u
10%9.99 01.008.04
00171.0924.1208025.0 ±=×
±=u
0.078%, 0.081%, 0.082%, 0.080%.7125 001.0080.0 == sx
1.7960002.0
00171.03.30002.0
22
=⎟⎠⎞
⎜⎝⎛ ×
=⎟⎠⎞
⎜⎝⎛=
tsnTo get 0.0803±0.0002
What if s was a σ? Then one needs a table for z not t. Work more problems
16
0.1 L
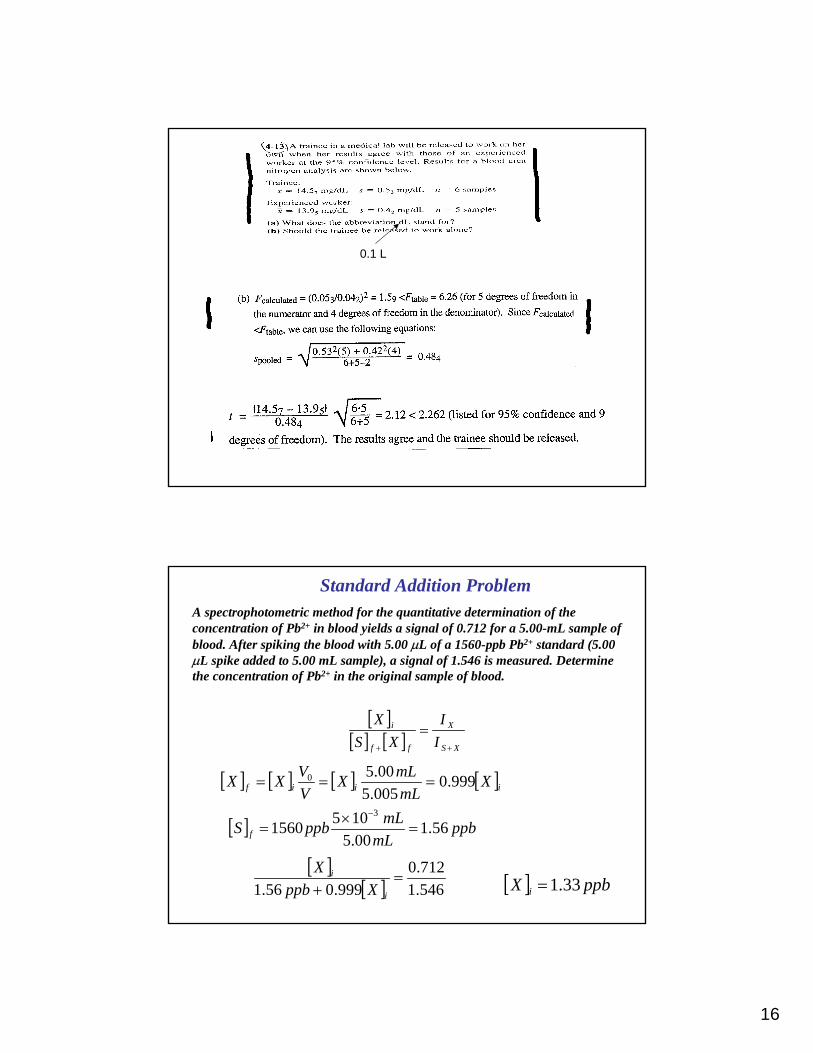
A spectrophotometric method for the quantitative determination of the concentration of Pb2+ in blood yields a signal of 0.712 for a 5.00-mL sample of blood. After spiking the blood with 5.00 µL of a 1560-ppb Pb2+ standard (5.00 µL spike added to 5.00 mL sample), a signal of 1.546 is measured. Determine the concentration of Pb2+ in the original sample of blood.
[ ][ ] [ ] XS
X
ff
i
II
XSX
++
=
[ ] [ ] [ ] [ ]iiif XmLmLX
VVXX 999.0
005.500.50 ===
[ ] ppbmL
mLppbS f 56.100.51051560
3
=×
=−
[ ][ ] 546.1
712.0999.056.1
=+ i
i
XppbX
[ ] ppbX i 33.1=
Standard Addition Problem
17
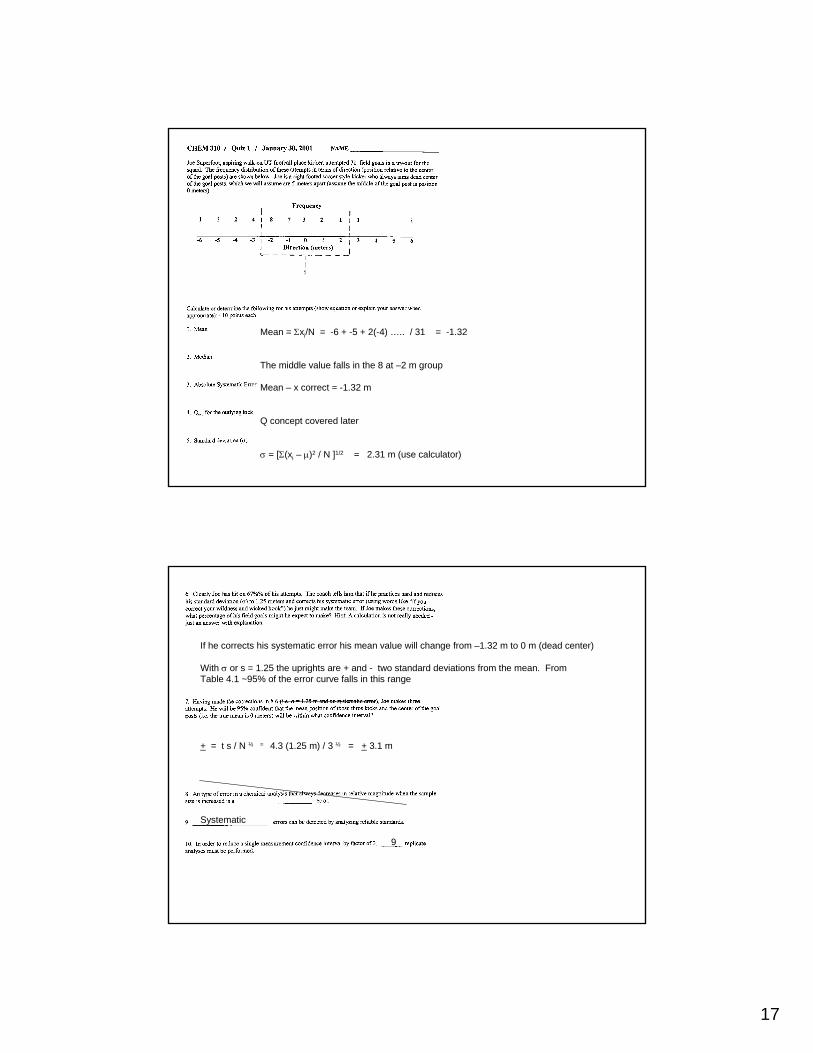
Mean = Σxi/N = -6 + -5 + 2(-4) ….. / 31 = -1.32
The middle value falls in the 8 at –2 m group
Mean – x correct = -1.32 m
Q concept covered later
σ = [Σ(xi – µ)2 / N ]1/2 = 2.31 m (use calculator)
If he corrects his systematic error his mean value will change from –1.32 m to 0 m (dead center)
With σ or s = 1.25 the uprights are + and - two standard deviations from the mean. FromTable 4.1 ~95% of the error curve falls in this range
+ = t s / N ½ = 4.3 (1.25 m) / 3 ½ = + 3.1 m
Systematic
9
18
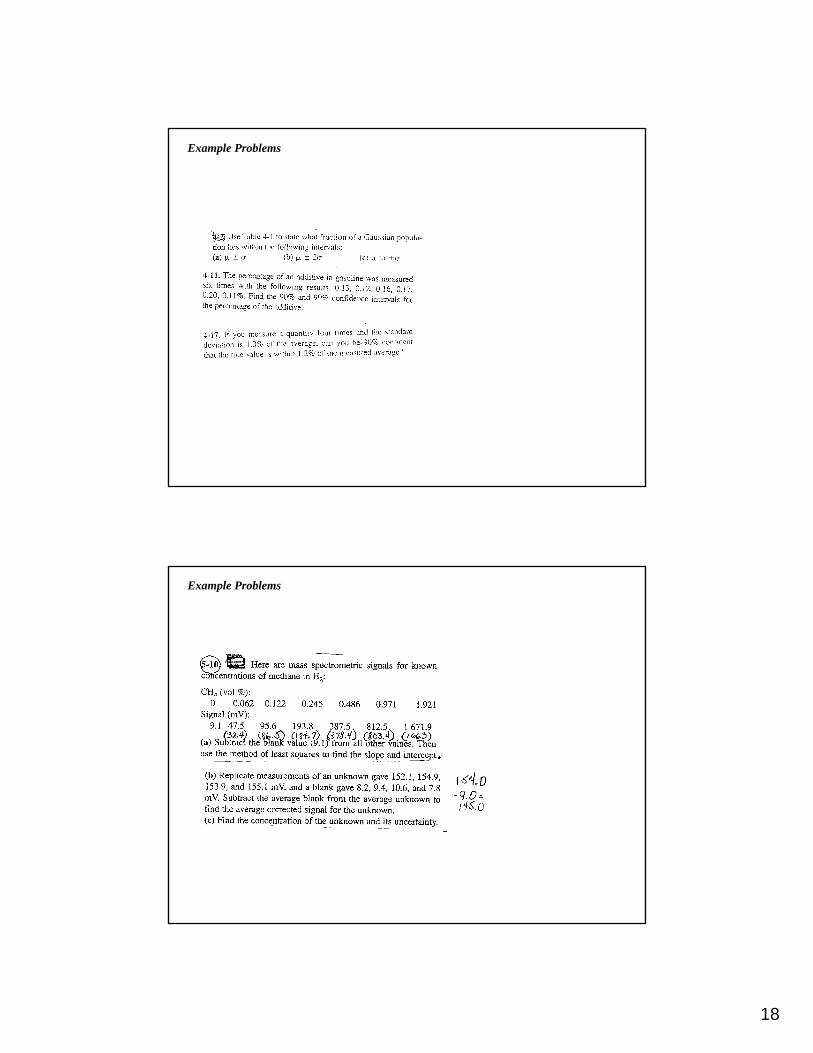
Example Problems
Example Problems

19
20
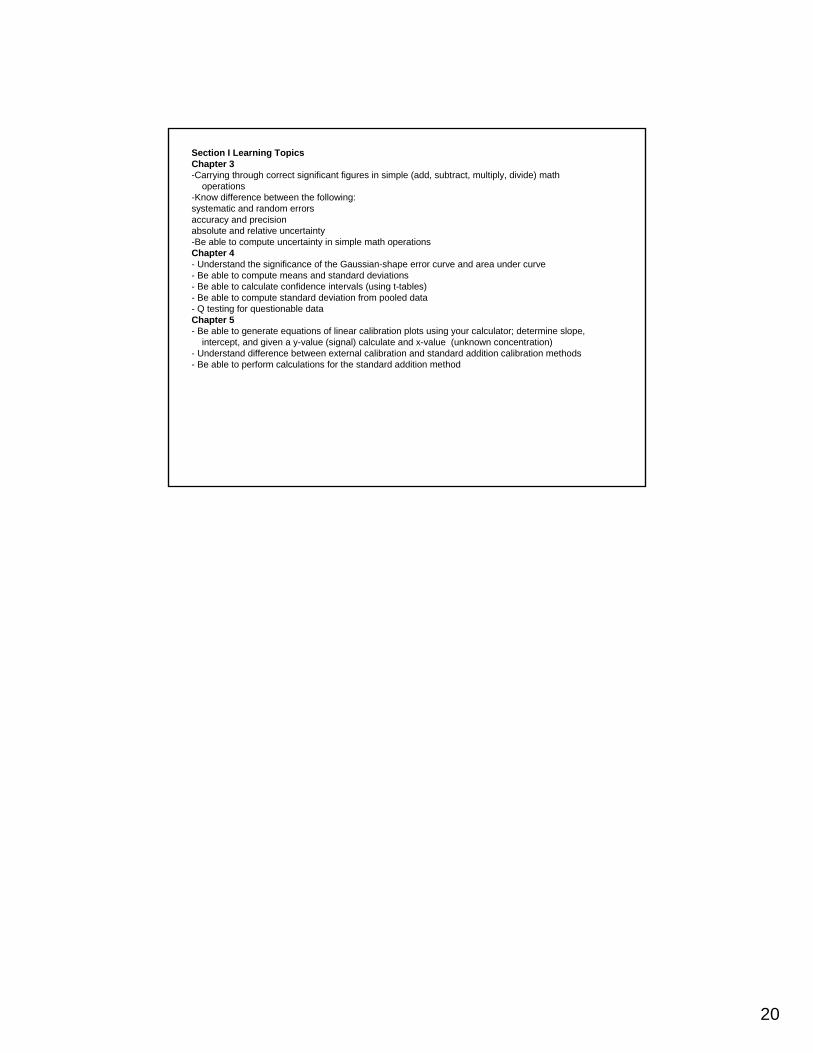
Section I Learning TopicsChapter 3-Carrying through correct significant figures in simple (add, subtract, multiply, divide) math
operations-Know difference between the following: systematic and random errorsaccuracy and precisionabsolute and relative uncertainty-Be able to compute uncertainty in simple math operationsChapter 4- Understand the significance of the Gaussian-shape error curve and area under curve- Be able to compute means and standard deviations- Be able to calculate confidence intervals (using t-tables)- Be able to compute standard deviation from pooled data- Q testing for questionable dataChapter 5- Be able to generate equations of linear calibration plots using your calculator; determine slope,
intercept, and given a y-value (signal) calculate and x-value (unknown concentration)- Understand difference between external calibration and standard addition calibration methods- Be able to perform calculations for the standard addition method