analysis of the industry’s funding needs for the
TRANSCRIPT

Analysis of the industry’s funding needs for the implementation of the SET Plan
D2.3 Analysis of the industry’s funding needs
WP 2 – Further define adequate financial strategies /T.2.2 Analysis of industry’s funding
needs for the realisation for the SET Plan Implementation Plans.
Authors: José Trindade, Juan Sanciñena, Luca Pira, Marie Latour (ZABALA)
September 2020
www.smartspend.eu
More and better designed national public support for energy
technology Research and Innovation
Ref. Ares(2020)4666735 - 08/09/2020

2
More and better designed national public support for energy technology Research and Innovation
Technical references
Project Acronym SMARTSPEND
Project Title More and better designed national public support for energy technology Research and Innovation
GA No 826044
Project Coordinator
Administrative Coordinator Name:
WIP, [email protected]
Scientific Coordinator Name:
EUREC, [email protected]
Project Duration 1st December 2018 – 30th November 2021 (36months)
Deliverable No. D2.3. Analysis of the industry’s funding needs
Dissemination level* PU
Work Package WP2 - Further define adequate financial strategies
Task T2.2 – Analysis of industry’s funding needs for the realisation for the SET Plan Implementation Plans
Lead beneficiary ZABALA SPAIN
Contributing beneficiary/ies ZABALA BRUSSELS
Due date of deliverable 30th November 2019
Actual submission date 08 September 2020
PU = Public
PP = Restricted to other programme participants (including the Commission Services)
RE = Restricted to a group specified by the consortium (including the Commission Services)
CO = Confidential, only for members of the consortium (including the Commission Services)
Date Beneficiary Author
08/09/2020 ZABALA Authors: José Trindade, Juan Sanciñena, Luca Pira, Marie Latour. (ZABALA)
3
More and better designed national public support for energy technology Research and Innovation
Disclaimer of warranties This project has received funding from the European Union’s Horizon 2020 research and innovation
programme under grant agreement No 826044. The sole responsibility for the content of this report
lies with the authors. It does not necessarily reflect the opinion of the European Union. Neither INEA
nor the European Commission are responsible for any use that may be made of the information
contained therein.
While this publication has been prepared with care, the authors and their employers provide no
warranty with regards to the content and shall not be liable for any direct, incidental or consequential
damages that may result from the use of the information or the data contained therein. Reproduction
is authorised providing the material is unabridged and the source is acknowledged.
Partners
.

4
More and better designed national public support for energy technology Research and Innovation
Index TECHNICAL REFERENCES ................................................................................................................ 2
DISCLAIMER OF WARRANTIES ........................................................................................................ 3
PARTNERS ..................................................................................................................................... 3
INDEX OF FIGURES ......................................................................................................................... 5
INDEX OF TABLES .......................................................................................................................... 8
LIST OF ABBREVIATIONS AND ACRONYMS ...................................................................................... 9
1. EXECUTIVE & PUBLISHABLE SUMMARY ................................................................................. 10
2. REPORT OBJECTIVES ............................................................................................................. 12
3. OVERVIEW OF METHODOLOGIES .......................................................................................... 13
How the questionnaire was developed ...................................................................................................................... 13 How it was disseminated ........................................................................................................................................... 14 Structure of the questionnaire ................................................................................................................................... 15 How the interviews were conducted.......................................................................................................................... 16
4. CHARACTERISING THE RESPONDENTS ................................................................................... 17
5. ANALYSIS OF THE INDUSTRY EXPERIENCE ON FUNDING MECHANISMS AND ENTITIES ............ 20
INDUSTRY VIEW ON FUNDING MECHANISMS ............................................................................... 20
H2020 (programme) .................................................................................................................................................. 20 NER 300 (programme) ............................................................................................................................................... 24 InnovFin (programme) ............................................................................................................................................... 26 LIFE (Programme) ...................................................................................................................................................... 27 Connecting Europe Facility – CEF (Programme)......................................................................................................... 30 ERANETs (Initiative) ................................................................................................................................................... 32 EUREKA (Initiative) .................................................................................................................................................... 35 Joint Programming Initiative JPI (Initiative) ............................................................................................................... 38 EFSI ............................................................................................................................................................................ 40 National funding mechanisms ................................................................................................................................... 43 Regional funding mechanisms ................................................................................................................................... 45 Other Funding Mechanisms ....................................................................................................................................... 48
INDUSTRY VIEW ON FUNDING ENTITIES ....................................................................................... 48
EIT-KICs (Entity) ......................................................................................................................................................... 48 InnoEnergy (Entity) .................................................................................................................................................... 51 EASME (Entity) ........................................................................................................................................................... 53 EIB (Entity) ................................................................................................................................................................. 56 International Energy Agency (IEA) (Entity) ................................................................................................................ 59
6. POTENTIAL MEASURES AND IMPROVEMENTS ....................................................................... 63
7. CONCLUSIONS ON THE INDUSTRY’S FUNDING NEEDS ............................................................ 71
8. ANNEXES ............................................................................................................................. 73
Annex I – Questionnaire ............................................................................................................................................ 73 Annex II – Interview Guidelines .................................................................................................................................. 82 Annex III – Interviewer and interviewed companies .................................................................................................. 86

5
More and better designed national public support for energy technology Research and Innovation
Index of Figures
Figure 1 - Number of participants per country (total numbers) ............................................................ 17
Figure 2 - Share of participants per country .......................................................................................... 17
Figure 3 - Share of participants per type of entity ................................................................................. 18
Figure 4 - Share of Participants' Companies Per number of employees ................................................ 18
Figure 5 - Share of participants per sector ............................................................................................. 19
Figure 6 - H2020 severity level of barriers ............................................................................................. 21
Figure 7 - Share of participants who have applied for H2020 and have faced these barriers - Part 1 .. 21
Figure 8 - Share of participants who have faced these barriers in H2020 - Part 2 ................................ 22
Figure 9 - Share of participants who have faced these barriers in H2020 - Part 3 ................................ 23
Figure 10 – NER 300 severity level of barriers ....................................................................................... 24
Figure 11 - Share of participants who have applied for NER300 and have faced these barriers - Part 1
................................................................................................................................................................ 25
Figure 12 - Share of participants who have faced these barriers in NER300 - Part 2 ............................ 25
Figure 13 - Share of participants who have faced these barriers in NER300 - Part 3 ............................ 26
Figure 14 - InnovFin Severity Level of Barriers ....................................................................................... 27
Figure 15 - LIFE Severity Level of Barriers .............................................................................................. 28
Figure 16 - Share of participants who have applied for LIFE and have faced these barriers - Part 1 .... 28
Figure 17 - Share of participants who have faced these barriers in LIFE - Part 2 .................................. 29
Figure 18 - Share of participants who have faced these barriers in LIFE - Part 3 .................................. 29
Figure 19 - CEF Severity Level of Barriers ............................................................................................... 30
Figure 20 - Share of participants who have applied for CEF and have faced these barriers - Part 1 ..... 31
Figure 21 - Share of participants who have faced these barriers in CEF - Part 2 ................................... 31
Figure 22 - Share of participants who have faced these barriers in CEF - Part 3 ................................... 32
Figure 23 - ERANETs Severity Level of Barriers ...................................................................................... 33
Figure 24 - Share of participants who have applied for ERANETs and have faced these barriers - Part 1
................................................................................................................................................................ 33
Figure 25 - Share of participants who have faced these barriers in ERANETs - Part 2........................... 34
Figure 26 - Share of participants who have faced these barriers in ERANETs - Part 3........................... 34
Figure 27 - EUREKA Severity Level of Barriers ........................................................................................ 36
Figure 28 - Share of participants who have applied for EUREKA and have faced these barriers - Part 1
................................................................................................................................................................ 36
Figure 29 - Share of participants who have faced these barriers in EUREKA - Part 2 ............................ 37
Figure 30 - Share of participants who have faced these barriers in EUREKA - Part 3 ............................ 37
Figure 31 - JPI Severity Level of Barriers ................................................................................................ 38
Figure 32 - Share of participants who have applied for JPI and have faced these barriers - Part 1 ...... 39
Figure 33 - Share of participants who have faced these barriers in JPI - Part 2 ..................................... 39

6
More and better designed national public support for energy technology Research and Innovation
Figure 34 - Share of participants who have faced these barriers in JPI - Part 3 ..................................... 40
Figure 35 - EFSI Severity Level of Barriers .............................................................................................. 41
Figure 36 - Share of participants who have applied for EFSI and have faced these barriers - Part 1 .... 41
Figure 37 - Share of participants who have faced these barriers in EFSI - Part 2 .................................. 42
Figure 38 - Share of participants who have faced these barriers in EFSI - Part 3 .................................. 42
Figure 39 - National Funding Mechanisms' severity level of barriers .................................................... 43
Figure 40 - Share of participants who have applied for National funding mechanisms and have faced
these barriers - Part 1 ............................................................................................................................. 44
Figure 41 - Share of participants who have faced these barriers in National funding mechanisms - Part
2 .............................................................................................................................................................. 44
Figure 42 - Share of participants who have faced these barriers in National funding mechanisms - Part
3 .............................................................................................................................................................. 45
Figure 43 - Regional Funding Mechanisms' severity level of barriers .................................................... 46
Figure 44 - Share of participants who have applied for Regional funding mechanisms and have faced
these barriers - Part 1 ............................................................................................................................. 46
Figure 45 - Share of participants who have faced these barriers in Regional funding mechanisms - Part
2 .............................................................................................................................................................. 47
Figure 46 - Share of participants who have faced these barriers in Regional funding mechanisms - Part
3 .............................................................................................................................................................. 47
Figure 47 - EIT-KICs Severity Level of Barriers ........................................................................................ 49
Figure 48 - Share of participants who have applied for EIT-KICs and have faced these barriers - Part 1
................................................................................................................................................................ 50
Figure 49 - Share of participants who have faced these barriers in EIT-KICs - Part 2 ............................ 50
Figure 50 - InnoEnergy Severity Level of Barriers .................................................................................. 51
Figure 51 - Share of participants who have applied for InnoEnergy and have faced these barriers -
Part 1 ...................................................................................................................................................... 52
Figure 52 - Share of participants who have faced these barriers in InnoEnergy - Part 2 ....................... 52
Figure 53 - Share of participants who have faced these barriers in InnoEnergy - Part 3 ....................... 53
Figure 54 - EASME Severity Level of Barriers ......................................................................................... 54
Figure 55 - Share of participants who have applied for EASME and have faced these barriers - Part 1
................................................................................................................................................................ 54
Figure 56 - Share of participants who have faced these barriers in EASME - Part 2.............................. 55
Figure 57 - Share of participants who have faced these barriers in EASME - Part 3.............................. 55
Figure 58 - EIB Severity Level of Barriers ................................................................................................ 57
Figure 59 - Share of participants who have applied for EIB and have faced these barriers - Part 1 ...... 57
Figure 60 - Share of participants who have faced these barriers in EIB - Part 2 .................................... 58
Figure 61 - Share of participants who have faced these barriers in EIB - Part 3 .................................... 58

7
More and better designed national public support for energy technology Research and Innovation
Figure 62 - IEA Severity Level of Barriers ............................................................................................... 59
Figure 63 - Share of participants who have applied for IEA and have faced these barriers - Part 1 ..... 60
Figure 64 - Share of participants who have faced these barriers in IEA - Part 2 .................................... 60
Figure 65 - Share of participants who have faced these barriers in IEA - Part 3 .................................... 61
Figure 66 - Potential Measures and Improvements - Part 1 .................................................................. 64
Figure 67 - Potential Measurements and Improvements - Part 2 ......................................................... 65
Figure 68 - Potential Measures and Improvements - Part 3 .................................................................. 66
Figure 69 - Potential Measures and Improvements - Part 4 .................................................................. 67
8
More and better designed national public support for energy technology Research and Innovation
Index of Tables Table 1 - Participants' experience with H2020 topic calls ...................................................................... 20
Table 2 – Participants’ experience with NER 300 ................................................................................... 24
Table 3 - Participants’ experience with InnovFin ................................................................................... 26
Table 4 - Participants' experience with CEF ........................................................................................... 27
Table 5 - Participants’ experience with CEF ........................................................................................... 30
Table 6 - Participants’ experience with ERANETs ................................................................................... 32
Table 7 - Participants’ experience with EUREKA .................................................................................... 35
Table 8 - Participants’ experience with JPI ............................................................................................. 38
Table 9 - Participants' experience with EFSI ........................................................................................... 40
Table 10 - Participants’ experience with National Funding Mechanisms .............................................. 43
Table 11 - Participants' experience with Regional Funding Mechanisms .............................................. 45
Table 12 - Participants’ experience with EIT-KICs .................................................................................. 49
Table 13 - Participants’ experience with InnoEnergy ............................................................................. 51
Table 14 - Participants’ experience with EASME .................................................................................... 53
Table 15 - Participants' experience with EIB .......................................................................................... 56
Table 16 - Participants’ experience with IEA .......................................................................................... 59

9
More and better designed national public support for energy technology Research and Innovation
List of abbreviations and acronyms CEF: Connecting Europe Facility
cPPP: Contractual Public-Private Partnership
CSA: Coordination and Support Action
DG: Directorate-General
EFSI: European Fund for Strategic Investments
EIB: European Investment Bank
EIF: European Investment Fund
EIP: European Innovation Partnership
EIS: European Innovation Scoreboard
EIT: European Institute of Innovation and Technology
EJP: European Joint Programme
ERDF: European Regional Development Fund
ERIC: European Research Infrastructure Consortium
ETP: European Technology Platform
FOAK: First-of-a-kind
H2020: Horizon 2020
JPI: Joint Programming Initiative
KIC: Knowledge Innovation Community
MS: Member State
NCP: National Contact Point
P2P: Public to Public Partnerships
R&D: Research and Development
R&D&I: Research, Development and Innovation
R&I: Research and Innovation
RES: Renewable Energy Sources
SME: Small and medium-sized enterprises

10
More and better designed national public support for energy technology Research and Innovation
1. Executive & publishable summary
The SMARTSPEND project aims for more and better designed public support for energy
technology Research & innovation supporting the execution of the Strategic Energy
Technology Plan (SET Plan) of the European Commission. SMARTSPEND main objectives are
to foster efficiency in allocation of public and private funding, and to better inform
stakeholders and engagement with policy makers.
To develop this report, a series of consultations were undertaken including a questionnaire
with 105 participants and interviews to relevant stakeholders from different sectors (Energy
Systems, Photovoltaics, Energy Efficiency Solutions for Buildings, Energy Efficiency in Industry
and Smart Cities). The main areas of interest of the questionnaire were related to existing
funding mechanisms’ gaps for the implementation of the SET Plan, existing funding
mechanisms’ barriers (e.g. administrative, legal, fiscal), sector specific issues and needs of the
sector. The complete list of interviewed companies and who carried out the interview is
included in the Annex III of this report. Via the open questions in the questionnaire and the
phone interviews conducted with some of the participants, it was possible to identify other
funding mechanisms and other barriers than those mentioned in the questionnaire.
Importantly, a better understanding of the industries views and concerns was developed
beyond the statistical/quantitative analysis of each analysed funding mechanism.
The quantitative and qualitative analysis of the industry’s experience on funding mechanisms
and entities is presented in the report. The report takes into consideration the need for
financial contributions from public and private funding sources at different levels and analyses
the main constraints (bureaucratic, administrative, legal) which can compromise the regular
execution of R&I activities and implementation of the SET Plan.
A better understanding of the industries’ views and concerns was developed with reference
to potential measures and improvements in the fields of funding mechanisms, project
management, funding applications, budget and reporting, amongst others.
The main findings on the industry’s funding needs for the implementation of the SET Plan, as
collected from the quantitative and qualitative analysis of the feedbacks provided by the
participants, are presented in the conclusions of this report. The conclusions are related to
specific funding needs for the scale up of specific entities (like SMEs), for certain categories of
projects (like those that produced working prototypes or demonstrators) and for specific types
of technologies (like market-uptake and manufacturing in cutting edge technologies). In the
conclusions are also highlighted some specific needs for more funding for certain funding
schemes or the need to consider different types of indicators for receiving the funding. Other
conclusions are also related on how to make certain funding schemes more attractive.

11
More and better designed national public support for energy technology Research and Innovation
What are the results that might be disseminated?
Analysis of the Industry’s Funding Needs
Main stakeholders to be addressed by the results of the deliverable
Type
Public
Main events and activities related to the results of the deliverable (also organised by third parties)
Title Date Press release Target audience
1 ETIP SNET Workshop
March 2020
Stakeholders interested in available funding opportunities, funding needs of the industry, implementation of the technology pillar of the EU's energy and climate policy and industry, energy system integration.
Dissemination tools: what sort of materials can be created to contribute to disseminate the results? (consider budget / time)
☐ Photographs ☐ Video X Power point ☐ Papers ☐Poster Created by...
X News for project website
☐ Networking opportunities
☐ Training course
X Seminar X Social network
Potential Paper
Title Authors
Other dissemination suggestion or comments from the DLV authors

12
More and better designed national public support for energy technology Research and Innovation
2. Report objectives This report provides an outlook of the industry’s funding needs in order to support the
coordination of the industrial participation in the SET Plan, in particular from the industry-
driven associations and initiatives such as JA-2 calls, the European Technology and Innovation
platforms (ETIPs) and importantly the industrial actors identified in the 11 identified sectors
(Materials, Bioenergy, PV, Deep Geothermal, Energy Storage, Energy-efficient Buildings,
Energy-efficient industry, Renewable Heating and Cooling, Ocean, Smart Networks, Wind).
This information is intended to assist industry in considering their funding needs, also taking
into consideration the main findings of D 2.1. “Mapping of Funding Instruments”.
The approach in this guide is not to describe every specific sector’s funding needs, but rather
to focus on a broad picture of the industry funding needs as a whole.
This document is due in month 12 as deliverable D2.3.
This project has received funding from the European Union’s framework programme Horizon
2020 for Research and Innovation actions under Grant Agreement no 826044.

13
More and better designed national public support for energy technology Research and Innovation
3. Overview of methodologies
How the questionnaire was developed
This report contains a questionnaire T2.2. – “Analysis of industry’s funding needs for the
realisation for the SET Plan Implementation Plans” which was elaborated by ZABALA, based
on consultations within SMARTSPEND's network of partners, with the purpose of better
identifying the industry and/or research sector funding needs.
The SMARTSPEND partners are the following, the full list of their members (over one thousand
altogether) is available on each website:
1. EUREC (Scientific coordinator) www.eurec.be 2. OEE (Ocean Energy) www.oceanenergy-europe.eu 3. EMIRI (Advanced materials for clean energy & clean mobility) www.emiri.eu 4. CIRCE Foundation in representation of SPIRE (Process industry) www.spire2030.eu 5. ZABALA Brussels in representation of ETIP SNET (Smart energy networks) www.etip-
snet.eu 6. WIP in representation of ETIP PV (Photovoltaics) www.etip-pv.eu 7. ESTELA (Solar thermal electricity (concentrated solar power) www.estelasolar.org 8. EASE (Energy Storage) www.ease-storage.eu 9. EGEC (Geothermal) www.egec.org 10. ECTP (Energy-efficient buildings and construction) www.ectp.org/ 11. FNR In representation of ETIP Bioenergy (Bioenergy) www.etip-bioenergy.eu
The main areas of interest of the questionnaire were:
• Existing funding mechanisms’ gaps for the implementation of the SET Plan
o Lack of innovative financing mechanisms tailor-made per sector and per the level of maturity of markets and technologies;
o Lack of specific Clean Energy Funding (They are part of either global package or part of research and innovation topics.).
• Existing funding mechanisms’ barriers (e.g. administrative, legal, fiscal)
o Clarity of the application process (The evaluation process is not always clear and lacks information in most of the cases.);
o Lack of synergies between different funding programmes; o Great administrative disparity between different levels of public funding
(regional, national, European).
• Sector specific issues
• Needs of the Sector

14
More and better designed national public support for energy technology Research and Innovation
How it was disseminated
The questionnaire was circulated by ZABALA amongst the partners of the SMARTSPEND
project and their associates/members in order to collect their feedback in accordance to their
sector’s needs. SMARTSPEND’s partners disseminated the questionnaire through their
channels (e.g. emailing members of their associations, social media, etc.).
In addition to the questionnaire, each partner suggested 2-3 companies to be interviewed.
The companies were selected on the basis of their representation of the sector and on the
basis of previous relevant experience in applying for funding. Following this selection, they
were contacted and those that were available were interviewed.
Interviews started from mid-September 2019. Guidelines for these interviews were provided.
The results of the consultation that are included in this report will be shared with key
stakeholders and high-level policy makers in order to design together better funding
instruments.

15
More and better designed national public support for energy technology Research and Innovation
Structure of the questionnaire
The questionnaire used in the survey comprised 16 questions divided in 6 sections, in addition
to a one-page document on the SET Plan priorities as well as a concluding page allowing
respondents to add comments. The questionnaire’s different sections
1. Profile
Name of the association, name of the company, nature of the organisation, sector and size of
organization, country.
2. Existing Funding Mechanisms
Enquiring about the participants’ knowledge and experience with the addressed funding
mechanisms.
3. Existing Barriers
This section included multiple choice and open questions to identify barriers the participants
may have faced.
4. Potential Measures and Improvements
This section included multiple choice and open questions to identify potential measures and
improvements the participants may find relevant.
5. Conclusion and comments
Respondents were invited to provide any additional comments. On completing the
questionnaire, respondents are thanked and redirected to the SMARTSPEND website in order
to learn more about the project.

16
More and better designed national public support for energy technology Research and Innovation
How the interviews were conducted
9 interviews with stakeholders from the different sectors were covered by the SMARTSPEND
project between 15th September and 15th October. These interviews lasted between 30 and
40 minutes and followed the same topics addressed in the questionnaire, looking to deepen
them and get a more detailed and direct input regarding the stakeholders’ sectors. A copy
of the questionnaire was used by the interviewer as a support document during the interviews
and some of them were also recorded in order to improve the quality and accuracy of the
collected data during the interview.
The interview was structured in the following 5 different sections:
Section 1 – General Data This section included general data related to the identification of the
participant and the partner conducting the interview and the type of activities undertaken by
the participant in order to have a clear view of the analysed sector.
Section 2 – Funding instruments This section was aimed at getting a better insight of the
relevant funding instruments for the analysed sector and the experience of the participant in
the identification and implementation of these funding mechanisms.
Section 3 – Barriers This section was aimed at deepening the knowledge of the experience of
the participants on the main obstacles/barriers encountered in these financing schemes.
Section 4 – Potential Improvements This section was aimed at deepening the knowledge of
the experience of the participants in the application and implementation process of the
identified funding mechanisms, lessons learnt and potential measures to be taken to
overcome these obstacles.
Section 5 – Further Comments This section served as an open question for any remarks the
participant might want to include, and which fall outside the previous questions.

17
More and better designed national public support for energy technology Research and Innovation
4. Characterising the respondents A total of 105 participants replied to the SMARTSPEND questionnaire on the industry’s funding
needs. The respondents’ locations are shown in Figure 1 and Figure 2 and reflect a good
geographical distribution of respondents across Europe with 20 countries represented.
However, they do not include representatives from all H2020 associated countries nor all EU
member states.
The highest number of responses (13) was received from Italy, followed by France with 11 and
Belgium and Spain both with 10.
Figure 1 - Number of participants per country (total numbers)
Figure 2 - Share of participants per country
4
10
12
5
2
11
89
1
13
6
3
6
1
5
10
23 3
0
2
4
6
8
10
12
14
NUMBER OF PARTICIPANTS PER COUNTRY

18
More and better designed national public support for energy technology Research and Innovation
Regarding the type of entity, the participants came from, the majority, 55%, came from
Business Companies, while the second most represented type was Research Centres with 28%.
11% came from Other types of entities such as Public Bodies and Education Institutions. The
distribution can be seen in Figure 3.
Figure 3 - Share of participants per type of entity
Looking into the size of the participants’ entities (Figure 4), it can be seen that 52% are SMEs
having up to 250 employees. It is interesting to observe as well that 28% of the participants
came from very large companies, with over 1000 employees.
Figure 4 - Share of Participants' Companies Per number of employees
55%
28%
4%
2%
11%
SHARE OF PARTICIPANTS PER TYPE OF ENTITY
Business Company Research CentreAssociation Non-profit organisationOthers
17%
19%
16%20%
28%
SHARE OF PARTICIPANTS' COMPANIES PER NUMBER OF EMPLOYEES
1 to 10 11 to 50 51 to 250 251 to 1000 Over 1000

19
More and better designed national public support for energy technology Research and Innovation
As for the sectors the participants are active in, the majority (55%) are active in Energy
Systems, followed by Photovoltaics, Energy Efficiency Solutions for Buildings, Energy Efficiency
in Industry and Smart Cities, all around 30%. This can be explained with the fact that
participants could select more than one sector in which they were active and the broad scope
of the Energy Systems sector. See Figure 5.
Figure 5 - Share of participants per sector
55%
32% 32% 31% 30% 28%
21%17%
14%10%
5% 5%
0%
10%
20%
30%
40%
50%
60%SHARE OF PARTICIPANTS PER SECTOR

20
More and better designed national public support for energy technology Research and Innovation
5. Analysis of the industry experience on
funding mechanisms and entities This chapter focuses on the analysis of the industry experience on funding mechanisms and
entities and is based on the quantitative analysis of each funding mechanism through the
feedbacks received in the quantitative section of the questionnaire, on the analysis of the
qualitative section (open questions) of the questionnaire and of the phone interviews. Via the
open questions in the questionnaire and the phone interviews conducted with some of the
participants, it was possible to identify other funding mechanisms and other barriers than
those mentioned in the questionnaire. Importantly, a better understanding of the industries
views and concerns was developed beyond the statistical/quantitative analysis of each
analysed funding mechanism. In order to ensure the validity of the conclusions in this report
only the data coming from the participants who already had applied to the funding
mechanisms considered was taken into consideration. Although more data could have been
analysed for those who have no experience it could have jeopardized the accuracy of the
outputs. As such some funding mechanisms outputs come from smaller pools of participants
but their indications remain relevant.
Industry view on Funding mechanisms
H2020 (programme)
H2020 definition: Horizon 2020 is the eighth framework programme funding research, technological development, and innovation. The framework programme's objective is to complete the European Research Area (ERA) by coordinating national research policies and pooling research funding in some areas to avoid duplication. The programme runs from 2014–20 and provides an estimated €80 billion of funding, an increase of 23 per cent on the previous phase. Horizon 2020 provides grants to research and innovation projects through open and competitive calls for proposals.
Focusing on H2020 Topic Calls, 103 of the 105 participants had knowledge of them, and of
these 94 had applied for funding. A strong majority of 78 participants had already received
funding from this mechanism (See Table 1).
Table 1 - Participants' experience with H2020 topic calls
Experience with H2020 Topic Calls

21
More and better designed national public support for energy technology Research and Innovation
No Experience Have knowledge Have applied Have received funding
2 103 94 78
When asked about the severity of the barriers they had encountered in H2020 topic calls, only
9% claimed to have faced major barriers, while 27% stated they had not faced any (See Figure
6).
Figure 6 - H2020 severity level of barriers
As for the specific barriers the participants have encountered when applying, the results can
be seen in Figures 7, 8 and 9.
Figure 7 - Share of participants who have applied for H2020 and have faced these barriers - Part 1
27%
34%
30%
9%
H2020 SEVERITY LEVEL OF BARRIERS
No Barriers Minor Barriers Medium Barriers Major Barriers
14%
47%
23%
22%
14%
0% 5% 10% 15% 20% 25% 30% 35% 40% 45% 50%
The funding is too focused on practical results andnot research
The application process is complicated andexhaustive
Process from idea to implementation is too long
Lack of investment funding when there are highup-front costs
Lack of interconnection between the differentprogrammes
SHARE OF PARTICIPANTS WHO HAVE APPLIED FOR H2020 AND FACED THESE BARRIERS - PART 1

22
More and better designed national public support for energy technology Research and Innovation
From the barriers in Figure 7, it is possible to see that 47% of the participants believe that the
application process is complicated and exhaustive. In addition, the lack of investment
funding when there are high up-front costs (22%) and the process from idea to
implementation being too long (23%) can be seen as commonly felt barriers.
Figure 8 - Share of participants who have faced these barriers in H2020 - Part 2
From the barriers in Figure 8, it is possible to see that the main barrier highlighted for H2020
grants are administrative and bureaucratic barriers for new business models (30% of the
participants had this opinion). It is worth mentioning that 20% of respondents believe that
H2020 Grants are not suited for industry-led projects.
Beyond these, it can also be concluded that other barriers mentioned in the questionnaire
where results are below 7%, such as the level of confidentiality of information requested in
the application, do not constitute a major barrier.
6%
20%
5%
7%
30%
0% 5% 10% 15% 20% 25% 30% 35%
Retroactive changes in the financing schemes
Grants not suited for industry-led projects
Great variation of application procedures
Information requested is private/confidential
Administrative and bureaucratic barriers for newbusiness models
SHARE OF PARTICIPANTS WHO HAVE APPLIED FOR H2020 AND FACED THESE BARRIERS - PART 2

23
More and better designed national public support for energy technology Research and Innovation
Figure 9 - Share of participants who have faced these barriers in H2020 - Part 3
From the barriers in Figure 9, it is possible to see that with 67% of the participants having
faced them, low success rates often do not justify the investment in the application to H2020
calls. Moreover, 35% of participants feel that reporting is too complicated and time
consuming.
In H2020 calls, the participants’ general view is that the applications and project management
processes do not take into account the uncertain nature of research and development: a set
work plan is supposed to be fixed at the time of application and updating it can be seen as
extremely cumbersome.
They also reflect difficulty in implementing all the expected impacts of a call, which also
makes it difficult to find a suitable consortium. In addition to this, it is complicated to add
other important industrial partners during on-going H2020 projects, this could maximize a
project’s impact.
Participating representatives of SME have highlighted the time and effort to develop a good
proposal, which is demanding on their human and financial resources, often preventing
them from applying. However, these issues do not end with the success of a proposal. The
administrative, bureaucratic, financial procedures are very resource and time consuming for
companies throughout the projects themselves. These factors lead to a certain reluctance of
companies to participate in the calls.
18%
61%
11%
21%
35%
1%
0% 10% 20% 30% 40% 50% 60% 70%
Unpredictability of R&I programmes
Low success rates do not justify the investment inthe application
Geographic imbalance
Lack of transparency in the evaluation
Reporting is too complicated and time consuming
Funding only given after the project results areobtained
SHARE OF PARTICIPANTS WHO HAVE APPLIED FOR H2020 AND FACED THESE BARRIERS - PART 3

24
More and better designed national public support for energy technology Research and Innovation
NER 300 (programme)
NER 300 Definition: NER 300 is a funding programme pooling together about EUR 2 billion for innovative low-carbon technology, focusing on the demonstration of environmentally safe Carbon Capture and Storage (CCS) and innovative renewable energy technologies on a commercial scale within the EU.
Focusing on NER 300, 30 of the 105 participants had knowledge of them, and of these 11 had
applied for funding. Only 6 participants had already received funding from this mechanism
(See Table 2).
Table 2 – Participants’ experience with NER 300
Experience with NER 300
No Experience Have knowledge Have applied Have received funding
75 30 11 6
When asked about the severity of the barriers they had encountered in NER 300, 44% claimed
to have faced major barriers, while only 17% stated they had not faced any (See Figure 10).
Figure 10 – NER 300 severity level of barriers
As for the specific barriers the participants have encountered when applying, the results can
be seen in Figures 11, 12 and 13.
17%
22%
17%
44%
NER 300 SEVERITY LEVEL OF BARRIERS
No Barriers Minor Barriers Medium Barriers Major Barriers

25
More and better designed national public support for energy technology Research and Innovation
Figure 11 - Share of participants who have applied for NER300 and have faced these barriers - Part 1
From the barriers in Figure 11, it is possible to see that the great majority of the participants
believe that the application process is complicated and exhaustive.
In addition, a large majority feel that there is a lack of investment funding when there are
high up-front costs, as well as a lack of interconnection between the different programmes.
Figure 12 - Share of participants who have faced these barriers in NER300 - Part 2
From the barriers in Figure 12, it is possible to see that 73% of the participants believe that
administrative and bureaucratic barriers for new business models are a common barrier. A
significant number has also felt that the information requested is private/confidential.
0%
82%
45%
73%
73%
0% 10% 20% 30% 40% 50% 60% 70% 80% 90%
The funding is too focused on practical results andnot research
The application process is complicated andexhaustive
Process from idea to implementation is too long
Lack of investment funding when there are highup-front costs
Lack of interconnection between the differentprogrammes
SHARE OF PARTICIPANTS WHO HAVE APPLIED FOR NER300 AND HAVE FACED THESE BARRIERS - PART 1
0%
27%
18%
36%
73%
0% 10% 20% 30% 40% 50% 60% 70% 80%
Retroactive changes in the financing schemes
Grants not suited for industry-led projects
Great variation of application procedures
Information requested is private/confidential
Administrative and bureaucratic barriers for newbusiness models
SHARE OF PARTICIPANTS WHO HAVE FACED THESE BARRIERS IN NER300 - PART 2

26
More and better designed national public support for energy technology Research and Innovation
Figure 13 - Share of participants who have faced these barriers in NER300 - Part 3
From Figure 13 it can be concluded that more than half of the participants believe that low
success rates do not justify the investment in the application. Moreover, with 36%, “Funding
only given after the project results are obtained” is also an important barrier.
InnovFin (programme)
InnovFin definition: "InnovFin – EU Finance for Innovators" is a joint initiative launched by the European Investment Bank Group (EIB and EIF) in cooperation with the European Commission under Horizon 2020. InnovFin aims to facilitate and accelerate access to finance for innovative businesses and other innovative entities in Europe.
Focusing on InnovFin, 26 of the 105 participants had knowledge of them, but none of the
participants have applied for funding. (See Table 3).
Table 3 - Participants’ experience with InnovFin
Experience with InnovFin
No Experience Have knowledge Have applied Have received funding
79 26 0 0
When asked about the severity of the barriers they had encountered in InnovFin, 25% claimed
to have faced major barriers, while only 37% stated they had not faced any (See Figure 14).
9%
55%
9%
18%
27%
36%
0% 10% 20% 30% 40% 50% 60%
Unpredictability of R&I programmes
Low success rates do not justify the investment inthe application
Geographic imbalance
Lack of transparency in the evaluation
Reporting is too complicated and time consuming
Funding only given after the project results areobtained
SHARE OF PARTICIPANTS WHO HAVE FACED THESE BARRIERS IN NER300 - PART 3

27
More and better designed national public support for energy technology Research and Innovation
This high value can be justified by the fact few participants had knowledge of InnovFin, not
recognising in it any barrier.
Figure 14 - InnovFin Severity Level of Barriers
It is not possible to analyse the specific barriers the participants have encountered when
applying as none of the participants have applied for InnovFin funding.
LIFE (Programme)
LIFE description: The LIFE programme is the EU’s funding instrument for the environment and climate action created in 1992. The current funding period 2014-2020 has a budget of €3.4 billion.3.4 billion.
44 of the 105 participants had no experience of LIFE. 61 of the participants had knowledge of
LIFE and of these 25 had applied for funding and 20 of them had received it (See Table 4).
Table 4 - Participants' experience with CEF
Experience with LIFE
No Experience Have knowledge Have applied Have received funding
44 61 25 20
When asked about the severity of the barriers they had encountered in LIFE, 7% claimed to
have faced major barriers, 37% medium barriers, 34% minor barriers, while 22% stated they
had not faced any (See Figure 15).
37%
13%25%
25%
INNOVFIN SEVERITY LEVEL OF BARRIERS
No Barriers Minor Barriers Medium Barriers Major Barriers

28
More and better designed national public support for energy technology Research and Innovation
Figure 15 - LIFE Severity Level of Barriers
As for the specific barriers the participants have encountered when applying, the results can
be seen in Figures 16, 17 and 18.
Figure 16 - Share of participants who have applied for LIFE and have faced these barriers - Part 1
From Figure 16, almost one third of the participants believe there is a lack of investment
funding when there are high up-front costs in LIFE projects. A significant number was also of
the opinion that LIFE application processes are complicated and exhaustive.
22%
34%
37%
7%
LIFE SEVERITY LEVEL OF BARRIERS
No Barriers Minor Barriers Medium Barriers Major Barriers
4%
20%
12%
4%
32%
0% 5% 10% 15% 20% 25% 30% 35%
The funding is too focused on practical results andnot research
The application process is complicated andexhaustive
Process from idea to implementation is too long
Lack of investment funding when there are highup-front costs
Lack of interconnection between the differentprogrammes
SHARE OF PARTICIPANTS WHO HAVE APPLIED FOR LIFE AND HAVE FACED THESE BARRIERS - PART 1

29
More and better designed national public support for energy technology Research and Innovation
Figure 17 - Share of participants who have faced these barriers in LIFE - Part 2
Not many participants felt the barriers from Figure 17 in LIFE calls. It is noteworthy that very
few felt the information requested is private or confidential for them or that the application
procedures vary significantly.
Figure 18 - Share of participants who have faced these barriers in LIFE - Part 3
On the other hand, from Figure 18, it is possible to see that almost half of the participants
have felt that the reporting in LIFE is too complicated and time consuming, and that often
the low success rates do not justify the investment in the application.
4%
16%
4%
4%
12%
0% 2% 4% 6% 8% 10% 12% 14% 16% 18%
Retroactive changes in the financing schemes
Grants not suited for industry-led projects
Great variation of application procedures
Information requested is private/confidential
Administrative and bureaucratic barriers for newbusiness models
SHARE OF PARTICIPANTS WHO HAVE FACED THESE BARRIERS IN LIFE - PART 2
8%
40%
8%
12%
48%
0%
0% 10% 20% 30% 40% 50% 60%
Unpredictability of R&I programmes
Low success rates do not justify the investment inthe application
Geographic imbalance
Lack of transparency in the evaluation
Reporting is too complicated and time consuming
Funding only given after the project results areobtained
SHARE OF PARTICIPANTS WHO HAVE FACED THESE BARRIERS IN LIFE - PART 3

30
More and better designed national public support for energy technology Research and Innovation
Connecting Europe Facility – CEF (Programme)
CEF Description: The Connecting Europe Facility (CEF) is a key EU funding instrument to promote growth, jobs and competitiveness through targeted infrastructure investment at European level. It supports the development of high performing, sustainable and efficiently interconnected trans-European networks in the fields of transport, energy and digital services. CEF investments fill the missing links in Europe's energy, transport and digital backbone.
76 of the 105 participants had no experience of CEF, 29 had knowledge of CEF, of these 10
had applied for funding and 7 of them had received it (See Table 5).
Table 5 - Participants’ experience with CEF
Experience with CEF
No Experience Have knowledge Have applied Have received funding
76 29 10 7
When asked about the severity of the barriers they had encountered in CEF, 6% claimed to
have faced major barriers, 33% medium barriers, 17% minor barriers, while 56% stated they
had not faced any (See Figure 19).
Figure 19 - CEF Severity Level of Barriers
As for the specific barriers the participants have encountered when applying, the results can
be seen in Figures 20, 21, 22.
44%
17%
33%
6%
CEF SEVERITY LEVEL OF BARRIERS
No Barriers Minor Barriers Medium Barriers Major Barriers

31
More and better designed national public support for energy technology Research and Innovation
Figure 20 - Share of participants who have applied for CEF and have faced these barriers - Part 1
As seen in Figure 20, almost half the participants believe that the application process in CEF
is complicated and time-consuming, with the same number believing that there is a lack of
investment funding when there are high up-front costs in projects. A smaller but relevant
number also missed interconnection between the different programmes, as well as moving
from the original idea to its implementation being too long.
Figure 21 - Share of participants who have faced these barriers in CEF - Part 2
From Figure 21, it is possible to see that a strong share of the participants believe that the
grants are not suited for industry-led projects in CEF, while a slightly smaller number also
identified administrative and bureaucratic barriers for new business models.
10%
40%
30%
40%
30%
0% 5% 10% 15% 20% 25% 30% 35% 40% 45%
The funding is too focused on practical results andnot research
The application process is complicated andexhaustive
Process from idea to implementation is too long
Lack of investment funding when there are highup-front costs
Lack of interconnection between the differentprogrammes
SHARE OF PARTICIPANTS WHO HAVE APPLIED FOR CEF AND HAVE FACED THESE BARRIERS - PART 1
10%
40%
10%
10%
30%
0% 5% 10% 15% 20% 25% 30% 35% 40% 45%
Retroactive changes in the financing schemes
Grants not suited for industry-led projects
Great variation of application procedures
Information requested is private/confidential
Administrative and bureaucratic barriers for newbusiness models
SHARE OF PARTICIPANTS WHO HAVE FACED THESE BARRIERS IN CEF - PART 2

32
More and better designed national public support for energy technology Research and Innovation
Figure 22 - Share of participants who have faced these barriers in CEF - Part 3
From the barriers in Figure 22, it is possible to see that the reporting being too complicated
and time consuming was an opinion shared by almost half of the participants. A non-negligible
number was also concerned about the lack of transparency in the evaluation process and
have felt that the low success rates do not justify the investment in the application for CEF
funding.
ERANETs (Initiative)
ERANETs definition: ERA-NET Cofund under Horizon 2020 is designed to support Public-Public Partnerships, including Joint Programming Initiatives between Member States, in their preparation, establishment of networking structures, design, implementation and coordination of joint activities as well as Union topping-up of a trans-national call for proposals. main and compulsory activity of the ERA-NET Cofund under Horizon 2020 is the implementation of the co-funded joint call for proposals that leads to the funding of trans-national research and/or innovation projects.
Focusing on ERANETs, 70 of the 105 participants had knowledge of them, and of these 30 had
applied for funding. 21 participants had already received funding from this mechanism (See
Table 6).
Table 6 - Participants’ experience with ERANETs
Experience with ERANETs
No Experience Have knowledge Have applied Have received funding
10%
20%
10%
20%
40%
0%
0% 5% 10% 15% 20% 25% 30% 35% 40% 45%
Unpredictability of R&I programmes
Low success rates do not justify the investment inthe application
Geographic imbalance
Lack of transparency in the evaluation
Reporting is too complicated and time consuming
Funding only given after the project results areobtained
SHARE OF PARTICIPANTS WHO HAVE FACED THESE BARRIERS IN CEF - PART 3

33
More and better designed national public support for energy technology Research and Innovation
35 70 30 21
When asked about the severity of the barriers they had encountered in ERANETs, 22% claimed
to have faced major barriers, while only 13% stated they had not faced any (See Figure 23).
Figure 23 - ERANETs Severity Level of Barriers As for the specific barriers the participants have encountered when applying, the results can
be seen in Figures 24, 25 and 26.
Figure 24 - Share of participants who have applied for ERANETs and have faced these barriers - Part 1
13%
30%
35%
22%
ERANETS SEVERITY LEVEL OF BARRIERS
No Barriers Minor Barriers Medium Barriers Major Barriers
13%
53%
20%
27%
20%
0% 10% 20% 30% 40% 50% 60%
The funding is too focused on practical results andnot research
The application process is complicated andexhaustive
Process from idea to implementation is too long
Lack of investment funding when there are highup-front costs
Lack of interconnection between the differentprogrammes
SHARE OF PARTICIPANTS WHO HAVE APPLIED FOR ERANETS AND HAVE FACED THESE BARRIERS - PART 1

34
More and better designed national public support for energy technology Research and Innovation
From Figure 24, it is possible to see that over half of the participants believe that the
application process is complicated and exhaustive in ERANETs. In addition, the lack of
investment funding when there are high up-front costs was seen as a common barrier by 27%
of the participants.
Figure 25 - Share of participants who have faced these barriers in ERANETs - Part 2
In Figure 25, it can be seen that 27% of the participants have experienced great variation of
application procedures as an important barrier in ERANETs. Beyond this, 23% of participants
often felt that grants are not suited for industry-led projects.
Figure 26 - Share of participants who have faced these barriers in ERANETs - Part 3
10%
23%
27%
3%
17%
0% 5% 10% 15% 20% 25% 30%
Retroactive changes in the financing schemes
Grants not suited for industry-led projects
Great variation of application procedures
Information requested is private/confidential
Administrative and bureaucratic barriers for newbusiness models
SHARE OF PARTICIPANTS WHO HAVE FACED THESE BARRIERS IN ERANETS - PART 2
20%
23%
20%
17%
17%
3%
0% 5% 10% 15% 20% 25%
Unpredictability of R&I programmes
Low success rates do not justify the investment…
Geographic imbalance
Lack of transparency in the evaluation
Reporting is too complicated and time consuming
Funding only given after the project results are…
SHARE OF PARTICIPANTS WHO HAVE FACED THESE BARRIERS IN ERANETS - PART 3

35
More and better designed national public support for energy technology Research and Innovation
From Figure 26, 23% of the participants felt that the low success rates do not justify the
investment in the application. Other important barriers for a significant number of the
participants have been the geographic imbalance in ERANETs, as well as the unpredictability
of their R&I programmes.
Moreover, participants also find it difficult to keep track of all ERANETs, as given their number and diversity, visibility is often minute. Adding this factor to low funding rates, participants feel disengaged.
EUREKA (Initiative)
EUREKA description: EUREKA is an intergovernmental network launched in 1985, to support market-oriented R&D and innovation projects by industry, research centres and universities across all technological sectors. It is composed of 41 member states, including the European Union represented by the Commission and three associated states – Canada, South Africa and South Korea. With its flexible and decentralised network, EUREKA offers project partners rapid access to skills and expertise across Europe and national public and private funding schemes.
56 of the 105 participants had knowledge of EUREKA, of which 21 had applied for funding and
12 of them had received it (See Table 7).
Table 7 - Participants’ experience with EUREKA
Experience with EUREKA
No Experience Have knowledge Have applied Have received funding
49 56 21 12
When asked about the severity of the barriers they had encountered in EUREKA, only 9%
claimed to have faced major barriers, while 21% stated they had not faced any (See Figure 27).

36
More and better designed national public support for energy technology Research and Innovation
Figure 27 - EUREKA Severity Level of Barriers
As for the specific barriers the participants have encountered when applying, the results can
be seen in Figures 28, 29 and 30.
Figure 28 - Share of participants who have applied for EUREKA and have faced these barriers - Part 1
From Figure 28, it is possible to see that the most important barrier for the participants was
the lack of interconnection between different programmes. Other barriers that were widely
felt by the participants in EUREKA were the application process being complicated and
exhaustive, as well as the lack of investment funding when there are high up-front costs.
21%
44%
26%
9%
EUREKA SEVERITY LEVEL OF BARRIERS
No Barriers Minor Barriers Medium Barriers Major Barriers
10%
33%
19%
33%
38%
0% 5% 10% 15% 20% 25% 30% 35% 40%
The funding is too focused on practical results andnot research
The application process is complicated andexhaustive
Process from idea to implementation is too long
Lack of investment funding when there are highup-front costs
Lack of interconnection between the differentprogrammes
SHARE OF PARTICIPANTS WHO HAVE APPLIED FOR EUREKA AND HAVE FACED THESE BARRIERS - PART 1

37
More and better designed national public support for energy technology Research and Innovation
Figure 29 - Share of participants who have faced these barriers in EUREKA - Part 2
From Figure 29, it can be seen that participants feel that the grants are not suited for industry-
led projects, while the other options do not have a significant weight.
Figure 30 - Share of participants who have faced these barriers in EUREKA - Part 3
According to 19% of the participants, reporting in EUREKA is too complicated and time
consuming and low success rates do not justify the investment in the application (Figure 30).
The remaining barriers do not seem to be widely faced.
0%
19%
10%
10%
14%
0% 2% 4% 6% 8% 10% 12% 14% 16% 18% 20%
Retroactive changes in the financing schemes
Grants not suited for industry-led projects
Great variation of application procedures
Information requested is private/confidential
Administrative and bureaucratic barriers for newbusiness models
SHARE OF PARTICIPANTS WHO HAVE FACED THESE BARRIERS IN EUREKA - PART 2
5%
19%
10%
10%
19%
5%
0% 2% 4% 6% 8% 10% 12% 14% 16% 18% 20%
Unpredictability of R&I programmes
Low success rates do not justify the investment inthe application
Geographic imbalance
Lack of transparency in the evaluation
Reporting is too complicated and time consuming
Funding only given after the project results areobtained
SHARE OF PARTICIPANTS WHO HAVE FACED THESE BARRIERS IN EUREKA - PART 3

38
More and better designed national public support for energy technology Research and Innovation
Joint Programming Initiative JPI (Initiative)
JPI description: Joint Programming is a structured and strategic process whereby Member States agree, on a voluntary basis and in a partnership approach, on common visions and Strategic Research and Innovation Agendas (SRIA) to address major societal challenges. After the development of a common vision and the launch of the SRIA common activities of each Joint Programming Initiative (JPI) can be implemented including e.g. joint calls, so-called fast track activities, knowledge hubs, task forces etc.
84 of the 105 participants had no experience of JPI. 21 of the participants had knowledge of
JPI and of these 4 had applied for funding and 2 of them had received it (See Table 8).
Table 8 - Participants’ experience with JPI
Experience with JPI
No Experience Have knowledge Have applied Have received funding
84 21 4 2
When asked about the severity of the barriers they had encountered in JPI, 11% claimed to
have faced major barriers, 22% medium barriers, 33% minor barriers, while 34% stated they
had not faced any (See Figure 31).
Figure 31 - JPI Severity Level of Barriers
As for the specific barriers the participants have encountered when applying, the results can
be seen in Figures 32, 33, 34.
34%
33%
22%
11%
JPI SEVERITY LEVEL OF BARRIERS
No Barriers Minor Barriers Medium Barriers Major Barriers

39
More and better designed national public support for energy technology Research and Innovation
Figure 32 - Share of participants who have applied for JPI and have faced these barriers - Part 1
Half of the participants in JPI calls felt that there is a lack of investment funding when there
are high up-front costs, as well as lack of interconnection between the different
programmes. Moreover, due to these and other factors, for them the application process is
complicated and exhaustive.
Figure 33 - Share of participants who have faced these barriers in JPI - Part 2
Half the participants also faced administrative and bureaucratic barriers for new business
models and believe there is a great variation of application procedures in JPI calls (see Figure
32).
25%
50%
25%
50%
50%
0% 10% 20% 30% 40% 50% 60%
The funding is too focused on practical results andnot research
The application process is complicated andexhaustive
Process from idea to implementation is too long
Lack of investment funding when there are highup-front costs
Lack of interconnection between the differentprogrammes
SHARE OF PARTICIPANTS WHO HAVE APPLIED FOR JPI AND HAVE FACED THESE BARRIERS - PART 1
0%
25%
50%
0%
50%
0% 10% 20% 30% 40% 50% 60%
Retroactive changes in the financing schemes
Grants not suited for industry-led projects
Great variation of application procedures
Information requested is private/confidential
Administrative and bureaucratic barriers for newbusiness models
SHARE OF PARTICIPANTS WHO HAVE FACED THESE BARRIERS IN JPI - PART 2

40
More and better designed national public support for energy technology Research and Innovation
Figure 34 - Share of participants who have faced these barriers in JPI - Part 3
A vast majority of participants have felt that the evaluation process is not transparent in JPIs.
This can lead to low application numbers, together with the fact that half the participants feel
that low success rates do not justify the investment in the application (see Figure 34).
EFSI
EFSI Description: EFSI is an initiative launched jointly by the EIB Group – the European Investment Bank and European Investment Fund – and the European Commission to help overcome the current investment gap in the EU. EFSI is one of the three pillars of the Investment Plan for Europe that aims to revive investment in strategic projects around the continent to ensure that money reaches the real economy.
63 of the 105 participants had no experience of EFSI, 42 had knowledge, of these 1 had applied
for funding and received it (See Table 9).
Table 9 - Participants' experience with EFSI
Experience with EFSI
No Experience Have knowledge Have applied Have received funding
63 42 1 1
0%
50%
0%
75%
25%
0%
0% 10% 20% 30% 40% 50% 60% 70% 80%
Unpredictability of R&I programmes
Low success rates do not justify the investment in…
Geographic imbalance
Lack of transparency in the evaluation
Reporting is too complicated and time consuming
Funding only given after the project results are…
SHARE OF PARTICIPANTS WHO HAVE FACED THESE BARRIERS IN JPI - PART 3

41
More and better designed national public support for energy technology Research and Innovation
When asked about the severity of the barriers they had encountered in EFSI, 11% claimed to
have faced medium barriers, 33% minor barriers, while 56% stated they had not faced any
(See Figure 35).
Figure 35 - EFSI Severity Level of Barriers
Given that only one participant had applied for funding, the specific barriers’ analysis reflects
only their agreement (100%) or disagreement (0%). See Figures 36, 37 and 38.
Figure 36 - Share of participants who have applied for EFSI and have faced these barriers - Part 1
56%33%
11%0%
EFSI SEVERITY LEVEL OF BARRIERS
No Barriers Minor Barriers Medium Barriers Major Barriers
0%
100%
100%
100%
100%
0% 20% 40% 60% 80% 100% 120%
The funding is too focused on practical results andnot research
The application process is complicated andexhaustive
Process from idea to implementation is too long
Lack of investment funding when there are highup-front costs
Lack of interconnection between the differentprogrammes
SHARE OF PARTICIPANTS WHO HAVE APPLIED FOR EFSI AND HAVE FACED THESE BARRIERS - PART 1

42
More and better designed national public support for energy technology Research and Innovation
It is possible to see that the participant recognized most of the barriers from Figure 36, stating
however that they do not feel the felt that the funding is too focused on practical results
instead of research.
Figure 37 - Share of participants who have faced these barriers in EFSI - Part 2
Similarly, to the previous analysis, the participant also agreed with most of the barriers from
Figure 37, while not believing that the requested information is private or confidential.
Figure 38 - Share of participants who have faced these barriers in EFSI - Part 3
As for the barriers in Figure 38, although the participant recognized many of them in EFSI, they
did not feel any geographical imbalance in the calls or that funding being given after the
projects results were obtained were issues.
100%
100%
100%
0%
100%
0% 20% 40% 60% 80% 100% 120%
Retroactive changes in the financing schemes
Grants not suited for industry-led projects
Great variation of application procedures
Information requested is private/confidential
Administrative and bureaucratic barriers for newbusiness models
SHARE OF PARTICIPANTS WHO HAVE FACED THESE BARRIERS IN EFSI - PART 2
100%
100%
0%
100%
100%
0%
0% 20% 40% 60% 80% 100% 120%
Unpredictability of R&I programmes
Low success rates do not justify the investment…
Geographic imbalance
Lack of transparency in the evaluation
Reporting is too complicated and time consuming
Funding only given after the project results are…
SHARE OF PARTICIPANTS WHO HAVE FACED THESE BARRIERS IN EFSI - PART 3

43
More and better designed national public support for energy technology Research and Innovation
National funding mechanisms
Focusing on National funding mechanisms, 96 of the 105 participants had knowledge of them,
and of these 79 had applied for funding. 71 participants had already received funding from
this mechanism (See Table 10).
National funding mechanisms definition: Include national public research funding mechanisms across Europe with 20 countries represented.
Table 10 - Participants’ experience with National Funding Mechanisms
Experience with National Funding Mechanisms
No Experience Have knowledge Have applied Have received funding
9 96 79 71
When asked about the severity of the barriers they had encountered in National funding
mechanisms, 40% claimed to have faced minor barriers, while only 12% claimed to have faced
major barriers (See Figure 39).
Figure 39 - National Funding Mechanisms' severity level of barriers
As for the specific barriers the participants have encountered when applying, the results can
be seen in Figures 40, 41 and 42.
13%
40%
35%
12%
NATIONAL FUNDING MECHANISMS SEVERITY LEVEL OF BARRIERS
No Barriers Minor Barriers Medium Barriers Major Barriers

44
More and better designed national public support for energy technology Research and Innovation
Figure 40 - Share of participants who have applied for National funding mechanisms and have faced these barriers - Part 1
From Figure 40, it is possible to see that slightly over one third of the participants believe that
the application process in national funding mechanisms is complicated and exhaustive,
followed by the feeling that there is lack of investment funding when there are high up-front
costs in projects.
Figure 41 - Share of participants who have faced these barriers in National funding mechanisms - Part 2
Although most of the barriers in Figure 41 were not strongly felt by the participants,
nonetheless circa one quarter of them believe that there is a great variation of application
procedures.
10%
34%
15%
29%
14%
0% 5% 10% 15% 20% 25% 30% 35% 40%
The funding is too focused on practical results andnot research
The application process is complicated andexhaustive
Process from idea to implementation is too long
Lack of investment funding when there are highup-front costs
Lack of interconnection between the differentprogrammes
SHARE OF PARTICIPANTS WHO HAVE APPLIED FOR NATIONAL FUNDING MECHANISMS AND HAVE FACED
THESE BARRIERS - PART 1
8%
16%
24%
9%
19%
0% 5% 10% 15% 20% 25% 30%
Retroactive changes in the financing schemes
Grants not suited for industry-led projects
Great variation of application procedures
Information requested is private/confidential
Administrative and bureaucratic barriers for newbusiness models
SHARE OF PARTICIPANTS WHO HAVE FACED THESE BARRIERS IN NATIONAL FUNDING MECHANISMS - PART 2

45
More and better designed national public support for energy technology Research and Innovation
Figure 42 - Share of participants who have faced these barriers in National funding mechanisms - Part 3
Similarly, to the previous analysis, around one quarter of the participants highlighted that low
success rates often do not justify the investment in the application to national funding, and
when applications are successful the reporting is too complicated and time consuming.
Regional funding mechanisms
Regional funding mechanisms definition: Include regional public research funding mechanisms across Europe with 20 countries represented.
Focusing on Regional funding mechanisms, 90 of the 105 participants had knowledge of them,
and of these 58 had applied for funding. 49 participants had already received funding from
this mechanism (See Table 11).
Table 11 - Participants' experience with Regional Funding Mechanisms
Experience with Regional Funding Mechanisms
No Experience Have knowledge Have applied Have received funding
15 90 58 49
When asked about the severity of the barriers they had encountered in Regional funding
mechanisms, 39% claimed to have faced minor barriers, while only 13% claimed to have faced
major barriers (See Figure 43).
16%
24%
11%
15%
23%
19%
0% 5% 10% 15% 20% 25% 30%
Unpredictability of R&I programmes
Low success rates do not justify the investment inthe application
Geographic imbalance
Lack of transparency in the evaluation
Reporting is too complicated and time consuming
Funding only given after the project results areobtained
SHARE OF PARTICIPANTS WHO HAVE FACED THESE BARRIERS IN NATIONAL FUNDING MECHANISMS - PART 3

46
More and better designed national public support for energy technology Research and Innovation
Figure 43 - Regional Funding Mechanisms' severity level of barriers
As for the specific barriers the participants have encountered when applying, the results can
be seen in Figures 44, 45 and 46.
Figure 44 - Share of participants who have applied for Regional funding mechanisms and have faced these barriers - Part 1
From Figure 44, almost one third of the participants believe the application process in regional
funding is complicated and exhaustive, and that there should be some investment funding
given when projects have high up-front costs.
19%
39%
29%
13%
REGIONAL FUNDING MECHANISMS SEVERITY LEVEL OF BARRIERS
No Barriers Minor Barriers Medium Barriers Major Barriers
10%
31%
12%
28%
17%
0% 5% 10% 15% 20% 25% 30% 35%
The funding is too focused on practical results andnot research
The application process is complicated andexhaustive
Process from idea to implementation is too long
Lack of investment funding when there are highup-front costs
Lack of interconnection between the differentprogrammes
SHARE OF PARTICIPANTS WHO HAVE APPLIED FOR REGIONAL FUNDING MECHANISMS AND HAVE FACED
THESE BARRIERS - PART 1
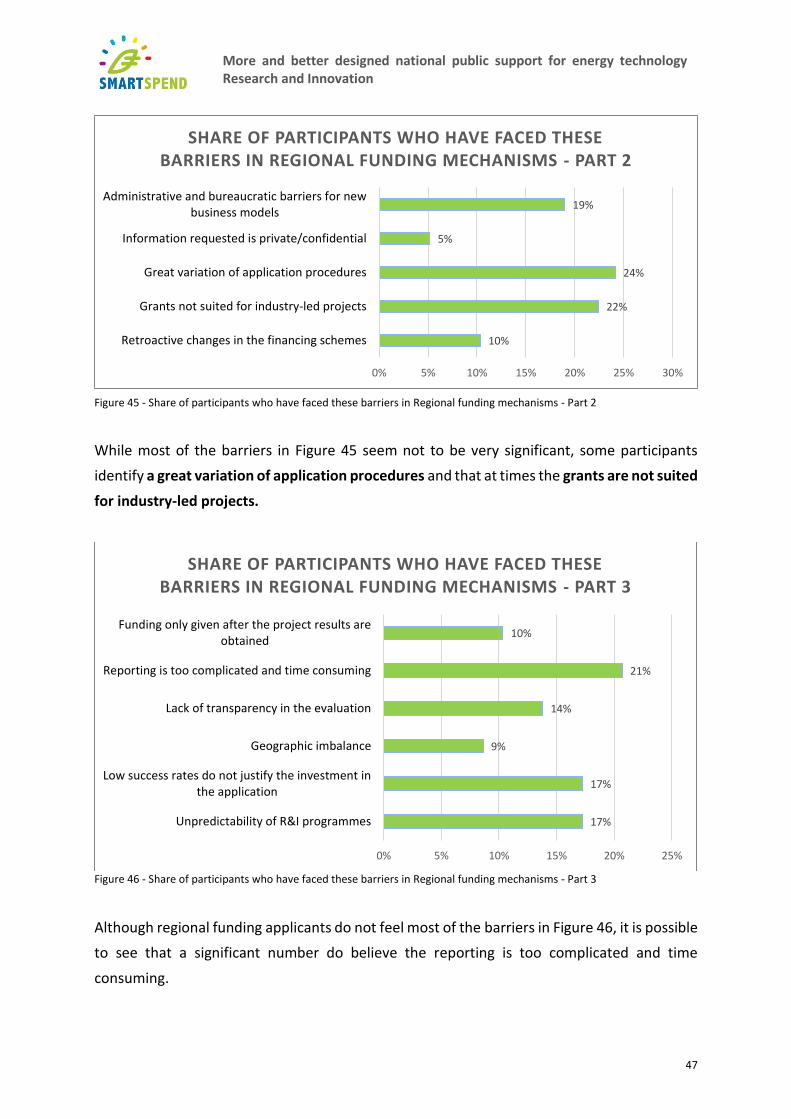
47
More and better designed national public support for energy technology Research and Innovation
Figure 45 - Share of participants who have faced these barriers in Regional funding mechanisms - Part 2
While most of the barriers in Figure 45 seem not to be very significant, some participants
identify a great variation of application procedures and that at times the grants are not suited
for industry-led projects.
Figure 46 - Share of participants who have faced these barriers in Regional funding mechanisms - Part 3
Although regional funding applicants do not feel most of the barriers in Figure 46, it is possible
to see that a significant number do believe the reporting is too complicated and time
consuming.
10%
22%
24%
5%
19%
0% 5% 10% 15% 20% 25% 30%
Retroactive changes in the financing schemes
Grants not suited for industry-led projects
Great variation of application procedures
Information requested is private/confidential
Administrative and bureaucratic barriers for newbusiness models
SHARE OF PARTICIPANTS WHO HAVE FACED THESE BARRIERS IN REGIONAL FUNDING MECHANISMS - PART 2
17%
17%
9%
14%
21%
10%
0% 5% 10% 15% 20% 25%
Unpredictability of R&I programmes
Low success rates do not justify the investment inthe application
Geographic imbalance
Lack of transparency in the evaluation
Reporting is too complicated and time consuming
Funding only given after the project results areobtained
SHARE OF PARTICIPANTS WHO HAVE FACED THESE BARRIERS IN REGIONAL FUNDING MECHANISMS - PART 3

48
More and better designed national public support for energy technology Research and Innovation
Other Funding Mechanisms
From the input received in the interviews and in the qualitative parts of the questionnaire, the
following funding mechanisms have been used by the participants to help in the development
of clean energy technologies besides those addressed previously:
• COST: European Cooperation in Science and Technology is a funding organisation for
research and innovation networks.
• ELENA: ELENA is a joint initiative by the EIB and the European Commission under the
Horizon 2020 programme. ELENA provides grants for technical assistance focused on
the implementation of energy efficiency, distributed renewable energy and urban
transport programmes.
• Erasmus+: A funding scheme programme to support activities in the fields of
Education, Training, Youth and Sport.
• The Fast Track to Innovation (FTI) is central part of the European Innovation Council
(EIC) pilot, targeting radically new, breakthrough products, services, processes or
business models that open up new markets.
• Tenders from the EC: Open and upcoming calls for funding proposals
Industry view on Funding entities
EIT-KICs (Entity)
EIT-KICs description: The European Institute of Innovation & Technology (EIT) is an independent body of the European Union set up in 2008 to deliver innovation across Europe. The EIT brings together leading business, education and research organisations to form dynamic cross-border partnerships. KICs ‘Knowledge and Innovation Communities’ create a pan-European network and carry out a whole range of activities that cover the entire innovation chain – including training and education programmes, reinforcing the journey from research to the market, innovation projects as well as business incubators and accelerators.
54 of the 105 participants had knowledge of EIT-KICs, of these 14 had applied for funding and
13 of them had received it (See Table 12).

49
More and better designed national public support for energy technology Research and Innovation
Table 12 - Participants’ experience with EIT-KICs
Experience with EIT-KICs
No Experience Have knowledge Have applied Have received funding
51 54 14 13
When asked about the severity of the barriers they had encountered in EIT-KICs, 12% claimed
to have faced major barriers, while 24% stated they had not faced any (See Figure 47).
Figure 47 - EIT-KICs Severity Level of Barriers
As for the specific barriers the participants have encountered when applying, the results can
be seen in Figures 48, 49 and 50.
24%
28%
36%
12%
EIT-KICS SEVERITY LEVEL OF BARRIERS
No Barriers Minor Barriers Medium Barriers Major Barriers

50
More and better designed national public support for energy technology Research and Innovation
Figure 48 - Share of participants who have applied for EIT-KICs and have faced these barriers - Part 1
In Figure 48, it is possible to see that over half the participants believe there is a lack of
interconnection between the different programmes in EIT-KICs. A large share of the
participants also felt that the application process is complicated and exhaustive.
On the other hand, only a small minority believes that the process from idea to
implementation is too long, so it is possible to conclude it is not a barrier.
Figure 49 - Share of participants who have faced these barriers in EIT-KICs - Part 2
From Figure 49, it is possible to see that 43% of the participants believe that there is a great
variation of application procedures in EIT-KICs. To a minor extent, a significant number has
also encountered administrative and bureaucratic barriers for new business models.
21%
43%
7%
29%
57%
0% 10% 20% 30% 40% 50% 60%
The funding is too focused on practical results andnot research
The application process is complicated andexhaustive
Process from idea to implementation is too long
Lack of investment funding when there are highup-front costs
Lack of interconnection between the differentprogrammes
SHARE OF PARTICIPANTS WHO HAVE APPLIED FOR EIT-KICS AND HAVE FACED THESE BARRIERS - PART 1
21%
14%
43%
14%
29%
0% 5% 10% 15% 20% 25% 30% 35% 40% 45%
Retroactive changes in the financing schemes
Grants not suited for industry-led projects
Great variation of application procedures
Information requested is private/confidential
Administrative and bureaucratic barriers for newbusiness models
SHARE OF PARTICIPANTS WHO HAVE FACED THESE BARRIERS IN EIT-KICS - PART 2

51
More and better designed national public support for energy technology Research and Innovation
In EIT-KICs, similarly to ERANETs, participants also feel that the calls can be very open, not
restricting topics to certain areas.
InnoEnergy (Entity)
InnoEnergy description: InnoEnergy is the innovation engine for Europe’s energy industry that invest in businesses and help develop innovative products, services, and solutions that have high commercial potential. InnoEnergy provide access to a deep pool of complementary skills and resources and connect them to markets and commercial opportunities across Europe.
47 of the 105 participants had no experience of InnoEnergy. 58 of the participants had
knowledge of InnoEnergy and of these 9 had applied for funding and 6 of them had received
it (See Table 13).
Table 13 - Participants’ experience with InnoEnergy
Experience with InnoEnergy
No Experience Have knowledge Have applied Have received funding
47 58 9 6
When asked about the severity of the barriers they had encountered in InnoEnergy, 9%
claimed to have faced major barriers, 17% medium barriers, 44% minor barriers, while 30%
stated they had not faced any (See Figure 50).
Figure 50 - InnoEnergy Severity Level of Barriers
30%
44%
17%
9%
INNOENERGY SEVERITY LEVEL OF BARRIERS
No Barriers Minor Barriers Medium Barriers Major Barriers

52
More and better designed national public support for energy technology Research and Innovation
As for the specific barriers the participants have encountered when applying, the results can
be seen in Figures 51, 52 and 53.
Figure 51 - Share of participants who have applied for InnoEnergy and have faced these barriers - Part 1
From Figure 51, it is possible to see that almost the entirety of the participants believes the
application process to be complicated and exhaustive. One third of them also feels the lack
of investment funding when there are high up-front costs to be a constraint.
Figure 52 - Share of participants who have faced these barriers in InnoEnergy - Part 2
Another third of the participants have identified strong administrative and bureaucratic
barriers for new business models deriving from InnoEnergy projects (see Figure 52).
33%
89%
11%
33%
22%
0% 10% 20% 30% 40% 50% 60% 70% 80% 90% 100%
The funding is too focused on practical results…
The application process is complicated and…
Process from idea to implementation is too long
Lack of investment funding when there are high…
Lack of interconnection between the different…
SHARE OF PARTICIPANTS WHO HAVE APPLIED FOR INNOENERGY AND HAVE FACED THESE BARRIERS - PART
1
11%
22%
22%
11%
33%
0% 5% 10% 15% 20% 25% 30% 35%
Retroactive changes in the financing schemes
Grants not suited for industry-led projects
Great variation of application procedures
Information requested is private/confidential
Administrative and bureaucratic barriers for newbusiness models
SHARE OF PARTICIPANTS WHO HAVE FACED THESE BARRIERS IN INNOENERGY - PART 2

53
More and better designed national public support for energy technology Research and Innovation
Figure 53 - Share of participants who have faced these barriers in InnoEnergy - Part 3
From Figure 53, it is possible to see that one third of the participants believe the evaluation
to be non-transparent, while also stating low success rates do not justify the investment in
the application. None of the participants thought there is geographic imbalance in InnoEnergy
calls or that the R&I programmes are unpredictable.
EASME (Entity)
EASME description: The Executive Agency for Small and Medium-sized Enterprises (EASME) has been set-up by the European Commission to manage on its behalf several EU programmes in the fields of SME support & innovation, environment, climate action, energy and maritime affairs.
48 of the 105 participants had knowledge of EASME calls such as the SME instrument, of which
17 had applied for funding and 11 of them had received it (See Table 14).
Table 14 - Participants’ experience with EASME
Experience with EASME
No Experience Have knowledge Have applied Have received funding
57 48 17 11
0%
33%
0%
33%
22%
11%
0% 5% 10% 15% 20% 25% 30% 35%
Unpredictability of R&I programmes
Low success rates do not justify the investment inthe application
Geographic imbalance
Lack of transparency in the evaluation
Reporting is too complicated and time consuming
Funding only given after the project results areobtained
SHARE OF PARTICIPANTS WHO HAVE FACED THESE BARRIERS IN INNOENERGY - PART 3

54
More and better designed national public support for energy technology Research and Innovation
When asked about the severity of the barriers they had encountered in EASME, only 12%
claimed to have faced major barriers, while 30% stated they had not faced any (See Figure 54).
Figure 54 - EASME Severity Level of Barriers
As for the specific barriers the participants have encountered when applying, the results can
be seen in Figures 55, 56 and 57.
Figure 55 - Share of participants who have applied for EASME and have faced these barriers - Part 1
30%
40%
18%
12%
EASME SEVERITY LEVEL OF BARRIERS
No Barriers Minor Barriers Medium Barriers Major Barriers
6%
41%
24%
12%
29%
0% 5% 10% 15% 20% 25% 30% 35% 40% 45%
The funding is too focused on practical results andnot research
The application process is complicated andexhaustive
Process from idea to implementation is too long
Lack of investment funding when there are highup-front costs
Lack of interconnection between the differentprogrammes
SHARE OF PARTICIPANTS WHO HAVE APPLIED FOR EASME AND HAVE FACED THESE BARRIERS - PART 1

55
More and better designed national public support for energy technology Research and Innovation
From Figure 55, it is possible to see that the application process in EASME calls is complicated
and exhaustive for a large portion of the participants. There are also many who feel there is
a lack of interconnection between the different programmes.
Figure 56 - Share of participants who have faced these barriers in EASME - Part 2
From Figure 56, it is possible to see that almost one quarter of the participants have faced
administrative and bureaucratic barriers for new business models.
Figure 57 - Share of participants who have faced these barriers in EASME - Part 3
In Figure 57, a non-negligible amount of participants have claimed that the reporting is too
complicated and time consuming as well as that there is a lack of transparency in the
evaluation.
0%
18%
12%
18%
24%
0% 5% 10% 15% 20% 25%
Retroactive changes in the financing schemes
Grants not suited for industry-led projects
Great variation of application procedures
Information requested is private/confidential
Administrative and bureaucratic barriers for newbusiness models
SHARE OF PARTICIPANTS WHO HAVE FACED THESE BARRIERS IN EASME - PART 2
6%
18%
12%
24%
24%
0%
0% 5% 10% 15% 20% 25%
Unpredictability of R&I programmes
Low success rates do not justify the investment inthe application
Geographic imbalance
Lack of transparency in the evaluation
Reporting is too complicated and time consuming
Funding only given after the project results areobtained
SHARE OF PARTICIPANTS WHO HAVE FACED THESE BARRIERS IN EASME - PART 3

56
More and better designed national public support for energy technology Research and Innovation
Under EASME, participants believe that the SME Instrument should have topics/areas
separated from each other, so companies from different sectors do not compete against each
other (e.g. Health technologies against Clean Energy). As for the Fast Track to Innovation, its
requirement for “disruption” is not clearly explained, leaving participants unsure whether
their projects are suitable.
EIB (Entity)
EIB Description: The European Investment Bank is the lending arm of the European Union. Is the biggest multilateral financial institution in the world and one of the largest providers of climate finance.
55 of the 105 participants had knowledge of EIB, of these 7 had applied for funding and 5 of
them had received it (See Table 15).
Table 15 - Participants' experience with EIB
Experience with EIB
No Experience Have knowledge Have applied Have received funding
50 55 7 5
When asked about the severity of the barriers they had encountered in EIB, 11% claimed to
have faced major barriers, while 39% stated they had not faced any (See Figure 58).

57
More and better designed national public support for energy technology Research and Innovation
Figure 58 - EIB Severity Level of Barriers
As for the specific barriers the participants have encountered when applying, the results can
be seen in Figures 59, 60 and 61.
Figure 59 - Share of participants who have applied for EIB and have faced these barriers - Part 1
In Figure 59, it is possible to see that over half of the participants believe that there is a lack
of interconnection between the different programmes in the EIB, together with a
complicated and exhaustive application process. This can lead to the process from idea to
implementation to be too long.
39%
33%
17%
11%
EIB SEVERITY LEVEL OF BARRIERS
No Barriers Minor Barriers Medium Barriers Major Barriers
14%
57%
57%
43%
57%
0% 10% 20% 30% 40% 50% 60%
The funding is too focused on practical results andnot research
The application process is complicated andexhaustive
Process from idea to implementation is too long
Lack of investment funding when there are highup-front costs
Lack of interconnection between the differentprogrammes
SHARE OF PARTICIPANTS WHO HAVE APPLIED FOR EIB AND HAVE FACED THESE BARRIERS - PART 1

58
More and better designed national public support for energy technology Research and Innovation
On the other hand, few participants think the funding is too focused on practical results and
not research.
Figure 60 - Share of participants who have faced these barriers in EIB - Part 2
From Figure 60, it is possible to see that a large majority of the participants faced
administrative and bureaucratic barriers for new business models when applying for EIB
funding. A smaller but still significant number also felt that often the information requested
is private/confidential for them, and that the grants are not suited for industry-led projects.
Figure 61 - Share of participants who have faced these barriers in EIB - Part 3
From Figure 60, it is possible to see that almost half of the participants believe the R&I programmes can be unpredictable, with slightly fewer also having the opinion the low success rates do not justify the investment in the application procedure.
0%
29%
0%
29%
71%
0% 10% 20% 30% 40% 50% 60% 70% 80%
Retroactive changes in the financing schemes
Grants not suited for industry-led projects
Great variation of application procedures
Information requested is private/confidential
Administrative and bureaucratic barriers for newbusiness models
SHARE OF PARTICIPANTS WHO HAVE FACED THESE BARRIERS IN EIB - PART 2
43%
29%
0%
14%
14%
14%
0% 5% 10% 15% 20% 25% 30% 35% 40% 45%
Unpredictability of R&I programmes
Low success rates do not justify the investment in…
Geographic imbalance
Lack of transparency in the evaluation
Reporting is too complicated and time consuming
Funding only given after the project results are…
SHARE OF PARTICIPANTS WHO HAVE FACED THESE BARRIERS IN EIB - PART 3

59
More and better designed national public support for energy technology Research and Innovation
International Energy Agency (IEA) (Entity)
International Energy Agency (IEA) definition: The International Energy Agency acts as energy policy advisor to 29 Member Countries plus the European Commission, in their effort to ensure reliable, affordable, and clean energy for their citizens. Current work focuses on climate change policies, market reform, energy technology collaboration and outreach to the rest of the world, especially major producers and consumers of energy like China, India, Russia and the OPEC countries.
Focusing on the IEA, 52 of the 105 participants had knowledge of it, 14 of them having applied
for funding and 10 receiving it. (See Table 16).
Table 16 - Participants’ experience with IEA
Experience with IEA
No Experience Have knowledge Have applied Have received funding
53 52 14 10
When asked about the severity of the barriers they had encountered in IEA, only 5% claimed
to have faced major barriers, while 57% stated they had not faced any (See Figure 62).
Figure 62 - IEA Severity Level of Barriers
57%29%
9%
5%
IEA SEVERITY LEVEL OF BARRIERS
No Barriers Minor Barriers Medium Barriers Major Barriers

60
More and better designed national public support for energy technology Research and Innovation
As for the specific barriers the participants have encountered when applying, the results can
be seen in Figures 63, 64 and 65.
Figure 63 - Share of participants who have applied for IEA and have faced these barriers - Part 1
From Figure 63, it is possible to see that half of the participants believe that there is a lack of
interconnection between the different programmes. In addition, the lack of investment
funding when there are high up-front costs has been felt by 29% of the participants.
Beyond these, it can also be concluded that other barriers mentioned in the questionnaire
where results are below 7%, such as the funding being too focused on practical results and
not research do not have a significant impact on applicants.
Figure 64 - Share of participants who have faced these barriers in IEA - Part 2
7%
14%
7%
29%
50%
0% 10% 20% 30% 40% 50% 60%
The funding is too focused on practical results andnot research
The application process is complicated andexhaustive
Process from idea to implementation is too long
Lack of investment funding when there are highup-front costs
Lack of interconnection between the differentprogrammes
SHARE OF PARTICIPANTS WHO HAVE APPLIED FOR IEA AND HAVE FACED THESE BARRIERS - PART 1
7%
21%
7%
7%
14%
0% 5% 10% 15% 20% 25%
Retroactive changes in the financing schemes
Grants not suited for industry-led projects
Great variation of application procedures
Information requested is private/confidential
Administrative and bureaucratic barriers for newbusiness models
SHARE OF PARTICIPANTS WHO HAVE FACED THESE BARRIERS IN IEA - PART 2

61
More and better designed national public support for energy technology Research and Innovation
From Figure 64, it is possible to see that 21% of the participants believe that grants not suited
for industry-led projects. Beyond this, it can also be concluded that the remaining barriers do
not seem to be of great importance.
Figure 65 - Share of participants who have faced these barriers in IEA - Part 3
In Figure 65, it can be seen that 29% of the participants believe that the low success rates do
not justify the investment in the application.
Beyond this, it can also be concluded that the remaining barriers do not seem to be as
commonly felt in IEA.
The main findings related to the industry experience on the above described funding
mechanisms and main barriers can be summarised as follow:
Funding mechanisms:
• A strong majority of participants had already received H2020 funding. Almost half of
them faced administrative and bureaucratic barriers and consider the application
process for H2020 to be complicated and exhaustive with a low success rate that does
not necessarily justify the investment in the application. Difficulties were highlighted
in implementing all the expected impacts of a call, which also makes it difficult to find
0%
29%
14%
14%
14%
14%
0% 5% 10% 15% 20% 25% 30%
Unpredictability of R&I programmes
Low success rates do not justify the investment inthe application
Geographic imbalance
Lack of transparency in the evaluation
Reporting is too complicated and time consuming
Funding only given after the project results areobtained
SHARE OF PARTICIPANTS WHO HAVE FACED THESE BARRIERS IN IEA - PART 3

62
More and better designed national public support for energy technology Research and Innovation
a suitable consortium. Participating representatives of SMEs claim that the time and
effort to develop a good proposal is often a deterrent to apply.
• Most of the participants had no knowledge of NER 300, with those who had already
applied having faced a severe level of administrative and bureaucratic barriers.
• The majority of the participants had no knowledge of InnovFin and none of them had
previously applied.
• The vast majority of participants had experience with LIFE, almost one fourth had
applied and 20 of them received funding. Almost half of the participants claimed that
the reporting is too complicated and time consuming.
• The vast majority of participants had no experience with CEF. Of those who had
applied, more than one third claimed that grants were not suited for industry-led
projects.
• The vast majority of the participants had knowledge of ERANETs, more than one
fourth had applied for funding of which almost all had received funding from this
mechanism. Participants feel that calls for ERANETs can be more open and not
restricting certain topics or certain areas. The low funding rates make the participants
feel disengaged.
• Half of the participants had knowledge of EUREKA, of which 21 had applied for
funding and 12 of them had received it. Lack of interconnection between the different
programmes is the most important barrier participants have encountered in EUREKA.
• The vast majority of participants had no experience with JPI. Those who had
participated had felt a strong lack of transparency in the evaluation.
• The vast majority of participants had no experience with EFSI and only one participant
had applied and received funding.
• The vast majority of participants had applied and received funding from national
funding schemes. Almost one fourth of those who had applied believed that
application procedures vary greatly.
• The vast majority of participants had applied for regional funding schemes and
almost the half of them received funding. One fourth of them believe that the

63
More and better designed national public support for energy technology Research and Innovation
application process is complicated and exhaustive and that there is lack of investment
funding when there are high up-front costs.
Funding entities
• Focusing on the IEA, around half the participants had knowledge of it, 14 of them
having applied for funding. Only 5% of participants claimed to have faced major
barriers, while 57% stated they had not faced any.
• Lack of interconnection between the different programmes is the most important
barrier participants have encountered in EIT-KICs.
• The vast majority of participants had knowledge of InnoEnergy and considered the
application process to be complicated and exhaustive.
• Half the participants had no knowledge of EASME calls. Of those who did, more than
one third believe that the application process is complicated and exhaustive and more
than one fourth that there is a lack of transparency in the evaluation. Participants
believe that the SME Instrument should have topics/areas separated from each other
and ideally divided by sectors.
• Half the participants had knowledge of the EIB instruments. All of those who had
already applied claimed administrative and bureaucratic barriers and believe the R&I
programmes to be very unpredictable.
6. Potential Measures and Improvements All 105 participants provided their feedbacks in the section “Potential Measure and
Improvement” of the questionnaire. In it, they classified whether suggested measures and
improvements were relevant or not to them.

64
More and better designed national public support for energy technology Research and Innovation
Figure 66 - Potential Measures and Improvements - Part 1
From the potential measures and improvements in Figure 66, it is possible to see that the vast
majority (70%) believe that “Applications should have 2 stages - a first simple one and a second
more elaborate for those approved” is a relevant measure to be taken. Furthermore, 63% of
participants state that “Shared infrastructures should be available for funded projects.” in
accordance with the relevancy of each of the suggested measures and improvements.
19%
17%
31%
25%
9%
70%
40%
49%
54%
63%
11%
43%
20%
21%
29%
0% 20% 40% 60% 80%
Applications should have 2 stages - a firstsimple one and a second more elaborate
for those approved
There should be a stage gate approach
Recognition of experience should includeexperience in other fundingmechanisms/programmes
H2020 reporting model should be used fornational and regional mechanisms
Shared infrastructures should be availablefor funded projects
POTENTIAL MEASURES AND IMPROVEMENTS - PART 1
No Opinion Relevant Not Relevant

65
More and better designed national public support for energy technology Research and Innovation
Figure 67 - Potential Measurements and Improvements - Part 2
From the potential measures and improvements in Figure 67, 56% of participants believe that
“Mid-term reviews should be instated”, and 47% that there should be “VAT/Tax exemptions
in initial stages of a project”. It is difficult to conclude whether participants are for or against
the termination of projects which are not performing as 56% are in favor and 54% against.
However, 50% do believe that if a project is performing well but its focus has changed it should
not be cancelled.
15%
16%
28%
28%
50%
47%
56%
56%
54%
35%
39%
29%
17%
19%
15%
0% 10% 20% 30% 40% 50% 60%
VAT/Tax exemptions in initial stages of aproject
Mid-term reviews should be instated
Projects should be cancelled if they arenot performing. Their funding would be
reallocated to better performing projects
Projects should be encouraged tocontinue even if initial results are not
promising
Projects which deviate from their originalfocus should be cancelled. Their funding
would be reallocated to other/new…
POTENTIAL MEASURES AND IMPROVEMENTS - PART 2
No Opinion Relevant Not Relevant

66
More and better designed national public support for energy technology Research and Innovation
Figure 68 - Potential Measures and Improvements - Part 3
From the potential measures and improvements in Figure 68, 81% of participants believe that
“EU funding needs to support industrial-scale market-uptake and manufacturing in cutting
edge technologies”, and 70% that “There should be investment not just for R&I but also new
business models”. A large majority of 68% also states that “More capital is needed for SMEs
to be able to upscale”. It is difficult to conclude if there should be more H2020 calls with
smaller budgets or the other way around as those in favor and against are very close in number
(43% and 50%, respectively).
13%
11%
13%
50%
43%
81%
68%
70%
22%
27%
7%
22%
18%
30%
31%
0% 20% 40% 60% 80% 100%
EU funding needs to support industrial-scale market-uptake and manufacturing in
cutting edge technologies
More capital is needed for SMEs to beable to upscale
There should be investment not just forR&I but also new business models
There should be fewer H2020 workprogramme calls but with a larger budget
There should be more H2020 workprogramme calls but with a smaller
budget
POTENTIAL MEASURES AND IMPROVEMENTS - PART 3
No Opinion Relevant Not Relevant

67
More and better designed national public support for energy technology Research and Innovation
Figure 69 - Potential Measures and Improvements - Part 4
From the potential measures and improvements in Figure 69, 80% of participants believe that
“More funding is needed specially for demonstrators”, and 70% that “National regulations
should be more in sync”. Although 50% believe “The creation of an Insurance and Guarantee
Fund” could lower the uncertainty costs of projects” it is difficult to see it as widespread
approval given 41% did not express their opinion.
Beyond this analysis, which was undertook with the data collected through the questionnaire, an analysis has also been done taking into consideration the direct input gathered from the interviews and the questionnaire’s open questions. This input was not structured to be statistically analysed but rather open questions to get input to broaden the scope of the questionnaire. The main potential measures can be divided into the following sections: Project Management, Funding Application, Funding Mechanisms, Technology Readiness Level, IPR, Budget and Funding, Reporting and Calls.
Project Management
• Smaller consortiums structures with up to 5 partners were suggested in order to
deliver quicker results.
• A ruling service for admissible costs to remove uncertainty before spending was
suggested.
• In cases where the results have deviated, participants suggested the creation of an
intermediate evaluation for all projects to carefully evaluate if the new results are
interesting or relevant.
10%
12%
10%
70%
80%
50%
22%
9%
41%
0% 20% 40% 60% 80% 100%
National regulations should be more insync (e.g. licenses, authorisations)
More funding is needed specifically fordemonstrators
The creation of an "Insurance andGuarantee Fund" could lower the
uncertainty costs of projects
POTENTIAL MEASURES AND IMPROVEMENTS - PART 4
No Opinion Relevant Not Relevant

68
More and better designed national public support for energy technology Research and Innovation
• It was suggested that funding programmes should take into account the changeable
reality during the lifetime of a project, which could mean that initially agreed activities
should be changed and modified to a new reality.
Funding application
• Two-stage applications were considered as favored (where relevant). Indeed, it was
suggested that the first stage should comprise only a brief explanation of the project
idea. If the idea does not fit in the funding programme, a lot of work could be avoided
losing less time on a project if it does not seem solid enough from the beginning.
• It was highlighted that the evaluation procedures are transversely very long and was
suggested the creation of procedure calls for projects with higher TRL level (6-7 and
above).
• The majority of participants highlighted that there is too much focus on administrative
accuracy and not result accuracy. This may be jeopardizing the actual results of the
projects.
• A more specific language for the calls of proposal was suggested in order to have a
better wording of the calls that allow the applicants to check whether a project idea
fits into it.
• It was highlighted that the rules and application processes are very different for
European projects than for national projects and that uniformization could be helpful.
• In some European schemes (like Eurostars and ERANET projects) when a project is
selected for funding after the first submission and evaluation of the proposal, another
submission is required at national level in the national language. This implies more
time, efforts and costs.
Funding mechanisms
• Improve the synergies and synchronization between European programmes, but also
between national and European programmes.
• Quick evaluation processes and a shorter project duration will substantially contribute
to make certain funding schemes more attractive.
• The published information and the info sessions are not always enough even for
specialists.
• More funding should be given to successful projects so their results can then be open
to the public.

69
More and better designed national public support for energy technology Research and Innovation
• It was as suggested to establish a framework of shared results and that more results
should be made public.
• More funds for expansion of infrastructure should be made available.
• There should be funding to follow up on projects that produced working prototypes
(key exploitable results), to be scaled up.
• A balance between independent and centralized funding options could be more
efficient.
• Funding mechanisms sometimes are too complex and was suggested the creation of a
sort of a guideline with the basic introduction to different European funding
mechanisms.
Technology Readiness Level:
• According to the feedback received the TRLs should not be the only indicator given
that they may not be relevant for energy R&D where different parts of the system may
be at very different levels of maturity, and where some aspects (especially software
ones) can move very rapidly from concept to commercial implementation.
• The TRL scale can be unclear, good for pure technological review but not for market
and social impact for the project to be considered successful. Another scale can be
being used like for instance the TIL (Technology Impact Level).
• It was highlighted that it is easy to find low TRL funding instruments at national level,
not so much higher TRL.
• Unclear definition of what is close to market.
IPR
• IPR management, should be more open after the end of the project.
Budget and Funding
• Budgets should continue to be based on an effort assessment basis but for individual
deliverables, payment should be based on delivery only so that there is a clear
incentive to deliver and a benefit for organizations which manage to deliver more
efficiently.
Reporting

70
More and better designed national public support for energy technology Research and Innovation
• The mid-term reports and the final project reports executed by independent
reviewers/experts, should always be complemented by the visits to the coordinators
main facilities and to validate the stage of development of the expected
outcomes/pilot units/prototypes.
• It was also stated that the cancellation of projects, should be based on clear and pre-
defined criteria and milestones.
Calls
• There should be a more concentrated focus on some core R&D issues of bottleneck
nature.
• Some participants suggested that the topics could be more general in order to have
more flexibility to apply the needed research.
• Some funding schemes (like those from EASME for SMEs) should receive more funding
because too many good ideas are dropped due to the competition.

71
More and better designed national public support for energy technology Research and Innovation
7. Conclusions on the industry’s funding
needs
The majority of the 105 participants that provided feedback to this report came from Business
Companies (55%), while the second most represented type were Research Centres (28%)
followed by other types of entities such as Public Bodies and Education Institutions (11%).
Within the companies, the majority of the participants are SMEs followed by very large
companies, mainly active in the sector of Energy Systems, followed by Photovoltaics, Energy
Efficiency Solutions for Buildings, Energy Efficiency in Industry and Smart Cities.
From the analysis of the industry’s funding needs for the implementation of the SET Plan the
conclusions below can be obtained.
• As difficulties in accessing funding represent an obstacle for starting and growing a
business and the lack of finance prevents SMEs from investing in innovative projects,
improving their productivity, and seizing opportunities in expanding or new markets, the
large majority of participants considered that improved access to finance is needed to
boost SME scale-up.
• It was highlighted that there should be specific funding to follow up on projects that
produced working prototypes, to be scaled up and the majority of participants consider
that more funding is needed for demonstrators. It was highlighted by the most of
participants that there should be an investment focus for new business models.
• A vast majority of participants believe that EU funding needs to support industrial-scale
market-uptake and manufacturing in cutting edge technologies.
• The majority of participants also think that shared infrastructures should be available for
funded projects.
• It was suggested that funding programmes should take into account the changeable
reality during the lifetime of a project, which could mean that initially agreed activities
should be changed and modified to a new reality. More funding should be allocated to
successful projects so their results can then be open to the public.
• It was highlighted that some funding schemes (like the EIC Accelerator grant & equity
funding opportunity from EASME) should receive more funding because as these are
highly competitive opportunities too many good ideas are disregarded or do not receive
funding.
• The technology readiness level (TRL) should not be the only indicator to be considered
for receiving funding, given that they may not be relevant for energy R&D related projects

72
More and better designed national public support for energy technology Research and Innovation
where different parts of the system may be at very different levels of maturity, and where
some aspects (especially software ones) can move very rapidly from concept to
commercial implementation. Was also highlighted that TRL scale could be unclear for
instance in the definition of what is close to market and can be useful for pure
technological review but not for market and social impact for the project to be considered
successful. Another parameter that was suggested to be taken in consideration was the
TIL (Technology Impact Level).
• It was highlighted that some calls should not restrict the topics to certain areas and could
be more general in order to have more flexibility to apply the needed research.
• It was highlighted that a better balance between independent and centralized funding
options could be more efficient and that improved synergies and synchronization
between European programmes, but also between national and European programmes
are needed.
• Some of the participants consider that quick evaluation processes and a shorter project
duration will substantially contribute to make certain funding schemes more attractive.
• It was also highlighted that the published information and the info sessions are not always
enough even for specialists and that as funding mechanisms sometimes are too complex,
practical guidelines with the basic introduction to the different European funding
mechanisms could be useful.

73
More and better designed national public support for energy technology Research and Innovation
8. Annexes
Annex I – Questionnaire

74
More and better designed national public support for energy technology Research and Innovation

75
More and better designed national public support for energy technology Research and Innovation

76
More and better designed national public support for energy technology Research and Innovation

77
More and better designed national public support for energy technology Research and Innovation

78
More and better designed national public support for energy technology Research and Innovation

79
More and better designed national public support for energy technology Research and Innovation

80
More and better designed national public support for energy technology Research and Innovation

81
More and better designed national public support for energy technology Research and Innovation

82
More and better designed national public support for energy technology Research and Innovation
Annex II – Interview Guidelines
83
More and better designed national public support for energy technology Research and Innovation

84
More and better designed national public support for energy technology Research and Innovation

85
More and better designed national public support for energy technology Research and Innovation

86
More and better designed national public support for energy technology Research and Innovation
Annex III – Interviewer and interviewed companies The companies in the tables below were interviewed by some SMARTSPEND partners.
Partner who carried out the interview: ZABALA
Name of Participant Guglielmo Cioni
Entity TVP Solar
Nature of the entity Business Company
Sector Energy Systems, Energy Efficiency Solutions for Buildings, Energy Efficiency in Industry, Solar Thermal
Country Italy
Name of Participant Dr. Rainer Bacher
Entity BACHER ENERGIE AG
Nature of the entity Business Company
Sector Energy Systems
Country Switzerland
Name of Participant Eva Sass Lauritsen
Entity SEAS NVE
Nature of the entity Business Company
Sector Utilities
Country Denmark
Name of Participant Philippe Marchand
Entity TOTAL
Nature of the entity Business Company
Sector Bioenergy and renewable fuels
Country France

87
More and better designed national public support for energy technology Research and Innovation
Partner who carried out the interview: FNR
Name of Participant René Venendaal
Entity BTG Biomass Technology Group BV
Nature of the entity Business company
Sector Bioenergy and renewable fuels
Country The Netherlands
Name of Participant Lars Waldheim
Entity Waldheim Consulting
Nature of the entity Consultancy
Sector Energy systems, Bioenergy and renewable fuels
Country Sweden
Partner who carried out the interview: ECTP
Name of Participant Karine Laffont-Eloire
Entity DOWEL Management
Nature of the entity Business company
Sector Smart cities, energy systems, energy efficiency solutions for buildings, energy efficiency in industry
Country France
Partner who carried out the interview: WIP
Name of Participant Elena Rico
Entity ONYX SOLAR ENERGY SL
Nature of the entity SME
Sector BIPV
Country SPAIN
Name of Participant Julius Denafas
Entity Soli Tek R&D, UAB
Nature of the entity Business company
Sector Photovoltaics
Country Lithuania