analysis of site effects, building response and damage
TRANSCRIPT
Analysis of site effects, building response and damage distribution
observed due the 2011 Lorca destructive Earthquake.
Dr. Manuel Navarro
University of Almería (Spain)
10th International Workshop on Seismic Microzoning and Risk Reduction
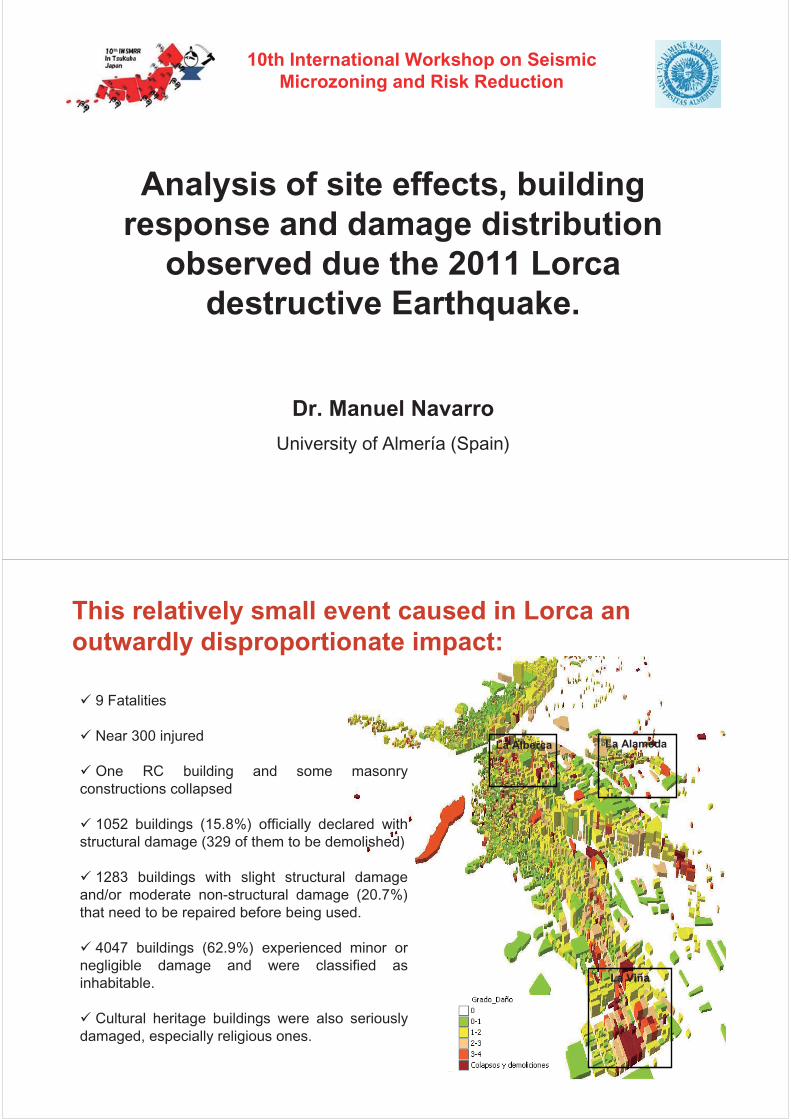
� 9 Fatalities
� Near 300 injured
� One RC building and some masonry
constructions collapsed
� 1052 buildings (15.8%) officially declared with
structural damage (329 of them to be demolished)
� 1283 buildings with slight structural damage
and/or moderate non-structural damage (20.7%)
that need to be repaired before being used.
� 4047 buildings (62.9%) experienced minor or
negligible damage and were classified as
inhabitable.
� Cultural heritage buildings were also seriously
damaged, especially religious ones.
This relatively small event caused in Lorca an outwardly disproportionate impact:
La Viña
La AlamedaLa Alberca

RC Building collapsed
44
Damage at Masonry structures

Damage at nonstructural elements
55The victims were due to detachments
nonstructural elements (sills, parapets, etc.)
66
Damage to heritageChurch of Santiago (XVIII)

Convent of Las Clarisas (XVII)
Damage to heritage
Damage to heritageFortaleza del Sol (IX-XV)

Effects on the ground. Landslides
TIME TIME (UTC)(UTC)
LATITUDLATITUDEE
LONGITUDELONGITUDE DEPTHDEPTHkmkm
MAGN.MAGN.mLg mLg
MAGN. MAGN. MwMw
MAX. INT. MAX. INT. (EMS)(EMS)
SEISMIC SEISMIC MOMENTMOMENT
(Nm)(Nm)
EPIC. EPIC. DIST.DIST.(km)(km)
15:05 37.72 N 1.70 W 5.1 4.5 4.6 VI 9.6x10¹⁵ 5.3
16:47 37.73 N 1.69 W 4.6 5.1 5.2 VII 6.5x10¹⁶ 5.5
1010
Mainshock (rock)
PGA = 0.37 g PGV = 35.4 cm/s PGD = 3.5 cm
The May 11th, 2011 Lorca destructive earthquake
Foreshock (rock)
PGA = 0.29 gPGV = 13.76 cm/sPGD = 1.1cm
The mainshock of Lorca seismic serie had Mw = 5.2. This event had a relevant foreshock with
Mw = 4.6 and maximum intensity VI two hours before (15:05, UTC), as well as a Mw 3.9
aftershock four hours later (20:37 UTC). It was followed by more than one hundred aftershocks
during the first month, 80% of them during the first week.
It shows a maximum at 2–3Hz and another
peak at 6Hz, in the decay zone of the spectrum.
Mainshock accelerogram recorded at LOR
station.
5 10 15 20 25-400
-200
0
200
400GROUND ACCELERATION AT STATION LOR
5 10 15 20 25-400
-200
0
200
400
ga
l
5 10 15 20 25-400
-200
0
200
400
time s
a-Z
a-NS
a-EW
Urban Geological cartography
The identification and classification of
urban geology of Lorca town was a
step to perform a geological mapping at scale 1:10,000 and to
interpret the spatial geometry of
geological formations.
Field data:
(a) 14 field-ground testing data
(b) 40 mechanical drillings
(c) 27 electrical geophysical tests
(IGME, 1992)
(d) 10 shallow refraction profiles
(IGME, 1992)
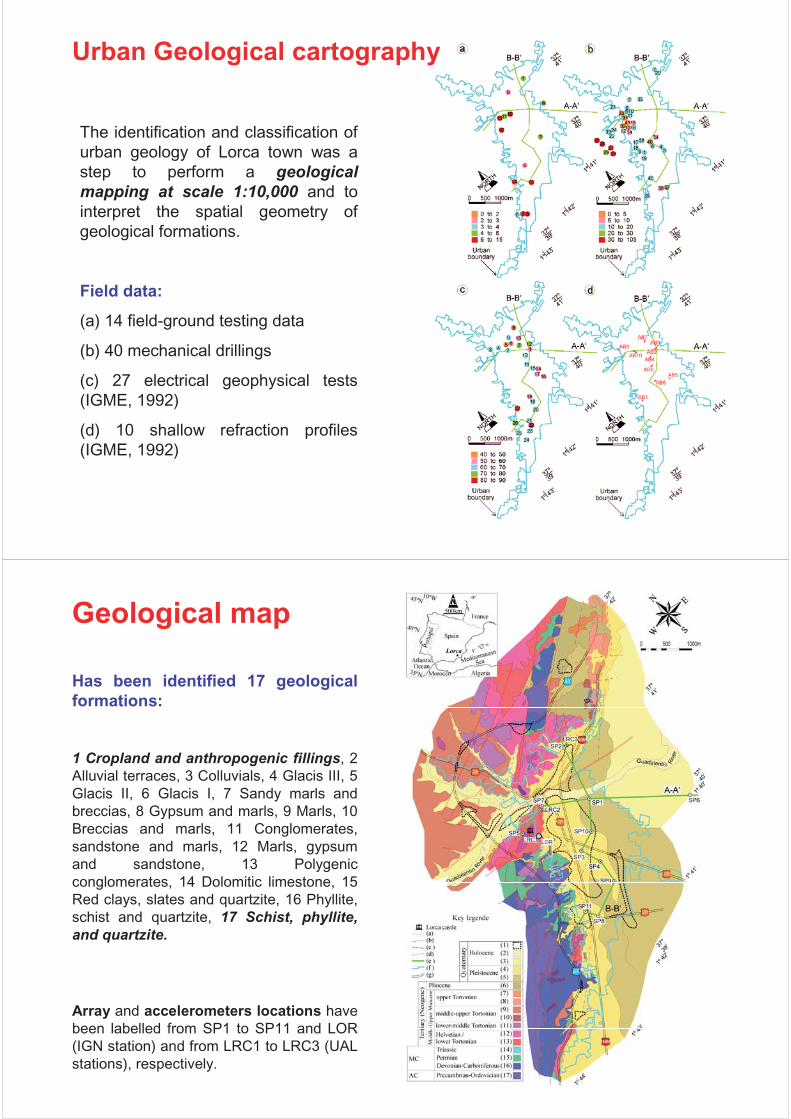
Geological map
Has been identified 17 geological formations:
1 Cropland and anthropogenic fillings, 2
Alluvial terraces, 3 Colluvials, 4 Glacis III, 5
Glacis II, 6 Glacis I, 7 Sandy marls and
breccias, 8 Gypsum and marls, 9 Marls, 10
Breccias and marls, 11 Conglomerates,
sandstone and marls, 12 Marls, gypsum
and sandstone, 13 Polygenic
conglomerates, 14 Dolomitic limestone, 15
Red clays, slates and quartzite, 16 Phyllite,
schist and quartzite, 17 Schist, phyllite, and quartzite.
Array and accelerometers locations have
been labelled from SP1 to SP11 and LOR
(IGN station) and from LRC1 to LRC3 (UAL
stations), respectively.
LOR

VS30 velocity structure
The shallow geological structure of Lorca
town has been studied using a Spatial Autocorrelation method (SPAC).
The measurements were carried out at
eleven open spaces, obtaining Shear-
wave velocity profiles from the Rg-wave
dispersion curves by means of inversion
procedure.
Vertical components of ground motion were
recorded at the surface using circular arrays. Five sensors surrounding a sixth
central sensor with same characteristics
were used.
Different radii were used depending on the
dimensions of the open areas.
Examples of Rg-wave dispersion curves
Shallow Shear-wave velocity structure has
been obtained from Rg-wave phase velocities
by using an iterative inversion method.
Finally, the average shear-wave velocity of the
uppermost 30m (VS30) has been finally
computed for each model.
Inversion of S-wave profiles
���� ����� �� ������ ���������� ���� ������
��� ����� ���� ����� ��� ����� ��� ������ ������ ���� ����� ��� ����� ���� ������ ����� ��� ����� ��� ����� ��� ������ �� � ���� ����� ��� ����� ��� ������ ����� ���� ����� ��� ����� ��� ���� ����� ��� ����� ��� ����� ��� ������ ������ ���� ����� ��� ���� ��� ������ ����� ���� ����� ��� ����� ��� ������ ����� ���� ����� ��� ����� ��� ������� ����� ���� ��� � ��� �� � ��� ������� ����� ���� ����� ��� ����� ��� ���

The 17 geological formations identified in Lorca
town have been clustered into 5 main
geological/seismic formations:
Soil classification map according to EC8 (1998)
FormationGeological formations
EC8-ground class
VS30 values range
(ms-1)
1
Cropland and anthropogenic
fillings of variable thickness overlaying
Pleistocene glacis.
D < 180
2
Unconsolidated Holocene
colluvials and alluvial terraces
belong to the Guadalentin River
valley.
C 220-380
3The Pliocene and Pleistocene glacis B2 340-580
4
The lower-to-upper Tortonian post-
orogenic medium-hard bedrock
B1 660-800
5
Pre-orogenic Triassic carbonate hardest bedrock
Pre-Triassic metamorphic
hardest bedrock
A
800-1000
>1000
3.- Computation of HVSR and predominant period
� Three-component ambient vibrations were
recorded at 82 sites of a 400m x 400m grid.
� Nakamura´s method (Horizontal-to-Vertical
Spectral Ratio, HVSR; Nakamura, 1989) was
applied to obtain the predominant period of
each site.
� The shorter predominant periods are less
than 0.15 s for the pre-Triassic hard-rock sites.
�The Miocene medium-hard rock sites provides
values between 0.15 and 0.3 s.
� The Pliocene and the older Pleistocene glacis
formations show values in the 0.2-0.5 s range.
� The predominant periods are larger than 0.5
s for the latest Pleistocene glacis formations
and the Holocene alluvial fan deposits from the
Guadalentin River in the centre and eastern
parts of the town.

Site amplificationClassical spectral ratio
An elemental local array composed of 3 strong-
motion stations (ETNA-KINEMETRICS) was
deployed in different parts of Lorca town from
March 2004 to October 2008.
Example of simultaneous recorded acceleration time histories
in Lorca town (mb=3.7 and epicentre distance 25.8 km)
Fourier spectra were calculated using a
time window containing S and coda
waves, and the classical spectral ratios
between the stations over Pleistocene
glacis and the reference station (Miocene
medium-hard bedrock) were calculated.
The average amplification at LRC2
station is around three in the band from
0.1 to 0.2 s. The LRC3 station shows an
average amplification of four for the
periods less than 0.1 s.
Average spectral amplifications obtained from classical spectral ratios (solid-bold blue lines) and standard deviation (solid-dotted black line). (a) LRC2 station; (b) LRC3 station.
Average spectral amplifications(a)LRC2
(b)LRC3

Comparison between calculated transfer function by using classical spectral ratios and HVSR of ambient noise
The spectral amplification bands obtained
from classical spectral ratio and from
HVSR of ambient noise are quite similar.
The different average amplifications
obtained from these techniques at
frequencies over about 1s evidence
instability or larger statistical uncertainties
in this band.
Comparison between calculated transfer function by using
classical spectral ratios (red line) and HVSR of ambient noise
(blue line). (a) LRC2 station; (b) LRC3 station.
LRC2
LRC3
5 10 15 20 25-400
-200
0
200
400GROUND ACCELERATION AT STATION LOR
5 10 15 20 25-400
-200
0
200
400
gal
5 10 15 20 25-400
-200
0
200
400
time s
a-Z
a-NS
a-EW
Ground motion simulation at different sites.

LRC2 LRC3
Comparison between calculated transfer function, HVSR and simulated 1-D transfer function.
Strong ground motion parametersFor the record of the LOR station, and the
simulated accelerograms at the SPAC points, a
set of representative strong motion parameters
were calculated to characterize quantitatively the
shake severity at these points.
SP
1
SP
2
SP
3
SP
4
SP
5
SP
6
SP
7
SP
8
SP
9
SP
10
SP
11
LO
R
VII
VIII
10
100
1000
PG
A g
al
SP
1
SP
2
SP
3
SP
4
SP
5
SP
6
SP
7
SP
8
SP
9
SP
10
SP
11
LO
R
VII
VIII
1
10
100
1000
AI
cm/s
SP
1
SP
2
SP
3
SP
4
SP
5
SP
6
SP
7
SP
8
SP
9
SP
10
SP
11
LO
R
VII
VIII
10
100
1000
CA
V c
m/s
� The PGA and PGV
� The Arias intensity (Arias 1969)
� The Cumulative Absolute Velocity(CAV)
� !
"#�
�=�
���π
� �= −
=$
%
%
%
� &"�� �
�
SP
1
SP
2
SP
3
SP
4
SP
5
SP
6
SP
7
SP
8
SP
9
SP
10
SP
11
LO
R
VII
VIII
1
10
100
SI
cm/s
* Parameter for the European record
sets associated to local intensities of
VII and VIII (EMS scale).
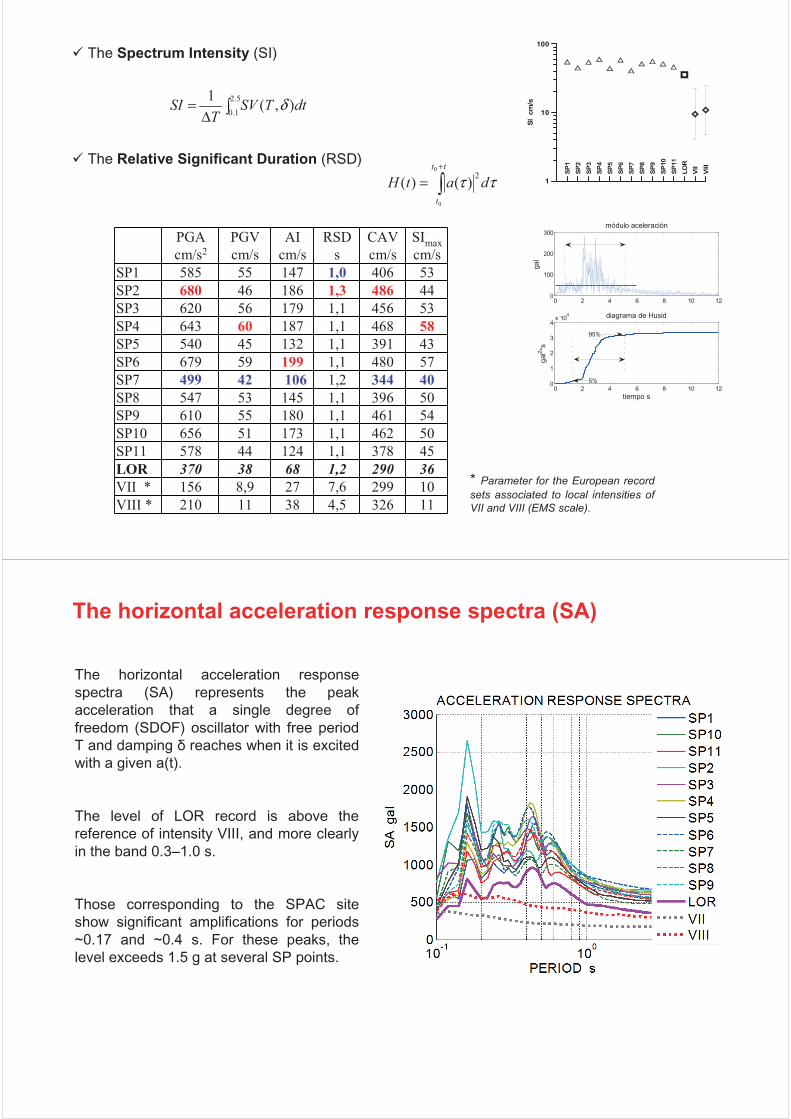
� The Spectrum Intensity (SI)
� The Relative Significant Duration (RSD)
�'���(��
�'���(�
����(�
�)�
�����(�
����*��(�
��� ��� �� ��� �+� ��� ����� �� �� ��� �+� �� ����� ��� �� ��� ��� ��� ����� ��� � ��� ��� ��� ���� ��� �� ��� ��� ��� ����� ��� �� ��� ��� ��� ����� ��� �� �� ��� ��� ����� ��� �� ��� ��� ��� ����� ��� �� ��� ��� ��� ������ ��� �� ��� ��� ��� ������ ��� �� ��� ��� ��� ��,-� ��� �� �� �� � �������. ��� ��� �� ��� ��� �������. ��� �� �� ��� ��� ��
�Δ= ���
��� ��� � /� /
�# δ
�+
=
�� ��
�
��� ττ
0 2 4 6 8 10 120
1
2
3
4x 10
4
tiempo s
gal2
*s
diagrama de Husid
0 2 4 6 8 10 120
100
200
300
ga
l
módulo aceleración
5%
95%
The horizontal acceleration response
spectra (SA) represents the peak
acceleration that a single degree of
freedom (SDOF) oscillator with free period
T and damping � reaches when it is excited
with a given a(t).
The level of LOR record is above the
reference of intensity VIII, and more clearly
in the band 0.3–1.0 s.
Those corresponding to the SPAC site
show significant amplifications for periods
~0.17 and ~0.4 s. For these peaks, the
level exceeds 1.5 g at several SP points.
The horizontal acceleration response spectra (SA)

5. Dynamic Properties of Existing RC buildings
Changes in the fundamental translational period (T)
and damping ratio (h) of a set of buildings in Lorca
town (SE of Spain) have been examined, affected
by the May 11th, 2011 earthquake.
These building parameters have been calculated
from ambient vibration measurements, recorded at
top RC buildings pre- and post earthquake, using
the Fast Fourier Transform and the Randomdec
technique.
Before the earthquake sequence, the total number
of measured buildings was 59, with a number of
storeys range from 2 to 12.
34 buildings were measured again after the
earthquake using the same methodology. 23 of
them measured also before the earthquake.
Examples of amplitude spectra of the transverse
component for buildings with 3, 6, 9 and 12 floors,
respectively.
Example of damping evaluation by Random
Decrement Technique. (a) Ambient noise
record obtained at the top of LRC20 building.
(b) Amplitude spectrum, (c) Damped response of the building.
Average values of natural periods and damping
factors corresponding to each number of storey,
obtained pre- and post-earthquake for all building
set.
NS = number of storey; NB = number of buildings.
Relationships between the average natural period (T) and the number of storeys (N) for RC
buildings obtained from ambient noise analysis
for undamaged [T(N)] and damaged buildings [T*(N)].
Fundamental Translational Period
0�� 01� ���� 01�� ��������� �� ����2����� �� �����2�������� �� ����2����� �� �����2�������� �� ����2����� �� �����2�������� �� ����2����� �� �����2�������� �� ����2����� �� �����2�������� �� ����2����� �� �����2�������� �� ����2����� �� �����2�������� �� ����2����� �� �����2��������� �� ����2����� �� �����2��������� �� ����2����� �� �����2��������� �� ����2����� �� �����2��������� �� �� �� �����2������

Average values of natural periods corresponding to each number of storey, obtained pre-
and post-earthquake for 23 damaged buildings of Lorca.
T(N) relationships for different degree of damage
0�� 01� 3�4�� 01�� 3���4���� �� ����2����� �� �����2�������� �� ����2����� �� �����2�������� �� ����2����� �� �����2�������� �� ����2����� �� �����2�������� �� ����2����� �� �����2�������� �� ����2����� �� �����2�������� �� ����2����� �� �����2�������� �� ����2����� �� �����2��������� �� ����2����� �� �����2��������� �� ����2����� �� �����2��������� �� ����2����� �� �����2��������� �� �� �� �����2������
Relationship between the average damping
factor (h) and the number of floors (N) for RC
buildings of Lorca town obtained from ambient noise measurements.
Average values of damping factors corresponding to
each number of storey, obtained pre- and post-earthquake for all building set.
h(N) relationships for different degrees of damage
h = (12.8±2.0) N (-0.87±0.12)
h* = (7.3±1.4) N (-0.71±0.13)

Conclusions:
� The high acceleration values can be attributed to the proximity of the source fault, the near-
field directivity effect (López-Comino et al. 2012) and the local site effect.
� Geological materials have been clustered into 5 geological/seismic formations according to
the Eurocode 8. The most widespread EC8 soil class is B2 (360-500 ms-1) followed by B1(500-
800 ms-1). Class C (180-360 ms-1) also covers a significant part of the urban area.
� The general trend of ground predominant periods is grow as the thickness of Quaternary
formations increases.
� The values obtained from strong ground motion parameters at the LOR station and at the
simulation points correspond to intensity degree (EMS scale) of not less than VIII.
� The high values of HARS (SA >1.5 g) in the period ~0.17 s and in the band 0.3–0.5 s can
explain the serious structural damage in buildings with fundamental period in this range.
� Damping factor does not show a significant variation with earthquake damage degree. This
result suggest that damping factor parameter is not good indicator of damage in structures.
� Significant variations of T (>20%) indicate the occurrence of damage in buildings. Small
variations of T (10–20%) indicate change in stiffness of buildings although damage evidences
are not detected visually. This result shows that natural period parameter is a good indicator of
damage in structures.
Working Group
Manuel Navarro University of Almería (Spain) [email protected]
Francisco Vidal University of Granada (Spain) [email protected]
Gerardo Alguacil University of Granada (Spain) [email protected]
Takahisa Enomoto University of Kanagawa (Japan) [email protected]
Antonio García-Jerez University of Granada (Spain) [email protected]
Francisco Alcalá Technical University of Lisbon (Portugal)[email protected]