scaling effects on damage development, strength, and
TRANSCRIPT

Scaling Effects on Damage Development, Strength, and Stress-Rupture Lifeof
Laminated Composites in Tension
J. André Lavoie
Dissertation submitted to the Faculty of the Virginia Polytechnic Institute and State Universityin partial fulfillment of the requirements for the degree of
Doctor of Philosophyin
Engineering Mechanics
John Morton, ChairWilliam A. Curtin, Co-Chair
Kenneth L. ReifsniderKaren E. JacksonDon H. MorrisMark S. Cramer
April 4th, 1997Blacksburg, Virginia
Keywords: strength scaling, size effects, microcracking, first-ply failure, delamination, compositematerial, Weibull statistics, tension testing, flexural testing, carbon/epoxy, glass/epoxy, creep,stress-rupture, creep-rupture, stress relaxation, stress-corrosion cracking, durability, life.

Scaling Effects on Damage Development, Strength, and Stress-Rupture Lifeof Laminated Composites in Tension
J. André Lavoie
(ABSTRACT)
The damage development and strength of ply-level scaled carbon/epoxy compositelaminates having stacking sequence of [+θn/-θn/902n]s where constraint ply angle, θ, was 0°, 15°,30°, 45°, 60°, and 75°, and size was scaled as n=1,2,3, and 4, is reported in Part I. X-radiographywas used to monitor damage developments. First-ply failure stress, and tensile strength wererecorded. First-ply failure of the midplane 90° plies depended on the stiffness of constraint plies,and size. All 24 cases were predicted using Zhang’s shear-lag model and data generated from[02/902]s cross-ply tests. Laminate strength was controlled by the initiation of a triangular-shapedlocal delamination of the surface angle plies. This delamination was predicted using O’Brien’sstrain energy release rate model for delamination of surface angle plies. For each ply angle, thesmallest laminate was used to predict delamination (and strength) of the other sizes.
The in-situ tensile strength of the 0° plies within different cross-ply, and quasi-isotropiclaminates of varying size and stacking sequence is reported in Part II. No size effect was observedin the strength of 0° plies for those lay-ups having failure confined to the gauge section. Laminatesexhibiting a size-strength relationship, had grip region failures for the larger sizes. A statisticallysignificant set of 3-point bend tests of unidirectional beams were used to provide parameters for aWeibull model, to re-examine relationship between ultimate strength of 0° plies and specimenvolume. The maximum stress in the of 0° plies in bending, and the tensile strength of the of 0°plies (from valid tests only) was the same. Weibull theory predicted loss of strength which wasnot observed in the experiments.
An effort to model the durability and life of quasi-isotropic E-glass/913 epoxy compositelaminates under steady load and in an acidic environment is reported in Part III. Stress-rupturetests of unidirectional coupons immersed in a weak hydrochloric acid solution was conducted todetermine their stress-life response. Creep tests were conducted on unidirectional coupons paralleland transverse to the fibers, and on ±45° layups to characterize the lamina stress- and time-dependent compliances. These data were used in a composite stress-rupture life model, based onthe critical element modeling philosophy of Reifsnider, to predict the life of two ply-levelthickness-scaled quasi-isotropic laminates.
Keywords: strength scaling, size effects, microcracking, first-ply failure, delamination, compositematerial, Weibull statistics, tension testing, flexural testing, carbon/epoxy, glass/epoxy, creep,stress-rupture, creep-rupture, stress relaxation, stress-corrosion cracking, durability, life.
This work was supported by the US Army Research Laboratory under NASA grant NAS1-19610, No. 15, by the U.K. Ministry of Defence, and by the Virginia Institute for MaterialSystems.

iii
ACKNOWLEDGMENTS
The author acknowledges the financial support of the US Army Research Laboratory forfinancial support under NASA grant NAS1-19610, No. 15, monitored by Dr. Karen Jackson.Additional financial support from the Virginia Institute for Material Systems, made possible byProf. Ken Reifsnider, is gratefully acknowledged. Dr. Jackson’s careful reading of drafts of myvarious papers was very helpful. A visit to the Royal Institute of Technology, Stockholm, wasundertaken to collaborate with Professor Peter Gudmundson and his student, Erik Adolfsson, andwould not have been possible without a tuition waiver. Erik was a pleasure to work with, andgave freely of his time. At the Structural Materials Centre (SMC), Defence Research Agency, inFarnborough, England, the author received support from many people in different groups whileworking on the stress-rupture project. Prof. Paul Curtis authorized composite plate fabrication,and Dr. Phil Powell arranged financing for Andrew Renshaw, a sandwich student, to help withcreep and stress-rupture testing, and Mr. Bill Mitten allowed free access to the creep lab.
The author extends thanks to Dr. Costas Soutis at Imperial College for being a friend andtaking special interest in the work. Dr. Paul Smith at the University of Surrey, Prof. Frank Jonesat the University of Sheffield, Mr. Micheal G. Phillips at the University of Bath, and Dr. PaulHogg at Queen Mary and Westfield College made time for helpful discussions. Prof. Kenneth L.Reifsnider provided helpful guidance during the literature review and proposal phase of theresearch, by steering me toward experimentation. The author is especially grateful to Dr. JohnMorton, committee chair and Director of the SMC, for providing me opportunities, especially theopportunity to spend one year pursuing my studies at the SMC. Prof. Bill Curtin, co-chair,provided further guidance, and help analyzing data.
The author wishes to thank his wife, Chiara, for her love and support during the longmonths of their separation while he pursued his research abroad. Her forgiveness is replied with apromise to avoid long separations again.

iv
TABLE OF CONTENTS
Page
ABSTRACT.....................................................................................................................................iiACKNOWLEDGEMENTS ..........................................................................................................iiiTABLE OF CONTENTS...............................................................................................................ivLIST OF TABLES.........................................................................................................................viiLIST OF FIGURES......................................................................................................................viii
Part I. Effects of Size, Constraint and Thickness, on Damage Initiation, Growth,and Strength of [+θn/-θn/902n]s Composite Laminates ......................................................................1
Abstract .............................................................................................................................11. Introduction .......................................................................................................................22. Materials And Specimens..................................................................................................42.1. Materials And Laminates...................................................................................................42.2. Specimen Preparation........................................................................................................43. Analysis.............................................................................................................................63.1. Model for First-Ply Failure................................................................................................63.2. Model for Stress-Strain Response while Laminate is Cracking.........................................73.3. Model for Strength of Angle-Ply Laminates .....................................................................84. Results...............................................................................................................................94.1. Thermal Stress-Induced Matrix Cracking..........................................................................94.2. Mechanical Testing: Stress-Strain Response ..................................................................114.3. First-Ply Failure: Effects of Constraint and Thickness...................................................114.4. Effects of Constraint Ply Orientation on Interlaminar and Intralaminar Matrix
Cracking Due to Tensile Loading ....................................................................................124.4.1. Damage Progression for Constraint Plies at ±15° ...........................................................124.4.2. Damage Progression for Constraint Plies at ±30° ...........................................................124.4.3. Damage Progression for Constraint Plies at ±45° ...........................................................124.4.4. Damage Progression for Constraint Plies at ±60° ...........................................................134.5. Damage and the Response of [(+60/-60/902)2]s Lay-Up..................................................134.6. Delamination of Surface +θ° Plies and Prediction of Strength........................................145. Discussion.......................................................................................................................155.1. First-Ply Failure...............................................................................................................155.2. “Stitch” Crack Formation................................................................................................165.3. Stress-Strain Response of the [(+60/-60/902)2]s Lay-Up..................................................175.4. Strength of [+θn/-θn/902n]s Laminates ..............................................................................176. Conclusions.....................................................................................................................177. References .......................................................................................................................18

v
Part II. Strength Scaling of Composite Laminates Amidst Invariant 0° Ply Strength .................49Abstract ...........................................................................................................................49
1. Introduction .....................................................................................................................492. Materials and Specimens.................................................................................................523. Analysis...........................................................................................................................533.1. Prediction of 0° Laminae Strength Using Weibull Theory..............................................533.2. Calculation of Stress in the 0° Plies.................................................................................543.3. Calculation of Maximum Stress for the Three-Point Bend Test......................................554. Results.............................................................................................................................564.1. Three-Point Bend Tests ...................................................................................................564.2. Tensile Test Results with Comparison to Weibull Prediction..........................................574.2.1. Tensile Tests of [0]8n and [02n/902n]s ................................................................................574.2.2. Tensile Tests of [90n/0n/90n/0n]s, [90/0/90/0]ns, and [+45/-45/0/90]ns ...............................584.2.3. Tensile Tests of [+45n/-45n/0n/90n]s .................................................................................594.3. Width and End Tab Effects on Strength of [+45n/-45n/0n/90n]s.......................................604.3.1. Effect of Specimen Width on Strength............................................................................604.3.2. Effect of End Tab on Strength.........................................................................................615. Discussion.......................................................................................................................625.1. Grip Failures in the [0]8n and [02n/902n]s Specimens.........................................................625.2. Stress Concentration Due to 90° Matrix Cracks..............................................................625.3. Adjustments Made to Strain Data....................................................................................635.4. Stiffness Change, Failure Strain and Laminate Strength.................................................635.5. Error in Extending Weibull Theory to Unidirectional Composites .................................635.6. Explanation for Grip Failures in Unidirectional Composites...........................................645.7. Future Work: Improved Unidirectional Strength Test Methods.....................................646. Conclusions.....................................................................................................................657. References .......................................................................................................................66
Part III.Prediction of Stress-Rupture Life of Glass/Epoxy Laminatesin an Acidic Environment from Lamina Behavior ..........................................................87Abstract ...........................................................................................................................87
1. Introduction .....................................................................................................................872. Experiments ....................................................................................................................882.1. Materials and Specimen Preparation................................................................................882.2. Quasi-Static Tensile Testing ............................................................................................902.3. Creep and Stress-Rupture Testing ...................................................................................902.3.1. Strain Measurement.........................................................................................................902.3.2. Environmental Conditioning ...........................................................................................902.3.3. Creep Tests......................................................................................................................91

vi
2.3.4. Stress-Rupture Tests........................................................................................................913. Stress-Rupture Life Modeling .........................................................................................913.1. Estimation of Remaining Strength and Life ....................................................................923.2. Modeling Loss of Strength in the Unidirectional Plies ....................................................933.3. Creep Model of Compliance Change...............................................................................943.4. Other Mechanisms Influencing Life................................................................................954. Results.............................................................................................................................954.1. Quasi-Static Strength Tests and Damage Characterization ..............................................954.1.1. Unidirectional [0]8 Specimens.........................................................................................954.1.2. Quasi-Isotropic Specimens..............................................................................................954.2. Viscoelastic Creep Tests..................................................................................................964.2.1. Lamina Creep Characterization........................................................................................964.2.2. Quasi-Isotropic Creep Data and Predictions....................................................................974.3. Stress-Rupture Tests and Damage Developments...........................................................984.3.1. Stress-Rupture of Unidirectional [0]2 Specimens............................................................984.3.2. Stress-Rupture of Quasi-Isotropic [0/90/+45/-45]s Specimens .......................................994.4. Stress-Rupture Life Predictions.....................................................................................1005. Discussion.....................................................................................................................1005.1. Quasi-Static Tensile Strength Data ................................................................................1005.1.1. Unidirectional [0]8 Tensile Tests....................................................................................1005.1.2. Quasi-Isotropic Specimens............................................................................................1015.2. Creep Test Data .............................................................................................................1015.2.1. Unidirectional [0]2 Creep Tests......................................................................................1025.2.2. Fitting Curves to the [+45/-45/+45/-45]s Creep Tests....................................................1025.2.3. Moisture Absorption Effects on Creep Response and Life ...........................................1025.3. Stress-Rupture Life........................................................................................................1035.3.1. Experimental Variability................................................................................................1035.3.2. Model Predictions..........................................................................................................1035.3.3. Effect of “n” on Stress-Rupture Life of [0]n Unidirectional Specimens........................1035.3.4. Other Damages to the Sub-Critical Elements: Observed, Yet Unaccounted For..........1045.4. Future Work..................................................................................................................1046. Conclusions...................................................................................................................1057. References .....................................................................................................................105
Appendix: Stress-Rupture Life FORTRAN Code........................................................140Vita...............................................................................................................................................145

vii
LIST OF TABLES
Part I
Table 1. Specimen sizes and dimensions ...................................................................................23Table 2. Mechanical properties of [+θn/-θn/902n]s laminates for differing size, n........................23Table 3. Thermal stress-induced 90° crack density of [+θn/-θn/902n]s.........................................23Table 4. Count of thermal stress-induced cracks in +θ° plies ....................................................23Table 5. Length and density of cracks in -θ° plies......................................................................24Table 6. Stiffnesses and strain energy release rate for delamination of +θ° plies.......................24Table 7. Experimental results for strength of [+θn/-θn/902n]s laminates......................................25
Part II
Table 1. Specimen dimensions...................................................................................................68Table 2. Detail about end tabs used on quasi-isotropic [+45n/-45n/0n/90n]s
specimens................68Table 3. Unidirectional [0]8n strength, and failure strain .............................................................68Table 4. Unidirectional [0]8n, strength, failure strain, and location of failure...............................69Table 5. Cross-ply [02n/902n]s strength, failure strain, and 0° stress............................................69Table 6. Cross-Ply [02n/902n]s, strength, failure strain, and location of failure.............................70Table 7. Cross-ply [90n/0n/90n/0n]s strength, failure strain, and 0° stress.....................................70Table 8. Cross-ply [90/0/90/0]ns strength, failure strain, and 0° stress........................................71Table 9. Quasi-isotropic [+45/-45/0/90]ns strength, failure strain, and 0° stress .........................71Table 10. Quasi-isotropic [+45n/-45n/0n/90n]s
strength, failure strain, and 0° stress (Johnson) .....72Table 11. Quasi-isotropic [+45n/-45n/0n/90n]s
strength, failure strain, and 0° stress (Kellas).........72Table 12. Quasi-isotropic [+45n/-45n/0n/90n]s
strength, failure strain, and location of failure ........73Table 13. Experimental results for ultimate strength of scaled [+45n/-45n/0n/90n]s
laminates........74Table 14. Effect of end tab on strength of quasi-isotropic [+45n/-45n/0n/90n]s
specimens.............74
Part III
Table 1. Elastic and strength properties of E-glass/913............................................................108Table 2. Elastic properties of E-glass/913 from creep test data...............................................108Table 3. Stress-rupture life results............................................................................................109

viii
LIST OF FIGURES
Part I.
Figure 1. X-ray of fabrication microcracks in the [+154/-154/908]s layup ...............................26Figure 2. X-ray of fabrication microcracks in the [+304/-304/908]s layup ...............................27Figure 3. X-ray of fabrication microcracks in the [+454/-454/908]s layup ...............................28Figure 4. Typical stress/strain plots for [+θn/-θn/902n]s laminates...........................................29Figure 5. Plots of first-ply failure of [+θn/-θn/902n]s laminates...............................................30Figure 6. Development of -15/90 interface failure at 90° crack tips.......................................31Figure 7. Edge view of inclined secondary cracks in the 90° plies, with 90°
crack-tip delaminations and continuous -15/90 interface delamination..................32Figure 8. X-ray of localized delaminations associated with the -15/90 local delamination.....33Figure 9. Edge view of development of -30/90 delamination from the 90° crack .................34Figure 10. X-ray of deep delamination of the -30/90 interface along 90° crack tips ................35Figure 11. X-ray of effect of edge polish on damage sequence in a [+30/-30/902]s layup........36Figure 12. Edge view of growth of a -30° crack from a 90° crack at the -30/90 interface.......37Figure 13. Internal section showing cracks in a [+454/-454/908]s laminate, before loading.......38Figure 14. Internal section of a [+45/-45/902]s specimen loaded to failure...............................39Figure 15. An internal section of a [+452/-452/904]s laminate ...................................................40Figure 16. X-ray of 90° cracks and -60° stitch cracks in a [+60/-60/902]s layup......................41Figure 17. X-ray, 90° cracks and +/-60° cracks in a [+60/-60/902]s layup, loaded further.......41Figure 18. Edge view of a [(+60/-60/902)2]s laminate ..............................................................42Figure 19. X-ray of cracks in a sublaminate-scaled [(+60/-60/902)2]s laminate........................43Figure 20. Modeled vs. actual stress/strain response of [(+60/-60/902)2]s laminate..................44Figure 21. X-ray of +15° delaminations..................................................................................45Figure 22. X-ray of +45° delaminations..................................................................................46Figure 23. Photographs of failed [+θ3/-θ3/906]s laminates.......................................................47Figure 24. The strength scaling of [+θn/-θn/902n]s laminates ....................................................48
Part II.
Figure 1. Schematic of the 3-point bend test..........................................................................75Figure 2. Fracture profile of a 3-point bend specimen ...........................................................75Figure 3. Typical load vs. displacement trace for a 3-point bend test.....................................76Figure 4. Survivability vs. stress for unidirectional [0]32 beams in 3-point bending ..............77Figure 5. Stress vs. strain plots of [02n/902n]s .........................................................................78Figure 6. Plot of stress at failure of 0° plies for unidirectional [0]8n and [02n/902n]s ................79

ix
Figure 7. Plot of stress at failure of 0° plies for [90n/0n/90n/0n]s, [90/0/90/0]ns,and quasi-isotropic [+45/-45/0/90]ns .......................................................................80
Figure 8. X-ray of delamination in [+45n/-45n0n/90n]s layups loaded near failure...................81Figure 9. Constraint effect on the fracture profile for two sizes of quasi-isotropic layups .....82Figure 10. Typical grip failures for the [+453/-453/03/903]s laminate.........................................83Figure 11. Plot of stress at failure of 0° plies for [+45n/-45n/0n/90n]s coupons..........................84Figure 12. Strength of the [+45n/-45n/0n/90n]s laminate for different thickness and width ........85Figure 13. Representative stress vs. strain plots of [+45n/-45n/0n/90n]s .....................................86
Part III.
Figure 1. Creep frame with specimen and extensometers....................................................110Figure 2(a). 0° specimen showing clamped end tabs...............................................................111Figure 2(b). Alignment fixture for end tabs..............................................................................112Figure 3. Close-up view of the acid cell...............................................................................113Figure 4(a). Fracture of [0]8 quasi-static tensile specimen........................................................114Figure 4(b). Representative fracture profile of a quasi-static tensile test of
[0/90/+45/-45]s E-Glass/913-epoxy laminate.......................................................115Figure 4(c). Representative fracture profile of a quasi-static tensile test of
[02/902/+452/-452]s E-Glass/913-epoxy laminate...................................................116Figure 5. Creep results for constant stress tests of [0]2 E-glass/913-epoxy in
0.01 molar HCl acid bath......................................................................................117Figure 6. Creep results for 200 MPa constant stress tests of [0]2.........................................118Figure 7. Creep results for constant stress tests of [0]2 ........................................................119Figure 8. Linearized Findley fit to S11(t) compliance vs. time data.......................................120Figure 9. Examination of quality of fit early in the life for S11 .............................................121Figure 10. Linearized Findley fit to experimentally determined S22(t) vs. time data...............122Figure 11. Schapery’s quadratic fitting function fit to S66(t) data ...........................................123Figure 12. Creep results for 128 MPa constant stress tests of [0/90/+45/-45]s ......................124Figure 13. Creep results for 112 MPa constant stress tests of [0/90/+45/-45]s ......................125Figure 14. Creep results for 80 MPa constant stress tests of [0/90/+45/-45]s .......................126Figure 15. Creep results for 154 MPa constant stress tests of [02/902/+452/-452]s ..................127Figure 16. Creep results for 124 MPa constant stress tests of [02/902/+452/-452]s ..................128Figure 17. Creep results for 108 MPa constant stress tests of [02/902/+452/-452]s ..................129Figure 18. Predicted and experimental creep vs. time response of quasi-isotropic layup.......130Figure 19. Representative fracture profile of stress-ruptured [0]2 having a higher stress
(225 MPa), and shorter life (18.7 hours)..............................................................131Figure 20. Representative fracture profile of stress-ruptured [0]2 layup having a lower
stress (185 MPa), and longer life (41 hours).......................................................132

x
Figure 21. Fit to experimentally determined [0]2 stress-rupture life data................................133Figure 22. Representative fracture profile of stress-ruptured [02/902/+452/-452]s
having a higher stress (154 MPa), and shorter life (13.0 hours)...........................134Figure 23. Schematic of the formation of a stress-corrosion crack in the surface 0°-ply.......135Figure 24. Representative fracture profile of stress-ruptured [0/90/+45/-45]s layup ..............136Figure 25. Representative fracture profile of stress-ruptured [02/902/+452/-452]s layup ..........137Figure 26. Prediction of the life of a [0/90/+45/-45]s laminate ...............................................138Figure 27. Prediction of the life of a [02/902/+452/-452]s laminate ...........................................139

1
Part I
Effects of Size, Constraint and Thickness, on Damage Initiation, Growth,and Strength of [+θn/-θn/902n]s Composite Laminates
Abstract
An experimental investigation of damage development and strength was conducted on ply-level scaled carbon/epoxy composite laminates having stacking sequence of [+θn/-θn/902n]s wherethe constraint ply angle, θ, was 0°, 15°, 30°, 45°, 60°, and 75°, and size was scaled as n=1,2,3,and 4. Photomicrography and x-radiography were used to monitor damage development withtensile load. Subcritical damage development before complete failure was dependent upon theconstraint ply angle, θ, for their mode, but the size affected the initiation stress, and rate ofdevelopment. Damage in the form of high density matrix cracking in plies adjacent to plies with amajor matrix crack appeared due to thermal residual stress, and after monotonic loading. Tohighlight the significance of the failure mode on elastic properties of particular damaged lay-ups,the [(+60/-60/902)2]s lay-up was tested, and its stress-strain response compared to that predictedfrom Gudmundson’s model (Gudmundson, Östlund, and Zang, 1993).
Measurements of first-ply failure stress, and tensile strength were made. First-ply failureof the midplane 90° plies was shown to depend on the level of constraint, and the scale factor, n.The strain energy release rate for matrix microcracking was computed from first-ply failure data ofthe [02/902]s laminate. Then, first-ply failure was predicted from Zhang’s model (Zhang, Fan, andSoutis, 1993) for all other lay-ups and sizes, accounting for both constraint and size. Tensilestrength was predicted using O’Brien’s strain energy release rate model for delamination ofsurface angle plies. A delamination energy value for each ply angle was calculated from thesmallest (n=1) laminates to predict delamination (and strength) of the n=2, 3, and 4 sizes. Thepredictions were successful because strength was controlled by the initiation of a triangular-shapedlocal delamination of the surface angle plies.
Keywords: strength scaling, size effect, matrix microcracking, first-ply failure, delamination,carbon/epoxy composite material, laminated composite material.

J. André Lavoie Part I
2
1. Introduction
The problem of matrix cracking in composite materials is usually not that it is a cause forsome impending structural failure, but that these cracks can act as stress raisers, and are initiationsites for more critical damage such as delamination. Cracks can allow ingress of the environment,which is often deleterious. The motivations for the work contained in this report originates withobservations that matrix microcracking in the transverse, or 90°, plies of cross-ply compositelaminates in tension did not initiate at the same stress as that measured in a transverse tension test.Instead, the stress to crack the 90° plies varies as a function of the constraint imposed by thesandwiching plies, and the thickness of both constraint and constrained plies.
A 2-D elasticity analysis of a three ply laminate for the case of a single crack in the middleply was given by Vasil'ev (1970). Each ply could be orthotropic, and a saturation crack spacingcould be predicted. An equilibrium element approach (1-D shear-lag model) was used byReifsnider (1977) and Highsmith and Reifsnider (1982), to analyze the role of the constrainingplies on the development of cracks in the interior constrained plies, to predict the saturation crackspacing, and to give information on stress concentration in the constraint plies. Parvizi, Garrett, andBailey (1978) tested cross-ply laminates of the form [0/90n]s where n=1,2,3,... They modeled thecrack initiation using a 1-D shear lag model and a Griffith energy balance concept extended fromthe theory of Aveston and Kelly. Flaggs and Kural (1982) tested [02/90n]s, [±30/90n]s, and[±60/90n]s, where n=1,2,4, and 8, to investigate the effect of constraint on cracking. They showedthat the models of the time had difficulty predicting the onset of cracking except in the mostconstrained cases. They also showed that the material system could not be characterized as asimple Weibull material. Fukunaga et al. (1984) used a statistical strength analysis together with ashear-lag analysis to predict first ply failure of the [±θ/90n]s laminates described by Flaggs andKural. Kistner, Whitney, and Browning (1985) confirmed that the "in situ" strength variation ofthe transverse plies was real in the sense that the orientation of the constraining plies affected thestrain at which cracking initiates. They tested unidirectional laminates ranging in thickness fromfour to sixteen plies in transverse tension, and showed that the thickness, in and of itself, had noeffect on transverse strength. However, O’Brien and Salpekar (1993) found that the transversetensile strength did obey a Weibull volumetric scaling law. Crossman and Wang (1982) studieddamage initiation and growth in [±25/90n]s laminates where n=1,...,8. The first damage to initiatedepended upon n. A finite element energy analysis could predict onset of transverse cracking.Dvorak and Laws (1987) attempted to predict the growth of a transverse crack within the ply,parallel to the fibers, and toward the ply interfaces. Zhang, Fan, and Soutis (1992) presented amodel based on classical fracture mechanics and assuming a through-thickness flaw. The modelused a modified 2-D shear-lag analysis wherein shear stresses were allowed to vary linearly withinthe constraining plies and cracked 90° plies. Hashin (1985) used variational methods to accountfor crack interaction and predicted changes in axial Young’s modulus, and Poisson’s ratio. Varnaand Berglund (1991, 1993) found unacceptably large errors in Hashin’s analysis for Poisson’s

J. André Lavoie Part I
3
ratio prediction, due to the approximate stress field chosen, improved upon his work, and resolvedthe problem of accurate stress field determination. Gudmundson and coworkers (1992, 1993) havedeveloped a general model for estimating the thermoelastic properties of arbitrary compositelaminates having cracks in any ply, and any crack density. The model depends upon a closed formsolution for the crack opening displacements in an infinite isotropic medium. Most elasticproperties, thermal expansion coefficients, and elastic coupling coefficients are computed. Themodel does not predict crack initiation, but must be given the strain energy release rate for crackingand resistance curve for progressive cracking. Talreja (1985a,b) developed a continuum damagemechanics modeling approach, where the mechanical response of a damaged composite material ischaracterized by a set of vector fields each representing a damage mode. Recently, Talreja (1996)proposed a combined approach to structural analysis in which the strengths of micromechanics tocompute accurate local displacements in damaged materials is combined with continuum damagemechanics useful to compute laminate level thermoelastic property changes.
Several types of delamination were encountered during the course of this work, and haveall been studied previously. These are gross edge delamination, crack-tip induced interplydelamination, and triangular-shaped local delaminations in off-axis plies. The large edgedelamination characterized by interply separation along the length of the gauge section of acomposite coupon specimen, for example, often involves a substantial portion of the width. Thiskind of delamination has received much attention, and some works are by O’Brien (1982a,b),Kim and Soni (1984), and Lagace (1987). Not to be neglected are works which look at theconditions which favor the development of edge delamination. Edge stresses and edge effectswere studied by Pipes and Pagano (1970, 1973), Pipes and Daniel (1971), Pagano and Pipes(1973), Oplinger, Parker, and Chiang (1974), Hsu and Herakovich (1977), Rodini and Eisenmann(1978), Curtis (1980), Herakovich, Post, Buczek, and Czarnek, (1985), and Herakovich(1981,1982).
The development of delamination at the interface of the cracked and the constraining pliesis described by Reifsnider, Henneke, Stinchcomb, and Duke (1983), Jamison, Schulte, Reifsnider,and Stinchcomb (1984), and Crossman and Wang (1982), among others. Talreja (1986)employed continuum damage mechanics to model the property changes that result. Zhang, Soutis,and Fan (1994a,b) use a combined fracture mechanics and finite element model to compute thetotal strain energy associated with this form of delamination at the edge. Wang and Karihaloo(1994) solved for the stress intensity factor to cause delamination due to a matrix crack. Thetriangular delamination was observed by Herakovich (1982), and O’Brien and Hooper (1993). Amodel to predict the onset of the triangular delamination was developed by O’Brien (1993).
In the current work, damage development, and ultimate strength of composite laminateswas studied from the scaling viewpoint. Specifically, the dimensions were varied in length, width,and most importantly, thickness. Thickness was usually scaled in two ways: ply-level scaling in

J. André Lavoie Part I
4
which plies of the same orientation are clustered together, and sublaminate-level scaling in which astacking sequence is repeated any number of times to build up the laminate thickness. Someworks which consider thickness scaling are by Rodini and Eisenmann (1978), Crossman andWang (1982), Herakovich (1982), Kellas and Morton (1990,1992), Kellas, Johnson, Morton, andJackson (1993), and Jackson and Kellas (1993).
The work of Jackson and Kellas (1993) was an experimental investigation of damagedevelopment and strength of ply-level scaled carbon/epoxy composite laminates having stackingsequence of [+θn/-θn/902n]s where constraint ply angle, θ, was 0°, 15°, 30°, 45°, 60°, and 75°, andsize was scaled as n=1,2,3, and 4. In addition, they tested the sublaminated-level scaled [(+θ/-θ/902)2]s layup, where θ varied as before. The results reported were on initial modulus andultimate strength. The purpose of their work was to investigate the effect of outer ply constraint(the [+θn/-θn ply group) on the initial modulus and tensile strength of the coupons. Strength wasshown to vary markedly as a function of thickness, n. The current paper is a continuation of thework begun by Jackson and Kellas (1993). The focus here, was to characterize the nature andsequence of the damages developed, such as those described previously, to isolate themechanism(s) governing strength and to attempt to model the onset of various damage modes andstrength, especially accounting for the effect of size. Furthermore, the [(+60/-60/902)2]s layup wassingled out for added attention because of its remarkable plastic-like stress-strain response.
2. Materials and Specimens
2.1. MATERIALS AND LAMINATES
The material used for this study was a commonly available 0.125 mm thick unidirectionalgraphite/epoxy prepreg: Hercules Magnamite AS-4/3502. Laminates were cured at 177°C. Arange of laminates were fabricated. They were ply-level scaled laminates having the stackingsequence [+θn/-θn/902n]s, where θ varied from 0° to 75° in 15° steps. Laminate thickness, width,and length was changed by varying “n” from 1 to 4. There was also a 16-ply laminate havingstacking sequence of [(+60/-60/902)2]s. Specimen dimensions appear in Table 1.
2.2. SPECIMEN PREPARATION
Specimens were machined from flat panels using a high speed diamond saw with liquidcooling. This machining operation resulted in very smooth, square cuts. One edge of eachspecimen was polished so that cracks and delaminations could be readily discerned. A specialpolishing procedure was needed to polish the entire specimen’s edge. First, to help keep thespecimen edge flat against the grinding surface, three to five specimens were clamped together. Itwas possible to begin the wet grinding with #400 grit silicon carbide paper because the edges were

J. André Lavoie Part I
5
cut very square and flat during the machining operation. Flatness had to be maintained at each stepin the grinding process for the final polish to result in a high quality finish. To ensure flatness, theblock of specimens was ground by hand against a large flat surface using a fore and aft motionwith the specimens aligned to the grinding direction. Grit and debris were flushed out withrunning water, followed by immersion in an ultrasonic bath. The second step was carried outusing an Engis Corporation Hyprez lapping system. A copper lapping platen, 38 centimeters indiameter, and turning at 50 revolutions per minute (rpm), was sprayed with a 3 µm diamondslurry (formula 3(S4305-6) STD-MA). The diamond was carried in a low viscosity petroleumdistillate, having a texture of light oil, but with the property of evaporating away within minutes.Polishing took about 3 minutes when the platen’s surface was freshly prepared. Final polish wason a polishing wheel covered with a hard and flat cloth, such as Kempad “Pan-W” PSA. Thepolishing compound was a 0.3 µm alumina suspension, such as Struers code SDALOC-.3.Polishing took about a minute, when a wheel speed of about 150 rpm was used.
Mechanical Testing These laminates did not suffer from grip region stress concentration whichmight adversely affect strength, and so end tabs were not needed. Specimen ends were coveredwith a #100 grit cloth, which was sufficient to protect the fibers from damage by the grip face, yetstill provide the needed traction. All data reported are for specimens from the same batch ofmaterial. Each panel yielded twelve specimens. Six specimens per panel were used to determinestrength and initial elastic modulus, by Jackson and Kellas (1993). Their data was used here, andappears in Table 2. The remaining specimens were used to study damage development. To verifythat there was not a significant difference in the test methods used, one specimen each from theremaining six specimens, was tested to failure. For those tests the test conditions were as follows.The test machine was a screw driven Instron. Specimens were gripped in Instron hand-tightenedwedge-action grips. The crosshead speeds were chosen according to the specimen size to give aconstant strain rate of 0.5% strain per minute, which translated to 2.54 x n mm/minute (where n =1, 2, 3, or 4). The elastic modulus data presented was determined by Jackson and Kellas (1993)using back-to-back strain gages located at the geometric center of the specimen.
First-ply failure was determined by listening for the onset of matrix microcracking in the90° plies, striking the “unload” button on the test machine, and recording the peak load from thetest machine’s memory. For this study, first-ply failure was the stress to initiate a 90° matrixcrack, regardless of whether there were pre-existing cracks. To characterize damage developmentsbeyond first ply failure, specimens were loaded to intermediate stress levels below failure, and x-rays were taken to observe the damage developed. Damage was monitored by occasionallyremoving the specimen and inspecting the polished edge for cracks and delamination. Dyepenetrant enhanced x-radiography was used to peer inside the laminate to determine the extent ofdelamination and the nature of the matrix cracking. The recipe for the x-ray dye penetrant was todissolve 60 grams of zinc iodide in 10 ml each of water, ethanol, and Kodak Photo-Flo 200.

J. André Lavoie Part I
6
Two methods were used for taking x-rays after loading specimens to the desired stresslevel. The first method involved removing the specimen from the tensile test machine,submerging it in the dye penetrant for at least 1/2 hour, then carefully cleaning the entire specimen.Failure to completely clean the specimen resulted in clouded or foggy x-rays. Specimens werethen arranged on a sheet of Kodak Industrex SR5, or Industrex M5 x-ray film inside an HewlettPackard Faxitron series 43805N x-ray cabinet. The film was processed using Kodak GBXdeveloper and fixer. Besides being time consuming and messy, this method had the drawback thatwhen the specimen was unloaded the cracks would close. Even with a long soak time, dyepenetration may have been incomplete. The second method of obtaining x-radiographs had theadvantage of speed, cleanliness, and assured penetration of the dye. The specimen was loaded tothe desired stress level, then unloaded slightly (about 20%) to ensure that failure would not occurwhile preparing the specimen for x-ray, or during the x-ray exposure. Dye penetrant wasintroduced to both edges of the specimen using a syringe and a bead of penetrant was allowed todrip along the specimen length. Immediately after, a sheet of Polaroid Type 52 (ISO 400), orType 55 (ISO 50), black and white film was taped to the specimen and exposed using a portable x-ray system. The convenience of the Polaroid film was undermined by its low resolution for thistask. Resolution was adequate to reveal all damage except for very fine cracks having theappearance of stitches. X-rays were repeated, as needed, using the Kodak Industrex film describedearlier, to highlight the missing details.
3. Analysis
The topics of matrix cracking and delamination, both investigated in this study, were twoareas that have had a great deal of attention from the modeling community, therefore it would havebeen unwise to spend additional time on model development. Even reproducing the models fromthe literature, in order to test them against the experimental results, was highly time consuming.Of the three models eventually used, only O’Brien’s (1993) had a simple closed-form solution thatwas easily implemented. The other two models were complex computer models that would havebeen prohibitively time consuming to reconstruct. Therefore, gaining direct access to the modelswas well worth the effort involved. The author was fortunate to have been given the computer codefor the model of Zhang, Fan and Soutis (1992) and was provided with the resources for an on-sitevisit to use the model of Gudmundson, Östlund, and Zang (1992).
3.1. MODEL FOR FIRST-PLY FAILURE
The equivalent constraint model (ECM) is a 2-D shear-lag model used to predict in-planestiffness properties for laminates of the general type [±θm/90n]s which contain 90° matrix cracks,Zhang, Fan and Soutis (1992). In the current study, the ECM was used to predict first-ply failureas a function of constraint ply angle and laminate size. The ECM allowed for out-of-plane shear

J. André Lavoie Part I
7
deformation in the constraining plies. In contrast, the 1-D shear-lag models assumed constant in-plane displacements across the thickness of the constraint plies, and confined shear stress transferto a resin-rich interply layer. This distinction between the 1-D and 2-D models becomesincreasingly significant when the constraint plies are oriented off-axis. As the constraint ply angle,θ, increases, the out-of-plane shear modulus, G23 (on the order of 50 to 60% that of G12) becomesthe dominant shear modulus, in preference to G12. Hence, as the shear moduli of constraint layersand constrained layers converges, the assumption of constant in-plane displacements becomesincreasingly inaccurate. Another refinement to the model was to allow partial linear variation ofthe shear stresses across the constraining plies. This approach was more realistic than using theentire constraint ply group thickness because stress perturbations are generally thought to dissipatewithin a typical ply thickness. Here, the model was set to confine the shear stress in theconstraining plies to vary linearly over a single ply thickness for all sizes of laminates.
In order to predict the initiation of first-ply failure, the model needed the material elasticproperties, residual thermal stresses, and the strain energy release rate, G, for transverse matrixcracking. Obtaining elastic properties was not difficult. However, the residual stress state wasunknown because there was substantial stress relaxation, especially immediately after fabrication.Use of the difference between the cure and room temperature would give an overly high estimateof residual stress. For that reason, model predictions assuming no stress relaxation, and completestress relaxation, were included.
The [02/902]s cross-ply lay-up (n=1) was chosen to determine the strain energy release rate,G. Then, the model was used to predict first-ply failure stress as a function of constraint ply angle,θ, and laminate size, n.
3.2. MODEL FOR STRESS-STRAIN RESPONSE WHILE LAMINATE IS CRACKING
Gudmundson and coworkers have produced a model capable of predicting the onset andgrowth of matrix cracking in each and every ply of an arbitrary composite laminate, and thethermoelastic property changes as a consequence. The general nature of the model made it the bestavailable choice for the task of modeling the stress-strain response of laminates which exhibitmatrix cracking in arbitrary layers. The response of the [(+60/-60/902)2]s lay-up was highlynonlinear due to the development of dense matrix cracking. The purpose of modeling the stress-strain response of this laminate was twofold. First, this lay-up would provide a harsh test of themodel, and second, to highlight the effect of a particularly dense form of microcracking onlaminate stiffness.
The model was given an initial strain energy release rate for matrix microcracking, G, of100 J/m2. Past research which investigates crack multiplication, has shown that there is an

J. André Lavoie Part I
8
increasing resistance to continued cracking as the matrix crack density increases. A resistancecurve was used for G(r) and was assumed to be:
G r r( ) = +( )100 1 . (1)
The variable, r, is crack density normalized by the thickness of the cracked layer. The form chosenfor G(r) was based upon that of similar carbon/epoxy materials. Attention was given to forcingthe onset of matrix cracking in the midplane 90° plies of the model to coincide with that of theexperimental data. The value for G was assumed to be the same for all plies in the laminate,regardless of their orientation or thickness.
3.3. MODEL FOR STRENGTH OF ANGLE-PLY LAMINATES
Catastrophic failure of [+θn/-θn/902n]s laminates was identified to occur upon initiation of atriangular-shaped delamination of the surface +θ° angle plies from a +θ° matrix crack at the freeedge. The analysis of O’Brien (1993) gives an expression for the strain energy release rate, G, forsuch local delaminations growing from an arbitrary angle ply matrix crack as:
GP
mw t E tELD LD LAM
= −
2
22
1 1(2)
Here, m=1 because delamination initiates from one +θ° crack on one side of the laminate, not onboth sides simultaneously. The expression in Equation 2 can be rewritten as:
GN
h N n E NEx
LD LAM
=−
−
2
2
1 1
( )(3)
symbols, definitions, and units:G = strain energy release rate for local delamination, J/m2
Nx = tensile force resultant on the laminate, N/mh = ply thickness, mN = number of plies in the laminaten = number of plies in the locally delaminated regionELAM = modulus of the laminate, PaELD = modulus of the locally delaminated region, Pa
The general expression for ELD given by O’Brien handles unsymmetric delaminated sublaminatesand is:

J. André Lavoie Part I
9
EN n h
AA D B B
A D BA
A B A B
A D BBLD =
−( )− −
−
+ −−
211
12 22 12 22
22 22 222 12
12 22 22 12
22 22 222 12 (4)
The laminates in this study all had symmetric delaminated sublaminates, and as a consequencethere is no bend extension coupling, therefore the Bij terms are all zero and the expression for ELD
in Equation 4 simplifies to:
EN n h
AA
ALD =−( )
−
211
122
22
(5)
The strain energy release rate, G, is computed using the average tensile force resultant, Nx, atfailure of the 8-ply (n=1) laminate for each value of θ. The force resultant to cause failure of thethicker laminates (n increasing) is predicted by rearranging Equation 3 as:
N n hGN n E NEx
LD LAM
( ) =−( )
−
−
21 1
1
(6)
4. Results
In the following subsections the various forms of damage development are described, andrelated to the constraint ply angle and laminate size (scale factor, n). Damage due to residualthermal stress is the topic of Section 4.1. The obvious differences in the stress-strain response as afunction of laminate size and constraint ply angle are presented in Section 4.2. In Section 4.3,transverse matrix cracking and first-ply failure data, as a function of constraint and size, wasmodeled. In Section 4.4, the development of damage after first-ply failure, as affected by theconstraint ply angle and laminate size was examined with the aid of detailed x-ray and edgephotomicrographs. In Section 4.5, the elastic/plastic-like stress-strain response of the [(+60/-60/902)2]S lay-up was examined specifically because its response was highly sensitive to the effectof dense localized cracking not accounted for in most models available. In Section 4.6, thestrength-controlling delamination of +θ° plies was predicted. The delamination of the midplane,along the -θ/90 interface, which had a strong effect on stiffness, was not examined. This decisionwas made because the relationship between delamination initiation and growth, for ply-levelscaling of a quasi-isotropic lay-up, was successfully modeled by O’Brien (1993).
4.1. THERMAL STRESS-INDUCED MATRIX CRACKING
Thermal stress-induced cracking appeared spontaneously in the [+θn/-θn/902n]s laminateshaving high constraint (low θ angle), and thick blocks of plies (n increasing). The cracks in the

J. André Lavoie Part I
10
90° and +θ° or -θ° plies existed throughout the panel. It was likely that these cracks formedduring cooling of the laminate from cure, though they may have formed when the first edge of thepanel was trimmed. It was certain that they were not a result of cutting individual specimens, aswas verified by marking the location of each crack on each specimen and piecing the panelstogether again to see that cracks were continuous from one specimen to the next. A summary ofthe thermal stress-induced crack density in the 90° plies of each [+θn/-θn/902n]s laminate is given inTable 3. In the columns labeled “r” the crack spacing a is divided by the thickness, d, of the 90°ply block. For +θ° ply cracking, the crack count along the length of the specimen at the top andbottom surface plies is given in Table 4.
The n=1 size laminates had no thermal stress-induced matrix cracks, nor were there cracksin any lay-up having +60° or +75° constraint plies. The n=2, 3, and 4 size lay-ups had 90° cracks,for constraint ply angles of θ = 0°, +15°, +30°, or +45°. For the n=3 size lay-up, additionalcracking appeared in the top surface plies for θ = +15° and +30°. The n=4 size lay-up also hadcracks in the top surface plies for θ = +45°. There was a tendency toward large numbers of cracksin the top surface plies, but few in the bottom surface plies. Finally, all of the coupon specimenshad a small concave down curvature, as measured between the middle of the coupon and a flatsurface. The consistent appearance, in all 24 composite panels, of convex curvature toward theunderside of each coupon, indicated unbalanced resin content of the upper and lower surfaces,rather than error in orienting the plies during the hand lay-up. This phenomenon was expectedfrom the fabrication process, because the laminate was cured against a caul plate, which isimpenetrable to fluids, while excess resin was bled through the bleeder ply at the top. The warpagedue to the fabrication process was studied by Radford (1993). He measured the fiber volumefraction across the thickness, and found that resin content was fairly uniform throughout thelaminate thickness, but rose sharply in the ply against the caul plate, and dropped sharply in the plyagainst the bleeder cloth. The resin content gradient was likely responsible for the different crackcounts of the +θ° ply groupings at the top and bottom surfaces.
The angle, θ, of the constraint plies relative to the 90° plies, and also the angle of theconstraint plies to each other, affected whether or not stitch-like cracks formed in the -θ° plies. Anx-ray of a [+154/-154/908]s laminate appears in Figure 1, and shows the presence of -15° stitchcracks due to a neighboring +15° crack. Constraint ply angles of 30° resulted in very few stitchcracks, but -30° cracks were much longer, see Figure 2. In Figure 3, there is a return of stitchcrack formation, but now in the -45° plies due to a 90° matrix crack.

J. André Lavoie Part I
11
4.2. MECHANICAL TESTING: STRESS-STRAIN RESPONSE
Six representative plots of the stress-strain response of [+θn/-θn/902n]s laminates, for θ=0°,15°, 30°, 45°, 60°, and 75°, appears in Figure 4. Each plot contains four curves, one for each sizetested, n=1,2,3, and 4. The initial elastic modulus, strength, and strain to failure was given in Table2. There was no size effect on the initial elastic modulus. However, it was clear that upon tensileloading, differences in damage onset stress, and development rate, resulted in early loss ofstiffness, and strength, as size, n, was increased. For θ=0°, 15°, 60°, and 75°, the most obviouseffect was a reduction in strength. The lay-ups having constraint plies at 30° and 45° hadsubstantial change in the stiffness, due to midplane delamination.
4.3. FIRST-PLY FAILURE: EFFECTS OF CONSTRAINT AND THICKNESS
First-ply failure (fpf) was recorded for each [+θn/-θn/902n]s laminate for n=1 to 4, and forθ=0°, 15°, 30°, 45°, 60°, and 75°. The experimental data, along with predictions of the ECM,appear in Figure 5. The model was used to predict fpf for various levels of constraint, as indicatedby the constraint ply angle, θ, and for the four different scales, as indicated by n. All predictionswere based upon experimental data from the [02/902]s cross-ply lay-up. To maintain clarity, eachplot contains the data and predictions for one size of laminate (marked on the plot as n=1, n=2,n=3, and n=4).
The residual stress state was unknown, because the lamina stress-relaxation response wasnot characterized. Therefore, an attempt was made to bound the possible predictions. The twoextremes are full residual stress (no stress relaxation), represented as a solid curve; and no residualstress (full stress relaxation) represented as the dashed curve. Note that the value for strain energyrelease rate, G, computed by the model from the [02/902]s cross-ply data, was very differentdepending upon the residual stress that was input to it.
Examine first the plot labeled “n=1” in Figure 5. The experimental data suggested animmediate drop in the fpf stress as the constraint ply angle, θ, was increased, while the modelpredicted a gradual drop initially. The level of residual stress had little effect on the predictions.The plot “n=2”, corresponds to 16-ply laminates. The solid curve follows the data best, butunderpredicts fpf of the cross-ply (which has a 0° constraint angle) more than the dashed curve.For both the “n=3” and “n=4” plots, corresponding to 24-ply and 32-ply laminates, respectively,there are similar trends: the solid curve follows the data best, but consistently underpredicts fpfstress of the cross-plies. On the other extreme, the dashed curve predicts the cross-ply’sdependence of fpf on n well, or is slightly nonconservative. For constraint angles up to 35 or 40°the prediction was highly nonconservative.

J. André Lavoie Part I
12
4.4. EFFECTS OF CONSTRAINT PLY ORIENTATION ON INTERLAMINAR AND INTRALAMINAR MATRIX CRACKING DUE TO TENSILE LOADING
In this section, damage development in the constrained 90° plies, the constraining -θ° plies,and the -θ/90 interface of [+θn/-θn/902n]s laminates is covered. It was found that the type ofdamage sustained by the respective plies depended on the angle, θ, of the constraint plies. Thethickness of the ply groupings, controlled by n, affected the stress for onset of damage, and rate ofdamage growth.
4.4.1. Damage Progression for Constraint Plies at ±15°
The -15° plies were not damaged due to stress redistribution around the 90° cracks.Instead, the -15/90 interface delaminated from the tips of the 90° cracks, see Figure 6. Subsequentdamage to the 90° plies was in the form of inclined secondary cracks near the 90° crack, see rightside of Figure 7. The inclined cracks coalesce with the 90° crack-tip delaminations to form acontinuous -15/90 delamination at the edge, see left side of Figure 7. The -15/90 delaminationprogressed deeply into the laminate, running preferentially along the 90° crack, see the magnifiedportion of the x-ray in Figure 8. Edge delamination was also evident, but did not penetrate withthe same readiness as for constraint plies at ±30°.
4.4.2. Damage Progression for Constraint Plies at ±30°
The progression of damage was similar to that of the laminates having ±15° plies justdescribed. After formation of 90° cracks, there was delamination of the -30/90 interface, startingfrom the tips of the 90° cracks, see Figure 9. Additional damage to the 90° plies appeared asinclined secondary cracks near the 90° crack, also Figure 9. The 90° crack-tip delaminationpenetrated deeply into the laminate interior, though 90° matrix cracks were still sparse, see Figure10.
Only one edge of each specimen had been polished, and in this lay-up the effect wasmarked. The unpolished edge (right edge in Figure 11) exhibits rapid coalescence of the localizeddelaminations to form a continuous -30/90 delamination that penetrated from the edge toward theinterior. Though polishing suppressed delamination along the left edge, it did not forestall crackingin the -30° plies, and may have encouraged it. The -30° ply cracks initiated from the tips of the90° cracks, see magnified area of Figure 11. The -30° cracks appear fuzzy because they wereinclined, as shown in Figure 12.
4.4.3. Damage Progression for Constraint Plies at ±45°
As discussed previously in Section 4.1, the appearance of 90° cracks caused stitch cracksin -45° constraint plies. When stitch cracks formed due to thermal stresses alone, little interfacialdamage was found. The exception was the thickest, n=4 size, [+454/-454/908]s laminate. In a fewinstances, barely discernible -45/90 delamination along the 90° crack could be found, as shown in

J. André Lavoie Part I
13
the magnified portion of Figure 3. A cut was made perpendicular to the 90° crack, and the planeof the laminate, at the interior of the specimen, see Figure 13. In this highly magnified view, the -45° and 90° cracks are in close proximity, but the interface is intact.
After tensile loading, both the n=3 and n=4 sizes of laminates had clearly developed the -45/90 interfacial delamination, look ahead to Figure 22. For the n=1 and n=2 sizes, nodelaminations had formed at the tips of the 90° cracks either from thermal residual stresses or afterloading to failure. To be more certain, sections were taken from a failed n=1 size couponperpendicular to the 90° crack, as shown in Figure 14. The -45° and 90° cracks were in closeproximity, but no delamination was visible. From an n=2 size coupon loaded to failure, a sectionwas taken parallel to the 90° crack, with the crack just under the polished surface, see Figure 15.An inclined -45° crack was visible, which ran across the two ply thickness up to the +45/-45interface and the -45/90 interface. There was no sign of delamination at either interface.
4.4.4. Damage Progression for Constraint Plies at ±60°
For the n=1 size laminate loaded to 66 MPa, formation of 90° cracks was accompanied bystitch cracks in the -60° plies, see Figure 16. There existed -60/90 delaminations along the 90°crack. Immediately, a +60° crack formed at the intersection of the 90° crack with the edge. FromFigure 17, observe that with little additional loading (68 MPa), more 90° cracks formed, whichwere confined to within a length of about 11 mm, or that defined by the coupon’s width x Cos60°.The +60° cracks induced -60° stitch cracks. For the larger sizes, n=2, 3, and 4, the initiation of thefirst 90° crack triggered complete laminate failure.
4.5. DAMAGE AND THE RESPONSE OF [(+60/-60/902)2]S LAY-UP
Earlier, it was shown that dense cracking occurs in the -θ° plies, due to a neighboring 90°crack, for θ values of 45° and 60°. The length and density of the cracks in the -θ° plies of severallaminates is given in Table 5. Damage in the [(+60/-60/902)2]s lay-up proceeded as follows. First,midplane 90° plies developed matrix cracks. These cracks induced short, densely spaced, cracksin the adjacent -60° plies. Delamination at the -60/90 interface was absent, in preference toforming the -60° cracks. A photomicrograph of the polished edge showing a 90° crack and thecracks induced in the -60° plies, appears in Figure 18(a). Second, matrix cracks form in the off-center 90° plies, accompanied by the same short, densely spaced, cracks in adjacent +60° and -60°plies, see Figure 18(b). As the laminate strain was increased, +60° cracks appear in the surfaceplies. The profusion of cracks can be seen in the x-ray of Figure 19.
Actual and modeled stress-strain responses are shown in Figure 20. The stages at which damage initiates in the various plies are indicated. The model predicts a four stage stress-strainresponse, as indicated by the solid line. There was the crack-free linear-elastic stage, then cracking

J. André Lavoie Part I
14
began first in the midplane 90° plies, next in off-center 90° plies, and lastly in all 60° plies. Theactual response was similar to a linear-elastic/ perfectly plastic response.
There were three stages to the experimental stress-strain response, shown as the dashedcurve in Figure 20. After the initial linear-elastic stage, the onset of cracking in the midplane 90°plies was accompanied by cracking in neighboring -60° plies. Next, cracking in the off-center 90°plies was accompanied by cracking in neighboring +60° and -60° plies. Lastly, ply scissoring atnearly 1.5% strain causes stiffening of the laminate.
4.6. DELAMINATION OF SURFACE +θ° PLIES AND PREDICTION OF STRENGTH
Ultimate strength of the [+θn/-θn/902n]s laminate class was controlled by the initiation of alocal delamination of the surface +θn block of plies at the free edge, from a +θ° matrix crack.Typically, the +θ° delamination grew catastrophically when θ=15°, 30°, 60°, and 75°. For θ=45°,growth of the delamination often arrested. If delamination growth was not catastrophic, it wascertainly very close to the ultimate strength. The +15° local delamination, for a [+15/-15/902]s
laminate, was captured because of its proximity to the grip, and is shown in the x-ray of Figure21(a). The damage sequence was 90° matrix cracking first, then a +15° matrix crack, immediatelyfollowed by -15° stitch cracking, and the initiation of the local delamination. In Figure 21(b) then=3 size [+153/-153/906]s lay-up has two sites of +15° ply delamination from the +15° matrixcrack. The [+45n/-45n/902n]s laminate class could develop several +45° surface delaminationsbefore complete laminate failure, though they were still very close to ultimate failure, as shown inFigure 22.
In Figure 23 a photograph of the failed specimens of the size n=3, for each constraint plyangle, θ, is shown. The common characteristic of all ply angles (and sizes), is the delamination of+θ° plies from the -θ° plies. In consequence, it was possible to predict the critical load to causefailure of each.
The strength of each [+θn/-θn/902n]s laminate for n>1 was predicted from the strain energyrelease rate, G=G(θ, n=1), of the n=1 size laminate, for θ=15°, 30°, 45°, 60°, and 75°. Theneeded values for ELAM, the modulus of the laminate, and ELD, the modulus of the locallydelaminated region, were computed from the lamina elastic properties using classical laminationtheory, and are tabulated in Table 6. Corresponding values for G(θ, n=1) were computed usingthe average ultimate force resultant, Nx, of the n=1 size specimens, and Equation 3, and are shownin Table 6. The force resultant, Nx, to initiate a +θ° delamination in the n=2, 3, and 4 sizelaminates was predicted using the corresponding G value, and Equation 6. The results are given inTable 7, and include the percent error between the predicted and measured values. Plots of theexperimental data along with the predictions are given in Figure 24. In most cases, the data scatterwas greater than the error between the average experimental value and the prediction. Agreement

J. André Lavoie Part I
15
between the data and the model was quite good for all, with the exception of the [+75n/-75n/902n]s
lay-up, which failed upon initiation of a 90° crack.
5. Discussion
5.1. FIRST-PLY FAILURE
In Figure 5, the equivalent constraint model was used to predict the first-ply failure of thelaminates from sizes of n=2,3, and 4, and gradations of constraint from θ=0°, 15°, 30°, 45°, 60°,and 75° in the [+θn/-θn/902n]s layups, based on the first-ply failure stress of the [02/902]s cross-ply(n=1 size). Necessarily, the model was tuned to the material’s strain energy release rate, G.Clearly, the model has captured the essence of the mechanics of first ply failure as affected by bothscaling and constraint.
A problem that appeared while using this model was that it could give unexpectedly highvalues for G. Specifically, when the residual stress was assumed to be zero, the computed G was250 J/m2, a value that is within the range generally reported for graphite/epoxies, see O’Brien(1997), and was close to that reported by Bradley and Cohen (1985) for the same material. Whenthe residual stress was at a maximum (or -138°C, the difference between fabrication and usetemperatures) the computed G was 675 J/m2, well above anything reported for carbon/epoxy, seeO’Brien (1997). Thus, when stress relaxation was manipulated using the model, a large effect onfpf was predicted. Perhaps stress relaxation is the change that affects the load at which crackingwill initiate. An observation that suggests the importance of stress relaxation in determining themechanical load to initiate cracking follows.
Laminates with cracks due to thermal residual stress do not immediately resume crackingwhen loaded mechanically. For example, the n=3 size cross-ply cracks at about 225 MPa, whichis more than 50% of the stress to cause cracking in the n=1 size. This is a lot of stress consideringthat the expectation is to resume cracking immediately upon application of tensile mechanical load.Moore and Dillard (1990) showed that matrix cracking appears during long-term tensile loading ofcross-ply laminates. Their work shows that time-dependent change in the ability of the matrix tosupport load causes delayed appearance of matrix cracking. Their work lends support to theargument that a laminate containing residual fabrication stresses will also experience time-dependent changes in the matrix. It appears that to test the model more rigorously, the stressrelaxation behavior of the lamina should be determined as part of a complete materialscharacterization process, which would include the usual measurements of elastic properties, as wellas thermal and moisture expansion coefficients.

J. André Lavoie Part I
16
5.2. “STITCH” CRACK FORMATION
The cracks in the -θ° ply block which formed because of stress redistribution around a 90°crack were called “stitch” cracks because their length and proximity to each other resembled astitched incision. Stitch cracks appeared in the -θ° plies due to 90° cracks when θ=-45°, seeFigure 3, and in -60° plies after monotonic loading, see Figure 16. Stitch cracks were notobserved in laminates having constraint ply angles at ±75°, probably because total laminate failurealways occurred upon initiation of the first 90° crack. The -15° stitch cracks followed the cracks in+15° plies, not 90° plies, see Figure 1. When the constraint plies were oriented at ±30° then stitchcracks did not appear, except for a very few, see Figure 2. Tensile loading did not appear toincrease the stitch crack density or change their length, see Table 5.
Stitch cracks were first described by Jamison, Schulte, Reifsnider, and Stinchcomb (1984).They considered a 1 mm thick [0/90/+45/-45]s laminate which apparently did not develop thesecracks until after 50,000 tension-tension fatigue cycles at 62% of ultimate tensile load. In thepresent work, stitch cracks appeared due to thermal stresses, or after monotonic tensile loading.The existence of stitch cracking suggests an additional damage mechanism resulting from stressredistribution around cracks. The local delamination mechanism reported in the literature is morefamiliar, probably because the laminates studied were cross-plied, where constraint plies areoriented at 0° to the load direction.
In two previous studies, stitch cracks likely existed, but were overlooked. Flaggs andKural (1982) considered T300/934 (a material having similar elastic and thermal properties toAS4/3502), with stacking sequences of [±30/90n]s and [±60/90n]s, where n=1,2,4, and 8. Dyepenetrant enhanced x-radiography had been used, but stitch cracks in -60° plies were not reported.Kistner, Whitney, and Browning (1985) considered AS4/3502 having stacking sequences of
+ − + −[ ]θ θ θ θ/ / / / /90 903 s, and + − + −[ ]θ θ θ θ/ / / / / / /90 90 90 90
s,
where θ=45° and θ=60°. Because x-radiographs were not taken, the stitch cracking was missed.In the current work, even when x-radiographs were made, the stitch cracks were fine enough thatthey were not visible unless the film resolution was sufficiently high. Stitch cracks wereoverlooked when both the fast Polaroid Type 52 (ISO 400), and finer grain Type 55 (ISO 50)films were used. Finely detailed x-radiographs were made using Kodak Industrex SR5, orIndustrex M5. The development of the stitch cracks has been shown to occur in all thicknessestested, and only required the presence of a matrix microcrack in the neighboring ply. Furthermore,the stitch cracks appeared in great numbers in plies oriented by as much as 45° from the cracked90° ply, but were few in number for the 30° plies (oriented 60° from the cracked 90° ply). Stitchcracks are a damage form which can appear early in the service life, if not immediately afterfabrication, and as such should be considered during design. State-of-the-art models can design to

J. André Lavoie Part I
17
avoid matrix cracking and subsequent crack-tip delamination (see Wang and Karihaloo, 1996a,b)but stitch cracks are not yet considered.
5.3. STRESS-STRAIN RESPONSE OF THE [(+60/-60/902)2]s LAY-UP
The same plastic-like stress-strain response observed in the [(+60/-60/902)2]s lay-up, Figure20, was observed earlier by Kistner, Whitney, and Browning (1985) in their tests of a similar lay-up. The plastic-like stress-strain response was explained from observation (by edge inspection)that cracks appeared in all plies simultaneously. However, without high resolution x-radiographs itwould not have been clear that the cracks in the interior +60° and -60° plies were actually short andstitch-like, and not cracks that ran across the laminate. Talreja (1985b) commented that theelastic/plastic-like response was expected of laminates having transverse plies with low constraint.The immediate effect of the stitch crack was to radically reduce the stiffness. Certainly, structurallay-ups will have plies oriented in the major loading directions, so the effect may not be verynoticeable. However, shear stiffness may be more strongly affected.
5.4. STRENGTH OF [+θn/-θn/902n]s LAMINATES
The tensile strength of the [+θn/-θn/902n]s family of scaled angle-ply laminates was found toclosely coincide with initiation of a local delamination in the +θ° plies, see Figure 24. Because ofthis fact, the dependence of laminate tensile strength on size was predicted successfully usingO’Brien’s 1993 model for predicting local delamination of this type. Damage in the form ofmatrix cracks and -θ/90 delamination served as favored soft zones for initiation of the +θ° crackand critical strength-controlling +θ° delamination. This is overlooked when using the model,because the modulus, ELAM, of an undamaged laminate was used. Perhaps the G value computedfrom the n=1 size experiments is compensating for the fact that the laminate is actually locallysofter than ELAM suggests.
6. Conclusions
The scaling effect observed for first-ply failure of 90° plies, in [+θn/-θn/902n]s laminateshaving varying levels of constraint and varying ply thickness, has been shown to follow thatpredicted by a mechanics-based model. The cause for deviation of the model from the experimentmay lay with the model, but certainly contributing factors must be the pre-existence of cracks inthicker laminates with high constraint, and the unknown level of residual stress.
The laminate strength was controlled by delamination of the surface +θ° ply block in thepresence of a +θ° crack. Damage development before final failure, particularly the midplanedelamination of layups with 30° constraint plies, governed the location of final failure. Even so,
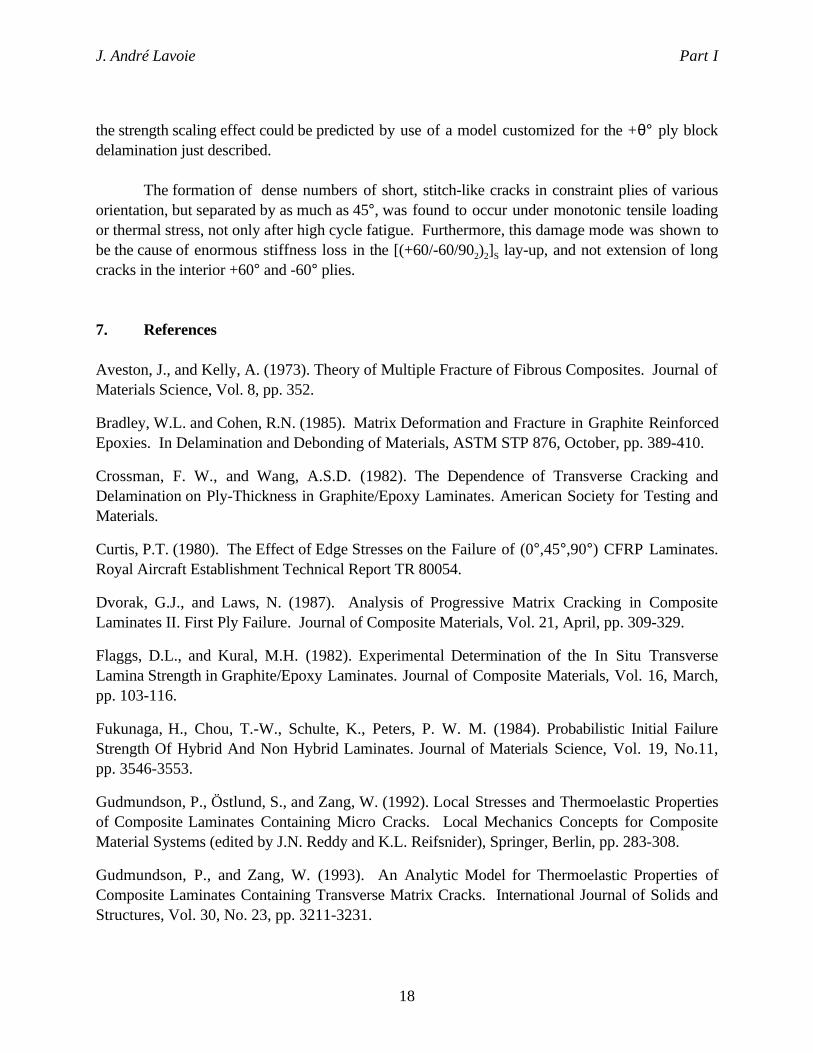
J. André Lavoie Part I
18
the strength scaling effect could be predicted by use of a model customized for the +θ° ply blockdelamination just described.
The formation of dense numbers of short, stitch-like cracks in constraint plies of variousorientation, but separated by as much as 45°, was found to occur under monotonic tensile loadingor thermal stress, not only after high cycle fatigue. Furthermore, this damage mode was shown tobe the cause of enormous stiffness loss in the [(+60/-60/902)2]S lay-up, and not extension of longcracks in the interior +60° and -60° plies.
7. References
Aveston, J., and Kelly, A. (1973). Theory of Multiple Fracture of Fibrous Composites. Journal ofMaterials Science, Vol. 8, pp. 352.
Bradley, W.L. and Cohen, R.N. (1985). Matrix Deformation and Fracture in Graphite ReinforcedEpoxies. In Delamination and Debonding of Materials, ASTM STP 876, October, pp. 389-410.
Crossman, F. W., and Wang, A.S.D. (1982). The Dependence of Transverse Cracking andDelamination on Ply-Thickness in Graphite/Epoxy Laminates. American Society for Testing andMaterials.
Curtis, P.T. (1980). The Effect of Edge Stresses on the Failure of (0°,45°,90°) CFRP Laminates.Royal Aircraft Establishment Technical Report TR 80054.
Dvorak, G.J., and Laws, N. (1987). Analysis of Progressive Matrix Cracking in CompositeLaminates II. First Ply Failure. Journal of Composite Materials, Vol. 21, April, pp. 309-329.
Flaggs, D.L., and Kural, M.H. (1982). Experimental Determination of the In Situ TransverseLamina Strength in Graphite/Epoxy Laminates. Journal of Composite Materials, Vol. 16, March,pp. 103-116.
Fukunaga, H., Chou, T.-W., Schulte, K., Peters, P. W. M. (1984). Probabilistic Initial FailureStrength Of Hybrid And Non Hybrid Laminates. Journal of Materials Science, Vol. 19, No.11,pp. 3546-3553.
Gudmundson, P., Östlund, S., and Zang, W. (1992). Local Stresses and Thermoelastic Propertiesof Composite Laminates Containing Micro Cracks. Local Mechanics Concepts for CompositeMaterial Systems (edited by J.N. Reddy and K.L. Reifsnider), Springer, Berlin, pp. 283-308.
Gudmundson, P., and Zang, W. (1993). An Analytic Model for Thermoelastic Properties ofComposite Laminates Containing Transverse Matrix Cracks. International Journal of Solids andStructures, Vol. 30, No. 23, pp. 3211-3231.

J. André Lavoie Part I
19
Hashin, Z. (1985). Analysis of Cracked Laminates: A Variational Approach. Mechanics ofMaterials, Vol. 4, pp. 121-136.
Herakovich, C.T. (1981). On the Relationship Between Engineering Properties and Delaminationof Composite Materials. Journal of Composite Materials, Vol. 15, pp. 336-348.
Herakovich, C.T. (1982). Influence of Layer Thickness on the Strength of Angle-Ply Laminates.Journal of Composite Materials, Vol. 16, May, pp. 216-227.
Herakovich, C.T., Post, D., Buczek, M.B., Czarnek, R. (1985). Free Edge Strain Concentrationsin Real Composite Laminates: Experimental-Theoretical Correlation. Journal of AppliedMechanics, Vol. 52, No. 4, pp. 787-793.
Highsmith, A.L. and Reifsnider, K.L. (1982). Stiffness-Reduction Mechanisms in CompositeLaminates. Damage in Composite Materials, ASTM STP 775, K.L. Reifsnider, Ed., AmericanSociety for Testing and Materials, pp. 103-117.
Hsu, P. W. and Herakovich., C.T. (1977). Edge Effects in Angle-Ply Composite Laminates.Journal of Composite Materials, Vol. 11, pp. 422-428.
Jackson, K.E., and Kellas, S. (1993). Effect of Specimen Size on the Tensile Strength ofGeometrically Scaled [+θn/-θn/902n]s Composite Laminates. Army Symposium on SolidMechanics, August 17-19, Plymouth, MA.
Jamison, R.D., Schulte, K., Reifsnider, K.L., and Stinchcomb, W.W. (1984). Characterizationand Analysis of Damage Mechanisms in Tension-Tension Fatigue of Graphite/Epoxy Laminates.Effects of Defects in Composite Materials, ASTM STP 836, American Society for Testing andMaterials, Philadelphia, pp. 21-55.
Kellas, S., and Morton, J. (1990). Strength Scaling in Fiber Composites. NASA ContractorReport 4335, November.
Kellas, S., and Morton, J. (1992). Scaling Effects in Angle-Ply Laminates. NASA ContractorReport 4423, February.
Kellas, S., Johnson, D.P., Morton, J., and Jackson, K.E. (1993). Scaling Effects in Sublaminate-Scaled Composite Laminates. 34th AIAA/ASME/ASCE/AHS/ASC Structures, StructuralDynamics and Materials Conference, AIAA/ASME Adaptive Structures Forum, April 19-22, LaJolla, CA, Part 6, pp. 3715-3725.
Kim, R. Y., Soni, S.R. (1984). Experimental and Analytical Studies On the Onset ofDelamination in Laminated Composites. Journal of Composite Materials, Vol. 18, pp. 70-80.
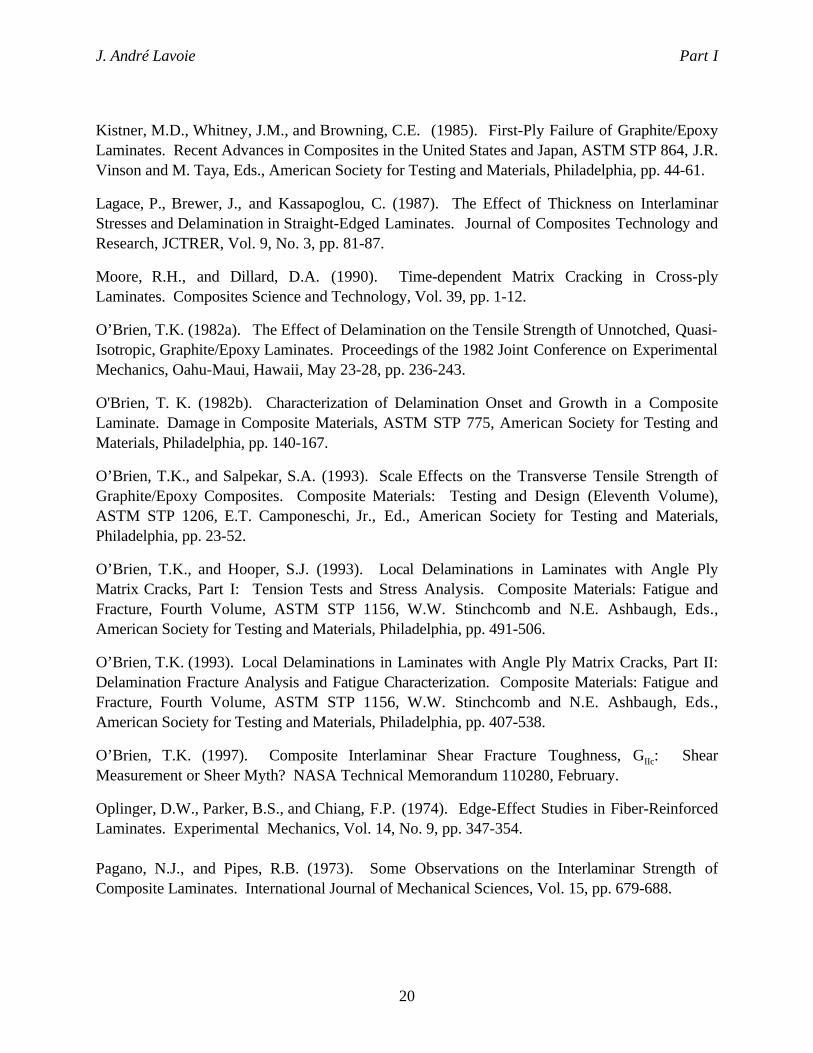
J. André Lavoie Part I
20
Kistner, M.D., Whitney, J.M., and Browning, C.E. (1985). First-Ply Failure of Graphite/EpoxyLaminates. Recent Advances in Composites in the United States and Japan, ASTM STP 864, J.R.Vinson and M. Taya, Eds., American Society for Testing and Materials, Philadelphia, pp. 44-61.
Lagace, P., Brewer, J., and Kassapoglou, C. (1987). The Effect of Thickness on InterlaminarStresses and Delamination in Straight-Edged Laminates. Journal of Composites Technology andResearch, JCTRER, Vol. 9, No. 3, pp. 81-87.
Moore, R.H., and Dillard, D.A. (1990). Time-dependent Matrix Cracking in Cross-plyLaminates. Composites Science and Technology, Vol. 39, pp. 1-12.
O’Brien, T.K. (1982a). The Effect of Delamination on the Tensile Strength of Unnotched, Quasi-Isotropic, Graphite/Epoxy Laminates. Proceedings of the 1982 Joint Conference on ExperimentalMechanics, Oahu-Maui, Hawaii, May 23-28, pp. 236-243.
O'Brien, T. K. (1982b). Characterization of Delamination Onset and Growth in a CompositeLaminate. Damage in Composite Materials, ASTM STP 775, American Society for Testing andMaterials, Philadelphia, pp. 140-167.
O’Brien, T.K., and Salpekar, S.A. (1993). Scale Effects on the Transverse Tensile Strength ofGraphite/Epoxy Composites. Composite Materials: Testing and Design (Eleventh Volume),ASTM STP 1206, E.T. Camponeschi, Jr., Ed., American Society for Testing and Materials,Philadelphia, pp. 23-52.
O’Brien, T.K., and Hooper, S.J. (1993). Local Delaminations in Laminates with Angle PlyMatrix Cracks, Part I: Tension Tests and Stress Analysis. Composite Materials: Fatigue andFracture, Fourth Volume, ASTM STP 1156, W.W. Stinchcomb and N.E. Ashbaugh, Eds.,American Society for Testing and Materials, Philadelphia, pp. 491-506.
O’Brien, T.K. (1993). Local Delaminations in Laminates with Angle Ply Matrix Cracks, Part II:Delamination Fracture Analysis and Fatigue Characterization. Composite Materials: Fatigue andFracture, Fourth Volume, ASTM STP 1156, W.W. Stinchcomb and N.E. Ashbaugh, Eds.,American Society for Testing and Materials, Philadelphia, pp. 407-538.
O’Brien, T.K. (1997). Composite Interlaminar Shear Fracture Toughness, GIIc: ShearMeasurement or Sheer Myth? NASA Technical Memorandum 110280, February.
Oplinger, D.W., Parker, B.S., and Chiang, F.P. (1974). Edge-Effect Studies in Fiber-ReinforcedLaminates. Experimental Mechanics, Vol. 14, No. 9, pp. 347-354.
Pagano, N.J., and Pipes, R.B. (1973). Some Observations on the Interlaminar Strength ofComposite Laminates. International Journal of Mechanical Sciences, Vol. 15, pp. 679-688.

J. André Lavoie Part I
21
Parvizi, A., Garrett, K.W., Bailey, J.E. (1978). Constrained Cracking in Glass Fibre-ReinforcedEpoxy Cross-Ply Laminates. Journal of Materials Science, Vol. 13, pp. 195-201.
Pipes, R.B., and Pagano, N.J. (1970). Interlaminar Stresses in Composite Laminates UnderUniform Axial Extension. Journal of Composite Materials, Vol. 4, October, pp. 538-548.
Pipes, R.B., and Daniel, I.M. (1971). Moiré Analysis of Interlaminar Shear Edge Effect inLaminated Composites. Journal of Composite Materials, Vol. 5, pp. 255-259.
Radford, D.W. (1993). Cure Shrinkage Induced Warpage in Flat Uni-Axial Composites, Journalof Composites Technology and Research, JCTRER, Vol. 15, No. 4, pp. 290-296.
Reifsnider, K.L. (1977). Some Fundamental Aspects of the Fatigue and Fracture Response ofComposite Materials. Proceedings of the 14th Annual Meeting, Society of Engineering Science,G.C. Sih, Ed., Lehigh University, Bethlehem, PA, Nov. 14-16. Recent Advances in EngineeringScience, pp. 373-384.
Rodini, B.T., and Eisenmann, J.R. (1978). An Analytical and Experimental Investigation of EdgeDelamination in Composite Laminates. Fibrous Composites in Structural Design. New York,Plenum Press. 441-457.
Talreja, R. (1985a). A Continuum Mechanics Characterization of Damage in CompositeMaterials. Proceedings of the Royal Society of London, A399, pp. 195-216.
Talreja, R. (1985b). Transverse Cracking and Stiffness Reduction in Composite Laminates.Journal of Composite Materials, Vol. 19, July, pp. 355-375.
Talreja, R. (1986). Stiffness Properties of Composite Laminates with Matrix Cracking andInterior Delaminations. Engineering Fracture Mechanics, Vol. 25, No. 5/6, pp. 751-762.
Talreja, R. (1996). A Synergistic Damage Mechanics Approach to Durability of CompositeMaterial. Progress in Durability Analysis of Composite Systems. Cardon, Fukuda and Reifsnider,Eds. Balkema, Rotterdam, ISBN: 90 5410 809 6, pp. 117-129.
Varna, J., and Berglund, L.A. (1991). Multiple Transverse Cracking and Stiffness Reduction inCross-Ply Laminates. Journal of Composites Technology and Research, Vol. 13, pp. 97-106.
Varna, J., Berglund, L.A., Talreja, R., and Jacovics, A. (1993). A Study of the OpeningDisplacement of Transverse Cracks in Cross-Ply Laminates. International Journal of DamageMechanics, Vol. 2, pp. 272-289.
Vasil'ev, V.V., Dudchenko, and A.A., Elpat'evskii, A.N. (1970). Analysis of the TensileDeformation of Glass-Reinforced Plastics. Mekhanika Polimerov, Vol. 1, pp. 144-147.

J. André Lavoie Part I
22
Wang, J., and Karihaloo, B.L. (1994). Cracked Composite Laminates Least Prone toDelamination. Proc. of the Royal Society London, Vol. 444, pp. 17-35.
Wang, J., and Karihaloo, B.L. (1996a). Optimum in Situ Strength Design of CompositeLaminates Part I: In Situ Strength Parameters. Journal of Composite Materials, Vol. 30, No. 6,pp. 1314-1337.
Wang, J., and Karihaloo, B.L. (1996b). Optimum in Situ Strength Design of CompositeLaminates Part II: Optimum Design. Journal of Composite Materials, Vol. 30, No. 12, pp. 1338-1358.
Zhang, J., Fan, J., and Soutis, C. (1992). Analysis of Multiple Matrix Cracking in [±θm/90n]s
Composite Laminates, Part 2: Development of Transverse Ply Cracks. Composites, Vol. 23, No.5, September 1992, pp. 299-304.
Zhang, J., Soutis, C., and Fan, J. (1994a). Strain Energy Release Rate Associated with LocalDelaminations in Cracked Composite Laminates. Composites, Vol. 25, No. 9, pp. 851-862.
Zhang, J., Soutis, C., and Fan, J. (1994b). Effects of Matrix Cracking and Hygrothermal Stresseson the Strain Energy Release Rate for Edge Delamination in Composite Laminates. Composites,Vol. 25, No.1, pp. 27-35.

J. André Lavoie Part I
23
Table 1. Specimen sizes and dimensions.scale n plies length
(mm)width(mm)
thickness(mm)
1/4 1 8 146.1 12.7 1.0921/2 2 16 292.1 25.4 2.1593/4 3 24 438.2 38.1 3.302Full 4 32 584.2 50.8 4.394
Table 2. Mechanical properties of [+θn/-θn/902n]s laminates for differing size, n.θ n=1 n=2 n=3 n=4
degrees modulus strength
strain modulus strength
strain modulus strength
strain modulus strength
strain
GPa MPa % GPa MPa % GPa MPa % GPa MPa %0 74.3 843.2 1.24 71.5 814.5 1.11 70.5 796.6 1.08 73.8 764.7 1.0215 65.5 449.6 0.726 63.3 324.7 0.541 62.6 271.9 0.446 61.0 234.5 0.39330 42.1 270.2 0.824 -- 173.2 -- 41.7 156.9 0.441 40.3 139.6 0.39545 22.5 140.5 0.843 -- 84.7 -- 20.8 79.4 0.577 19.7 79.3 0.50360 13.3 65.9 0.521 12.2 53.0 0.443 12.4 44.9 0.357 12.9 33.7 0.28775 10.9 43.9 0.417 10.2 42.6 0.513 10.4 35.7 0.334 10.2 31.1 0.30390 10.8 39.3 0.366 10.1 38.3 0.383 10.2 38.2 0.377 10.2 37.0 0.846
Table 3. Thermal Stress Induced 90° Crack Density of [+θn/-θn/902n]s
constraint ply angle0° 15° 30° 45°
scale nd(1)
(cm)r(2) d
(cm)r d
(cm)r d
(cm)r
1/4 1 ∞ 0 ∞ 0 ∞ 0 ∞ 01/2 2 1.02 0.10 0.37 0.27 0.33 0.30 4.17 0.023/4 3 0.42 0.36 0.34 0.45 0.87 0.17 0.64 0.24Full 4 0.39 0.51 0.45 0.44 1.00 0.20 0.67 0.30
(1) d is the average crack spacing in the 90° plies.(2) r is the micro crack density, where r=a/d, and a = the 90° ply block thickness.
Table 4. Count of Thermal Stress-Induced Cracks in +θ° Plies+θ° constraint ply angle
gauge length, 0° 15° 30° 45°mm n top bottom top bottom top bottom top bottom
146.1 1 0 0 0 0 0 0 0 0292.1 2 0 0 0 0 0 0 0 0438.2 3 0 0 11 0 50 0 0 0279.4 4 4 4 4 0 0 1 28 0
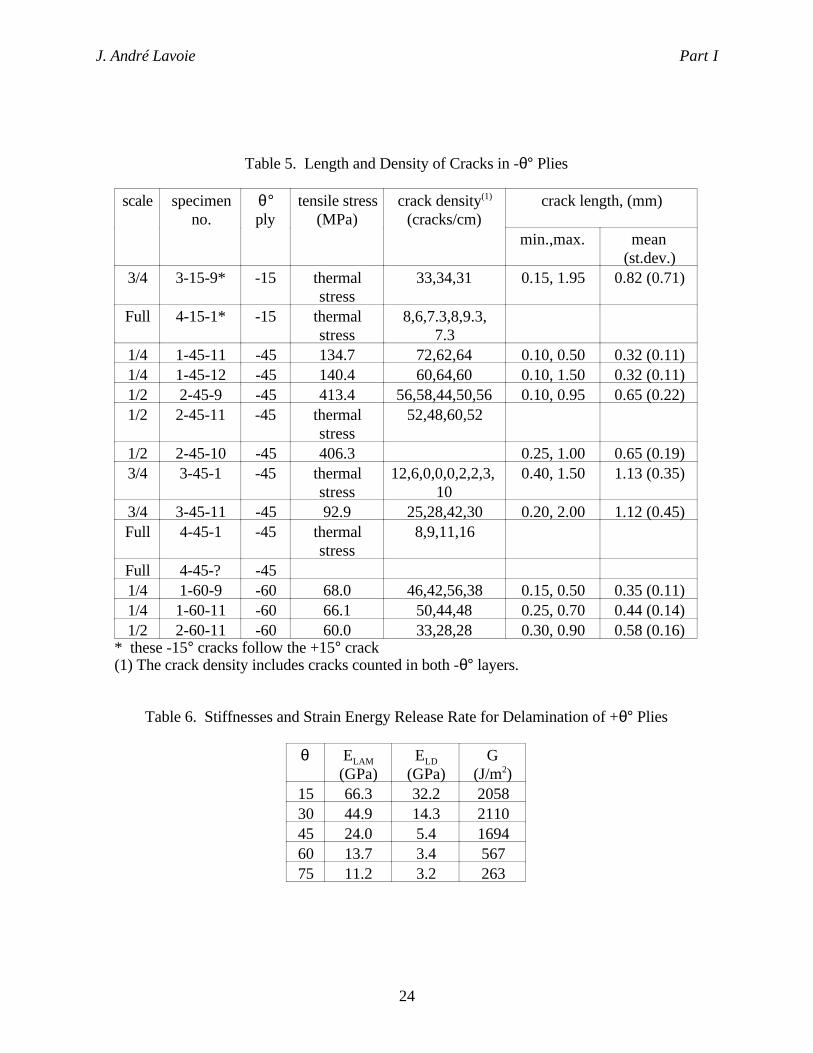
J. André Lavoie Part I
24
Table 5. Length and Density of Cracks in -θ° Plies
scale specimenno.
θ°ply
tensile stress(MPa)
crack density(1)
(cracks/cm)crack length, (mm)
min.,max. mean(st.dev.)
3/4 3-15-9* -15 thermalstress
33,34,31 0.15, 1.95 0.82 (0.71)
Full 4-15-1* -15 thermalstress
8,6,7.3,8,9.3,7.3
1/4 1-45-11 -45 134.7 72,62,64 0.10, 0.50 0.32 (0.11)1/4 1-45-12 -45 140.4 60,64,60 0.10, 1.50 0.32 (0.11)1/2 2-45-9 -45 413.4 56,58,44,50,56 0.10, 0.95 0.65 (0.22)1/2 2-45-11 -45 thermal
stress52,48,60,52
1/2 2-45-10 -45 406.3 0.25, 1.00 0.65 (0.19)3/4 3-45-1 -45 thermal
stress12,6,0,0,0,2,2,3,
100.40, 1.50 1.13 (0.35)
3/4 3-45-11 -45 92.9 25,28,42,30 0.20, 2.00 1.12 (0.45)Full 4-45-1 -45 thermal
stress8,9,11,16
Full 4-45-? -451/4 1-60-9 -60 68.0 46,42,56,38 0.15, 0.50 0.35 (0.11)1/4 1-60-11 -60 66.1 50,44,48 0.25, 0.70 0.44 (0.14)1/2 2-60-11 -60 60.0 33,28,28 0.30, 0.90 0.58 (0.16)
* these -15° cracks follow the +15° crack(1) The crack density includes cracks counted in both -θ° layers.
Table 6. Stiffnesses and Strain Energy Release Rate for Delamination of +θ° Plies
θ ELAM
(GPa)ELD
(GPa)G
(J/m2)15 66.3 32.2 205830 44.9 14.3 211045 24.0 5.4 169460 13.7 3.4 56775 11.2 3.2 263
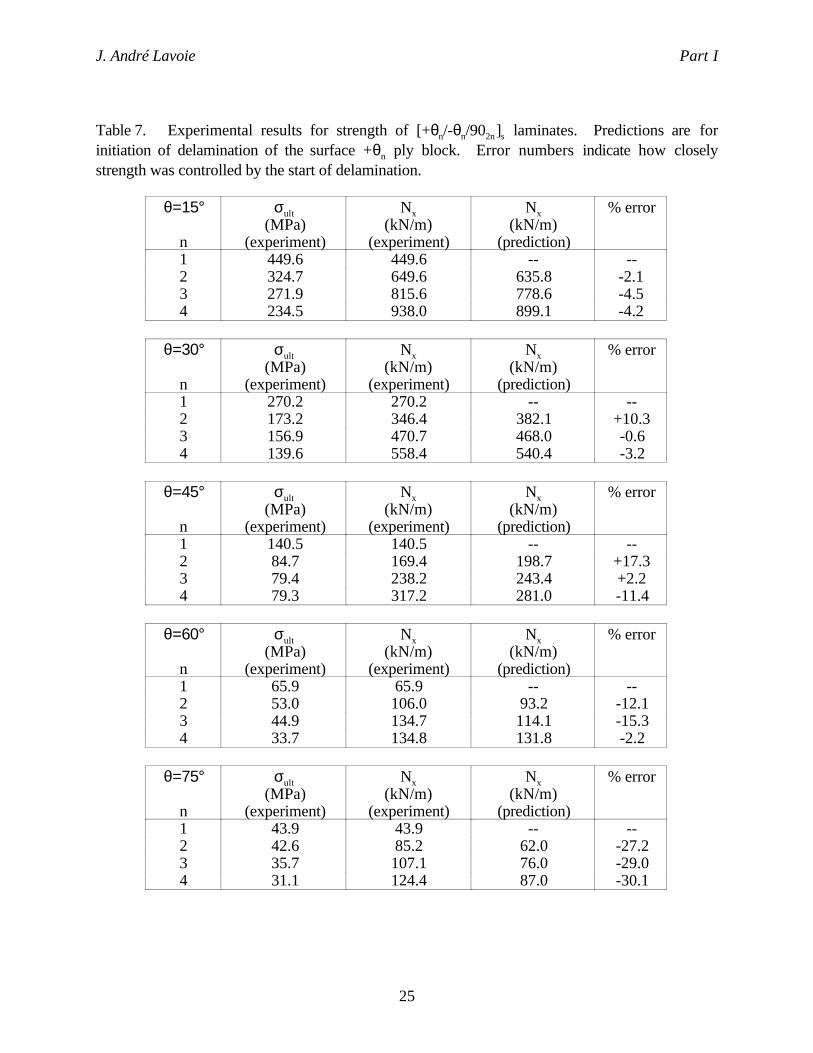
J. André Lavoie Part I
25
Table 7. Experimental results for strength of [+θn/-θn/902n]s laminates. Predictions are forinitiation of delamination of the surface +θn ply block. Error numbers indicate how closelystrength was controlled by the start of delamination.
θ=15°
n
σult
(MPa)(experiment)
Nx
(kN/m)(experiment)
Nx
(kN/m)(prediction)
% error
1 449.6 449.6 -- --2 324.7 649.6 635.8 -2.13 271.9 815.6 778.6 -4.54 234.5 938.0 899.1 -4.2
θ=30°
n
σult
(MPa)(experiment)
Nx
(kN/m)(experiment)
Nx
(kN/m)(prediction)
% error
1 270.2 270.2 -- --2 173.2 346.4 382.1 +10.33 156.9 470.7 468.0 -0.64 139.6 558.4 540.4 -3.2
θ=45°
n
σult
(MPa)(experiment)
Nx
(kN/m)(experiment)
Nx
(kN/m)(prediction)
% error
1 140.5 140.5 -- --2 84.7 169.4 198.7 +17.33 79.4 238.2 243.4 +2.24 79.3 317.2 281.0 -11.4
θ=60°
n
σult
(MPa)(experiment)
Nx
(kN/m)(experiment)
Nx
(kN/m)(prediction)
% error
1 65.9 65.9 -- --2 53.0 106.0 93.2 -12.13 44.9 134.7 114.1 -15.34 33.7 134.8 131.8 -2.2
θ=75°
n
σult
(MPa)(experiment)
Nx
(kN/m)(experiment)
Nx
(kN/m)(prediction)
% error
1 43.9 43.9 -- --2 42.6 85.2 62.0 -27.23 35.7 107.1 76.0 -29.04 31.1 124.4 87.0 -30.1

J. André Lavoie Part I
26
Figure 1. X-radiograph of thermal stress-induced matrix microcracks in the n=4 size layup[+154/-154/908]s. The 90° ply matrix cracks run from left to right. Stress redistribution around the+15° ply matrix cracks induce formation of short, stich-like, -15° ply matrix cracks.

J. André Lavoie Part I
27
Figure 2. X-radiograph of thermal stress-induced matrix microcracks in the n=4 size layup[+304/-304/908]s. The 90° ply matrix cracks run from left to right, and trigger formation of a fewshort, stich-like, -30° ply matrix cracks. This layup exhibits long -30° ply matrix cracks, inaddition to +30° ply matrix cracks.

J. André Lavoie Part I
28
Figure 3. X-radiograph of thermal stress-induced matrix microcracks in the ply-level scaled,(n=4) layup [+454/-454/908]s. The 90° ply matrix cracks run from left to right, and triggerformation of a many short, stich-like, -45° ply matrix cracks. Long +45° ply matrix cracksappear.

J. André Lavoie Part I
29
0
200
400
600
800
1000
0 0.2 0.4 0.6 0.8 1 1.2 1.4
n=1n=2n=3n=4
stress,MPa
strain, %
[ 02 n
/ 9 02 n
]s
0
100
200
300
400
500
0 0.1 0.3 0.4 0.5 0.7 0.8
n=1n=2n=3n=4
strain, %
[+15n/ - 1 5
n/ 9 0
2 n]
s
0
5 0
100
150
200
250
300
0 0.2 0.4 0.6 0.8 1
n=1n=2n=3n=4
stress,MPa
strain, %
[+30n/ - 3 0
n/ 9 0
2 n]
s
0
2 0
4 0
6 0
8 0
100
120
140
160
0 0.2 0.4 0.6 0.8 1
n=1n=2n=3n=4
strain, %
[+45n/ - 4 5
n/ 9 0
2 n]
s
0
1 0
2 0
3 0
4 0
5 0
6 0
7 0
8 0
0 0.1 0.2 0.3 0.4 0.5 0.6
n=1n=2n=3n=4
stress,MPa
strain, %
[+60n/ - 6 0
n/ 9 0
2 n]
s
0
1 0
2 0
3 0
4 0
5 0
6 0
0 0.1 0.2 0.3 0.4 0.5 0.6
n=1n=2n=3n=4
strain, %
[+75n/ - 7 5
n/ 9 0
2 n]
s
Figure 4. Typical stress versus strain plots for [+θn/-θn/902n]s laminates.
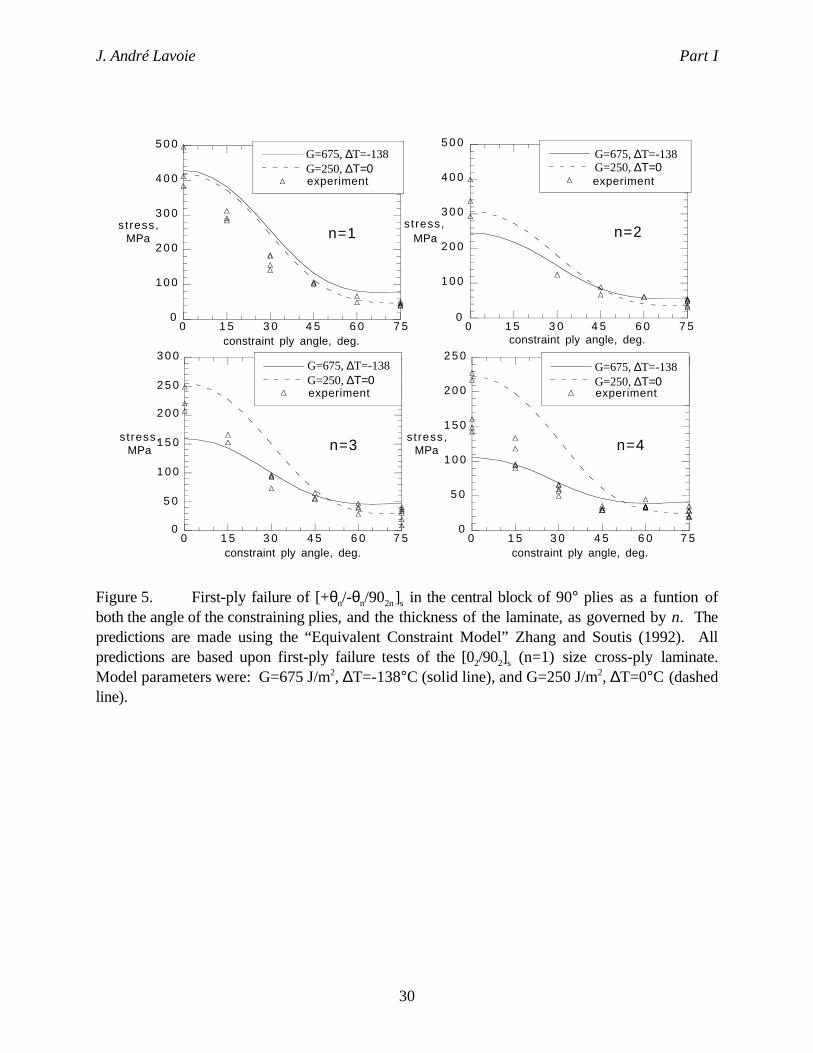
J. André Lavoie Part I
30
0
5 0
1 0 0
1 5 0
2 0 0
2 5 0
0 1 5 3 0 4 5 6 0 7 5
experiment
stress,MPa
constraint ply angle, deg.
n=4
G=675, ∆T=-138G=250, ∆Τ=0
0
5 0
1 0 0
1 5 0
2 0 0
2 5 0
3 0 0
0 1 5 3 0 4 5 6 0 7 5
experiment
stress,MPa
constraint ply angle, deg.
n=3
G=675, ∆T=-138G=250, ∆Τ=0
0
1 0 0
2 0 0
3 0 0
4 0 0
5 0 0
0 1 5 3 0 4 5 6 0 7 5
experiment
stress,MPa
constraint ply angle, deg.
n=2
G=675, ∆T=-138G=250, ∆Τ=0
0
1 0 0
2 0 0
3 0 0
4 0 0
5 0 0
0 1 5 3 0 4 5 6 0 7 5
experiment
stress,MPa
constraint ply angle, deg.
n=1
G=675, ∆T=-138G=250, ∆Τ=0
Figure 5. First-ply failure of [+θn/-θn/902n]s in the central block of 90° plies as a funtion ofboth the angle of the constraining plies, and the thickness of the laminate, as governed by n. Thepredictions are made using the “Equivalent Constraint Model” Zhang and Soutis (1992). Allpredictions are based upon first-ply failure tests of the [02/902]s (n=1) size cross-ply laminate.Model parameters were: G=675 J/m2, ∆T=-138°C (solid line), and G=250 J/m2, ∆T=0°C (dashedline).
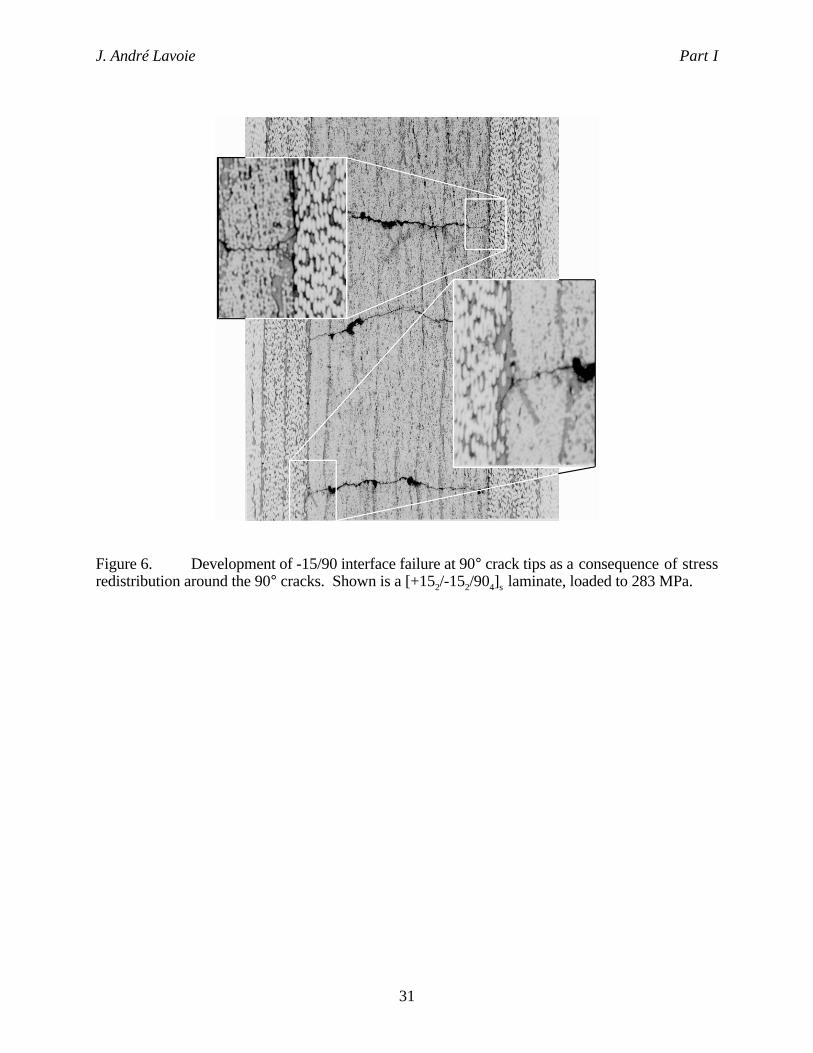
J. André Lavoie Part I
31
Figure 6. Development of -15/90 interface failure at 90° crack tips as a consequence of stressredistribution around the 90° cracks. Shown is a [+152/-152/904]s laminate, loaded to 283 MPa.

J. André Lavoie Part I
32
Figure 7. Coalescence of inclined secondary cracks in the 90° plies with 90° crack-tipdelaminations into a continuous -15/90 interface delamination. Shown is a [+152/-152/904]s
laminate, loaded to 339 MPa.

J. André Lavoie Part I
33
Figure 8. Comparatively high loading did not produce a general edge delamination.Delaminations were very localized and associated with 90° crack-tip delamination. Shown is a[+152/-152/904]s laminate, loaded to 311 MPa.
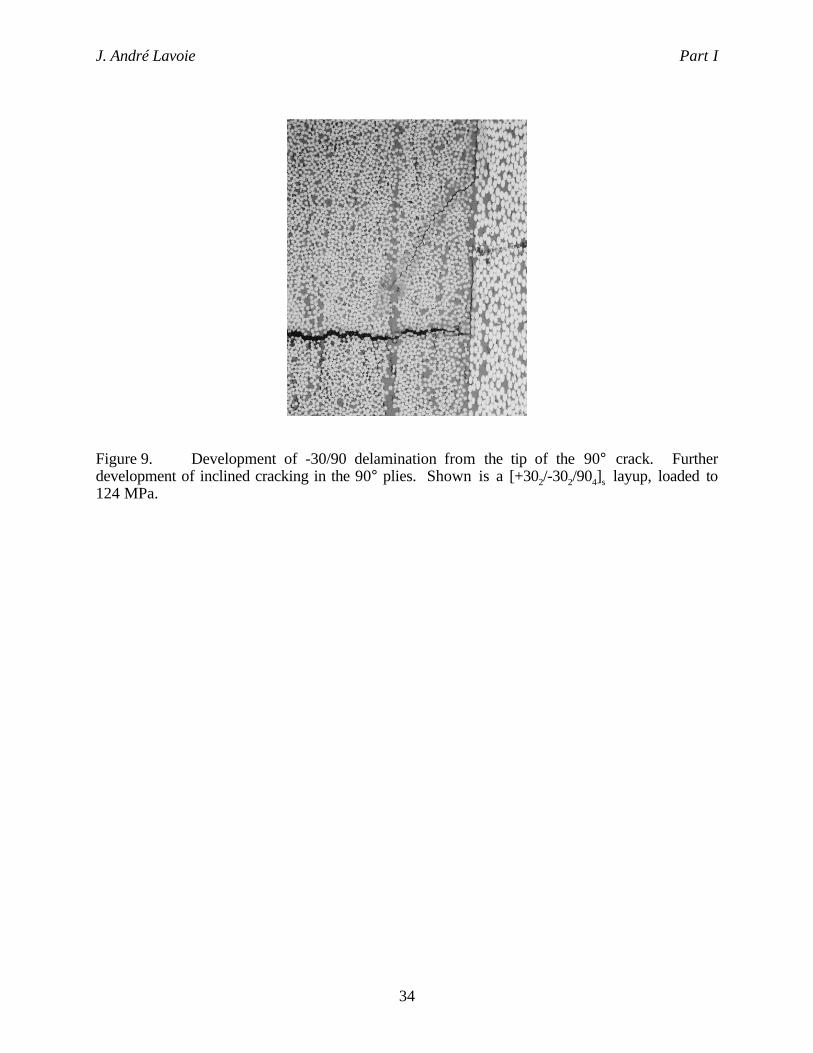
J. André Lavoie Part I
34
Figure 9. Development of -30/90 delamination from the tip of the 90° crack. Furtherdevelopment of inclined cracking in the 90° plies. Shown is a [+302/-302/904]s layup, loaded to124 MPa.
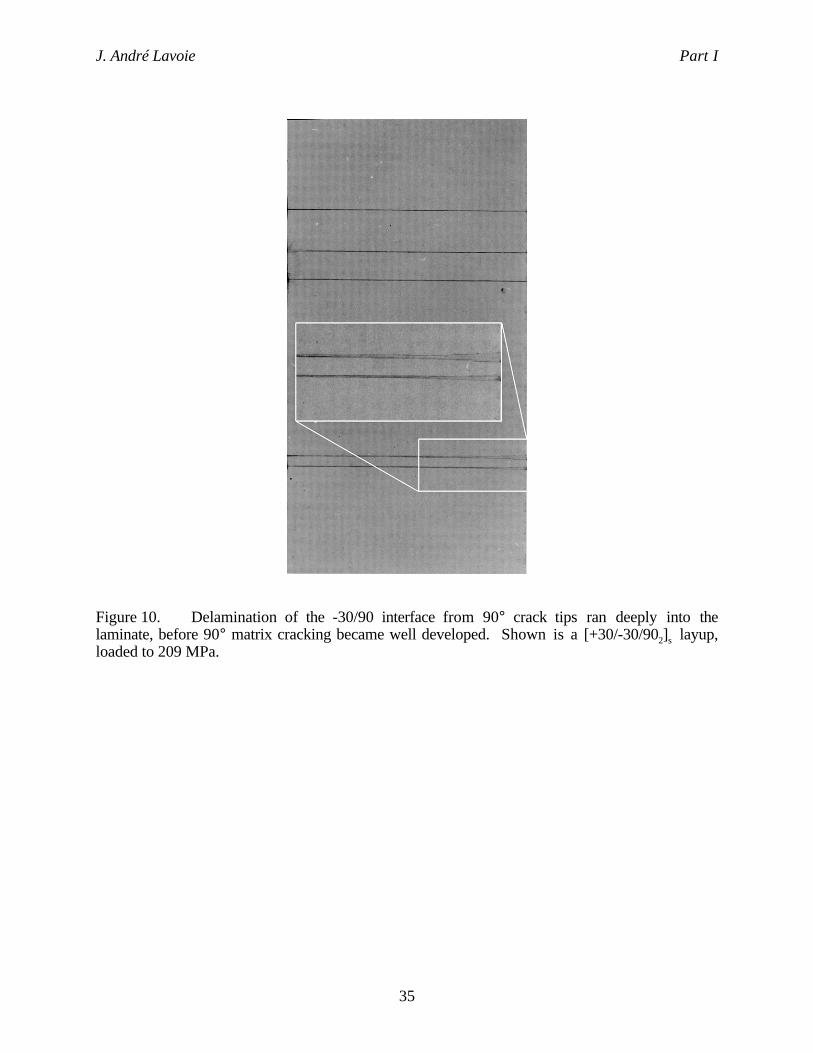
J. André Lavoie Part I
35
Figure 10. Delamination of the -30/90 interface from 90° crack tips ran deeply into thelaminate, before 90° matrix cracking became well developed. Shown is a [+30/-30/902]s layup,loaded to 209 MPa.

J. André Lavoie Part I
36
Figure 11. Progress of damage in a [+30/-30/902]s layup loaded to 227 MPa. Right edge,unpolished, shows rapid coalescence of -30/90 local delaminations had formed one large edgedelamination. Left edge shows that polishing suppressed the edge delamination, but that -30°cracks formed instead.

J. André Lavoie Part I
37
Figure 12. Growth of a -30° crack from the tip of a 90° crack at the -30/90 interface. Shownis a [+302/-302/904]s laminate, loaded to 160 MPa.

J. André Lavoie Part I
38
Figure 13. Internal view, perpendicular to the 90° plies, close to the intersection of a -45° stitchcrack and a 90° crack. There was no -45/90 delamination. Specimen was an n=4 size, [+454/-454/908]s laminate, not yet loaded. Magnification is 400X.

J. André Lavoie Part I
39
Figure 14. An interior section, close to the intersection of the -45° and 90° cracks, cut andpolished perpendicular to the 90° plies. Shown is a [+45/-45/902]s laminate which had been loadedto failure. No -45/90 delamination can be observed.
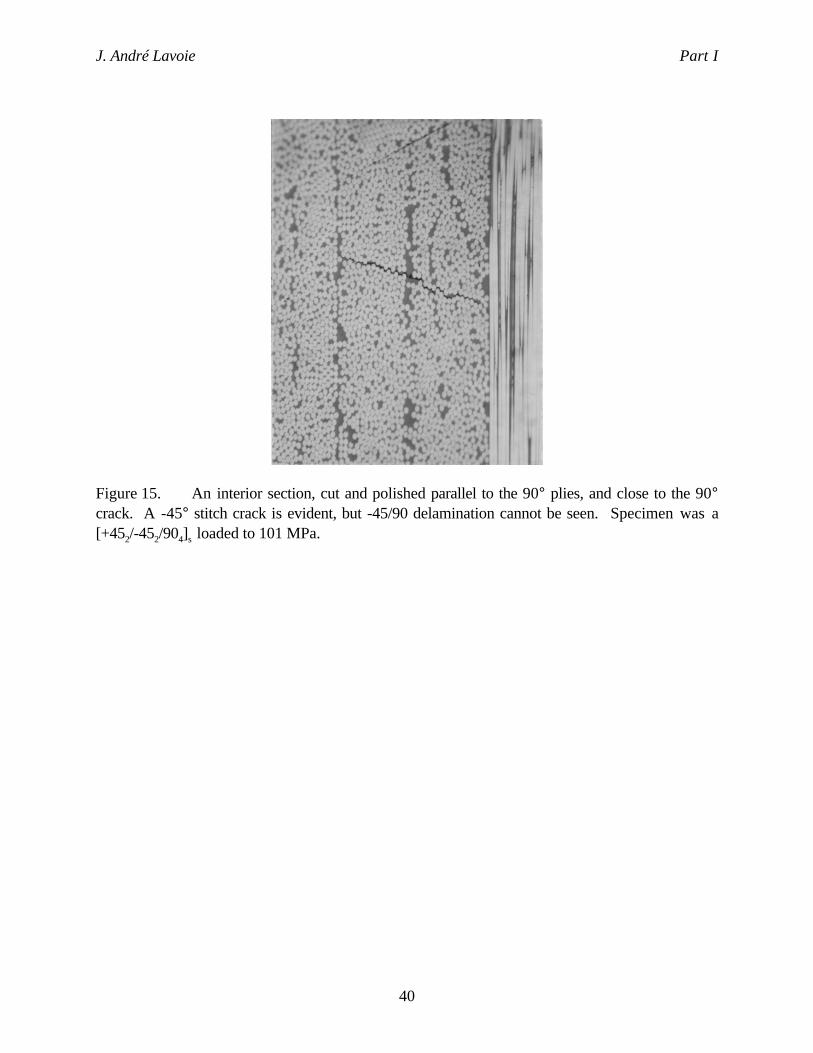
J. André Lavoie Part I
40
Figure 15. An interior section, cut and polished parallel to the 90° plies, and close to the 90°crack. A -45° stitch crack is evident, but -45/90 delamination cannot be seen. Specimen was a[+452/-452/904]s loaded to 101 MPa.

J. André Lavoie Part I
41
Figure 16. Formation of 90° cracks results in -60° stitch cracks. The +60° cracks initiate from-60° cracks, and prefer to start near 90° cracks. Specimen is a [+60/-60/902]s layup, loaded to 66MPa.
Figure 17. Additional 90° cracks formed, but under the +60° cracks. Stitch cracks in the -60°plies formed due to +60° cracks. Specimen is a [+60/-60/902]s layup, loaded to 68 MPa. Failurewas imminent.

J. André Lavoie Part I
42
(a) first failure (b) second failure
Figure 18. Micrographs of the polished edge of the sublaminate-level scaled [(+60/-60/902)2]s
layup. The first failure event (a) occurs at 63 MPa, and consists of midplane 90° ply matrix cracksand immediate formation of short, stich-like, -60° ply matrix cracks. The second failure event (b)occurs at 75 MPa, and consists of off-center 90° ply matrix cracks and immediate formation ofshort, stich-like, -60° and +60° ply matrix cracks in all remaining 60° plies.
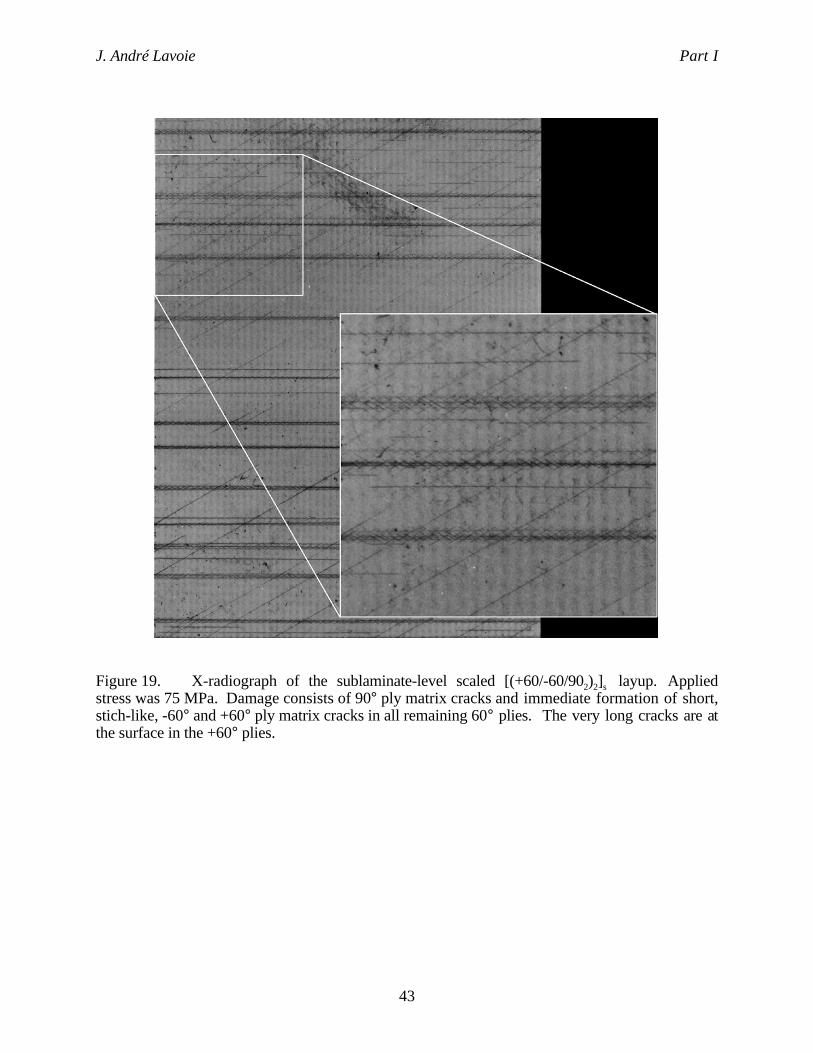
J. André Lavoie Part I
43
Figure 19. X-radiograph of the sublaminate-level scaled [(+60/-60/902)2]s layup. Appliedstress was 75 MPa. Damage consists of 90° ply matrix cracks and immediate formation of short,stich-like, -60° and +60° ply matrix cracks in all remaining 60° plies. The very long cracks are atthe surface in the +60° plies.

J. André Lavoie Part I
44
0
2 0
4 0
6 0
8 0
1 0 0
1 2 0
0 0.5 1 1.5 2 2.5
model (Gudmundson)experiment (Lavoie)
s t ress,MPa
strain, %
[ (+60 / -60 /902)2]
S
mid-plane90's
mid-plane 90's& adjacent -60's
off-center90 's
all 60's
off-center 90's& remaining +/-60's
onset ofply scissoring
Figure 20. Modeled (solid line) and actual (dashed line) stress-strain response of thesublaminate-level scaled [(+60/-60/902)2]s layup. Arrows indicate the onset of matrixmicrocracking in the various plies, or ply groups.

J. André Lavoie Part I
45
(a) (b)
Figure 21. An x-ray of a captured +15° delamination in an (a) n=1 size [+15/-15/902]s layup,loaded to 398 MPa. (b) n=3 size [+153/-153/906]s layup, loaded to 192 MPa.

J. André Lavoie Part I
46
(a) (b) (c)
Figure 22. Three sizes of [+45n/-45n/902n]s shown at stresses very near their respective failurestress. Several +45° delaminations appear before ultimate failure in (a) n=1 size at 147 MPa, and105% of average failure stress in (b) n=2 size at 103 MPa, or 123% of average failure stress, andin (c) n=3 size at 69 MPa, or 87% of average failure stress.

J. André Lavoie Part I
47
Figure 23. Photographs of failed [+θ3/-θ3/906]s laminates.

J. André Lavoie Part I
48
0
200
400
600
800
1000
1200
1 2 3 4
[+15n/ - 1 5
n/ 9 0
2 n]
s
Jackson/Kellas dataLavoie dataO'Brien model
Nx
kN /m
n
0
100
200
300
400
500
600
1 2 3 4
[+30n/ - 3 0
n/ 9 0
2 n]
s
Jackson/Kellas dataLavoie dataO'Brien model
Nx
kN /m
n
0
100
200
300
400
1 2 3 4
[+45n/ - 4 5
n/ 9 0
2 n]
s
Jackson/Kellas dataLavoie dataO'Brien model
Nx
kN /m
n
0
5 0
100
150
200
1 2 3 4
[+60n/ - 6 0
n/ 9 0
2 n]
s
Jackson/Kellas dataLavoie dataO'Brien model
Nx
kN /m
n
0
4 0
8 0
120
160
1 2 3 4
[+75n/ - 7 5
n/ 9 0
2 n]
s
Jackson/Kellas dataLavoie dataO'Brien model
Nx
kN /m
n
Figure 24. The strength scaling (displayed as a force-resultant) of [+θn/-θn/902n]s AS-4/3502carbon/epoxy laminates is effectively predicted using a strain-energy release rate model fordelamination. Experimental data from Jackson and Kellas (1993) (circles), one year later byLavoie (diamond), and O’Briens (1993) model (line).