analysis of mnchoices
TRANSCRIPT

Research and Analysis of
Individual Budget
Methodologies
Minnesota Waiver Reimagine Project.
Study 2, Tasks 2.2 and 2.42.4
Analysis of
MnCHOICES
Minnesota Waiver Reimagine Project
Study 2, Task 2.4

Prepared for: Minnesota Department of Human Services
Disability Services Division
PO Box 64967
St. Paul, MN 55164-0967
https://mn.gov/dhs/
Prepared by: Colleen Kidney, Jami Petner-Arrey, & John Agosta
Human Services Research Institute
7690 SW Mohawk St.
Tualatin, OR 97062
503-924-3783
www.hsri.org
This project is sponsored by the Minnesota Department of Human Services, Disability Services
Division (DHS/DSD). All opinions expressed herein are solely those of the authors and do not
reflect the position or policy of the Department of Human Services.
April 30, 2018
About the Human Services Research Institute
The Human Services Research Institute (www.hsri.org) is a nonprofit, mission-driven
organization that works with government agencies and others to improve health and human
services and systems, enhance the quality of data to guide policy, and engage stakeholders to
effect meaningful systems change.

Contents
INTRODUCTION ............................................................................................................................. 1
Background .................................................................................................................................. 1
FINDINGS ...................................................................................................................................... 2
Demographics ............................................................................................................................. 2
Support Need .............................................................................................................................. 6
Activities of Daily Living (ADLs) ............................................................................................. 6
Instrumental Activities of Daily Living (IADLs) ....................................................................10
Health Support Needs ............................................................................................................ 13
Psychosocial Support Needs ................................................................................................... 16
Exploring Waiver Participants by Support Need Groups .......................................................... 18
Determining Support Need Groups ....................................................................................... 19
Support Need Groups Across Waivers .................................................................................. 27
Support Need Groups using CDCS ........................................................................................ 28
Support Need Group and Service Recipient Demographics ................................................. 29
CONSIDERATIONS ...................................................................................................................... 33
Next Steps ................................................................................................................................. 33
BACKGROUND AND APPROACH ............................................................................................... 34
MnCHOICES Background ........................................................................................................ 34
Methods ..................................................................................................................................... 35
Review MnCHOICES ............................................................................................................. 36
Collect, Review, & Merge Datasets ........................................................................................ 36
Conduct Exploratory Descriptive Statistics ........................................................................... 36
Sum Scores on Selected Domains/Items .............................................................................. 37
Create Preliminary Analysis Support Need Groups .............................................................. 40
Explore Support Need Groups by Waiver Participants .......................................................... 41
Limitations ................................................................................................................................. 41
MnCHOICES Validity and Reliability .................................................................................... 41
Content and Format of MnCHOICES Items and Sections .................................................... 42
Analysis Inclusion Criteria .................................................................................................... 43
Appendix: MnCHOICES Domains and Descriptions ................................................................... 44

1
INTRODUCTION
Background
HSRI is under contract with the Minnesota Department of Human Services (DHS),
Disability Services Division (DSD) to complete two studies. The first will determine
potential options for reconfiguring four Medicaid Home and Community Based
Services (HCBS) waivers associated with people with disabilities. The second will
determine a unified individual budgeting model for the proposed reconfiguration,
both for individuals utilizing regular waiver services and those self-directing services
through the Consumer-Directed Community Supports (CDCS) service.
Regarding Study 2, in advance of deciding on an individual budget methodology, the
project team is undertaking a series of research and analysis tasks to gain knowledge
of efforts elsewhere to establish individual budgets. The team is also undertaking an
analysis of the MnCHOICES assessment tool and data collected to date, historical
service use and costs, and the current CDCS methodology.
This paper pertains in particular to Study 2, Task 2.4 and includes the results of our
analysis of MnCHOICES data. What follows are findings from this analysis,
considerations, and a description of the methods we used to complete this work.

2
FINDINGS
DHS seeks to use the MnCHOICES assessment to inform a budget methodology for
individuals who receive services in Minnesota. (See Background and Approach for
more information). For this reason, we must first understand the support needs of
individuals served and how support needs are likely to impact the resulting budget
methodology. The findings below show the results of descriptive analyses of the
MnCHOICES data, including a look at demographics and measures of support need.
Then, using groups that range from “low support need” to “high support need,” we
compare summary support need information across waiver participants.
Demographics
This section provides demographic information describing the population for whom
we plan to develop a budget methodology.
In total, we explored MnCHOICES data from 27,808 individuals across the four
waivers (see the section on Methods for inclusion criteria). The vast majority are
served on the CADI waiver (n=17,359) and DD waiver (n=9,170).
Figure 1
Most of the individuals represented in MnCHOICES are served on either the CADI
waiver or DD waiver, though relatively small percentages of these are using CDCS
In contrast, nearly half of CAC waiver recipients use CDCS (48%). Overall, 11% of the
waiver recipients are using CDCS.
Figure 2
Nearly half of CAC waiver recipients use CDCS
n = 27,808

3
Across all waivers, 2,951 service recipients are children under age 18 (Figure 3).
Adults ages 50 to 64 years old compose the largest group of recipients, due mainly to
the high number of individuals in this age group on the CADI waiver.
Figure 3
Children ages 0-17 account for approximately 3,000 (or 11%) of the waiver
recipients
n = 27,808
As displayed below, the proportion of waiver recipients in the 0-17 age group ranges
from a low of 3% (BI) to a high of 50% (CAC).
Figure 4
Children comprise half of the CAC waiver group
n = 27,808.
While 11% of all service recipients use CDCS, this percentage differs drastically
between children and adults (Figure 5). Across all children, 60% use CDCS while 6%
of adults use CDCS.

4
Figure 5
Children and young adults are significantly more likely to be using CDCS than are
older adults
n = 27,808.
Residence—like age—is typically a significant factor in determining individual
budgets. The MnCHOICES data do not currently capture residential setting. For the
figure below, we used the residential setting data from the Long-Term Care (LTC)
screening document. Further analyses including residence will be considered in Task
2.5.
Figure 6
Across the four waivers, waiver recipients are most likely to live in their own home
n = 26,438
Note: 1,370 had residence that was unknown, so the totals for residence are less than the overall population.
Across the waiver population, there are slightly more male than female waiver
recipients, 52% versus 48%, respectively (Figure 7). Though we did not include CDCS
in Figure 7, a slightly higher proportion of males (14%) use CDCS than females (9%)
across all waivers.

5
Figure 7
Females account for one-third of the BI waiver group but slightly over half of the
CADI waiver group
n = 27,808.
The waiver population is predominantly white, as displayed below. Though not
included in the figure below, 2% of the waiver population identified as
Spanish/Hispanic/Latino.
Figure 8
Across the four waiver groups, most recipients are white
N=26,934
Note: 874 people had race/ethnicity that was unknown, so the totals for race/ethnicity are less the overall
population.
Figure 9
A substantially higher proportion of individuals who identify as multiracial
use CDCS (32%) compared to the other race groups
n = 26,934
Note: Multiracial is described as two or more races

6
Support Need
DHS is interested in pursuing a budget methodology that considers individual
support need. Here, we describe the support needs of service recipients across all
waivers for adults only (since there are differences in how MnCHOICES handles
adults and children). We considered four domains of MnCHOICES for the analysis:
Activities of Daily Living (ADLs), Instrumental Activities of Daily Living (IADLs),
Health, and Psychosocial since these domains measure support needs that are most
likely to impact the budget methodology.
ADLs are defined as the basic tasks carried out throughout the day such as bathing,
maintaining personal hygiene and dressing. IADLs are the additional set of life
functions necessary for maintaining a person’s immediate environment, such as meal
preparation, transportation, and housework. The Health domain measures medical
support needs such as G-tube feeding and ostomy care, while the Psychosocial
domain measures behavioral and emotional support needs (See the Appendix for
more information about these domains).
ADLs
MnCHOICES measures the support needed for eight ADLs:
We focus our analysis on three consistent items used in MnCHOICES to ask about
support need for ADLs: (a) whether the person has difficulty or needs assistance with
the task, (b) what type of cueing or supervision is needed, and (c) what type of
physical assistance is needed (See the Methods section for details).
Difficulty with or Needs Assistance with ADLs
First, we explored whether the person has difficulty with or needs assistance with
each of the eight ADLs.
Figure 10 displays the number of adults who require assistance for each of the ADLs
and the percent out of all adults. Of all ADLs, most adults require support for bathing
and hygiene (69% and 68%, respectively), while relatively few require support for
positioning and transfers (18% and 28%, respectively).
Eating Bathing Dressing Hygiene
Toilet use Mobility Positioning Transfers

7
Figure 10
Most adult waiver recipients require assistance with bathing, hygiene, and
dressing
ADL Requires assistance
n
Requires assistance
% out of all adults
Eating 10,996 44%
Bathing 17,184 69%
Dressing 15,227 61%
Hygiene 16,982 68%
Toilet use 10,221 41%
Mobility 12,335 50%
Positioning 4,393 18%
Transfers 6,874 28%
n = 24,857
Cueing or Supervision and Physical Assistance with ADLs
MnCHOICES asks about “cueing/supervision” and “physical assistance” in two
separate questions that illustrate the type of support that people need. Figures 11
through 13 display crosstabulations1 of these two types of support in three areas:
eating, bathing, and dressing, respectively.
Figure 11
Most adults who need any assistance eating need intermittent or constant
cueing/supervision and setup/prep or limited physical assistance
n = 10,996
Note: 1 individual requires intermittent cueing and supervision but did not respond to the type of physical
assistance needed, so that individual is in the “null” row.
While the types of physical and cueing/supervision assistance needed for bathing
(Figure 12) are mostly similar, some individuals require limited physical assistance
and no cueing or supervision. Others require cueing/supervision assistance to initiate
the task but no physical assistance to complete the task.
1 A crosstab, or crosstabulation, is a means to combine and summarize data from one or more sources for analysis or reporting. They display the joint distribution of two or more variables in table or matrix
8
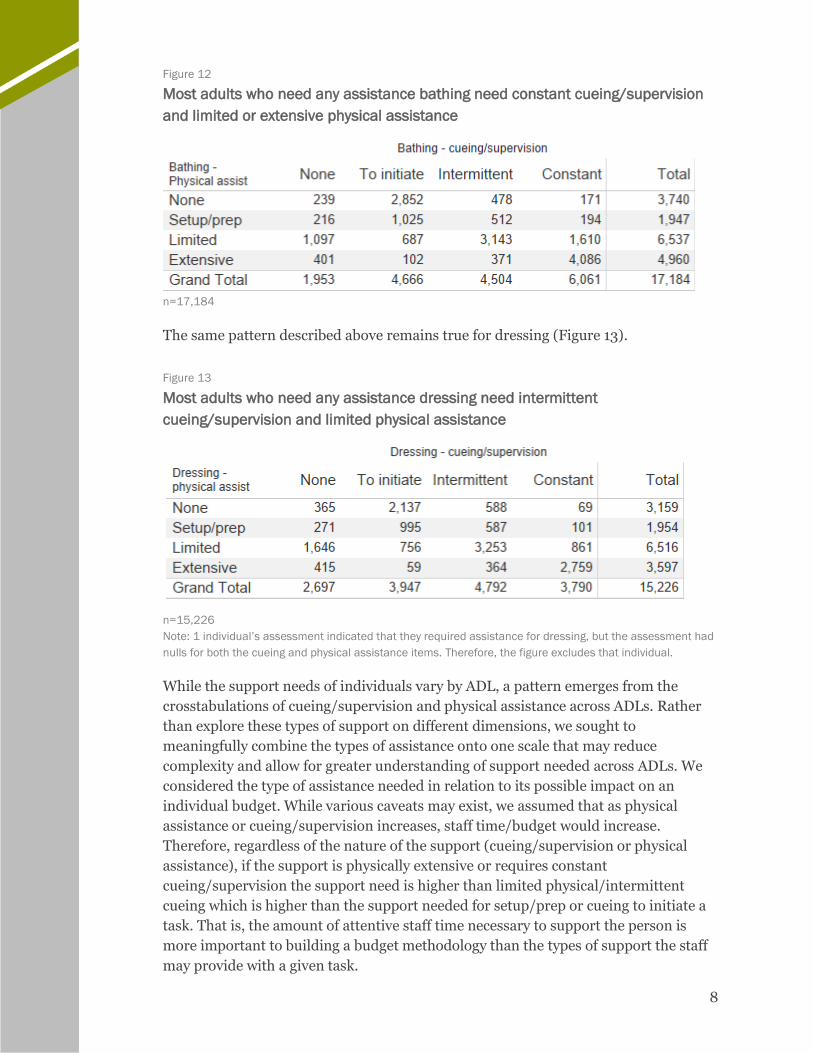
Figure 12
Most adults who need any assistance bathing need constant cueing/supervision
and limited or extensive physical assistance
n=17,184
The same pattern described above remains true for dressing (Figure 13).
Figure 13
Most adults who need any assistance dressing need intermittent
cueing/supervision and limited physical assistance
n=15,226
Note: 1 individual’s assessment indicated that they required assistance for dressing, but the assessment had
nulls for both the cueing and physical assistance items. Therefore, the figure excludes that individual.
While the support needs of individuals vary by ADL, a pattern emerges from the
crosstabulations of cueing/supervision and physical assistance across ADLs. Rather
than explore these types of support on different dimensions, we sought to
meaningfully combine the types of assistance onto one scale that may reduce
complexity and allow for greater understanding of support needed across ADLs. We
considered the type of assistance needed in relation to its possible impact on an
individual budget. While various caveats may exist, we assumed that as physical
assistance or cueing/supervision increases, staff time/budget would increase.
Therefore, regardless of the nature of the support (cueing/supervision or physical
assistance), if the support is physically extensive or requires constant
cueing/supervision the support need is higher than limited physical/intermittent
cueing which is higher than the support needed for setup/prep or cueing to initiate a
task. That is, the amount of attentive staff time necessary to support the person is
more important to building a budget methodology than the types of support the staff
may provide with a given task.

9
With this assumption, we measured support need for each ADL—counting the highest
amount of attentive staff time between the cueing/supervision item and physical
assistance item. Figure 14 displays the decision criteria to combine these two items to
create a single support need score for each ADL.
Figure 14
Decision criteria for creating a support need score for further analyses of ADL
support needs.
ADL Support Need
Highest support need type response between physical assistance
and cueing/supervision for each ADL in MnCHOICES Score Value
None and none 0 None
Setup/prep physical assistance or
initiate task cueing and supervision
1 Setup/prep
Limited physical assistance or
intermittent cueing and supervision
2 Limited/
intermittent
Extensive physical assistance or
constant cueing and supervision
3 Extensive/
constant
Figure 15 displays the ADL support need scores for each of the ADLs for all adults.
Figure 15
Support need scores by ADL
ADL None Setup/prep Limited/
intermittent
Extensive/
constant
Eating 14,203 (57%) 3,132 (13%) 4,235 (17%) 3,287 (13%)
Bathing 7,912 (32%) 4,093 (17%) 5,917 (24%) 6,935 (28%)
Dressing 9,996 (40%) 3,403 (14%) 6,830 (27%) 4,628 (19%)
Hygiene 8,027 (32%) 4,457 (18%) 7,514 (30%) 4,859 (20%)
Toilet use 15,218 (62%) 1,085 (4%) 4,607 (19%) 3,947 (16%)
Mobility 14,585 (59%) 1,100 (4%) 5,362 (22%) 3,810 (15%)
Positioning 20,603 (83%) 299 (1%) 1,812 (7%) 2,143 (9%)
Transferring 18,173 (73%) 386 (2%) 2,983 (12%) 3,315 (13%)
n=24,857
ADL Total Support Score
Once we determined a simplified scoring system consistent across each of the eight
ADLs, we calculated a sum score by adding individual scores across each of the eight
ADL support needs to create an ADL total support score. Prior to calculating this sum
score, we examined a correlation matrix for the cueing and supervision items, the
physical assistance items, and the ADL support need items to determine whether any
items were problematic for inclusion in the sum score. All items were significantly
and positively correlated to one another. The magnitude of the correlations range
from .24 up to .86, suggesting that further work to refine this measure should occur
prior to creating a sum score or using these items for the budget methodology. Given

10
the direction and significance of all the items, however, we created a sum score of all
ADL support need scores—the ADL total support score.
Since the ADL support need scores range from 0 (None) to 3 (Extensive/Constant)
and there are eight ADL items, the range of possible ADL total support scores is 0 to
24.
Below is the distribution of ADL total support scores across all adults displayed as a
histogram. The biggest group of individuals scored a 0—twice as many as the next
biggest group of individuals who scored a 2. Even without including “None,” the
distribution is non-normal, meaning it does not follow a bell-curve shape. This is not
uncommon when considering support need—many individuals have very little or very
high support need, and there is not an easily definable “average” support need.
Figure 16
ADL total support need scores from low (0) to high (24)
n = 24,857
We discuss further exploration of ADLs across the population in the “Exploring
Waiver Participants by Support Need Groups” section.
IADLs
In this section we focus on the IADL support needs in MnCHOICES data. We review
six IADLs in MnCHOICES:

11
We use two consistent items from each of the IADLs: (a) whether the person has
difficulty or needs assistance with the task, and (b) the frequency or amount of
assistance needed when performing the task. We first examine these items across all
IADLs using descriptive statistics. Then, we determine a preliminary solution for
examining IADLs holistically.
Needs Assistance with IADLs
First, we explored whether the person has difficulty or needs assistance with each of
the six IADLs. The figure below displays the number of adults who require assistance
for each of the IADLs and the percent out of all adults.
Figure 17
Almost all adults require support for housework, shopping and meal prep (93%,
91%, and 90%, respectively); less than half require support for telephone use
(44%)
IADL Requires assistance
n
Requires assistance
% out of all adults
Meal prep 22,268 90%
Transportation 20,629 83%
Housework 23,121 93%
Telephone use 11.054 44%
Shopping 22,665 91%
Finances 20,572 83%
n = 24,857
Amount of Assistance Needed with IADLs
MnCHOICES asks about the intensity of assistance required to perform IADL tasks,
with response options that range from “Needs no help or supervision” to “Always or
nearly always needs assistance.” We coded the responses options from 0 “None” to 3
“Always.” Figure 18 displays the IADL support need for each of the IADLs. Since
housework has three items and telephone use has two items, there are frequencies for
each of these items.
Meal prep Transportation Housework
Telephone use Shopping Finances

12
Figure 18
Support needs by IADL
IADL None Sometimes Often Always
Meal prep 2,723 (11%) 4,746 (19%) 7,293 (29%) 10,095 (41%)
Transportation 4,584 (18%) 3,601 (15%) 4,148 (17%) 12,524 (50%)
Housework – heavy 1,932 (8%) 3,424 (14%) 6,038 (24%) 13,463 (54%)
Housework – light 2,515 (10%) 6,180 (25%) 7,480 (30%) 8,682 (35%)
Laundry 3,582 (14%) 4,612 (19%) 5,832 (24%) 10,831 (44%)
Phone – Call 13,130 (57%) 3,590 (14%) 2,474 (10%) 4,663 (19%)
Phone – Answer 16,031 (65%) 2,772 (11%) 1,810 (7%) 4,244 (17%)
Shopping 2,255 (9%) 4,176 (17%) 7,257 (29%) 11,169 (45%)
Finances 4,319 (17%) 2,664 (11%) 5,625 (23%) 12,249 (49%)
n = 24,857
IADL Total Support Score
Once we determined a simplified scoring system consistent across each of the IADLs,
we calculated a sum score by adding the scores of each of the eight IADL support
needs to calculate the IADL total support score.
We examined a correlation matrix for the IADL support need items to determine
whether any items were problematic for inclusion in the sum score. The correlations
indicated strong positive correlations among most of the items, though finances
correlates less than .14 with each housework item. All correlations are statistically
significant. Most items have significant, strong, and positive correlations to one
another which justifies summing the scores for a preliminary examination of support
need for IADLs. Since the multiple housework and telephone items show strong
positive correlations with the other items in the same IADL section (housework item
correlations range from .76 to .79 and the telephone items correlation is .91), we
selected one question for housework and one question for telephone use so that the
score would not be skewed by including all of these items (see the Methods section for
more detail).
Since the IADL support need scores range from 0 (None) to 3 (Always) and there are
six ADL items, the range of possible IADL total support scores is 0 to 18. Below is the
distribution of IADL total scores across all adults displayed as a histogram. The mode
is 18, which is the highest possible score. As with the ADLs, this distribution is non-
normal but approaches normality besides the highest score.

13
Figure 19
Distribution of IADL total support needs
n = 24,857
We discuss further exploration of IADLs across the population in the “Exploring
Waiver Participants by Support Need Groups” section.
Health Support Needs
MnCHOICES asks about the supports needed for maintaining health. Typically,
health needs are considered in addition to ADLs and IADLs as they likely impact the
budget since support needed for medical conditions often require intensive support
and may be administered by caregivers with specialized training. While much of the
Health section in MnCHOICES may be useful for planning purposes, we focus on
support needed rather than diagnoses or types of medical or health issues for this
analysis.
Needs Assistance with Treatments, Monitoring, and Therapies
The assessment collects detailed information about medical treatments, whether the
person needs assistance, and who provides the assistance (See the Appendix for more
information about MnCHOICES). Specifically, the section on treatment, monitoring,
and therapies was used for our analyses on health support needs.
Figure 20 below contains all treatments, monitoring, and therapies listed in
MnCHOICES and the number of adults who require them. The last column contains
the percent of adults who require that support daily. No single treatment, monitoring,
or therapy is required by more than 6% of adults on a daily basis, and most are
required by less than 2%.

14
Figure 20
No single treatment, monitoring, or therapy is required by more than 6% of adults
on a daily basis, and most are required by less than 2%
Treatments and Monitoring Performed daily by support person
n % of all adults
Cardiac Blood Pressure 602 2%
Cardioverter-defibrillator 12 <1%
Pacemaker 17 <1%
Vital signs 380 2%
Weight 192 1%
Elimination Bladder 138 1%
Bowel program 0 0%
Enemas 47 <1%
Sterile catheter change 0 0%
Clean self-catheter 154 1%
Intermittent catheter 70 <1%
Colostomy 104 <1%
Ileostomy 52 <1%
Scheduled toileting program 215 1%
Feeding and nutrition GJtube 242 1%
Gastrostomy 267 1%
Jejunostomy 28 <1%
Nasogastric 2 <1%
Oral stimulation program 36 <1%
Other swallowing disorders 306 1%
Special diet management 371 2%
Neurological Seizure Assist 715 3%
Apnea 59 <1%
CPAP 450 2%
Nebulizer 329 1%
Oxygen therapy 475 2%
Pulse Oximeter 196 1%
Bronchial Drainage Postural drainage 63 <1%
Respiratory vest 159 1%
Bi-Level 167 1%
Suctioning Nasopharyngeal 14 <1%
Oral 138 1%
Trach care 117 1%
Trach change 9 <1%
Ventilator Ventilator 107 <1%
Vascular Blood Glucose 625 3%
Protime/INR 0 0%
Other blood draw 26 <1%
Dialysis 16 <1%
IV Therapy Blood transfusions 0 0%
Chemotherapy 0 0%
Medications 0 0%
Total parenteral nutrition 15 <1%
Wounds Burn 12 <1%

15
Treatments and Monitoring Performed daily by support person
n % of all adults
Dressing changes 406 2%
Lesions 297 1%
Open surgical site 38 <1%
Ulcer 102 <1%
Wound vac 39 <1%
Skin Care Application ointment 1,595 6%
Dry bandage change 179 1%
Pressure relieving device 293 1%
Turning/repositioning program 626 3%
Other Dialectical behavior therapy 10 <1%
Electroconvulsive therapy 0 0%
Input/output measurements 103 <1%
Isolation precautions 22 <1%
Telemedicine 4 <1%
Other therapy 129 1%
Therapies Alternative therapies 22 <1%
Occupational therapy 206 1%
Pain management 86 <1%
Physical therapy 471 2%
Range of motion 786 3%
Respiratory therapy 118 1%
Speech therapy 88 <1%
Health total support score
To approximate a measure of medical support need for the purposes of this analysis
we tallied the number of daily support needs performed by someone other than the
individual. If a person has a medical need, they are assigned a “1” for the need, then
the 1’s are summed for a health total support score. The figure below displays the
criteria for scoring the health section items for analysis to generate the health total
support score.
Figure 21
Decision criteria for creating a support need score for further analyses of health
support needs
Treatment, monitoring,
or therapy frequency:
Treatment, monitoring, or
therapy performed by:
Health Support Need
score value
Never n/a 0 None
any self 0 None
less than daily someone other than self 0 None
daily someone other than self 1 Daily support needed
A health total support score is possible in the range of 0 (No daily support needed
from someone other than the individual) to 66 (all types of daily support needed from
someone other than the individual) though no adult has a health total support score
higher than 22. The figure below displays the distribution of the health total support

16
score across adults. The majority have a 0, or no daily health support need (78%).
Thirteen percent have at least one daily extraordinary health need that is performed
by someone other than them self.
Figure 22
Most adults do not have extraordinary health support needs.
n = 24,857
We discuss further exploration of Health support needs across the population and
compared to ADL and IADL support needs in the “Exploring Waiver Participants by
Support Need Groups” section.
Psychosocial Support Needs
As with support needs for health and medical conditions, psychosocial behaviors
often increase support need in ways that contribute to the need for higher individual
budgets, since supporting these needs may require intensive staffing patterns or staff
availability and supervision. Therefore, we considered psychosocial behaviors
separate from ADLs, IADLs, and health supports.
Support needed for psychosocial behaviors
MnCHOICES asks about 18 challenging behaviors. We focused our analysis on two
items: (a) frequency of needed support and (b) type of support needed.
Figure 23 displays the number and percent of adults who fall into the three intensities
of psychosocial behavior in each area measured. Note that the majority of adults have
no or less than weekly interventions for all the psychosocial behaviors.

17
Figure 23
Most adults do not have weekly challenging behaviors
Challenging behavior None or less than
weekly
Weekly+,
responds to
intervention
Weekly+, resists
intervention
Injurious to self 21,283 (85%) 1,924 (8%) 1,750 (7%)
Physically aggressive 22,114 (89%) 1,162 (5%) 1,581 (6%)
Verbally aggressive 17,177 (69%) 4,133 (17%) 3,547 (14%)
Socially unacceptable behavior 20,400 (82%) 2,564 (10%) 1,893 (8%)
Property destruction 23,075 (93%) 776 (3%) 1,006 (4%)
Wandering 22,933 (92%) 1,031 (4%) 893 (4%)
Legal involvement 24,369 (98%) 222 (1%) 266 (1%)
Pica 24,293 (98%) 314 (1%) 250 (1%)
Difficulties regulation emotion 15,790 (64%) 5,582 (23%) 3,485 (14%)
Susceptibility to victimization 14,546 (59%) 7,589 (31%) 2,722 (11%)
Withdrawal 16,119 (65%) 6,040 (24%) 2698 (11%)
Agitation 16,539 (67%) 5,023 (20%) 3,295 (13%)
Impulsivity 18,597 (75%) 3,77 (15%) 2,483 (10%)
Intrusiveness 21,437 (86%) 2,148 (9%) 1,272 (5%)
Injury to others 23,680 (95%) 484 (2%) 693 (3%)
Anxiety 12,901 (52%) 8,468 (34%) 3,488 (14%)
Psychotic behaviors 21,422 (86%) 1,905 (8%) 1,530 (6%)
Manic behaviors 23,523 (95%) 724 (3%) 610 (3%)
n = 24,857
Psychosocial total support score
As with the health scores, the measure for psychosocial behaviors do not measure the
intensity of the support needed, but instead list different challenging behaviors. To
determine a range from low to high challenging behaviors, we computed a sum
score—the psychosocial total support score. Since there is a meaningful
differentiation between whether the person resists an intervention or not, we consider
this in the sum score. That is, we treat responding to intervention differently than
resisting intervention. We calculate a score using the criteria displayed in the figure
below. Each adult gets a score of 0, 1, or 2 for each item depending on their responses.
Figure 24
Decision criteria for creating a support need score for further analyses of
psychosocial support needs
Challenging behavior
frequency
Intervention response Psychosocial Support Need
score value
Never or less than weekly n/a 0 None
weekly or more frequently responds to
intervention
1 weekly+, responds to
intervention
weekly or more frequently resists intervention 2 weekly+, resists intervention

18
Since MnCHOICES asks about 18 psychosocial behaviors and each has a response
from 0 to 2, the summed psychosocial scores may range from 0 to 36. The highest
psychosocial score across all adults is 34. Figure 25 displays the distribution of
psychosocial total support scores in adults. While the most frequent score was 0 (no
weekly challenging behaviors), the majority of adults have at least a score of 1,
indicating that most adults have at least one weekly challenging behavior that
requires intervention.
Figure 25
Most adults have at least one challenging behavior, requiring intervention at least
weekly.
n = 24,857
We discuss further exploration of Psychosocial support needs across the population
and compared to ADL and IADL support needs in the “Exploring Waiver Participants
by Support Need Groups” section.
Exploring Waiver Participants by Support Need Groups
In this section we begin to explore grouping individuals by support needs. This
exploration provides insight into the support needs of the population and differences
among subgroups of the population. These groupings may be illustrative when
considering the differences in how services are used or how service recipients access
CDCS.

19
Determining Support Need Groups
Our review of research into methodologies used in other states as part of Task 2.2 for
this project showed that level methodologies are common. Level methodologies are
those budget methodologies that result in groups of individuals sharing the same
budget amount, and are developed by first sorting individuals into groups. These
groups often range from low to high, with corresponding budgets from low to high.
For the purpose of this analysis we created rudimentary groups to explore variances
in support need across the waiver population.
Although there are limitations in this approach (see the “Limitations” section), these
groups allow for a comprehensive view of MnCHOICES data and offer an anchor
point for later comparisons between groups. Since these are preliminary, we caution
against drawing firm conclusions as additional analyses are necessary to test their fit
for use. The following analyses provide a high-level view of the waiver population that
will later be refined once an approach and methodology are selected.
General support need groups
To form preliminary groups of support need, we first considered the sum scores
created across the four domains. Since we created the ADL and IADL total support
scores by summing the items with scales from 0 to 3, the total score is a rough
approximation of none, low, moderate, and high scores for ADLs and IADLs. We took
all the ADL and IADL total support scores (excluding none) and divided them into
thirds. Figure 26 below displays these groupings for ADL total scores into none, low,
moderate, and high. When grouped in this way, most adults are in the low ADL
support need group (43%).
20
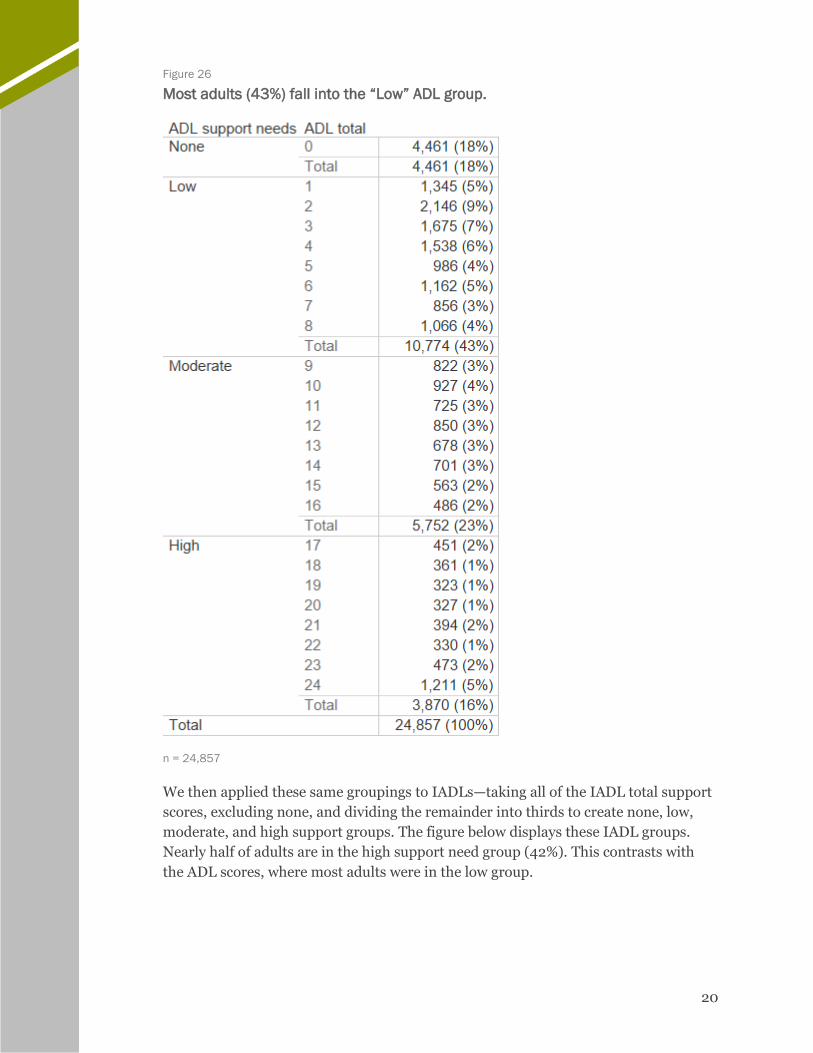
Figure 26
Most adults (43%) fall into the “Low” ADL group.
n = 24,857
We then applied these same groupings to IADLs—taking all of the IADL total support
scores, excluding none, and dividing the remainder into thirds to create none, low,
moderate, and high support groups. The figure below displays these IADL groups.
Nearly half of adults are in the high support need group (42%). This contrasts with
the ADL scores, where most adults were in the low group.

21
Figure 27
In contrast to ADL scores, most adults (42%) fall into the “High” IADL group.
n = 24,857
Next we explored how the ADL and IADL groupings related to one another in effort to
form a general support need group assignment for everyone. We did this by reviewing
a crosstab of the ADLs and IADLs. Figure 28 displays this crosstabulation of the ADL
support need groups by the IADL support need groups. Most individuals fall into the
low ADL and moderate IADL cell.

22
Figure 28
When cross-tabulated, most adults fall into the “Low” ADL/” Moderate” IADL group
n = 24,857
Note: The darkness of the color indicates the frequency within the cell, with smaller numbers lighter and
larger numbers darker.
In many established measures of support need (i.e., Supports Intensity Scale,
Inventory for Client and Agency Planning), scales of ADL and IADL support needs are
combined into one general measure—if they are even distinguished in the measure at
all. For this analysis, however, we consider support need across various populations
in which need may manifest differently. For example, individuals with support need
due to challenges related to mental health may have little to no support need for ADLs
but substantial need for support for IADLs. If we simply summed ADL and IADL total
support need scores, the total may not accurately reflect actual support needs.
Instead, we decided to move an individual into the group that matches the higher of
the two ADL and IADL groups for which they scored. For example, a person with low
ADLs and high IADLs would be placed in the high group, and a person with moderate
ADLs and low IADLs would be placed in the moderate group. We called this the
general support need group. Since IADL totals were, for the most part, higher than
ADL scores, this decision essentially groups individuals from low to high based on
their IADLs except when ADLs are higher. Figure 29 demonstrates the same crosstab
of ADLs and IADLs with the addition of the general support need grouping to
illustrate these placements.

23
Figure 29
When general support need is factored into the cross-tabulation, most adults fall
into the “High” support need group (11,027).
n=24,857
Note: The darkness of the color indicates the frequency within the cell, with smaller numbers lighter and
larger numbers darker.
After applying these decisions, the biggest group of adults are assigned to the high
general support needs group.
Extraordinary health support need
Extraordinary medical needs may contribute substantially to support cost. Therefore,
states that implement level budget methodologies often place individuals with
extraordinary medical support need in a separate group to account for the different
types of support they require. For purposes of this report, we elected to similarly
assign individuals with extraordinary support need to their own group.
The health total support score tallies the number of treatments, monitoring, and
therapies an individual requires assistance with on a daily basis. Considering how
such a tally impacts budget, we may consider a score of 2 (at least 2 daily medical
support needs that require support) to merit extraordinary health support need.
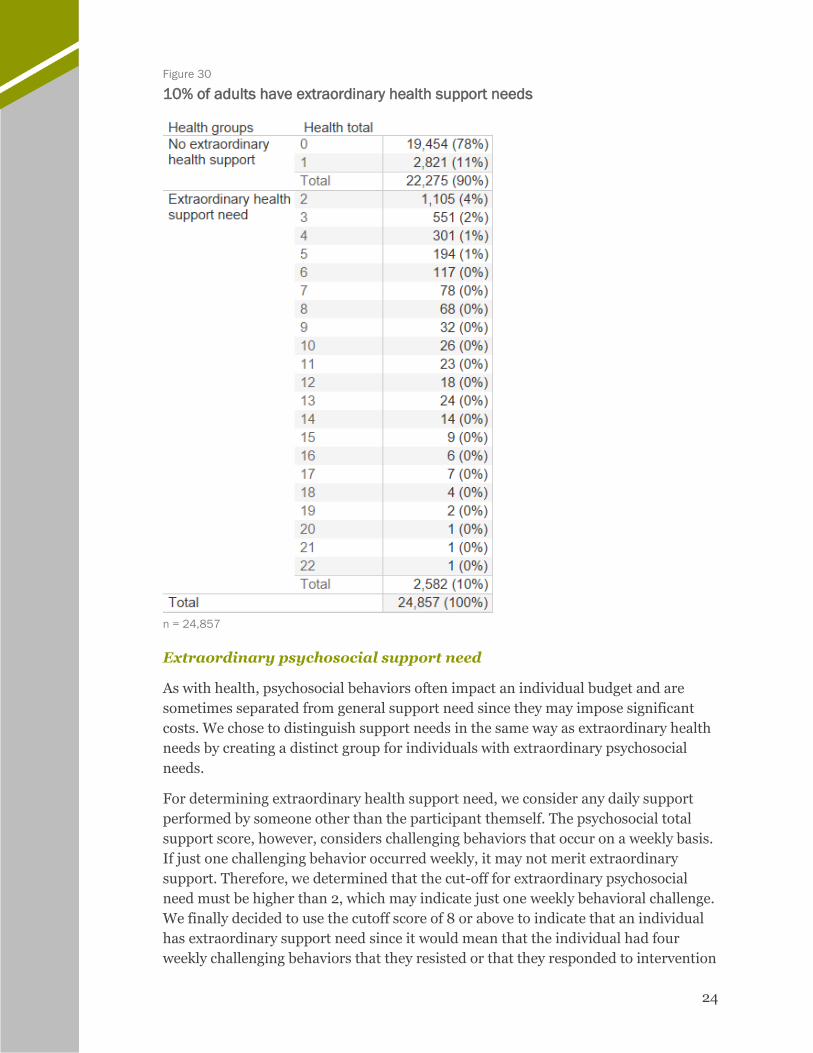
Figure 30 displays how this cut-off creates a group designated “extraordinary health
support need”; 10% of adults are assigned to this group.
24
Figure 30
10% of adults have extraordinary health support needs
n = 24,857
Extraordinary psychosocial support need
As with health, psychosocial behaviors often impact an individual budget and are
sometimes separated from general support need since they may impose significant
costs. We chose to distinguish support needs in the same way as extraordinary health
needs by creating a distinct group for individuals with extraordinary psychosocial
needs.
For determining extraordinary health support need, we consider any daily support
performed by someone other than the participant themself. The psychosocial total
support score, however, considers challenging behaviors that occur on a weekly basis.
If just one challenging behavior occurred weekly, it may not merit extraordinary
support. Therefore, we determined that the cut-off for extraordinary psychosocial
need must be higher than 2, which may indicate just one weekly behavioral challenge.
We finally decided to use the cutoff score of 8 or above to indicate that an individual
has extraordinary support need since it would mean that the individual had four
weekly challenging behaviors that they resisted or that they responded to intervention

25
for up eight challenging behaviors per week. Figure 31 displays how the cut-off is used
to designate the “extraordinary psychosocial support need” group; 22% of adults are
placed in the extraordinary psychosocial support need group.
Figure 31
Nearly a quarter of adults have extraordinary psychosocial support needs
n = 24,857

26
Next, we examine all dimensions of support need together to view the final groups to
which individuals are assigned for the purposes of this analysis. We assigned each
individual to one support need group.
Analysis support need groups
As reiterated throughout this report, the
groups offered here are for preliminary
analysis only. We have not used these
methods to create finalized support
levels in the past, and do not
recommend implementing these
support levels without extensive
analysis confirming them. With this
caveat, we offer a preliminary glimpse
into the support needs of the
individuals in the BI, CAC, CADI, and
DD waivers in Minnesota.
Figure 32 displays a grouping framework that considers individuals to be in one of
three general support need groups: low, moderate, and high. If an individual is
flagged as having extraordinary health or psychosocial needs, they are placed in one
of those two groups. If a person has both extraordinary health and extraordinary
psychosocial support needs, they are placed in the extraordinary psychosocial support
need group, the support for which is likely to result in a higher budget due to greater
staffing needs than the extraordinary health group. Only 530 adults with
MnCHOICES data (2%) flag for both extraordinary health and extraordinary
psychosocial.
The total number of adults assigned to a group is reduced due to scores too low to be
included. Seventy-six adults (less than 1%) could not be assigned to a group because
their ADL and IADL totals were both 0 and they did not flag for extraordinary health
or psychosocial groups. This may be a result of the items included in this preliminary
analysis framework, the result of assessment error, or an unknown issue with the
data. Since the source of the issue is unknown, we excluded these 76 individuals from
the groups and remaining analyses that include the groups. Of these 76 individuals,
one is on the DD waiver and 75 are on the CADI waiver.
To complete the following analyses,
we assigned individuals into 1 of 5
support need groups.
1. Low General Support Need
2. Moderate General Support
Need
3. High General Support Need
4. Extraordinary Health Support
Need
5. Extraordinary Psychosocial
Support Need

27
Figure 32
According to preliminary analysis, most adults (30%) fall into the “Moderate
Support Need” group
n = 24,781
Support Need Groups Across Waivers
Since the BI, CAC, CADI, and DD waivers serve different populations, support need
manifests differently across the waivers. Figure 33 displays the number of individuals
in each of the preliminary support need groups by waiver; Figure 34 shows the
percent of each group by waiver.
Figure 33
Support need groups by waiver
n = 24,781
Figure 34
Individuals served on the CAC waiver are overwhelmingly in the extraordinary
health support need group, which is consistent with the population needs
n = 24,781
Note: “Health” indicates extraordinary health support need group and “Psychosocial” indicates extraordinary
psychosocial support need group.

28
For more information on how ADL and IADL totals differ by waiver, Figure 35
presents box and whisker plots2 of median scores by waiver. This figure shows how
the IADL scores are pulling up the ADL scores, as well as the difference in the scores
by waiver.
Figure 35
IADL scores are often higher than ADLs pushing indivdiuals into higher general
support need groups.
Support Need Groups using CDCS
Figure 36 shows a comparison of support need between service recipients who use
CDCS and those who do not. The moderate and high support need groups make up
the biggest groups of non-CDCS service recipients, while the extraordinary
psychosocial support need group comprises the biggest group of CDCS users.
Figure 36
Frequency of adults in each support need group by CDCS
n = 24,781
Figure 37 shows the percent of service recipients by non-CDCS and CDCS. Despite
only comprising 22% of the total population, individuals in the extraordinary
psychosocial support need group make up 43% of individuals who use CDCS.
2 Box and whisker plots show quartiles with the upper and lower quartiles in the “boxes,” the median marked by the intersection where they meet, and the whiskers markng the highest and lowest values.

29
Figure 37
The extraordinary psychosocial support need group represents the greatest
proportion of CDCS users
n = 24,781
Note: “Health” indicates extraordinary health support need group and “Psychosocial” indicates extraordinary
psychosocial support need group.
Support Need Group and Service Recipient Demographics
Figure 38 shows the frequency of support need group by age group for adults.
Figure 38
Frequency of adults in each support need group by age group
n = 24,781
Figure 39 shows the percentage of adults in each support need group by age group.
The percent of individuals in higher support need groups other than psychosocial
support need is higher as age increases, suggesting that general support need and
extraordinary health support need increase with age.

30
Figure 39
Half of the 18-21 age group are in the extraordinary psychosocial support need
group, which diminishes by age, dropping to 13% of the 65+ grouping
n = 24,781
Figure 40 below displays the frequency of adults in each support need group by
residential setting.
Figure 40
Frequency of adults in each support need group by residential setting
n = 23,489
Figure 41 displays the percentage of adults in each support need group by residential
setting. As indicated in the “Limitations” section, the data on residential setting is
from the LTC Screening document and may not be as accurate or up-to-date as the
rest of the variables considered for analysis.

31
Figure 41
Most individuals living in their own home have low or moderate support needs;
individuals living in foster care tend to have higher support needs
n = 23,489
Note: The total number is reduced by 1,292 individual for whom we did not have residence. 1% of homeless
individuals are in the extraordinary health support need group, but the percent was too small to label above.
Extraordinary health support need group is indicated by the light green color.
Figure 42 below displays the frequency of adults in each support need group by sex.
Figure 42
Frequency of adults in each support need group by sex
n = 24,781
Figure 43 displays the percentage of each support need group by sex. The percentages
are generally similar between females and males, but a higher proportion of males are
in the extraordinary psychosocial support need group than females. Females are more
often assigned to the moderate general support needs group.
Figure 43
Males represent a slightly higher proportion of the extraordinary psychosocial
support need group
n = 24,781
32
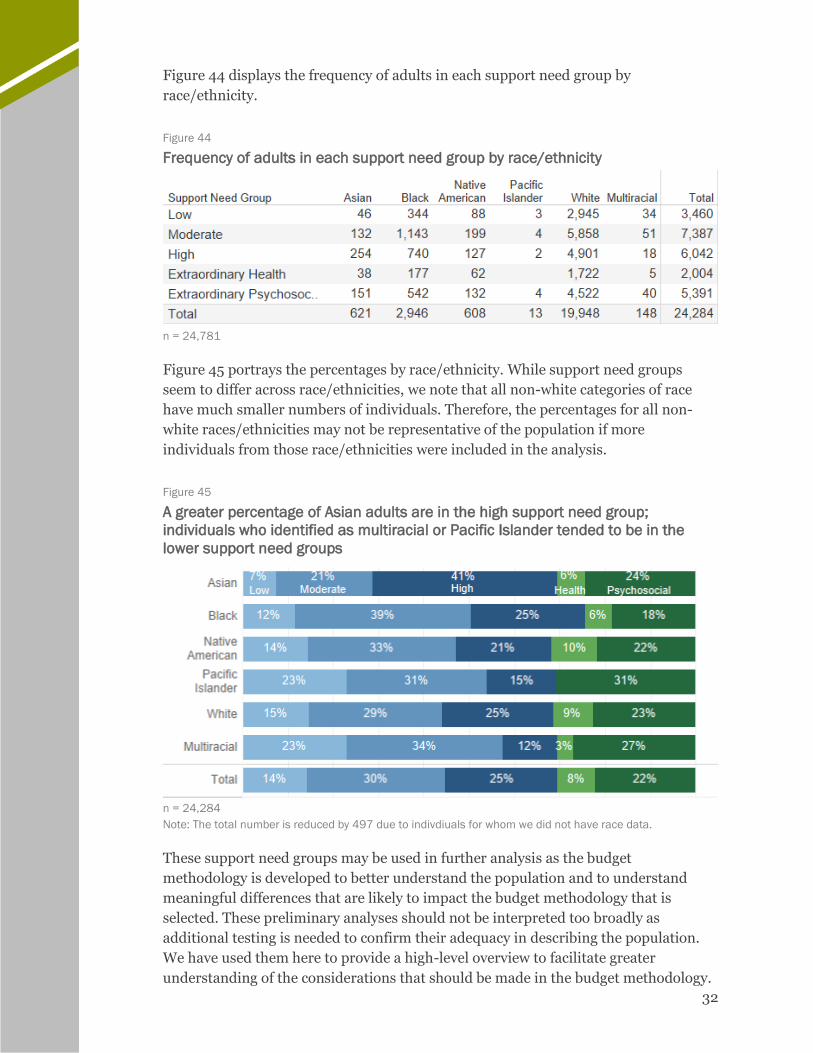
Figure 44 displays the frequency of adults in each support need group by
race/ethnicity.
Figure 44
Frequency of adults in each support need group by race/ethnicity
n = 24,781
Figure 45 portrays the percentages by race/ethnicity. While support need groups
seem to differ across race/ethnicities, we note that all non-white categories of race
have much smaller numbers of individuals. Therefore, the percentages for all non-
white races/ethnicities may not be representative of the population if more
individuals from those race/ethnicities were included in the analysis.
Figure 45
A greater percentage of Asian adults are in the high support need group;
individuals who identified as multiracial or Pacific Islander tended to be in the
lower support need groups
n = 24,284
Note: The total number is reduced by 497 due to indivdiuals for whom we did not have race data.
These support need groups may be used in further analysis as the budget
methodology is developed to better understand the population and to understand
meaningful differences that are likely to impact the budget methodology that is
selected. These preliminary analyses should not be interpreted too broadly as
additional testing is needed to confirm their adequacy in describing the population.
We have used them here to provide a high-level overview to facilitate greater
understanding of the considerations that should be made in the budget methodology.

33
CONSIDERATIONS
Minnesota has been on an extended journey to develop an individual budget
methodology. There are many elements that DHS has put into place that are
conducive to the development of these budgets. DHS has:
▪ Established principles and intentions that are consistent with person-
centered principles;
▪ Expanded the services available to offer a broad range of access to
individuals across the four waivers;
▪ Established a rates framework through the Disability Waiver Rate System
(DWRS) for agency-provided service; and
▪ Is considering an individual budget methodology that will best meet the
needs of individuals served among the four waivers.
Next Steps
With the research conducted to date, including the analysis presented here,
Minnesota can begin to make decisions about the approach that will work best for
Minnesotans with disabilities. The following are the necessary next steps to facilitate
such a decision.
Analyze service utilization and spending across the four identified waivers. This
analysis will provide key insights into current service use patterns to inform the
development of a budget methodology.
This analysis will help us to understand differences across waivers and by support
need to consider how to best develop the budget.
Decide on individual budget approach with the Methodology Review Team
(MRT). Now that we have established an understanding of how the MnCHOICES tool
is applied to individuals with disabilities and how it can be used to understand a range
of support needs, we can begin to decide how to approach the task of developing an
individual budget methodology. We will work in close coordination with DHS to
determine which approach is best.
Perform statistical analysis and apply the model once decided. Once the
MRT agrees on the approach, we will use statistical analysis to confirm the model fit
and to adjust the methodology as appropriate. When the final model has been
established, it will be applied to all individuals receiving services so that a record
review can be used to understand how well it works for some of them, and so that an
impact analysis can be completed to determine the fiscal effects of implementing the
chosen model.

34
BACKGROUND AND APPROACH
MnCHOICES Background MnCHOICES was developed in 2007 by HCBS Strategies.3 It was developed to replace
the Developmental Disabilities Screening, Long-Term Care Consultation, and
Personal Care Assistance Assessment,4 and to better the assessment process.5
MnCHOICES is intended to provide greater consistency in eligibility determinations
across programs, streamline support plans across programs, determine needs for
support planning, and provide for the evaluation of individual outcomes.
Implementation of the assessment began in 2014 and continues today. DHS uses the
MnCHOICES assessment across each of these four waivers.
▪ Brain Injury (BI) Waiver: For people under the age of 65 years with a
traumatic or acquired brain injury who need the level of care provided in a
nursing facility or neurobehavioral hospital
▪ Community Alternative Care (CAC) Waiver: For people under the age
of 65 years who are chronically ill or medically fragile and need the level of
care provided at a hospital
▪ Community Access for Disability Inclusion (CADI) Waiver: For
people under the age of 65 years who need the level of care provided in a
nursing facility
▪ Developmental Disabilities (DD) Waiver: For people with
developmental disabilities or a related condition who need the level of care
provided at an intermediate care facility for people with developmental
disabilities (ICF/DD)
MnCHOICES is a “comprehensive assessment and support planning web-based
application.” The assessment is composed of 14 domains:
▪ Person Information
▪ Quality of Life
▪ ADLS
▪ IADLs
▪ Health
▪ Psychosocial
▪ Memory and Cognition
▪ Sensory and Communication
3 Information on MnCHOICES, if not otherwise referenced, is from personal communication via project meetings on January 25, 2018 and February 27, 2018 with staff from Minnesota DHS, MnCHOICES training, or gained from review of the MnCHOICES assessment instrument and data. 4 https://edocs.dhs.state.mn.us/lfserver/Public/DHS-6477-ENG 5 http://www.hcbsstrategies.com/clients_state.php?id=11
▪ Safety/Self-Preservation
▪ Employment, Volunteering,
and Training
▪ Housing and Environment
▪ Self-Direction
▪ Caregiver
▪ Assessor Conclusions

35
We provide a brief description of each domain in the Appendix of this report.
Minnesota requires all care coordinators to be certified assessors before they can
administer MnCHOICES, with training and certification having been established by
statute. Some qualifications of assessors include a bachelor’s degree in one of several
helping professions and experience in home and community-based services.6
Assessors must be recertified every three years.
The assessment itself is conducted in a face-to-face interview with the person being
assessed, their legal representative, and other individuals that the person being
assessed choses. These respondents, however, cannot be service providers or other
individuals with a financial interest in services to be provided to the individual being
assessed. The assessment is meant to occur in a conversational manner and is
sometimes completed after assessors leave the face-to-face interview.
Eventually the assessment will be used to inform a budget methodology. We reviewed
MnCHOICES data from 27,808 individuals to inform this analysis.
Methods
This section describes our analysis methodology. We included data from individuals
with completed MnCHOICES assessments as of January 2018 when the data were
extracted. We restricted the analysis to individuals who were in the recipient file and
who were assigned to one of the four waivers. We did not include individuals who
were assigned to more than one waiver in this analysis (161 individuals). We only
completed analysis on individuals who had an assessment in the MnCHOICES file
that we received, and we included only the most recent assessment for everyone on
the recipient file. In total there were 27,808 individuals with assessments that were
included in the analysis. The steps we took for producing the findings in this report
are:
6 https://mn.gov/dhs/partners-and-providers/news-initiatives-reports-workgroups/long-term-services-and-supports/mnchoices/certified-assessor-training/
Conduct exploratory descriptive statistics
Collect, review, & merge datasets
Review MnCHOICES
Explore support need groups by
waiver participants
Create preliminary
analysis support need groups
Sum scores on selected
domains/items

36
Review MnCHOICES
First, we reviewed the MnCHOICES assessment to better understand its contents. We
had two onsite meetings with the MnCHOICES team and collected the assessment
and supporting materials. We also participated in Steps 1 through 3 trainings on the
DHS Trainlink site.7 We met several times to review the domains of the assessment
and to discuss the questions and responses. The section above, “MnCHOICES
Background,” summarizes what we learned about the assessment.
Collect, Review, & Merge Datasets
Next, we collected, reviewed, and merged several datasets. DHS provided us with:
• A recipient file, containing all current recipients of the four waivers considered
in this project
• MnCHOICES data from the start of implementation to when the data was extracted in January 2018.
• LTC Screening Document data from Fiscal Year (FY) 2013 to when the data was extracting in January 2018.
• DD Screening Document data from FY 2013 to when the data was extracted in January 2018.
• Claims data from FY 2013-2017
We first recoded the MnCHOICES, LTC, and DD Datasets so that we could analyze
them using SPSS. We reviewed each dataset to understand its contents and then
merged all the datasets.
Conduct Exploratory Descriptive Statistics
Next, we explored the frequencies of select variables. We wanted to get a better sense
of the individuals who are served by the four waivers, so we chose variables that could
provide a better picture of the population. We were particularly interested in:
• The waiver under which that each individual is served
• Whether the individual used Consumer Directed CDCS or not
• Demographics of the individuals served, including race, age, sex
• Responses to select items in the ADL, IADL, Health, and Psychosocial domains
We explored the datasets and conducted exploratory descriptive statistics, including
frequencies, on the variables.
To review support need, we focused only on adults—since support need changes from
youth to adulthood and is accounted for differently in MnCHOICES by age group. We
anticipate conducting future analyses with different age cohorts once we determined
7 Trainings are accessed here: http://pathlore.dhs.mn.gov/stc/dsd/psciis.dll?linkid=97714&mainmenu=DSD&top_frame=1

37
the best approach to exploring these cohorts within the budget methodology selected.
Adults are defined as individuals age 18 and older.
Sum Scores on Selected Domains/Items
We chose items from the ADL, IADL, Health, and Psychosocial domains to represent
support need. The items we chose were those that had consistent response options.
The ADL domain has sections on:
• Eating
• Bathing
• Dressing
• Personal Hygiene/Grooming
• Toilet Use/Continence Support
• Mobility—Walking and Wheeling
• Positioning
• Transfers
We selected the first three questions in each section for analysis. The first question
asks whether the person has difficulty in the area covered in the section, and the
response options are “No,” “Yes,” “Sometimes,” and “Chose not to answer.” The
second question concerns whether the individual needs cueing or supervision in the
area, and the response options include “None,” “To initiate the task,” “Intermittently
during the task,” and “Constantly throughout the task.” The third question concerns
the physical assistance that the individual needs in the area, and the response options
are “None,” “Setup/Prep,” “Limited,” and “Extensive/Total Dependence.”
Less than 1% of each of the items had responses of “Chose not to answer” or “No.”
Since this analysis is preliminary, “Chose not to answer” and missing responses are
counted as “no” since they do not provide sufficient information about the needs of
the person. Each of the eight ADLs had responses of “Sometimes” for less than 6% of
service recipients, which did not correspond meaningfully to less frequency or less
intensive types of support than “Yes” responses. For these reasons, we treated
sometimes as “Yes.” Given these decisions, the responses to ADL items were
narrowed to only “Yes” or “No” across the population.
Using decision criteria, we scored each of the items on the selected questions and ran
frequency counts. We also summed the scores for all the ADLs, forming a ADL total
support score. The scores were correlated, so we included all the ADLs. As the budget
methodology development is underway, we will give greater attention to the final
items to be included and the ways in which they will be used to ensure their utility in
the methodology, such as conducting factor analysis.
The IADL Domain has sections on:
• Medication Management
• Meal Preparation
• Transportation
• Housework

38
• Telephone Use
• Shopping
• Finances
Each section (except Medication Management) has at least one question about
whether the person needs help to complete the task, with response options of “Needs
no help or supervision,” “Sometimes needs assistance or occasional supervision,”
“Often needs assistance or constant supervision,” and “Always or nearly always needs
assistance.” Medication Management does not ask the about the level of support
needed for medication management in a manner consistent with all other IADLs.
Additionally, the Health section of MnCHOICES covers support need for medication
management. For this reason, we excluded medication management in this analysis of
IADLs.
As with ADLs, less than 1% of each of the items had responses of “Chose not to
answer” or “No.” We treated “Chose not to answer” or missing responses as “No”
since they do not provide sufficient information about the needs of the person. Later,
we may consider more complex options for dealing with such responses, such as
statistical imputation or assessor training. Each of the six IADLs had responses of
“Sometimes” for less than 6% of recipients. We also found that “Sometimes” did not
correspond meaningfully to less frequency of support than “Yes” responses, so we
treated “Sometimes” as “Yes.”
Note that Housework has three questions and Telephone Use has two questions to
capture this information. We considered several options to deal with these additional
questions. First, all items could be used together for the sum score. However, the sum
would then consider three types of housework and two types of telephone use while
only one item for the other IADLs, artificially weighing housework and telephone use
higher than the rest of the IADLs. Another option was to take the highest support
need of the three housework options to score for housework and the highest support
need of the two telephone use options to score for telephone use. However, this option
does not consider the different needs each item may be measuring which may form a
greater complete picture of the overarching construct. There are more complex
statistical analyses that would also determine the proper handling of individual items
to measure a construct, such as using factor analysis. These may be considered when
the budget methodology is developed.
Since this analysis is a preliminary look meant to show a general picture of the
support needs of the waiver populations, we opted to instead simply select one of the
housework items to use and one of the telephone use items to use to represent the
overarching IADL. For housework, we selected “heavy housework,” since it
presumably is the most difficult and requires the most assistance. For telephone use,
we selected “calling on the phone,” since it is presumably more difficult and requires
more assistance than just answering the phone. With these decisions, we moved
forward with six items representing six IADLs. We scored each of the items on the
selected questions and summed the scores to create an IADL total support score. We
ran frequency counts.

39
The Health Domain has a section on Treatment and Monitoring that covers 63 unique
conditions in each of the following areas:
• Cardiac
• Elimination
• Feeding and Nutrition
• Neurological
• Respiratory
• Vascular
• Wounds
• Skin Care
• Other
For each of the 63 conditions counted for each area, information is captured to
determine who provides the assistance and the frequency of assistance. We
considered the basis that support was needed and counted supports that were
required at least once per week. We only counted items that could not be completed
by the individual themself, since the requirement of support outside of an individual’s
own capacities is meaningfully associated with a need for a higher budget. In this
section we used decision criteria to score the items and summed the scores to create a
Health total support needs score. We then ran frequency counts.
Finally, the Psychosocial Domain has a section on Behavior/Emotions/Symptoms
that includes the following need areas:
• Injurious to self
• Aggressive towards others, physical
• Aggressive towards others, verbal/gestural
• Socially unacceptable behavior
• Property destruction
• Wandering/Elopement
• Legal involvement
• PICA
• Difficulties regulating emotions
• Susceptibility to victimization
• Withdrawal
• Agitation
• Impulsivity
• Intrusiveness
• Injury to others
• Anxiety
• Psychotic behaviors
• Manic behaviors
Each area contains a question to capture information about the intervention needed
with response options of “Requires no intervention,” “Needs intervention in the form
of cues—responds to cues,” “Needs redirection—responds to redirection,” “Needs
behavior management or instruction—resists redirection/intervention,” and “Needs
behavior management or instruction—physically resists intervention.” When
considering the impact such support need may have on an individual budget, support

40
staff time and attention would increase by the response to the intervention by the
service recipient. That is, a behavior that may be redirected or avoided with cues
without resistance require less support than if the intervention is met with resistance.
Therefore, we consider the levels of each challenging behavior as none, responds to
intervention, and resists intervention by grouping the response options together to
differential responding and resisting.
Another question is the frequency of the intervention with response options of
“None,” “Less than weekly,” “One time per week,” “Two times per week,” “Three times
per week,” “Four or more times per week,” and “Daily.” Challenging behaviors may be
serious and require additional support if the frequency is less than daily and perhaps
even less than weekly. The assessment, however, does not specify frequency beyond
weekly that may be meaningful—less than weekly may mean three times a month or
once a year. Therefore, we considered challenging psychosocial behaviors those that
occur at least weekly, since they would most meaningfully impact the individual
budget. We group together any “none” or “less than weekly” responses.
Create Preliminary Analysis Support Need Groups
After exploring individual variables in the MnCHOICES data, we created rudimentary
support groups for preliminary analysis. To develop these groups, we used the
summed scores for both the ADL and IADL total support scores. We divided each
total support score, that was not 0, into thirds and labeled the groups low, moderate,
and high. We completed a crosstab of the intersection between low, moderate, and
high ADLs and IADLs. We then selected the higher of an individual’s low, moderate,
or high designation and assigned each individual to the higher of the ADL/IADL
group. For example, if someone was assigned to low ADL and high IADL, they would
be assigned to the high group. We called these the general support need groups. The
groups were labeled low, moderate, and high general support need groups.
Next, we considered the Health domain. We used the Health total support score to
establish a cutoff. We chose to establish the cutoff at a score of two or more, since this
score would indicate that the individual requires at least daily support for one or more
medical needs that could not be completed by themself. We called this group the
Extraordinary Health Support Need Group.
We completed the same process for the Psychosocial domain, using the Psychosocial
total support need score to establish a cutoff. We established the cutoff for this group
at eight, since this score indicated that an individual required support for at least four
challenging behaviors per week, and that they resisted that support, or that they
required support for eight challenging behaviors per week and they complied with the
support. We called this group the Extraordinary Psychosocial Support Need Group.
We treated these groups separately from the general support need groups since
individuals assigned to these groups might have support needs that require
specialized or intensive staffing patterns that impact their budget. Further individuals
who were assigned to either of the Extraordinary groups were not assigned to a

41
general support need group, since their more pressing needs related to health or
psychosocial issues.
Explore Support Need Groups by Waiver Participants
Once we developed preliminary analysis support need groups, we explored how the
waiver populations fell into the groups. We used descriptive statistics to explore the
support need groups by waiver. Then, we explored CDCS and other demographics by
support need group to get a rudimentary sense of the support needs of the population.
Limitations
The limitations of our analysis of MnCHOICES are generally related to validity and
reliability of the assessment, the content/format of assessment items and sections,
and the inclusion criteria of the analysis.
MnCHOICES Validity and Reliability
The MnCHOICES tool has not undergone validity or reliability testing. Such testing is
imperative for assessments that are to be used to determine funding amounts. This
analysis considers data from the instrument, regardless of its psychometric
properties. Similarly, the assessment is meant to be conversational—not all questions
are asked, and the assessment information is often entered after the interview. As a
result, questions may be mis-entered for individuals to whom they apply, or errant
responses entered. MnCHOICES assessors are expected to make judgements
regarding several sections of the assessment, though the standard for making these
determinations are not objective.
MnCHOICES 2.0, a next generation of the assessment, is currently in development
and is expected to be complete this year, which may remove pressure to conduct
extensive testing on the current assessment. However, if the current MnCHOICES
assessment will be used to link to a budget methodology, the current assessment
should undergo testing for validity and reliability to confirm its adequacy for a
methodology. We recommend that MnCHOICES 2.0 is also tested for validity and
reliability prior to implementation as a tool for calculating individual budgets.
In a similar vein, we chose to show support groups to provide a simplified summative
look at support need rather than consider support need by individual items. However,
these groups should not be considered final since they lack statistical testing. We
made several assumptions about how to combine, score items, and established groups
and cutoffs. The support need groups were establishing relying on specific domains
and only certain questions on the assessment. We chose the items, developed the
scoring system, and merged domains to create groups. Though we used logical
reasoning to develop these, the groups are by no means comprehensive. These
assumptions were made without confirming their statistical soundness. If any of these

42
decisions will later inform the budget methodology that is applied, they will need to
be testested to assure their adequacy in informing the support need construct.
Given that all of the support need sections result in mostly “none” (ADLs, health,
somewhat for psychosocial) or “all” (IADLs), there may be floor and ceiling effects
occuring with the measurement. It appears as though people are answering in the
extremes (e.g., none or always). For the extraordinary needs measures, this fits our
understanding of those needs with other assessments: people tend to have
extraordinary need or don’t. For ADLs a floor effect may be due to the variety of
populations served. Some individuals may not have needs in the specific areas
questioned. A ceiling effect for IADLs, however, may be due to the instrument,
assessors, or assessor process that skews answers, since we would expect everyone
served to have needs in one general support area. Another area for possible
consideration in MnCHOICES 2.0 may be to consider response options in
MnCHOICES and the breadth of information they cover. Statistical approaches may
account for these floor and ceiling effects, but a preferred and more accurate
approach to dealing with these scoring issues is to ensure that the items are validly
measuring support need.
Lastly, as we recoded and cleaned the dataset, we noted a very small number of
inconsistencies that may be of concern regarding the validity of the data. For example,
all the items we used in the ADL and IADL sections are radio options which imply one
response only per item. However, some items included more than one selection per
individual. The occurrence of this was exceptionally small (less than 1% of the
dataset), therefore we decided to recode all such instances to the higher support need
of the two or more responses. If this is inconsistent with how the MnCHOICES
database should work or inconsistent with how assessors should answer items, we will
explore this further.
Content and Format of MnCHOICES Items and Sections
Since we selected only specific domains and items, much of the assessment is not
used. The MnCHOICES assessment is a wide-ranging assessment that can be used for
a variety of purposes. To develop support groups, only a number of items are needed.
As with the groups, the domains and items selected should not be considered
complete. More work is needed to ensure that the appropriate domains and items are
included. Any budget methodology, however, will impose restrictions on what can be
used from this comprehensive assessment.
To exemplify this limitation, 76 individuals did not have any support needs for the
items we included for ADLs, IADLs, Health, and Psychosocial. As these individuals
receive services on the waiver, they presumably do have some sort of support need
that is not captured by the included items. Further exploration of how to capture
support need across all individuals is necessary.
Additionally, despite the thoroughness of many of the sections, not all dimensions of
support need are measured in most of the sections. Other valid and reliable measures

43
of support need (e.g., SIS, ICAP) measure the frequency, duration, and type/intensity
of support for each task. While the ADL and IADL sections measure the frequency of
support, the duration of support is not measured. Further, ADLs measure the type of
support and IADLs measure the intensity of support. For the Health domain,
frequency is measured, but not duration or type of support. Lastly, for the
Psychosocial domain, frequency is measured, and intensity is questioned but not
measured on a scale. While you may want MnCHOICES to operationalize support
need in a way, we recommend considering how MnCHOICES 2.0 may expand the
consistency of items and provide a greater depth of information that may be more
useful in the budget methodology.
Lastly, the available data on residential setting are from the LTC screening document,
which may not have accurate/up-to-date information. Further, the categories for
housing in these data do not always reflect differentiations that meaningfully impact
budget. For example, “own home” does not indicate whether a person lives with
family or independently. We are exploring ways of further identifying residential
setting from claims data, but we recommend adding meaningful categories to this
question in MnCHOICES 2.0.
Analysis Inclusion Criteria
Lastly, our inclusion criteria included only individuals with MnCHOICES data who
were flagged as served by one waiver. We could only provide analysis on the
assessments that were completed. Since not everyone who will eventually receive an
assessment has an assessment included in the data that we analyzed, some
individuals are not represented. The number of completed assessments and the range
of individuals that they cover (by waiver type, living setting, CDCS, and
demographics) however, offer a well-rounded sample from which to draw conclusions
as the findings section in this report demonstrate.
Additionally, we only analyzed data from adults for the preliminary support groups.
This is because different response patterns are used for children, making the
assessment less comparable across age groups. Though work can be done to develop a
comparable grouping, we chose to focus on adults only for this purpose. After we
agree with DHS on the approach to pursue, we will determine how best to include
children in the methodology.

44
Appendix: MnCHOICES Domains and Descriptions
Person Information
This domain is used at the time people first contact DHS to collect needed information about the referral. It
includes information about the reasons for the call, demographics including race/ethnicity, lead agency
information including county of residence, and county of financial responsibility, decision-making authority,
and guardianship, information about insurance, OBRA levels for Developmental Disabilities and Mental
Illness, and concludes with referrals and goals.
Quality of Life
This domain is used to determine what is important to the person. It includes information about the person’s
routines and preferences, strengths, relationships, traditions and rituals, future plans, and the support
needed in each area. It concludes with referrals and goals.
ADLs
This domain is used to assess the persons support needs with activities of daily living and includes
assessments of:
▪ Eating
▪ Bathing
▪ Dressing
▪ Personal Hygiene/Grooming
▪ Toilet Use/Continence Support
▪ Mobility—Walking and Wheeling
▪ Positioning
▪ Transfers
For each area, the individual is assessed on whether they need support, the assistance that they need,
challenges with providing the assistance, strengths of the individual, and preferences of the individual,
support instructions, training needed, and adaptive equipment needed. The domain concludes with referrals
and goals.
IADLs
This domain is used to assess the persons support needs with instrumental activities of daily living and
includes assessments of:
▪ Medication Management
▪ Meal Preparation
▪ Transportation
▪ Housework
▪ Telephone Use
▪ Shopping
▪ Finances
For each area, the individual is assessed on whether they need support, the assistance that they need,
challenges with providing the assistance, strengths of the individual, and preferences of the individual,
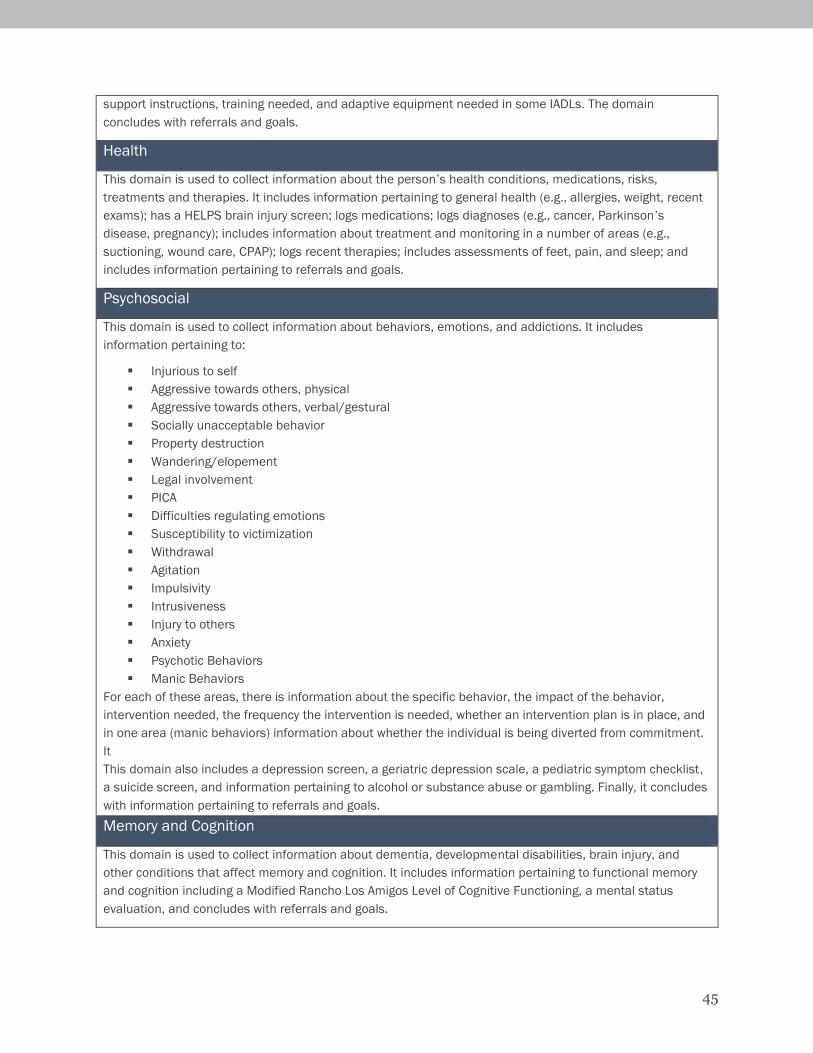
45
support instructions, training needed, and adaptive equipment needed in some IADLs. The domain
concludes with referrals and goals.
Health
This domain is used to collect information about the person’s health conditions, medications, risks,
treatments and therapies. It includes information pertaining to general health (e.g., allergies, weight, recent
exams); has a HELPS brain injury screen; logs medications; logs diagnoses (e.g., cancer, Parkinson’s
disease, pregnancy); includes information about treatment and monitoring in a number of areas (e.g.,
suctioning, wound care, CPAP); logs recent therapies; includes assessments of feet, pain, and sleep; and
includes information pertaining to referrals and goals.
Psychosocial
This domain is used to collect information about behaviors, emotions, and addictions. It includes
information pertaining to:
▪ Injurious to self
▪ Aggressive towards others, physical
▪ Aggressive towards others, verbal/gestural
▪ Socially unacceptable behavior
▪ Property destruction
▪ Wandering/elopement
▪ Legal involvement
▪ PICA
▪ Difficulties regulating emotions
▪ Susceptibility to victimization
▪ Withdrawal
▪ Agitation
▪ Impulsivity
▪ Intrusiveness
▪ Injury to others
▪ Anxiety
▪ Psychotic Behaviors
▪ Manic Behaviors
For each of these areas, there is information about the specific behavior, the impact of the behavior,
intervention needed, the frequency the intervention is needed, whether an intervention plan is in place, and
in one area (manic behaviors) information about whether the individual is being diverted from commitment.
It
This domain also includes a depression screen, a geriatric depression scale, a pediatric symptom checklist,
a suicide screen, and information pertaining to alcohol or substance abuse or gambling. Finally, it concludes
with information pertaining to referrals and goals.
Memory and Cognition
This domain is used to collect information about dementia, developmental disabilities, brain injury, and
other conditions that affect memory and cognition. It includes information pertaining to functional memory
and cognition including a Modified Rancho Los Amigos Level of Cognitive Functioning, a mental status
evaluation, and concludes with referrals and goals.
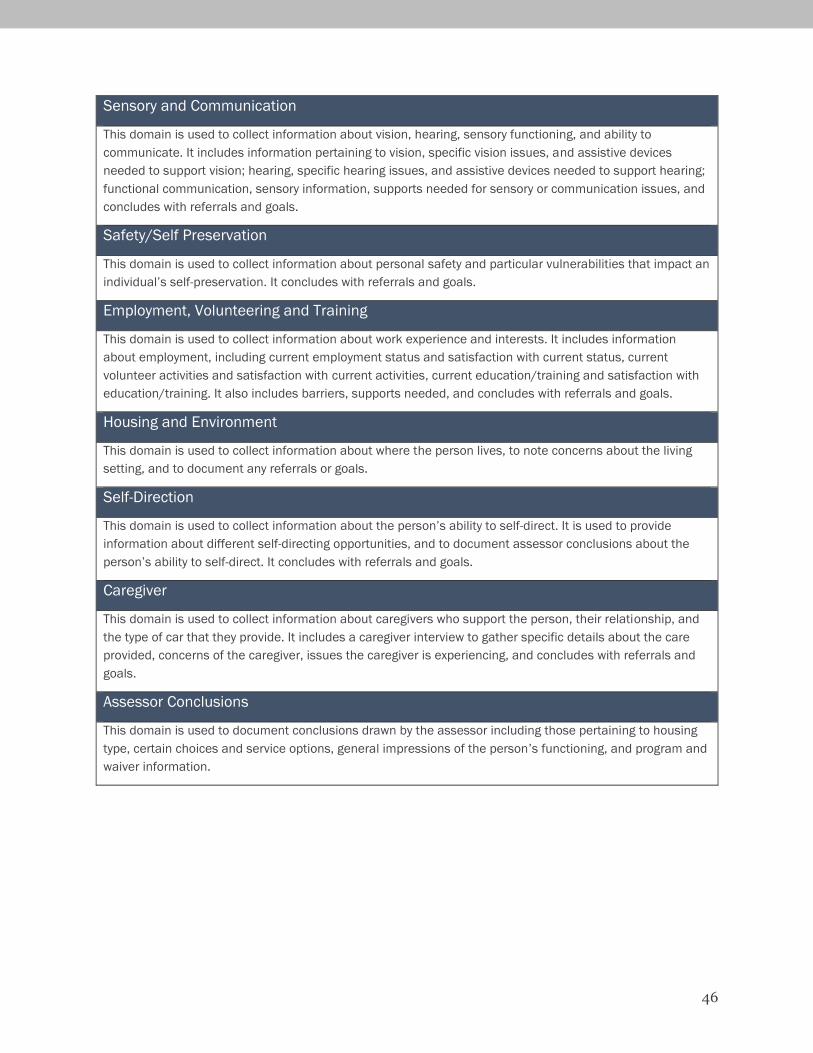
46
Sensory and Communication
This domain is used to collect information about vision, hearing, sensory functioning, and ability to
communicate. It includes information pertaining to vision, specific vision issues, and assistive devices
needed to support vision; hearing, specific hearing issues, and assistive devices needed to support hearing;
functional communication, sensory information, supports needed for sensory or communication issues, and
concludes with referrals and goals.
Safety/Self Preservation
This domain is used to collect information about personal safety and particular vulnerabilities that impact an
individual’s self-preservation. It concludes with referrals and goals.
Employment, Volunteering and Training
This domain is used to collect information about work experience and interests. It includes information
about employment, including current employment status and satisfaction with current status, current
volunteer activities and satisfaction with current activities, current education/training and satisfaction with
education/training. It also includes barriers, supports needed, and concludes with referrals and goals.
Housing and Environment
This domain is used to collect information about where the person lives, to note concerns about the living
setting, and to document any referrals or goals.
Self-Direction
This domain is used to collect information about the person’s ability to self-direct. It is used to provide
information about different self-directing opportunities, and to document assessor conclusions about the
person’s ability to self-direct. It concludes with referrals and goals.
Caregiver
This domain is used to collect information about caregivers who support the person, their relationship, and
the type of car that they provide. It includes a caregiver interview to gather specific details about the care
provided, concerns of the caregiver, issues the caregiver is experiencing, and concludes with referrals and
goals.
Assessor Conclusions
This domain is used to document conclusions drawn by the assessor including those pertaining to housing
type, certain choices and service options, general impressions of the person’s functioning, and program and
waiver information.