analysis and summary (five year) - cssr
TRANSCRIPT

Report to NETWORK Steering Committee
and the USDOE Office of Innovation and Improvement as part of the
Investing in Innovation (i3) Grant Program Evaluation
Analysis and Summary (Five Year)
UCLA Center X Northeast Region
40 Lindeman Drive, Suite 200 ◆ Trumbull, CT 06611 ◆ 203-365-8914 http://uclacenterxnortheast.org

TABLE OF CONTENTS
SUMMARY OF IMPACT ................................................................................................... 4
INTRODUCTION .............................................................................................................. 5
RESEARCH AND EVALUATION DESIGN ...................................................................... 6
Key Measures ............................................................................................................................................. 6
Report Organization .................................................................................................................................. 7
IMPACT STUDY ............................................................................................................... 9
Confirmatory Research Questions .......................................................................................................... 9
Comparison conditions ........................................................................................................................... 10
Statistical Analysis Model ....................................................................................................................... 12
Research Question 2. Does school level participation in the NETWORK project produce an impact in state assessment scores in core content areas? ............................................................................. 13
Question 2.1 Does school level participation in the NETWORK project produce an impact in state assessment scores in English Language Arts relative to state assessment scores in comparison schools? ......................................................................................................................... 14 Question 2.2 Does school level participation in the NETWORK project produce an impact in state assessment scores in Mathematics relative to state assessment scores in comparison schools? ............................................................................................................................................... 17
Research Question 3. Does school level participation in the NETWORK project produce an impact on graduation rate, postsecondary enrollment and persistence in 2014-15 (Project Year 5) relative to comparison schools? ......................................................................................................................... 22
Question 3.1 Does school level participation in the NETWORK project produce an impact on graduation rate in 2014-15 (Project Year 5) relative to comparison schools? .............................. 23 Question 3.2 Does school level participation in the NETWORK project produce an impact on postsecondary enrollment within 4 months in 2014-15 (Project Year 5) relative to comparison schools? ............................................................................................................................................... 26 Question 3.3 Does school level participation in the NETWORK project produce an impact on postsecondary enrollment within 16 months in 2014-15 (Project Year 5) relative to comparison schools? ............................................................................................................................................... 26
EXPLORATORY STUDY ............................................................................................... 30
Exploratory Research Questions ........................................................................................................... 30
Exploratory Question 1. Does school level participation in the NETWORK project produce an impact on student engagement and motivation? ................................................................................. 31
Exploratory Question 4. Describe the extent to which the intervention was delivered and implemented as designed. Was there significant variation in implementation fidelity among the schools in the treatment group? ............................................................................................................ 37
Exploratory Question 5. For which subgroups and under which conditions does the program have its greatest impact? ........................................................................................................................ 39
Exploratory Question 5.1. Was there a change in the achievement gap between economically disadvantaged and non-economically disadvantaged students, as measured by the percent of students demonstrating proficiency on state assessments in ELA and math, between 2010 (baseline) and 2015 (PY5)? ................................................................................................................................................... 39 Exploratory Question 5.2. Was there a change in the graduation rate gap between economically disadvantaged and non-economically disadvantaged students, as measured by the 4-year cohort graduation rate, between 2010 (baseline) and 2015 (PY5)? ................................................................. 42
Evaluation Question 6. Is there a significant relationship between implementation fidelity and outcomes and does this relationship vary by school, district, state or other geographic factors? 43
Evaluation Question 7. Is there a significant relationship between the number of students who participate in at least one exhibition/performance assessment and state assessment scores? .... 44
Evaluation Question 8. Is there a significant relationship between the number of students who participate in four exhibition/performance assessments and state assessment scores? ............... 44
Evaluation Question 9. Was there significant variation in the participation in and use of network resources among the schools? Is there a significant relationship between network strength and outcomes and does this relationship vary by school, district, state or other geographic factors? 44
TECHNICAL REPORT Research Study Design Baseline Equivalence Report Fidelity of Implementation Report NEi3 Impact Reporting A note on the cover design: The word cloud image was created based on essay responses from participants following the first summer institute for the project. Word clouds provide prominence to words or phrases that appear frequently in a text and create a visual map of important concepts.

An Investing in Innovation (i3) grant was awarded to a consortium of 13 high schools in October 2010, with Plymouth Public Schools as the fiscal agent. The primary provider of technical assistance in this work is the Center for Secondary School Redesign (CSSR). The Nellie Mae Foundation and the Rural School and Community Trust provided matching funds for this project. The grant period ended September 30, 2015, with the evaluation team awarded a 12-month extension (through September 30, 2016) in order to finalize the analysis based on five full years of implementation. This document encompasses the final narrative report of the NETWORK project. A technical report is appended that includes the study design and analysis procedures. Annual formative evaluation reports were developed and are available from the project evaluation team.
SUMMARY OF IMPACT When comparing results from the pre-treatment years (baseline), the following impacts emerged. None of the findings were statistically significant.
! The percent of students demonstrating proficiency on the state ELA assessment increased by 1.45 points. Gaps in demonstrated proficiency between Economically Disadvantaged and Non-Economically Disadvantaged students decreased in 10 of 12 schools.
! The percent of students demonstrating proficiency on the state math
assessment increased by 2.32 points. Gaps in demonstrated proficiency between Economically Disadvantaged and Non-Economically Disadvantaged students decreased in 5 of 12 schools.
! The percent of students graduating in four years decreased by 2.02 points.
Gaps in the graduation rate between Economically Disadvantaged and Non-Economically Disadvantaged students decreased in 9 of 11 schools.
! The percent of students enrolling in college within 4 months of high school
graduation increased by 0.34 points.
! The percent of students enrolling in college within 16 months of high school graduation decreased by 2.67 points.

5
INTRODUCTION The New England Network for Personalization and Performance (NETWORK) represents a truly innovative approach to preparing and motivating students for postsecondary success. The project hypothesis is: A network of schools, working together to create authentic tasks and common rubrics to measure uncommon assessment tasks, will foster personalized learning resulting in higher student achievement, as demonstrated by lower dropout rates, higher graduation rates and demonstrable success after high school. Project work is described around four interrelated activity strands that will support the success of all participants at all network schools, while building capacity and tracking success in multiple contexts:
A collaborative, peer-mentored and mediated approach to professional development to support the development of instructional experiences and related assessments and rubrics.
A change leadership team at each network school to shepherd the systemic
change process needed to be successful in this endeavor.
A Performance Assessment Review Board (PAR), made up of nationally recognized experts to make visits to the network schools, validate the student experiences, and provide feedback for improvement.
A Project Steering Committee to oversee the project, including monitoring
progress towards goals and adherence to the timeline and budget. By the end of the fifth project year, every student in every network school participated in at least two personalized, inquiry-based experiences and demonstrated mastery through performance assessment (and some participated in more). Students experiencing and participating in these uncommon learning and assessment tasks (with common scoring) are hypothesized to have a greater likelihood of graduation and success in college and career.

6
The New England Network for Personalization and Performance (NETWORK) is made up of thirteen high schools (close to 11,000 students) across four New England states – Maine, Massachusetts, New Hampshire and Vermont. However, one school (Mt. Abraham Union HS in Bristol, Vermont) was not included in the research study because they did not intend to implement all model aspects. Mt. Abe did receive services and was included as part of the evaluation.
Research and Evaluation Design Under an agreement with the Plymouth Public School District, the UCLA Center X Northeast Region office (“Center X”) conducted a targeted, five-year longitudinal research and evaluation study of the NETWORK project. This longitudinal study involved the collection and analysis of accurate, valid and reliable data for performance indicators and project performance measures identified for this program and regular feedback to and assistance with refining the program to meet its proposed implementation goals and objectives. The NETWORK participated in the National Evaluation of i3 (Dev-24). The i3 AR team reviewed and approved the study design. The Evaluation of i3 AR Team review also assessed whether the evaluation plans met the expectations of the evaluation-related GPRA measures. After review, the AR team concluded the NETWORK met the criteria for GPRA measure 2, the evaluation of student outcomes. This is the only GPRA measure relevant to this study. The design is a multi-site, interrupted time series quasi-experimental study (QED-ITS) in which schools were selected based on a history of successful experiences with high school reform. Treatment group schools participated in professional development experiences while receiving mentoring and support from network partners. The design followed schools over five school years (2010-11 through 2014-15). Comparison schools are matched in student achievement and attainment indicators, size, demographics, geography and history of successful innovation but do not receive the intervention.
Key Measures
• Percent of students proficient in state assessments reading and math, administered at the high school level.

7
• New England Secondary School Consortium (NESSC) graduation rate as reported to the state departments of education.
• Enrollment in post-secondary education within 4 months of high school graduation, as reported by the National Student Clearinghouse.
• Enrollment in post-secondary education within 16 months of high school graduation, as reported by the National Student Clearinghouse.
Fidelity of implementation was captured by school observations, surveys, interviews, and PAR Board visits each project year. Additional outcomes, including student engagement and motivation, were captured using surveys and interviews.
Report Organization This report is structured around nine research questions, with the impact evaluation (questions 2 and 3) presented first, followed by the exploratory questions (question 1, questions 4 through 9).
• Question 1. Does school level participation in the NETWORK project produce an impact on student engagement and motivation?
• Question 2. Does school level participation in the NETWORK project produce
an impact in state assessment scores in core content areas?
• Question 3. Does school level participation in the NETWORK project produce an impact in postsecondary enrollment and persistence?
• Question 4. Describe the extent to which the intervention was delivered and
implemented as designed. Was there significant variation in implementation fidelity among the schools in the treatment group?
• Question 5. For which subgroups and under which conditions does the program
have its greatest impact?
• Question 6. Is there a significant relationship between implementation fidelity and outcomes and does this relationship vary by school, district, state or other geographic factors?
• Question 7. Is there a significant relationship between the number of students
who participate in at least one exhibition/performance assessment and state
8
assessment scores?
• Question 8. Is there a significant relationship between the number of students who participate in four exhibition/performance assessments and state assessment scores?
• Question 9. Was there significant variation in the participation in and use of
network resources among the schools? Is there a significant relationship between network strength and outcomes and does this relationship vary by school, district, state or other geographic factors?
The full research study design is included in the Technical Report.
9
Impact Study The design is a multi-site, interrupted time series quasi-experimental study (QED-ITS) in which schools were selected based on a history of successful experiences with high school reform. Treatment group schools participated in professional development experiences while receiving mentoring and support from network partners. The design followed schools over five school years (2010-11 through 2014-15).
Confirmatory Research Questions Research Question 2. Does school level participation in the NETWORK project produce an impact in state assessment scores in core content areas in 2014-15 (Project Year 5) relative to state assessment scores in comparison schools?
• Question 2.1 Does school level participation in the NETWORK project produce an impact in state assessment scores in English Language Arts in 2014-15 (Project Year 5) relative to state assessment scores in comparison schools?
• Question 2.2 Does school level participation in the NETWORK project produce
an impact in state assessment scores in Mathematics in 2014-15 (Project Year 5) relative to state assessment scores in comparison schools?
Research Question 3. Does school level participation in the NETWORK project produce an impact on graduation rate, postsecondary enrollment and persistence in 2014-15 (Project Year 5) relative to comparison schools?
• Question 3.1 Does school level participation in the NETWORK project produce an impact on graduation rate in 2014-15 (Project Year 5) relative to comparison schools?
• Question 3.2 Does school level participation in the NETWORK project produce
an impact on postsecondary enrollment within 4 months in 2014-15 (Project Year 5) relative to comparison schools?
• Question 3.3 Does school level participation in the NETWORK project produce
an impact on postsecondary enrollment within 16 months in 2014-15 (Project Year 5) relative to comparison schools?

10
Comparison conditions Comparison schools are matched in student achievement and attainment indicators, size, demographics, geography and history of successful innovation but do not receive the intervention (i.e. ‘business as usual’). Treatment schools represent intentionally mixed demographics and settings (large, small, rural, suburban, urban, high achieving, low achieving and others). The treatment schools are all located in New England, and have been notably successful in implementing and sustaining high school innovation and reform. For example, a number of treatment schools have successfully implemented Smaller Learning Communities grants that focus on personalization. Many of the treatment schools have also been developing and implementing Extended Learning Opportunities for their students, believed to be a key factor in accelerating the development of personalized learning approaches. Treatment school characteristics: Small/Large Hi/Lo ELA* Hi/Lo Math** Rural/Not
Rural*** Plymouth No Large High High Not Rural Plymouth So Large High High Not Rural Manchester Large Low Low Not Rural Nashua No Large High Low Not Rural Nashua So Large High Low Not Rural Raymond Small High Low Not Rural Noble Large Low High Rural Kearsarge Small High High Not Rural Laconia Small Low Low Rural Nute Small High Low Rural Newfound Small High Low Rural Pittsfield Small Low Low Rural
Large schools = 1,000+ students *High ELA = 60+% proficient in reading as measured by state assessments in English Language Arts **High math = 40+% proficient in math as measured by state assessments in Mathematics ***Rural/Not Rural as defined by the US Dept. of Education

11
Project partners, including staff at treatment schools and partners were asked to suggest potential comparison schools for this project from the population of secondary schools in their home state. Evaluators examined and ranked each suggested school based on the size of the student body, the most recent achievement data, and the Rural Designation. Suggestions were then ranked on the variables shown below and selected by the evaluator based on the closeness of a match for each treatment school to arrive at three matched comparison schools for each treatment school. Schools were further narrowed based on a calculation of baseline equivalence. The resulting comparison school population closely mirrors the treatment school population in terms of the percentage of small and large schools; the percentage of schools with relatively high achievement in ELA and Math; and the percentage of schools designated as rural. MA Schools Small/Large Hi/Lo ELA Hi/Lo Math Rural? Weymouth High School Large High (79%) High (80%) for SY 2010 Salem High School Large High (68%) High (57%) Lowell HS Large High (66%) High (63%) Randolph HS Small High (72%) High (77%) ME Schools Small/Large Hi/Lo Reading Hi/Lo Math Rural? Massabesick High School Large Low (45%) Low (38%) Rural Biddeford High School Small Low (38%) Low (35%) NH Schools Small/Large Hi/Lo Reading Hi/Lo Math Rural? Campbell High School Small High (76%) Low (39%)
Franklin High School Small Low (49%) Low (20%) Rural
Inter-lakes High School Small High (75%) Low (30%) Rural
Manchester Central Large High (73%) Low (30%) Manchester Memorial Large High (66%) Low (25%)
Monadnock Regional Small High (82%) Low (37%) Rural
Moultonborough Academy Small High (75%) Low (28%) Pembroke Small High (72%) Low (34%) Timberlane Large High (69%) Low (25%)
Stevens High School Small Low (58%) Low (19%) Rural
Somersworth High School Small High (66%) Low (29%) Spaulding High School Large High (64%) Low (36%) Merrimack Valley High School Small High (80%) Low (35%)
Farmington Senior High School Small Low (53%) Low (21%) Rural
Groveton High School Small High (68%) Low (23%)
Winnisquam Regional High School Small High (71%) Low (21%) Rural
Mascoma Valley Regional High School Small High (61%) Low (26%) Rural
Conval Regional High School Large High (64%) Low (38%)

12
Baseline equivalence testing was used to establish the final comparison group, and there were no significant differences found in dependent variables between the treatment schools and comparison schools during the baseline year (2009-2010). Baseline equivalence was established using a t-test based on 2009 scores, and reconfirmed by testing for the appropriateness of use of baseline mean model. The full baseline equivalence analysis data is included in the Technical Report.
Statistical Analysis Model The NETWORK project is designed as a whole-school intervention, with many activities designed to impact the culture and climate across the board. There were 5 to 10 teachers selected from each school each year to participate in professional development, leading to the development and implementation of personalized curricular experiences tied to authentic assessments. These teachers are selected by each school. By the end of the five-year grant period, each school had trained between 25 and 50 teachers. In some cases (the small schools in particular) this may represent the entire faculty. Selected schools were followed for five years without any attrition. We used a C-SITS model to estimate impacts of NETWORK on all outcomes. For each outcome each school will contribute a single measure. For example, the measure for mathematics is “percent proficient” defined as the number of 9th, 10th, 11th and 12th graders who received a rating of “proficient” or “advanced proficient” divided by the total number of students who took the test. All tests are two-tailed and we used a p < 0.05 criterion for determining statistical significance. The chart below displays the treatment and pre-treatment years to be included in the analysis. Treatment Years and Pre-treatment Years for Outcome for Treatment and Comparison Schools
Type of School (Treatment or Comparison)
Spring 2008
Spring 2009
Spring 2010
Spring 2011
Spring 2012
Spring 2013
Spring 2014
Spring 2015
Number of Schools
Treatment x x x T T T T T 12 Comparison x x x t t t t t 24 ntime coded as: -3 -2 -1 0 1 2 3 4 TrtYr coded as: 0 0 0 1 1 1 1 1 All scores come from measures collected in the spring-summer of the school year “x”: indicates a pre-treatment year when a school-level percent proficient score will be obtained “T”: For Treatment schools T indicates a treatment year “t”: For comparison schools, “t” indicates a year when the schools’ treatment group counterparts have received treatment.

13
The full Statistical Analysis Model is included in the Technical Report.
Research Question 2. Does school level participation in the NETWORK project produce an impact in state assessment scores in core content areas?
Following is a look at the changes in percent of students scoring proficient or better on the ELA and math state assessments from 2009-2010 (baseline) to 2014-15 (PY5) at each school. Percent proficient is used to minimize the effect of different state assessments used across the treatment schools. Maine, New Hampshire and Massachusetts each used a different state assessment tool (MSA, NECAP and MCAS respectively) through the 2013-14 testing year. The 2014-15 assessment data also represents the introduction of new assessments in New Hampshire and Maine (SBAC), which resulted in an overall downward trend in the number of students proficient. This is most evident in the ELA assessments.
In most sites involvement with the NETWORK spread slowly across the school, building on initial small teams of teachers and expanding each year. This underlies the expectation that the true impact of the project is not yet evident in the state assessment and graduation rate results. As each school transitions and sustains a ‘NETWORK’ mindset that impacts all students they are confident that measurable improvements will continue to unfold. Teachers and administrators felt the professional development and support offered through the project focused all participants on student-centered, authentic and rigorous curriculum and instruction. In some schools, the number of content area teachers actively participating in the project is correlated with changes in state assessment scores. Where more ELA teachers participated, the ELA scores improved.
“Senior Project, in particular, allows students to engage in a personalized learning experience utilizing interdisciplinary skills and knowledge while investigating an area of personal interest. The Senior Project offers broad opportunities so that all students can achieve at high standards and apply their knowledge and skills in real world situations. Senior Project allows students to demonstrate proficiency through a comprehensive exhibition which makes a meaningful connection between the skills they have acquired during their years in Plymouth North High School and the outside world.” – Teacher at Plymouth North High School.
14
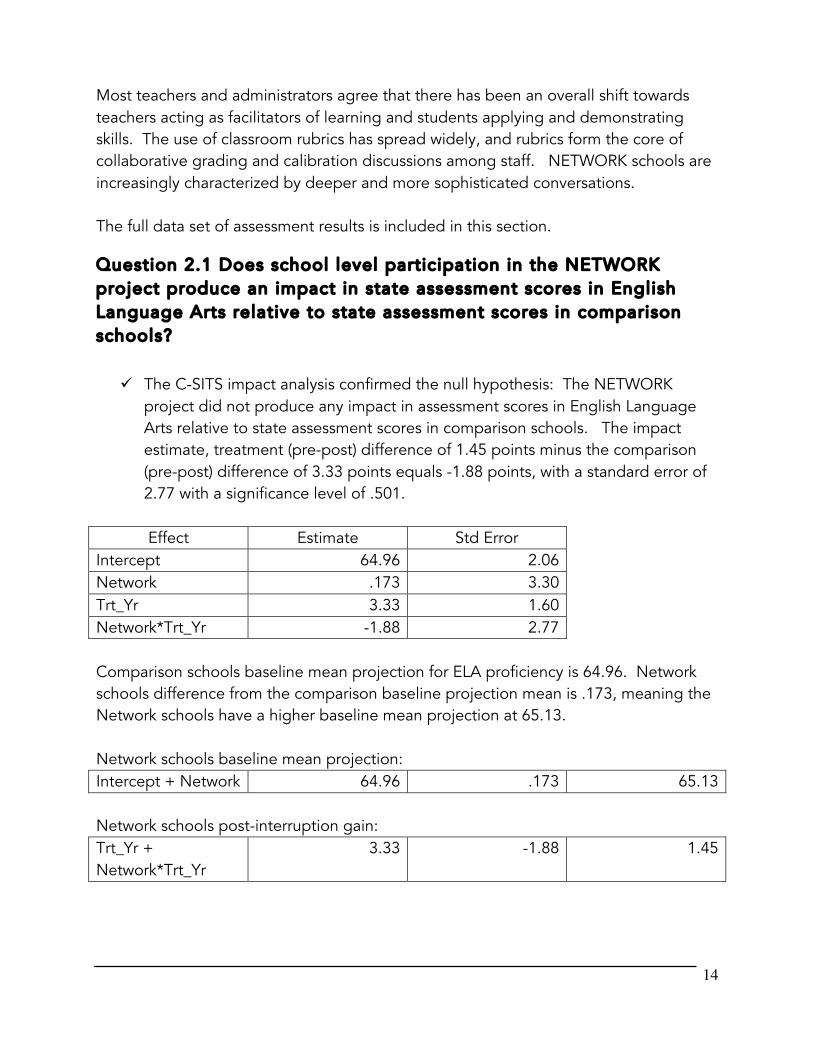
Most teachers and administrators agree that there has been an overall shift towards teachers acting as facilitators of learning and students applying and demonstrating skills. The use of classroom rubrics has spread widely, and rubrics form the core of collaborative grading and calibration discussions among staff. NETWORK schools are increasingly characterized by deeper and more sophisticated conversations. The full data set of assessment results is included in this section.
Question 2.1 Does school level participation in the NETWORK project produce an impact in state assessment scores in English Language Arts relative to state assessment scores in comparison schools?
! The C-SITS impact analysis confirmed the null hypothesis: The NETWORK
project did not produce any impact in assessment scores in English Language Arts relative to state assessment scores in comparison schools. The impact estimate, treatment (pre-post) difference of 1.45 points minus the comparison (pre-post) difference of 3.33 points equals -1.88 points, with a standard error of 2.77 with a significance level of .501.
Effect Estimate Std Error
Intercept 64.96 2.06 Network .173 3.30 Trt_Yr 3.33 1.60 Network*Trt_Yr -1.88 2.77 Comparison schools baseline mean projection for ELA proficiency is 64.96. Network schools difference from the comparison baseline projection mean is .173, meaning the Network schools have a higher baseline mean projection at 65.13. Network schools baseline mean projection: Intercept + Network 64.96 .173 65.13 Network schools post-interruption gain: Trt_Yr + Network*Trt_Yr
3.33 -1.88 1.45
15
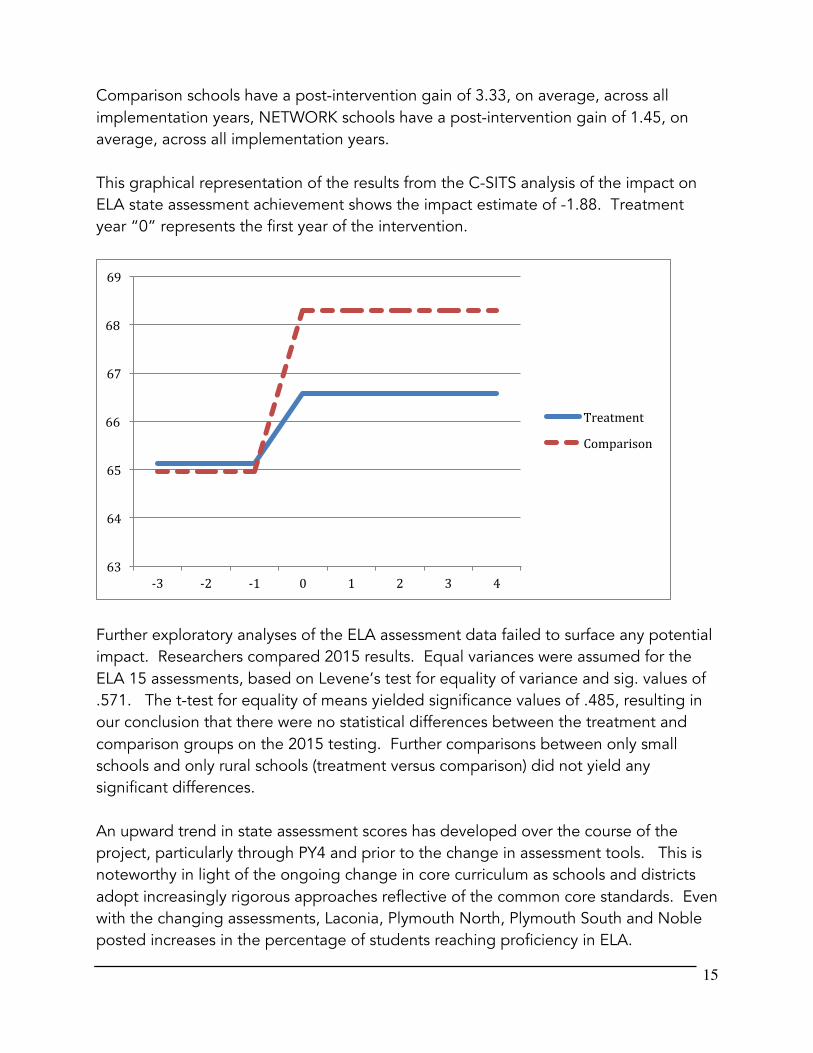
Comparison schools have a post-intervention gain of 3.33, on average, across all implementation years, NETWORK schools have a post-intervention gain of 1.45, on average, across all implementation years. This graphical representation of the results from the C-SITS analysis of the impact on ELA state assessment achievement shows the impact estimate of -1.88. Treatment year “0” represents the first year of the intervention.
Further exploratory analyses of the ELA assessment data failed to surface any potential impact. Researchers compared 2015 results. Equal variances were assumed for the ELA 15 assessments, based on Levene’s test for equality of variance and sig. values of .571. The t-test for equality of means yielded significance values of .485, resulting in our conclusion that there were no statistical differences between the treatment and comparison groups on the 2015 testing. Further comparisons between only small schools and only rural schools (treatment versus comparison) did not yield any significant differences. An upward trend in state assessment scores has developed over the course of the project, particularly through PY4 and prior to the change in assessment tools. This is noteworthy in light of the ongoing change in core curriculum as schools and districts adopt increasingly rigorous approaches reflective of the common core standards. Even with the changing assessments, Laconia, Plymouth North, Plymouth South and Noble posted increases in the percentage of students reaching proficiency in ELA.
63#
64#
65#
66#
67#
68#
69#
)3# )2# )1# 0# 1# 2# 3# 4#
Treatment#
Comparison#

16
Chart. Percent proficient in ELA state assessments, all years School Name ELA08 ELA09 ELA10 ELA11 ELA12 ELA13 ELA14 ELA15
Comparison Sites: Biddefor 40 37 38 37 35 36 33 43
Campbell 65 70 63 76 86 85 89 73 Conval R 60 73 71 64 69 78 74 56
Farmingt 47 49 48 53 57 60 57 29 Franklin 62 43 50 49 72 73 72 50
Groveton 82 78 62 69 82 77 78 50 Inter-La 72 70 76 76 73 80 84 81
Lowell 56 68 66 75 80 85 82 86 Man Cent 62 74 81 73 77 64 69 65
Man Mem 52 70 73 66 70 69 68 47 Mascoma 56 65 70 61 74 79 82 40
Massabes 43 41 45 43 38 39 39 ** Merrimac 91 85 83 80 83 85 84 75
Monadnoc 46 76 76 84 86 82 86 50 Moultonb 89 75 67 75 81 88 91 70
Pembroke 68 80 67 72 80 83 82 52 Randolph 64 70 72 83 76 89 81 84
Salem 65 70 68 68 80 84 78 85 Souhegan 82 75 79 83 83 84 84 73
Spauldin 52 68 69 64 63 62 64 37 Stevens 61 60 62 58 65 63 74 48
Timberla 58 65 68 69 74 81 75 50 Weymouth 76 84 81 90 93 94 96 92
Winnisqu 58 72 62 71 65 81 71 51
Treatment Sites: Kearsarg 72 82 72 74 76 75 77 62
Laconia 58 64 57 56 74 76 77 59 Man W 56 56 60 62 55 53 57 50
Nash No 61 62 75 68 69 62 61 48 Nash So 54 70 72 71 69 64 61 39
Newfound 71 65 80 64 87 81 72 67 Noble 53 50 43 44 47 48 46 47
Nute Hig 50 62 62 58 72 64 77 53 Pittsfie 51 60 55 60 79 64 64 44
Ply Nort 73 87 84 89 92 96 92 95 Ply Sout 81 88 83 89 95 95 92 95
Raymond 66 65 66 68 69 77 79 42

17
Question 2.2 Does school level participation in the NETWORK project produce an impact in state assessment scores in Mathematics relative to state assessment scores in comparison schools?
! The C-SITS impact analysis confirmed the null hypothesis: The NETWORK
project did not produce any impact in assessment scores in math relative to state assessment scores in comparison schools. The impact estimate, treatment (pre-post) difference of 2.32 points minus the comparison (pre-post) difference of 3.54 points equals -1.22 points, with a standard error of 1.89 and a significance level of .519.
Effect Estimate Std Error Intercept 26.69 1.71 Network -1.59 2.72 Trt_Yr 3.54 1.09 Network*Trt_Yr 1.22 1.89 Comparison schools baseline mean projection for math proficiency is 26.69. Network schools difference from the comparison baseline projection mean is -1.59, meaning the Network schools have a lower baseline mean projection at 25.1. Network schools baseline mean projection: Intercept + Network 26.69 -1.59 25.1 Network schools post-interruption gain: Trt_Yr + Network*Trt_Yr
3.54 1.22 2.32
Comparison schools have a post-intervention gain of 3.54, on average, across all implementation years, NETWORK schools have a post-intervention gain of 2.32, on average, across all implementation years. The graphical representation of the results from the C-SITS analysis of the impact on Math state assessment achievement shows the impact estimate of -1.22. Treatment year “0” represents the first year of the intervention.

18
Further exploratory analyses of the Math assessment data failed to surface any potential impact. Researchers compared 2015 results. Equal variances were assumed for the MATH 15 assessments, based on Levene’s test for equality of variance and sig. values of .713. The t-test for equality of means yielded a significance values of .531, resulting in our conclusion that there were no statistical differences between the treatment and comparison groups on the 2015 testing. Further comparisons between only small schools and only rural schools (treatment versus comparison) did not yield any significant differences. Demonstrated growth in math proficiency continued to grow as well. Again, even with the change in assessments, Laconia, Manchester West, Nute, Plymouth North and Plymouth South all showed positive growth in the percentage of students demonstrating proficiency in math.
20#
22#
24#
26#
28#
30#
32#
34#
)3# )2# )1# 0# 1# 2# 3# 4#
Treatment#
Comparison#

Chart. Percent proficient in Math state assessments, all years School Name MATH08 MATH09 MATH10 MATH11 MATH12 MATH13 MATH14 MATH15
Comparison Sites:
Biddefor 31 29 35 34 46 47 37 16 Campbell 20 28 30 39 39 34 48 41
Conval R 24 40 45 38 39 37 31 39 Farmingt 15 16 18 21 19 46 14 17
Franklin 24 11 16 20 28 31 24 10 Groveton 39 27 35 23 49 37 39 35
Inter-La 30 22 30 30 31 35 43 58 Lowell 54 65 63 66 71 70 67 72
Man Cent 22 26 47 30 31 30 27 39 Man Mem 19 26 27 25 30 24 21 17
Mascoma 16 25 29 26 30 28 33 23 Massabes 42 39 38 44 35 35 43 **
Merrimac 24 30 39 35 31 45 44 37 Monadnoc 16 25 30 38 30 29 38 28
Moultonb 33 44 28 28 34 36 43 49 Pembroke 28 35 29 34 36 34 36 40
Randolph 63 65 77 71 68 73 72 64 Salem 61 62 67 61 63 65 55 71
Souhegan 36 44 48 50 42 45 40 44 Spauldin 13 25 28 36 28 29 27 27
Stevens 23 22 27 19 25 25 22 25 Timberla 25 28 31 25 33 40 33 29
Weymouth 74 77 80 82 80 77 81 77 Winnisqu 19 26 27 21 20 31 28 28
Treatment Sites:
Kearsarg 34 35 41 35 43 44 43 39 Laconia 20 18 21 20 23 25 24 31
Man W 27 15 19 23 18 19 16 20 Nash No 25 30 31 29 28 23 24 28
Nash So 25 31 24 31 30 31 25 17 Newfound 21 19 24 20 26 37 29 29
Noble 48 52 34 55 54 55 58 27 Nute Hig 16 19 2 11 24 10 28 13
Pittsfie 10 17 27 41 46 33 29 21 Ply Nort 63 74 76 82 81 89 80 79
Ply Sout 74 76 78 79 85 82 84 81 Raymond 22 25 28 26 30 39 26 26

Another way of looking for patterns of impact is to rank order all the schools (treatment and comparison) by the percent of proficient students and see how that rank changed between 2010 and 2015. Rank Order: (1 is highest score, green signifies moved up in rank)
ELA10 ELA15 MTH10 MTH15
Comparison Sites: Biddefor 36 30 13 34 Campbell 24 9 18 11 Conval R 15 16 9 13 Farmingt 33 36 34 31 Franklin 32 20 35 36 Groveton 25 21 14 17 Inter-La 8 7 19 7 Lowell 22 4 6 4 Man Cent 4 13 8 15 Man Mem 11 27 26 32 Mascoma 16 32 21 28 Massabes 34 33 12 10 Merrimac 2 8 11 16 Monadnoc 9 23 20 21 Moultonb 20 11 23 8 Pembroke 21 18 22 12 Raymond 23 31 24 26 Salem 18 5 5 5 Souhegan 7 10 7 9 Spauldin 17 35 25 25 Stevens 27 26 28 27 Timberla 19 24 17 20 Weymouth 5 3 1 3 Winnisqu 28 19 29 23
Treatment Sites: Kearsarg 12 14 10 14 Laconia 30 15 32 18 Man W 29 22 33 30 Nash No 10 25 16 22 Nash So 13 34 30 33 Newfound 6 12 31 19

21
Noble 35 28 15 24 Nute Hig 26 17 36 35 Pittsfie 31 29 27 29 Ply Nort 1 1 4 2 Ply Sout 3 2 2 1 Randolph 14 6 3 6 Each school received a rank from 1 (the highest percent proficient) to 36 (the lowest percent proficient) for the results of the ELA and math assessments in 2010 and 2015. A comparison showed which schools moved up in comparative rank (shown in green on the chart). Of 36 schools, 21 moved up a rank on the ELA assessments (58%). Broken down, 7 of 12 (or 58%) of the treatment schools moved up, and 14 of 24 (or 56%) of the comparison schools moved up. For math, 17 of 36 schools (or 47%) moved up. 6 of 12 (or 50%) of treatment schools moved up, and 11 of 24 (46%) of comparison schools moved up. Taken together, more of the treatment schools moved up in rank in both ELA and math than the comparison schools.
22
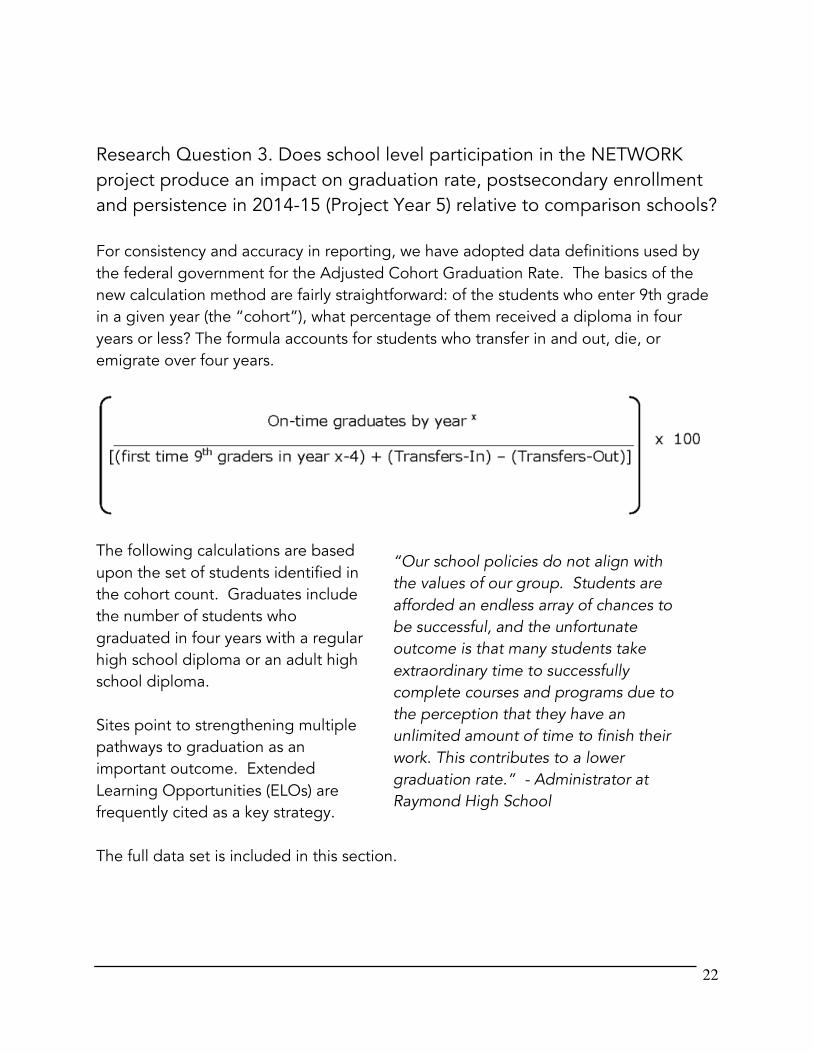
Research Question 3. Does school level participation in the NETWORK project produce an impact on graduation rate, postsecondary enrollment and persistence in 2014-15 (Project Year 5) relative to comparison schools? For consistency and accuracy in reporting, we have adopted data definitions used by the federal government for the Adjusted Cohort Graduation Rate. The basics of the new calculation method are fairly straightforward: of the students who enter 9th grade in a given year (the “cohort”), what percentage of them received a diploma in four years or less? The formula accounts for students who transfer in and out, die, or emigrate over four years.
The following calculations are based upon the set of students identified in the cohort count. Graduates include the number of students who graduated in four years with a regular high school diploma or an adult high school diploma. Sites point to strengthening multiple pathways to graduation as an important outcome. Extended Learning Opportunities (ELOs) are frequently cited as a key strategy. The full data set is included in this section.
“Our school policies do not align with the values of our group. Students are afforded an endless array of chances to be successful, and the unfortunate outcome is that many students take extraordinary time to successfully complete courses and programs due to the perception that they have an unlimited amount of time to finish their work. This contributes to a lower graduation rate.” - Administrator at Raymond High School
23
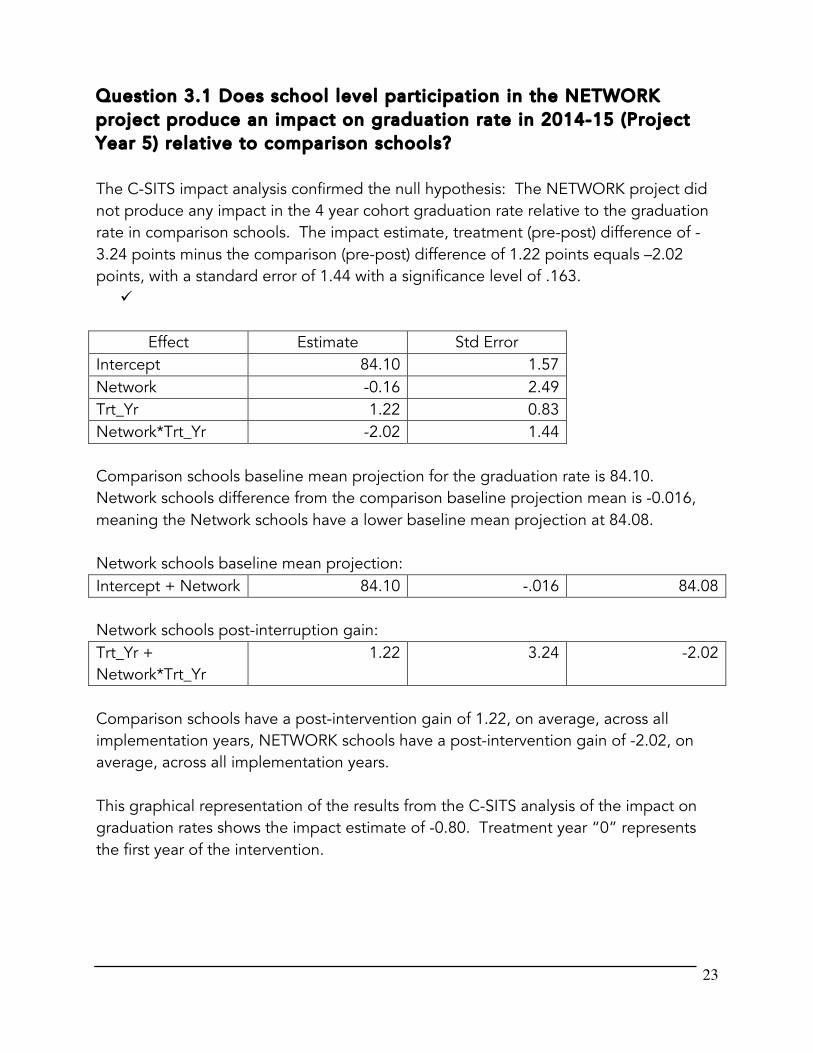
Question 3.1 Does school level participation in the NETWORK project produce an impact on graduation rate in 2014-15 (Project Year 5) relative to comparison schools? The C-SITS impact analysis confirmed the null hypothesis: The NETWORK project did not produce any impact in the 4 year cohort graduation rate relative to the graduation rate in comparison schools. The impact estimate, treatment (pre-post) difference of -3.24 points minus the comparison (pre-post) difference of 1.22 points equals –2.02 points, with a standard error of 1.44 with a significance level of .163.
!
Effect Estimate Std Error Intercept 84.10 1.57 Network -0.16 2.49 Trt_Yr 1.22 0.83 Network*Trt_Yr -2.02 1.44 Comparison schools baseline mean projection for the graduation rate is 84.10. Network schools difference from the comparison baseline projection mean is -0.016, meaning the Network schools have a lower baseline mean projection at 84.08. Network schools baseline mean projection: Intercept + Network 84.10 -.016 84.08 Network schools post-interruption gain: Trt_Yr + Network*Trt_Yr
1.22 3.24 -2.02
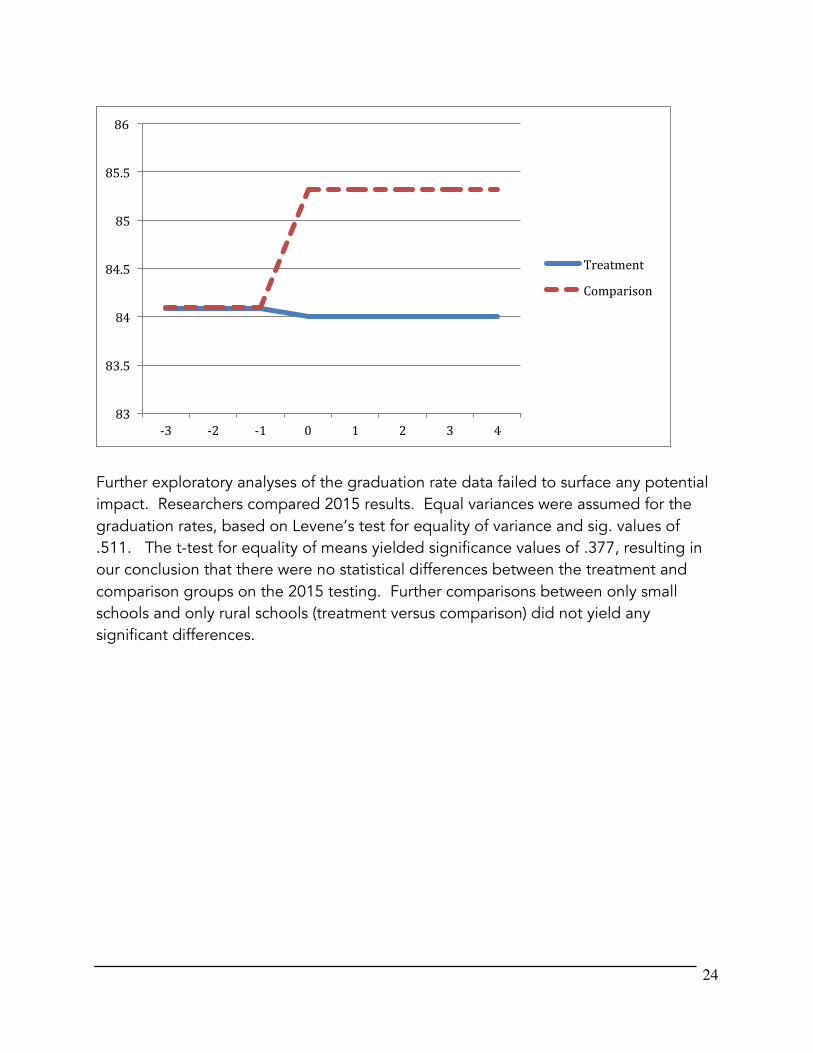
Comparison schools have a post-intervention gain of 1.22, on average, across all implementation years, NETWORK schools have a post-intervention gain of -2.02, on average, across all implementation years. This graphical representation of the results from the C-SITS analysis of the impact on graduation rates shows the impact estimate of -0.80. Treatment year “0” represents the first year of the intervention.
24
Further exploratory analyses of the graduation rate data failed to surface any potential impact. Researchers compared 2015 results. Equal variances were assumed for the graduation rates, based on Levene’s test for equality of variance and sig. values of .511. The t-test for equality of means yielded significance values of .377, resulting in our conclusion that there were no statistical differences between the treatment and comparison groups on the 2015 testing. Further comparisons between only small schools and only rural schools (treatment versus comparison) did not yield any significant differences.
83#
83.5#
84#
84.5#
85#
85.5#
86#
)3# )2# )1# 0# 1# 2# 3# 4#
Treatment#
Comparison#

Chart. Graduation Rates, all years School Name 08 09 10 11 12 13 14 15
Comparison Sites:
Campbell 86.5 96.2 95.4 94.56 94.62 94.7 95.54 94.96 Conval R 90.8 93.3 94.7 91.02 93.46 89 93.1 92.79
Farmingt 74.3 83.4 75.2 81.9 75.42 81.2 76.09 75.49 Franklin 84.3 87.4 67.44 78.5 74.19 81 63.55 67.8
Groveton 92.3
79.5 73.17 81.4 76.9 76.67 87.88 Inter-La 93.9 92.6 92.6 88.35 84.62 86.2 89.25 85.11
Man Cent 77.9 82.8 73.8 76.27 73.97 72.6 87.61 78.49 Man Mem 79.9 86.5 80.3 79.05 79.67 82.7 74.32 79.04
Mascoma 87.2 89.2 81.2 83.61 83.64 95.7 91.82 93.51 Merrimac 89.7 96.4 88 83.42 88.35 90.96 93.26 89.91
Monadnoc 76.5 86 76.8 79.33 79.61 80.7 88.06 80.74 Moultonb 95.8 94.2 88.9 87.93 95.45 95 94.12 90.91
Pembroke 90.1 88.7 83.3 83.68 82.57 88.2 92.45 92.86 Souhegan 90.1 91.3 83.5 96.93 94.67 97.2 96.7 94.92
Spauldin 75.2 86.7 74.7 77.07 78.96 87.1 87.13 89.97 Stevens 71.4 85.8 76.4 76.39 79.5 74.1 69.3 80.56
Timberla 90.1 91.1 93.8 95.16 93.43 95.9 95.55 94.65 Winnisqu 91.6 94 88.4 80.65 81.45 84.8 91.53 76.92
Weymouth 87.8 82.4 86.6 86.6 86.7 87.9 90.8 89.8 Salem 71 79.8 82.8 85.8 86.1 91.7 89.9 91.5
Lowell 78.2 74.2 74.1 75.1 78.1 81.7 81.3 78.8 Randolph 78.9 71.4 73.9 74.3 72 86.4 79.7 86.1
Massabes 81.1 72.97 77.89 81.61 85.8 83.3 86.97 83.8 Biddefor 79.4 76.25 81.08 88.36 85.1 91 87.56 84.5
Treatment Sites: Kearsarg 95 96.1 92.26 94.44 90.4 92.6 92.52 94.7
Laconia 86.8 90.4 86.16 82.68 86.71 82.3 77.85 75.6 Man W 79.2 82.4 66.49 66.57 63.03 67.6 68.28 66.33
Nash No 91.2 91 86.31 86.03 85.46 90.8 88.92 90.89 Nash So 91.6 90.4 88.01 83.36 85.59 88.1 88.66 87.98
Newfound 89.4 87.9 80.17 87.62 76.03 82.4 85.15 85.33 Nute Hig 68.4 92 71.11 68.97 68.75 74.5 72.34 83.33
Pittsfie 74 78.9 75 70.73 79.41 80.4 72.09 70.83 Raymond 78.3 80.8 80.77 86.09 85.39 75.7 84.85 78.3
Ply Nort 85.6 81.9 85.1 90.8 87 89.5 90 86.2 Ply Sout 89.3 87.1 93.2 93.1 91.6 96.2 93 91.8
Noble 80.95 79.37 80.61 85.1 79 87.3 80.89 89.4

Question 3.2 Does school level participation in the NETWORK project produce an impact on postsecondary enrollment within 4 months in 2014-15 (Project Year 5) relative to comparison schools?
! The C-SITS impact analysis confirmed the null hypothesis: The NETWORK
project did not produce any impact in the rate of postsecondary enrollment 4 months following high school graduate relative to the rate in comparison schools. The impact estimate, treatment (pre-post) difference of .34 points minus the comparison (pre-post) difference of 1.73 points equals -1.39 points, with a standard error of 1.57 with a significance level of .377.
Effect Estimate Std Error
Intercept 52.17 1.87 Network -3.77 2.95 Trt_Yr .34 .96 Network*Trt_Yr -1.39 1.57 Comparison schools baseline mean projection for the 4-month rate is 52.17. Network schools difference from the comparison baseline projection mean is -3.77, meaning the Network schools have a lower baseline mean projection at 48.40. Network schools baseline mean projection: Intercept + Network 52.17 -3.77 48.40 Network schools post-interruption gain: Trt_Yr + Network*Trt_Yr
.34 1.73 -1.39
Comparison schools have a post-intervention gain of 1.73, on average, across all implementation years, NETWORK schools have a post-intervention gain of .34, on average, across all implementation years.
Question 3.3 Does school level participation in the NETWORK project produce an impact on postsecondary enrollment within 16 months in 2014-15 (Project Year 5) relative to comparison schools?
! The C-SITS impact analysis confirmed the null hypothesis: The NETWORK project did not produce any impact in the rate of postsecondary enrollment 16
27
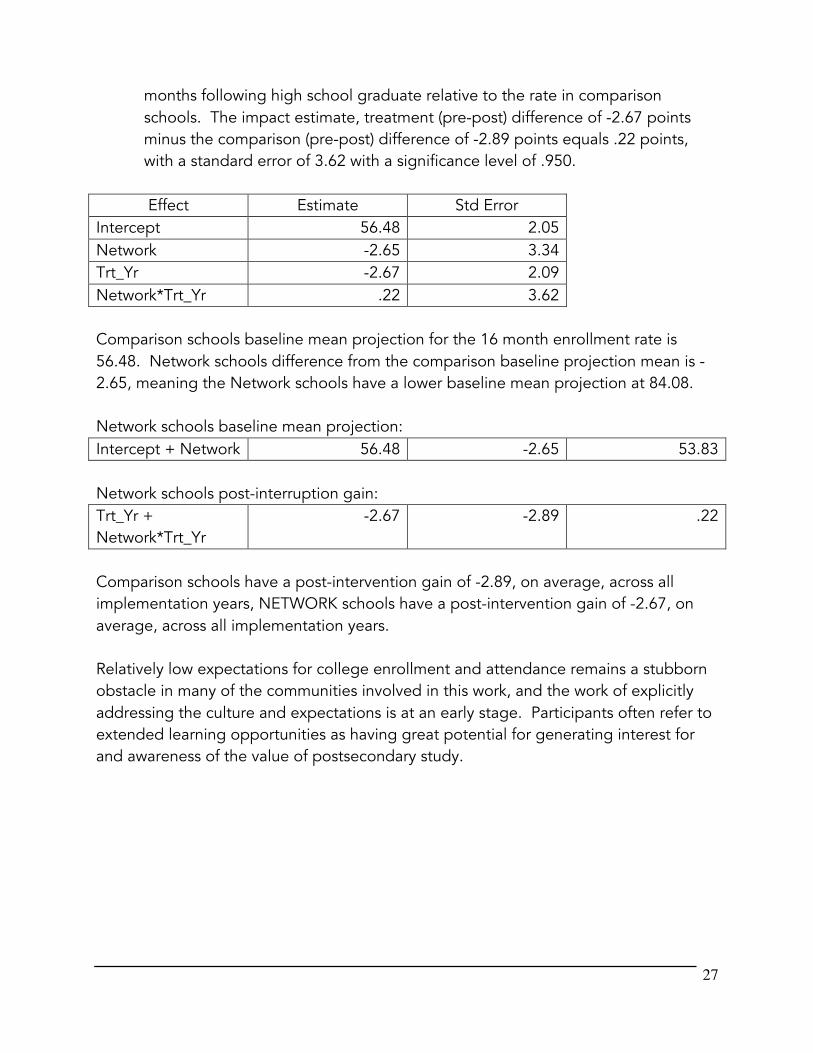
months following high school graduate relative to the rate in comparison schools. The impact estimate, treatment (pre-post) difference of -2.67 points minus the comparison (pre-post) difference of -2.89 points equals .22 points, with a standard error of 3.62 with a significance level of .950. Effect Estimate Std Error
Intercept 56.48 2.05 Network -2.65 3.34 Trt_Yr -2.67 2.09 Network*Trt_Yr .22 3.62 Comparison schools baseline mean projection for the 16 month enrollment rate is 56.48. Network schools difference from the comparison baseline projection mean is -2.65, meaning the Network schools have a lower baseline mean projection at 84.08. Network schools baseline mean projection: Intercept + Network 56.48 -2.65 53.83 Network schools post-interruption gain: Trt_Yr + Network*Trt_Yr
-2.67 -2.89 .22
Comparison schools have a post-intervention gain of -2.89, on average, across all implementation years, NETWORK schools have a post-intervention gain of -2.67, on average, across all implementation years. Relatively low expectations for college enrollment and attendance remains a stubborn obstacle in many of the communities involved in this work, and the work of explicitly addressing the culture and expectations is at an early stage. Participants often refer to extended learning opportunities as having great potential for generating interest for and awareness of the value of postsecondary study.
28
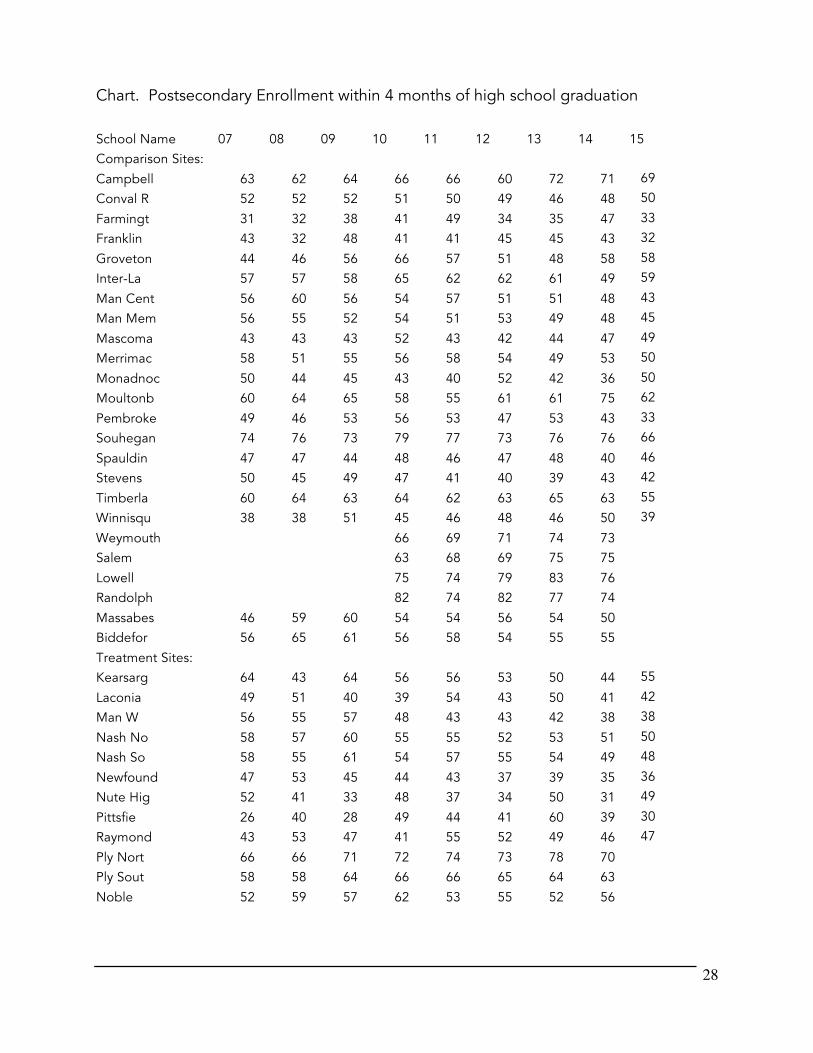
Chart. Postsecondary Enrollment within 4 months of high school graduation School Name 07 08 09 10 11 12 13 14 15 Comparison Sites:
Campbell 63 62 64 66 66 60 72 71 69
Conval R 52 52 52 51 50 49 46 48 50
Farmingt 31 32 38 41 49 34 35 47 33
Franklin 43 32 48 41 41 45 45 43 32
Groveton 44 46 56 66 57 51 48 58 58
Inter-La 57 57 58 65 62 62 61 49 59
Man Cent 56 60 56 54 57 51 51 48 43
Man Mem 56 55 52 54 51 53 49 48 45
Mascoma 43 43 43 52 43 42 44 47 49
Merrimac 58 51 55 56 58 54 49 53 50
Monadnoc 50 44 45 43 40 52 42 36 50
Moultonb 60 64 65 58 55 61 61 75 62
Pembroke 49 46 53 56 53 47 53 43 33
Souhegan 74 76 73 79 77 73 76 76 66
Spauldin 47 47 44 48 46 47 48 40 46
Stevens 50 45 49 47 41 40 39 43 42
Timberla 60 64 63 64 62 63 65 63 55
Winnisqu 38 38 51 45 46 48 46 50 39
Weymouth
66 69 71 74 73 Salem
63 68 69 75 75
Lowell
75 74 79 83 76 Randolph
82 74 82 77 74
Massabes 46 59 60 54 54 56 54 50 Biddefor 56 65 61 56 58 54 55 55 Treatment Sites:
Kearsarg 64 43 64 56 56 53 50 44 55
Laconia 49 51 40 39 54 43 50 41 42
Man W 56 55 57 48 43 43 42 38 38
Nash No 58 57 60 55 55 52 53 51 50
Nash So 58 55 61 54 57 55 54 49 48
Newfound 47 53 45 44 43 37 39 35 36
Nute Hig 52 41 33 48 37 34 50 31 49
Pittsfie 26 40 28 49 44 41 60 39 30
Raymond 43 53 47 41 55 52 49 46 47
Ply Nort 66 66 71 72 74 73 78 70 Ply Sout 58 58 64 66 66 65 64 63 Noble 52 59 57 62 53 55 52 56

29
Chart. Postsecondary Enrollment within 16 months of high school graduation
School Name 07 08 09 10 11 12 13 14 Comparison Sites:
Campbell 73 66 70 72 72 67 77 66
Conval R 60 61 60 62 62 56 55 22
Farmingt 40 38 47 48 41 41 41 67
Franklin 52 40 53 43 43 51 50 63
Groveton 47 54 59 69 67 54 48 52
Inter-La 64 64 64 75 69 71 69 59
Man Cent 62 69 64 61 64 60 58 12
Man Mem 63 63 62 62 59 58 55 13
Mascoma 50 47 47 57 51 46 50 47
Merrimac 64 59 62 60 63 58 58 32
Monadnoc 58 49 51 49 47 55 47 31
Moultonb 74 72 70 67 61 70 66 56
Pembroke 58 55 62 63 58 52 59 22
Souhegan 80 83 80 83 82 79 81 37
Spauldin 53 53 50 52 54 53 55 13
Stevens 57 53 55 55 45 50 44 54
Timberla 69 71 69 68 66 69 70 20
Winnisqu 46 50 62 52 54 54 50 46
Weymouth 69 66 66 66 69 71 74 72.7 Salem 67 72 67 63 68 69 75 74.8
Lowell 72 72 73 75 74 79 83 76.4 Randolph 76 74 83 82 74 82 77 74
Massabes 51 61 65 57 55 58 55 Biddefor 60 67 63 59 60 55 56 Treatment Sites:
Kearsarg 70 53 66 63 61 58 62 32
Laconia 54 62 48 48 60 49 57 35
Man W 64 62 66 55 53 54 50 19
Nash No 67 66 66 64 62 61 60 14
Nash So 66 65 69 62 63 64 60 13
Newfound 52 61 52 50 51 47 46 41
Nute Hig 57 50 40 58 42 51 50 91
Pittsfie 36 47 35 55 56 47 63 26
Raymond 53 62 56 50 61 57 59 55
Ply Nort 72 68 71 72 74 73 78 70.4 Ply Sout 72 71 64 66 66 65 64 62.6
Noble 58 64 58 67 55 61 57

30
Exploratory Study The purpose of the exploratory study is to surface additional information that will be useful in measuring the progress of the project, identifying areas for ongoing improvement, and focusing on areas ready for further research. Information and evidence was gathered through a mixed methods approach, utilizing survey results, interviews of contracted partners, staff and students, classroom observations, and review of school performance data. Evaluators conducted annual site visits at each network school and collected baseline survey information from each site. Evaluators utilized a set of common questions to conduct their interviews, specifically keyed to required activities and outputs.
Exploratory Research Questions
• Exploratory Question 1. Does school level participation in the NETWORK project produce an impact on student engagement and motivation?
• Exploratory Question 4. Describe the extent to which the intervention was
delivered and implemented as designed. Was there significant variation in implementation fidelity among the schools in the treatment group?
• Exploratory Question 5. For which subgroups and under which conditions does
the program have its greatest impact?
• Exploratory Question 6. Is there a significant relationship between implementation fidelity and outcomes and does this relationship vary by school, district, state or other geographic factors?
• Exploratory Question 7. Is there a significant relationship between the number
of students who participate in at least one exhibition/performance assessment and state assessment scores?
• Exploratory Question 8. Is there a significant relationship between the number
of students who participate in four exhibition/performance assessments and state assessment scores?
• Exploratory Question 9. Was there significant variation in the participation in and
31
use of network resources among the schools? Is there a significant relationship between network strength and outcomes and does this relationship vary by school, district, state or other geographic factors?
Exploratory Question 1. Does school level participation in the NETWORK project produce an impact on student engagement and motivation?
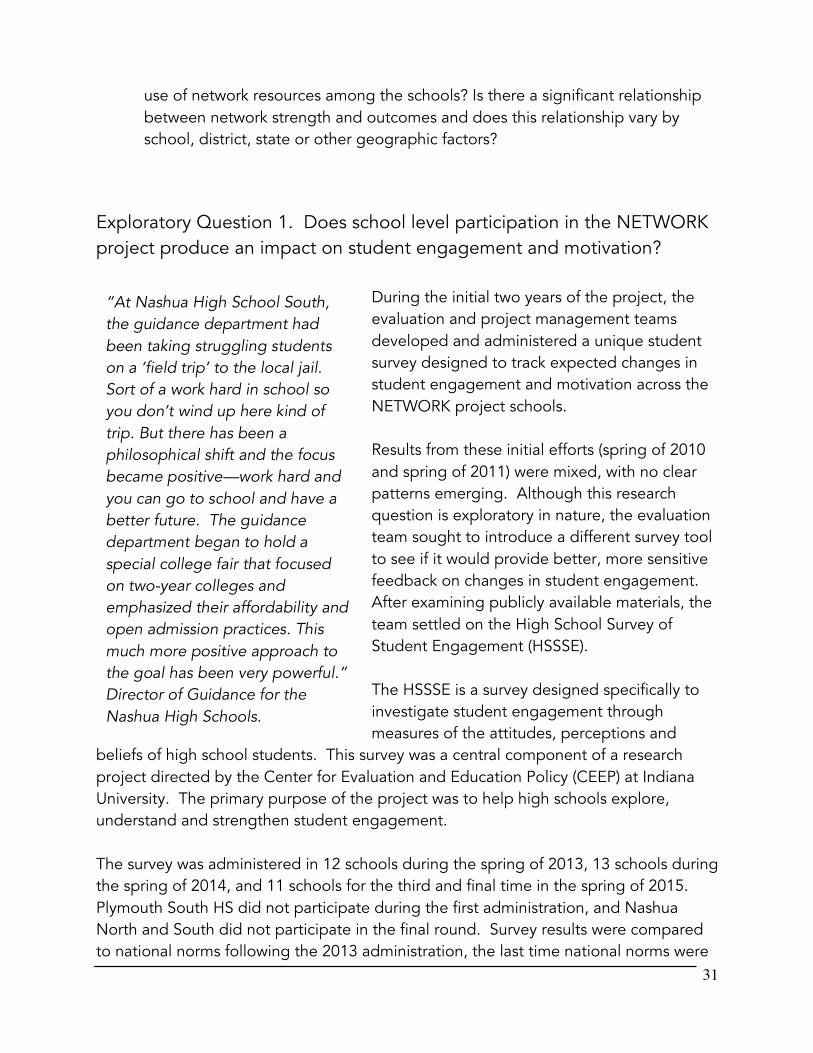
During the initial two years of the project, the evaluation and project management teams developed and administered a unique student survey designed to track expected changes in student engagement and motivation across the NETWORK project schools. Results from these initial efforts (spring of 2010 and spring of 2011) were mixed, with no clear patterns emerging. Although this research question is exploratory in nature, the evaluation team sought to introduce a different survey tool to see if it would provide better, more sensitive feedback on changes in student engagement. After examining publicly available materials, the team settled on the High School Survey of Student Engagement (HSSSE). The HSSSE is a survey designed specifically to investigate student engagement through measures of the attitudes, perceptions and
beliefs of high school students. This survey was a central component of a research project directed by the Center for Evaluation and Education Policy (CEEP) at Indiana University. The primary purpose of the project was to help high schools explore, understand and strengthen student engagement. The survey was administered in 12 schools during the spring of 2013, 13 schools during the spring of 2014, and 11 schools for the third and final time in the spring of 2015. Plymouth South HS did not participate during the first administration, and Nashua North and South did not participate in the final round. Survey results were compared to national norms following the 2013 administration, the last time national norms were
“At Nashua High School South, the guidance department had been taking struggling students on a ‘field trip’ to the local jail. Sort of a work hard in school so you don’t wind up here kind of trip. But there has been a philosophical shift and the focus became positive—work hard and you can go to school and have a better future. The guidance department began to hold a special college fair that focused on two-year colleges and emphasized their affordability and open admission practices. This much more positive approach to the goal has been very powerful.” Director of Guidance for the Nashua High Schools.

32
made available. Overall, the student engagement indicators generally fell in all areas from the 2012-13 school year through the 2014-15 school year, though the changes were small and not statistically significant. Kearsarge High School stands out from the schools analyzed by having the highest scores in all three engagement dimensions, as well as the highest percentage of students indicating they plan to go on to postsecondary study (93%). Nute High School received the lowest scores on all three engagement dimensions, and overall scores have fallen since 2013 in each category. Nute also has a relatively low percentage of students indicating they plan to go on to postsecondary study (79%). Comparisons for all schools following are between the 2012-13 school year and the 2014-15 school with the exception of Plymouth South. PSHS comparisons are with the 2013-14 school year as they did not administer surveys during 2012-13. The full set of survey questions is included in Appendix 1. BASELINE Dimension 1: Cognitive/ Academic/ Intellectual Engagement
Cognitive/academic/intellectual engagement describes students’ efforts, investment, and strategies for learning — the work students do and the ways students go about their work. This dimension can be described as “engagement of the mind.” The
-5.00 0.00 5.00 10.00 15.00 20.00 25.00 30.00 35.00
Kearsarge
Laconia
Man West
Mt Abe
Newfound
Noble
Nute
Pittsfield
PNHS
PSHS
Raymond
Change from 2013
Dimension 1: Academic Engagement

33
minimum score possible for this dimension is 10.75 and the maximum is 43.
• Kearsarge, Man West, Pittsfield and Plymouth South had the highest scores in this domain.
• Scores at every school dropped since 2013. The largest drops were noted at Nute, Pittsfield and Noble.
BASELINE Dimension 2: Social/ Behavioral/ Participatory Engagement
Social/behavioral/participatory engagement captures students’ actions in social, extracurricular, and non-academic school activities, including interactions with other students — the ways in which students interact within the school community. This dimension can be thought of as “engagement in the life of the school.” The minimum score possible for this dimension is 1.75 and the maximum is 7.
• Kearsarge, Man West and Plymouth South had the highest scores in this domain.
• Kearsarge, Newfound and Raymond are the only schools that increased the rating from 2012-13. The largest decrease was seen at Man West.
-2 -1 0 1 2 3 4 5 6
Kearsarge
Laconia
Man West
Mt Abe
Newfound
Noble
Nute
Pittsfield
PNHS
PSHS
Raymond
Change from 2013
Dimension 2: Social Engagement

34
BASELINE Dimension 3: Emotional Engagement
Emotional engagement emphasizes’ students’ feelings of connection (or disconnection) to their school – how students feel about where they are in school, the ways and workings of the school, and the people within their school. This dimension can be described as ‘engagement of the heart’. Maximum score = 28.
• Kearsarge and Plymouth South High School had the high scores in this domain. • Kearsarge and Plymouth South are the only schools that increased the rating
from 2012-13. The largest decreases were seen at Plymouth North, Noble and Nute.
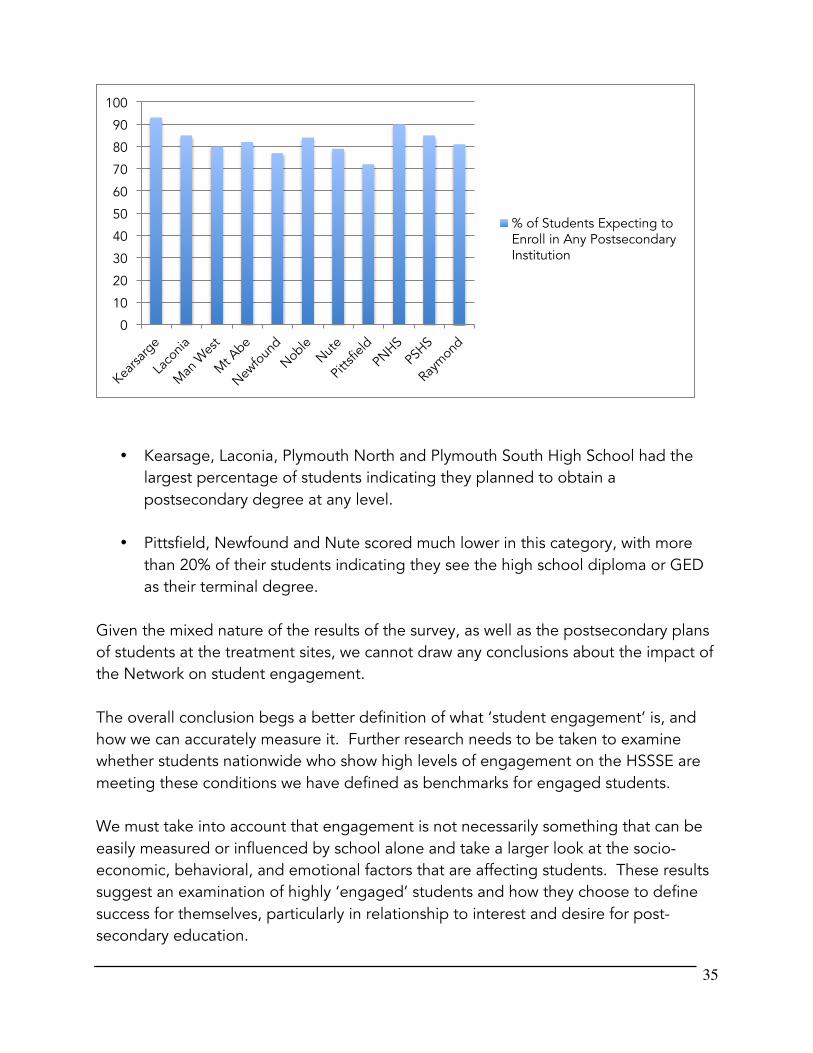
Expected postsecondary plans Students were also asked to indicate their expectations about postsecondary education, if they planned to attain a 2-year, 4-year or graduate level degree following high school graduation.
-5 0 5 10 15 20 25
Kearsarge
Laconia
Man West
Mt Abe
Newfound
Noble
Nute
Pittsfield
PNHS
PSHS
Raymond
Change from 2013
Dimension 3: Emotional Engagement
35
• Kearsage, Laconia, Plymouth North and Plymouth South High School had the largest percentage of students indicating they planned to obtain a postsecondary degree at any level.
• Pittsfield, Newfound and Nute scored much lower in this category, with more than 20% of their students indicating they see the high school diploma or GED as their terminal degree.
Given the mixed nature of the results of the survey, as well as the postsecondary plans of students at the treatment sites, we cannot draw any conclusions about the impact of the Network on student engagement. The overall conclusion begs a better definition of what ‘student engagement’ is, and how we can accurately measure it. Further research needs to be taken to examine whether students nationwide who show high levels of engagement on the HSSSE are meeting these conditions we have defined as benchmarks for engaged students. We must take into account that engagement is not necessarily something that can be easily measured or influenced by school alone and take a larger look at the socio-economic, behavioral, and emotional factors that are affecting students. These results suggest an examination of highly ‘engaged’ students and how they choose to define success for themselves, particularly in relationship to interest and desire for post-secondary education.
0
10
20
30
40
50
60
70
80
90
100
% of Students Expecting to Enroll in Any Postsecondary Institution

36
Promoting ‘student voice and choice’ became an increasingly important strategy for NETWORK schools, one that was not clearly defined or stated as part of the original design. This aspect took on different formats in each school, but generally included things like developing student leadership as well as providing students choices in how they pursued and demonstrated their learning. Student leadership appeared to be particularly evident at sites where students were involved in the lesson planning process. In the words of the team at Plymouth South HS, “The student voice component of the network was truly one of the best parts of the experience. We worked hard to bring our students into all discussions and thanks to the work with the network we were able to achieve this goal in a more intentional manner.” The Newfound team introduced ‘courageous conversations’ to promote student voice and believes this led to a changed and safer culture in the building. Nute High School developed a Student Senate, providing students a voice in the governance of the school. Many teachers made note of their increased leadership roles and confidence developed through their participation. A Nashua High School South teacher stated, “teachers feel their voices are heard more loudly.” The introduction and support of conversation protocols (i.e., consultancy protocol, tuning protocol) are often singled out as being key factors in developing teacher leadership. NETWORKing opportunities provided through the Performance Assessment Work Group (PAWG) and Performance Assessment Review Board (PAR) are frequently cited as mechanisms important for building teacher leadership and skill through peer collaboration. Newfound High School conducted a three year study of student data that showed a decrease in the number of failures and an increase in the aggregate GPA, both reliable proxies for measuring student engagement.

37
Exploratory Question 4. Describe the extent to which the intervention was delivered and implemented as designed. Was there significant variation in implementation fidelity among the schools in the treatment group? Project evaluators used a Fidelity of Implementation (FII) index tool to sharpen the definition of activities and measure the extent of their implementation. This information, aggregated over five years, has helped the project leadership team examine these questions:
• Are outputs being achieved? Does there appear to be a relationship between FII scores and the achievement of outputs?
• Can you describe causal links between activities and outputs? • Where FII is low, does it appear reasonable that strengthening implementation
(increasing FII) will lead to achievement of outputs? • Does the connection between the activities and outputs still appear reasonable
and feasible? Are there alternative pathways that should be considered? Overall, there are five activity groups, and each has been given an FII for each project year. This score describes the level of implementation for each described activity across all 13 schools, or across the project as a whole.
3 Implementation is adequate or better in more than 75% of the possible applications (IS>75).
2 Implementation is adequate or better in 75% or fewer but more than 50% of the possible applications (75>IS>50).
1 Implementation is adequate or better 50% or fewer but more than 1% of the possible applications (50>IS>1).
0 Implementation is not present in any site (IS<1). All indicators are weighted equally (considered equally important). FII PY1 FII PY2 FII PY3 FII PY4 FII PY5 Development of inquiry-based curricular units and performance based assessments, along with rubrics, aligned with state content standards.
0 3 3 3 3

38
Establishment of a broadly representative Project Steering Committee responsible for project oversight, communication, dissemination and evaluation.
3 2 1 2 2
Establishment of a school-based change leadership team with the support of a school change coach.
1 3 3 3 3
Establishment of a Performance Assessment Review Board comprised of nationally recognized experts.
3 3 3 3 3
An objective process and outcome evaluation process provides useful feedback and documentation for the Project Steering Committee.
3 3 3 3 3
Further information is provided on each activity group and how individual fidelity scores were determined and aggregated in the full fidelity study report included in the appendix. Fidelity of implementation scores were essentially uniform across all project sites, with most sites achieving a full fidelity score most years. On a project level, the project steering committee did not meet as often as anticipated for four of the five project years.

39
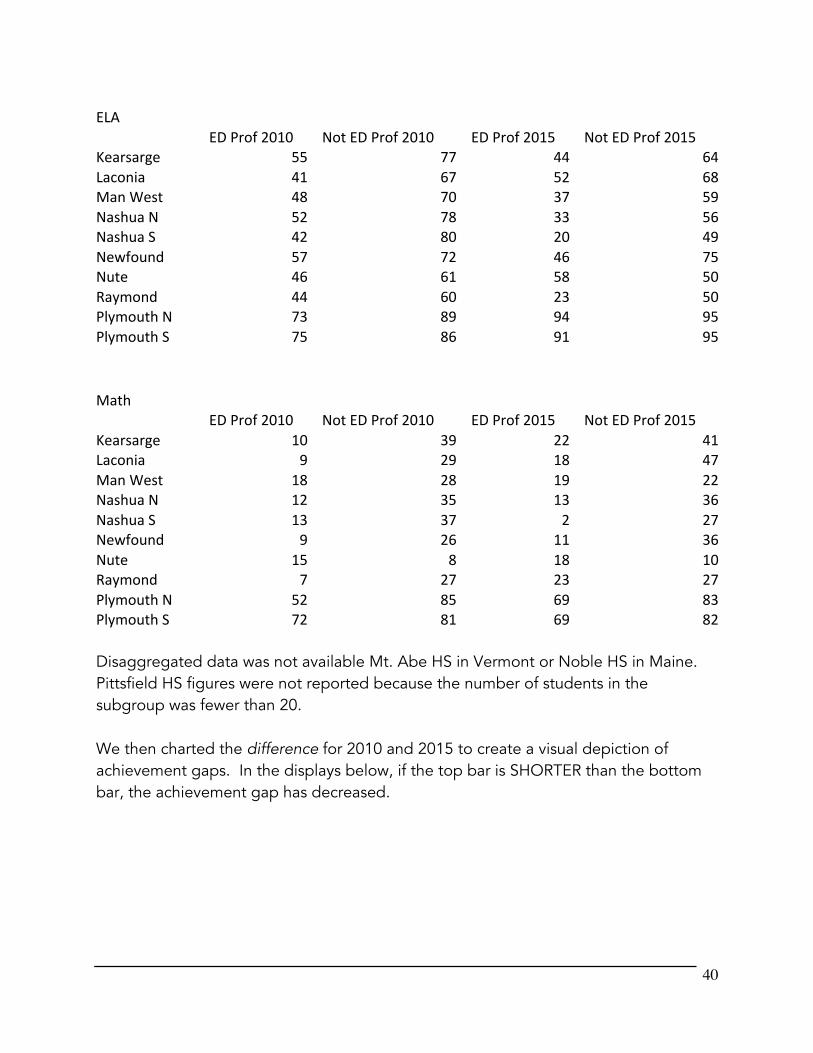
Exploratory Question 5. For which subgroups and under which conditions does the program have its greatest impact? Educators involved in the NETWORK project share a common belief that personalization efforts disproportionately impact high needs students, leading to better outcomes for students with the greatest challenges. In order to investigate the impact of the program on specific subgroups, we examined ‘achievement gaps’ between high and low-income students. The economically disadvantaged (ED) subgroup was the only subgroup with reportable results across most schools for most project years.
Exploratory Question 5.1. Was there a change in the achievement gap between economically disadvantaged and non-economically disadvantaged students, as measured by the percent of students demonstrating proficiency on state assessments in ELA and math, between 2010 (baseline) and 2015 (PY5)?
In order to address this question we employed a simple measure of the achievement gap – the difference between the percent of non-economically disadvantaged students and economically disadvantaged students demonstrating proficiency (or better) on state assessments. This very rough measure was employed to compensate for the differing assessments used across schools and across years. We began with a look at the numbers for the spring 2010 and spring 2015 assessments:
“At the first summer institute, student participation in school decision making was widely described as tokenism. But since that time, I have been focused on recognizing and listening to the student voice in my school. The students have developed a skillful way of organizing themselves and being heard on issues that impact them both within our school and our greater community. For example, the student voice group has been a large presence at City budget hearings over the last 2 years. I have seen student leaders utilize the skills honed within the student voice group to organize and lead these efforts. As building principal, it has been terrific to see this growth and to encourage and nurture it whenever possible.” Principal, Nashua High School South.
40
ELA$
$ $ $ $$
ED$Prof$2010$ Not$ED$Prof$2010$ ED$Prof$2015$ Not$ED$Prof$2015$Kearsarge$ 55$ 77$ 44$ 64$Laconia$ 41$ 67$ 52$ 68$Man$West$ 48$ 70$ 37$ 59$Nashua$N$ 52$ 78$ 33$ 56$Nashua$S$ 42$ 80$ 20$ 49$Newfound$ 57$ 72$ 46$ 75$Nute$ 46$ 61$ 58$ 50$Raymond$ 44$ 60$ 23$ 50$Plymouth$N$ 73$ 89$ 94$ 95$Plymouth$S$ 75$ 86$ 91$ 95$ Math$
$ $ $ $$
ED$Prof$2010$ Not$ED$Prof$2010$ ED$Prof$2015$ Not$ED$Prof$2015$Kearsarge$ 10$ 39$ 22$ 41$Laconia$ 9$ 29$ 18$ 47$Man$West$ 18$ 28$ 19$ 22$Nashua$N$ 12$ 35$ 13$ 36$Nashua$S$ 13$ 37$ 2$ 27$Newfound$ 9$ 26$ 11$ 36$Nute$ 15$ 8$ 18$ 10$Raymond$ 7$ 27$ 23$ 27$Plymouth$N$ 52$ 85$ 69$ 83$Plymouth$S$ 72$ 81$ 69$ 82$ Disaggregated data was not available Mt. Abe HS in Vermont or Noble HS in Maine. Pittsfield HS figures were not reported because the number of students in the subgroup was fewer than 20. We then charted the difference for 2010 and 2015 to create a visual depiction of achievement gaps. In the displays below, if the top bar is SHORTER than the bottom bar, the achievement gap has decreased.

41
Gaps grew smaller in ELA at all schools except Raymond and Newfound. The gap at Manchester West was unchanged. Plymouth North HS showed the greatest impact, virtually eliminating the gap.
The impact pattern for math is mixed. Plymouth South, Newfound, Nashua North and Laconia all display larger achievement gaps in math for 2015 than in 2010. The gaps at Plymouth North, Raymond, Man West and Kearsarge narrowed, and the measure was unchanged at Nashua North.
-20 -10 0 10 20 30 40 50
Kearsarge
Laconia
Man West
Nashua N
Nashua S
Newfound
Nute
Raymond
Plymouth N
Plymouth S
2015: NotED-ED
2010: NotED-ED
-20 -10 0 10 20 30 40
Kearsarge
Laconia
Man West
Nashua N
Nashua S
Newfound
Nute
Raymond
Plymouth N
Plymouth S
2015: NotED-ED
2010: NotED-ED

42
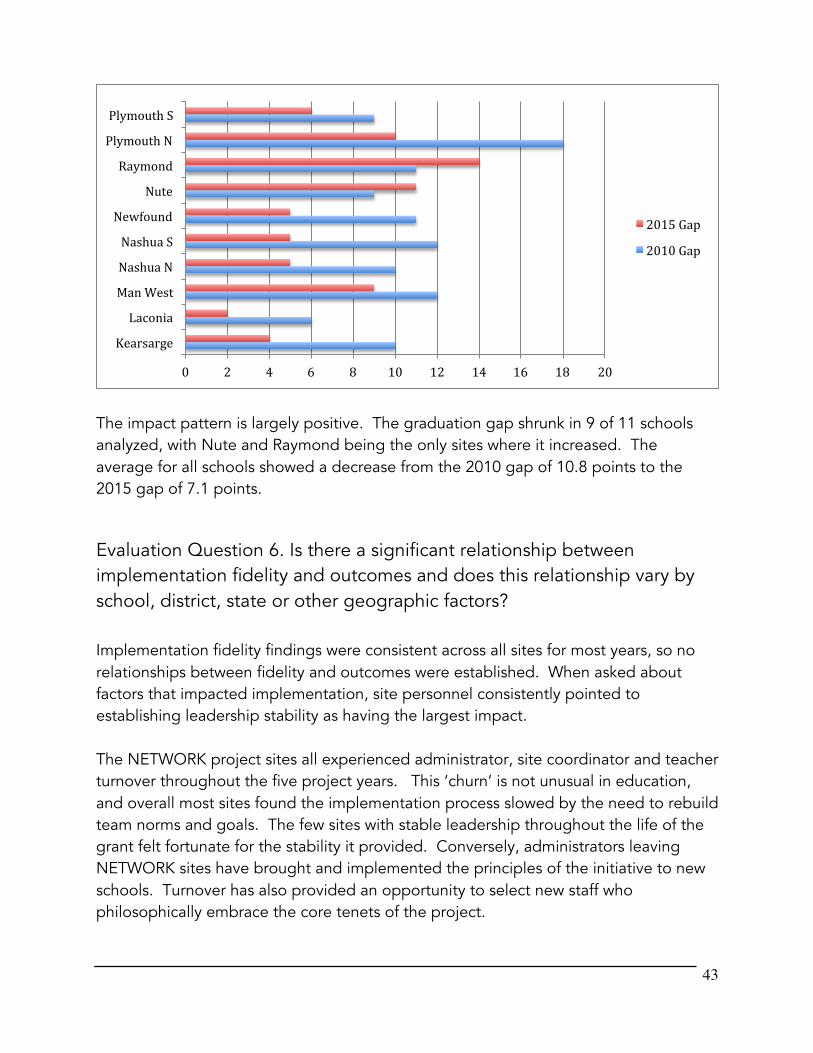
Exploratory Question 5.2. Was there a change in the graduation rate gap between economically disadvantaged and non-economically disadvantaged students, as measured by the 4-year cohort graduation rate, between 2010 (baseline) and 2015 (PY5)?
In order to address this question we employed a simple measure of the graduation rate gap – the difference between the graduation rate of all students and the rate for economically disadvantaged students. Disaggregated data for Noble HS in Maine was not available. We began with a look at the numbers for the graduates of 2010 and the graduates of 2015:
Graduation$Rates$$ $ $
$ED$2010$ All$2010$ ED$2015$ All$
Kearsarge$ 82$ 92$ 90$ 94$Laconia$ 80$ 86$ 73$ 75$Man$West$ 54$ 66$ 57$ 66$Nashua$N$ 76$ 86$ 86$ 91$Nashua$S$ 77$ 88$ 82$ 87$Newfound$ 69$ 80$ 80$ 85$Nute$ 62$ 71$ 72$ 83$Raymond$ 70$ 81$ 64$ 78$Plymouth$N$ 67$ 85$ 81$ 91$Plymouth$S$ 84$ 93$ 87$ 93$ We then charted the gaps for 2010 and 2015 to create a visual depiction of graduation rate gaps. In the displays below, if the top bar (the 2015 gap) is SHORTER than the bottom bar, the graduation gap has decreased.
“When teachers recognize your voice, it makes you feel comfortable and valued. And when they encourage you, it helps your confidence. You learn more when you talk about things. Our high school encourages thought and taking control of your own thinking.” Students, Manchester West High School.
43
The impact pattern is largely positive. The graduation gap shrunk in 9 of 11 schools analyzed, with Nute and Raymond being the only sites where it increased. The average for all schools showed a decrease from the 2010 gap of 10.8 points to the 2015 gap of 7.1 points.
Evaluation Question 6. Is there a significant relationship between implementation fidelity and outcomes and does this relationship vary by school, district, state or other geographic factors? Implementation fidelity findings were consistent across all sites for most years, so no relationships between fidelity and outcomes were established. When asked about factors that impacted implementation, site personnel consistently pointed to establishing leadership stability as having the largest impact. The NETWORK project sites all experienced administrator, site coordinator and teacher turnover throughout the five project years. This ‘churn’ is not unusual in education, and overall most sites found the implementation process slowed by the need to rebuild team norms and goals. The few sites with stable leadership throughout the life of the grant felt fortunate for the stability it provided. Conversely, administrators leaving NETWORK sites have brought and implemented the principles of the initiative to new schools. Turnover has also provided an opportunity to select new staff who philosophically embrace the core tenets of the project.
0# 2# 4# 6# 8# 10# 12# 14# 16# 18# 20#
Kearsarge#
Laconia#
Man#West#
Nashua#N#
Nashua#S#
Newfound#
Nute#
Raymond#
Plymouth#N#
Plymouth#S#
2015#Gap#
2010#Gap#

44
Evaluation Question 7. Is there a significant relationship between the number of students who participate in at least one exhibition/performance assessment and state assessment scores?
Evaluation Question 8. Is there a significant relationship between the number of students who participate in four exhibition/performance assessments and state assessment scores? The definition of performance assessment varied widely across implementation sites, so it was not possible to explore questions 7 and 8 in any meaningful way. Definitions of a performance assessment ranged from performance tasks incorporated into unit assessments (for example, Manchester West) to semester-long interdisciplinary projects required of all students (for example, Kearsarge High School).
Evaluation Question 9. Was there significant variation in the participation in and use of network resources among the schools? Is there a significant relationship between network strength and outcomes and does this relationship vary by school, district, state or other geographic factors? Solving the ‘network’ problem was a consistent challenge for this project, and participants struggled over the course of the work to find ways to achieve this intention. Geography and time both proved challenging and led to the redirection of a number of efforts focused on peer mentoring. Several of the smaller schools happened to be located relatively close to one another, and staff often found ways to meet in person and work together. Ultimately two strategies emerged that worked well. The Performance Assessment Review (PAR) Board visited 7 or 8 schools each year, and during the second year of the project they were opened up to include staff from each participant school. This
“There was never a NETWORK - from the first year on we asked for the opportunity to collaborate with other schools regularly...once a year was not enough time. We were always told - we are working on a Twitter page, we are working on a Facebook page - and nothing ever came of actually collaborating!” – Teacher at Plymouth South High School

45
opportunity to visit other schools and engage in a collaborative conversation with peers was overwhelmingly pointed to as a highly valued learning experience. The second emergent strategy was the establishment of the Performance Assessment Work Group (PAWG), a group with representatives from each site that met monthly to collaboratively develop and score student work. This group became a powerful, central voice in guiding the work of the NETWORK during the final two project years.