an undervalued turnaround play - nextcapital.com.pk 21... · product portfolio as compared to its...
TRANSCRIPT

Fauji Foods Limited
An undervalued turnaround play
March 21, 2018
Bloomberg
FFL PA
PSX / KATS
FFL
Reuters
FFL.KA
Research Entity Notification No.: REP-116 See last page for analyst certification and other important disclosures
BUY
Pakistan Equities
Foods & Personal Care
Initiation with ‘BUY’ call and Target Price of PKR 47.00
We initiate coverage on Fauji Foods Limited (FFL) with a Buy recommendation and a Dec-18 TP of PKR 47
per share. The target price offers 52% upside potential. Our main investment proposition rests on
Pakistan’s growing consumer market and significantly underpenetrated dairy business. In that, FFL
presents a great investment opportunity given its scalable business model that is leveraged on expanding
suite of products in a growth market. We have valued the company on different valuation techniques
which include discounted cash flows (DCF) along with relative valuation based on Market Cap to Sales and
Enterprise Value (EV) per liter. The company’s strong valuation provides us comfort in terms of decent
margin of safety at current stock price level. We expect the company to breakeven in terms of net
profitability during CY20 and from there going forward we foresee astounding 5-year (CY21-CY25) earnings
CAGR of 76%. Key risks for FFL include increased competition in the industry by new entrants, unfavorable
change in taxation for the industry, sharp rupee devaluation and sustainable price hike in international
skimmed milk powder (SMP).
Pakistan Dairy Industry – a holistic overview
With the sixth largest population on the planet, having 2.6% CAGR for the period 1981-2017, Pakistan
ranks amongst the world’s fastest growing populations. Pakistan is also currently the world’s fourth largest
milk producer, with milk consumption of over 200 liters per capita. Buffaloes are the major milk producing
animals in Pakistan, representing nearly half of the total dairy herd and providing almost 2/3rd of total
milk production.
In total, Pakistan’s current milk consumption stands at 45.2bn liters of which only a meager ~8.5%
represents packaged milk i.e. the formal sector. While this figure may make it seem like packaged milk
does not have much hope, one only need to look towards the example of Turkey, which went from 31%
packaged milk to 61% in a matter of a decade! We are witnessing on a lower scale a similar trend picking
up in Pakistan in recent years with the addition of new entrants in the formal dairy sector.
Whereas, an example of a successful yet not fully realized potential in the formal dairy segment is Nestle.
It has been operating in Pakistan since 1988 and is now the leading food and beverage company in
Pakistan. It wouldn’t be unjustified to consider Nestle Pakistan’s successful business story as a leading
indicator of a robust industry dynamics. Its annual revenues currently stand at PKR 122.2 bn for CY17
which have grown by over four times in the preceding ten years. The company’s CY07 revenues were
recorded at PKR 28.2 bn.
34 35 36 38 39 40 41 42 44 45
0
20
40
60
FY08 FY09 FY10 FY11 FY12 FY13 FY14 FY15 FY16 FY17
Chart 1: Milk Production in Pakistan
Source: PBS
20% 20%
12%
7%5%
4% 4%3% 2%
1%
0%
10%
20%
30%
Euo
rpe
Ind
ia US
Pak
ista
n
Ch
ina
Bra
zil
Ru
ssia NZ
Turk
ey
Me
xico
Chart 2: Pakistan’s share in World’s milk production
Source: FFL’s Analyst Briefing 2017
Bn liters
Target Price PKR 47.00
Current Price PKR 31.22
Shares 528 Million
Market Cap PKR 16,497 Million
Free Float 25%
6M Avg. Volume 3.6 Million
6M Avg. Value USD 0.77 Million
52 Week Range 14.96 – 40.36
Rahul Hans
+92-21-35169515

Tilt of Consumer and Government against the informal sector
Adulteration within the informal milk sector has been brought into the limelight with the liberalization of
media in Pakistan over the past decade. Government of Pakistan has begun to take strict notice of such
adulteration in the informal sector sold to consumers. Recently, in a bold move against the use of
Recombinant Bovine Growth Hormone injections (RBST) in dairy animals, the Supreme Court of Pakistan
banned the use of this injection nationwide. The purpose of the RBST injection was to increase the yield of
the animal.
In the past couple of decades, RBST injections had become as common as feed in the majority of dairy
farms in Pakistan. RBST has been banned in the markets of Canada, Australia, New Zealand, Japan, Israel,
the EU, and Argentina. Although, this ban bodes well for dairy products’ safety standards in the country, it
has led to decline in yields. This shall gradually induce farmers to work towards implementing safer
methods of increasing yield. Other substances used in milk adulteration include caustic soda, urea, and
contaminated water etc. This has swayed the consumers’ mind set towards packaged milk to some degree
and we expect this trend to continue at a faster pace over the coming years.
63%59%
43%39%
15% 14%9%
0%
25%
50%
75%
US
EU
Bra
zil
Ch
ina
Sub
.S
Afr
ica
Ind
ia
Pak
ista
n
Chart 5: Processed diary products' share in total consumption
Source: FAO
Farmer retention , Artisanal
Production & wastage, 18 bn. Ltrs
Unprocessed 22 bn. Ltrs
Processed 4.2 bn . Ltrs
Chart 6: Growth opportunity in Pakistan diary sector
Source: FFL’s Analyst Briefing 2017
16%
21%
23%
10%
15%
20%
25%
Sales Operating Profit Net Profit
Chart 3: Nestle – 10 years’ CAGR
Source: Company Financials
30%
15%
8%
0%
20%
40%
Gross Profit Margin Operating Profit Margin Net Profit Margin
Chart 4: Nestle - 10 years’ average profitability ratios
Source: Company Financials
Opportunity for conversion
to processed milk

Key trends serving as growth drivers in the “formal” milk segment
Following drivers would continue to unfold growth opportunities in Pakistan’s formal milk sector:
Demographics
- 55% of the total population is in the age bracket of 5-29 years (113.8 million milk
lovers!)
Convenience
- With family structures changing towards working couples, the need for packaged milk is
a necessity
- Raw milk (informal sector) requires it to be immediately boiled and refrigerated
Urbanization
- From 2013 – 2017, the urban population grew by 3% i.e. additional 6.2 million people
- By 2030, this % is expected to be half of the total population!
Wellness
- Rise in Consumer demand for healthy products
About the Company
Incorporated in 1966, FFL (formerly Noon Pakistan Ltd.) started its humble beginnings from the small village
of Nurpur, Sarghoda (Punjab). Fast forward 50+ years, and we don’t have to look far to realize that the
House of Nurpur is a brand that is synonymous with high quality. Today, FFL boasts the most extensive
product portfolio as compared to its peers (Nestle, Engro Foods, Shakarganj, and Haleeb), being active in
chilled dairy, ambient dairy, juices, and jams. In April 2015, the Fauji Group acquired 63.4% of FFL, and put
in place a rigorous growth strategy. This strategy included the commissioning of a cutting edge UHT plant, a
production portfolio expansion, rebranding, modernization and expansion of milk collection centers, and an
enhancement of the distribution and sales network. As a testament to the materializing of this strategy,
2017 alone saw the introduction of four new products, namely “Must” Fruit Juices, Nurpur Low Fat UHT
Milk, Nurpur Flavored Milk, and Nurpur Lassi. These four products added to FFL’s already renowned
portfolio of Dostea (tea whitener), and the very recognizable Nurpur Milk, butter, and cheese line.
About the Sponsors
Perhaps one of the greatest of comforts in favor of FFL is the backing of the resources, skills, and power of
the Fauji group. The Fauji Foundation itself started in 1945, pre Pakistan, as a “Post War Services
Reconstruction Fund” for Indian veterans who served the British crown for WW2. At the time of the
partition, the amount of the fund apportioned to the now Pakistanis, was transferred. This fund of PKR
18.2mn was invested in a textile mill, and soon after, the earnings from this mill were used to construct a
50 bedded TB hospital in Rawalpindi. Fast forward six and a half decades to today and the Fauji Foundation
now operates in more than 18 industries, and uses approximately 80% of its income to serve about 9mn
Tea Whitener
76%
UHT Milk16%
UHT flavor Milk2%
Pesturized Milk
4%
Butter2%
Cheese0%
Chart 7: Product Mix
Source: Company Financials 2016
3% 3% 3% 4% 4%
13%
19% 20% 20%
25%
0%
15%
30%
Dec-16 Mar-17 Jun-17 Sep-17 Dec-17
Plain White Milk Market Share LiquidTea Creamer Market Share
Chart 8: FFL’S market share in Milk & Tea Whitener
Source: FFL’s Analyst Briefing 2017

beneficiaries. Such growth is nearly unmatched in the country, and goes miles in showcasing the ability of
the group.
FFL Strategy -Exponential revenue growth and improving product mix
FFL has posted a two year (CY16-17) sales CAGR of 108%! It clearly shows that FFL is expanding quite
rapidly in capturing market share in an industry with the likes of NESTLE and EFOODS. In this context,
marketing & distribution (M&D) expenses as a percentage of sales for FFL presently exceed that of
established firms i.e. NESTLE & EFOODS.
Needless to say, market share cannot be captured without significant spending in advertising, marketing
and distribution for any new entrant in a competitive environment. Such spending paired with sizeable
investments in infrastructure is the primary reason for the losses seen over the past couple of years and is
considered quite normal for any new entrant in this industry with an aggressive growth strategy. Here, a
subtle point worth noting would be that these expenses should normalize going forward as the company
gains market share.
FF 12.8%
FFBL 50.6%
Funds 2.0%
Noon 14.0%
Others 21.0%
Chart 10: FFL’s Shareholding Pattern
Source: FFL’s Analyst Briefing 2017
Chart 9: FFL’s product portfolio
Source: Company Website, FFL’s Analyst Briefing 2017
9%
36% 33%
10% 12% 11%
15% 16% 15%
0%
10%
20%
30%
40%
2015 2016 2017
FFL EFOODS Nestle
Chart 12: Mktg. & Dist. Exp. as % of Sales
Source: Company Financials
1.62
3.37
7.00
0
2
4
6
8
10
CY15 CY16 CY17
PKR Bn
Chart 11: FFL’s Sales
Source: Company Financials

The company has reported loss per share amounting to PKR 3.38, PKR 8.75, & PKR 9.22 in CY15, CY16 &
CY17 respectively. In an industry where demand has barely been tapped into, we like the fact that FFL is
investing heavily in positioning itself to catapult into grabbing a sizeable market share. FMCG firms usually
go through a similar phase in the initial years of their business life cycle and show losses in the bottom line.
Gradually as market share is captured with sizable volumes the bottom line numbers begin to turn green.
Savvy investors understand this particular business model in FMCG business, and value such firms on price
to sales basis while monitoring closely their top line growth. Therefore, it would not do justice with FFL if
one decides to evaluate it solely on recent financial performance.
In order to penetrate the market and build a fresh distribution network in the country, the company offered
higher trade discounts which were the cause of lower reported margins. This is a normal phenomenon for
any new entrant in the consumer industry. FFL strongly feels it is now in a position to reduce its large trade
discounts offered which would help improve margins complemented with efficiencies from changes in the
current product mix going forward.
Dostea- Liquid Tea Whitener
Liquid Tea Whitener by the name of “Dostea” has been a huge success in this growing market with
Pakistanis love for tea in their daily life. Dostea has gained 25% of the market share in a short span. The
success has been on the back of its highly liked taste and secret recipe versus its competitors. Moreover,
the acceptance of Dostea in rural areas is also picking up due to issues of storage of raw milk required for
making tea and its subsequent wastage in wake of power breakdowns if stored in refrigerators.
The company feels that this strong penetration now requires less marketing expense and focus shall be on
maintaining its market share further given it is a low margin product when compared to UHT milk. Dostea is
composed of SMP (skimmed milk powder), HPO (hydrogenated palm oil) and sugar. SMP is imported and is
of very high quality. Its prices may vary internationally over time and exchange rate fluctuations may affect
margins. Purchase contracts of imported SMP are normally of 6 months, giving a hedge to FFL on any
upward price movement in international prices. Also, to counter loss in margins in the event of further rise
in SMP prices, the company has a contingency plan which is to use local high grade quality SMP. This has
been tested for consumer satisfaction and could give essentially the same taste to Dostea made from
imported SMP. Furthermore, the company can also use procured milk to compensate in times when prices
of imported SMP are affecting margins.
UHT Nurpur Milk
The company presently aims to put additional focus on the UHT milk segment where margins are higher
along with further strengthening its distribution network given the expansive landscape of Pakistan. Here,
FFL is in a more comfortable position given the success of its tea whitener explained earlier.
The one step plant which is a “5G grade” procured from TetraPak Sweden is the top of the line technology
available in the world today with greater fuel and water efficiency compared to its predecessors. Installed
0.48
1.05
3.83
0
1
2
3
4
5
2015 2016 2017
Chart 13: FFL’s Capex
Source: Company Financials
114%
75%67%
0%
40%
80%
120%
2015 2016 2017
Chart 14: Capital Structure (Total debt to assets ratio)
Source: Company Financials
PKR Bn

capacity for liquid products is approximately 650,000 litres per day. UHT volumes have picked up reasonably
over the past two years as its distribution network deepens. The UHT segment provides a higher margin
when compared to tea whitener. FFL procures milk from rural collection centers and has the latest testing
equipment which allows it to test the barrels of milk on site before being transported on chilled vans to the
plant. Recently, FFL has also signed a partnership in Feb 2018 with the Australian Government funded
Market Development Facility (MDF). Through this partnership, 20 new milk collection centers are to be
opened in southern Punjab. Critical knowledge on best practices relating to milking, vaccination, and
husbandry will be shared at these centers with smallholder farmers.
Nurpur Butter
Butter produced by the name of NURPUR BUTTER is a leading trusted household name for generations in
Pakistan. Butter is a very high margin product in the dairy line. However, focus on UHT milk and Dostea in
the past couple of years was necessary as the company built its distribution network due to the high
installed capacity and cost of the plant. Since now both products are known, the company can and in fact
has already started to focus on butter as well. Competition in butter has been primarily limited to just one
foreign brand by the name of Lurpak from Denmark. Price difference between the two has now been
reduced to ~ 25-30% which was previously as high as 100% without affecting sales. The company can easily
meet the total demand of the formal butter segment in Pakistan and needs only to expand its distribution
network to capture further market share. Extra fat extracted during the treatment of raw milk at the plant
supplements the butter manufacturing process at a lower cost resulting in higher margins particularly given
limited competition. We expect this strategy to increase average margins from this year onwards on the
overall product mix.
Nurpur Cheese
Cheese is presently a negligible contributing product in its top line, but the management seems quite keen
on strengthening its market penetration possibly through a re-launch strategy in the very near future.
Moreover, with the onset of the fast food culture over the past couple of decades and success of foreign
and local fast food chains, cheese as a product has seen an increasing demand though no established data is
available to validate market size. We expect the average margins of the portfolio to increase once Cheese is
launched aggressively.
MUST flavored drinks and Nurpur Lassi
Flavored drinks by the name of “Must” and “Lassi” constitute one segment which offers huge potential in
Pakistan given the severe under penetration in the industry. Though, competition is high and margins are
tight but increase in volumes would add value to the bottom line which again requires a stronger
distribution network already being in the focus of the management.
Future products
The company appears quite determined to possibly launch new products in the medium term though we’ll
have to wait for any specific details in the coming quarters as the management remains tight lipped on
which products it is considering. However, based on a competitive analysis of the products of other major
players (mainly NESTLE, EFOODS and Shakarganj) in our market, only four key products are missing, in our
opinion, which FFL does not have and others currently produce. These include: Yoghurt, Dry Milk Powder,
Cream and Ice Cream. However, the management was clear that Ice Cream is the least contender given
issues in the cold chain within Pakistan which would take time to resolve. We would have to wait and see
what product of the remaining three the company launches in the future.

Tetra Pak-UHT TECHNOLOGY FOR DAIRY PRODUCTS
Used for the sterilization of low acid foods, UHT treatment involves heating the product to over 135 °C.
It destroys all microorganisms, making the end product suitable for ambient distribution.
UHT treatment requires both a sterilizer and an aseptic unit (for packaging the product). It is used for
low acid (above pH 4.6) products such as UHT milk, UHT flavoured milk, UHT creams and other dairy
alternatives. The same process is also used to sterilize prepared food, such as soups, sauces, desserts,
tomato and fruit preparations, and baby food.
In UHT treatment, the goal is to maximize the destruction of microorganisms while minimizing the
chemical changes in the product. That means finding the optimal combination of temperature and
processing time for different types of food.
Tetra Pak offers two alternative methods of UHT treatment: direct or indirect. In direct UHT heating,
steam is briefly injected into the product, and this is rapidly followed by flash cooling. The brevity of
the treatment makes it possible to achieve very high product quality.
An alternative process is HTST pasteurization (high temperature/short time), in which the milk is
heated to 72 °C (162 °F) for at least 15 seconds.
UHT milk packaged in a sterile container, if not opened, has a typical unrefrigerated shelf life of six to
nine months. However, in Pakistan due to higher prevailing temperatures the shelf life is deliberately
quoted at 90 days for safety of the consumer. In contrast, HTST pasteurized milk has a shelf life of
about two weeks from processing, or about one week from being put on sale. Again in Pakistan this is
reduced to approximately 3 days.
Technology – Process
Ultra-high-temperature processing is performed in complex production plants, which perform several
stages of food processing and packaging automatically and in succession:
Heating
Flash cooling
Homogenization
Aseptic packaging
In the heating stage, the treated liquid is first pre-heated to a non-critical temperature (70–80°C for
milk), and then quickly heated to the temperature required by the process. There are two types of
heating technologies: direct, where the product is put in a direct contact with the hot steam,
and indirect, where the product and the heating medium remain separated by the equipment's contact
surfaces. The main goals of the design, both from product quality and from efficiency standpoints, are
Chart 15: Product Portfolio Comparison
Category Product FFL EFOODS NESTLE Shakarganj Haleeb
Chilled
Butter
Cheese
Pasteurized
Yogurt
Ambient
UHT Milk
Tea Creamer
Flavored Milk
Cream
Juices Juices & Fruit Drink
Jams Jams
Dry Dry Milk
Other Ice Cream

to maintain the high product temperature for the shortest period possible, and to ensure that the
temperature is evenly distributed throughout.
Direct heating systems
Direct systems have an advantage that the product is held at a high temperature for a shorter period of
time, thereby reducing the thermal damage for the sensitive products such as milk. There are two
groups of direct systems:
Injection-based, where the high-pressure steam is injected into the liquid. It allows fast
heating and cooling, but is only suitable for some products. As the product comes in contact
with the hot nozzle, there is a possibility of local overheating.
Infusion-based, where the liquid is pumped through a nozzle into a chamber with high-
pressure steam at a relatively low concentration, providing a large surface contact area. This
method achieves near-instantaneous heating and cooling and even distribution of
temperature, avoiding local overheating. It is suitable for liquids of both low and
high viscosity.
Indirect heating systems
In indirect systems, the product is heated by a solid heat exchanger similar to those used for
pasteurization. However, as higher temperatures are applied, it is necessary to employ higher
pressures in order to prevent boiling. There are three types of exchangers in use:
Plate exchangers,
Tubular exchangers
Scraped-surface exchangers.
For higher efficiency, pressurized water or steam is used as the medium for heating the exchangers
themselves, accompanied with a regeneration unit which allows reuse of the medium and energy
saving.
Flash cooling
After heating, the hot product is passed to a holding tube and then to a vacuum chamber, where it
suddenly loses the temperature and vaporizes. The process, referred to as flash cooling, reduces the
risk of thermal damage, removes some or all of excess water obtained through the contact with steam,
and removes some of volatile compounds which negatively affect the product quality. Cooling rate and
the quantity of water removed is determined by the level of vacuum, which must be carefully
calibrated.
Homogenization
Homogenization is part of the process specific for milk. Homogenization is a mechanical treatment
which results in decrease of size and increase of number and total surface area of fat globules in milk
number. That, in turn, reduces milk's tendency to form cream at the surface and on contacts with
container, enhances its stability, and makes it more palatable for consumers.
Aseptic packaging
Aseptic packaging refers to technique in which previously sterilized milk is aseptically packaged in a
sterile package and hermetically sealed to have prolonged shelf life even under ambient conditions.

Valuation
Our equity valuation of FFL is based on the results of the DCF and relative valuation analysis which
translates into Dec-2018 target price of PKR 47/share implying a 52% upside from current level; therefore,
we set a BUY recommendation for FFL. Note that we have assigned 50% weight to DCF valuation and 25%
each to both of our relative valuation techniques. We believe the company would continue to grow market
share in expanding markets and is set to benefit from increasing capacity utilization and efficiencies by
altering the current product mix sold.
Key valuation assumptions:
Discounted cash-flows (DCF)
We have considered the discounted value of the firm’s estimated free cash flow from CY18 to
CY25;
10.5% risk-free rate, which is comprised of yield on the 10-Yr Pakistan investment bond,
exhibiting our hawkish stance on interest rates going forward in the next 12 months;
Equity Market risk premium of 6.0%; and
Terminal growth rate set at 6.0%, reflecting our growth assumption for the food and FMCG
sector beyond the forecast period.
Relative Valuation
Market Cap (MC) to Sales 2011-2017 average of NESTLE & EFOODS’ trailing Market Cap to
sales ratio (2.62x) times our 2018e FFL’s Sales.
Enterprise Value (EV) per liter – 2011-2017 average of NESTLE & EFOODS’ trailing EV/ liter
ratio (PKR 155/ liter) times our 2018e FFL’s capacity in liters. Note that we have assumed no
change in the company’s capacity during our forecasted period
In both the above valuation techniques, we have then conservatively assumed 20% discount
to the relevant multiples to arrive at our valuation target for FFL. Hence, our benchmark MC/
Sales & EV/ liter multiples comes to approx. 2.1x and PKR 124/ liter respectively.
1.9
2.4
3.3
4.0 4.3
3.1
3.9
0.6
1.1
2.4
1.9 2.2
2.6 2.9
1.0
2.2
1.2
0.0
1.0
2.0
3.0
4.0
5.0
2011 2012 2013 2014 2015 2016 2017
NESTLE EFOODS FFL
Chart 16: Market cap / Sales
Source: Company Financials
100
148
188
235 241
186
239
46
80
143
117
148 148 155
29
66 49
-
50
100
150
200
250
2011 2012 2013 2014 2015 2016 2017*
NESTLE EFOODS FFL
Chart 17: EV / liter
Source: Company Financials
Valuation Weights TP
DCF 50% 40
MC/Sales 25% 45
EV/Liter 25% 65
Final TP
47
Potential stock price triggers
These would include though may not be limited to the following:
Minimum Pasteurization Law in the offing – Internationally this law has been applied in a lot of
countries. The law sets a minimum percentage at which the formal sector should operate
within the milk industry. The effect of such a law is that demand of milk in any nation
channelizes from the informal sector to the formal sector as the share of the former gradually
declines while the latter builds up and gains market share. This if implemented in future in
Pakistan would be a huge Game Changer for FFL.
Product development & market penetration to bolster revenue growth – In that, the company
already has an extensive portfolio of products vis-à-vis industry competition. Any new product
launches (yogurt, cream & dry milk) along with a tilt towards existing high margin products
(UHT, butter & cheese) would have significant impact on net earnings
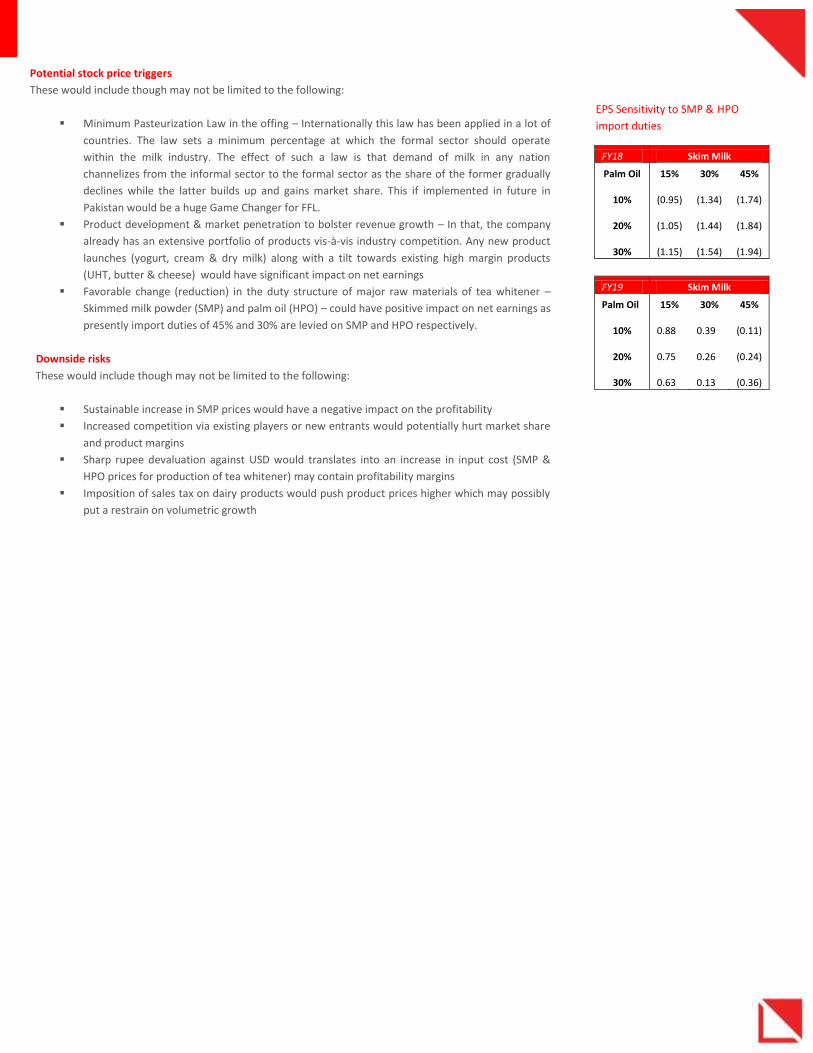
Favorable change (reduction) in the duty structure of major raw materials of tea whitener –
Skimmed milk powder (SMP) and palm oil (HPO) – could have positive impact on net earnings as
presently import duties of 45% and 30% are levied on SMP and HPO respectively.
Downside risks
These would include though may not be limited to the following:
Sustainable increase in SMP prices would have a negative impact on the profitability
Increased competition via existing players or new entrants would potentially hurt market share
and product margins
Sharp rupee devaluation against USD would translates into an increase in input cost (SMP &
HPO prices for production of tea whitener) may contain profitability margins
Imposition of sales tax on dairy products would push product prices higher which may possibly
put a restrain on volumetric growth
FY18 Skim Milk
Palm Oil 15% 30% 45%
10% (0.95)
(1.34)
(1.74)
20% (1.05)
(1.44)
(1.84)
30% (1.15)
(1.54)
(1.94)
FY19 Skim Milk
Palm Oil 15% 30% 45%
10% 0.88
0.39
(0.11)
20% 0.75
0.26
(0.24)
30% 0.63
0.13
(0.36)
EPS Sensitivity to SMP & HPO
import duties

Income Statement
PKR million CY'16A CY'17A CY'18F CY'19F CY'20F CY'21F CY'22F CY'23F
Net Sales 3,371 7,001 10,006 13,138 16,805 20,260 23,457 27,558
Cost of Sales 3,265 6,814 8,533 10,620 12,965 15,101 17,036 19,700
Gross Profit 106 187 1,474 2,518 3,840 5,159 6,421 7,858
Dist Exp 1,216 2,335 1,718 1,957 1,898 2,019 2,291 2,360
Admin Exp 257 411 441 482 528 579 636 701
EBITDA (1,175) (2,018) (67) 701 2,037 3,187 4,121 5,429
Profit before tax (1,518) (3,016) (1,398) (538) 743 1,869 2,856 4,253
Net profit (967) (2,288) (1,023) (191) 520 1,308 1,999 2,977
Balance Sheet
PKR million CY'16A CY'17A CY'18F CY'19F CY'20F CY'21F CY'22F CY'23F
PPE 4,938 6,822 6,818 6,836 6,860 6,890 6,925 6,965
Others 634 1,080 1,080 1,080 1,080 1,080 1,080 1,080
Current Assets 2,109 4,005 4,248 4,603 4,905 5,349 5,633 6,131
Total Assets 7,681 11,907 12,145 12,518 12,845 13,318 13,637 14,176
Equity 1,801 3,486 2,464 2,273 2,793 4,101 6,100 9,077
Short Term Borrowing
3,899 1,450 2,445 3,266 4,335 4,707 3,458 651
Long Term Finances - 4,450 4,450 3,917 2,433 900 267 267
Equity & Liabilities 7,681 11,907 12,145 12,518 12,845 13,318 13,637 14,176
Key Ratios
CY'16A CY'17A CY'18F CY'19F CY'20F CY'21F CY'22F CY'23F
EPS/(LPS) (8.75) (9.22) (1.94) (0.36) 0.99 2.48 3.79 5.64
DPS - - - - - - - 2.25
BVPS 16.30 14.04 4.67 4.30 5.29 7.77 11.55 17.19
Gross Margin 3% 3% 15% 19% 23% 25% 27% 29%
Operating Margins
-41% -37% -7% 1% 8% 13% 15% 17%
Net Margins -29% -33% -10% -1% 3% 6% 9% 11%
Financial Outlook

Rating Expected Total Return
Buy R ≥ 15%
Neutral 0% ≥ R < 15%
Sell R < 0%
Analyst Certification: All of the views expressed in this report accurately reflect the personal views of the responsible
analyst(s) about any and all of the subject securities or issuers. No part of the compensation of the responsible analyst(s)
named herein is, or will be, directly or indirectly, related to the specific recommendations or views expressed by the
responsible analyst(s) in this report.
Disclaimer The information and opinion contained in this report have been compiled by our research department from sources believed by it to be reliable and in good faith, but no representation or warranty, express or implied, is made as to their accuracy, completeness or correctness. All opinions and estimates contained in the document constitute the department’s judgment as of the date of this document and are subject to change without notice and are provided in good faith but without legal responsibility. This report is not, and should not be construed as, an offer to sell or a solicitation of an offer to buy any securities. Next Capital Limited (NCL) or persons connected with it may from time to time have investment banking or other relationship, including but not limited to, the participation or investment in commercial banking transactions (including loans) with some or all of the issuers mentioned therein, either for their own account or the account of their customers. NCL may be providing, or have provided within the previous twelve months, significant advice or brokerage services to the subject company. NCL may have, within the past twelve months, served as manager or co-manager of a public offering of securities for, or currently may make a primary market in issues of, any or all, the entities mentioned in this report or received compensation for corporate advisory services, brokerage services or underwriting services from the subject company. The Subject Company may have been a client of NCL in the past twelve months. NCL might intend to seek compensation for corporate advisory services, brokerage services or underwriting services from the Subject Company in the next three months. Directors, officers and associated of NCL may have received compensation from the Subject Company in the previous twelve months. This report may contain forward looking statements which are often but not always identified by the use of words such as “anticipate”, “believe”, “estimate”, “intend”, “plan”, “expect”, “forecast”, “predict” and “project” and statements that an event or result “may”, “will”, “can”, “should”, “could” or “might” occur or be achieved and other similar expressions. Such forward looking statements are based on assumptions made and information currently available to us and are subject to certain risks and uncertainties that could cause the actual results to differ materially from those expressed in any forward looking statements. Readers are cautioned not to place undue relevance on these forward looking statements. NCEL expressly disclaims any obligation to update or revise any such forward looking statements to reflect new information, events or circumstances after the date of this publication or to reflect the occurrence of unanticipated events. Exchange rate fluctuations may affect the return to investors. Neither the company nor any of its affiliates, nor any other person, accepts any liability whatsoever for any direct or consequential loss arising from any use of this report or the information contained therein. Next Capital Limited, its respective affiliate companies, associates, directors and/or employees may have investments in
securities or derivatives of securities of companies mentioned in this report, and may make investment decisions that
are inconsistent with the views expressed in this report. NCL or any of its officers and directors does not have a
significant financial interest (above 1% of the value of the securities of the subject company) in the securities of the
subject company
Valuation Methodology
The research analyst has used blended valuation methodology (DCF & Relative) to arrive at Dec-18 Target Price, which is
our estimate of fundamental value under a set of assumptions.
Rating System
Next Capital Limited also employs a three tier rating system, depending upon expected total return (R) of the stock, as
follows:
Ratings are updated regularly based on the latest developments in the economy/sector/company, changes in stock
prices, and changes in analyst’s assumptions.
Key Risks
• Increase in SMP prices
• Exchange rate devaluation
• Imposition of sales tax
Where; R = Expected Dividend Yield + Expected Capital Gain R’ is before tax Investment horizon is between six months to twelve months
Analyst Certification and Disclosures