an exploratory study of the inputs for ensemble clustering ... · partitioning around medoids (pam)...
TRANSCRIPT

An exploratory study of the inputs for ensemble clustering technique as a subset selection problem
Samy Ayed, Mahir Arzoky, Stephen Swift, Steve Counsell & Allan Tucker
Brunel University, London, UK
{samy.ayad,mahir.arzoky,stephen.swift, steve.counsell,allan.tucker}@brunel.ac.uk
IDA RESEARCH GROUP
8th February 2018
Contents
Data Clustering
Issues with Data Clustering
Ensemble Clustering Problem
Subset Selection
Experiments
Results and Post-Analysis
Conclusions and Future Work
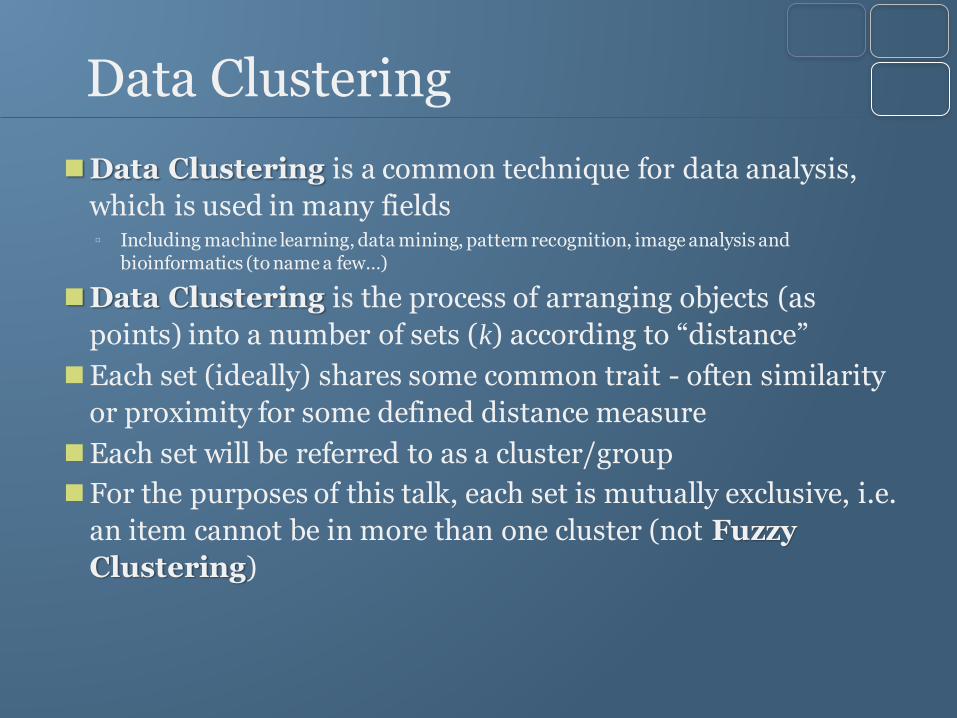
Data Clustering
Data Clustering is a common technique for data analysis,
which is used in many fields▫ Including machine learning, data mining, pattern recognition, image analysis and
bioinformatics (to name a few…)
Data Clustering is the process of arranging objects (as
points) into a number of sets (k) according to “distance”
Each set (ideally) shares some common trait - often similarity
or proximity for some defined distance measure
Each set will be referred to as a cluster/group
For the purposes of this talk, each set is mutually exclusive, i.e.
an item cannot be in more than one cluster (not Fuzzy
Clustering)

The “Ideal” Data Clustering Method
Features desirable in the“ideal” Clustering Method:▫ Scalable and efficient▫ Able to cope with arbitrary shaped clusters
▫ Can cope with noise, outliers and missing data
▫ No requirements on row or column ordering▫ Can cope with high dimensionality and a large number of
records
▫ Flexibility to incorporate any user constraints▫ Interpretable, explainable, usable, (parameters)
▫ No limitation on features/variables/data – type and number
▫ Repeatable results
▫ Back in the real world..
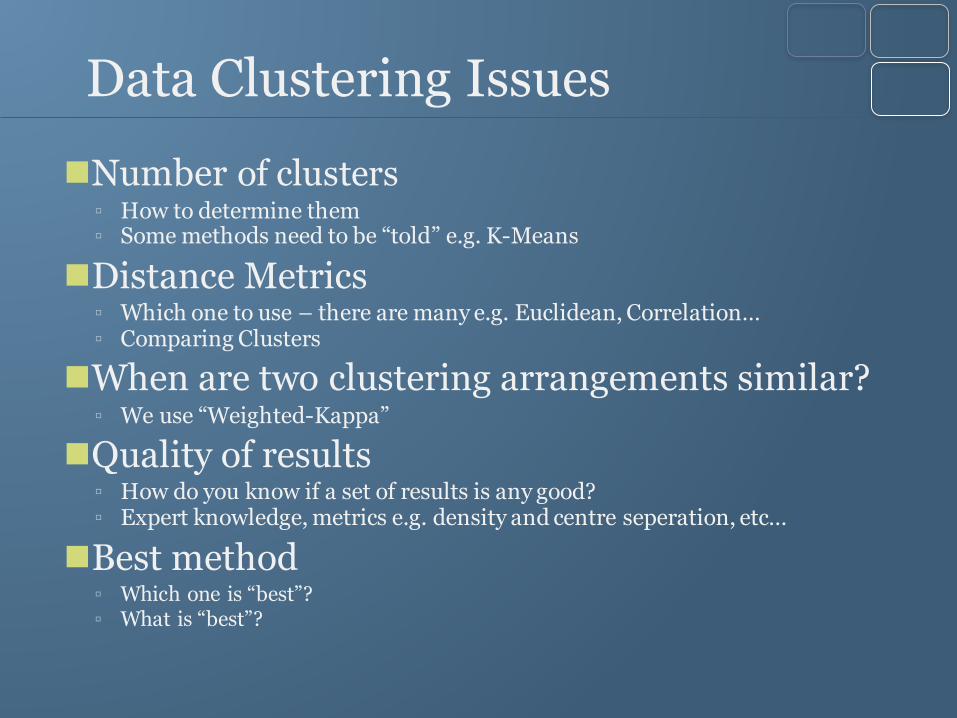
Data Clustering Issues
Number of clusters▫ How to determine them▫ Some methods need to be “told” e.g. K-Means
Distance Metrics▫ Which one to use – there are many e.g. Euclidean, Correlation…▫ Comparing Clusters
When are two clustering arrangements similar?▫ We use “Weighted-Kappa”
Quality of results▫ How do you know if a set of results is any good?▫ Expert knowledge, metrics e.g. density and centre seperation, etc…
Best method▫ Which one is “best”?▫ What is “best”?

There is no “Free Lunch”
• The “No Free Lunch” theorem in mathematical optimisation states:
“For certain types of mathematical problems, the computational cost of finding a solution, averaged over all
problems in the class, is the same for any solution method”
• No solution therefore can alwaysoffer a better set of results…

What Does This Mean?
• An equivalent theorem exists for Machine Leaning algorithms
• Which includes Data Clustering methods• This theorem effectively states that just because
method X is great at solving problem Y it might be no use at solving problem Z▫ Even if problem Y and Z are very, very similar...
• This makes the lives as implementers of these types of algorithms somewhat difficult
• How do you choose the correct method to apply to a set of data?
“Implications”
• The results are highly variable
• No clear “winner” [method]
• No clear “loser” [method]
• What to do?

Ensemble Clustering
• One solution would be to apply “Ensemble Clustering” methods
• Ensemble clustering takes a number of clustering method and produces the best clustering results based on agreement between the methods
• Cluster the clustering results…• We use Consensus Clustering
Aim and Objectives
• Given a large library of clustering methods and datasets, we aim to identify and select a suitable subset for benchmarking and testing Ensemble clustering techniques
• Lack of approaches that looks at identifying the optimal subset of both clustering inputs and datasets
• We propose to use Weighted Kappa (WK), which measures agreements between the clustering methods (inputs)
• No previous study looked at selecting both clustering inputs and datasets for EC using heuristic search techniques
• We investigates a novel combinatorial optimisation technique that looks at controlling the number of inputs and datasets in a more efficient manner

Datasets
The datasets are derived from various data repositories
Emphasis on real-world data
Mainly clustering data, bio-medical, statistical, botanical, social and ecological data
All datasets under analysis contain the expected clustering arrangements so we can compute WK values
Data collected from: University of Heidelberg Institute for Applied Mathematics
ML-Data Repository
UCI Machine Learning Repository
Kaggle data repository
University of Carnegie Mellon Department of Statistics
University of Monash
The Time Series Data Library (TSDL)
Statistical Science Web.

Clustering Methods
Clustering methods Details Variations
K-means The ‘stats’ package is used for implementing the K-means function. The
following algorithms were used: Forgy, Lloyd, MacQueen and Hartigan-Wong.
4
Hierarchical
Clustering
The agglomeration methods are Ward, Single, Complete, Average, Mcquitty,
Median and Centroid. Two versions of the methods are produced, using bothEuclidian and Correlation distance methods. The ‘stats’ package is used.
14
Model-based
clustering
Model-based clustering is implemented using a contributed R package called
‘mclust’. The following identifiers is used VII, EEI, VVI, EEV and VVV.
5
Affinity
Propagation (AP)
An R package for AP clustering called ‘apcluster’ is used. AP was computed
using the following similarity methods: negDistMat, expSimMat andlinSimMat.
3
Partitioning
Around Medoids(PAM)
A more generic version of the K-means method is implemented using the
‘cluster’ package. Two similarity distance methods are used: Euclidean andCorrelation.
2
Clara (partitioning
clustering)
Clara is a partitioning clustering method for large applications. It is part of the
‘cluster’ package.
1
X-means Clustering An R Script based on (Pelleg and Moore, 2002). 1
Density Based
Clustering ofApplications withNoise (DBSCAN)
A density-based algorithm as part of the ‘dbscan’ package. 1
Louvain
Clustering
A multi-level optimisation of modularity algorithm for finding community
structure.
1

Problem Definition
198 datasets and 32 inputs
Some of the datasets appear not to cluster and
some of the clustering methods are not as
effective as others
Difficult to get representative datasets by
performing experiments on all the data as they are all of different sizes and properties
The same difficulty can be said for the inputs (clustering methods)

Matrix Creation
• A 32 by 198 matrix of the WK values of the inputs’ (clustering methods) clustering arrangements versus the expected clustering arrangements for each of the datasets was constructed.
Let W be an n rows (number of datasets) by m columns (number of inputs) real matrix where the ith, jth value wij is the WK of input j (the actual clustering arrangement versus
the expected clustering arrangement) applied to dataset i
Weighted-Kappa
Introduction Experimental Methods Experiments Results Conclusions
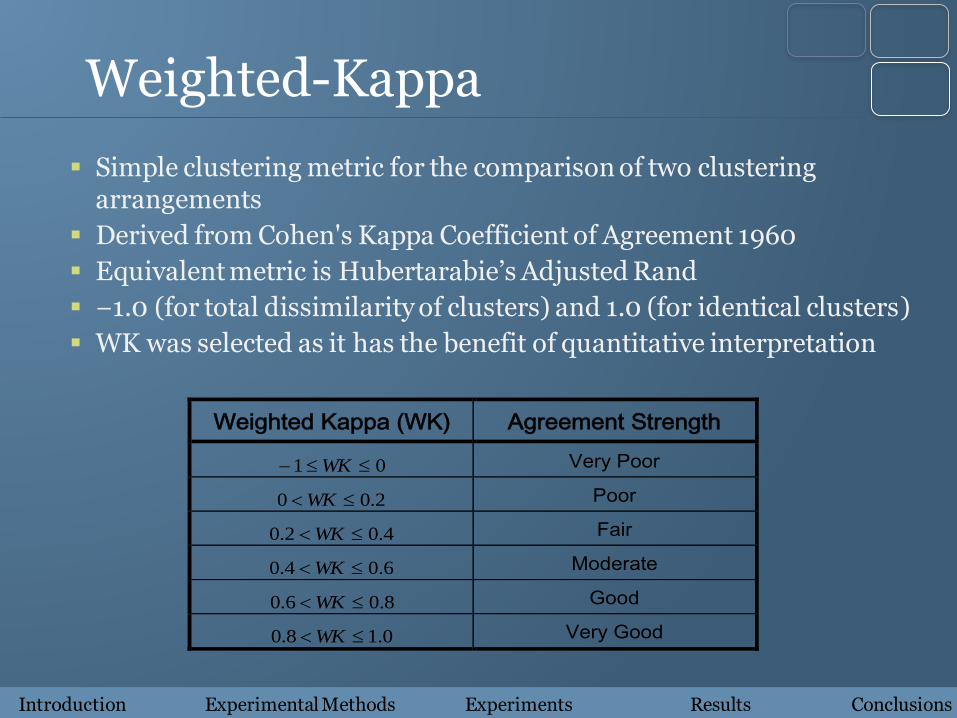
Simple clustering metric for the comparison of two clustering arrangements
Derived from Cohen's Kappa Coefficient of Agreement 1960
Equivalent metric is Hubertarabie’s Adjusted Rand
−1.0 (for total dissimilarity of clusters) and 1.0 (for identical clusters)
WK was selected as it has the benefit of quantitative interpretation
Weighted Kappa (WK) Agreement Strength
01 WK Very Poor
2.00 WK Poor
4.02.0 WK Fair
6.04.0 WK Moderate
8.06.0 WK Good
0.18.0 WK Very Good
Defining The Threshold 1
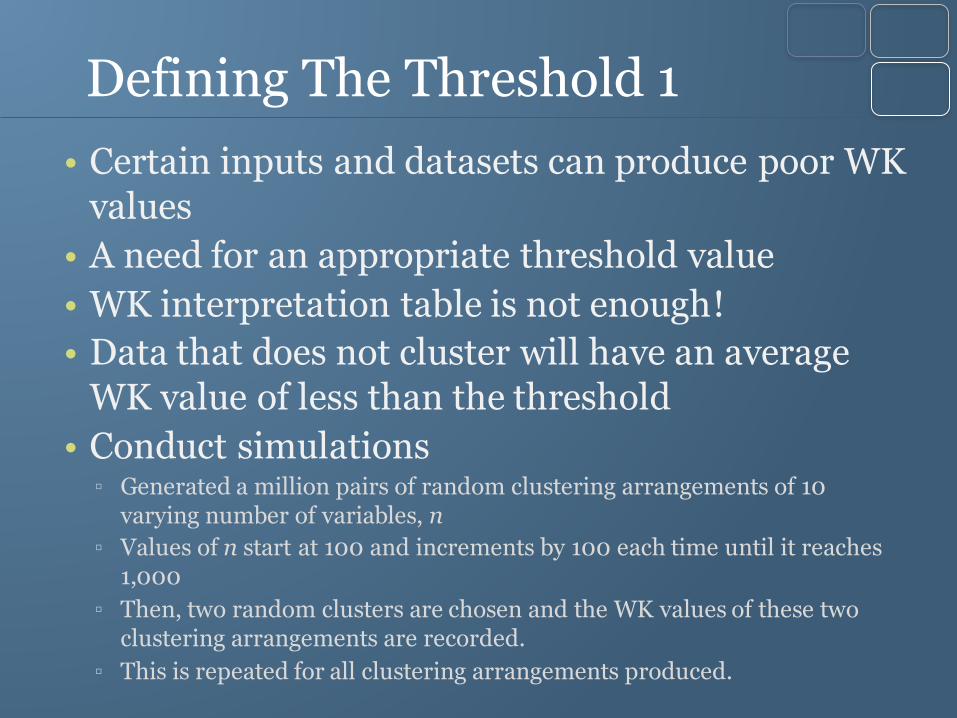
• Certain inputs and datasets can produce poor WK values
• A need for an appropriate threshold value
• WK interpretation table is not enough!
• Data that does not cluster will have an average WK value of less than the threshold
• Conduct simulations ▫ Generated a million pairs of random clustering arrangements of 10
varying number of variables, n
▫ Values of n start at 100 and increments by 100 each time until it reaches 1,000
▫ Then, two random clusters are chosen and the WK values of these two clustering arrangements are recorded.
▫ This is repeated for all clustering arrangements produced.
Defining The Threshold 2
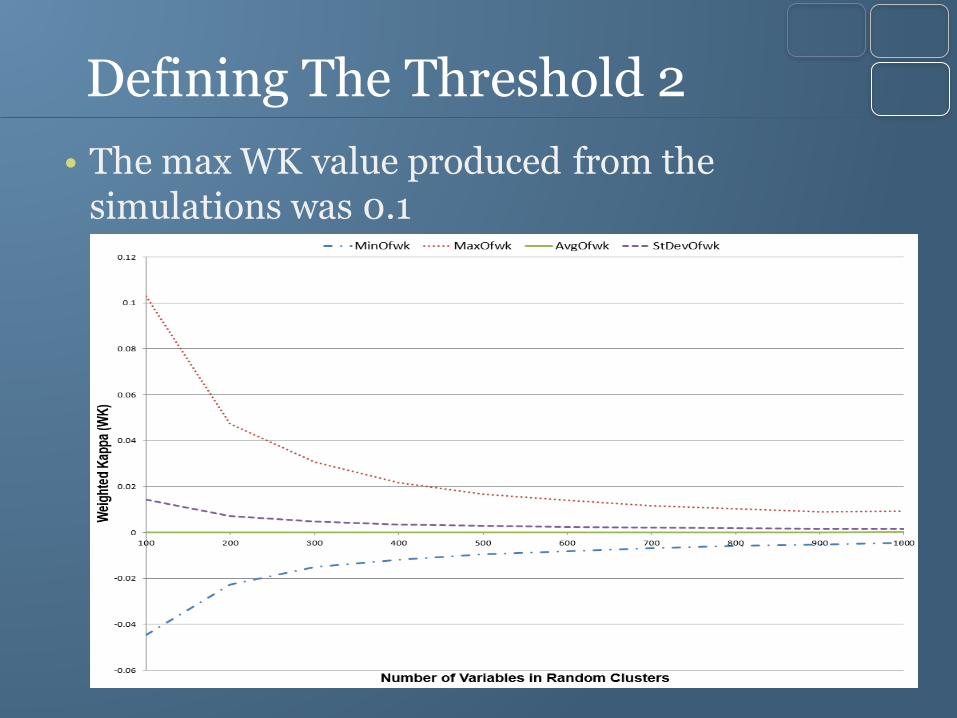
• The max WK value produced from the simulations was 0.1
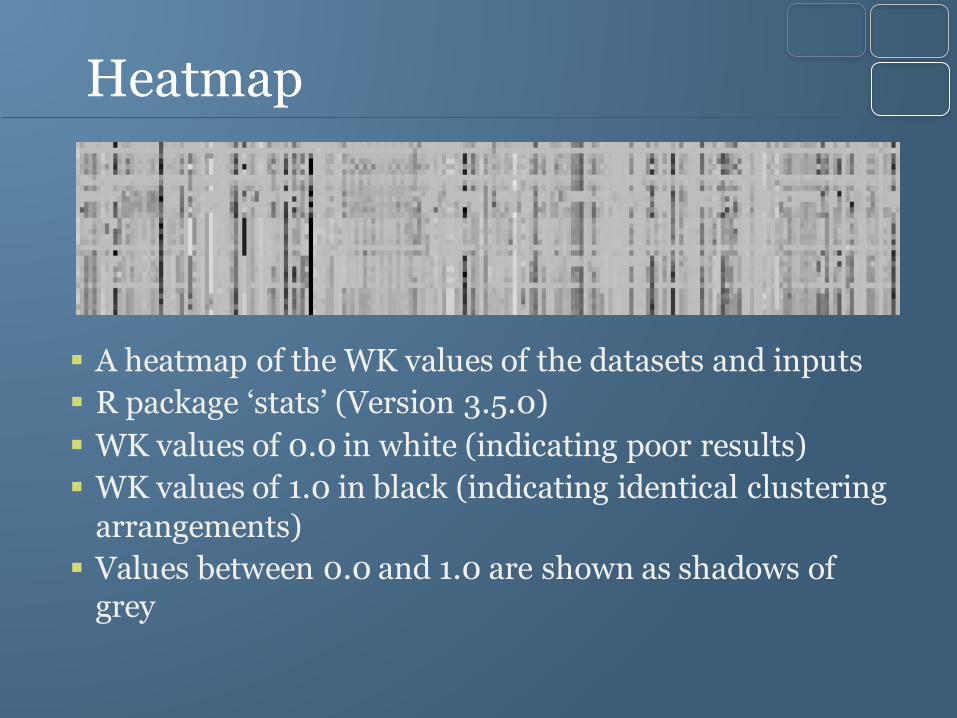
Heatmap
A heatmap of the WK values of the datasets and inputs
R package ‘stats’ (Version 3.5.0)
WK values of 0.0 in white (indicating poor results)
WK values of 1.0 in black (indicating identical clustering
arrangements)
Values between 0.0 and 1.0 are shown as shadows of grey
Subset Selection
Being able to identify inputs and datasets that are poor and to exclude them from the matrix is important
The aim is to find the best balance between inputs and datasets
Manually removing poor datasets/inputs would alter row/column averages as they are interconnected
Selecting appropriate datasets/inputs becomes a sub-selection problem where the goal is to include as many datasets and as many clustering methods as possible

Experiments
Input: 32 by 198 matrix
Output: a subset containing the selected
datasets/inputs
Threshold: WK value of 0.1
Five methods:
Manual Selection 1
Manual Selection 2
Random Mutation Hill Climbing
Simulated Annealing
Genetic Algorithm

Results
Method Datasets Inputs % Datasets % Inputs
MS1 79 11 39.9 34.4
MS2 53 28 26.8 87.5
RMHC 60 28 30.3 87.5
SA 60 28 30.3 87.5
GA 60 28 30.3 87.5

Convergence Graph
HC converges at the least number of iterations, 3,283
SA comes second in terms of runtime, converging at 5,701 iterations
GA performed the worst converging last
The FF from all experiments is 221.895. The min theoretical fitness is -399.839 and max is 288.823
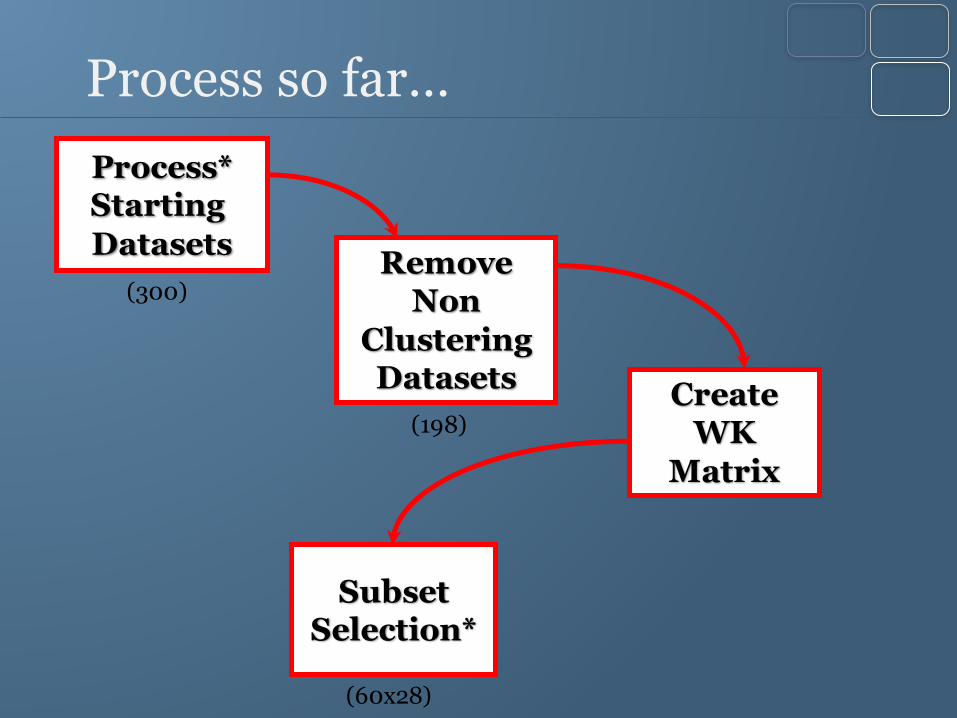
Process so far…
Process*Starting
DatasetsRemove
Non
Clustering Datasets
SubsetSelection*
Create WK
Matrix
(300)
(198)
(60x28)
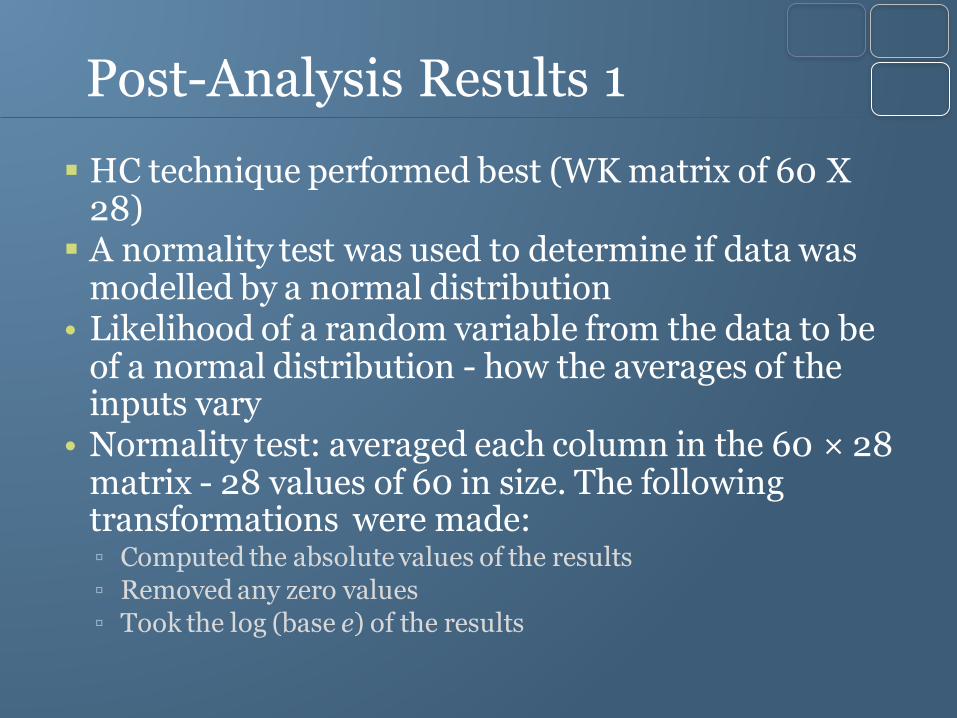
Post-Analysis Results 1
HC technique performed best (WK matrix of 60 X 28)
A normality test was used to determine if data was modelled by a normal distribution
• Likelihood of a random variable from the data to be of a normal distribution - how the averages of the inputs vary
• Normality test: averaged each column in the 60 × 28 matrix - 28 values of 60 in size. The following transformations were made: ▫ Computed the absolute values of the results
▫ Removed any zero values
▫ Took the log (base e) of the results
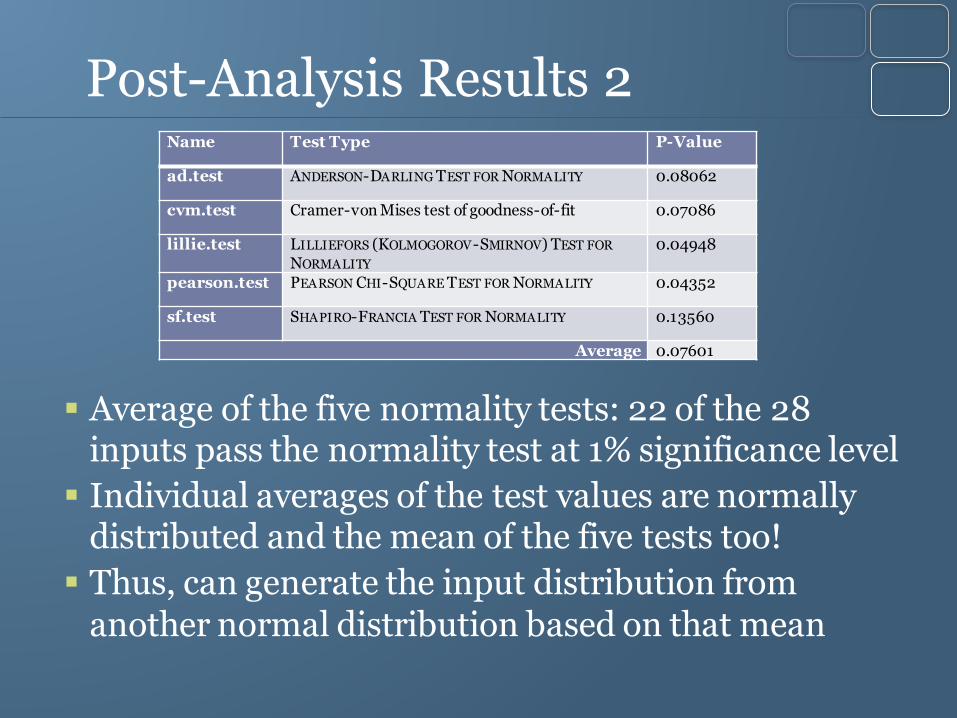
Post-Analysis Results 2
Average of the five normality tests: 22 of the 28 inputs pass the normality test at 1% significance level
Individual averages of the test values are normally distributed and the mean of the five tests too!
Thus, can generate the input distribution from another normal distribution based on that mean
Name Test Type P-Value
ad.test ANDERSON-DARLING TEST FOR NORMALITY 0.08062
cvm.test Cramer-von Mises test of goodness-of-fit 0.07086
lillie.test LILLIEFORS (KOLMOGOROV-SMIRNOV) TEST FOR
NORMALITY
0.04948
pearson.test PEARSON CHI-SQUARE TEST FOR NORMALITY 0.04352
sf.test SHAPIRO-FRANCIA TEST FOR NORMALITY 0.13560
Average 0.07601
Post-Analysis Results 3
To see if there is a link between the intra-method agreement
and method vs. expected: For the 60 datasets, computed average WK of inputs vs. expected
For the 60 datasets computed average WK of inputs vs. inputs
Correlating these two datasets (0.562) - strong correlation above 1% significance
level
Suggests: if inputs keeps increasing, the mean of the inputs vs. inputs will possibly start resembling the mean of inputs vs.
expected
Interesting! It is possible to find out the average quality of inputs without having the expected clustering arrangements
So we only compare inputs vs. inputs and compute average. If very high, then clustering methods are reasonably accurate
If very low, clustering methods are not appropriate

Post-Analysis Results 3
To find out if any bias in WK values produced or in our proposed technique
Investigate relationship between average input vs. expected and size of the datasets (No. of instances and attributes)
Correlation: No. of attributes (0.093) and No. of instances (0.165)
Weak and does not pass 10% significance level (0.211).
Indicates: no relationships between average WK of inputs and changing dataset sizes i.e. independent
Does not increase/reduce based on dataset size
Same repeated for correlating the average input vs. input and dataset sizes
Correlations is also weak: number of attributes (0.014) and number of instances (0.187).
No Bias!

Conclusions & Future Work
Clustering inputs and datasets for EC can be poor
Difficult to identify poor inputs or appropriate datasets
Five sub-selection techniques proposed (three heuristic and two manual selection)
A normal distribution model, based on the WK values of the inputs, can be used to generate the input distributions
Using these techniques may improve the results for EC
Propose a quick metric to estimate the quality of the inputs, if there are no expected clustering arrangements
Expand on the datasets to model a more accurate distribution
Extend this study towards a larger combinatorial optimisation
problem and apply results to CC

Thanks for listening!