clustering 1: k-means, k-medoids - cmu...
TRANSCRIPT

Clustering 1: K-means, K-medoids
Ryan TibshiraniData Mining: 36-462/36-662
January 24 2013
Optional reading: ISL 10.3, ESL 14.3
1

What is clustering? And why?Clustering: task of dividing up data into groups (clusters), so thatpoints in any one group are more “similar” to each other than topoints outside the group
Why cluster? Two main uses
I Summary: deriving a reduced representation of the full dataset. E.g., vector quantitization (we’ll see this shortly)
I Discovery: looking for new insights into the structure of thedata. E.g., finding groups of students that commit similarmistakes, or groups of 80s songs that sound alike
Other uses, e.g.,
I Checking up on someone else’s work/decisions, investigatingthe validity of pre-existing group assignments
I Helping with prediction, i.e., in classification or regression
We won’t study clustering for verification purposes, but we’ll seeclustering in prediction later
2
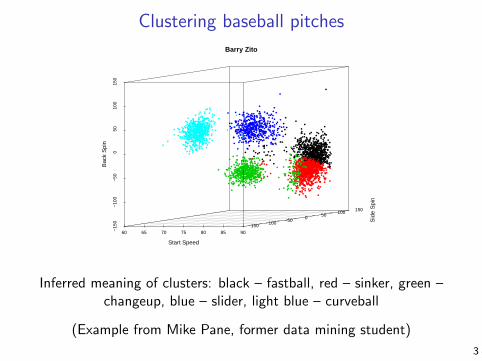
Clustering baseball pitches
Barry Zito
60 65 70 75 80 85 90−15
0−
100
−50
0
50
100
150
−150 −100 −50 0 50 100 150
Start Speed
Sid
e S
pin
Bac
k S
pin
●
●
●
●
●●
●
●
●
●
●
●
●
●
●
●
●
●
●
●
●
●
●
●
●
●
●
●
●
●
●
●
●
●
●
●●
●
●
●
●
●
●
●
●
●
●
●
● ●
●
●
●
●
●
●
●
●
●
●
●
●
●
●
●
●
●
●
●
●
●
●
●
●
●
●
●
●
●
●●
●
●
●
●
●
●
●
●
●
●
●
●
●
●
●
●
●
●
●
●
●
●
●
●
●
●
●
●
●
●
●
●
●
●
●
●
●
●
●
●
●
●
●
●
●
●●
●
●
●●
●
●
●
●
●
●
●
●
●
●
●
●
●
●
●
●
●
●
●
●
●
●
●
●
●
●
●
●
●
●●
●
● ●
●
●
●
●●
●
●
●
●
●●
●
●●
●
●
●
●
●●
●●●
●
●
●
●
●
●
●
●
●
●
●
●
●
●
●
●
●
●
●
●
●
●
●
●
●
●
●
●
●
●
●
●
●
●
●
●
●
●
●
●
●●
●
●
●
●
●
●
●
●
●
●
●
●●
●
● ●
●
●
●
●
●
●
●
●
●
●
●
●
●
●
●
●
● ●●●
●
●
●
●
●
●
●
●
● ●
●
●●
●●
●
● ●
●
●
●●
●
●
●
●
●
●
● ●
●
●
●
●
●
●
●●
●
● ●
●
●
●
●
●
●
●
●
●
●
●
●
●
●
●
●●
●
●
●
●
●
●
●
●
●
●
●
●●
●
●
●
●
● ●●
●
●
●●
●
●●
●
●
●
●
●
●
●
●
●
●
●
●
●
●
●
●
●
●
●● ●
●
●
●
●
●
●
●
●
●
●
●
●
●
●
●●
●
●
●
●
●
●
●
● ●
●●
●
●
●
●
●
●
●
●
●
●
●
●
●●
●
●
●
●
●
●
●
●
●
●
●
●
●
●
●
●
●
●
●
●
●●
●
●
●●
●
●
●
●
●
●●
●
●
●
●
●
●
●
●●
●
●
●
●
●
●
●
●
●
●
●
●
●●
●
●
●
●
●
●
●
●
●
● ●
●
●
●
●
●
●
●
●
●
● ●
●
●
●
●
●
●
●
●
●
●
●
●
●
●
●
●
●
●
●
●●
●
●
●
●
● ●
●
●
●
●
●
●
●
●
●
●
●●
●
●
●
●
●
●
●
●
●●
●
●
●
●
●
●
●
●
●
●
●
●
●
●
●
●
●
●
●
●●
●
●
●
●
●
●●
●
●
●
●
●
●
●
●
●
●
●●
●
●●
●
●
●
●
●
●●
●
●
●
●
●
●
●
●
●
●
●
●
●
●
●
●
●
●
●
●
●
●
●
●
●
●
●
●●
●
●
●●
●
●
●
●
●
●
●
●
●
●
●
●
●
●●
●
●
●●●
●
●
●
●
●
●
●
●
●
●
●
●●
●● ●●
●
●
●
●
●
●
●
●
●
●
●
●
●
●
●
●
●
●
●
●
●
●
●
●
●
●
●
●
●
●
●
●
●●
●
●
●
●
●
●●
●
●
●
●
●
● ●
●● ●
●
●
●
●
●
●
●
●
●
●
●
●
●
●
●
●
●
●
●
●
●
●
●
●●
●
●
●
●
●
●
●
●
● ●
●
●
●
●
●
●
●
●
●
● ●
● ●
●
●●
●
●
●
●
●
●
●
●
●●
●
●
●
●
●
●
●
●●
●
●
●
●
●
●
●
●
●●
●
●
●
●
●
●
●
●
●
●
●
●●
●●
●
●
●
●
●
●
●
●
●
●
●
●
●
●
●
●
●
●
●
●
●
●
●
●
●
● ●●
●
●
●
●●
●
●●
●
●
●
●
●
●
●
●
●
●
●
●
●
●
●
●
●
●
●
●
●
●
●
●
●
●
●
●
●
●
●
●
●
●
●
●
●
●
●
●
●●
●●
●
●
●
●
●
●
●
●
●
●
●
●
●
●
●●
●
●
●
●
●
●
●
●
●
●
●
● ●
●
●
●
●
●
●
●
●
●
●● ●
●
●
●
●
●
●
●
●●
●
●
●
●
●
●
●●
●
●
●
●
●
●
●
●
●
●
●
●
●
●
●
●
●
●
●
●
●
●
●
●
●
●
●
●
●
●
●
●
●
●
●
●
●
●
●
●
●
●
●
●
●
●
● ●
●
●
●
●
●●●
●
●
●
●
●
●
●
●
●
●
●
●●
●
●●
●
● ●
●
●
●
●
●
●
●
●
●
●
●
●
●
●
●
●
●
●
●
●
●
●
●
●
●
●
●
●
●
●
●
●
●
●
●
●
●
●
●●
●
●
●●
● ●
●
●
●
●
●
●
●
●
●●
●
●
● ●
●●
●
●
●
●
●● ●
●
●
●
●
●●
●
●●
●
●
●
●
●
●
●
●
●
●
●
●
●
●
●●
●
●
●
●
●●
●
●
●
●●
●
●
●
●
●
●
●●
● ●
●
●
●●
●
●
●
●●
●●
●
●
●
●
●●
●
●
●
●
●
●
●
●
● ●
●
●
●
●
●
●
●
●
●
●
●
●
●
● ●
●
●
●
●
●
●
●
●
●
●
●
●●
●
●
●
●
●
●
●
●
●
●
●
●
●●
●
●●
●
●
●
●
●
●
●
●
●
●
●
●
●
●
●
●
●
●
●
●
●
●
●
●
●
●
●
●
●
●
●
●
● ●
●
●
●
●
●
●●
●
●
●
●●
●
●
●●
●
●
●
●
●
●
●
●
●
●
●
●●
●●
●
●
●
●
●
●
●
●
●
●
●
●
●
●
●
●
●●
●
●
●
●
●
●
●
●
● ●
●
●
●
●
●
●
●
●
●
●
●
●●
●
●
●
●
●
●
●
●
●
●●
●
●
●●
●
●
●●
●●
●
●
●
●
●
●
●
●●
●
●
●
●
●
●
●
● ●
●
●
●
●
●
●
●
●
●
●
●
●
●
●●
●
●
●
●
●
●
● ●
●
●
●
●
●
●
●
●
●
●
●
●
●
●
●
●
●
●
●
●
●
●
●
●●
●
●
●
●
●
●
●●
● ●
●
●● ●
●
●
●
●
●
●
●
●
●
●
●●
●
●● ●
●
●
●
●●
●
● ●
●
●
●
●●
●
●
●
●
●
●
●●
●●
●
●
● ●
●
●
●
●
●
●
●
●
●
●
●
●●
●
●
●
●
●
●
● ●
●
●
●
●
●
●
●
●
● ●●
●
●
●
●
●
●
●
●
●
●●●
●
●
●
●
●●
●
●
●
●
●
●
●
●
●
●
●
●●
●●
●
●
●
●
●
●
●
●
●
●
●
●
●
● ●
●
●
●
●
●
●
●
●
●
●
●
●
●
●
●●
●
●●
●●
●
●
●
●●
●
●
●●●
●
●
●
●
●
●
●
●
●
●
●
●
●
●
●
●
●
●
● ●
●
●●
●
●
●●
●
●
●●●
●
●
●
●
● ●
●
●
●
●
●
●
●
●
●
●
●
●
●
●
●
●
●
●
●
●
●
●
●
●
●
●
●●
●
●
●
●
●
●
●●
●
●
●
●
●●
●
●
●●
●
●
●
●
●
●
●
●
●●
●
●
●
●
●●
●
●
●
●
●
●
●
●
●
●
●
●
●
●●
●
●
●
● ●
●
●
●
●●
●
●
●
●
●
●●
●
●
●
●
●
●
●
●
● ●
●
●
●●
●
●
●
●
●●
●
●
●●
●
●●
●
●
●
●
●
●
●
●
●
●
●●
●
●
●
●
●
●
●
●
●
●
●
●
●
●●
●
●
●
●
●
●
●
●
●
●
●
●
●●
●●
●●
●
●
●
●
●
●
●
●
●
●
●●
●
●
●
●
●
●
●
●
●
●
●●
●
●
●
● ●
●
●●●●
●
●
●
●
●●
●
●
●
● ●
●
●
●
●
●
●
●
●
●
●
●
●
●
●
●
●●
●
●
●
●
●
●
●
●●
●
●
●
●
●
●●
●
●
●
●
●
●●
● ●
●
●
●
●
●
●
●
●
●
●
●
●
●
● ●
●
●
●
●
●
●
●●
●
●
●
●
●●
●●
●
●
●
●
●
●
●
●
●
●
●
●
●
●
●
●
●
●
●
●●
●
●
●
● ●
●
●
●●
●
●
●
●
●
●
●
●
●
●
●
●
●
●
●
●●
● ●
●
●
●
●
●
●
●
●
●
●
●
●
●
●
●
●
●
●
●
●
●
●
●
● ●
●
●
●
●
●
●
●
●
●
●
●
●
●
●
●
●
●
●
●
●●
●
●
●
●
●
●
●
●
●
●
●
●
●●●
●
●
●
●
●
●
●
●
●
●
●
●
●
●
●
●
●
●
●
●●
●
●
●
●
●
●●
●
●
●
●
● ●
●
●
●
●
●
●
●
●
●
●
● ●
●
●
●●
●
●
●
●
●
●
●
●
●
●
●
● ●
●
●
●
●
●●
●
●
●
●
●
●
●●
●
●●
●
●
●
●
●
●
●
●
●
●
●●
●
●●
●
●
●
●
●
●
●
●
●
●
●
●
●●
●
●
●
●
●
●
●●
●
●
●
●
●
●
●●
●
●
●
●
●
●●
●●
●
●
●
●
●
●
●
●
●
●
●
●
●
●●
●
●
●
●
●
●
● ●
●●
●
●
●
●
●
●
●
●
●
●
●
●
●
●
●
●
●
●
●
●
●
●
●
●
● ●
●
●
●
●
●
●
●
●● ●
●
●
●
●
●
●
●
●
●
●
●
●●
●
●
●
●
●
●
● ●
●
●●
●
●
●
●
●
●
●
●
●
●
●
●
●
●
●
●
●
●
●●
●●
●
●●
● ●
●●
●●
●
●
●
●●
●
●
●●
●
●●
●
●
●
●
●
●
●
●●
●
●
●
●●●
●
● ●
●
●
●
●
●●
●
●
●
●
●
●
●
●
●●
●
●
●
●
●
●
●
●●●
●●
● ●
●
●
●
●
●
●
●
●
●
●
●
●
●●
●
●
●●
●
●
●
●
●●
●
●
●
●
●
●
●
●
●
●●
●●
●
●
●
● ●
●
●
●
●
●
●
●
●
●
●
●
●
●
●
●
●
●
●
●
●
●
●
●
● ●
●
●
●
●●
●
●
●
●
●
●
●
●
●
●●
●
●●
●
●
●
●
●
●
●
●
●
●
●
●
●
●
●●
●
●
●
●
●
●
●
●
●
●
●
●
●
●
●●
●
●
●
●
●
●
●
●
●
●
●
●
●
●
●
●
●
●●
●
●
●
●
●
●●
●●
●
●
●
●
●●
●
●
●
● ●
●●
●
●
●
●
●
●●
●
●
●
●
●
●
●
●
●
●
●
●
●●
●
●
●
●
●
●
●
●
●
●
●
●
●
●
●
●
●
●
●
●
●
●
●
●
●
●●
●
●
●
●
●
●
●
●
●
● ●
●
●
●
●
●
●
●
●
●
●
●
●●
●
●
●●
●
●
●
●
●
●
●
●
●
●
●
●
●
●
●
●
●●
●
●
●
●
●
●●
●
●
●
●
●
●
●
●
●
●
●
●
●●
●
●
●
●
●●
●
●●
●
●
●
●
●
●
●
●
●
●
●●
●
●
●
●
●
● ●●
●
●
●
●●
●
●
●
●
●
●●
●
●
●
●
●
●
●
●
●
●●
●
●
● ●●
●
● ●●
●
●
●●
●
●
●
●
●
●
●
●●●
●
●
●
●
●
●
●
●
●
●
●
●●
●
●
●
●
●
●
●
●
●
●
●
●
●
●
●●
●
●
●
●
●
●●
●
●
●
●
●●
●
●
●
●●
●
●
●
●
●
●
●
●●
●
●
●
●●●
●
●
●
●
●
●
●
●
●
●
●
●
●
●
●
●
●
●
●
●
●
●
●
●
●
●
●
●
●
●
●
●
●
●
●
●
●
●
●
●●
●
●
●
●
●
●
●●
●
●
●
● ●
●
●
●
●
●
●
●
●●
●
●
●
●
●
●
●
●
●
●
●
●
●
●
●
●
●
●
●
●
●
●
●
●
●
●
●
●
●
●
●
●●
●
●
●●
●
●
●
●
●
●
●●
●
●
●●
●
●
●
●
●
●
●
●
●
●
●
●
●
●●
●
●
●
●
●
●
●
●●
●●
●
●
●
●●
●
●
●●
●●
●
●
●
●
●
●●
●
●
●
●●
●
●
●
●
●
●
●
●
●
●●
●
●
●
●
●●
●
●
●
●
●
●●
●
●●
●
●●●
●
●
●
●
●
●
●
●
●
●
●
●
●
●
●
●
●
●
●
●
●
●
●●
●
●
●
●
●
●
●
●
●
●
●
● ●●
●
●●
●
●
●
●
●
●
●
●●
●
●●
●
●
●●
●
●
●
●●
●
●
●
●●
●
●●
●
●●
●
●
●
● ●
●
●
●
●
●
●
● ●
●
●
●
●●
●
●
●
● ●
●
●
●
●
●
● ●●
●
●
●
●
●
●
●
●
●
●
●
●●
●
●
●
●
●
●
●
●
●●
●
●
●
●
●
●
●●
●
●●
●
●●
●
●
●
●●
●●
●
●
●
●●
●
●
●●
●
●
●
●●
●
●
●
●●
●
●
●
●
●
●
●
●●
●
●●
●
●
●
●
●
● ●
●
●
●
●
●●
●●
●
●●
●●
●
●
●●
●
●
●●
●
●
●
●
●
●
●
●
●
●
●
●
●
● ●●
●●
●
●
●
●
●●
●
●●
●
●
●
●
●
●
●
●
●
●
●
●
●
●●
●
●
●
●
●
●
●
●
●
●
●
●●
●
●
●
●
●
●●
●●
●
●
●
●
●
●
●
● ●
●
●
●
●
●
●
●
●
●
●●
●
●
●
●
●
●
●●
●●
● ●
●
● ●
●
●
●
●●
●
●
●
●
● ●●
●
●
●
●
●
●
●
●
●
●
●
●●
●
●
●●
●
●
●
● ●
● ●
●
●●
●
●
●
●
●
●
●●
●
● ●●
●●
●
●
●
●
●
●
●
●
●
●
●●●
●
●
●
●
●●
●●
●●
●
●
●
●
●
●
●●
●
●
● ●
●
●
●●
●
●
●
●●
●
●
●
●
●●
●
●
●
●
●●
●●●
●
●
●●
●
●
●
●
●
●●
●
●
●
●●●
●
●
●
●
●
●●
●
●
●
●●
●
●
●
●
●
●
●
● ●●
●
●
●
●
●
●
●
●
●
●●
●
●
●
●
●
●
●
●
●
●
●
●
● ●
●●
●
●
●
●
●
●
●●
●
●
●
●
●
●
●
●
●● ●
●
●●
●
●
●
●
●
●
●
●●
●
●
●
●●
●
●
●
●
●
●
●●
●
●
●
●
●
●
●
●
●
●
●
●
●
●●
●●
●
●
●●
●
●
●
● ●
●
●
●
●
●
●
●
●
●
●
●
●
● ●
●●
●
●
●
●
● ●●
●
●
●●
●
●
●
●●
●
●
●
●
●
●
●
●●
●
●
●
●
●
●● ●
●
●
●
●●
●
●
●
●
●
●
●
●
●
●
●
●
●
●
●
●
●
●
●
●
●
●●●
●
●
●
●
●
●
●●
●●
●
●
●
●
●
●
●
●●
●
●
●
●
●
●
●
●
●
●
●
●
●
●
●
●
●
●
● ●
● ●
●
●●
●
●
●●
●
●
●
● ●
Inferred meaning of clusters: black – fastball, red – sinker, green –changeup, blue – slider, light blue – curveball
(Example from Mike Pane, former data mining student)
3

Don’t confuse clustering and classification!
In classification, we have data for which the groups are known, andwe try to learn what differentiates these groups (i.e., classificationfunction) to properly classify future data
In clustering, we look at data for which groups are unknown andundefined, and try to learn the groups themselves, as well as whatdifferentiates them
4

Dissimilarity and within-cluster scatter
Given observations X1, . . . Xn, and dissimilarites d(Xi, Xj). (E.g.,think of Xi ∈ Rp and d(Xi, Xj) = ‖Xi −Xj‖22)
Let K be the number of clusters (fixed). A clustering of pointsX1, . . . Xn is a function C that assigns each observation Xi to agroup k ∈ {1, . . .K}
Notation: C(i) = k means that Xi is assigned to group k, and nk
is the number of points in the group k. Also, let dij = d(Xi, Xj)
The within-cluster scatter is defined as
W =1
2
K∑k=1
1
nk
∑C(i)=k,C(j)=k
dij
Smaller W is better
5

Simple example
Here n = 5 and K = 2,Xi ∈ R2 and dij = ‖Xi −Xj‖22
1 2 3 4 5
1 0 0.25 0.98 0.52 1.09
2 0.25 0 1.09 0.53 0.72
3 0.98 1.09 0 0.10 0.25
4 0.52 0.53 0.10 0 0.17
5 1.09 0.72 0.25 0.17 0
I Red clustering:Wred = (0.25 + 0.53 + 0.52)/3 + 0.25/2 = 0.56
I Blue clustering:Wblue = 0.25/2 + (0.10 + 0.17 + 0.25)/3 = 0.30
(Tip: dist function in R)
6

Finding the best group assignments
Smaller W is better, so why don’t we just directly find theclustering C that minimizes W?
Problem: doing so requires trying all possible assignments of the npoints into K groups. The number of possible assignments is
A(n,K) =1
K!
K∑k=1
(−1)K−k
(K
k
)kn
Note that A(10, 4) = 34, 105, and A(25, 4) ≈ 5× 10¹³ ... huge
Most problems we look at are going to have way more than n = 25observations, and potentially more than K = 4 clusters too (butK = 4 is not unrealistic)
So we’ll have to settle for an approximation
7
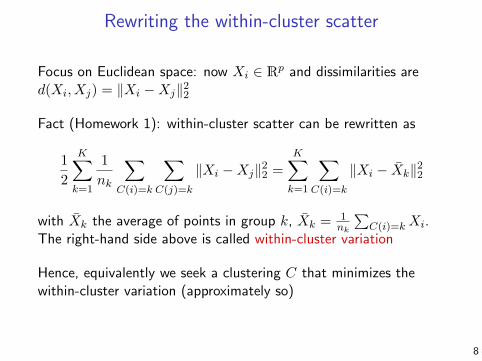
Rewriting the within-cluster scatter
Focus on Euclidean space: now Xi ∈ Rp and dissimilarities ared(Xi, Xj) = ‖Xi −Xj‖22
Fact (Homework 1): within-cluster scatter can be rewritten as
1
2
K∑k=1
1
nk
∑C(i)=k
∑C(j)=k
‖Xi −Xj‖22 =
K∑k=1
∑C(i)=k
‖Xi − X̄k‖22
with X̄k the average of points in group k, X̄k = 1nk
∑C(i)=k Xi.
The right-hand side above is called within-cluster variation
Hence, equivalently we seek a clustering C that minimizes thewithin-cluster variation (approximately so)
8
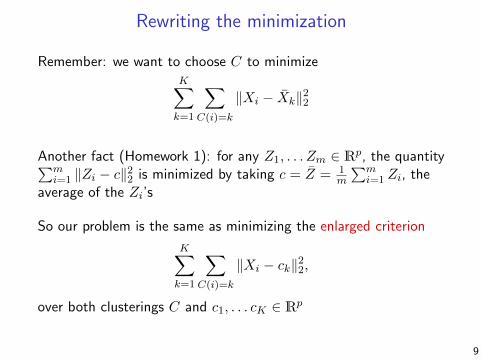
Rewriting the minimization
Remember: we want to choose C to minimizeK∑k=1
∑C(i)=k
‖Xi − X̄k‖22
Another fact (Homework 1): for any Z1, . . . Zm ∈ Rp, the quantity∑mi=1 ‖Zi − c‖22 is minimized by taking c = Z̄ = 1
m
∑mi=1 Zi, the
average of the Zi’s
So our problem is the same as minimizing the enlarged criterion
K∑k=1
∑C(i)=k
‖Xi − ck‖22,
over both clusterings C and c1, . . . cK ∈ Rp
9
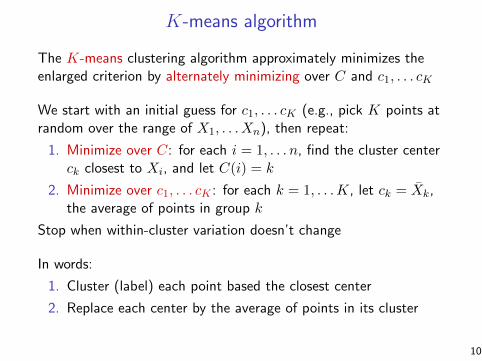
K-means algorithm
The K-means clustering algorithm approximately minimizes theenlarged criterion by alternately minimizing over C and c1, . . . cK
We start with an initial guess for c1, . . . cK (e.g., pick K points atrandom over the range of X1, . . . Xn), then repeat:
1. Minimize over C: for each i = 1, . . . n, find the cluster centerck closest to Xi, and let C(i) = k
2. Minimize over c1, . . . cK : for each k = 1, . . .K, let ck = X̄k,the average of points in group k
Stop when within-cluster variation doesn’t change
In words:
1. Cluster (label) each point based the closest center
2. Replace each center by the average of points in its cluster
10

K-means example
Here Xi ∈ R2, n = 300, and K = 3
●
●●
●
●
●
●
●
●
●
●
●
● ●
●
●
●
●●
●●
●
●●
●
● ●
●
●
●
●
●
●
●
●
●●
● ●●
●
●
●
●●●
●
●
●
●
●
●
●
●
●
●
●
●
●●
●
●
●
●
● ●
●
●
●
●
●
●
●●
●
●
●
●●
●
●●
●
●
●
●●
●
●
●
●●
●
●
●
●
●
●
● ●
●
●
●
●
●
●
●
●
●●
●
●
●
● ●
●
●
●
●
●
●
●
●●
●
●
●
●
●
●
●
●
● ●
●
●
●●
●
●
●
●
●●●
●
●● ●
●
●
●
●
●
●
●
●
●
●
●
●
●
●
●
●
●
●
●
●
●
●
●
●
●
●
●
●
●
●●
●
●●
●
● ●
●
●
●
●
●
●
●
●
●
●●
●
●
●
●
●
●
●
●●
●
●
●
●●
● ●●
●
●
●
●
●
●
●●
●●
●
●
●
●
●
●
●
●
●
●
●
●
●
●●
●
●●
●
●
●
●
●
●
●
●
●
●
●
●
●●
●●
●
● ● ●●●
●●
●
●
●
●
●●
●
●
●
●●
●
●●
●● ●●
●
●
●
●
●
●
●
● ●
●
●
●
●
●
●
●
−0.5 0.0 0.5 1.0 1.5
0.0
0.5
1.0
1.5
2.0
Initial centers
●
●
●
●
●
●
●
●●
●
●
●
●
●
●
●
●
●
● ●
●
●
●
●●
●●
●
●●
●
● ●
●
●
●
●
●
●
●
●
●●
● ●●
●
●
●
●●●
●
●
●
●
●
●
●
●
●
●
●
●
●●
●
●
●
●
● ●
●
●
●
●
●
●
●●
●
●
●
●●
●
●●
●
●
●
●●
●
●
●
●●
●
●
●
●
●
●
● ●
●
●
●
●
●
●
●
●
●●
●
●
●
● ●
●
●
●
●
●
●
●
●●
●
●
●
●
●
●
●
●
● ●
●
●
●●
●
●
●
●
●●●
●
●● ●
●
●
●
●
●
●
●
●
●
●
●
●
●
●
●
●
●
●
●
●
●
●
●
●
●
●
●
●
●
●●
●
●●
●
● ●
●
●
●
●
●
●
●
●
●
●●
●
●
●
●
●
●
●
●●
●
●
●
●●
● ●●
●
●
●
●
●
●
●●
●●
●
●
●
●
●
●
●
●
●
●
●
●
●
●●
●
●●
●
●
●
●
●
●
●
●
●
●
●
●
●●
●●
●
● ● ●●●
●●
●
●
●
●
●●
●
●
●
●●
●
●●
●● ●●
●
●
●
●
●
●
●
● ●
●
●
●
●
●
●
●
−0.5 0.0 0.5 1.0 1.50.
00.
51.
01.
52.
0
Iteration 1
●
●
●
●
●
●●
●●
●
●
●
●
●
●
●
●
●
● ●
●
●
●
●●
●●
●
●●
●
● ●
●
●
●
●
●
●
●
●
●●
● ●●
●
●
●
●●●
●
●
●
●
●
●
●
●
●
●
●
●
●●
●
●
●
●
● ●
●
●
●
●
●
●
●●
●
●
●
●●
●
●●
●
●
●
●●
●
●
●
●●
●
●
●
●
●
●
● ●
●
●
●
●
●
●
●
●
●●
●
●
●
● ●
●
●
●
●
●
●
●
●●
●
●
●
●
●
●
●
●
● ●
●
●
●●
●
●
●
●
●●●
●
●● ●
●
●
●
●
●
●
●
●
●
●
●
●
●
●
●
●
●
●
●
●
●
●
●
●
●
●
●
●
●
●●
●
●●
●
● ●
●
●
●
●
●
●
●
●
●
●●
●
●
●
●
●
●
●
●●
●
●
●
●●
● ●●
●
●
●
●
●
●
●●
●●
●
●
●
●
●
●
●
●
●
●
●
●
●
●●
●
●●
●
●
●
●
●
●
●
●
●
●
●
●
●●
●●
●
● ● ●●●
●●
●
●
●
●
●●
●
●
●
●●
●
●●
●● ●●
●
●
●
●
●
●
●
● ●
●
●
●
●
●
●
●
−0.5 0.0 0.5 1.0 1.5
0.0
0.5
1.0
1.5
2.0
Iteration 2
●
●
●
●
●
●
●
●●
●
●
●
●
●
●
●
●
●
● ●
●
●
●
●●
●●
●
●●
●
● ●
●
●
●
●
●
●
●
●
●●
● ●●
●
●
●
●●●
●
●
●
●
●
●
●
●
●
●
●
●
●●
●
●
●
●
● ●
●
●
●
●
●
●
●●
●
●
●
●●
●
●●
●
●
●
●●
●
●
●
●●
●
●
●
●
●
●
● ●
●
●
●
●
●
●
●
●
●●
●
●
●
● ●
●
●
●
●
●
●
●
●●
●
●
●
●
●
●
●
●
● ●
●
●
●●
●
●
●
●
●●●
●
●● ●
●
●
●
●
●
●
●
●
●
●
●
●
●
●
●
●
●
●
●
●
●
●
●
●
●
●
●
●
●
●●
●
●●
●
● ●
●
●
●
●
●
●
●
●
●
●●
●
●
●
●
●
●
●
●●
●
●
●
●●
● ●●
●
●
●
●
●
●
●●
●●
●
●
●
●
●
●
●
●
●
●
●
●
●
●●
●
●●
●
●
●
●
●
●
●
●
●
●
●
●
●●
●●
●
● ● ●●●
●●
●
●
●
●
●●
●
●
●
●●
●
●●
●● ●●
●
●
●
●
●
●
●
● ●
●
●
●
●
●
●
●
−0.5 0.0 0.5 1.0 1.5
0.0
0.5
1.0
1.5
2.0
Iteration 3
●
●
●
●
●
●
●
●●
●
●
●
●
●
●
●
●
●
● ●
●
●
●
●●
●●
●
●●
●
● ●
●
●
●
●
●
●
●
●
●●
● ●●
●
●
●
●●●
●
●
●
●
●
●
●
●
●
●
●
●
●●
●
●
●
●
● ●
●
●
●
●
●
●
●●
●
●
●
●●
●
●●
●
●
●
●●
●
●
●
●●
●
●
●
●
●
●
● ●
●
●
●
●
●
●
●
●
●●
●
●
●
● ●
●
●
●
●
●
●
●
●●
●
●
●
●
●
●
●
●
● ●
●
●
●●
●
●
●
●
●●●
●
●● ●
●
●
●
●
●
●
●
●
●
●
●
●
●
●
●
●
●
●
●
●
●
●
●
●
●
●
●
●
●
●●
●
●●
●
● ●
●
●
●
●
●
●
●
●
●
●●
●
●
●
●
●
●
●
●●
●
●
●
●●
● ●●
●
●
●
●
●
●
●●
●●
●
●
●
●
●
●
●
●
●
●
●
●
●
●●
●
●●
●
●
●
●
●
●
●
●
●
●
●
●
●●
●●
●
● ● ●●●
●●
●
●
●
●
●●
●
●
●
●●
●
●●
●● ●●
●
●
●
●
●
●
●
● ●
●
●
●
●
●
●
●
−0.5 0.0 0.5 1.0 1.5
0.0
0.5
1.0
1.5
2.0
Iteration 9
● ●
●
● ●
●
11

Voronoi tessellation
Given cluster centers, we identifyeach point to its nearest center.This defines a Voronoi tessellationof Rp
●
●
●
●
●●
●
●
●
●
●
●
●
●
●
●
●
● ●● ●
●
●
●
●
●
●●
●
●
●
●
●
●● ●
●
●
●
●
●
●
●
●
●
●
●
●
●
●
●
●
●
●
●
●
●
●
●
●
●
●
●
●
● ●
●
●
●
●
●
●
●●
●
●
●
●
●
●
●
●●
●
●
●●
●
●
●
●●
●
●
●
●
●
●
●●
●
● ●
●
●
●●
●
●
●●
●
●
●
●
●
●
●
●
●
●
●
●
●
●
●
●
●
●
●
●
●
● ●●
●
●
●
●●
●
●
●
●●
●
●
● ●
●●
●
●
●
●
●
●
●
●
●
●
●●
●
●
●
●
●
●
●
●
●
●●
●
●
●
●● ●
●
●●
●
● ●
●
●
●
●
●
●
●
●
●
●●
●
●●
●
●
●
●
●
●
●
●
●
●
●
●
●
●
●
●
●
●
●
●
●
●
●●
●●
●
●
●●
●
●
●
●
●
●
●
●
●
●
●
●
●●
●
●●
●
●
●
0.0 0.5 1.0 1.5
−0.
50.
00.
51.
01.
5
●
●
●
●
●●
●
●
●
●
●
●
●
●
●
●
●
● ●● ●
●
●
●
●
●
●●
●
●
●
●
●
●● ●
●
●
●
●
●
●
●
●
●
●
●
●
●
●
●
●
●
●
●
●
●
●
●
●
●
●
●
●
● ●
●
●
●
●
●
●
●●
●
●
●
●
●
●
●
●●
●
●
●●
●
●
●
●●
●
●
●
●
●
●
●●
●
● ●
●
●
●●
●
●
●●
●
●
●
●
●
●
●
●
●
●
●
●
●
●
●
●
●
●
●
●
●
● ●●
●
●
●
●●
●
●
●
●●
●
●
● ●
●●
●
●
●
●
●
●
●
●
●
●
●●
●
●
●
●
●
●
●
●
●
●●
●
●
●
●● ●
●
●●
●
● ●
●
●
●
●
●
●
●
●
●
●●
●
●●
●
●
●
●
●
●
●
●
●
●
●
●
●
●
●
●
●
●
●
●
●
●
●●
●●
●
●
●●
●
●
●
●
●
●
●
●
●
●
●
●
●●
●
●●
●
●
●
●
●
●
●
●
●
●
●
Given c1, . . . cK ∈ Rp, we define the Voronoi sets
Vk = {x ∈ Rp : ‖x− ck‖22 ≤ ‖x− cj‖22, j = 1, . . .K}, k = 1, . . .K
These are convex polyhedra (we’ll see them again when we studyclassification)
12

Properties of K-means
I Within-cluster variation decreases with each iteration of thealgorithm. I.e., if Wt is the within-cluster variation at iterationt, then Wt+1 ≤Wt (Homework 1)
I The algorithm always converges, no matter the initial clustercenters. In fact, it takes ≤ Kn iterations (why?)
I The final clustering depends on the initial cluster centers.Sometimes, different initial centers lead to very different finaloutputs. So we typically run K-means multiple times (e.g., 10times), randomly initializing cluster centers for each run, thenchoose among from collection of centers based on which onegives the smallest within-cluster variation
I The algorithm is not guaranteed to deliver the clustering thatglobally minimizes within-cluster variation (recall: this wouldrequire looking through all possible assignments!)
13

K-means example, multiple runs
Here Xi ∈ R2, n = 250, and K = 4, the points are not aswell-separated
●
●
●
●
●●
●
●
●
●
●
●
●
●
●
●
●
● ●● ●
●
●
●
●
●
●●
●
●
●
●
●
●● ●
●
●
●
●
●
●
●
●
●
●
●
●
●
●
●
●
●
●
●
●
●
●
●
●
●
●
●
●
● ●
●
●
●
●
●
●
●●
●
●
●
●
●
●
●
●●
●
●
●●
●
●
●
●●
●
●
●
●
●
●
●●
●
● ●
●
●
●●
●
●
●●
●
●
●
●
●
●
●
●
●
●
●
●
●
●
●
●
●
●
●
●
●
● ●●
●
●
●
●●
●
●
●
●●
●
●
● ●
●●
●
●
●
●
●
●
●
●
●
●
●●
●
●
●
●
●
●
●
●
●
●●
●
●
●
●● ●
●
●●
●
● ●
●
●
●
●
●
●
●
●
●
●●
●
●●
●
●
●
●
●
●
●
●
●
●
●
●
●
●
●
●
●
●
●
●
●
●
●●
●●
●
●
●●
●
●
●
●
●
●
●
●
●
●
●
●
●●
●
●●
●
●
●
0.0 0.5 1.0 1.5
−0.
50.
00.
51.
01.
5
WCV = 25.9
●
●
●
●
●
●
●
●
●
●
●
●
●●
●
●
●
●
●
●
●
●
●
●
●
● ●● ●
●
●
●
●
●
●●
●
●
●
●
●
●● ●
●
●
●
●
●
●
●
●
●
●
●
●
●
●
●
●
●
●
●
●
●
●
●
●
●
●
●
●
● ●
●
●
●
●
●
●
●●
●
●
●
●
●
●
●
●●
●
●
●●
●
●
●
●●
●
●
●
●
●
●
●●
●
● ●
●
●
●●
●
●
●●
●
●
●
●
●
●
●
●
●
●
●
●
●
●
●
●
●
●
●
●
●
● ●●
●
●
●
●●
●
●
●
●●
●
●
● ●
●●
●
●
●
●
●
●
●
●
●
●
●●
●
●
●
●
●
●
●
●
●
●●
●
●
●
●● ●
●
●●
●
● ●
●
●
●
●
●
●
●
●
●
●●
●
●●
●
●
●
●
●
●
●
●
●
●
●
●
●
●
●
●
●
●
●
●
●
●
●●
●●
●
●
●●
●
●
●
●
●
●
●
●
●
●
●
●
●●
●
●●
●
●
●
0.0 0.5 1.0 1.5
−0.
50.
00.
51.
01.
5
WCV = 18.1
●
●
●
●
●
●
●
●
●
●
●
●
●●
●
●
●
●
●
●
●
●
●
●
●
● ●● ●
●
●
●
●
●
●●
●
●
●
●
●
●● ●
●
●
●
●
●
●
●
●
●
●
●
●
●
●
●
●
●
●
●
●
●
●
●
●
●
●
●
●
● ●
●
●
●
●
●
●
●●
●
●
●
●
●
●
●
●●
●
●
●●
●
●
●
●●
●
●
●
●
●
●
●●
●
● ●
●
●
●●
●
●
●●
●
●
●
●
●
●
●
●
●
●
●
●
●
●
●
●
●
●
●
●
●
● ●●
●
●
●
●●
●
●
●
●●
●
●
● ●
●●
●
●
●
●
●
●
●
●
●
●
●●
●
●
●
●
●
●
●
●
●
●●
●
●
●
●● ●
●
●●
●
● ●
●
●
●
●
●
●
●
●
●
●●
●
●●
●
●
●
●
●
●
●
●
●
●
●
●
●
●
●
●
●
●
●
●
●
●
●●
●●
●
●
●●
●
●
●
●
●
●
●
●
●
●
●
●
●●
●
●●
●
●
●
0.0 0.5 1.0 1.5
−0.
50.
00.
51.
01.
5
WCV = 24.3
●
●
●
●
●
●
●
●
These are results of result of running the K-means algorithm withdifferent initial centers (chosen randomly over the range of theXi’s). We choose the second collection of centers because it yieldsthe smallest within-cluster variation
14
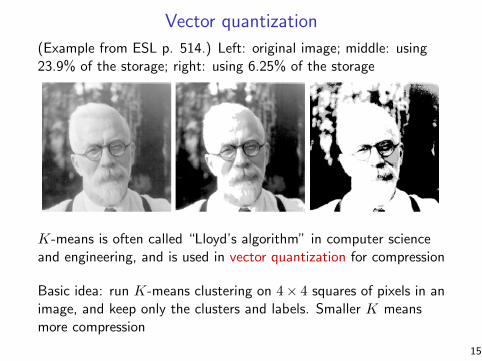
Vector quantization
(Example from ESL p. 514.) Left: original image; middle: using23.9% of the storage; right: using 6.25% of the storage
K-means is often called “Lloyd’s algorithm” in computer scienceand engineering, and is used in vector quantization for compression
Basic idea: run K-means clustering on 4× 4 squares of pixels in animage, and keep only the clusters and labels. Smaller K meansmore compression
15
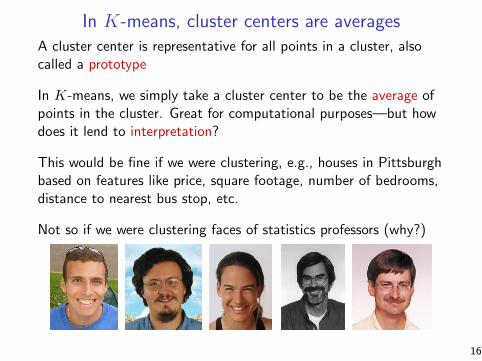
In K-means, cluster centers are averagesA cluster center is representative for all points in a cluster, alsocalled a prototype
In K-means, we simply take a cluster center to be the average ofpoints in the cluster. Great for computational purposes—but howdoes it lend to interpretation?
This would be fine if we were clustering, e.g., houses in Pittsburghbased on features like price, square footage, number of bedrooms,distance to nearest bus stop, etc.
Not so if we were clustering faces of statistics professors (why?)
16

K-medoids algorithmIn some applications we want each center to be one of the pointsitself. This is where K-medoids comes in—an algorithm similar tothe K-means algorithm, except when fitting the centers c1, . . . cK ,we restrict our attention to the points themselves
Initial guess for centers c1, . . . cK (e.g., randomly select K of thepoints X1, . . . Xn), then repeat:
1. Minimize over C: for each i = 1, . . . n, find the cluster centerck closest to Xi, and let C(i) = k
2. Minimize over c1, . . . cK : for each k = 1, . . .K, let ck = X∗k ,
the medoid of points in cluster k, i.e., the point Xi in clusterk that minimizes
∑C(j)=k ‖Xj −Xi‖22
Stop when within-cluster variation doesn’t change
In words:
1. Cluster (label) each point based on the closest center
2. Replace each center by the medoid of points in its cluster17

K-medoids example
●
●●
●
●
●
●
●
●
●
●
●
● ●
●
●
●
●●
●●
●
●●
●
● ●
●
●
●
●
●
●
●
●
●●
● ●●
●
●
●
●●●
●
●
●
●
●
●
●
●
●
●
●
●
●●
●
●
●
●
● ●
●
●
●
●
●
●
●●
●
●
●
●●
●
●●
●
●
●
●●
●
●
●
●●
●
●
●
●
●
●
● ●
●
●
●
●
●
●
●
●
●●
●
●
●
● ●
●
●
●
●
●
●
●
●●
●
●
●
●
●
●
●
●
● ●
●
●
●●
●
●
●
●
●●●
●
●● ●
●
●
●
●
●
●
●
●
●
●
●
●
●
●
●
●
●
●
●
●
●
●
●
●
●
●
●
●
●
●●
●
●●
●
● ●
●
●
●
●
●
●
●
●
●
●●
●
●
●
●
●
●
●
●●
●
●
●
●●
● ●●
●
●
●
●
●
●
●●
●●
●
●
●
●
●
●
●
●
●
●
●
●
●
●●
●
●●
●
●
●
●
●
●
●
●
●
●
●
●
●●
●●
●
● ● ●●●
●●
●
●
●
●
●●
●
●
●
●●
●
●●
●● ●●
●
●
●
●
●
●
●
● ●
●
●
●
●
●
●
●
−0.5 0.0 0.5 1.0 1.5
0.0
0.5
1.0
1.5
2.0
Initial centers
●
●
●
●
●
●
●
●●
●
●
●
●
●
●
●
●
●
● ●
●
●
●
●●
●●
●
●●
●
● ●
●
●
●
●
●
●
●
●
●●
● ●●
●
●
●
●●●
●
●
●
●
●
●
●
●
●
●
●
●
●●
●
●
●
●
● ●
●
●
●
●
●
●
●●
●
●
●
●●
●
●●
●
●
●
●●
●
●
●
●●
●
●
●
●
●
●
● ●
●
●
●
●
●
●
●
●
●●
●
●
●
● ●
●
●
●
●
●
●
●
●●
●
●
●
●
●
●
●
●
● ●
●
●
●●
●
●
●
●
●●●
●
●● ●
●
●
●
●
●
●
●
●
●
●
●
●
●
●
●
●
●
●
●
●
●
●
●
●
●
●
●
●
●
●●
●
●●
●
● ●
●
●
●
●
●
●
●
●
●
●●
●
●
●
●
●
●
●
●●
●
●
●
●●
● ●●
●
●
●
●
●
●
●●
●●
●
●
●
●
●
●
●
●
●
●
●
●
●
●●
●
●●
●
●
●
●
●
●
●
●
●
●
●
●
●●
●●
●
● ● ●●●
●●
●
●
●
●
●●
●
●
●
●●
●
●●
●● ●●
●
●
●
●
●
●
●
● ●
●
●
●
●
●
●
●
−0.5 0.0 0.5 1.0 1.5
0.0
0.5
1.0
1.5
2.0
Iteration 1
●
●
●
●
●
● ●
●●
●
●
●
●
●
●
●
●
●
● ●
●
●
●
●●
●●
●
●●
●
● ●
●
●
●
●
●
●
●
●
●●
● ●●
●
●
●
●●●
●
●
●
●
●
●
●
●
●
●
●
●
●●
●
●
●
●
● ●
●
●
●
●
●
●
●●
●
●
●
●●
●
●●
●
●
●
●●
●
●
●
●●
●
●
●
●
●
●
● ●
●
●
●
●
●
●
●
●
●●
●
●
●
● ●
●
●
●
●
●
●
●
●●
●
●
●
●
●
●
●
●
● ●
●
●
●●
●
●
●
●
●●●
●
●● ●
●
●
●
●
●
●
●
●
●
●
●
●
●
●
●
●
●
●
●
●
●
●
●
●
●
●
●
●
●
●●
●
●●
●
● ●
●
●
●
●
●
●
●
●
●
●●
●
●
●
●
●
●
●
●●
●
●
●
●●
● ●●
●
●
●
●
●
●
●●
●●
●
●
●
●
●
●
●
●
●
●
●
●
●
●●
●
●●
●
●
●
●
●
●
●
●
●
●
●
●
●●
●●
●
● ● ●●●
●●
●
●
●
●
●●
●
●
●
●●
●
●●
●● ●●
●
●
●
●
●
●
●
● ●
●
●
●
●
●
●
●
−0.5 0.0 0.5 1.0 1.5
0.0
0.5
1.0
1.5
2.0
Iteration 2
●
●
●
●
●
●
●
●●
●
●
●
●
●
●
●
●
●
● ●
●
●
●
●●
●●
●
●●
●
● ●
●
●
●
●
●
●
●
●
●●
● ●●
●
●
●
●●●
●
●
●
●
●
●
●
●
●
●
●
●
●●
●
●
●
●
● ●
●
●
●
●
●
●
●●
●
●
●
●●
●
●●
●
●
●
●●
●
●
●
●●
●
●
●
●
●
●
● ●
●
●
●
●
●
●
●
●
●●
●
●
●
● ●
●
●
●
●
●
●
●
●●
●
●
●
●
●
●
●
●
● ●
●
●
●●
●
●
●
●
●●●
●
●● ●
●
●
●
●
●
●
●
●
●
●
●
●
●
●
●
●
●
●
●
●
●
●
●
●
●
●
●
●
●
●●
●
●●
●
● ●
●
●
●
●
●
●
●
●
●
●●
●
●
●
●
●
●
●
●●
●
●
●
●●
● ●●
●
●
●
●
●
●
●●
●●
●
●
●
●
●
●
●
●
●
●
●
●
●
●●
●
●●
●
●
●
●
●
●
●
●
●
●
●
●
●●
●●
●
● ● ●●●
●●
●
●
●
●
●●
●
●
●
●●
●
●●
●● ●●
●
●
●
●
●
●
●
● ●
●
●
●
●
●
●
●
−0.5 0.0 0.5 1.0 1.5
0.0
0.5
1.0
1.5
2.0
Iteration 3
● ●
●
● ●
●
●
●●
●
●
●
●
●
●
●
●
●
● ●
●
●
●
●●
●●
●
●●
●
● ●
●
●
●
●
●
●
●
●
●●
● ●●
●
●
●
●●●
●
●
●
●
●
●
●
●
●
●
●
●
●●
●
●
●
●
● ●
●
●
●
●
●
●
●●
●
●
●
●●
●
●●
●
●
●
●●
●
●
●
●●
●
●
●
●
●
●
● ●
●
●
●
●
●
●
●
●
●●
●
●
●
● ●
●
●
●
●
●
●
●
●●
●
●
●
●
●
●
●
●
● ●
●
●
●●
●
●
●
●
●●●
●
●● ●
●
●
●
●
●
●
●
●
●
●
●
●
●
●
●
●
●
●
●
●
●
●
●
●
●
●
●
●
●
●●
●
●●
●
● ●
●
●
●
●
●
●
●
●
●
●●
●
●
●
●
●
●
●
●●
●
●
●
●●
● ●●
●
●
●
●
●
●
●●
●●
●
●
●
●
●
●
●
●
●
●
●
●
●
●●
●
●●
●
●
●
●
●
●
●
●
●
●
●
●
●●
●●
●
● ● ●●●
●●
●
●
●
●
●●
●
●
●
●●
●
●●
●● ●●
●
●
●
●
●
●
●
● ●
●
●
●
●
●
●
●
−0.5 0.0 0.5 1.0 1.5
0.0
0.5
1.0
1.5
2.0
Iteration 6
● ●
●
● ●
●
Note: only 3 points had different labels under K-means18
Properties of K-medoids
The K-medoids algorithm shares the properties of K-means thatwe discussed (each iteration decreases the criterion; the algorithmalways converges; different starts gives different final answers; itdoes not achieve the global minimum)
K-medoids generally returns a higher value of
K∑k=1
∑C(i)=k
‖Xi − ck‖22
than does K-means (why?). Also, K-medoids is computationallyharder than K-means (because of step 2: computing the medoid isharder than computing the average)
Remember, K-medoids has the (potentially important) propertythat the centers are located among the data points themselves
19
K-means and K-medoids in R
The K-means algorithm is part of the base distribution in R, givenby the kmeans function (use algorithm="Lloyd")
E.g.,
km = kmeans(x, centers=k, nstart=10, algorithm="Lloyd")
The K-medoids algorithm is implemented by the function pam
(stands “for partitioning around medoids”) in the package cluster
20

Recap: clustering
In clustering we divide up our data points into groups or clusters.We want points in any one group to be more similar to each otherthan to other points. All based on pairwise dissimilarities dij
Fixing the number of clusters K, the task of exactly minimizingthe within-cluster variation (equivalently, within-cluster scatter) isnot feasible. The K-means algorithm approximately minimizes thisby iterating two simple steps
Though it always converges, the answer given by K-means dependson the initial centers. It also returns centers that are averages ofdata points. The K-medoids algorithm is an alternative where thecenters are chosen among the points themselves. Its answer alsodepends on the starting configuration. Hence for either algorithm,one should run it several times with different starts
21
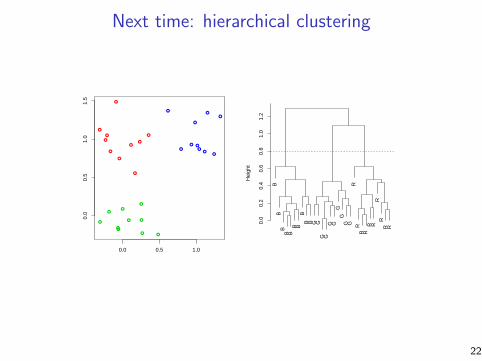
Next time: hierarchical clustering
●
●
●
●●●
●
●
●
●
●
●●
●
●
●●
●
●
●
●
●
●
●
●
●
●
●
●
●
0.0 0.5 1.0
0.0
0.5
1.0
1.5
BB
BB B
B BB
B B G GG G
G GG
GG G
RR
R RR R
RR
R R
0.0
0.2
0.4
0.6
0.8
1.0
1.2
Hei
ght
22