an empirical analysis of market segmentation on u.s ... · an empirical analysis of market...
TRANSCRIPT
An Empirical Analysis of Market Segmentation on U.S.
Equities Markets
Frank Hatheway The NASDAQ OMX Group, Inc.
Amy Kwan
The University of New South Wales - School of Banking and Finance & Capital Markets Cooperative Research Center
Hui Zheng*
The University of Sydney - Business School & Capital Markets Cooperative Research Center
Current Version: June 5, 2013
Abstract This paper examines the impact of trading on markets partially exempt from National Market System requirements on equity market quality. Lit and dark trading venues differ in their regulatory structure most notably in whether they must provide fair-access and pre-trade transparency and restrict sub-penny trading increments. We find evidence consistent with the notion that dark venues rely on their special features to segregate order flow based on asymmetric information risk, which results in their transactions being less informed and contributing less to price discovery on the consolidated market. We show that the effects of order segmentation by dark venues are damaging to overall market quality except for the execution of large transactions.
Keywords: Market Segmentation; Security Market Regulation; Market Efficiency
* Corresponding author. Tel: +61 (2) 9351 3915; Fax: +61 (2) 9351 6461; Email: [email protected] We thank Tarun Chordia, Robert Faff, Douglas Foster, Tom Smith, Peter Swan, Terry Walter, and seminar participants at Australian National University, Florida International University, The University of New South Wales, The University of Technology, Sydney, Australian Securities and Investments Commission and U.S. Securities and Exchange Commission for helpful comments. We thank NASDAQ OMX for providing the data for this research. The data employed in this research are equivalent to the TAQ data publicly available through databases such as WRDS. The views expressed herein are not intended to represent the views of NASDAQ OMX, its employees, or directors. The authors are solely responsible for the content, which is provided for informational and educational purposes only. Nothing contained herein should be construed as investment advice, either on behalf of a particular security or an overall investment strategy.

1
Introduction
Balancing the consolidation of trading interest with competition between marketplaces is a
central concern of U.S. equity market design and regulatory focus (Colby and Sirri, 2010). Today
in the US equities markets, investors can trade on approximately 300 different venues, including
thirteen registered exchanges, forty or so active alternative trading systems (ATSs) and
numerous broker-dealer platforms. This proliferation of trading venues encourages a diversity of
different market structures and trading mechanisms designed to appeal to the specific trading
needs of different segments of market participants. The recent rapid growth of trading activity on
venues partially outside the requirements of the National Market System (NMS) in the U.S. and
Markets in Financial Instruments Directive (MiFID) in Europe invites an examination of the
effects of this trend on order execution quality and public price discovery.1
In the U.S. market centers may be characterized based on whether they are full participants in
the NMS.
2 There are three main differentiating features between the fully participating markets,
which we refer to as lit markets, and those partially exempt from the NMS requirements, which
we refer to as dark venues. Firstly, compared with lit markets, dark venues are currently not
subject to NMS fair access requirements and thus can prohibit or limit access to their services
(see Reg ATS Rule 301(b)(5)). Second, dark venues provide limited or no pre-trade transparency
in that their best priced bids and offers are not required for inclusion in the publicly distributed
consolidated quotation data.3
1 See, SEC Concept Release 2010, p. 66; European Commission Consultation on the Review of the Markets in Financial Instruments Directive (2010), p.11.
Finally, executions by dark venues occur at finer price increments
than lit markets. Since dark venues are currently not required to disclose their market structures
2 In 1975, the US Congress directed the SEC to create the National Market System in order to link together multiple individual markets trading the same securities. 3 Reg NMS Rule 301 (b) (3) only requires an ATS to display quotations on the consolidated tapes when its trading volume exceeds 5% of national consolidated volume. Some dark pools may display an indication of interest (IOI), i.e. volume at the best quotes to selected clients without prices attached. Electronic Communication Networks (ECNs) are registered ATSs but in comparison to dark venues, ECNs provide their best priced quotations to the consolidated tapes. After DirectEdge and BATS, two major ECNs became registered exchanges in 2008 and 2010 respectively, the contribution of ECN volume to consolidated volume is minimal. All trades executed by exchanges, ATSs and broker systems are reported to the consolidated trade systems.
2
to the public (see Reg ATS Rule 301(b)(6), SEC Rule 3a1-1, and SEC Concept Release 2010),
few details are known about how specific dark venues operate.4
This paper explores how lit and dark market structures affect the trading choices of investors
and the resulting impact of order fragmentation on market quality.
5 We find evidence suggesting
that dark venues rely on their unique features to attract uninformed order flow.6 Under the
current regulatory environment, the exemption from the fair access requirement provides a
necessary condition for dark venues to segment order flow, and, without the requirement to
display firm quotations, dark venues can further implement this order segmentation through price
discrimination in the form of selectively improving the price shown on lit markets. Consistent
with this analysis, our results show that dark venues successfully segment the market and attract
uninformed order flow from the lit markets by offering sub-penny price improvement, leaving
liquidity providers worse off on lit markets and consequently harming overall market quality.7
The negative impact of dark venues is closely related to their ability to “cream-skim” the lit
markets and attract uninformed order flow. It is widely recognized that liquidity providers offset
their losses from trading against informed traders with gains from the uninformed.
8
4 Appendix 2 provides some details of the current structure and regulations of the US equities markets.
When
informed and uninformed order flow is segmented, there is little incentive for liquidity providers
to trade on the informed market (Admati and Pfleiderer, 1988). We find that fewer uninformed
investors trading on lit markets is associated with significantly lower returns for liquidity
provision on lit markets and higher transaction costs on both lit and dark markets. In particular,
we document that the adverse selection risk on dark venues is 60% – 80% less than that on lit
markets, while the average realized spreads for liquidity providers on lit markets are only 40% of
those on dark venues.
5 For an incomplete list of previous research on market fragmentation and competition, see Mendelson (1987), Pagano (1988a), Glosten (1994), Stoll (2001), Huang (2002), Barclay, Hendershott and McCormick (2003), Buti, Rindi and Werner (2010b), Degryse, de Jong and Van Kervel (2011), Gresse (2011), O’Hara and Ye (2011), Weaver (2011) and Comerton-Forde and Putnins (2012). 6 By the ‘Sub-penny’ rule of Reg NMS, the current minimum tick size for stocks priced at or over $1.00 is $0.01. However, we find that a significant number of transactions on dark venues are executed at sub-penny prices. Similar results are found by Nimalendran and Ray (2011) and Delassus and Tyc (2010). 7 Previous research also recognizes that discretionary liquidity traders are sensitive to transaction costs (Admati and Pfleiderer, 1988; Benveniste et al., 1992). 8 See Gammill (1985); Glosten and Milgrom (1985); Kyle (1985); Easley and O’Hara (1987); Glosten (1994) and Easley, Kiefer and O’Hara (1997).

3
The cream-skimming effect has been documented previously for regional exchanges in their
competition with the primary markets (Easley, Kiefer and O’Hara, 1996; Bessembinder and
Kaufman, 1997).9
Interestingly not all forms of dark trading are harmful. After controlling for dark market
share, we find that the execution of large trades on dark venues reduces the detrimental effect of
dark trading. This result is consistent with previous studies on upstairs markets (Seppi,1990;
Madhavan and Cheng, 1997). The way dark venues operate shares some similarity with the
traditional upstairs markets as both types of markets are featured with limited pre-trade
transparency, uncertainty surrounding trade execution and customer screening based on
information (Seppi, 1990; Madhavan and Cheng, 1997; Smith, Turnbull and While, 2001; Booth
et al., 2002). However, a significant difference between these two types of markets is that, the
traditional upstairs markets mainly execute block trades while the average trade size on dark
venues in our sample is only 256 shares. Our finding on the impact of dark block trades supports
the conclusions of Bessembinder and Venkataraman (2004) that the upstairs markets supplement
the downstairs markets by providing a better execution facility for large orders.
Madhavan (1995) models the pricing behaviour of markets with
heterogeneous information and shows that information fragmentation leads to higher volatility,
wider spreads and less efficient mid-quote prices. More recently, Bolton, Santos and Scheinkman
(2011) directly model the impact of informed dealers cream-skimming the transparent markets
and predict that in equilibrium cream-skimming will undermine the transparent exchanges and
result in market inefficiencies. Our results are consistent with these predictions. After controlling
for the overall level of information asymmetry in the market, we find that a 10% rise in dark
market share will lead to an increase of 4.5% in effective spreads market wide.
When assessing the relationship between dark fragmentation and market quality, it is
important to recognize the impact of adverse selection risk on trading behavior. Adverse
selection risk is one of the primary motivating factors for fragmentation. Previous studies
9 Previous literature has also identified another type of cream-skimming activity, i.e. order preferencing. For example, Chung, Chuwonganant and McCormick (2004) find that less informed orders are more likely to be preferenced and this order preferencing increases transaction costs. Since market markers use quotations to compete for liquidity (Bessembinder, 2003), the practice of order preferencing creates disincentives for posting competitive quotes (Huang and Stoll, 1996). In our study, price improvement offered by dark venues serve as a partial payment to brokers for routing uninformed liquidity to these markets and our findings are consistent with the conclusions of Chung, Chuwonganant and McCormick (2004).

4
demonstrate that the trading of diversely informed traders discourages discretionary uninformed
traders (Admati and Pfleiderer, 1988; Foster and Viswanathan, 1990; Wang, 1994). The arrival
of new information generates more informed trading on the market, temporarily increasing stock
price volatility and transaction costs. Intuitively, investors and traders who do not possess this
new information or only trade for liquidity reasons will strategically avoid trading in such
periods. Because there is a higher concentration of uninformed traders on dark venues relative to
lit markets, the proportion of trades executed on the dark venues decreases with the level of
adverse selection risk. Thus, the negative relationship between dark trading and transaction costs
reported in earlier studies (e.g. O’Hara and Ye, 2011) may be due to shifts in the overall adverse
selection risk of the underlying securities. We show that after controlling for overall adverse
selection risk, the relationship between dark trading and transaction costs becomes positive.
Our findings on price efficiency contradict the predictions of some recent theoretical models,
which tend to focus on the impact of dark trading on transparent markets rather than the
interaction between the two (e.g., Ye, 2009; Zhu, 2011). In addition, market microstructure
theory also suggests that informed traders correlate their trading activities with those of the
uninformed, and hence the speed of private information revelation may not change when more
informed traders trade on the lit markets. (Kyle, 1984, 1985; Admati and Pfleiderer, 1988).10
10 Kyle (1984) and Admati and Pfleiderer (1988) further show that under a heterogeneous information environment prices informativeness increases with liquidity trading, which is consistent with our results that prices are less efficient when uninformed orders leave the lit markets.
The
current lack of time-priority across market centers further discourages lit liquidity providers from
bearing the costs of price discovery. On the other hand, our results support the liquidity
externality hypothesis which predicts that “… pooling orders will provide informationally more
efficient prices than decentralized trading across fragmented markets” (Madhavan, 2000, p. 226).
For example, Madhavan (2011, p. 2) argues that transitory volatility increases with market
fragmentation because “fragmented trading can thin out order books in any given venue, making
prices more susceptible to the effects of order imbalances …”. Pagano (1989b) demonstrates that
this increase in transitory volatility will further discourage risk averse investors from entering the
market, leaving the market more susceptible to imbalances. Hendershott and Jones (2005)
present empirical evidence consistent with this liquidity externality hypothesis. They find that
there is a reduction in price efficiency after Island ECN stops displaying its limit order book and

5
liquidity migrates. Finally, our results support the predictions of Madhavan (1995) who shows
that prices under a fragmented environment are less efficient than in consolidated markets.
Another counterpoint to our study is that as a general result, separating equilibria, such as
segmentation of investor types, can be welfare improving in the presence of adverse selection
which is arguably the case in the current equity markets. One argument for segmentation is that
investors are better off not having to trade with proprietary traders on exchanges. A complicating
factor is that dark venues use the price set by lit markets as their benchmark. Therefore, our
investigation effectively tests whether the benefits to investors trading on dark venues offset the
negative effects on the benchmark price due to segmentation. Consistent with the predictions by
Bolton, Santos and Scheinkman (2011), our results demonstrate that the benefits of segmentation
are not welfare improving with the possible exception of the smallest stocks in our sample for
which our results are ambiguous.
Our study has important policy implications for the regulation of equity markets. By creating
an environment which has come to emphasize information based segmentation of order flow the
U.S. equity markets are increasingly characterized by intense competition within the distinct
informational classes of order flow. But, there is little effective competition between lit markets
and dark venues for low information content order flow.11 Consequently, the benchmark prices
set for all classes of order flow represent the characteristics of just one class, the informed trader
on lit markets. When only informed traders remain, the market may eventually collapse (Glosten
and Milgrom, 1985, p. 7).12
The balance of the paper is organized as follows. Section 1 describes the selection process of
our sample data. Sections 2 presents our empirical findings and analyses, and Section 3 conducts
some robustness tests. We conclude in Section 4.
We conclude that behaviors which are rational from the perspective
of an individual actor can be in aggregate harmful to the quality of equity markets.
11 Some evidence suggests that such competition exists among transparent markets. For example, Barclay, Hendershott and McCormick (2003) find that NASDAQ dealers are able to retain uninformed order flow in their competition with ECNs. 12 Major financial market centers are concerned with the damaging effect of dark venues on lit markets. See Response to “Call for Evidence on the Impact of MiFID on Secondary Markets Functioning (CSR/08-872)”, London Stock Exchange, January 9, 2009.

6
1. Data and Sample Selection
The data used in the analysis consists of trade and quote data for the period January 3, 2011
to March 31, 2011. Trade and quote data are time stamped to the millisecond. The initial sample
consists of the 120 stocks stratified by market capitalization as examined in Brogaard (2011).13
This dataset overcomes some data limitations in previous research. For example, O’Hara and
Ye (2011) measure market quality based on Rule 605 data which do not include all transactions
executed on lit and dark markets.
Market capitalization values of the sample stocks on January 3, 2011 are sourced from Thomson
Reuters DataScope database. Three of the 120 stocks were delisted before the sample period
(BARE, CHTT and KTII), and another stock is delisted during the sample period (BW). We
delete the four stocks from the sample, leaving a final sample of 116 stocks. Of these stocks, 59
are listed on NYSE and 57 are NASDAQ listed. Appendix 1 contains the list of stocks and their
market capitalization.
14 Furthermore, their sample of exchange trading activity
includes only marketable limit orders of 9,999 shares or fewer while their measure of off-
exchange activity includes all transactions. Finally, as also suggested by Weaver (2011), the TRF
volumes reported in their study are an over-estimation of dark volumes because a significant
portion of their TRF trades originated from two ECNs, namely BATS and DirectEdge, which are
lit market centers under the definition in our study.15 Our dataset is free from these issues and
hence our results are less likely to be affected by confounding lit and dark market centers in the
sample.16
13 See Brogaard (2011) for a full description of the sample selection process.
14 O’Hara and Ye (2011, p. 464, footnote 16) list the types of orders included in Rule 605 data. To further investigate the coverage of Rule 605 data, we calculate the total trading volume in Apple Ltd. (AAPL) on NASDAQ for March 2011, and compare it against the reported volume from NASDAQ based on Rule 605 for the same month. The total trading volume for AAPL on NASDAQ is 124,437,001 shares, while the number of covered shares reported based on Rule 605 is only 53,789,273, which represents 43% of the share volume executed. 15 BATS and DirectEdge gained regulatory approval for exchange status on August 18 2008 and March 12 2010, respectively. The inclusion of BATS and Direct Edge volume in O'Hara and Ye(2011) does not appear to be responsible for the differences in our results. 16 Another difference between our data and the Rule 605 reports is that our data contain only the trade report time, and we do not observe the market conditions prevailing at the time orders are received. As a result we are unable to
7
The data are further cleaned as follows. First, quotes that are likely to reflect errors are
filtered from the sample. Specifically, we delete quotes where the ask price or bid price is
missing or equal to zero, crossed quotes and quotes with a bid ask spread greater than $2.00.
Second, only records flagged as regular trades occurring between 09:30:30 and 16:00:00 are
included.17 The 30 second delay from the opening time of 09:30 is to ensure that our sample is
not contaminated by the opening call auction. Third, we winsorize the price of trades that occur
outside the prevailing best bid and ask prices as these records are likely to result from delays in
the trade reporting process. More specifically, the trade price is set to the prevailing ask (bid)
price for trades that occur at prices greater (less) than the ask (bid) price.18 Trades are then
classified into buyer or seller initiated transactions following Lee and Ready (1991). It has been
documented that trades may be reported with a delay from the actual execution time (Hasbrouck,
Sofianos and Sosebee, 1993). In our study we apply a 40 millisecond lag to the time of dark
trades before matching them with the NBBO and make no adjustment if the trades are from lit
venues.19
Table 1 reports the descriptive statistics for our sample of 116 stocks. We measure market
capitalization on January 3, 2011 and form three sub-samples based on stock size. Panel A
reports the summary statistics for the full sample and Panels B – D report the statistics for the
market capitalization sub-samples. We measure all remaining variables on a daily basis before
taking a simple average across all trading days for each stock.
The average market capitalization for our sample stocks is $20.72 billion, and the mean
quoted spread and stock price are 3.8¢ and $46.44 respectively. For the small, medium and large
sub-samples, the average market capitalizations are $0.57, $2.79 and $59.80 billion, respectively.
For both lit and dark markets, as market capitalization decreases from Panel B to D, the daily assess the execution speed of orders. However, the importance of order execution speed has diminished significantly in the past few years when most market centers adopted electronic order processing systems. 17 For example, we exclude VWAP trades because they do not reflect the trader’s trading preferences at the time of the transaction. In our sample, regular trades account for 99.83% of total transactions during normal trading hours. 18 There are a total of 4,787,185 trades that occur outside the quote, which represents 3.85% in our sample. Of these transactions, 62.53% (2,993,588) are from lit venues and 37.47% (1,793,597) are from dark venues. 19 Using transactions from the 116 stocks on 10 randomly selected days, we test trade and quote matching accuracies at various time lags for lit and dark trades. Details are provided in Appendix 3. Although we believe these adjustments on trade reporting delays will result in a more accurate matching between trades and quotes, our final results are invariant to these adjustments. Results based on the raw data (i.e. including VWAP trades and without adjustments for quote delay and prices outside the NBBO) are available from the authors.
8
average price, trading volume and number of trades decrease monotonically while the quoted
spread increases. This is consistent with large stocks being more liquid. The average trade size is
larger for large stocks; the average trade size for these is 195.8 shares, while it is 131.2 shares
and 134.4 shares for the medium and small cap stocks, respectively.
Comparing between lit and dark markets, the daily trading volume and the number of trades
are significantly greater for lit markets. The average dark market share based on trading volume
is 26.19%. This is consistent with Weaver (2011), who reports TRF volumes of 24.9% and
32.8% for NYSE- and NASDAQ-listed stocks respectively. Thus, while lit markets remain the
main trading center in U.S. equities, we observe significant market fragmentation by dark
venues. The average trade size is larger on dark venues than lit markets, which is persistent
across all subsamples.
2. Empirical Analysis
In this section we analyze the effects of dark fragmentation on market quality. In Section 2.1
we compare transaction costs between lit and dark markets. In Section 2.2 we investigate sub-
penny pricing and discuss the findings in the context of the current regulatory environment.
Section 2.3 assesses the information contribution by each market based on Hasbrouck (1995)
information shares. Finally, the impact of dark trading on transaction costs and price efficiency is
examined in Section 2.4 and 2.5, respectively.
2.1 Trading on Dark and Lit Venues
Transaction costs, measured in terms of bid-ask spreads, are important indicators of market
quality (Bessembinder and Venkataraman, 2010). To compare market quality between lit and
dark venues, we follow Hendershott, Jones and Menkveld (2011) and calculate the effective
spread, adverse selection costs and realized spread for each transaction as:
(1)
(2)

9
𝐸𝑓𝑓𝑒𝑐𝑡𝑖𝑣𝑒 𝑠𝑝𝑟𝑒𝑎𝑑𝑡 = 𝑞𝑡�𝑝𝑡 − 𝑚𝑡�
𝑚𝑡
𝐴𝑑𝑣𝑒𝑟𝑠𝑒 𝑠𝑒𝑙𝑒𝑐𝑡𝑖𝑜𝑛𝑡 = 𝑞𝑡(𝑚𝑡+30 − 𝑚𝑡)
𝑚𝑡
𝑅𝑒𝑎𝑙𝑖𝑧𝑒𝑑 𝑠𝑝𝑟𝑒𝑎𝑑𝑡 = 𝑞𝑡(𝑝𝑡 − 𝑚𝑡+30)
𝑚𝑡 +
𝑟𝑒𝑏𝑎𝑡𝑒𝑚𝑡
where 𝑚𝑡 is the bid ask midpoint at the time when the current trade takes place, 𝑚𝑡+30 is the bid
ask midpoint 30 seconds after the trade, and 𝑝𝑡 is the trade price.20 𝑞𝑡 is a buy sell indicator,
which equals to 1 (-1) if the trade is buyer- (seller-) initiated. The effective spread measures the
total transaction costs paid by liquidity demanders, which can be decomposed into the premium
demanded for the risk of adverse selection (i.e. adverse selection costs) and the return demanded
by liquidity providers for supplying the liquidity (i.e. realized spreads). The realized spreads are
also adjusted for potential rebates offered or costs charged by market centers for liquidity
provision. Detailed procedure of this adjustment is provided in Appendix 5.21
The comparison between lit and dark markets on these transaction cost measures is further
complicated by the following factors. First, our summary statistics show substantial cross-
sectional variation between market capitalization sub-samples, which may affect transaction cost
comparisons (Easley, O’Hara and Paperman, 1996). Thus, we present results for both the full
sample and the market capitalization sub-samples. Second, the level of transaction costs
prevailing in the market may affect the order submission strategies of traders. For example, Buti,
Rindi and Werner (2011) document that more orders will be directed towards dark venues when
bid-ask spreads are wide. Thus, transaction costs observed from dark trades may be biased by ex-
20 Transaction costs vary depending on the time horizon over which spreads are calculated. For example, a temporary shortage in liquidity supply may increase the short-term return for liquidity providers but is unlikely to have a permanent impact over a longer time period. For this reason, we evaluate realized spread and adverse selection costs over both 30 seconds and 5 minutes to ensure that our results are robust to different time horizons. The results are reported in Appendix 4. 21 Where several levels of rebate are offered, we assume the majority of traders meet the criteria to receive the maximum rebate and thus, we apply the maximum rebate level to all lit transactions. This choice also creates a bias against us in finding higher realized spreads on dark venues. Results for the comparison of rebate-adjusted effective spreads are reported in Appendix 6.
(3)

10
ante market conditions. 22
[Insert Table 2]
To control for market conditions, we sort all transactions for a stock
into terciles based on the quoted spread at the time of trade, and compare transaction costs within
each of these terciles separately.
Table 2 compares daily value-weighted average effective spreads, adverse selection costs and
realized spreads between lit and dark markets.23
For the full sample, traders pay a mean effective spread (across all quoted spreads) of 3.80
bps for taking liquidity off lit markets, while for dark venues it is 3.60 bps. For small and
medium quoted spreads, effective spreads are significantly smaller on dark venues. The
relationship reverses for situations where the quoted spread is large.
Panel A presents the full sample results and
Panels B – D report the results for the market capitalization sub-samples. The results are largely
consistent across all panels.
24
22 Our robustness tests (not reported) suggest that spurious conclusions can be reached if the ex-ante market conditions are not controlled for.
The stock size tercile
results for the difference in effective spreads between lit and dark markets shows a statistically
significant change in sign for large quoted spreads relative to small and medium quoted spreads
is driven by the results for large stocks demonstrating the importance of controlling for the state
of the quoted spread. One reason for lower effective spreads on lit markets than on dark venues
when the quoted spreads are wide is that lit markets are more capable of offering price
improvement when quoted spreads are wide. We investigate this further in the next section.
Effective spreads increase monotonically with quoted spreads indicating that traders pay more
when liquidity is scarce on the market.
23 We test for differences in mean spreads using a t-test. To account for skewness in the data, we also compare differences in median spreads between lit and dark markets using Wilcoxon rank tests and report the results in Appendix 6. 24 The actual costs of trading on lit markets also include market access fees, which are fixed costs for market participants and generally include membership fees, market participant ID (MPID) fees, data fees, co-location fees for co-location services, etc. Since our data do not contain broker information, it is difficult to determine the precise level of such costs. Dark venues may also charge fixed market access fees, which are not publicly disclosed. However, it is commonly believed that the market access fees for dark venues are lower than those for lit markets.

11
Conditional on quoted spreads, liquidity providers on average incur a cost of 3.24 to 3.83 bps
for bearing the adverse selection risk (i.e. Adverse Selection) if they trade on lit markets, but only
0.64 to 1.30 bps for such risk dark venues. Liquidity providers on lit markets receive a mean
spread of -0.06 to 2.40 bps (i.e. Realized Spreads), depending on the size of the quoted spread at
the time they trade. On the other hand, liquidity providers on dark venues receive a mean spread
of 1.18 to 4.12 bps. The differences in adverse selection cost and realized spread between lit and
dark markets are both statistically significant across all quoted spreads.
These results are consistent with the cream-skimming hypothesis of Bolton, Santos and
Scheinkman (2011). Specifically, dark venues cream-skim the uninformed order flow from lit
markets, which is associated with higher total transaction costs on lit markets. Realized spreads
on lit markets are significantly lower than dark venues. Furthermore, adverse selection costs are
greater than realized spreads for lit markets while the opposite holds for dark venues. Since
effective spreads are the sum of realized spread and adverse selection cost, this result indicates
that a significant portion of the total transaction costs on lit markets is to pay for the adverse
selection risk. We further calculate the adverse selection costs as a percentage of the effective
spread. Adverse selection costs are on average 73% – 144% of the effective spread on lit
markets, while the ratio is only 24 – 35% for dark venues.
While liquidity providers charge more on lit markets, a large proportion of this spread is used
to recoup losses from trading against informed traders and only a small proportion is received as
compensation for liquidity provision. This is in direct contrast to the higher liquidity premium
and lower adverse selection costs they incur if trading on the dark venues. In the long-run, the
lack of reward and higher risks faced by liquidity providers on lit markets is likely to discourage
them from trading on these markets. We conjecture that the segmentation of informed and
uninformed order flow may be lead to a decrease in overall market quality and test this
hypothesis in Section 2.4 and Section 2.5. In the next section, we explore how current market
structures enable dark venues to cream-skim uninformed order flow from lit markets.
2.2 The Practice of Cream-skimming
12
In this section, we analyze how cream-skimming activity is engaged in by dark venues.
Previous research has presented evidence supporting the hypothesis of cream-skimming by
competing exchanges (Easley, Kiefer and O’Hara, 1996; Chordia and Subrahmanyam, 1995;
Lin, Sanger, and Booth, 1995) and by dealers on the upstairs markets (Madhavan and Cheng,
1997). In the following analysis, we provide evidence on the use of sub-penny price
improvement by dark venues to attract order flow and end with a discussion on current market
regulations that allow dark venues to screen customers based on their information and thus,
cream-skim the order flow.
2.2.1 Sub-penning Pricing and Price Improvement
The ‘sub-penny’ rule of Reg NMS creates a minimum tick size of 1 cent for all stocks in our
sample.25
We calculate price improvement by comparing the trade price to the NBBO price. A buy
(sell) trade receives price improvement if the trade price is smaller (greater) than the NBBO ask
(bid) price. A total of 13 price improvement levels are classified, ranging from trades that receive
no price improvement (Level 1) to trades that receive more than 1 cent of price improvement
(Level 13). The upper and lower bounds for each price improvement level are outlined in Table
3. For each stock, the frequency of transactions falling into each level is calculated for the lit and
dark markets on each day before averaging across all trading days. Table 3 reports the cross-
sectional means and medians of the frequencies for each price improvement level.
However, we observe a significant number of transactions taking place at sub-penny
price increments on dark venues. One benefit of sub-penny pricing is that dark venues can attract
liquidity by offering price improvements.
[Insert Table 3 Here]
25 Reg NMS Rule 612 specifies that “No national securities exchange, national securities association, alternative trading system, vendor, or broker or dealer shall display, rank, or accept from any person a bid or offer, an order, or an indication of interest in any NMS stock priced in an increment smaller than $0.01 if that bid or offer, order, or indication of interest is priced equal to or greater than $1.00 per share”.
13
Panel A in Table 3 presents the results for the full sample of stocks. Over 80% of transactions
on the lit markets are executed at the NBBO and do not receive price improvement. In contrast,
about 50% of dark trades receive some level of price improvement. Although most of it is less
than 1 cent, these results provide strong evidence that dark venues provide price improvement
more frequently than lit markets.
A closer examination reveals differences in how lit and dark markets provide price
improvement. First, more than 20% of transactions on dark venues receive sub-penny price
improvement after excluding trades with a price increment of 0.5 cents (Level 7). In contrast, no
transactions take place at the sub-penny levels on lit markets. Second, the difference between lit
and dark markets for price improvement over a penny (Level 13) is less apparent. We find that
14.73% of lit transactions receive price improvement of at least 1 cent, which is only slightly
below the 16.64% on dark venues. 26
Panels B – D report the price improvement frequencies for the market capitalization
subsamples. For the lit markets, the frequency of trades receiving price improvement is
negatively related to stock sizes, while the percentage of trades receiving price improvement on
dark venues remains relatively constant across stocks of different sizes. The difference between
the percentage of trades receiving price improvement in lit and dark markets decreases with
stock size. Since spreads are more likely to be wider for small stocks, these results are consistent
with our findings in Panel A and suggest that sub-penny pricing is less valuable to dark venues
when spreads are wide.
Given that price improvement of at least 1 cent can only
occur when the bid-ask spread is greater than 1 cent, our results suggest that lit venues are better
positioned to compete with dark venues when minimum tick sizes are not a constraining factor
on spreads.
27
26 When price improvement is below 1 cent, a small portion of lit transactions (1.66%) receive price improvement of 0.5 cent through mid-point peg orders. Limit orders submitted to the lit markets can peg to the midpoint of the spread as a hidden order. See, SEC Release No. 34-57537, File No. SR-NASDAQ-2008-021. 27 Acting as broker-dealers, dark venues can accept orders with terms that allow them to derive an explicit price at sub-penny increments. However, the broker-dealer cannot accept an order that is explicitly priced at a sub-penny increment. See “Responses to Frequently Asked Questions Concerning Rule 612 (Minimum Pricing Increment) of Regulation NMS”, available at: http://www.sec.gov/divisions/marketreg/subpenny612faq.htm.

14
2.2.2 Regulation on Fair Access
The results in Table 3 suggest that compared with lit markets dark venues offer a price
advantage to liquidity takers through the widespread use of sub-penny pricing. Hence all
liquidity demanders are attracted naturally to the lower explicit transaction costs in dark venues.
However, it is possible that not all can trade on dark venues, because under the current regulatory
environment dark venues are not subject to the fair access rule and thus can prohibit or limit
access to their services (see Reg ATS Rule 301(b)(5); SEC Concept Release 2010). Our results
in the previous section show that the adverse selection risk is significantly lower on dark venues,
suggesting that dark venues preferentially screen for less informed orders. Taken together, our
findings support the notion that dark venues attract specifically uninformed order flow from lit
markets by bettering the displayed prices on lit markets through sub-penny price improvement.
This order segmentation activity has been documented for retail market makers, who attract
uninformed orders through payment for order flow agreements with retail brokers (Easley,
Kiefer and O’Hara, 1996; Bessembinder and Kaufman, 1997; Chung, Chuwonganant, and
McCormick, 2004). In Seppi’s (1990) model, upstairs brokers offer superior pricing because they
can screen block traders based on their information. Likewise, the evidence we document on
dark venues is essentially a variation of these practices; price improvement is analogous to
payments for order flow and the ability to identify the uninformed is similar to the screening
mechanisms modeled by Seppi (1990).28
Overall, our results suggest that by offering sub-penny price improvement dark venues attract
uninformed order flow to the adverse selection risk on their markets. Liquidity providers on dark
markets are able to offer discounts to uninformed orders while still receiving a large reward for
their provision of liquidity although payment for order flow and other inducements may reduce
the amount of this reward. The effect is a segmentation of uninformed and informed order flow.
In the next section, we discuss how pre-trade opacity and unequal access on dark venues further
contribute to this segmentation and the associated impact on price discovery.
28 Battalio, Hatch and Jennings (2003) argue that the payment for order flow may partially flow through brokers to investors in the form of lower commissions and/or better services. Therefore, there are also incentives for investors to participate in the payment for order flow scheme.

15
2.3 Price discovery
The previous section describes how dark venues affect trader behavior by self-selecting
customers using sub-penny pricing. The segregation of order flow is further enhanced by the pre-
trade opacity feature on dark venues. As discussed before, under the current regulatory
environment dark venues are not required to disclose their best priced orders. As a result, traders
cannot observe whether liquidity is available on dark venues and there is no guarantee that their
orders will be executed, discouraging informed traders from trading on these markets at the risk
of exposing their private information. Furthermore, some dark venues monitor the price impact
of trader’s orders and may ban or restrict market moving traders seeking to trade on their venue.
We conjecture that dark venues free ride on the quotes provided by the lit markets and hence,
contribute less to the price discovery process.
To assess relative price contribution of lit and dark venues, we compare their price
information shares as suggested by Hasbrouck (1995).29 Hasbrouck (1995) models the price
discovery process based on the concept of cointegration in that prices for two similar assets will
not diverge apart for extended periods of time. In the current market context, the information
share measures the proportional contribution of a market to the variance of permanent
innovations in all markets. Hasbrouck (1995) raises concerns about infrequent trading in some
market centre which may result in problems of autocorrelation between observations. To address
this issue, information shares are estimated based on last sale prices at 10 second and 1 minute
intervals.30
For each stock the daily upper and lower bounds as well as the the midpoint between the
bounds of information share are estimated for lit and dark markets. These values are then
The associated VECM models are estimated over 10 lags.
29 As a robustness check we carry out the Gonzalo-Granger common factor analysis as suggested by Harris, et al. (2002), and the results are similar to those reported in this section and available upon requests. 30 Infrequent trading is likely to be most prevalent in small stocks. Small stocks in our sample have on average over 1,000 trades a day which correspond to approximately 2.56 trades per minute (refer to Table 1). Therefore, by sampling at different time frequencies we reduce the impact of infrequent trading.

16
averaged across trading days for each market. The cross-sectional averages are reported in Table
4.31
[Insert Table 4 Here]
Table 4 presents strong evidence that price discovery is provided primarily by lit markets.
Panel A reports the information share estimates based on 10-second time intervals. Over the
sample period, the average maximum information contribution by lit markets is 0.917 while the
average minimum information contribution is 0.692. For dark venues, the maximum (minimum)
information share is 0.308 (0.083) respectively. For the midpoint values, the contribution to
priced discovery of lit markets is 0.804 and 0.196 for dark venues. Dividing the sample by
market capitalization, information shares for the lit (dark) markets as measured by the midpoint
are 0.714 (0.286), 0.876 (0.124) and 0.820 (0.180) for large, medium and small stocks
respectively. These results indicate that price discovery mainly takes place on lit markets.
The information shares are re-estimated using 1 minute intervals to ensure that the results are
not driven by potential infrequent trading problems in our sample. The results reported in Panel
B are largely consistent with the results based on 10 second intervals. While the differences
between lit and dark information shares are smaller when evaluated using 1 minute intervals, the
results clearly show that lit markets contribute more to price discovery than dark venues.
The results in Sections 2.1 and 2.2 suggest that market fragmentation by dark venues affect
the mix of informed and uninformed order flow and discourages liquidity providers from trading
on lit markets, which can lead to an increase in transaction costs (the cream-skimming
hypothesis). The results in Table 4 further demonstrate that it is the lit markets that provide the
majority of price discovery, which can be adversely affected by the reduced liquidity on these
markets (the liquidity externality hypothesis). Therefore, it is conjectured that there is a negative
relationship between dark fragmentation and market quality. We further investigate this issue in
the next two sections.
31 Individual information share estimates per stock are presented in Appendix 8.

17
2.4 Impact of Dark Trading on Transaction Costs
In this section we conduct analyses on the relationship between dark fragmentation and
transaction costs. In particular we use the Heckman (1979) two-step procedure to produce
consistent estimates that account for the self-selection bias of investors towards lit or dark
venues. For example, Bessembinder (2003) documents a systematic bias in the orders routed to
the NYSE and attributes it to the cream-skimming activities by the competing markets. If
investors only submit orders that are difficult to execute to the dark venues, a positive correlation
between transaction costs and dark trading can be due to the nature of the orders rather than the
differences between markets themselves. O’Hara and Ye (2011) also adopt the Heckman
correction procedure to correct for this data censoring problem. Following O’Hara and Ye
(2011), we evaluate the following models:
Stage 1: 𝐷𝑎𝑟𝑘_𝑣𝑎𝑙𝑢𝑒_𝑟𝑎𝑡𝑖𝑜𝑖𝑡 = 𝜙(𝑍𝑖𝑡𝛾 + 𝜇𝑖𝑡)
Stage 2: 𝐸𝑓𝑓𝑠𝑝𝑟𝑒𝑎𝑑𝑖𝑡 = 𝐷𝑎𝑟𝑘_𝑣𝑎𝑙𝑢𝑒_𝑟𝑎𝑡𝑖𝑜𝑖𝑡𝛽1 + 𝑋𝑖𝑡𝛽2 + 𝜃�̂�𝑖𝑡 + 𝜀𝑖𝑡
where 𝜙(·) is the standard normal cumulative distribution function. Dark_value_ratio is
calculated as the dark trading value divided by the total value of trading across all markets on
day t. Eff_spread is the value weighted effective half spread for each stock on day t. �̂� is the
inverse Mills ratio, 𝜑(𝑍𝑖𝑡𝛾�)/𝜙(𝑍𝑖𝑡𝛾�), where 𝜑(·) is the standard normal probability density
function. Zit contains explanatory variables to explain dark market share and Xit contains
economic variables that affect transaction costs.
Proxy for dark market share
In our analysis, we use Dark_value_ratio, which measures dark trading as a proportion of
total trading, where trading is measured in terms of dollar value. This measure of dark market
share differs from that of O’Hara and Ye (2011), who base their measure of TRF market share on
the number of shares traded. Compared with trade volume, the dollar value of trading captures an
additional dimension of trade activity, i.e. trade price. Since there is a significant variation in
(15)
(16)
18
prices for our sample stocks (i.e. Table 1), and more importantly the identification of informed
trading is based on the trader’s knowledge about future prices, it may be important to recognize
and include this dimension of trade in the measure of market share.32
Standard control variables
Following O’Hara and Ye (2011), we use the following control variables as determinants of
dark trading: price, trade size, market capitalization and trade value. These controls are captured
in Zit in the Stage 1 regression. Except for Mcap, which is the market capitalization measured at
the beginning of the sample period, all remaining variables are measured on a daily basis. More
specifically, Price is the value weighted average trade price. Trade_size_ratio is calculated as the
ratio of the average trade size on day t and the average trade size for the whole sample period for
each sample stock (see Bessembinder, 2003). Total_value is the daily dollar turnover. For the
second stage regression, Xit includes Price, Trade_size_ratio and Total_value.33
Except for
Dark_value_ratio and Trade_size_ratio, all variables are log transformed.
Additional control variables
A distinction between our study and previous research (e.g. O’Hara and Ye, 2011) is that we
introduce additional controls for the level of information asymmetry in the market to reflect that
some trading days contain more information than other trading days. In terms of our regression
specifications, the level of information asymmetry as determined by the average informativeness
of market transactions affects both Dark_value_ratio and Eff_spread. First, the level of
information asymmetry in the market may influence the decision to trade by uninformed
investors. As discussed before, it has been demonstrated that uninformed investors strategically
trade to avoid diversely informed investors (Admati and Pfleiderer, 1988; Foster and
Viswanathan, 1990; Wang, 1994). Our earlier results show that uninformed traders are biased
32 We also estimate Stage 1 and 2 regressions using Dark_volume_ratio and our conclusions are not changed. 33 The model specified in Stage 2 is also similar to that of Hendershott and Jones (2005).
19
towards dark venues. Therefore, in the presence of a high level of informed trading,
Dark_value_ratio will decrease. Second, higher adverse selection risk on a particular day will
also increase the total transaction costs because liquidity providers demand more to cover for the
increased risk of trading against an informed trader. For example, Bessembinder (2003) finds a
positive and significant relationship between ex-post price impact and transaction costs.34
We control for market information in two ways. First, following Bessembinder (2003), we
include measures of adverse selection costs in both stages of regressions. Specifically, for each
stock, we calculate the average 30 second (short-term) and 5 minute (long-term) adverse
selection costs for all transactions on each trading day. Second, similar to the comparison of
spread decomposition in Section 4.1, we include dummy variables for the quoted spread in the
second stage of regression. For each stock we calculate time weighted quoted bid-ask spread for
each trading day and rank the trading days into terciles based on the size of the time weighted
spread. Dummy_spread_median and Dummy_spread_large represent dummy variables for the
two largest quoted spread terciles.
For
these reasons, it is necessary to control for the level of market information asymmetry in both the
Stage 1 and Stage 2 regressions.
Figure 1 depicts the relationship between Eff_spread, Dark_value_ratio, and short-term and
long-term adverse selection costs. These variables are calculated as daily averages across sample
stocks. As expected, the information asymmetry level is positively (negatively) correlated with
transaction costs (dark market share), which demonstrates the necessity to control for adverse
selection risk.
[Insert Figure 1 Here]
Relationship between dark trading and effective spreads
34 Since the liquidity rebate rate under a maker-taker price scheme is pre-fixed, it does not cover for the additional costs incurred by liquidity providers during more risky market conditions.
20
Table 5 presents estimates of the Heckman correction models. Model 1 reports the results of
the Stage 1 probit regression and shows that market information asymmetry is associated with
the probability of dark trading. Specifically, we find a negative relationship between short-term
adverse selection risk and Dark_value_ratio, which is significant at the 0.001 level. Long-term
adverse selection risk is positively related to dark trading but only significant at the 5% level.
The coefficient associated with long-term adverse selection risk is also significantly smaller than
that of the short-term risk. Trade_size_ratio is positive and significant, indicating that dark
trading attracts trades of large size. Price and Mcap are both negative and significant, indicating
that small and low-priced stocks are more likely to be executed on the dark venues. These results
suggest that there is a significant selection bias towards dark trading.
[Insert Table 5]
Model 2 presents the results from the Stage 2 regression and, consistent with our predictions,
we find that transaction costs are positively related to the level of dark trading. After controlling
for market information asymmetry, Dark_value_ratio is positive and significant at the 0.001
level. The coefficient is 0.00016, which means that a 10% rise in absolute market share by dark
venues is associated with a 0.16 bps rise in effective spreads or about 0.32 bps in the round trip
costs of a trade market wide. Given that the average round trip cost of a trade is 7.08 bps in our
sample across all market centers (not reported), this result reflects an economically significant
increase of 4.5% in transaction costs.
Turning to the control variables, we find that transaction costs are positively related to the
adverse selection costs on the market, which is consistent with the results from Bessembinder
(2003). We find that coefficients for both measures of market information asymmetry are
positive and significant. Likewise, Trade_size_ratio is positively related to Eff_spread,
suggesting that large trades are more difficult to execute. Price and Total_value are negative and
significant which indicates that higher priced, more liquid stocks are cheaper to trade. Consistent
with O’Hara and Ye (2011), we find that the selection bias estimator �̂� is insignificant in
explaining the average transaction costs after controlling for the rest factors.

21
Our analysis differs from the previous literature in two ways. First, as discussed in
Section 1 our sample is based on all transactions and is less subject to biases. Since the TRF data
used by O’Hara and Ye (2011) include lit markets of BATS and DirectEdge, their study is more
focused on market fragmentation rather than a specific investigation for fragmentation by dark
venues. More importantly, we control for the market information asymmetry level of a trading
day. To test the sensitivity of our results to the information control variables, we repeat our tests
based on the model specification employed in O’Hara and Ye (2011), and find that Eff_spread
increases with Dark_volume_ratio (see Appendix 9). These tests demonstrate that it is critical to
control for the level of adverse selection risk when assessing the relationship between dark
fragmentation and transaction costs.
Large trades
As discussed previously, dark venues share much similarity with the traditional upstairs
market. Previous empirical literature shows that traders can benefit from executions in upstairs
markets for more difficult trades or at times when downstairs liquidity is scarce (Bessembinder
and Venkataraman, 2004). Thus, our conclusion that dark fragmentation is associated with
higher trading costs appears contradictory with these studies. However, one distinct feature of
the upstairs markets is the much larger sizes for transactions executed on these markets.
Bessembinder and Venkataraman (2004) report an average upstairs block size of 6,538 shares for
the Paris Bourse and Smith, Turnbull and White (2001) document an average trade size of
43,550 shares for the upstairs market on the Toronto Stock Exchange. In contrast, the average
trade size for dark venues in our sample is only 256 shares. To isolate the effect of fragmentation
by large trades on dark venues, we differentiate dark large trades from the pool of dark trades.
Specifically, for each stock, we calculate the daily Dark_block_ratio as the value of large trades
on dark venues divided by total value of trades on dark venues, where large trades are defined as
those trades that are in the top 1% of trades by trade value for each stock over the sample period.
In Model III of Table 7 we include Dark_block_ratio as an explanatory variable for
Eff_spread. All other variables are identical to those in Model II. We find that the coefficient of

22
Dark_block_ratio is negative and significant, indicating that large trades on dark venues are
associated with lower transaction costs. The coefficients of all other variables are similar to those
in Model II. These results suggest that after controlling for the total impact of dark trading, the
execution of large transactions on dark venues reduces the negative impact of dark trading on
market quality. This finding is consistent with previous studies which show that upstairs markets
supplement downstairs markets (Madhavan and Cheng, 1997; Smith, Turnbull and White, 2001;
Bessembinder and Venkataraman, 2004). Taken together, our results show that it is not large
trades on dark venues that are harmful to market quality but rather, the cream-skimming of
smaller uninformed orders.35
Impact of dark trading on lit and dark transaction costs
Until now, our regression analysis has focused on overall market transaction costs. In this
section, we assess the relationship between dark segmentation and lit and dark market transaction
costs individually. The results of Stage 2 regression are reported in Table 6.36
[Insert Table 6]
As the results show, dark trading is associated with higher transaction costs, primarily
through the impact on lit markets. The dependent variable is Eff_spread, which is the value
weighted effective spread for each stock-day, measured by market type. For the lit regression,
the coefficient of Dark_value_ratio is 0.00032, which is significant at the 0.001 level. Given that
the average round trip cost of a trade on lit markets is 7.2 bps in our sample (not reported), a 10%
rise in absolute market share by dark venues is accompanied by an economically significant
increase of 8.9% in transaction costs for lit markets. While positive, Dark_value_ratio in the
dark regression is statistically insignificant which we explore more fully below. Consistent with
the overall market results, we find that all controls for market information asymmetry are
35 To confirm the impact of dark large trades on market transaction costs, we estimate a regression of effective spreads on the ratio of the value of dark large trades to the total trading value of all markets, while keeping the other control variables. The results (not reported) show that the coefficient associated with dark large trades is negative and insignificant, confirming our conclusion that the execution of dark bock trades does not harm market quality. 36 The first stage regression is identical to that for the overall markets in Table 5.

23
positive and significantly related to lit and dark Eff_spread. Dark_block_ratio is negative and
significant for both regressions, which again highlights that the execution of trades on dark
venues between a large willing buyer and large willing seller does not have negative effects on
broader market quality. Taken as a whole, our results are consistent with the theoretical
predictions by Bolton, Santos and Scheinkman (2011) and suggest that dark trading increases
transaction costs by making it more costly to trade.
Further investigation on stocks of different sizes
The insignificant relationship between Dark_value_ratio and dark transaction costs may
reflect the use of sub-penny pricing in dark venues. Table 3 shows that the relative ability of lit
markets (dark venues) to provide price improvement strengthens (weakens) for smaller stocks
where prices are less constrained by narrow quotes. Therefore, the impact of dark trading on lit
or dark transaction costs may vary between stocks of different sizes since prices of smaller
capitalization stocks are less constrained. To further investigate this hypothesis, we estimate
Stage 1 and Stage 2 regressions separately for small, medium and large stocks, and report the
results of the Stage 2 regression in Table 7.37
[Insert Table 7 Here]
In general, our previous findings hold across all market capitalization categories. For all
trades on lit and dark venues combined, we find that Dark_value_ratio is positive for all sub-
samples and significant at the 0.001 level for large and medium stocks. Separating the dependent
variable Eff_spread into that of lit and dark, we also find that lit and dark transaction costs
increase with Dark_value_ratio for medium and large stocks. For these stocks, trading on dark
venue increases costs on both lit and dark venues indicating that the deterioration of the
benchmark set by lit markets also harms investors accessing liquidity on dark venues. For small
stocks, Dark_value_ratio continues to be positive and significant for lit markets but is
insignificant for all trades on both venue types combined and for dark venues. For these stocks,
37 The results of Stage 1 regression are similar to those reported in Table 5, and are available upon request.

24
the benchmark setting markets are negatively impacted by dark activity but the effect on trades
on dark venues is ambiguous.
Further investigation of these results indicates that a 10% increase in dark market share will
lead to a 11%, 8% and 1% increase in the market transaction costs (round trip) of large, median
and small stocks respectively, suggesting that transaction costs of large stocks are more sensitive
to dark market share.38
Dark_block_ratio is generally negative and significant across all venue
types and market capitalization subsamples, indicating that the execution of large trades on dark
generally decreases transaction costs. These results confirm our finding that dark fragmentation
is detrimental to market quality for stocks of all sizes.
2.5 Impact of Dark Trading on Price Efficiency
The evidence presented in the previous section documents strong information-based order
segmentation activity by dark venues, which is accompanied by an increase in market transaction
costs. Previous literature also suggests that market fragmentation and liquidity affect price
efficiency (Madhavan, 1995; Chordia, Roll and Subrahmanyam, 2008). In this section, we
employ variance ratios to examine the impact of dark trading on price efficiency.
Market efficiency hypothesis suggests that security prices that reflect all available
information follow a random walk. As such, any market frictions that prevent price discovery
from taking place will result in less efficient prices. Our previous results show that dark venues
segment uninformed liquidity from lit markets, which is the center of price discovery. Given the
negative effects of cream-skimming on lit liquidity, we conjecture that dark trading is associated
with lower price efficiency.
We follow O’Hara and Ye (2011) and calculate the variance ratio as:
38 The average effective spreads of large, medium and small stocks in our sample are 1.45, 2.65 and 6.48 bps, respectively.

25
2
2
11_
long
short
n
ratioVarianceσ
σ−=
where 2shortσ and 2
longσ are variances of returns measured over short and long intervals,
respectively and n is the ratio of the intervals. For each stock and trading day, we calculate the
variance of bid ask midpoint returns at 60-second, 600-second, 900-second and 1800-second
intervals. The variance ratio is then calculated over four frequencies: 60/600, 60/1800, 300/900
and 300/1800. If prices follow a random walk, the variance ratio should be close to zero.
Therefore, a smaller variance ratio indicates a more efficient price. To examine the impact of
dark trading on variance ratio, we regress the variance ratios on the explanatory variables
specified in the Heckman Stage 2 regression. Results are reported in Table 8.
[Insert Table 8 Here]
The results show a positive and significant coefficient on Dark_value_ratio across all
variance ratio measures, indicating that price efficiency decreases with dark trading. Further tests
(not reported) show that during our sample period short-term volatility significantly exceeds the
corresponding long-term volatility.39
39 For our sample stocks, the average value of
Therefore, the resulting price inefficiency mainly comes in
the form of excess short-term volatility. The coefficient on Dark_block_ratio is consistently
negative, although only significant for the variance ratio calculated on 60/600. Short-term
adverse selection risk is associated with less efficient prices, while long-term adverse selection
risk has the opposite effect. This suggests that traders who follow short-term price trends mainly
take advantage of temporary liquidity imbalance and do not contribute to the information
discovery process, while traders who possess more material information are beneficial to an
efficient market. Transaction size is also positively related to variance ratio, suggesting that
larger trades are associated with noisier prices. The coefficient on total trading value is negative,
indicating that market efficiency increases with market liquidity (Chordia, Roll and
)1/( 22longshort n
σσ for the measure of 60/600, 60/1800, 300/900 and
300/1800 is 1.2602, 1.5615, 1.1539 and 1.3410, respectively.
(17)
26
Subrahmanyam, 2008). Overall our results demonstrate that, except for the execution of large
orders, dark fragmentation reduces price efficiency.
3. Robustness Tests
3.1 Endogeneity
Our results show a negative relationship between dark trading and transaction costs.
However, the model specification is inadequate to establish causality between dark market share
and transaction costs. On the one hand, order segmentation and free-riding on information by
dark venues can lead to a conclusion that dark trading harms market quality while on the other
hand, investors may base routing decisions on their expectations about transaction costs on lit
and dark venues. In our main results, we use the Heckman two-step correction to control for
selection bias, but the procedure does not necessarily overcome the fact that Eff_spread and
Dark_value_ratio are endogenously determined.
One solution is to find an instrumental variable that is correlated with Dark_value_ratio but
uncorrelated with the error term in the Stage 2 transaction costs regression, ceteris paribus. More
importantly this instrumental variable should reflect the informational difference between lit and
dark markets which is captured in Dark_value_ratio. We propose the following instrument:
𝐷𝑎𝑟𝑘_𝑠𝑖𝑧𝑒_𝑟𝑎𝑡𝑖𝑜 = 𝑆𝑖𝑧𝑒𝐷𝑎𝑟𝑘𝑆𝑖𝑧𝑒𝑇𝑜𝑡𝑎𝑙
which is the ratio of the average transaction size on dark venues on the average trade size across
all markets. Previous research establishes a close link between a trader’s private information and
the size of her trades. Theoretical models propose that monopolistic informed traders camouflage
their information by breaking up large trades into a series of smaller trades (Kyle, 1985, Admati
and Pfleiderer, 1988; Foster and Viswanathan, 1990). Barclay and Warner (1993) provide the
first evidence consistent with the stealth trading hypothesis, which is further supported by a large
number of subsequent studies (Huang and Stoll, 1997; Chan and Fong, 2000; Chakravarty, 2001;
(18)
27
Garfinkel and Nimalendran, 2003; Alexander and Peterson, 2007; Frino, Johnstone and Zheng,
2010).
An implication of the stealth trading hypothesis is that informed traders trade with smaller
order sizes than uninformed traders. Therefore, Dark_size_ratio is effectively a measure of the
relative informativeness of dark venues compared to lit markets. For example, a higher
Dark_size_ratio today indicates that the concentration of informed trades on dark venues,
relative to lit markets, is lower today than it was yesterday. Holding the total level of market
informativeness constant, any changes to Dark_size_ratio must then represent exogenous
demands of liquidity-motivated traders. Take for example, a mutual fund that sends its large
liquidity-motivated orders to a dark venue. The increase in uninformed trading interest on dark
venues is captured by an increase in Dark_size_ratio. Since the order is routed to a dark venue,
dark market share also increases. Therefore we expect Dark_size_ratio, as a proxy for the
relative informativeness between venues, has a positive impact on Dark_value_ratio.40
In contrast, it is not obvious that Dark_size_ratio should have any relationship with the
average transaction costs on the market. The average market transaction costs can be influenced
by a series of variables, including the average adverse selection risk on the market. Intuitively,
the average market transaction costs across all venues should be affected by the average
informativeness of all traders rather than how informed order flow is split between two markets.
An increase (decrease) in adverse selection risk is likely to reduce (increase) the average trade
size across lit and dark venues, but it is unclear how the ratio of trade size between these two
types of venues will change. In our previous example, the average market transaction costs
should remain unchanged since the liquidity-motivated large trade contains no new information.
As a consequence, the Dark_size_ratio is expected to be uncorrelated with any idiosyncratic
component of market transaction costs.
We use the Dark_size_ratio as an instrument and re-examine the relationship between
Eff_spread and Dark_value_ratio in a 2SLS framework. The results are reported in Table 9.
Consistent with our main results reported in Table 7, Dark_value_ratio is positive and significant
40 We test the validity of the instrument by regressing Dark_value_ratio against Dark_size_ratio and report a coefficient of 2.99 (t-stat = 71.4).

28
indicating that dark fragmentation is detrimental to market quality. Dark_block_ratio remains
negative and significant, which confirms the benefits of dark venues when functioning as a block
trading facility. The proxies for adverse selection risk are all positive and significant. Similarly,
Price, Trade_size_ratio and Total_value are of the same sign and similar magnitude to our
estimates in Table 7. Therefore, our conclusion that dark fragmentation worsens transaction costs
is robust to adjustments for endogeneity.
[Insert Table 9 Here]
3.2 Tests on High Frequency Trading
The recent growth in high frequency trading (HFT) has raised concerns about its impact on
market quality. It is widely believed that dark venues screen out high frequency traders (HFTs).
Therefore, if dark venues are selectively excluding HFTs from trading, then it is possible that the
relationship between dark trading and transaction costs we observe is driven by HFT activity.
To test this hypothesis, we need to identify HFT activity, which is not available in the SIP
data. We obtain data released publically by NASDAQ that identify 21 of the most active HFT
firms on the NASDAQ market over the same sample period. The total trading value of these
HFT firms is $445 billion, which represents 60.13% of the total value traded on NASDAQ. For
each observation, information fields of the dataset include security, transaction date and time,
price, volume, buy (sell) indicator and indicators for whether the buyer (seller) is one of the HFT
firms. We exclude from our SIP data dark transactions that are not executed on NASDAQ, and
construct the following variables to analyze the impact of HFT:
𝐻𝐹𝑇𝐴𝑙𝑙 =𝑇𝑜𝑡𝑎𝑙 𝑉𝑎𝑙𝑢𝑒𝐻𝐹𝑇𝑇𝑜𝑡𝑎𝑙 𝑉𝑎𝑙𝑢𝑒 × 2
𝐻𝐹𝑇𝑀𝑎𝑘𝑒 =𝑇𝑜𝑡𝑎𝑙 𝑉𝑎𝑙𝑢𝑒𝐻𝐹𝑇_𝑚𝑎𝑘𝑒
𝑇𝑜𝑡𝑎𝑙 𝑉𝑎𝑙𝑢𝑒𝑀𝑎𝑘𝑒
𝐻𝐹𝑇𝑇𝑎𝑘𝑒 =𝑇𝑜𝑡𝑎𝑙 𝑉𝑎𝑙𝑢𝑒𝐻𝐹𝑇_𝑡𝑎𝑘𝑒
𝑇𝑜𝑡𝑎𝑙 𝑉𝑎𝑙𝑢𝑒𝑇𝑎𝑘𝑒

29
Specifically, TotalValueHFT is the sum of the value of transactions in which an HFT
provides liquidity and the value of transactions in which an HFT takes liquidity,
TotalValueHFT_make is the value of transactions in which an HFT provides liquidity, and
TotalValueHFT_take is the value of transactions in which an HFT takes liquidity. TotalValue is the
total trading value on NASDAQ. Clearly HFTAll measures the total level of HFT activity, while
HFTMake and HFTTake measure the level of HFT liquidity provision and consumption,
respectively. We estimate these values daily and incorporate the variables into the Heckman two-
stage model. The results are reported in Table 10.
[Insert Table 10 Here]
Model 1 of Table 10 re-estimates Model 3 in Table 5 with the new dataset. The results are
largely consistent: Dark_value_ratio is significantly positive while Dark_block_ratio is
significantly negative. In Model 2 of Table 10, we include HFTAll, our proxy for HFT activity.
HFTAll is negative and highly significant, suggesting that the level of HFT trading activity is
negatively related to effective spreads. In Model 3 of Table 10, we decompose total HFT activity
into maker and taker components. HFTMake is insignificant while HFTTake is significantly
negative, indicating that the negative correlation between HFT activity and effective spreads is
associated with the trading of HFT liquidity takers. This result is consistent with Hendershott and
Riordan (2011), who show that HFTs tend to take liquidity when it is cheap to do so. Hagstromer
and Norden (2012) also find that HFTs engaging in arbitrage and directional strategies tend to
take more liquidity following a decrease in the minimum tick size. Across all model
specifications, the coefficient of Dark_value_ratio (Dark_block_ratio) remains positive
(negative) and significant, indicating that HFT activity does not drive our results.
4. Conclusions
Trading on dark venues has grown significantly in recent years. Compared to lit markets,
there are three features unique to dark venues: exemption from the fair access requirement, pre-
trade opacity, and sub-penny trade executions. In this paper, we examine how these market
(20)
(21)
(19)

30
features influence trading behavior and the resulting impact of dark fragmentation on market
quality.
Our main finding is that dark venues successfully segment uninformed orders from the lit
markets and this fragmentation of order flow has a detrimental effect on market quality.
Specifically, we show that dark venues attract uninformed orders by providing sub-penny price
improvement. In contrast to lit markets, which are subject to fair access requirements, dark
venues enable trading by clients perceived to be uninformed.
Segmentation of uninformed order flow leaves a disproportionate amount of informed order
flow on lit markets, which disincentives liquidity providers to compete for order flow on these
venues. While overall effective spread transaction costs are higher on lit markets, we find that
almost all of this payment to liquidity providers is used to recoup the costs of trading against
informed order flow. Further, the opaque nature of dark venues means that pricing on these
markets is dependent on prices discovered through public quotations on lit markets. Without a
national-wide time-priority in place, traders on dark venues can trade ahead of the liquidity
providers on lit markets who bear the risk and provide information. This behavior discourages
limit order traders from discovering prices through quotations. For these reasons, the flight of
liquidity providers from lit markets will reduce price discovery and lead to higher transaction
costs.
Consistent with these predictions, we find that dark fragmentation is associated with higher
transaction costs and lower price efficiency. After controlling for the information content of
trades, our results show that a 10% gain in market share by dark market is associated with an
economically significant 4.5% rise in transaction costs. An increase in dark market share is also
associated with an increase in the price variance ratio, a measure of price inefficiency. However,
not all forms of dark trading are harmful. Our finding that the execution of large transactions on
the dark does not harm market quality supports the conclusions of previous literature on the
upstairs markets.
Our study makes significant contribution to the current literature on market fragmentation.
Firstly, our results extend the cream-skimming literature on the current US equity markets and
31
demonstrate the negative impact of dark trading on market quality. Our findings have important
policy implication on market design and the improvement of market integrity. In Appendix 10
we provide our policy recommendations on the current regulations of the US equity markets.
Secondly, our results directly support the theoretical predictions by Bolton, Santos and
Scheinkman (2011) on the competition between lit and dark markets. The overall negative
impact of dark trading suggests that the separation equilibria as a result of investor segmentation
reduce the overall investor welfare. Finally, our results demonstrate the importance to control for
adverse selection risk when examining the impact of dark trading. Confounding conclusions may
be reached if such controls are not applied.
There are a number of possible directions for future research. While this study documents the
general impact of dark trading on market quality, it is interesting to understand this impact
during extreme market conditions such as the May 6th Flash Crash and other highly volatile
market periods. The role of dark venues during such market events remains largely unknown.
Second, all dark venues are treated equally in our study. However, different dark venues have
adopted different market design to facilitate order matching and execution process (Mittal,
2008). Another possible future direction, therefore, is to test separately the impact of different
types of dark venues.
32
REFERENCES
Admati, AR, and P Pfleiderer, 1988, A theory of intraday patterns: Volume and price variability,
Review of Financial Studies 1, 3-40.
Alexander, Gordon J., and Mark A. Peterson, 2007, An analysis of trade-size clustering and its
relation to stealth trading, Journal of Financial Economics 84, 435-471.
Amihud, Yakov, and Haim Mendelson, 1987, Trading mechanisms and stock returns: An
empirical investigation, The Journal of Finance 42.
Brogaard, Jonathan, 2012, High frequency trading and volatility, Working Paper, University of
Washington
Blume, Marshall E., 2000, The structure of US equity markets, working paper, The Rodney L.
White Center for Financial Research, The Wharton School, University of Pennsylvania.
Baillie, Richard T., and G. Geoffrey Booth, and Yiuman Tse, and Tatyana Zabotina, 2002, Price
discovery and common factor models, Journal of Financial Markets 5, 309-321.
Barclay, Michael J., and Terrence Hendershott, and D. Timothy McCormick, 2003, Competition
among trading venues: Information and trading on electronic communications networks,
The Journal of Finance 58, 2637-2666.
Barclay, Michael J., and Jerold B. Warner, 1993, Stealth trading and volatility: Which trades
move prices?, Journal of Financial Economics 34, 281-305.
Battalio, Robert H., 1997, Third market broker-dealers: Cost competitors or cream skimmers?,
The Journal of Finance 52, 341-352.
Battalio, Robert H., Brian. Hatch, and Robert Jennings, 2003, All else equal?: A
multidimensional analysis of retail, market order execution quality. Journal of Financial
Markets 6, 143-62.
Benveniste, Lawrence M., Alan J. Marcus and William J. Wilhelm, 1992. What’s special about
the specialist?. Journal of Financial Economics 32, 61-86.
Bessembinder, Hendrik, 2003, Selection Biases and Cross-Market Trading Cost Comparisons,
Working Paper, David Eccles School of Business, University of Utah.
Bessembinder, Hendrik, and Herbert M. Kaufman, 1997, A comparison of trade execution costs
for NYSE and NASDAQ-listed stocks, Journal of Financial and Quantitative Analysis
32, 287-310.

33
Bessembinder, Hendrik, and Kumar Venkataraman, 2004, Does an electronic stock exchange
need an upstairs market?, Journal of Financial Economics 73, 3-36.
Bessembinder, Hendrik, and Kumar Venkataraman, 2010, Bid–ask spreads, in Encyclopedia of
quantitative finance (John Wiley & Sons, Ltd).
Bolton, Patrick, and Tano Santos, and Jose Scheinkman, 2011, Cream skimming in financial
markets, NBER Working Papers Series Number 16804.
Booth, G. Geoffrey, and Ji‐Chai Lin, and Teppo Martikainen, and Yiuman Tse, 2002, Trading
and pricing in upstairs and downstairs stock markets, Review of Financial Studies 15,
1111-1135.
Brogaard, Jonathan, 2011, High frequency trading and volatility, SSRN eLibrary.
Buti, Sabrina, and Barbara Rindi, and Ingrid M. Werner, 2010, Diving into dark pools, SSRN
eLibrary.
Buti, Sabrina, and Barbara Rindi, and Ingrid M. Werner, 2011, Dark pool trading strategies,
Innocenzo Gasparini Institute for Economic Research (Bocconi University).
Comerton-Forde, Carole, and Tālis J. Putniņš, 2012. Dark trading and price discovery, Working
Paper. College of Business and Economics, Australian National University.
Chaboud, Alain, Erik Hjalmarsson, Clara Vega and Ben Chiquoine, 2009, Rise of the machines:
algorithmic trading in the foreign exchange market, FRB International Finance
Discussion Paper No. 980.
Chan, Kalok, and Wai-Ming Fong, 2000, Trade size, order imbalance, and the volatility–volume
relation, Journal of Financial Economics 57, 247-273.
Chordia, Tarun, and Richard Roll, and Avanidhar Subrahmanyam, 2008, Liquidity and market
efficiency, Journal of Financial Economics 87, 249-268.
Chordia, Tarun, and Avanidhar Subrahmanyam, 1995, Market making, the tick size, and
payment-for-order flow: theory and evidence. Journal of Business 68, 543–575.
Chung, Kee H., and Chairat Chuwonganant, and D. Timothy McCormick, 2004, Order
preferencing and market quality on Nasdaq before and after decimalization, Journal of
Financial Economics 71, 581-612.
Colby, Robert L.D., and Erik R. Sirri, 2010, Consolidation and competition in the US equity
markets, Capital Markets law Journal 5, 169-196.

34
Degryse, Hans, and Frank De Jong, and Vincent Van Kervel, 2011, The impact of dark and
visible fragmentation on market quality, SSRN eLibrary.
Delassus, Romain, and Stéphane Tyč, 2011, Subpenny trading in US equity markets,
Econophysics of order-driven markets, in Frédéric Abergel, Bikas K. Chakrabarti,
Anirban Chakraborti, and Manipushpak Mitra, eds.: (Springer Milan).
Easley, D, and NM Kiefer, and M O'Hara, 1997, One day in the life of a very common stock,
Review of Financial Studies 10, 805-835.
Easley, David, and Nicholas M. Kiefer, and Maureen O'Hara, 1996, Cream-skimming or profit-
sharing? The curious role of purchased order flow, The Journal of Finance 51, 811-833.
Easley, David, and Nicholas M. Kiefer, and Maureen O'Hara, and Joseph B. Paperman, 1996,
Liquidity, information, and infrequently traded stocks, The Journal of Finance 51, 1405-
1436.
Easley, David, and Maureen O'Hara, 1987, Price, trade size, and information in securities
markets, Journal of Financial Economics 19, 69-90.
Ellis, Katrina, and Roni Michaely, and Maureen O'Hara, 2000, The accuracy of trade
classification rules: Evidence from Nasdaq, Journal of Financial and Quantitative
Analysis 35, 529-551.
Foster, FD, and S Viswanathan, 1990, A theory of the interday variations in volume, variance,
and trading costs in securities markets, Review of Financial Studies 3, 593-624.
Frino, Alex, and David Johnstone, and Hui Zheng, 2010, Anonymity, stealth trading, and the
information content of broker identity, The Financial Review 45, 501-522.
Gammill, J., 1985, Signaling and the design of financial markets, Sloan School of Management
(MIT).
Garfinkel, Jon A., and M. Nimalendran, 2003, Market structure and trader anonymity: An
analysis of insider trading, Journal of Financial and Quantitative Analysis 38, 591-610.
Glosten, Lawrence R., 1994, Is the electronic open limit order book inevitable?, The Journal of
Finance 49, 1127-1161.
Glosten, Lawrence R., and Paul R. Milgrom, 1985, Bid, ask and transaction prices in a specialist
market with heterogeneously informed traders, Journal of Financial Economics 14, 71-
100.
Gresse, Carole, 2011, Effects of the competition between multiple trading platforms on market

35
liquidity: Evidence from the MiFID experience, SSRN eLibrary.
Hagstromer, Bjorn, and Lars Norden, 2012. The diversity of high frequency traders, Working
paper. School of Business, Stockholm University.
Harris, Frederick H. deB., Thomas H. McInish and Robert A. Wood, 2002. Security price
adjustment across exchanges: an investigation of common factor components for Dow
stocks. Journal of Financial Markets 5, 277 – 308.
Hasbrouck, Joel, 1995, One security, many markets: Determining the contributions to price
discovery, The Journal of Finance 50, 1175-1199.
Hasbrouck, Joel, and George Sofianos, and Deborah Sosebee, 1993, New York Stock Exchange
systems and trading procedures, NYSE Working Paper #93-01.
Heckman, James J., 1979, Sample selection bias as a specification error, Econometrica 47, 153-
161.
Hendershott, Terrence, and Charles M. Jones, 2005, Island goes dark: Transparency,
fragmentation, and regulation, Review of Financial Studies 18, 743-793.
Hendershott, Terrence, and Charles M. Jones, and Albert J. Menkveld, 2011, Does algorithmic
trading improve liquidity?, The Journal of Finance 66, 1-33.
Hendershott, Terrence J., and Ryan Riordan, 2011, Algorithmic trading and information, SSRN
eLibrary.
Hendrik, Bessembinder, 2003, Quote-based competition and trade execution costs in NYSE-
listed stocks, Journal of Financial Economics 70, 385-422.
Huang, RD, and HR Stoll, 1997, The components of the bid-ask spread: A general approach,
Review of Financial Studies 10, 995-1034.
Huang, Roger D., 2002, The quality of ECN and Nasdaq market maker quotes, The Journal of
Finance 57, 1285-1319.
Huang, Roger D., and Hans R. Stoll, 1996, Dealer versus auction markets: A paired comparison
of execution costs on Nasdaq and the NYSE, Journal of Financial Economics 41, 313-
357.
Lin, S., G., Sanger, and G. Booth, 1995, Trade size and components of the bid-ask spread,
Review of Financial Studies, 8, 1153-1183.
Kwan, Amy, and Thomas McInish, 2012, Subpenny pricing and the competition for orderflow,
Working Paper, University of New South Wales.
36
Kyle, Albert. S., 1984, Market structure, information, futures markets, and price formation, in
International Agricultural Trade: Advanced Readings in Price Formation, Market
Structure, and Price Instability, ed. by Gary G. Storey, Andrew Schmitz, and Alexander
H. Sarris. Boulder and London: Westview Press, 45- 64.
Kyle, Albert S., 1985, Continuous auctions and insider trading, Econometrica 53, 1315-1335.
Lee, Charles M.C., and Mark J. Ready, 1991, Inferring trade direction from intraday data, The
Journal of Finance 46, 733-746.
Lo, AW, and AC MacKinlay, 1988, Stock market prices do not follow random walks: Evidence
from a simple specification test, Review of Financial Studies 1, 41-66.
Madhavan, A, 1995, Consolidation, fragmentation, and the disclosure of trading information,
Review of Financial Studies 8, 579-603.
Madhavan, A, and M Cheng, 1997, In search of liquidity: Block trades in the upstairs and
downstairs markets, Review of Financial Studies 10, 175-203.
Madhavan, A, 2000, Market microstructure: A survey, Journal of Financial Markets 3, 205-258.
Madhavan, A, 2011, Exchange-Traded Funds, Market Structure and the Flash Crash, Working
Paper, SSRN eLibrary.
Martin, Martens, 1998, Price discovery in high and low volatility periods: Open outcry versus
electronic trading, Journal of International Financial Markets, Institutions and Money 8,
243-260.
Mittal, H, 2008, Are you playing in a toxic dark pool? A guide to preventing information
leakage, Journal of Trading 3, 20-33.
Menkveld, Albert J., 2012, High Frequency Trading and the New-Market Makers, Working
Paper, VU University Amsterdam.
Nimalendran, Mahendrarajah, and Sugata Ray, 2011, Informed trading in dark pools, SSRN
eLibrary.
O'Hara, Maureen, and Mao Ye, 2011, Is market fragmentation harming market quality?, Journal
of Financial Economics 100, 459-474.
Pagano, Marco, 1989a, Trading volume and asset liquidity, The Quarterly Journal of Economics
104, 255-274.
Pagano, Marco, 1989b, Endogenous market thinness and stock price volatility, Review of
Economi Studies 56, 269-288.
37
Seppi, Duane J., 1990, Equilibrium block trading and asymmetric information, The Journal of
Finance 45, 73-94.
Smith, Brian F., and D. Alasdair S. Turnbull, and Robert W. White, 2001, Upstairs market for
principal and agency trades: Analysis of adverse information and price effects, The
Journal of Finance 56, 1723-1746.
Stoll, Hans R., 2001, Market fragmentation, Financial Analysts Journal 57, 16-20.
Sugato, Chakravarty, 2001, Stealth-trading: Which traders’ trades move stock prices?, Journal of
Financial Economics 61, 289-307.
Tse, Yiuman, and Grigori Erenburg, 2003, Competition for order flow, market quality, and price
discovery in the Nasdaq 100 index tracking stock, Journal of Financial Research 26,
301-318.
Wang, Jiang, 1994, A model of competitive stock trading volume, Journal of Political Economy
102, 127-168.
Weaver, Daniel G., 2011, Internalization and market quality in a fragmented market structure,
SSRN eLibrary.
Ye, Mao, 2011, A glimpse into the dark: Price formation, transaction costs, and market sharing
in the crossing network, Working Paper, Department of Economics, Cornell University.
Zhu, Haoxiang, 2011, Do dark pools harm price discovery? Working Paper, Graduate School of
Business, Stanford University.

38
Tables and Figures
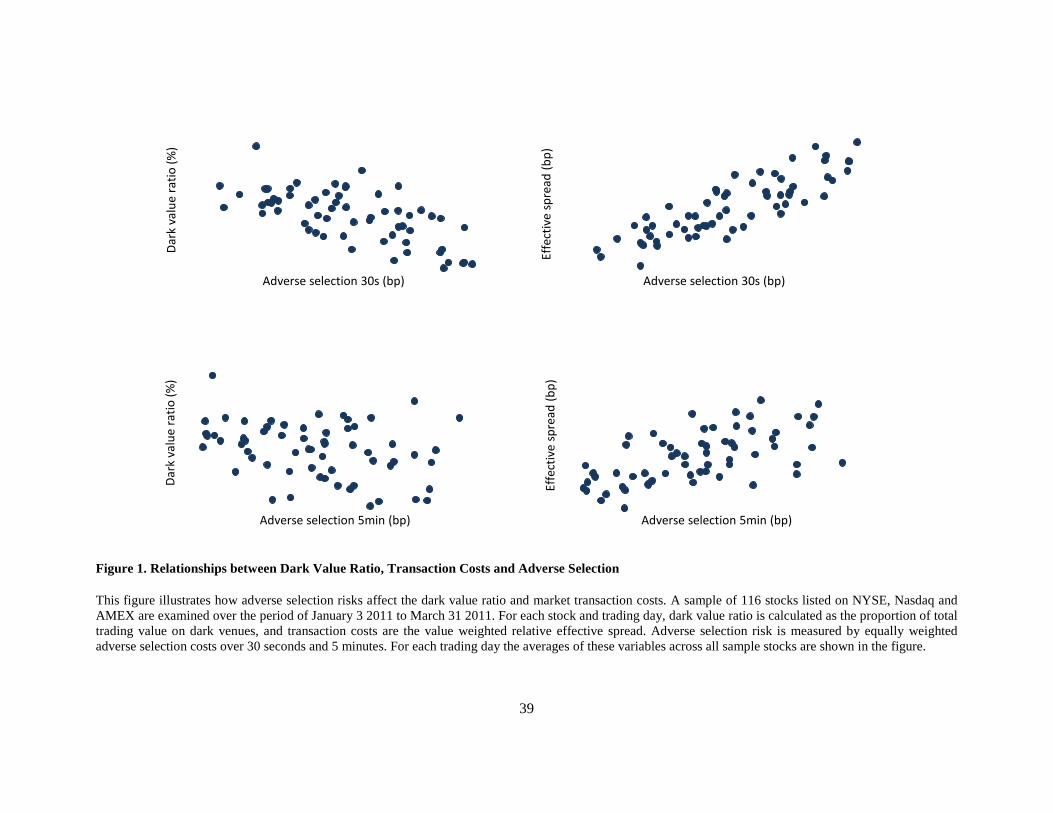
39
Figure 1. Relationships between Dark Value Ratio, Transaction Costs and Adverse Selection This figure illustrates how adverse selection risks affect the dark value ratio and market transaction costs. A sample of 116 stocks listed on NYSE, Nasdaq and AMEX are examined over the period of January 3 2011 to March 31 2011. For each stock and trading day, dark value ratio is calculated as the proportion of total trading value on dark venues, and transaction costs are the value weighted relative effective spread. Adverse selection risk is measured by equally weighted adverse selection costs over 30 seconds and 5 minutes. For each trading day the averages of these variables across all sample stocks are shown in the figure.
Dar
k va
lue
ratio
(%)
Adverse selection 30s (bp)
Effe
ctiv
e sp
read
(bp)
Adverse selection 30s (bp)
Dar
k va
lue
ratio
(%)
Adverse selection 5min (bp)
Effe
ctiv
e sp
read
(bp)
Adverse selection 5min (bp)
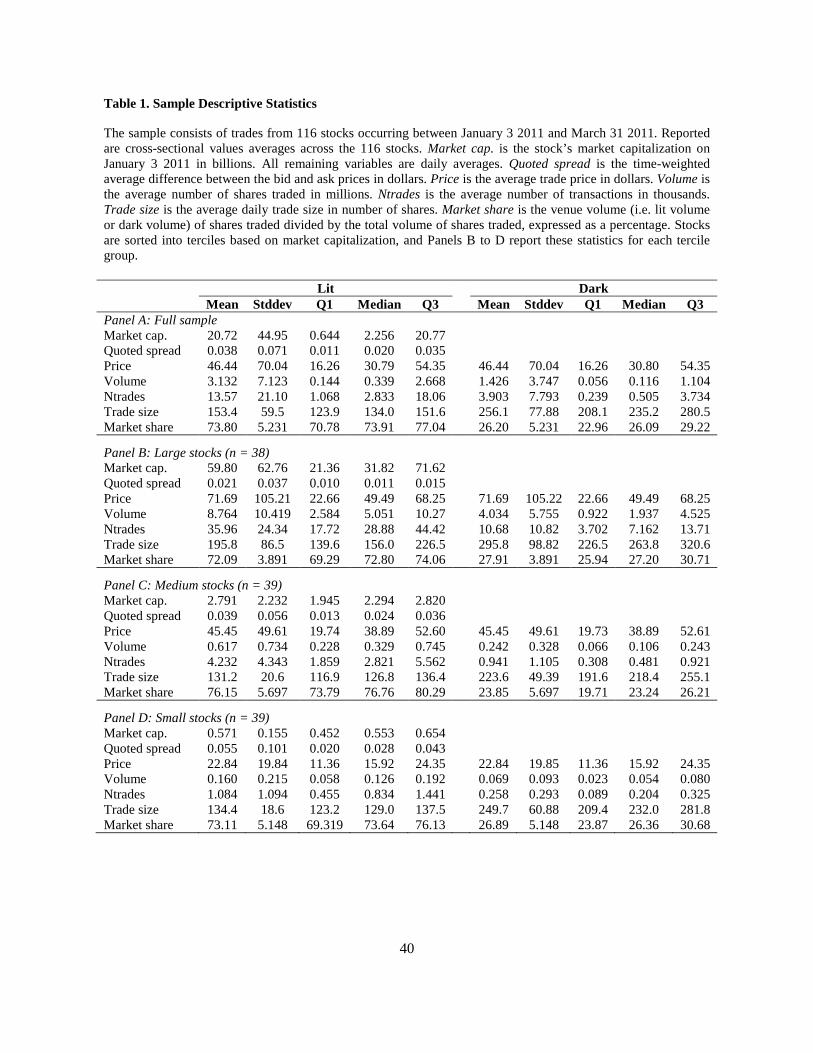
40
Table 1. Sample Descriptive Statistics The sample consists of trades from 116 stocks occurring between January 3 2011 and March 31 2011. Reported are cross-sectional values averages across the 116 stocks. Market cap. is the stock’s market capitalization on January 3 2011 in billions. All remaining variables are daily averages. Quoted spread is the time-weighted average difference between the bid and ask prices in dollars. Price is the average trade price in dollars. Volume is the average number of shares traded in millions. Ntrades is the average number of transactions in thousands. Trade size is the average daily trade size in number of shares. Market share is the venue volume (i.e. lit volume or dark volume) of shares traded divided by the total volume of shares traded, expressed as a percentage. Stocks are sorted into terciles based on market capitalization, and Panels B to D report these statistics for each tercile group. Lit Dark Mean Stddev Q1 Median Q3 Mean Stddev Q1 Median Q3 Panel A: Full sample Market cap. 20.72 44.95 0.644 2.256 20.77 Quoted spread 0.038 0.071 0.011 0.020 0.035 Price 46.44 70.04 16.26 30.79 54.35 46.44 70.04 16.26 30.80 54.35 Volume 3.132 7.123 0.144 0.339 2.668 1.426 3.747 0.056 0.116 1.104 Ntrades 13.57 21.10 1.068 2.833 18.06 3.903 7.793 0.239 0.505 3.734 Trade size 153.4 59.5 123.9 134.0 151.6 256.1 77.88 208.1 235.2 280.5 Market share 73.80 5.231 70.78 73.91 77.04 26.20 5.231 22.96 26.09 29.22
Panel B: Large stocks (n = 38) Market cap. 59.80 62.76 21.36 31.82 71.62 Quoted spread 0.021 0.037 0.010 0.011 0.015 Price 71.69 105.21 22.66 49.49 68.25 71.69 105.22 22.66 49.49 68.25 Volume 8.764 10.419 2.584 5.051 10.27 4.034 5.755 0.922 1.937 4.525 Ntrades 35.96 24.34 17.72 28.88 44.42 10.68 10.82 3.702 7.162 13.71 Trade size 195.8 86.5 139.6 156.0 226.5 295.8 98.82 226.5 263.8 320.6 Market share 72.09 3.891 69.29 72.80 74.06 27.91 3.891 25.94 27.20 30.71
Panel C: Medium stocks (n = 39) Market cap. 2.791 2.232 1.945 2.294 2.820 Quoted spread 0.039 0.056 0.013 0.024 0.036 Price 45.45 49.61 19.74 38.89 52.60 45.45 49.61 19.73 38.89 52.61 Volume 0.617 0.734 0.228 0.329 0.745 0.242 0.328 0.066 0.106 0.243 Ntrades 4.232 4.343 1.859 2.821 5.562 0.941 1.105 0.308 0.481 0.921 Trade size 131.2 20.6 116.9 126.8 136.4 223.6 49.39 191.6 218.4 255.1 Market share 76.15 5.697 73.79 76.76 80.29 23.85 5.697 19.71 23.24 26.21
Panel D: Small stocks (n = 39) Market cap. 0.571 0.155 0.452 0.553 0.654 Quoted spread 0.055 0.101 0.020 0.028 0.043 Price 22.84 19.84 11.36 15.92 24.35 22.84 19.85 11.36 15.92 24.35 Volume 0.160 0.215 0.058 0.126 0.192 0.069 0.093 0.023 0.054 0.080 Ntrades 1.084 1.094 0.455 0.834 1.441 0.258 0.293 0.089 0.204 0.325 Trade size 134.4 18.6 123.2 129.0 137.5 249.7 60.88 209.4 232.0 281.8 Market share 73.11 5.148 69.319 73.64 76.13 26.89 5.148 23.87 26.36 30.68
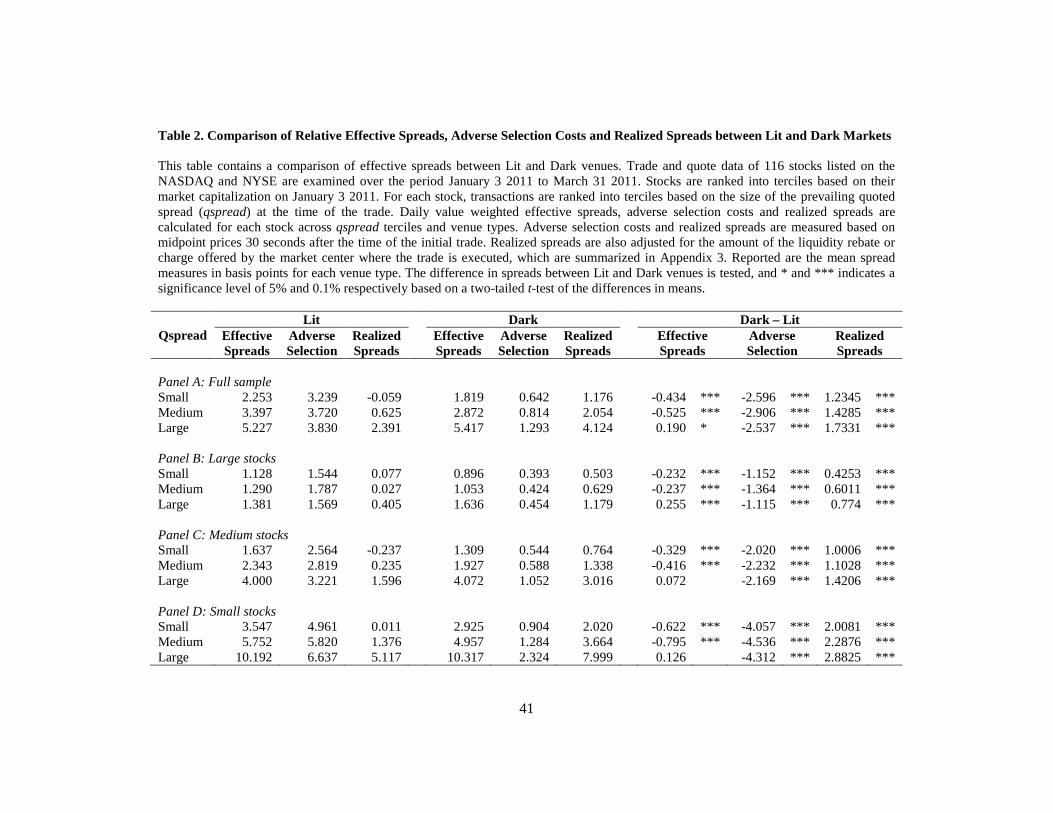
41
Table 2. Comparison of Relative Effective Spreads, Adverse Selection Costs and Realized Spreads between Lit and Dark Markets This table contains a comparison of effective spreads between Lit and Dark venues. Trade and quote data of 116 stocks listed on the NASDAQ and NYSE are examined over the period January 3 2011 to March 31 2011. Stocks are ranked into terciles based on their market capitalization on January 3 2011. For each stock, transactions are ranked into terciles based on the size of the prevailing quoted spread (qspread) at the time of the trade. Daily value weighted effective spreads, adverse selection costs and realized spreads are calculated for each stock across qspread terciles and venue types. Adverse selection costs and realized spreads are measured based on midpoint prices 30 seconds after the time of the initial trade. Realized spreads are also adjusted for the amount of the liquidity rebate or charge offered by the market center where the trade is executed, which are summarized in Appendix 3. Reported are the mean spread measures in basis points for each venue type. The difference in spreads between Lit and Dark venues is tested, and * and *** indicates a significance level of 5% and 0.1% respectively based on a two-tailed t-test of the differences in means.
Qspread Lit Dark Dark – Lit
Effective Spreads
Adverse Selection
Realized Spreads
Effective Spreads
Adverse Selection
Realized Spreads
Effective Spreads
Adverse Selection
Realized Spreads
Panel A: Full sample
Small 2.253 3.239 -0.059
1.819 0.642 1.176
-0.434 *** -2.596 *** 1.2345 *** Medium 3.397 3.720 0.625
2.872 0.814 2.054
-0.525 *** -2.906 *** 1.4285 ***
Large 5.227 3.830 2.391
5.417 1.293 4.124
0.190 * -2.537 *** 1.7331 *** Panel B: Large stocks
Small 1.128 1.544 0.077
0.896 0.393 0.503
-0.232 *** -1.152 *** 0.4253 *** Medium 1.290 1.787 0.027
1.053 0.424 0.629
-0.237 *** -1.364 *** 0.6011 ***
Large 1.381 1.569 0.405
1.636 0.454 1.179
0.255 *** -1.115 *** 0.774 *** Panel C: Medium stocks
Small 1.637 2.564 -0.237
1.309 0.544 0.764
-0.329 *** -2.020 *** 1.0006 *** Medium 2.343 2.819 0.235
1.927 0.588 1.338
-0.416 *** -2.232 *** 1.1028 ***
Large 4.000 3.221 1.596
4.072 1.052 3.016
0.072
-2.169 *** 1.4206 *** Panel D: Small stocks
Small 3.547 4.961 0.011
2.925 0.904 2.020
-0.622 *** -4.057 *** 2.0081 *** Medium 5.752 5.820 1.376
4.957 1.284 3.664
-0.795 *** -4.536 *** 2.2876 ***
Large 10.192 6.637 5.117 10.317 2.324 7.999 0.126 -4.312 *** 2.8825 ***

42
Table 3. Price Improvement on Lit and Dark This table contains a comparison of price improvement between Lit and Dark venues. Trade and quote data of 116 stocks listed on NASDAQ and NYSE are examined over the period January 3 2011 to March 31 2011. Stocks are ranked into terciles based on their market capitalization on January 3 2011. Price improvement is calculated by comparing the transaction prices with the prevailing NBBO and classified into 13 levels based on the magnitude of improvement. For each stock, the frequency of transactions with price improvement falling into each level is calculated for the Lit and Dark venues. The mean and median of the frequencies for each price level across stocks are reported.
Level Price
improvement (cents)
Lit Dark
Mean Median Mean Median
Panel A: Full sample 1 0 83.61 86.32
50.48 49.58
2 0 < x ≤ 0.10 0.00 0.00
11.73 11.45 3 0.10 < x ≤ 0.20 0.00 0.00
2.68 2.29
4 0.20 < x ≤ 0.30 0.00 0.00
2.83 2.78 5 0.30 < x ≤ 0.40 0.00 0.00
1.18 1.00
6 0.40 < x < 0.50 0.00 0.00
0.51 0.37 7 0.5 1.66 1.43
12.38 11.65
8 0.50 < x < 0.60 0.00 0.00
0.13 0.08 9 0.60 ≤ x < 0.70 0.00 0.00
0.36 0.27
10 0.70 ≤ x < 0.80 0.00 0.00
0.45 0.46 11 0.80 ≤ x < 0.90 0.00 0.00
0.45 0.39
12 0.90 ≤ x < 1.00 0.00 0.00
0.16 0.12 13 1.00 ≤ x 14.73 12.14
16.64 17.49
Panel B: Large stocks 1 0 89.92 93.76
51.55 51.60
2 0 < x ≤ 0.10 0.00 0.00
12.34 11.87 3 0.10 < x ≤ 0.20 0.00 0.00
3.74 3.57
4 0.20 < x ≤ 0.30 0.00 0.00
3.83 3.99 5 0.30 < x ≤ 0.40 0.00 0.00
1.55 1.44
6 0.40 < x < 0.50 0.00 0.00
0.90 0.71 7 0.5 2.57 1.94
18.52 20.24
8 0.50 < x < 0.60 0.00 0.00
0.12 0.02 9 0.60 ≤ x < 0.70 0.00 0.00
0.30 0.05
10 0.70 ≤ x < 0.80 0.00 0.00
0.27 0.09 11 0.80 ≤ x < 0.90 0.00 0.00
0.33 0.09
12 0.90 ≤ x < 1.00 0.00 0.00
0.15 0.04 13 1.00 ≤ x 7.50 2.46
6.41 1.56
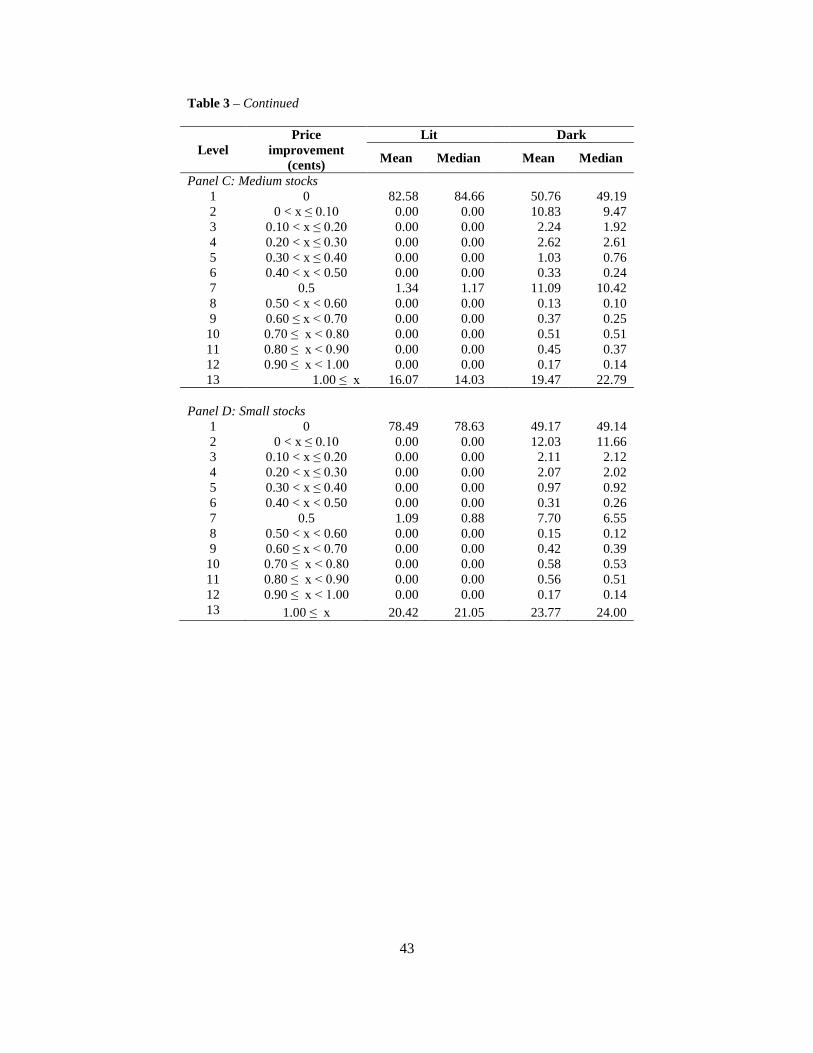
43
Table 3 – Continued
Level Price
improvement (cents)
Lit Dark
Mean Median Mean Median
Panel C: Medium stocks 1 0 82.58 84.66
50.76 49.19
2 0 < x ≤ 0.10 0.00 0.00
10.83 9.47 3 0.10 < x ≤ 0.20 0.00 0.00
2.24 1.92
4 0.20 < x ≤ 0.30 0.00 0.00
2.62 2.61 5 0.30 < x ≤ 0.40 0.00 0.00
1.03 0.76
6 0.40 < x < 0.50 0.00 0.00
0.33 0.24 7 0.5 1.34 1.17
11.09 10.42
8 0.50 < x < 0.60 0.00 0.00
0.13 0.10 9 0.60 ≤ x < 0.70 0.00 0.00
0.37 0.25
10 0.70 ≤ x < 0.80 0.00 0.00
0.51 0.51 11 0.80 ≤ x < 0.90 0.00 0.00
0.45 0.37
12 0.90 ≤ x < 1.00 0.00 0.00
0.17 0.14 13 1.00 ≤ x 16.07 14.03
19.47 22.79
Panel D: Small stocks
1 0 78.49 78.63
49.17 49.14 2 0 < x ≤ 0.10 0.00 0.00
12.03 11.66
3 0.10 < x ≤ 0.20 0.00 0.00
2.11 2.12 4 0.20 < x ≤ 0.30 0.00 0.00
2.07 2.02
5 0.30 < x ≤ 0.40 0.00 0.00
0.97 0.92 6 0.40 < x < 0.50 0.00 0.00
0.31 0.26
7 0.5 1.09 0.88
7.70 6.55 8 0.50 < x < 0.60 0.00 0.00
0.15 0.12
9 0.60 ≤ x < 0.70 0.00 0.00
0.42 0.39 10 0.70 ≤ x < 0.80 0.00 0.00
0.58 0.53
11 0.80 ≤ x < 0.90 0.00 0.00
0.56 0.51 12 0.90 ≤ x < 1.00 0.00 0.00
0.17 0.14
13 1.00 ≤ x 20.42 21.05 23.77 24.00

44
Table 4. Hasbrouck (1995) Information Share for Lit and Dark venues This table summarizes the information shares for the 116 stocks in our sample. Information shares are estimated daily using 10 lags at sampling intervals of 10 seconds (Panel A) and 1 minute (Panel B). Estimated values are averaged over all trading days in the sample period to arrive at a single information share estimate per stock. The maximum (minimum) market contribution for the Lit market is obtained when the Lit price is the first (second) variable in the Cholesky factorization. Similarly, the maximum (minimum) market contribution for the Dark venue is obtained when the Dark price is the first (second) variable in the Cholesky factorization. The midpoint represents the average between the maximum and minimum market contributions. Standard errors of the mean estimates are provided in parentheses. Lit Dark Maximum Minimum Midpoint Maximum Minimum Midpoint Panel A: 10 seconds
All 0.917 0.692 0.804
0.308 0.083 0.196
(0.072) (0.196) (0.105)
(0.196) (0.072) (0.105)
Large stocks 0.953 0.476 0.714
0.524 0.047 0.286
(0.043) (0.171) (0.098)
(0.171) (0.043) (0.098)
Medium stocks 0.937 0.816 0.876
0.184 0.063 0.124
(0.049) (0.111) (0.070)
(0.111) (0.049) (0.070)
Small stocks 0.861 0.779 0.820
0.221 0.139 0.180
(0.080) (0.074) (0.074)
(0.074) (0.080) (0.074)
Panel B: 1 minute All 0.903 0.507 0.705
0.493 0.097 0.295
(0.064) (0.257) (0.118)
(0.257) (0.064) (0.118)
Large stocks 0.947 0.182 0.564
0.818 0.053 0.436
(0.017) (0.087) (0.044)
(0.087) (0.017) (0.044)
Medium stocks 0.914 0.636 0.775
0.364 0.086 0.225
(0.042) (0.172) (0.086)
(0.172) (0.042) (0.086)
Small stocks 0.849 0.694 0.771
0.306 0.151 0.229 (0.074) (0.068) (0.057) (0.068) (0.074) (0.057)

45
Table 5. Relationship between Dark Fragmentation and Effective Spreads This table reports the estimates for the two-stage Heckman correction model. Trade and quote data of 116 stocks listed on the NASDAQ and NYSE are examined over the period January 3 2011 to March 31 2011. Model 1 reports the results for the first stage probit model. The dependent variable is Dark_value_ratio, which is calculated as the proportion of total trading value on Dark venues.
𝑁𝑜𝑛𝑁𝑀𝑆_𝑣𝑎𝑙𝑢𝑒_𝑟𝑎𝑡𝑖𝑜𝑖𝑡= Φ(𝛽0 + 𝛽1𝐴𝑑𝑣𝑒𝑟𝑠𝑒_𝑠𝑒𝑙𝑒𝑐𝑡𝑖𝑜𝑛_𝑆𝑇𝑖𝑡 + 𝛽2𝐴𝑑𝑣𝑒𝑟𝑠𝑒_𝑠𝑒𝑙𝑒𝑐𝑡𝑖𝑜𝑛_𝐿𝑇𝑖𝑡 + 𝛽3𝑃𝑟𝑖𝑐𝑒𝑖𝑡 + 𝛽4𝑇𝑟𝑎𝑑𝑒𝑠𝑖𝑧𝑒𝑟𝑎𝑡𝑖𝑜𝑖𝑡 + 𝛽5𝑇𝑜𝑡𝑎𝑙𝑣𝑎𝑙𝑢𝑒𝑖𝑡 + 𝛽6𝑀𝐶𝐴𝑃𝑖 + 𝜀𝑖𝑡)
Φ(⋅) is the standard normal cumulative distribution function. Models 2 and 3 report the results for the second stage OLS regression. The dependent variable is Eff_spread, which is the daily value weighted relative effective spread.
𝐸𝑓𝑓𝑠𝑝𝑟𝑒𝑎𝑑𝑖𝑡 = 𝛽0 + 𝛽1𝑁𝑜𝑛 − 𝑁𝑀𝑆_𝑣𝑎𝑙𝑢𝑒_𝑟𝑎𝑡𝑖𝑜𝑖𝑡 + 𝛽2𝐿𝑎𝑚𝑏𝑑𝑎𝑖𝑡 + 𝛽3𝐴𝑑𝑣𝑒𝑟𝑠𝑒_𝑠𝑒𝑙𝑒𝑐𝑡𝑖𝑜𝑛_𝑆𝑇𝑖𝑡 + 𝛽4𝐴𝑑𝑣𝑒𝑟𝑠𝑒_𝑠𝑒𝑙𝑒𝑐𝑡𝑖𝑜𝑛_𝐿𝑇𝑖𝑡 + 𝛽5𝑆𝑝𝑟𝑒𝑎𝑑_𝑚𝑒𝑑𝑖𝑡 + 𝛽6𝑆𝑝𝑟𝑒𝑎𝑑_𝑙𝑎𝑟𝑔𝑒𝑖𝑡 + 𝛽7𝑃𝑟𝑖𝑐𝑒𝑖𝑡 + 𝛽8𝑇𝑟𝑎𝑑𝑒_𝑠𝑖𝑧𝑒_𝑟𝑎𝑡𝑖𝑜𝑖𝑡 + 𝛽9𝑇𝑜𝑡𝑎𝑙_𝑣𝑎𝑙𝑢𝑒𝑖𝑡 + 𝜀𝑖𝑡
𝐸𝑓𝑓𝑠𝑝𝑟𝑒𝑎𝑑𝑖𝑡 = 𝛽0 + 𝛽1𝑁𝑜𝑛 − 𝑁𝑀𝑆𝑣𝑎𝑙𝑢𝑒𝑟𝑎𝑡𝑖𝑜𝑖𝑡 + 𝛽2𝑁𝑜𝑛 − 𝑁𝑀𝑆_𝑏𝑙𝑜𝑐𝑘_𝑟𝑎𝑡𝑖𝑜𝑖𝑡 + 𝛽3𝐿𝑎𝑚𝑏𝑑𝑎𝑖𝑡 + 𝛽4𝐴𝑑𝑣𝑒𝑟𝑠𝑒_𝑠𝑒𝑙𝑒𝑐𝑡𝑖𝑜𝑛_𝑆𝑇𝑖𝑡
+ 𝛽5𝐴𝑑𝑣𝑒𝑟𝑠𝑒_𝑠𝑒𝑙𝑒𝑐𝑡𝑖𝑜𝑛_𝐿𝑇𝑖𝑡 + 𝛽6𝑆𝑝𝑟𝑒𝑎𝑑_𝑚𝑒𝑑𝑖𝑡 + 𝛽7𝑆𝑝𝑟𝑒𝑎𝑑_𝑙𝑎𝑟𝑔𝑒𝑖𝑡 + 𝛽8𝑃𝑟𝑖𝑐𝑒𝑖𝑡 + 𝛽9𝑇𝑟𝑎𝑑𝑒_𝑠𝑖𝑧𝑒_𝑟𝑎𝑡𝑖𝑜𝑖𝑡 + 𝛽10𝑇𝑜𝑡𝑎𝑙_𝑣𝑎𝑙𝑢𝑒𝑖𝑡 + 𝜀𝑖𝑡
For Model 2, Dark_block_ratio is the daily value of the top 1% of trades on dark venues divided by the daily total value of dark trading. Lamda is the inverse Mills ratio obtained from the first stage probit model. Adverse_selection is the daily equally weighted adverse selection costs over 30 seconds (ST) and 5 minutes (LT). For each stock, days are ranked into terciles based on the time weighted quoted spread. Spread_med (Spread_large) is equal to 1 if the trading falls into the medium (large) quoted spread tercile. Price is the log of the daily value-weighted average price. Trade_size_ratio is the ratio of the average trade size on day t and the average trade size for the whole sample period for each sample stock. Total_value is the log of the daily total trading value. Mcap is the log of the stock’s market capitalization on January 3 2011. In Models 2 and 3, all coefficients except for Adverse_selection and Trade_size_ratio are scaled by a factor of 10,000. Standard errors reported in Models 2 and 3 are corrected for double clustering by date and symbol (Thompson, 2011). ***, ** and * indicate significance levels of 0.1%, 1% and 5% respectively.
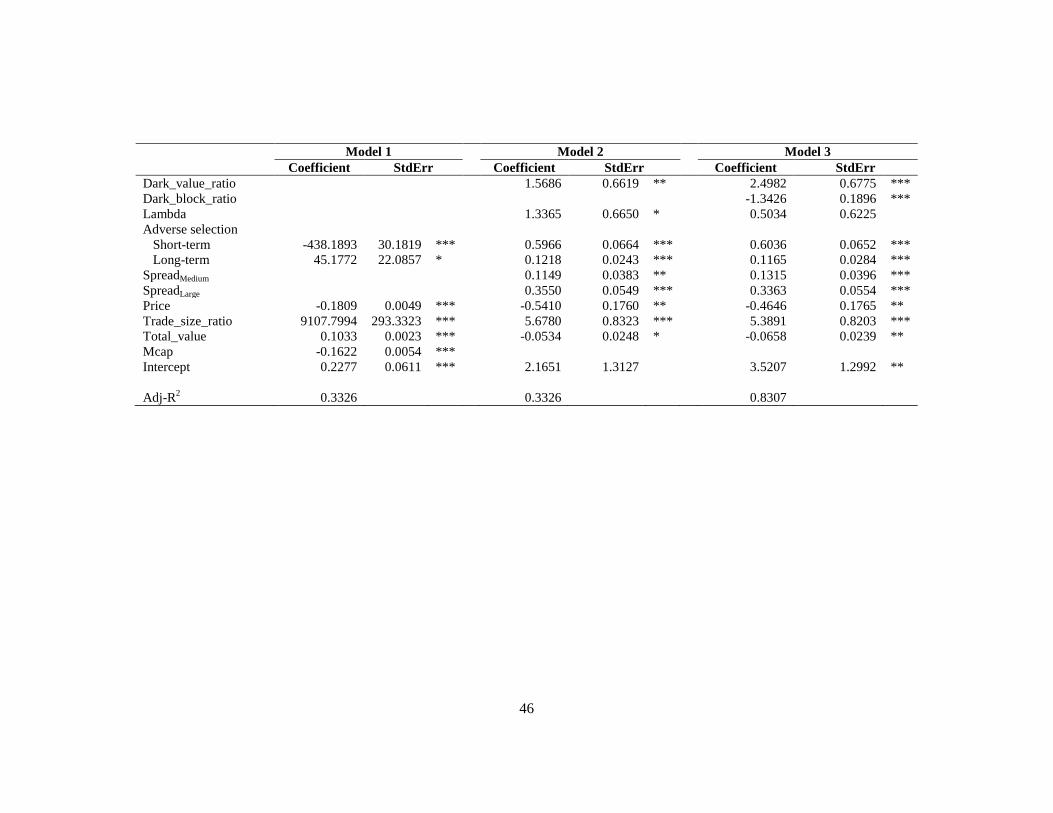
46
Model 1 Model 2 Model 3 Coefficient StdErr Coefficient StdErr Coefficient StdErr Dark_value_ratio
1.5686 0.6619 **
2.4982 0.6775 ***
Dark_block_ratio
-1.3426 0.1896 *** Lambda
1.3365 0.6650 *
0.5034 0.6225
Adverse selection Short-term -438.1893 30.1819 ***
0.5966 0.0664 ***
0.6036 0.0652 ***
Long-term 45.1772 22.0857 *
0.1218 0.0243 ***
0.1165 0.0284 *** SpreadMedium
0.1149 0.0383 **
0.1315 0.0396 ***
SpreadLarge
0.3550 0.0549 ***
0.3363 0.0554 *** Price -0.1809 0.0049 ***
-0.5410 0.1760 **
-0.4646 0.1765 **
Trade_size_ratio 9107.7994 293.3323 ***
5.6780 0.8323 ***
5.3891 0.8203 *** Total_value 0.1033 0.0023 ***
-0.0534 0.0248 *
-0.0658 0.0239 **
Mcap -0.1622 0.0054 *** Intercept 0.2277 0.0611 ***
2.1651 1.3127
3.5207 1.2992 **
Adj-R2 0.3326 0.3326 0.8307
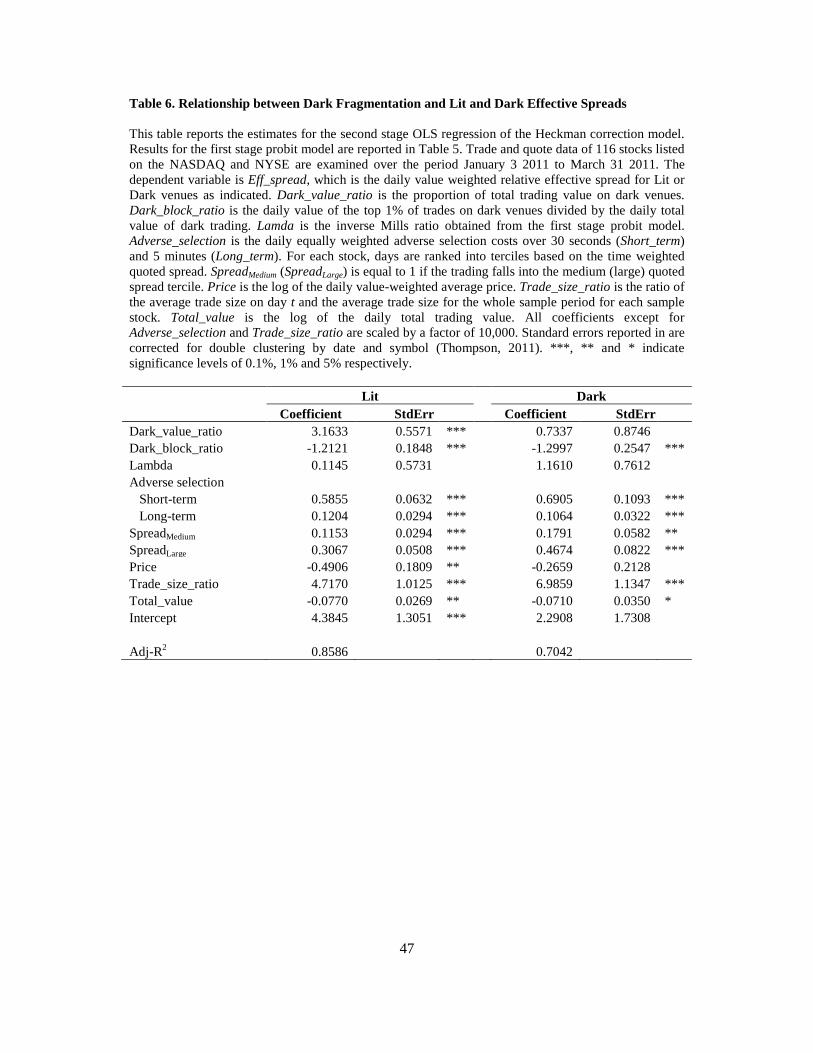
47
Table 6. Relationship between Dark Fragmentation and Lit and Dark Effective Spreads This table reports the estimates for the second stage OLS regression of the Heckman correction model. Results for the first stage probit model are reported in Table 5. Trade and quote data of 116 stocks listed on the NASDAQ and NYSE are examined over the period January 3 2011 to March 31 2011. The dependent variable is Eff_spread, which is the daily value weighted relative effective spread for Lit or Dark venues as indicated. Dark_value_ratio is the proportion of total trading value on dark venues. Dark_block_ratio is the daily value of the top 1% of trades on dark venues divided by the daily total value of dark trading. Lamda is the inverse Mills ratio obtained from the first stage probit model. Adverse_selection is the daily equally weighted adverse selection costs over 30 seconds (Short_term) and 5 minutes (Long_term). For each stock, days are ranked into terciles based on the time weighted quoted spread. SpreadMedium (SpreadLarge) is equal to 1 if the trading falls into the medium (large) quoted spread tercile. Price is the log of the daily value-weighted average price. Trade_size_ratio is the ratio of the average trade size on day t and the average trade size for the whole sample period for each sample stock. Total_value is the log of the daily total trading value. All coefficients except for Adverse_selection and Trade_size_ratio are scaled by a factor of 10,000. Standard errors reported in are corrected for double clustering by date and symbol (Thompson, 2011). ***, ** and * indicate significance levels of 0.1%, 1% and 5% respectively. Lit Dark Coefficient StdErr Coefficient StdErr Dark_value_ratio 3.1633 0.5571 ***
0.7337 0.8746
Dark_block_ratio -1.2121 0.1848 ***
-1.2997 0.2547 *** Lambda 0.1145 0.5731
1.1610 0.7612
Adverse selection Short-term 0.5855 0.0632 ***
0.6905 0.1093 ***
Long-term 0.1204 0.0294 ***
0.1064 0.0322 *** SpreadMedium 0.1153 0.0294 ***
0.1791 0.0582 **
SpreadLarge 0.3067 0.0508 ***
0.4674 0.0822 *** Price -0.4906 0.1809 **
-0.2659 0.2128
Trade_size_ratio 4.7170 1.0125 ***
6.9859 1.1347 *** Total_value -0.0770 0.0269 **
-0.0710 0.0350 *
Intercept 4.3845 1.3051 ***
2.2908 1.7308
Adj-R2 0.8586 0.7042
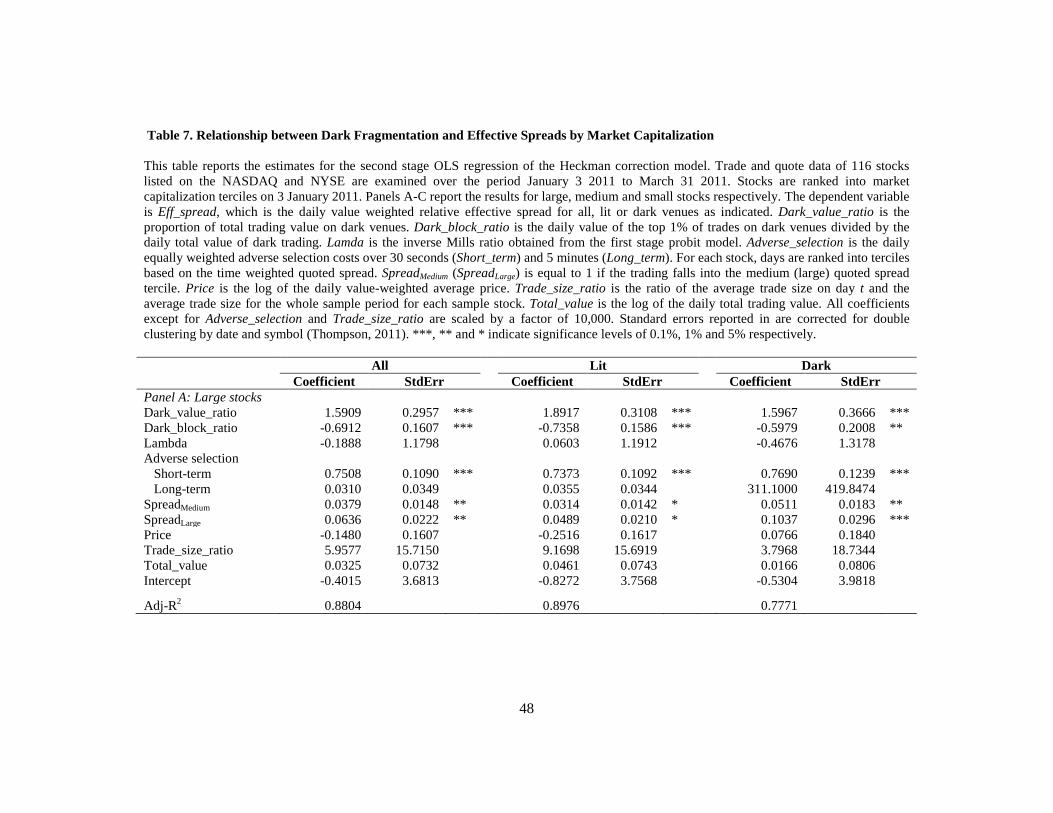
48
Table 7. Relationship between Dark Fragmentation and Effective Spreads by Market Capitalization This table reports the estimates for the second stage OLS regression of the Heckman correction model. Trade and quote data of 116 stocks listed on the NASDAQ and NYSE are examined over the period January 3 2011 to March 31 2011. Stocks are ranked into market capitalization terciles on 3 January 2011. Panels A-C report the results for large, medium and small stocks respectively. The dependent variable is Eff_spread, which is the daily value weighted relative effective spread for all, lit or dark venues as indicated. Dark_value_ratio is the proportion of total trading value on dark venues. Dark_block_ratio is the daily value of the top 1% of trades on dark venues divided by the daily total value of dark trading. Lamda is the inverse Mills ratio obtained from the first stage probit model. Adverse_selection is the daily equally weighted adverse selection costs over 30 seconds (Short_term) and 5 minutes (Long_term). For each stock, days are ranked into terciles based on the time weighted quoted spread. SpreadMedium (SpreadLarge) is equal to 1 if the trading falls into the medium (large) quoted spread tercile. Price is the log of the daily value-weighted average price. Trade_size_ratio is the ratio of the average trade size on day t and the average trade size for the whole sample period for each sample stock. Total_value is the log of the daily total trading value. All coefficients except for Adverse_selection and Trade_size_ratio are scaled by a factor of 10,000. Standard errors reported in are corrected for double clustering by date and symbol (Thompson, 2011). ***, ** and * indicate significance levels of 0.1%, 1% and 5% respectively. All Lit Dark Coefficient StdErr Coefficient StdErr Coefficient StdErr Panel A: Large stocks
Dark_value_ratio 1.5909 0.2957 ***
1.8917 0.3108 ***
1.5967 0.3666 *** Dark_block_ratio -0.6912 0.1607 ***
-0.7358 0.1586 ***
-0.5979 0.2008 **
Lambda -0.1888 1.1798
0.0603 1.1912
-0.4676 1.3178 Adverse selection
Short-term 0.7508 0.1090 ***
0.7373 0.1092 ***
0.7690 0.1239 *** Long-term 0.0310 0.0349
0.0355 0.0344
311.1000 419.8474
SpreadMedium 0.0379 0.0148 **
0.0314 0.0142 *
0.0511 0.0183 ** SpreadLarge 0.0636 0.0222 **
0.0489 0.0210 *
0.1037 0.0296 ***
Price -0.1480 0.1607
-0.2516 0.1617
0.0766 0.1840 Trade_size_ratio 5.9577 15.7150
9.1698 15.6919
3.7968 18.7344
Total_value 0.0325 0.0732
0.0461 0.0743
0.0166 0.0806 Intercept -0.4015 3.6813
-0.8272 3.7568
-0.5304 3.9818
Adj-R2 0.8804
0.8976
0.7771

49
Table 7 – Continued All Lit Dark Coefficient StdErr Coefficient StdErr Coefficient StdErr Panel B: Medium stocks Dark_value_ratio 2.1603 0.5301 ***
2.5121 0.5166 ***
1.7025 0.6700 **
Dark_block_ratio -0.8327 0.1603 ***
-0.7672 0.1523 ***
-0.9108 0.2496 *** Lambda 1.6474 1.3643
1.5067 1.3454
2.8685 1.4922 *
Adverse selection Short-term 0.6680 0.0884 ***
0.6636 0.0856 ***
0.7134 0.1161 ***
Long-term 0.0605 0.0377
0.0567 0.0355
0.0701 0.0478 SpreadMedium 0.0507 0.0306
0.0513 0.0276 *
0.0718 0.0449
SpreadLarge 0.1952 0.0619 **
0.1858 0.0621 **
0.2799 0.0790 *** Price -0.5252 0.2829 *
-0.6208 0.2828 *
-0.3404 0.3191
Trade_size_ratio 6.2669 1.6672 ***
6.1329 1.6676 ***
7.8796 1.9509 *** Total_value 0.1254 0.1376
0.1229 0.1365
0.1749 0.1517
Intercept -4.1432 5.4282
-3.5708 5.3539
-8.1373 5.9377
Adj-R 0.6919
0.7308
0.4844
Panel C: Small stocks Dark_value_ratio 0.6699 1.0630
1.5878 0.6340 **
-2.5489 1.5425
Dark_block_ratio -1.2064 0.2909 ***
-0.9218 0.2899 **
-0.7089 0.4774 Lambda -2.1365 1.2703
-3.9532 1.5722 **
-0.8272 1.9461
Adverse selection Short-term 0.5781 0.0754 ***
0.5987 0.0745 ***
0.6129 0.1277 ***
Long-term 0.1242 0.0355 ***
0.1355 0.0369 ***
0.1042 0.0338 ** SpreadMedium 0.3606 0.1273 **
0.3031 0.0843 ***
0.4934 0.1852 **
SpreadLarge 0.8562 0.1488 ***
0.7613 0.1272 ***
1.1959 0.2033 *** Price -0.2030 0.3801
0.1256 0.5133
0.1881 0.5652
Trade_size_ratio 3.6615 1.1551 **
1.9268 1.6965
4.9984 1.7397 ** Total_value -0.3453 0.1114 **
-0.4632 0.1468 **
-0.3856 0.1653 *
Intercept 14.7000 4.2134 ***
19.2000 5.1903 ***
13.8000 6.1273 *
Adj-R2 0.6615 0.7094 0.5054

50
Table 8. Relationship between Dark Fragmentation and Price Efficiency This table reports the estimates for the OLS regression of the variance ratio on Dark fragmentation. Trade and quote data of 116 stocks listed on the NASDAQ and NYSE are examined over the period January 3 2011 to March 31 2011. Stocks are ranked into market capitalization terciles on 3 January 2011. The dependent variable is the variance ratio from Lo and MacKinlay (1988):
𝑉𝑎𝑟𝑖𝑎𝑛𝑐𝑒 𝑟𝑎𝑡𝑖𝑜 = �1 − 𝜎𝑠ℎ𝑜𝑟𝑡2
1𝑛 𝜎𝑙𝑜𝑛𝑔
2 �
where 𝜎𝑠ℎ𝑜𝑟𝑡2 (𝜎𝑙𝑜𝑛𝑔2 ) are return variances measured over short (long) intervals and n is the ratio between the long and short interval length. Short/Long intervals are indicated in the column titles and are expressed in seconds. Dark_value_ratio is the proportion of total trading value on dark venues. Dark_block_ratio is the daily value of the top 1% of trades on dark venues divided by the daily total value of dark trading. Adverse_selection is the daily equally weighted adverse selection costs over 30 seconds (Short_term) and 5 minutes (Long_term). For each stock, days are ranked into terciles based on the time weighted quoted spread. SpreadMedium (SpreadLarge) is equal to 1 if the trading falls into the medium (large) quoted spread tercile. Trade_size_ratio is the ratio of the average trade size on day t and the average trade size for the whole sample period for each sample stock. Total_value is the log of the daily total trading value. Standard errors reported in are corrected for double clustering by date and symbol (Thompson, 2011). ***, ** and * indicate significance levels of 0.1%, 1% and 5% respectively. 60/600 60/1800 300/900 300/1800 Coefficient StdErr Coefficient StdErr Coefficient StdErr Coefficient StdErr Panel A: Full sample Dark_value_ratio 0.2348 0.0980 ** 0.4232 0.1987 * 0.1443 0.0593 ** 0.2726 0.1388 * Dark_block_ratio -0.1207 0.0509 ** -0.1811 0.1207 -0.0436 0.0328 -0.0853 0.0817 Adverse selection Short-term 363.33 99.578 *** 794.41 269.44 ** 201.81 70.960 ** 367.59 135.59 ** Long-term -487.07 53.149 *** -1095.32 161.51 *** -192.45 47.739 *** -429.58 88.110 *** SpreadMedium 0.0048 0.0138 -0.0056 0.0298 -0.0229 0.0109 * -0.0153 0.0221 SpreadLarge 0.0268 0.0155 * 0.0518 0.0334 -0.0239 0.0137 * 0.0049 0.0199 Trade_size_ratio 6986 1238 *** 12814 2553 *** 960 476 * 2819 784 *** Total_value -0.0102 0.0026 *** -0.0175 0.0051 *** -0.0008 0.0017 -0.0017 0.0027 Intercept 0.6796 0.0938 *** 1.2450 0.1973 *** 0.3353 0.0629 *** 0.5764 0.0978 ***
Adj-R2 0.0723 0.0480 0.0061 0.0072
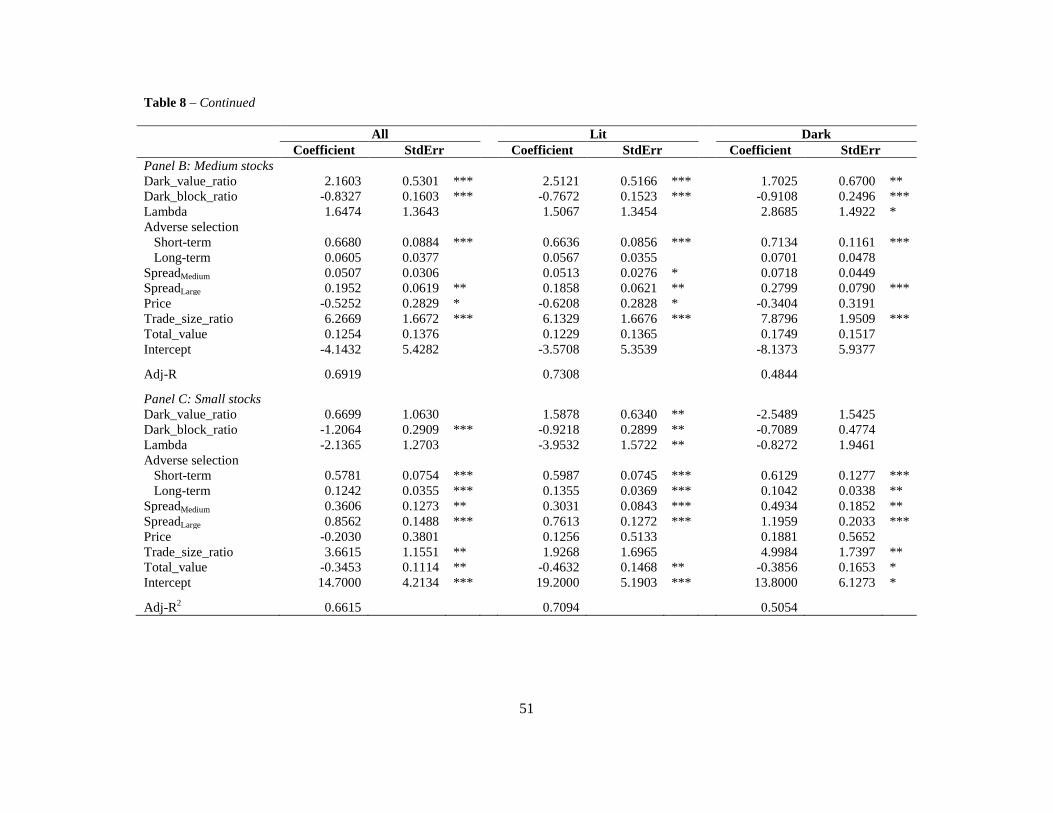
51
Table 8 – Continued All Lit Dark Coefficient StdErr Coefficient StdErr Coefficient StdErr Panel B: Medium stocks Dark_value_ratio 2.1603 0.5301 ***
2.5121 0.5166 ***
1.7025 0.6700 **
Dark_block_ratio -0.8327 0.1603 ***
-0.7672 0.1523 ***
-0.9108 0.2496 *** Lambda 1.6474 1.3643
1.5067 1.3454
2.8685 1.4922 *
Adverse selection Short-term 0.6680 0.0884 ***
0.6636 0.0856 ***
0.7134 0.1161 ***
Long-term 0.0605 0.0377
0.0567 0.0355
0.0701 0.0478 SpreadMedium 0.0507 0.0306
0.0513 0.0276 *
0.0718 0.0449
SpreadLarge 0.1952 0.0619 **
0.1858 0.0621 **
0.2799 0.0790 *** Price -0.5252 0.2829 *
-0.6208 0.2828 *
-0.3404 0.3191
Trade_size_ratio 6.2669 1.6672 ***
6.1329 1.6676 ***
7.8796 1.9509 *** Total_value 0.1254 0.1376
0.1229 0.1365
0.1749 0.1517
Intercept -4.1432 5.4282
-3.5708 5.3539
-8.1373 5.9377
Adj-R 0.6919
0.7308
0.4844
Panel C: Small stocks Dark_value_ratio 0.6699 1.0630
1.5878 0.6340 **
-2.5489 1.5425
Dark_block_ratio -1.2064 0.2909 ***
-0.9218 0.2899 **
-0.7089 0.4774 Lambda -2.1365 1.2703
-3.9532 1.5722 **
-0.8272 1.9461
Adverse selection Short-term 0.5781 0.0754 ***
0.5987 0.0745 ***
0.6129 0.1277 ***
Long-term 0.1242 0.0355 ***
0.1355 0.0369 ***
0.1042 0.0338 ** SpreadMedium 0.3606 0.1273 **
0.3031 0.0843 ***
0.4934 0.1852 **
SpreadLarge 0.8562 0.1488 ***
0.7613 0.1272 ***
1.1959 0.2033 *** Price -0.2030 0.3801
0.1256 0.5133
0.1881 0.5652
Trade_size_ratio 3.6615 1.1551 **
1.9268 1.6965
4.9984 1.7397 ** Total_value -0.3453 0.1114 **
-0.4632 0.1468 **
-0.3856 0.1653 *
Intercept 14.7000 4.2134 ***
19.2000 5.1903 ***
13.8000 6.1273 *
Adj-R2 0.6615 0.7094 0.5054

52
Table 9. Dark Fragmentation and Effective Spreads Estimated by a 2SLS Instrumental Variables Model This table reports the results based on a 2SLS instrumental variable framework to examine the relationship between Dark fragmentation and effective spreads. Trade and quote data of 116 stocks listed on the NASDAQ and NYSE are examined over the period January 3 2011 to March 31 2011. Stocks are ranked into market capitalization terciles on 3 January 2011. We use Dark_size_ratio to instrument for Dark_value_ratio. The instrumented variable is then used in the second-stage regression reported here. The dependent variable is Eff_spread, which is the daily value weighted relative effective spread for all, Lit or Dark venues as indicated. Dark_value_ratio is the proportion of total trading value on Dark venues. Dark_block_ratio is the daily value of the top 1% of trades on dark venues divided by the daily total value of dark trading. Lamda is the inverse Mills ratio obtained from the first stage probit model. Adverse_selection is the daily equally weighted adverse selection costs over 30 seconds (Short_term) and 5 minutes (Long_term). For each stock, days are ranked into terciles based on the time weighted quoted spread. SpreadMedium (SpreadLarge) is equal to 1 if the trading falls into the medium (large) quoted spread tercile. Price is the log of the daily value-weighted average price. Trade_size_ratio is the ratio of the average trade size on day t and the average trade size for the whole sample period for each sample stock. Total_value is the log of the daily total trading value. All coefficients except for Adverse_selection and Trade_size_ratio are scaled by a factor of 10,000. Standard errors reported in are corrected for double clustering by date and symbol (Thompson, 2011). ***, ** and * indicate significance levels of 0.1%, 1% and 5% respectively. Coefficient StdErr Dark_value_ratio (IV) 3.9350 0.6677 *** Dark_block_ratio -2.0137 0.4451 *** Lambda -0.0420 0.6214 Adverse selection Short-term 0.5892 0.0664 *** Long-term 0.1181 0.0287 *** SpreadMedium 0.1314 0.0413 *** SpreadLarge 0.3138 0.0602 *** Price -0.5007 0.1884 ** Trade_size_ratio 5.6274 0.8717 *** Total_value -0.0632 0.0259 ** Intercept 4.0919 1.3391 **
Adj-R2 0.8277

53
Table 10. HFT Activity and the Relationship between Dark Fragmentation and Effective Spreads This table reports the estimates for the two stage Heckman correction model as in Table 5, Model 3. Additional variables representing trading activities of HFTs on NASDAQ are incorporated. Transactions of the 21 most active HFT firms on the NASDAQ market are identified. HFTMake (HFTTake) is the ratio of the value of transactions in which an HFT provides (takes) liquidity and the total trading value on NASDAQ. HFTAll is the ratio of, the sum of the value of transactions in which an HFT provides the liquidity and the value of transactions in which an HFT takes the liquidity, to the total trading value on NASDAQ. All other variables are defined as in Table 5 Model 3. The sample data exclude Lit transactions that are not executed on NASDAQ. All coefficients except for Adverse_selection and Trade_size_ratio are scaled by a factor of 10,000. ***, ** and * indicate significance levels of 1%, 5% and 10% respectively.
Model 1 Model 2 Model 3 Coefficient StdErr Coefficient StdErr Coefficient StdErr
HFTdAll
-2.2746 0.5912 *** HFTdMake
-0.1601 0.6654
HFTdTake
-1.7635 0.3753 *** Dark_value_ratio 0.8070 0.4955 *
0.7723 0.4584 **
0.7585 0.4635 *
Dark_block_ratio -1.8207 0.3872 ***
-2.0315 0.3955 ***
-1.9884 0.3792 *** Lambda -5.2877 2.8103 **
-3.7453 2.8802 *
-3.8483 2.8627 *
Adverse selection Short-term 0.9477 0.1838 ***
0.8773 0.1880 ***
0.8844 0.1866 ***
Long-term 0.0471 0.0233 **
0.0375 0.0234 *
0.0342 0.0235 * SpreadMedium 0.2040 0.0419 ***
0.2485 0.0432 ***
0.2558 0.0419 ***
SpreadLarge 0.4741 0.0696 ***
0.5533 0.0742 ***
0.5747 0.0732 *** Price 0.3928 0.5023
0.1848 0.5196
0.3228 0.5545
Trade_size_ratio 1.4756 0.4744 ***
1.6476 0.4665 ***
1.5887 0.4612 *** Total_value -0.1796 0.0430 ***
-0.1296 0.0445 ***
-0.1528 0.0495 ***
Intercept 8.4987 1.6204 ***
7.4915 1.6005 ***
7.8264 1.6093 ***
Adj-R2 0.75
0.76
0.77

54
Appendices
The appendices accompany this paper are available at http://www.cmcrc.com