sanctuary markets and antidumping: an empirical analysis...
TRANSCRIPT

1
Sanctuary Markets and Antidumping:
An Empirical Analysis of U.S. Exporters
Abstract Antidumping proponents in the U.S. often argue that foreign firms use profits obtained behind home market barriers to “subsidize” “unfair” pricing abroad. This paper examines this “sanctuary market” hypothesis for antidumping petitions against U.S. manufacturing exporters. Econometric results suggest that there is little evidence that U.S. manufacturing firms facing antidumping actions abroad are beneficiaries of a home market sanctuary during the 1994-2007 time period. Instead, U.S. firms in capital-intensive sectors that are successful exporters are more likely to face antidumping petitions abroad. This evidence suggests that current antidumping rules need reform so that firms not benefitting from sanctuary markers may avoid antidumping actions.
Michael Moore Department of Economics/Elliott School
Institute for International Economic Policy George Washington University
Email: [email protected]
20 March 2013
Acknowledgements: I would like to thank Anna Hershberger and Misato Sato for invaluable research assistance and the GW-Center for International Business Education and Research for financial support of this study. Chad Bown’s efforts to create an international database of antidumping actions were essential for this project as well.
2
Introduction
Proponents of antidumping duty procedures have pointed to a number of justifications for
their inclusion in the World Trade Organization (WTO) system. Chief among them is the
long-standing “sanctuary market” hypothesis. The basic idea is that formal and informal
barriers to competition in the home market will result in excessive profits that in turn
allow an exporting firm to price “unfairly” in foreign markets and thereby lead to
material injury to domestic firms in the importing country. This behavior, so the
argument goes, is a justification for antidumping procedures as allowed under Article VI
of the General Agreement on Tariffs and Trade.
This argument is heard especially often in the United States where support for
antidumping procedures traditionally has been very strong. Many commentators in the
1980s, for example, accused the Japanese government of turning a blind eye towards
anti-competitive actions of domestic firms, which in turned allegedly allowed these firms
to take market share away from U.S. companies that were operating in a highly
competitive domestic market that was subject to vigorous anti-trust enforcement. In the
1980s, the U.S. steel industry and its allies argued that much of the import competition it
faced was “subsidized” by market sanctuaries in Japan and Europe (Howell, et al, 1988).
The American Iron and Steel Institute continues to argue that U.S. steel makers “cannot
compete against foreign governments that do not abide by international trade rules.”1
The sanctuary market argument often plays a very important role in the U.S.
government’s justification for resisting significant WTO antidumping reform. Members
1American Iron and Steel Institute (http://www.steel.org/en/Public%20Policy/Trade.aspx) Accessed on December 13, 2012.

3
of Congress and import competing industries refer to the market sanctuary argument as a
fundamental problem in the international trading system that justifies the continued and
largely unreformed antidumping system currently in place. In recent years, official U.S.
negotiating positions in the Doha Round of WTO negotiations also refer to sanctuary
arguments as a primary basis for the existence of antidumping rules in the international
trading system.
For example, the U.S. government formally submitted a paper to the WTO that
outlined its view of the “basic concepts” behind antidumping in the international trading
system:
[K]ey aspects of the economic system supported by government inaction can enable injurious dumping to take place… For instance, these policies may allow producers to earn high profits in a home "sanctuary market," which may in turn allow them to sell abroad at an artificially low price. Such practices can result in injury in the importing country since domestic firms may not be able to match the artificially low prices from producers in the sanctuary market. (U.S., 2002)
Greg Mastel, a former senior staff member on the Senate Finance Committee,
with principal jurisdiction over international trade, and a prominent U.S. supporter of
antidumping published a book in 1998 that contained some of the major arguments in
favor of the procedure. For example, he contends that high import barriers play a critical
role in antidumping initiations:
[The] high correlation between antidumping complaints and closed home markets is more than coincidence. A closed market allows companies to charge high prices at home because they face no foreign competition. Foreign companies can use the profits from these domestic sales to cross-subsidize export sales at dumped prices. (Mastel, p. 41, 1998)

4
Despite the frequency of such arguments, no systematic effort has ever been made
to assess whether there is any evidence that exporters that benefit from sanctuary markets
are more likely to face dumping allegations under the trade remedy laws. This lack of
research in part reflects the fact that the GATT agreements have never required evidence
of uncompetitive domestic market structure as part of an antidumping action. Instead,
governments need only show that imports are “dumped” (either sold below home market
prices or below production costs) and that those imports cause “material injury” to the
import-competing domestic industry. In short, evidence about a “market sanctuary” is
simply irrelevant to antidumping procedures in practice.
Another reason for the lack of study is that one must get detailed information
about the structure of the exporting country industries in order to assess these arguments,
data that are often difficult to obtain. Moreover, antidumping advocates in the U.S., for
example, may not feel that detailed official Japanese or Chinese industrial data are
reliable in any event. Even if one were to try to examine a wide variety of exporters into
the U.S., domestic data would be gathered using different methodologies in various
countries. Thus, it would be difficult to examine U.S. antidumping actions that involved
tens of exporting countries around the world.
This research will examine whether there is any evidence that exporting industries
with features consistent with the market sanctuary hypothesis are more likely to face
antidumping petitions than other industries. In order to avoid some of the problems
noted above, I will examine the experience of U.S. exporters in the antidumping process
in other countries.

5
This approach has a number of advantages. The first is that examining only one
exporting country will assure a consistent methodology for any official statistics used in
the study. The second is that most analysts consider official U.S. data to be reasonably
reliable or at least not systematically biased. Thirdly, the results of the study may have
particular relevance to antidumping proponents in the U.S. who would be familiar with
industrial structure and government policy in their own market. Finally, the now widely
acknowledged spread of antidumping actions to many jurisdictions means that
understanding the determinants of antidumping petitions against U.S. exporters will have
particular relevance to U.S. policy-makers.
There is a wide range of U.S. exporters that have been caught up in antidumping
actions abroad. Familiar large companies such as AK Steel, Brystol-Meyer-Squib, Dow
Chemicals, Whirlpool, Amana, and Duracell show up among the cases compiled by
Bown (2012). But one also finds smaller firms such as Firestone Building Products,
Roosevelt Paper Company, and Daramic as well as agricultural producers like
Georgetown Farmers Elevator, Ruskin Vegetable Corporation, and Northern Beef
Industries. The picture is further complicated by the presence of foreign firms producing
in the U.S. and that export to third markers, e.g. Bayer Chemical, Matsushita, and
Formosa Plastics.
Table 1 includes some basic information about antidumping actions targeting U.S.
exporters from 1978 through 2010.2 Note that this table only includes petitions initiated
and does not include information on products for which there are final antidumping
duties were imposed. We see that there have been individual 382 petitions brought
2 This information is based on Bown (2012).

6
against U.S. exporting firms by importing country governments for the entire period.
NAFTA partners Mexico and Canada are the most frequent initiators of antidumping
actions against U.S. companies for the entire period with 79 and 67 petitions,
respectively, followed by Brazil (42 cases), and India (34 cases) and China (32 cases).
One notable aspect of this information is how the countries targeting U.S. firms have
changed over the last few decades. In the earlier period of 1978-1992, the total number
of antidumping actions against U.S. exporters by three traditional users (Canada,
Australia, and the EU) equaled all other nations in the world combined (60 vs. 61
petitions). For the 1993-2003 period, the new users initiated antidumping actions against
U.S. firms 3.5 times as many as traditional users (140 vs. 40). In the 2004-2010 time
frame, this ratio had risen to over 4 (65 vs. 16).
From 1978 through 1992, Canada and Mexico were the most active nations filing
antidumping petitions against U.S. firms; Brazil, India, and China rarely initiated
antidumping actions against the U.S. (or against any other countries’ firms for that
matter). From 2004 through 2010, these three emerging markets targeted U.S. firms far
more frequently. China’s increased activity is particularly notable. This increased use of
antidumping by three of the “BRIC” countries (with only Russia not represented) should
cause concern among U.S. multinational companies and U.S. policymakers about
possible increased restrictions to American exports.
The basic approach of this study is to combine variables identified in the existing
literature on determinants of antidumping petitions with regressors consistent with the
market sanctuary hypothesis. The econometric model is based on work by Moore and
Zanardi (2011), who estimate the probability of observing a new antidumping petition
7
based on country-industry pairs and control for imports, a number of macroeconomic
conditions, and reactions against other countries’ antidumping actions. The current work
will expand on that study by including detailed industry information available from the
U.S. Commerce’s Census of Manufacturing. These latter variables (all at the six digit
North American Industrial Classification Schedule (NAICS) code level) will include
standard measures of industrial concentration, measures of high entry and exit costs in the
industry, and U.S. sectoral tariffs.
The time period analyzed in the formal empirical work will be from 1994 through
2007. This beginning date coincides the start of WTO antidumping rules as part of the
Uruguay Round negotiations completed in 1994. The latter date reflects a decision not to
include the impact of the financial crisis that began in 2008. Note that the analyzed
period will include a large majority of cases brought against the U.S. as well as the
actions of some of the new users of antidumping.
The null hypothesis for the research is that trade flows and macro conditions will
play an important role in explaining filings against U.S. exporters but that variables
consistent with the sanctuary market argument (e.g. U.S. applied tariffs that restrict
foreign imports, high entry costs, and measures of sectoral competitiveness) will also
help predict antidumping petitions. Econometric evidence consistent with this hypothesis
would be supportive of the view that antidumping procedures were working as intended
by U.S. supporters. If these market sanctuary regressors are not helpful in predicting
antidumping petitions, then one could argue that, at least for U.S. exporters, antidumping
measures are not directed at industries that plausibly use excessive domestic profits to
price aggressively abroad. Instead, antidumping actions against U.S. firms could be

8
interpreted as mere protectionism and which may undercut the argument that
antidumping solely targets “unfair” trade.
The rest of the paper is organized in the following way. Section 1 includes a brief
literature review and a short analysis of the market sanctuary argument. Section 2 lays
out some of the basic statistics and patterns of antidumping actions taken against U.S.
exporters. This section also will include a brief analysis of descriptive statistics that hint
towards whether there is evidence in favor of the market sanctuary (MS) hypothesis.
Section 3 includes a brief discussion about econometric methodology and construction of
the data. I will discuss the econometric results in Section 4 and offer some policy
implications and suggestions for further research in the conclusion.
I. Literature Review
Analysis of antidumping has taken a prominent place in the study of international
trade policy in recent decades. This reflects its role as one of the most frequently used
measures to restrict imports in first the GATT and now WTO systems. Moreover,
antidumping use has expanded across a great many new nations in recent decades, an
expansion that has been documented and analyzed by many authors, e.g. Miranda et al.
(1998), Prusa (2001), Zanardi (2004) and the various authors in Bown (2011). In
addition, study of antidumping actions is important since they represent allowed
exceptions to some of the most important WTO principles: most-favored-nation (MFN),
national treatment, and bound tariffs.3
3 MFN is violated since different countries’ exporters face tariffs. National treatment is violated since pricing behavior acceptable by domestic firms (differential pricing across regions) is punished if undertaken by foreigners. Antidumping duties are in addition to
9
The literature on antidumping has focused on many different aspects of its use
both from a theoretical and empirical angle. (See Prusa and Blonigen (2003) for a useful
survey.) In recent years, authors have begun to analyze determinants of initiations of
antidumping, both in the United States and increasingly among the new users of
antidumping in the developing world such as India, Brazil, South Africa and Turkey.4
As noted above, very little work has been done on determinants of cases initiated
against U.S. exporters, especially compared to the large number of cases focused on
determinants of U.S. actions against foreigners. The most notable example of formal
empirical analysis of actions taken against U.S. firms is Feinberg and Reynolds (2008).
They control for standard measures such as trade volume, exchange rates, and
macroeconomic conditions. But they focus most importantly on whether U.S. exporters
are more likely to face antidumping actions abroad as a result of U.S. actions against
importers. They do indeed find evidence of such retaliation, especially at the national
level.
This study builds upon this earlier work on antidumping initiations but focuses on
a new issue-----evidence about the market sanctuary hypothesis, which has not been
formally studied in the literature.
A very simple partial equilibrium version of the argument is illustrated in Figure
1. Suppose that a U.S. firm has a monopoly position in its home market in good x and
that domestic demand is linear. In the absence of sales abroad, domestic demand (D) is
those negotiated in multilateral trade negotiations so that bound tariff commitments are violated. 4 See for example, Bown (2011), Prusa and Skeath (2004), Bown and Blonigen, Bown and Crowley (2007), Moore and Zanardi (2009), and Feinberg and Reynolds (2006).

10
insufficient for the monopoly to have positive profits: output is at Q1 with average total
cost (ATC1) above the associated domestic price. Now assume that the domestic
monopolist gains access to the world market where it can sell for Pw. For simplicity and
without loss of generality, the U.S. firm is assumed small in international markets.
At this price, the U.S. firm equates marginal revenue across markets and now
produces Q3 for the domestic market and Q2-Q3 for the international market. Note that
the expansion of production to Q2 from Q1 results in lower domestic average total costs,
now at ATC2. The U.S. firm now earns C at home and loses E on international sales. If
area C is larger than E, then the U.S. firm would be able to operate profitably overall
even though it incurs negative profits on export sales.
Note as well that the U.S. firm is “dumping” by international standards. On the
one hand, it is now selling abroad at a price below its average cost of production
(i.e., Pw < AC2).5 In addition, it is practicing international price discrimination by
selling at home (P2) above what it charges abroad (Pw). Clearly, this state of affairs
would not be able to continue if international arbitrage was at play. Arbitragers would
have an incentive to buy internationally acquired goods and sell them into the U.S.
market.
This situation is exactly what lies at the heart of those who argue that dumping is
caused by firm’s operating from a “market sanctuary.” In particular, they argue that
formal or informal barriers prevent such arbitrage from occurring.
5 Pricing below marginal cost is not the standard in international trade agreements on dumping. Instead, pricing below production costs, typically below average total costs in practice, is considered dumping.

11
It is important to make two further points about the economic analysis embodied
in Figure 1. First, this example requires that there is substantial monopoly power in the
domestic market so that extra-normal profits can exist. Secondly, this strategy presumes
that the firm can lower its costs by expanding production, i.e., it is operating where
average costs are decreasing. Without this provision, expanding production through
exports when average costs are rising will not yield profits where none existed before.
I will use this simple analysis to examine evidence of the market sanctuary
hypothesis for U.S. exporters. I will control for: 1) monopolistic power in the domestic
market; 2) high (formal) U.S. barriers to international arbitrage; and 3) high fixed costs,
that would be associated with possible declining average costs. It is important to note
that without these characteristics, the MS strategy would be very difficult to implement.
One important caveat: firms with high fixed costs may continue to produce in the face of
a negative demand shock. This will increase the chance that they produce below average
total cost but need not reflect operating behind a sanctuary domestic market; it simply
might make sense to continue to produce and export.
II. Descriptive Statistics
Table 2 includes a breakdown of antidumping initiations facing U.S. exporters as
well as all other countries for the 1978 to 2010 period. As noted above, we see that there
were 382 petitions initiated against U.S. firms compared to a world total of 5,763. This
means that U.S. exporters faced antidumping actions in 6.6 percent of all cases
internationally from 1978 to 2010. To put this in some perspective, U.S. merchandising
exports in 2008 equaled 8.3 percent of world trade. (WTO World Trade Report, 2009).
12
China, on the other hand, was the target of 943 antidumping petitions for the period (or
16.4 percent of the total) although its 2008 world trade share was only 9.1 percent. The
high frequency of antidumping actins against China is of course a reflection of its
explosive growth in world trade in recent years. The authors in Bown (20111) make
clear that countries across the world have focused even more intensely on China over the
last decade. Other important antidumping targets include Japan (325), India (170), and
Brazil (185 cases).
These figures suggest that the U.S. exporters face antidumping petitions more or
less in line with its share of world merchandising trade. The data also make clear that
U.S. firms have been frequent targets of antidumping.
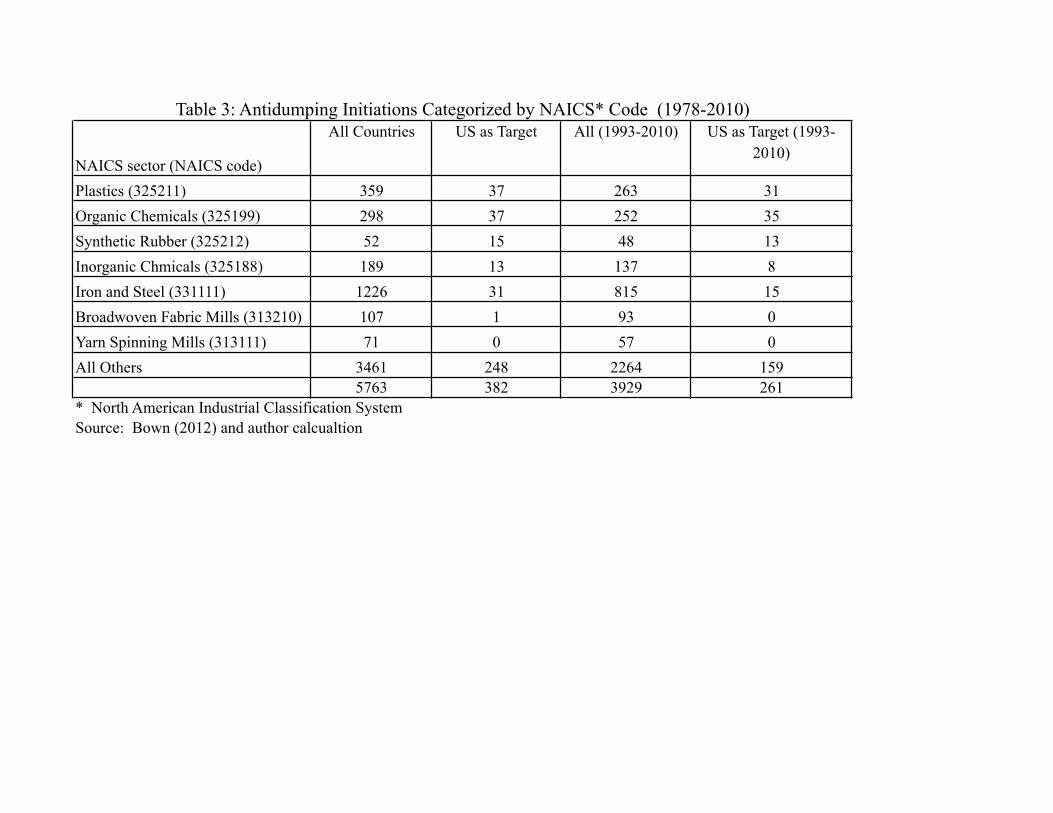
Table 3 includes a breakdown of antidumping initiations by major product
categories based on the 6-digit North American Industrial Classification System
(NAICS), which is a level of aggregation more or less similar to the ISIC 4-digit level.
The table includes information when U.S. firms are a target and separate data for non-
U.S. exporters.
I use the NAICS system in order to exploit later the detailed information about
U.S. international market structure. The NAICS codes were obtained by manually
comparing each product name with the U.S. definitions of products on the U.S. Census
Bureau website (http://www.census.gov/eos/www/naics). In addition, the Harmonized
Tariff System code for each case, compiled by Bown (2012) provided further
corroboration for the candidate NAICS code. In cases where the NAICS code was
unclear, the petition is characterized as in the “All Others” category.

13
Antidumping cases targeting U.S. exporters are concentrated in the petrochemical
industry, broadly defined. Petitions in the plastics (NAICS 325211), organic chemicals
(NAICS 325199), synthetic rubber (NAICS 325212), and inorganic chemicals (NAICS
325188) sectors represented 26.7 percent of all cases (102 out of 382 total) brought
against U.S. firms for the 1978-2010 period. This percentage rose to 33.3 percent for the
1993-2010 time frame. The comparable figures for all countries, including the U.S., were
15.6 percent (898 of 5763) and 17.8 (700 of 3929) percent for the two periods,
respectively. For all countries, the iron and steel sector (NAICS 33111), which includes
basic steel products such as hot-rolled sheet and steel products such as ball bearings, is by
far the most commonly targeted sector with 21.3 percent in the earlier period and 20.7
percent in the latter. (Note that this reflects in part the frequent targeting of steel
exporters in U.S antidumping cases.)
This variation across sectors for the U.S. and non-U.S. exports suggests the
possibility of different driving factors. Some of it certainly reflects the patterns of U.S.
exports; the U.S. steel industry has a much less important presence abroad than does the
globally competitive U.S. chemicals industry. But the steel and chemicals sectors also
share one important characteristic; they are both relatively capital intensive sectors with
large fixed costs. As such they may be subject to selling below average total costs in
economic downturns with the possibility of accusations of dumping. This feature also is
one of the important aspects of the market sanctuary hypothesis.
Table 4 includes various measures for capital intensity and fixed costs for overall
manufacturing and for the U.S. manufacturing sectors most frequently cited in foreign
antidumping actions.

14
The measures for the NAICS sectors include the “capital-labor ratio” in Column
1, defined as the reported book value (in thousands of U.S. dollars) divided by the total
number of employees of all firms in 1997, and the “capital-shipment ratio” in Column 2,
defined as book value divided by the three year shipment value (for years t-2, t-1, and t).
The book value and employment of industrial sectors are collected by the U.S. Census
every five years from individual firms; NAICS sector domestic shipments are available
every year.
We see that the average capital-labor ratios for all US. manufacturing sectors was
104 compared to 611 for the plastics sector, 503 for organic chemicals and 253 for the
iron and steel sector. We see similar patterns for the ratio of capital stock to shipments
with an average of 0.39 for all industries in the sample compared to 0.84 for organic
chemicals, 0.84 for plastics, 0.68 for synthetic rubber, and 0.65 for iron and steel.
In short, we find that U.S. sectors that face the most antidumping actions abroad
have higher capital stocks and higher fixed costs of production than average
manufacturing, all of which may make them more susceptible to pricing below average
total costs with negative demand shocks. These are all consistent with some aspects of
the market sanctuary argument but are not sufficient to show that such behavior is taking
place. We turn now to two further important aspects of the market sanctuary argument:
1) the presence of non-competitive domestic markets; and 2) high trade barriers that
restrict international arbitrage.
I measure the competitiveness of the U.S. market by the standard Herfindahl
Hirschman Index (HHI), which is the sum of the market shares of top firms in a particular
sector. The U.S. Department of Justice considers an HHI between 1500 and 2500 to be a
15
moderately concentrated industry, with the potential for anticompetitive behavior
increasing as the HHI value increases.6 Column 3 of Table 4 shows the HHI calculated
on the basis of value added for the top 50 firms in the sector. The average for the 1997
Census of Manufacturing for all industries for which the HHI can be calculated7 equals
763 compared to 333 for plastics, 237 for organic chemicals, 654 for organic and
inorganic chemicals. Only synthetic rubber among the frequent U.S. antidumping
exporter targets has an HHI that comes close to the overall manufacturing average (725).
These figures do not suggest that U.S. industries frequently facing antidumping petitions
in export markets are less competitive than average; the HHI for them is far below what
the U.S. Department of Justice would deem to be problematic.8 Columns 4 and 5 display
the HHI based on the 2002 and 2007 Census of Manufacturing. The broad picture
remains the same though the U.S. steel sector become much more concentrated.
The share of sector value-added by the top four firms is an alternative measure of
industry concentration. Column 6 of Table 4 once again suggests that these four
manufacturing sectors are not particularly less competitive than the U.S. manufacturing
sector as a whole. It is important to note that an HHI calculated for individual products
within these categories may be much higher and reflect a potential for market power.
More disaggregated data are not available on a systematic basis.
6 See http://www.usdoj.gov/atr/public/testimony/hhi.htm. Accessed on 3 September 2012. 7 A small number of sectors have less than 50 firms in the 6 digit NAICS category; the HHI-50 for these sectors cannot be calculated. 8 These patterns are qualitatively identical if the HH index is calculated on the basis of firm shipments. In fact, there is even less evidence of important market concentration based on that measure.

16
We also see little evidence that these U.S. sectors are protected by tariffs higher
than normal in the relatively open U.S. economy. Column 7 of Table 4 includes the
average sectoral applied most-favored-nation tariff rates9 for these sectors as well as the
overall manufacturing sector for the period 1993-2004 (which is based on Nicita and
Olarreaga (2007) for ISIC categories). One sees that the unweighted manufacturing
sector average tariff of 4.73 percent is higher than any of the five sectoral averages for
U.S. industries especially targeted by foreign governments in antidumping actions. It is
important to note that these averages do not reflect any non-tariff barriers such as quotas,
import licenses, or invisible import restrictions.10
There is little evidence from tariffs alone that firms in these sectors are able to
operate within a protected U.S. market that allows them to “subsidize” low sales abroad
from excess profits at home.
The evidence presented in this section is generally not supportive of the market
sanctuary hypothesis for four U.S. industries most frequently accused of dumping in
foreign markets. We do see convincing and consistent evidence that the U.S. plastics,
chemicals, and synthetic rubber industries are capital intensive and have high fixed costs
relative to national manufacturing averages. These results are consistent with one
important aspect of the market sanctuary hypothesis, to wit, firms with high capital and
fixed costs might have an incentive to expand production in a downturn by turning to an
9 These figures do not reflect preferential trade agreement rates or unilateral preferences, so that these averages are an upper bound of the protection these sectors receive. 10 There may be product level variation within these sectors that reflect more protection than evident from the broad sectoral averages. Bown (2012) reports the HS codes for all antidumping cases brought against U.S. The simple unweighted average applied tariff for these categories was 4.3 percent as of March 2013, which is similar to the overall tariff average reported in Table 4. Source: U.S. ITC (http://www.usitc.gov/tariff_affairs/tariff_databases.htm). Accessed March 2013.

17
international market to keep their average total productions costs down. But we do not
see support for two other critical pieces to that market sanctuary argument. In particular,
these four sectors seem to be more competitive than national averages, at least as
measured by the Herfindahl-Hirschman index. In addition, these four sectors are not
characterized by tariffs higher than average for the U.S. manufacturing sector.
III. Econometric Strategy and Data
I now turn to a more formal analysis of the market sanctuary hypothesis by
analyzing what variables help explain the probability of observing an initiation of an
antidumping petition in a 6 digit NAICS category for U.S. exports. The empirical focus
is of a purely reduced form nature that documents basic correlation of the data with
expected outcomes.
This relationship is naturally examined using a Probit model since the researcher
cannot observe the underlying utility of a foreign industry contemplating filing a petition
against a U.S. exporter. Instead, the researcher only sees whether a petition has been
filed or not. Thus, the probability of a filing is characterized by the following:
P yikt =1( ) = Φ α +MSt−1β1 + Xikt−1β2 + Rt−1β3( ) (1)
where yikt takes on a value of 1 if an antidumping petition is filed by importing country i
against the U.S. in sector k in year t and Φ(·) is the cumulative normal distribution.
MSt-1 includes various regressors associated with the market sanctuary hypothesis.
Information about conditions inside country i is included in Xikt-1. This will include both

18
information at the sector or country level. Matrix Rt-1 will include various measures of
retaliation and deflection involving other countries’ use of antidumping, both of which
have been found in the literature to have important explanatory power for initiations.
Standard errors are clustered on an industry basis reflecting heteroskedasticity in the
disturbance terms.11
Note that most regressors generally are lagged one period from the year in which
the probability of an initiation is assessed since antidumping authorities look at past
circumstances to decide on the merit of a filing (and petitioners take this aspect into
account when deciding whether to file or not a case). In addition, lagging the explanatory
variables will reduce endogeneity problems. There are some time-invariant variables for
which this cannot be done.
The data analysis will not include the universe of all countries using antidumping
nor all product categories involving U.S. exports. Instead, I restrict the sample to
manufacturing sectors alone because the U.S. Census does not collect detailed data for
agricultural sectors. In any event, a large fraction of the cases involving U.S. firms are in
the manufacturing sector.
The analyzed countries are either traditional users of antidumping (the European
Union, Canada, and Australia) or countries that have become important new users of
11 There may be important unobservable country and year variation not captured
by the regressors. I therefore will also include fixed effects for the year and the importing country to control for unobservables in specifications not reported here. However, Probit models with fixed effects can cause problems associated with the “incidental variables problem.” Consequently, I also estimate an alternative specification using a linear probability model that includes country and year fixed effects as a robustness check. The results are qualitatively similar to those reported below and are available on request.
19
antidumping (Argentina, Brazil, Colombia, China, India, Mexico, Korea, and South
Africa). I only include these eleven importing jurisdictions in the analysis for two
reasons. First, I choose not to include countries that have never filed an antidumping
petition against the U.S. Secondly, the countries included represent the vast majority of
all antidumping petitions involving in the U.S. involve these countries.
Information about the petitions filed against the U.S. comes from two sources:
Moore and Zanardi (2009) and Bown (2012), both of which are based on government
publications rather than submissions to the WTO, which are often incomplete and
inaccurate.
As noted above, the basic unit of observation for the study is a 6-digit NAICS
category, roughly the same level of aggregation as a 4-digit ISIC sector, and includes 473
manufacturing sectors. This level of aggregation is more detailed than often used in the
literature (e.g., Moore and Zanardi (2009 and 2011) and Feinberg and Reynolds (2007))
but less detailed than the 6, 8, or even 10 digit Harmonized System Code categorization
used by the administering authority when implementing antidumping petitions. The 6-
digit NAICS level does allow me to utilize the U.S. Census detailed industrial data.
Control variable names, sources, and basic descriptive statistics for the entire data
set are included in Table 5.
In the regressions below, I report results for three variables for U.S. 6-digit
NAICS categories associated with the MS hypothesis: 1) capital-shipment ratio; 2)
sectoral average applied tariff; and 3) the fifty firm HHI for value-added. The expected
value for the coefficients of each one is positive under the hypothesis that U.S. firms
targeted by antidumping operate within a domestic sanctuary market.

20
The “U.S. Capital/Shipment” ratio is defined as the book value (in thousands of
U.S. dollars) divided by the previous three-year average domestic shipments. The book
value is based on 1997 firm level data while shipments are available for every year. The
annual variation of this variable therefore comes from the changes in domestic shipments
rather than the capital stock. This variable is designed to control for the fixed costs of
U.S. manufacturing industries and the consequent possibility of using exports as a way to
expand production and lower average costs. The Herfindahl-Hirschman Index is
calculated on the basis of the value-added of 50 top firms in each sector for year 1997
and is a standard measure of industry competitiveness. The tariff rate is the MFN applied
rate for the NAICS 6-digit category for year t-1 and consequently varies for each year.12
A final control variable (“U.S. Demand (change)”) is included in some
specifications. This variable is the percentage change from t-2 to t-1 of net U.S.
domestic shipments at the NAICS 6-digit level, defined as the total value of shipments
minus the value of exports. This variable will help control for the possibility that U.S.
firms react to a drop in domestic demand by increasing exports and therefore find
themselves more likely to face antidumping abroad. This interpretation would suggest a
negative coefficient. The value of shipments is obtained from the U.S. Census and the
value of exports from the U.S. International Trade Commission.
The matrix Xikt-1 includes information about the importing country that has been
found in the literature to be important in explaining antidumping petitions. I include the
tariff level in time t-1 (“Foreign Tariff (level)”). The expected sign is ambiguous. On the
12 Note that the World Bank’s Trade and Production Database does not include U.S. tariffs data for 1994. Consequently, I use a simple average for 1993 and 1995 for the missing data.

21
one hand, a negative sign might indicate that firms already facing intense international
competition might be more prone to turn to antidumping duties. On the other hand,
firms that might have political clout and already receive high applied tariffs may feel that
they will be likely to win an antidumping case. All tariff information was obtained from
the World Bank’s Trade and Production Database, the latest data for which ends in 2004.
The data is reported in the original World Bank data at the ISIC 3-digit level and is
converted to the NAICS system by careful matching of categories.
The WTO antidumping agreements require that administering authorities find that
imports are causing “material injury” to a domestic industry before duties can be applied.
Consequently, I include the percentage change in U.S. exports (“U.S. Export (change)”)
to the importing country in sector j from t-2 to t-1 as an explanatory variable. I also
include the level of U.S. exports at the sectoral level (“U.S. Exports (level)”), which will
control for those sectors in which there is a large U.S. export presence. These data come
from the U.S. International Trade Commission online database
(“http://dataweb.usitc.gov”), which includes NAICS 6-digit level U.S. exports from
1997-2007. Data prior to 1997 were collected using the SIC classification, which was
converted to NAICS categories.
The expected sign on the coefficient for “U.S. Export Growth” is positive; the
greater the change in U.S. exports, the more likely that an industry will file an
antidumping petition against them. The working hypothesis is that larger increases of
exports will be positively correlated with a positive decision by administering agencies so
that firms would be more likely to fall knowing that they might win a case. I also expect
a positive coefficient for “U.S. Exports (level)”.

22
I also control for three country level variables for the importing economy. These
include: 1) the change in (nominal) bilateral exchange rate at from t-2 to t-1 with the U.S.
(“Exchange Rate (change)”), obtained from the U.S. Federal Reserve Board and the IMF
and defined as foreign currency units per dollar13; 2) the GDP growth (“GDP Growth”)
rate in the importing country, obtained from the World Bank’s World Development
Indicators for year t-1, and 3) the importing country current account to GDP ratio in year
t-1, also obtained from the World Bank’s World Development Indicators (“Current
Account”).
The expected coefficient for the exchange rate is negative. A high value of the
domestic currency vis-à-vis the dollar will make U.S. exports cheap and thereby increase
the competitive pressure on domestic import-competing industry.
The coefficient for “GDP Growth” is expected to be negative. The higher the
level of overall domestic economic activity, the less likely that domestic firms may be in
economic distress, and the less likely that they would decide to file an antidumping
petition. However, it is important to note that macroeconomic conditions may tell only a
part of the story since sectoral pressures may vary from the overall domestic economy.
Therefore, sectoral variation in the importing country would be preferable in principle but
the requisite data is not available on a systematic basis for the countries in the sample.
I also include variables to control for retaliation and deflection involving
antidumping cases, both of which have been found to be important in the existing
literature. Retaliation in this instance refers to the motivation to initiate antidumping
petitions against the U.S. industries as a response to the U.S. filing its own antidumping
13 The euro-dollar exchange rate was used for all European Union members and the ecu-dollar rate for pre-1999.

23
petitions. Deflection refers to the possibility, first noted by Bown and Crowley (2007),
that antidumping petitions filed abroad can divert trade to country i and thereby trigger
AD cases by country i. Note that Feinberg and Olson (2008) found that retaliation is a
statistically significant predictor of antidumping actions taken against U.S. exporters.
“Retaliation (sector)” is the number of cases filed against the importing country i
in year t-1 in sector j in the U.S. The second is “Retaliation (country),” which is the
number of U.S. cases filed against the importing country i in year t-1 in all sectors. The
former reflects the possibility that an industry, say the steel sector in Mexico, might
decide to file a case against U.S. firms if American companies had filed cases against
Mexican steel exports. The latter expands this to a response to U.S. cases against all
Mexican export sectors. I expect a positive coefficient for both variables; Mexican firms
may want to retaliate and might also feel they have a higher chance to win a case against
the U.S. if Mexican exports have been affected by U.S. AD actions.
I also include “Deflection,” which is the number of cases filed in year t-1 in sector
j in all countries (i.e. including those not in the twelve country sample for this study)
except for country i. The expected sign for the coefficient for this variable is also
positive; the more cases are filed worldwide in the particular sector, the more likely that
trade will flow in country i, thereby increasing the chance that one observes a new
petition in that sector.
Three different data sets will be used below, all of which span 1994 through 2007:
1) all twelve countries in the data set; 2) traditional users; and 3) “new users” that have
become more intensive users of antidumping actions in recent years.

24
IV. Econometric Results
Table 6 includes the results from the Probit estimations without country or year
fixed effects for all countries in the data set. Note that the reported coefficients are the
marginal increased probabilities of observing an antidumping initiation when the value of
the regressor increases infinitesimally. These marginal probabilities are very small given
the small number of antidumping cases relative to the total number of industries in the
sample.
The first two column is the base case and includes a fairly standard set of
explanatory variables in the literature on antidumping initiations and consequently does
not include any of the variables associated with the market sanctuary hypothesis. The
second column excludes the foreign tariff level, which increases the number of
observations from 36,001 to 54,980. The third column replaces the sectoral retaliation
variable with the aggregate retaliation variable.
The results are as expected for a number of the controls. Similar to other studies,
trade deflection as a result of antidumping cases is positive and statistically significant at
the 10 percent level; U.S. firms are more likely to face antidumping actions the more
cases have been filed in this sector in the previous year for the world as a whole,
excluding the importing country. This suggests that trade is being “deflected” into
countries that then take actions against other exporters, including the U.S. We also see
that a high level of U.S. exports to a particular sector raises the probability of observing
an antidumping petition in a statistically significant way.
A weak dollar is associated with a higher probability of an antidumping petition
against U.S. exporters though this effect is measured imprecisely. We also see no

25
evidence that petitions against U.S. firms are more likely in retaliation against U.S.
antidumping actions against firms in the importing country. This is true both for possible
retaliation within the same sector “Retaliation (country)” in column (1) or a broader
reaction against U.S. antidumping actions in all sectors “Retaliation (sector)” in column
(2). These results are surprising given the outcomes of many studies such as Bown and
Crowley (2007).
We do find that the coefficients for two variables have unexpected signs and are
statistically significant. In particular, higher aggregate GDP growth in the importing
country consistently is associated with a higher probability of a case filed against a U.S.
exporter. Falling U.S. exports in the sector also are correlated with a higher likelihood of
a petition. Neither outcome, especially the result for U.S. exports, reflects the
antidumping process working as intended. These results are likely biased given that there
are almost 3000 instances where the percentage change in U.S. exports were
exceptionally large since there were very small export values in the base year. In
subsequent tables, I report results when observations were dropped with year to year U.S.
export changes were greater than 300 percent.
I now turn to the main question of the study, which is whether there is evidence
that U.S. firms operate behind a closed, uncompetitive domestic market, and then can use
expanding exports to reduce average production costs.
Note that the results for the variables in the base case specification generally
remain qualitatively identical to columns (1) through (3) of Table 6. The notable
exception is that the exchange rate variable is now significantly different from zero in
some specifications.

26
In column (4) of Table 6, I add an interaction term between the sectoral
Herfindahl index and the U.S. tariff rate. If U.S. firms were operating in a protected
domestic market, with low levels of competition and relatively high import barriers, one
would expect this variable to be positive and significantly different from zero. We see
that there are no such indications in the estimated coefficients.
In subsequent columns, I report results after adding MS variables in seriatim.
The results in column (5) of Table 6 indicate that U.S. manufacturing sectors with
high costs as measured by the ratio of book value to shipments are more likely to face
antidumping actions abroad.14 These results suggest that the first aspect of the market
sanctuary hypothesis may be plausible for U.S. exporters, i.e., those that have high fixed
costs might use exports as a way to lower average production costs. This clearly is not
sufficient evidence that U.S. companies are acting this way but it does suggest that
importing nations may be targeting U.S. firms that might be in the position to use such a
strategy.
Columns (6) and (7) of Table 6 includes two further variables that help us
examine the MS hypothesis. We see that the including the U.S. tariff and the 1997
Herfindahl-Hirschmann index provide no statistically significant explanatory power for
explaining cases against American companies.15
These results cast important doubt on the market sanctuary hypothesis for U.S.
firms. More precisely, there is little evidence that foreign firms are targeting U.S.
14 In results not reported here, I use the ratio of book value to total employees as an alternative measure. The results in these Probit estimations are qualitatively identical to those reported for the capital-labor ratio. 15 I also included the HHI based on the share of shipment value (rather than value-added) and share of value-added of the top four firms in the sector. The empirical results are very similar to those reported here.
27
companies that benefit from high tariffs in the U.S. or that are relatively uncompetitive in
the U.S. domestic as indicated by standard measure of market concentration.
I finally include the measure of recent U.S. changes in net domestic shipments as
an explanatory variable in column (8). As noted above, this is to evaluate the frequent
claim that antidumping is a necessary part of the international system to counter the
incentives of firms to deal with dropping demand by ramping up exports. In fact, we see
no evidence that dropping U.S. domestic shipments helps explain the pattern of cases
brought against American firms.
In Table 7, I report the same regressions when the outlier cases of U.S. export
growth exceeding 300 percent were excluded. We see that the general patterns for the
market sanctuary variables remain: only the coefficient on the capital-shipments variable
is significantly different from zero. One notable change is that the coefficient on
exchange rate changes is now negative (as expected) and significant in all of the
specifications. The unanticipated result that U.S export changes enter positively (rather
than negatively) is not robust: in no instance is this coefficient significantly different
from zero. In subsequent regressions, the export outliers are dropped.
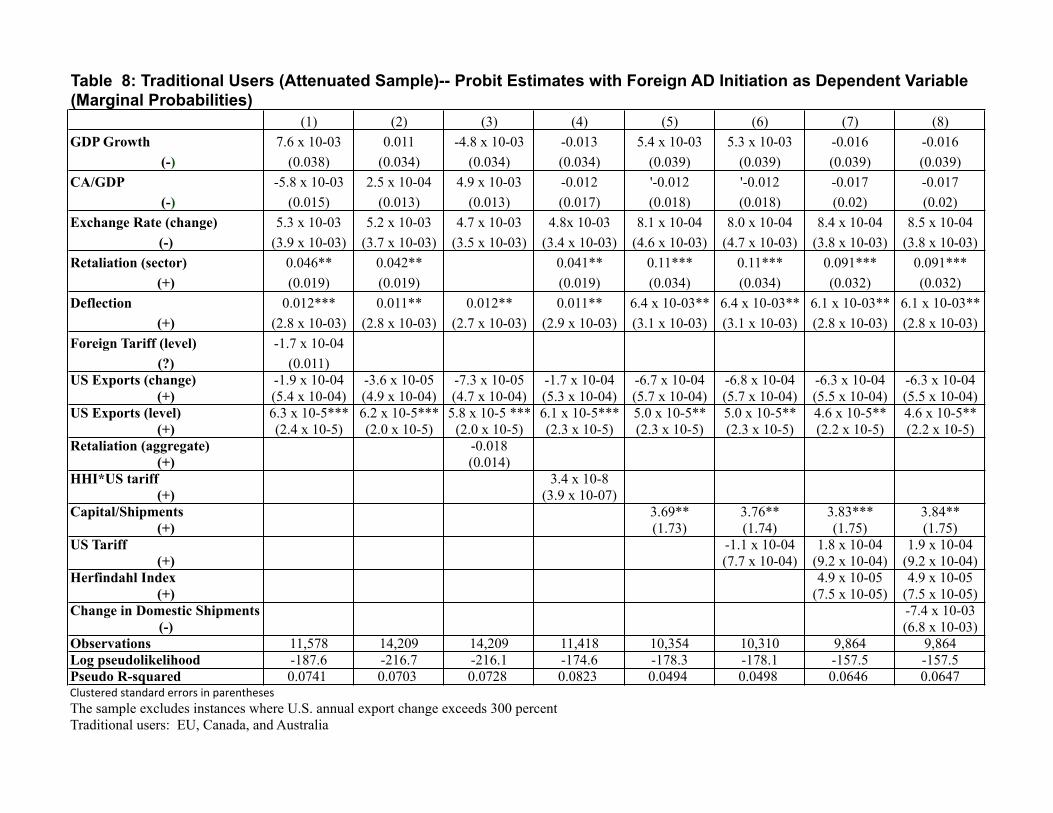
Tables 1 and 2 above showed that the countries filing cases against the U.S. has
changed substantially over time. Consequently, I report the same econometric
specifications found in Table 6 for traditional antidumping users (Table 8) and for new
users (Table 9).
Most importantly, we find no differences across the two subsets of data
concerning the market sanctuary variables. For both cases, the measure of capital costs
has very similar effects: the capital-shipments variable retains its sign and statistical

28
significance as well as the relative size of the estimated coefficients. The U.S. tariff and
measures of sectoral competition continue to provide little predictive power.
Other results are similar are the two groups of countries: higher levels of U.S.
exports are positively correlated with antidumping petitions for both. Trade deflection as
a result of antidumping use affecting other countries seems to be important for new and
traditional users deciding to target U.S. exporters.
There are some other important differences across the two samples for other
regressors. In general, some of the unexpected results for the entire data set in Table 6
seem to be a consequence of actions among new users rather than traditional antidumping
countries. For example, we see in Table 9 for traditional users that the positive and
significant coefficient for aggregate domestic growth does not continue. This regressor
does help explain new antidumping petitions among new users. The results also indicate
that sectoral retaliation may be an important predictor of antidumping use among
developed country users of antidumping but not for developing countries.
V. Conclusion
This research is the first effort to evaluate the argument offered by supporters of
antidumping that this WTO sanctioned import restriction is necessary to counter firms
using a sanctuary market at home to “dump” in foreign markets. I do so by analyzing
petitions filed against U.S. firms operating in twelve important trading partners for the
1994-2010 period. Formal econometric analysis is for the 1994-2007 so that the recent
financial crisis period is excluded. The research does so by exploiting detailed industry
level data at the six digit North American Industrial Classification System.

29
The Probit analysis finds no evidence that foreign antidumping petitions are
targeting U.S. firms that correspond to circumstances of the market sanctuary hypothesis.
Most notably, the results suggest that neither import barriers nor standard measures of
anti-competitive markets help predict antidumping cases brought against American
exporters. While it is conceivable that foreign firms are missing opportunities to file
against U.S. companies that truly exploit a favorable market situation at home, it is more
likely that antidumping cases are being filed for other reasons.
I also find that exporters with high fixed costs are more likely to face these
petitions. This is consistent with a world in which a company might temporarily price
below average total costs and become ensnared in the antidumping net. The U.S.
chemicals and plastics industries seem to be especially prone to face trade remedy
actions.
The evidence also suggests that the more U.S. firms exports to a country, the
more likely they will face a case. There is no systematic evidence that recent surges in
American exports play a role in encouraging initiations for developed countries. In
addition, if there is a spate of antidumping actions abroad in a particular sector in an
earlier year, it is more likely that American companies will face a petition in the
subsequent year, at least for traditional antidumping users.
In short, this research suggests that there is little indication that market sanctuary
considerations play a significant role in predicting when foreign countries will file
antidumping actions against U.S. companies. This evidence cannot help us directly
understand whether firms in other countries operate behind closed uncompetitive markets
that then “unfairly” compete with U.S companies. Those firms indeed may exploit

30
formal and informal barriers to “subsidize” their exports. But the results of this research
certainly suggest that firms that do not have the advantage of a home “market sanctuary”
can be swept up into the antidumping net. This alone means that world antidumping
rules might be rewritten to avoid “catching” firms that simply have high fixed costs but
otherwise are operating within a competitive framework.

31
References
Blonigen, Bruce A. and Chad P. Bown (2003), “Antidumping and Retaliation Threats,” Journal of International Economics, 60(2), 249-73. Bown, Chad P. (2007), “Global Antidumping Database, Version 3.0,” World Bank Policy Working Paper. Bown, Chad P. (2008), “The WTO and Antidumping in Developing Countries,” Economics and Politics, 20(2), pp. 255-88. Bown, Chad P. (2012), Global Antidumping Database. http://econ.worldbank.org/ttbd/gad/ Chad P. Bown (ed.), The Great Recession and Import Protection: The Role of Temporary Trade Barriers. London, UK: CEPR and the World Bank, 2011. Bown, Chad P. and Meredith A. Crowley (2007), “Trade Deflection and Trade Depression,” Journal of International Economics, 72(1), 176-201. Feinberg, Robert (1989), “Exchange Rates and Unfair Trade,” Review of Economics and Statistics, 71(4), 704-07. Feinberg, Robert (2005), “U.S. Antidumping Enforcement and Macroeconomic Indicators Revisited: Do Petitioners Learn?” Review of World Economics, 141(4), 612-22. Feinberg R., & Kara Reynolds, K. (2008). Friendly Fire? The Impact of US Antidumping Enforcement on US Exporters. Review of World Economics, 144(2), 366-378 Feinberg, Robert and Kara Reynolds (2006), “The Spread of Antidumping Regimes and the Role of Retaliation in Filings,” Southern Economic Journal, 72(4), 877-90. Feinberg, Robert and Kara Reynolds (2007), “Tariff Liberalization and Increased Administrative Protection: Is There a Quid Pro Quo?” World Economy, 30(6), 948-61. Finger, J. Michael and Julio J. Nogués (2005) (eds.), Safeguards and Antidumping in Latin American Trade Liberalization: Fighting Fire with Fire, Palgrave: New York. Francois, Joseph and Gunnar Niels (2006), “Business Cycles, the Current Account and Administered Protection in Mexico,” Review of Development Economics, 10(3), 388-99. Howe., Thomas, William Noellert, Jesse Kreier, and Alan Wolff (1988), Steel and the state: Government Intervention and Steel’s Structural Crisis, Westview Press: Boulder and London. Knetter, Michael M. and Thomas J. Prusa (2003), “Macroeconomic Factors and Antidumping Filings,” Journal of International Economics, 61(1), 1-18.

32
Mastel, Greg (1998), Antidumping Laws and the U.S. Economy Armonk, NY: ME Sharpe Miranda, Jorge, Raul. A. Torres and Mario Ruiz (1998), “The International Use of Antidumping: 1987-1997,” Journal of World Trade, 32(5), 5-71. Moore, Michael and Maurizio Zanardi (2009), “Does Antidumping Use Contribute to Trade Liberalization in Developing Countries?” Canadian Journal of Economics, 42(2), pp. 469-495. Moore, Michael and Maurizio Zanardi (2011), “Trade Liberalization and Antidumping: Is There a Substitution Effect?” Review of Development Economics, 15(4): 601-619 Nicita, Alessandro and Marcelo Olarreaga (2007), “Trade, Production and Protection 1976-2004,” World Bank Economic Review, 21(1), 165-71. Prusa, Thomas J. (2001), “On the Spread and Impact of Anti-Dumping,” Canadian Journal of Economics, 34(3), 591-611. Prusa, Thomas J. and Bruce A. Blonigen (2003), “Antidumping,” in E. Kwan Choi and James Harrigan (eds.), The Handbook of International Trade, Blackwell: Oxford. Prusa, Thomas J. and Susan Skeath (2004), “Modern Commercial Policy: Managed Trade or Retaliation?,” in E. Kwan Choi and James Hartigan (eds.), The Handbook of International Trade, vol. 2, Blackwell: Oxford. United States (2002), “Basic Concepts and Principles of the Trade Remedy Rules,” Submission to World Trade Organization, Document TN/RL/W/27. World Trade Organization (2009), World Trade Report 2009, WTO: Geneva. Zanardi, Maurizio (2004), “Antidumping: What are the Numbers to Discuss at Doha?” World Economy, 27(3), 403-33.

Figure'1:''Sanctuary'Market'
MR D
MC
ATC
Pw
Q2 Q1
ATC1
P2 C
E
ATC2
Q3
P1

Traditional*Users Total&(1978,2010) 1978,1992 1993,2003 2004,2010Canada 67 42 20 5Australia 29 14 11 4EU 20 4 9 7
Subtotal 116 60 40 16New*UsersMexico 79 42 35 2Brazil 42 4 24 14India 34 1 20 13China 32 0 13 19South Korea 19 3 11 5South Africa 16 4 9 3Argentina 5 0 4 1Others 39 7 24 8
Subtotal 266 61 140 65Total 382 121 180 81Source:&Bown&(2012)&&
Initiating Country ("importing")
As Target Country Share of Total AD
Initiations as Target Country
Country Share of 2008 World Merchandise
Trade
U.S. 1230 382 6.6% 8.2%China 189 943 16.4% 9.1%EU 724 87 1.5% 37.5%India 628 183 3.2% 1.1%Brazil 276 185 3.2% 1.3%Canada 366 92 1.6% 2.9%Japan 10 325 5.6% 5.0%Others 2340 3566 61.9% 35.0%Total 5763 5763 100%
Table*1**Initiations*against*US*firms
Table*2:**Antidumping*Initiations*(1978,2010)
Source:&&Bown&(2012)&and&WTO&(2009)Note: EU trade includes intraEU transactions.
NAICS sector (NAICS code)
All Countries US as Target All (1993-2010) US as Target (1993-2010)
Plastics (325211) 359 37 263 31Organic Chemicals (325199) 298 37 252 35Synthetic Rubber (325212) 52 15 48 13Inorganic Chmicals (325188) 189 13 137 8Iron and Steel (331111) 1226 31 815 15Broadwoven Fabric Mills (313210) 107 1 93 0Yarn Spinning Mills (313111) 71 0 57 0All Others 3461 248 2264 159
5763 382 3929 261* North American Industrial Classification SystemSource: Bown (2012) and author calcualtion
Table 3: Antidumping Initiations Categorized by NAICS* Code (1978-2010)

Sector (NAICS code) Capital/Labor* (1997)
Capital/Shipment** (1997)
Herfindahl- Hirschman Index***
(1997)
Herfindahl- Hirschman Index
(2002)
Herfindahl- Hirschman Index
(2007)
Share of Value-Added of Top
Four Firms
U.S. Applied Taruffs
Overall Manufacturing 104 0.39 763 761 743 42 4.73
Plastics (325211) 611 0.84 333 443 546 29 3.54
Organic Chemicals (325199) 503 0.84 237 238 289 23 2.6
Synthetic Rubber (325212) 342 0.68 725 744 717 46 3.54
Inorganic Chemicals (325188) 243 0.75 654 217 303 39 1.88
Iron and Steel (331111) 254 0.65 560 657 907 39 2.13
*"Book"value"(in"thousands"of"U.S."dollars)"divided"by"the"total"number"of"employees"of"all"firms"in"1997;""**"Book"value"divided"by"the"three@year"shipment"value"(for"years"t@2,"t@1,"and"t);"""***"All"versions"of"Herfindahl@Hirschmann"index"based"on"value@added"of"50"top"firms"in"sector.
Source:""U.S."Bureau"of"Census"and"Nicitia"and"Olarreaga"(2007)
Table 4: Sectoral Characteristics of Antidumping Petitions Against Select U.S. NAICS Sectors
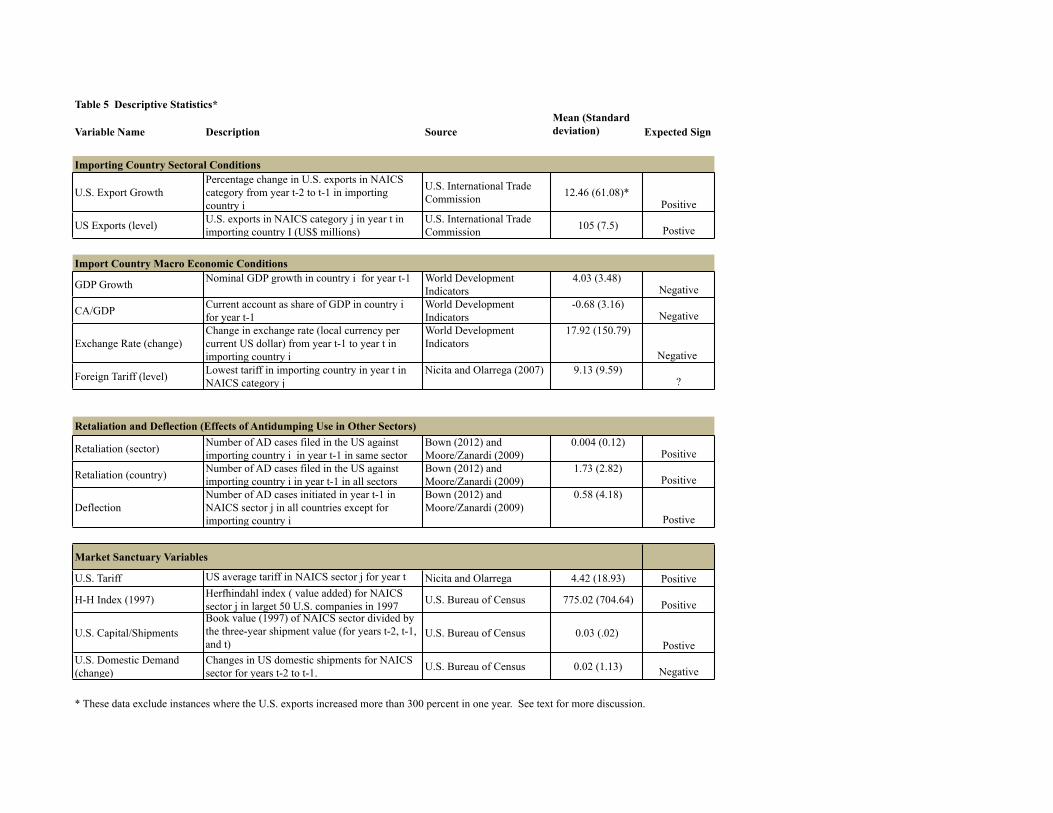
Table 5 Descriptive Statistics*
Variable Name Description SourceMean (Standard deviation) Expected Sign
Importing Country Sectoral Conditions
U.S. Export GrowthPercentage change in U.S. exports in NAICS category from year t-2 to t-1 in importing country i
U.S. International Trade Commission 12.46 (61.08)*
Positive
US Exports (level) U.S. exports in NAICS category j in year t in importing country I (US$ millions)
U.S. International Trade Commission 105 (7.5) Postive
Import Country Macro Economic Conditions
GDP Growth Nominal GDP growth in country i for year t-1 World Development Indicators
4.03 (3.48)Negative
CA/GDP Current account as share of GDP in country i for year t-1
World Development Indicators
-0.68 (3.16)Negative
Exchange Rate (change)Change in exchange rate (local currency per current US dollar) from year t-1 to year t in importing country i
World Development Indicators
17.92 (150.79)
Negative
Foreign Tariff (level) Lowest tariff in importing country in year t in NAICS category j
Nicita and Olarrega (2007) 9.13 (9.59)?
Retaliation (sector) Number of AD cases filed in the US against importing country i in year t-1 in same sector
Bown (2012) and Moore/Zanardi (2009)
0.004 (0.12)Positive
Retaliation (country) Number of AD cases filed in the US against importing country i in year t-1 in all sectors
Bown (2012) and Moore/Zanardi (2009)
1.73 (2.82)Positive
DeflectionNumber of AD cases initiated in year t-1 in NAICS sector j in all countries except for importing country i
Bown (2012) and Moore/Zanardi (2009)
0.58 (4.18)
Postive
U.S. Tariff US average tariff in NAICS sector j for year t Nicita and Olarrega 4.42 (18.93) Positive
H-H Index (1997) Herfhindahl index ( value added) for NAICS sector j in larget 50 U.S. companies in 1997 U.S. Bureau of Census 775.02 (704.64) Positive
U.S. Capital/ShipmentsBook value (1997) of NAICS sector divided by the three-year shipment value (for years t-2, t-1, and t)
U.S. Bureau of Census 0.03 (.02)Postive
U.S. Domestic Demand (change)
Changes in US domestic shipments for NAICS sector for years t-2 to t-1. U.S. Bureau of Census 0.02 (1.13) Negative
Market Sanctuary Variables
Retaliation and Deflection (Effects of Antidumping Use in Other Sectors)
* These data exclude instances where the U.S. exports increased more than 300 percent in one year. See text for more discussion.

Variable Name (Expected Sign) (1) (2) (3) (4) (5) (6) (7) (8)GDP Growth 0.021* 0.015* 0.015* 0.018* 0.018** 0.018** 0.017** 0.017**
(-) (0.012) (0.0084) (0.0083) (0.010) 0.0079 0.0079 0.0081 0.0081CA/GDP -0.0063 -0.0092* -0.0099* -0.011 -0.0092 -0.01 -8.4 x 10-03 -8.4 x 10-03
(-) (0.0072) (0.0052) (0.0055) (0.0072 (0.0061) (6.1 x 10-03) (6.4 x 10-03) (6.4 x 10-03)Exchange Rate (change) -6.5 x 10-04 -9.3 x 10-04 -9.3 x 10-04 -9.7 x 10-04 -0.0014** -0.0014** -0.0012** -0.0012**
(-) (5.3 x 10-04) (6.8 x 10-04) (6.7 x 10-04) (7.5 x 10-04) (6.1 x 10-04) (6.1 x 10-04) (6.2 x 10-04) (6.2 x 10-04)Retaliation (country) 0.023 -0.005 -0.004 0.03 0.030 0.031 0.031
(+) (0.035) (0.057) (0.058) (0.043) (0.043) (0.044) (0.044)Deflection 0.014** 0.014** 0.014** 0.014** 0.0085** 0.0085** 0.0086** 0.0086**
(+) (0.0059) (0.0062) (0.0055) (0.0063) (0.0041) (0.0041) (0.0041) (0.0041)Foreign Tariff (level) -9.3 x 10-04
(?) (2.1 x 10-03)US Exports (change) -2.2 x 10-04** -2.3 x 10-04** -2.2 x 10-04** -2.8 x 10-04** -2.6 x 10-04** -2.6 x 10-04** -2.5 x 10-04** -2.5 x 10-04**
(+) (1.0 x 10-04) (1.0 x 10-04) (1.0 x 10-04) (1.2 x 10-04) (1.0 x 10-04) (1.0 x 10-04) (1.1 x 10-04) (1.1 x 10-04)US Exports (level) 8.7 x 10⁻⁵** 8.4 x 10⁻⁵*** 8.4 x 10⁻⁵*** 8.8 x 10⁻⁵** 5.0 x 10⁻⁵** 5.0 x 10⁻⁵** 5.0 x 10⁻⁵** 5.0 x 10⁻⁵**
(+) (3.4 x 10⁻⁵) (3.1 x 10⁻⁵) (3.1 x 10⁻⁵) (3.5 x 10⁻⁵) (2.0 x 10⁻⁵) (2.0 x 10⁻⁵) (2.0 x 10⁻⁵) (2.0 x 10⁻⁵)Retaliation (sector) 0.0023
(+) (0.0040)HHI*US tariff -3.1 x 10-07
(+) (5.5 x 10-07)Capital/Shipments 4.50*** 4.52*** 4.83*** 4.83***
(+) (1.43) (1.44) (1.65) (1.65)US Tariff -4.2 x 10⁻⁴ 3.5 x 10-06 3.6 x 10-06
(+) (6.4 x 10-04) (8.5 x 10-04) (8.5 x 10-04)Herfindahl Index -9.2 x 10-06 -9.2 x 10-06
(+) (5.7 x 10-05) (5.7 x 10-05)Change in Domestic Shipments -0.0028
(-) (0.0044)Observations 36,001 54,980 54,980 44,055 39,860 39,690 37,990 37,990Log pseudolikelihood -663.4 -948.4 -948.3 -808.3 -722.4 -721.4 -682.4 -682.4Pseudo R-squared 0.0832 0.0735 0.0735 0.0828 0.0960 0.0967 0.100 0.100
Probit'Estimates'with'Foreign'AD'Initiation'as'Dependent'Variable'(Marginal'Probabilities)Clustered'standard'errors'in'parentheses
Table 6: All Countries (Probit Marginal Probability Estimates)

Table 7: All Countries (Attenuated Sample)-- Probit Estimates with Foreign AD Initiation as Dependent Variable (Marginal Probabilities)(1) (2) (3) (4) (5) (6) (7) (8)
GDP Growth 0.026* 0.02* 0.019* 0.022* 0.024** 0.024** 0.023** 0.023**(-) (0.014) (0.011) (0.011) (0.013) (0.011) (0.011) (0.011) (0.011)
CA/GDP -7.4 x 10-03 -0.0138** -0.0142** -0.0138 -0.0120 -0.0121 -0.0105 -0.0105(-) (8.3 x 10-03) (6.9 x 10-03) (7.2 x10-03) (8.6 x 10-03) (8.4 x 10-03) (8.4 x 10-03) (8.5 x 10-03) (8.5 x 10-03)
Exchange Rate (change) -3.3 x 10-04*** -3.3 x 10-04** -3.4 x 10-04** -3.5 x 10-04** -4.1 x 10-04* -4.1 x 10-04* -3.6 x 10-04** -3.6 x 10-04**(-) (1.0 x 10-04) (1.4 x 10-04) (1.4 x 10-04) (1.4 x 10-04) (2.4 x 10-04) (2.4 x 10-04) (1.8 x 10-04) (1.8 x 10-04)
Retaliation (sector) 0.023 -9.8 x 10-03 -9.5 x 10-03 0.04 0.040 0.039 0.039(+) (0.041) (0.071) (0.074) (0.059) (0.059) (0.058) (0.058)
Deflection 0.017** 0.017** 0.017** 0.017** 0.012** 0.012** 0.012** 0.012**(+) (6.7 x 10-03) (7.6 x 10-03) (6.7 x 10-03) (7.9 x 10-03) (5.6 x 10-03) (5.6 x 10-03) (5.4 x 10-03) (5.4 x 10-03)
Foreign Tariff (level) -1.7 x 10-03(?) (2.5 x 10-03)
US Exports (change) 4.8 x 10-04 4.5 x 10-04 4.6 x 10-04 3.5 x 10-04 2.1 x 10-04 2.0 x 10-04 2.5 x 10-04 2.5 x 10-04(+) (3.1 x 10-04) (2.8 x 10-04) (2.8 x 10-04) (2.9 x 10-04) (2.7 x 10-04) (2.7 x 10-04) (2.9 x 10-04) (2.8 x 10-04)
US Exports (level) 9.7 x 10⁻⁵ ** 9.9 x 10⁻⁵ *** 9.9 x 10⁻⁵ *** 1.1 x 10⁻⁵** 6.7 x 10⁻⁵** 6.7 x 10⁻⁵** 6.4 x 10⁻⁵** 6.4 x 10⁻⁵**(+) (4.0 x 10⁻⁵) (3.7 x 10⁻⁵) (3.7 x 10⁻⁵) (4.2 x 10⁻⁵) (2.7 x 10⁻⁵) (2.7 x 10⁻⁵) (2.7 x 10⁻⁵) (2.7 x 10⁻⁵)
Retaliation (aggregate) 1.0 x 10⁻³(+) (4.9 x 10-03)
HHI*US tariff -3.3 x 10-07(+) (6.7 x 10-07)
Capital/Shipments 6.15*** 6.19*** 6.40*** 6.40***(+) (1.83) (1.85) (2.13) (2.13)
US Tariff -6.3 x 10-04 -8.5 x 10-05 -8.4 x 10-05(+) (9.2 x 10-04) (1.2 x 10-03) (1.1 x 10-03)
Herfindahl Index -8.6 x 10-06 -8.6 x 10-06(+) (7.5 x 10-05) (7.5 x 10-05)
Change in Domestic Shipments -4.4 x 10-03(-) (5.8 x 10-03)
Observations 33,216 48,751 48,751 39,073 35,338 35,184 33,695 33,695Log pseudolikelihood -655.7 -921.6 -921.6 -785.3 -702.7 -701.7 -662.9 -662.9Pseudo R-squared 0.0830 0.0730 0.0730 0.0809 0.0915 0.0922 0.0966 0.0966
The sample excludes instances where U.S. annual export change exceeds 300 percentClustered,standard,errors,in,parentheses
(1) (2) (3) (4) (5) (6) (7) (8)GDP Growth 7.6 x 10-03 0.011 -4.8 x 10-03 -0.013 5.4 x 10-03 5.3 x 10-03 -0.016 -0.016
(-) (0.038) (0.034) (0.034) (0.034) (0.039) (0.039) (0.039) (0.039)CA/GDP -5.8 x 10-03 2.5 x 10-04 4.9 x 10-03 -0.012 '-0.012 '-0.012 -0.017 -0.017
(-) (0.015) (0.013) (0.013) (0.017) (0.018) (0.018) (0.02) (0.02)Exchange Rate (change) 5.3 x 10-03 5.2 x 10-03 4.7 x 10-03 4.8x 10-03 8.1 x 10-04 8.0 x 10-04 8.4 x 10-04 8.5 x 10-04
(-) (3.9 x 10-03) (3.7 x 10-03) (3.5 x 10-03) (3.4 x 10-03) (4.6 x 10-03) (4.7 x 10-03) (3.8 x 10-03) (3.8 x 10-03)Retaliation (sector) 0.046** 0.042** 0.041** 0.11*** 0.11*** 0.091*** 0.091***
(+) (0.019) (0.019) (0.019) (0.034) (0.034) (0.032) (0.032)Deflection 0.012*** 0.011** 0.012** 0.011** 6.4 x 10-03** 6.4 x 10-03** 6.1 x 10-03** 6.1 x 10-03**
(+) (2.8 x 10-03) (2.8 x 10-03) (2.7 x 10-03) (2.9 x 10-03) (3.1 x 10-03) (3.1 x 10-03) (2.8 x 10-03) (2.8 x 10-03)Foreign Tariff (level) -1.7 x 10-04
(?) (0.011)US Exports (change) -1.9 x 10-04 -3.6 x 10-05 -7.3 x 10-05 -1.7 x 10-04 -6.7 x 10-04 -6.8 x 10-04 -6.3 x 10-04 -6.3 x 10-04
(+) (5.4 x 10-04) (4.9 x 10-04) (4.7 x 10-04) (5.3 x 10-04) (5.7 x 10-04) (5.7 x 10-04) (5.5 x 10-04) (5.5 x 10-04)US Exports (level) 6.3 x 10⁻⁵*** 6.2 x 10⁻⁵*** 5.8 x 10⁻⁵ *** 6.1 x 10⁻⁵*** 5.0 x 10⁻⁵** 5.0 x 10⁻⁵** 4.6 x 10⁻⁵** 4.6 x 10⁻⁵**
(+) (2.4 x 10⁻⁵) (2.0 x 10⁻⁵) (2.0 x 10⁻⁵) (2.3 x 10⁻⁵) (2.3 x 10⁻⁵) (2.3 x 10⁻⁵) (2.2 x 10⁻⁵) (2.2 x 10⁻⁵)Retaliation (aggregate) -0.018
(+) (0.014)HHI*US tariff 3.4 x 10⁻⁸
(+) (3.9 x 10-07)Capital/Shipments 3.69** 3.76** 3.83*** 3.84**
(+) (1.73) (1.74) (1.75) (1.75)US Tariff -1.1 x 10-04 1.8 x 10-04 1.9 x 10-04
(+) (7.7 x 10-04) (9.2 x 10-04) (9.2 x 10-04)Herfindahl Index 4.9 x 10-05 4.9 x 10-05
(+) (7.5 x 10-05) (7.5 x 10-05)Change in Domestic Shipments -7.4 x 10-03
(-) (6.8 x 10-03)Observations 11,578 14,209 14,209 11,418 10,354 10,310 9,864 9,864Log pseudolikelihood -187.6 -216.7 -216.1 -174.6 -178.3 -178.1 -157.5 -157.5Pseudo R-squared 0.0741 0.0703 0.0728 0.0823 0.0494 0.0498 0.0646 0.0647
The sample excludes instances where U.S. annual export change exceeds 300 percentTraditional users: EU, Canada, and Australia
Clustered)standard)errors)in)parentheses
Table 8: Traditional Users (Attenuated Sample)-- Probit Estimates with Foreign AD Initiation as Dependent Variable (Marginal Probabilities)

(1) (2) (3) (4) (5) (6) (7) (8)GDP Growth 0.023 0.019 0.014 0.021* 0.022** 0.023** 0.021* 0.021*
(-) (0.041) (0.011) (9.5 x 10-03) (0.013) (0.011) (0.011) (0.011) (0.011)CA/GDP -5.0 x 10-03 -0.018* -0.022** -0.015 -0.011 -0.011 -9.4 x 10-03 -9.4 x 10-03
(-) (0.011) (0.010) (0.011) (0.012) (0.010) (0.010) (0.010) (0.010)Exchange Rate (change) -4.5 x 10-04 -4.9 x 10-04 -7.0 x 10-04 -5.4x 10-04 -5.0 x 10-04 -4.9 x 10-04 -4.6 x 10-04 -4.6 x 10-04
(-) (2.0 x 10-04) (3.8 x 10-04) (1.1 x 10-03) (4.3 x 10-04) (4.6 x 10-04) (4.4 x 10-04) (3.4 x 10-04) (3.4 x 10-04)Retaliation (sector) -0.012 -0.25 -0.26 -0.14 -0.14 -0.14 -0.14
(+) (0.12) (0.16) (0.16) (0.17) (0.17) (0.17) (0.17)Deflection 0.017** 0.019** 0.016** 0.020** 0.014** 0.014** 0.014** 0.014**
(+) (7.0 x 10-03) (8.7 x 10-03) (7.5 x 10-03) (8.9 x 10-03) (6.3 x 10-03) (6.3 x 10-03) (6.2 x 10-03) (6.2 x 10-03)Foreign Tariff (level) -4.6 x 10-03
(?) (3.4 x 10-03)US Exports (change) 5.4 x 10-04 4.9 x 10-04 5.0 x 10-04* 3.7 x 10-04 2.8 x 10-04 2.8 x 10-04 3.4 x 10-04 3.4 x 10-04
(+) (3.4 x 10-04) (3.0 x 10-04) (3.0 x 10-04) (3.0 x 10-04) (2.8 x 10-04) (2.8 x 10-04) (2.9 x 10-04) (2.9 x 10-04)US Exports (level) 3.6 x 10⁻⁴** 3.0 x 10⁻⁴** 3.0 x 10⁻⁴*** 3.6 x 10⁻⁴** 1.9 x 10-4* 1.9 x 10-4* 1.9 x 10-4* 1.9 x 10-4*
(+) (1.5 x 10⁻⁴) (1.2 x 10⁻⁴) (1.2 x 10⁻⁴) (1.5 x 10⁻⁴) (1.0 x 10⁻⁴) (1.0 x 10⁻⁴) (9.9 x 10⁻⁴) (9.9 x 10⁻⁴)Retaliation (aggregate) 0.015*
(+) (8.5e-03)HHI*US tariff -4.5 x 10⁻⁷
(+) (8.5 x 10-07)Capital/Shipments 6.44*** 6.44*** 6.82*** 6.83***
(+) (1.95) (1.97) (2.28) (2.28)US Tariff -1.1 x 10-03 -4.2 x 10-04 -4.2 x 10-04
(+) (1.5 x 10-03) (1.8 x 10-03) (1.8 x 10-03)Herfindahl Index -2.9 x 10-05 -2.9 x 10-05
(+) (8.9 x 10-05) (8.9 x 10-05)Change in Domestic Shipments -2.8 x 10-03
(-) (6.0 x 10-03)Observations 21,638 34,542 34,542 27,655 24,984 24,874 23,831 23,831Log pseudolikelihood -454.6 -690.7 -691.3 -594.8 -516.7 -515.9 -497.1 -497.1Pseudo R-squared 0.1100 0.0906 0.0898 0.1020 0.1170 0.1170 0.1190 0.119
The sample excludes instances where U.S. annual export change exceeds 300 percentNon-traditional users: Argentina, Brazil, Colombia, China, India, Mexico, Korea, and South Africa
Clustered)standard)errors)in)parentheses
Table 9: Non-traditional Users (Attenuated Sample)-- Probit Estimates with Foreign AD Initiation as Dependent Variable (Marginal Probabilities)