an empirical analysis of avoided cost rates for solar … · avoided cost rates for qf contracts...
TRANSCRIPT

AN EMPIRICAL ANALYSIS OF AVOIDED COST
RATES FOR SOLAR AND WIND QFS UNDER PURPA
NOVEMBER 2019
PREPARED FOR:
EDISON ELECTRIC INSTITUTE
PREPARED BY:
EMMA NICHOLSON AND MICHAEL KAGAN
CEADVISORS.COM
©2019 CONCENTRIC ENERGY ADVISORS, INC. ALL RIGHTS RESERVED.

1 of 20
I. Introduction
This analysis compares contract rates for solar and wind generation set pursuant to the Public
Utility Regulatory Policies Act1 (“PURPA”) to contract rates set in the competitive market. The
analysis is performed by examining a sample of contracts executed between utilities and solar
and wind generation facilities that qualify as small power producers – qualifying facilities or “QFs”
– under PURPA. Our analysis of a sample of 708 QF contracts representing approximately 8,000
megawatts (“MW”) shows that the QF contract rates consistently exceed market-based contract
rates for solar and wind energy. Further, we find that these QF contract rates do not reflect the
price change observed in competitive markets.
On an annual levelized cost basis, the solar QF contracts signed between 2013 and 2019 exceeded
a competitive market rate by between $6.27/MWh and $10.79/MWh in 2018 dollars.2 We also
estimate this cost-per-MWh differential results in an estimated overpayment relative to the
market-based alternative of between $67.9 million and $116.8 million per year for the solar QF
contracts we reviewed. Accounting for the full term of the solar QF contracts raises the total
overpayment estimate to between $1.05 billion and $1.87 billion.
For wind QF contracts signed between 2009 and 2018, we estimate that QF contract rates are
between $17.66/MWh and $21.19/MWh higher on an annual levelized basis than comparable
market-based contract rates. The differential for the wind QF contracts we reviewed results in
estimated overpayments relative to a market-based alternative of between $82.9 million and
$99.4 million per year we reviewed. Accounting for the full term of the wind QF contracts raises
the total overpayment estimate to between $1.65 billion and $1.99 billion.
Our analysis of levelized cost of energy (“LCOE”) trends found that the administratively
determined avoided cost rates for the solar QFs established pursuant to PURPA did not reflect
underlying declining installation cost trends. For example, Lazard estimates that solar PV and
wind LCOEs declined by 89% and 70%, respectively, over the 2009-2019 period.3 Our results
corroborate the findings of state public utilities commissions (“PUCs”)4 that the avoided cost
1 16 U.S.C. 796(17)-(18), 842a-3. 2 Unless specified otherwise, all figures in this report are presented in 2018 dollars. 3 Lazard, Lazard’s Levelized Cost of Energy Analysis – Version 13.0, November 2019, at 8. Note that Lazard’s LCOE estimates do not include the impacts of state and federal tax incentives or other subsidies. See also U.S. Energy Information Administration, Updated Capital Cost Estimates for Utility Scale Electricity Generating Plants, November 22, 2016, which estimated that solar and wind overnight capital costs for solar and wind declined by 67% and 25%, respectively, between 2013 and 2016.
4 See, e.g., The Honorable Travis Kavulla, Vice Chairman, Montana Public Service Commission before the United States House of Representatives Committee on Energy & Commerce Subcommittee on Energy hearing entitled “Legislation Addressing LNG Exports and PURPA Modernization”, January 19, 2018, Exhibit A.

2 of 20
rates established under PURPA guidelines do not reflect market trends and often exceed market-
based metrics.
II. Background: PURPA and Recent Trends in Renewable Generation Costs
Congress passed PURPA in 1978 and required the Federal Energy Regulatory Commission
(“FERC”) to establish regulations to implement the law. State PUCs are required to adopt rules
that comply with FERC regulations when implementing PURPA within their state.5 PURPA
generally requires all electric utilities to purchase electricity at “avoided cost” from QFs, which
can take the form of “cogeneration facilities” and “small power production facilities that are 80
MW or smaller.” Congress amended PURPA, once, through the Energy Policy Act of 2005 (“EPAct
2005”) to allow FERC to terminate the mandatory purchase obligation if FERC finds that specific
criteria are met.6 In implementing EPAct2005, FERC found that QFs of 20 MW or less are not
presumed to have access to wholesale markets.7
FERC defines avoided cost as “the incremental costs to an electric utility of electric energy or
capacity or both which, but for the purchase from the qualifying facility or qualifying facilities,
such utility would generate itself or purchase from another source.”8 Today, solar and wind
facilities are the most common types of small power production facility QFs in the United States.
State PUCs determine the methods utilities must use to calculate the avoided cost energy and
capacity rates paid to QFs, but these methods vary significantly.9 Avoided cost energy and
capacity rates are typically developed through one of the following methods: the utility’s next
planned unit; the estimated cost of a new marginal unit (typically a peaking unit); the estimated
systemwide costs from a production cost model; a fuel-indexed rate; a market-based price or
index; or a request for proposal (“RFP”) process.10 Generally speaking, smaller QFs less than 100
kW receive avoided cost rates pursuant to a standard tariff as required by FERC, while larger QFs
5 FERC’s PURPA regulations are contained in 18 C.F.R. §§ 292. Several resources are available to provide a background on PURPA, which is not the focus of this whitepaper. We recommend R. Burns and K. Rose, PURPA Title II Compliance Manual, March 2014, for further background. 6 FERC revised its PURPA regulations in 2006 in Order No. 688, New PURPA Section 210(m) Regulations Applicable to Small Power Production and Cogeneration Facilities, Order No. 688, 117 FERC ¶ 61,078 (2006).
7 18 C.F.R. §§ 292.601(c)1. FERC proposed to reduce this threshold from 20 MW to 1 MW in a September 2019 Notice of Proposed Rulemaking, Notice of Proposed Rulemaking, Qualifying Facility Rates and Requirements, 168 FERC ¶ 61,184 (2019).
8 Under PURPA, the rates electric utilities pay QFs must be: 1) just and reasonable to the electric utility’s customers and in the public interest; non-discriminatory toward QFs and cogenerators; and not exceed the “incremental cost to the electric utility for alternative Energy. See e.g. 16 U.S.C. 841a-3(b) and 3(d). 9 QFs can seek relief from FERC if they believe that a state Commission has not complied with FERC’s PURPA regulations. 10 R. Burns and K. Rose, PURPA Title II compliance Manual, March 2014, at 6.
3 of 20
receive a rate that is negotiated with the utility according to a methodology approved by the
state PUC.11 The cost of QF purchases is ultimately borne by customers.
Robust competitive electricity markets largely did not exist when PURPA was enacted in 1978, so
with FERC’s guidance, state PUCs used administrative methods as the only available mechanism
to estimate a utility’s avoided cost.12 However, as recognized in EPAct2005, competitive
electricity markets have developed throughout the U.S. in the past 40 years and now provide a
means to estimate a competitive benchmark for a utility’s avoided cost for energy and capacity.
Congress also instructed FERC to review PURPA implementation rules “from time to time.”13 In
addition to the creation and growth of competitive electricity markets, the fuel mix for electric
generation has evolved significantly since PURPA was enacted. For example, 1.9% of electric
generation in the U.S. came from solar and wind facilities in 2009, which increased to 9.7% in the
first six months of 2019.14 Furthermore, the U.S. Energy Information Administration forecasts
that renewable facilities are projected to be the most common source of generation additions in
the U.S. through 2050.15
The growth in renewable resources has been driven by state and federal policies to promote
renewable energy, consumer demand and declining installation costs. The installation costs of
solar and wind generation have declined dramatically in recent years due to technological
improvements, resulting in a significant decline in the contract rates of competitively determined
purchased power agreements (“competitive PPAs”) for solar and wind. For example, the
Lawrence Berkeley National Laboratory (“Berkeley Lab”) found that the levelized competitive
PPA prices for utility-scale photovoltaic solar declined by $20/MWh to $30/MWh per year (in
2017 dollars) on average between 2006 and 2012. Competitive solar PPA prices declined by a
smaller amount – approximately $10/MWh per year – between 2013 and 2016.16 Based on a
11 FERC defined 100 kW standard QF contract size in 18 CFR 292.304(c)(2). Note that some states offer standard contracts to qualifying facilities larger than 100 kW. For example, Oregon offers standard contracts to solar facilities up to 3 MW and other small power production facilities up to 10 MW. 12 See e.g., American Paper Institute v. AEP, 461 U.S. 402, 417 (1983) (“The Commission's order makes clear that the Commission considered the relevant factors and deemed it most important at this time to provide the maximum incentive for the development of cogeneration and small power production, in light of the Commission's judgment that the entire country will ultimately benefit from the increased development of these technologies and the resulting decrease in the Nation's dependence on fossil fuels”) emphasis added. 13 16. U.S.C. 824a-3(a). 14 US Energy Information Administration, September 2019 Monthly Energy Review, Table 7.2b Electricity Net Generation: Electric Power Sector. 15 U.S. Energy Information Administration, 2019 Annual Energy Outlook, Reference Case forecast of electric generation capacity. Note that “renewable energy” also includes hydroelectric generation but the majority of renewable growth is expected to come from non-hydro renewables like solar and wind. 16M. Bolinger and J. Seel, Utility-Scale Solar Empirical Trends in Project Technology, Cost, Performance, and PPA Pricing in the United States – 2018 Edition, September 2018, at 35.

4 of 20
sample of competitive wind PPA prices from the Berkeley Lab, the Department of Energy’s
(“DOE”) Office of Energy Efficiency & Renewable Energy estimates that competitively determined
PPA prices for wind in the interior U.S. region have declined from an average of $57/MWh in
2009 (in 2018 dollars) to $20/MWh in 2017, a gross decline of 65% and a compound average
decline of 12.3% per year.17
FERC and state PUCs have observed that the administrative methods state PUCs use to determine
avoided cost rates for QF contracts have not always tracked the declines observed in competitive
markets.18 As a result, state PUCs have identified numerous instances of specific utilities
overpaying for renewable QF energy and capacity relative to rates available through market
mechanisms, with such overpayments ultimately being borne by utility consumers.19 The analysis
presented below estimates the extent to which the QF contract prices in the sample differ from
the observed market trends of competitively determined wind and solar PPAs executed in the
last seven years for solar QFs and last 10 years for wind QFs.
III. Data and Methodological Approach
This section describes the data and methods used in the analysis. QF contract rates were provided
by several utilities on a confidential basis, and as such, the results are aggregated by QF contract
execution year to maintain the confidentiality of the utilities and QFs. Competitive PPA
benchmarks were derived from a sample of competitive PPA prices collected by the Berkeley Lab,
with sensitivities to account for possible differences in contract term. The competitive PPA
benchmarks represent contract rates the utilities may have been able to execute for solar and
wind generation at market-based prices, as opposed to the administratively determined avoided
cost rates paid to QFs. The remainder of this section describes the data and methods used to
estimate the competitive benchmarks used to compare with the administratively determined QF
contract rates in the sample.
A. QF contract sample background
Table 1 indicates the number of solar and wind QF contracts in the sample and the total capacity
as measured by nameplate capacity in MW. The QF contracts were analyzed based on the year
they were executed to determine the extent to which the administratively determined avoided
cost QF rates followed market and cost trends for solar and wind. The QF contracts in the sample
17 U.S. Department of Energy, Office of Energy Efficiency & Renewable Energy, 2018 Wind Technologies Market Report at 59. Over 80% of wind capacity in the U.S. is located in the Interior region which generally covers the central U.S (see Id. at p 2, Figure 1). 18 See e.g., Notice of Proposed Rulemaking, Qualifying Facility Rates and Requirements, 168 FERC ¶ 61,184 (2019) at note 101. 19 See e.g., The Honorable Travis Kavulla, Vice Chairman, Montana Public Service Commission before the United States House of Representatives Committee on Energy & Commerce Subcommittee on Energy hearing entitled “Legislation Addressing LNG Exports and PURPA Modernization”, January 19, 2018, Exhibit A.

5 of 20
represent most and, in many cases, all solar and wind QF contracts the utilities in the sample
have signed since 2009 (the sample does not include QF contract renewals). The unit of
observation is a single QF contract with one exception: one utility that provided the total QF
contract capacity that was executed at each administratively determined avoided cost rate
during the sample period.
Table 1: Summary of QF contract sample
Solar Wind
Number of QF contracts 629 79
Total capacity 6,311 MW 1,670 MW
Average QF capacity 9.2 MW 21.14 MW
Sample period 2009-2019 2009-2019
States 7 7 Note: All capacity is reported in nameplate MWac. The average capacity figure excludes records from a utility that provided aggregated QF contract information by contract vintage rather than individual QF facility. The total capacity and number of QF contract figures include this utility.
The QFs in the sample are generally located in states with a significant number of QFs.
Additionally, some of the states in the sample are in the footprint of an organized wholesale
electricity market (i.e., an independent system operator (“ISO”) or regional transmission
organization (“RTO”)), and some are not. While not a national sample, the data from 708 QF
contracts examined provide valuable insights about administratively determined avoided cost
rates established under PURPA for both wind and solar generation.
B. Competitive PPA benchmark prices
The analysis uses a sample of third-party utility-scale competitively determined solar and wind
PPA data collected and maintained by the Berkeley Lab to estimate a market-based benchmark
price for the QF contract rates in the sample. Berkeley Lab provides the caveat that the
competitive PPA prices it maintains should be analyzed for trends rather than focusing on specific
price points.20 Thus, while our analysis calculates annual benchmarks and price differentials, we
use weighted-average PPAs each year and focus more on the general trends over the sample
period. As described below, the Berkeley Lab competitive PPA prices provide a means to
20 See e.g., M. Bolinger and J. Seel, Berkeley Lab, Utility-Scale Solar, Empirical Trends in Project Technology, Cost, Performance, and PPA pricing in the United States – 2018 Edition. U.S. Department of Energy, Office of Energy Efficiency & Renewable Energy, 2018 Wind Technologies Market Report, September 2018, at 59.
6 of 20
determine if the QF contract prices in the sample have generally aligned with trends in U.S. solar
and wind markets.
1. Berkeley Lab competitive PPA sample
The competitive solar and wind PPA prices in the Berkeley Lab sample are presented on a
levelized basis, as are the QF contracts.21 Two-thirds of the competitive PPA contracts are
nominal fixed-price contracts (i.e., the price in real terms declines at the rate of inflation). For the
sake of brevity, we frequently refer to the levelized competitive PPA prices and levelized QF PPA
prices as “PPA prices” and “QF prices,” respectively. The Berkeley Lab competitive PPA sample is
composed of contracts that included the long-term bundled sale of renewable energy credits
(“RECs”), energy, and capacity. The sample excludes long-term contracts established under
PURPA (e.g., the QF contracts in our sample) and contracts with rates set through a feed-in
tariff.22
Some wind and solar QF contracts in the sample do not include the value of the facility’s
renewable attributes (e.g., RECs), and others do. Given this, the prices of the competitive PPAs
used in this analysis (which include renewable attributes) are higher than they would have been
had the competitive PPAs excluded renewable attributes. In this respect, the competitive PPA
prices are a conservative benchmark for a QF contract that does not include the QF’s renewable
attributes. The competitive PPA prices also reflect federal and state tax incentives and are
presented by Berkeley Lab on a regional basis.23 QFs are also eligible for federal and state tax
incentives.
The Berkeley Lab PPA sample of competitive, utility-scale, solar PPA prices consists of 232
contracts totaling 14,461 MW of capacity signed as early as 2006. All of the competitive solar
PPAs in the sample are associated with “utility-scale” projects that are 5 MWac or larger.24 The
competitive solar PPA sample composition prior to 2013 did not align with the geographic
location of the utilities in the sample, so this analysis only uses competitive solar PPAs signed in
2013 or later. The competitive PPAs in the Berkeley Lab sample signed before 2013 are largely
based on projects in California and the Southwest and thus do not provide a meaningful
21 Berkeley Lab estimates levelized costs based on revenues during the life of the contract and assumed a 7% discount rate. The QF contracts were provided in, or converted to, a levelized rate. 22 State feed-in-tariff programs generally obligate retail utilities to purchase electricity from renewable producers under standard arrangements that specify prices, terms and conditions. As such, feed-in tariff rates are not the product of the market-based arms-length negotiations that produced the competitive PPA prices in the Berkeley Lab sample. 23 See e.g., M. Bolinger and J. Steel, Utility-Scale Solar, Empirical Trends in Project Technology, Cost, Performance, and PPA pricing in the United States – 2018 Edition, September 2018, at 30. 24 M. Bolinger and J. Steel, Utility-Scale Solar, Empirical Trends in Project Technology, Cost, Performance, and PPA pricing in the United States – 2018 Edition, September 2018, at 4.

7 of 20
benchmark for the QFs in the sample. Competitive PPAs signed in California and the Southwest
still constitute a significant portion of the data set after 2012, but the sample became more
representative of other regions after 2012, which is the first year we use in this analysis.25,26 The
Berkeley Lab competitive solar PPA sample includes PPAs executed in regions that align with the
QF contracts in the sample throughout the 2013-2019 period, making these competitive PPAs a
reasonable and robust source from which to estimate market-based prices for solar.27
The Berkeley Lab sample of competitive wind PPAs included 448 PPAs totaling 42,018 MW of
wind projects built as early as 1998.28 The competitive wind PPA sample consists of utility-scale
wind projects, which Berkeley Lab defines as having individual turbines of 100 kW or larger.29 The
regional composition of the competitive wind PPAs is more closely aligned with the states in the
QF sample throughout the sample period, so competitive wind PPAs signed on or after 2010 can
be used as a reasonable basis to estimate competitive market benchmarks for the wind QFs in
the sample.30
The Berkeley Lab sample includes competitive PPAs that vary by size, and project design and
engineering. However, the evidence suggests that specific technology choice or project size does
not have a significant impact on competitive PPA pricing. For example, the Berkeley Lab found
that beyond a certain threshold size, which the QFs in the sample exceed, project size is not a key
determinant of utility-scale competitive solar PPA prices.31 Additionally, other DOE research
demonstrates that wind installation costs fall when comparing projects in the 5-MW or less range
25 See e.g., M. Bolinger and S. Weaver, Utility-Scale Solar 2015 An Empirical Analysis of Project Cost, Performance, and Pricing Trends in the United States, Berkeley Lab, August 2016, at 30. 26 Furthermore, research indicates that solar installation costs in California exceeded costs in other areas of the nation (including states in the QF sample), which suggests that the competitive PPAs from the early years of the sample may be too high to compare with states other than California. See e.g. Fu, R., D. Feldman, and R. Margolis, U.S. Solar Photovoltaic System Cost Benchmark: Q1 2018, National Renewable Energy Laboratory, November 2018, Figure 27 “Q1 2018 benchmark by location: 100-MW utility-scale PV systems, EPC only (2018 USD/Wdc)”, which shows that California is estimated to have higher installation costs than most states. 27 M. Bolinger and S. Weaver, Utility-Scale Solar 2015 An Empirical Analysis of Project Cost, Performance, and Pricing Trends in the United States, Berkeley Lab, August 2016, at 36, Figure 20. 28 U.S. Department of Energy Office of Energy Efficiency & Renewable Energy, 2018 Wind Technologies Market Report, August 2019, at 58. 29 U.S. Department of Energy Office of Energy Efficiency & Renewable Energy, 2018 Wind Technologies Market Report, August 2019, at 1. 30 U.S. Department of Energy, Office of Energy Efficiency & Renewable Energy, 2018 Wind Technologies Market Report, August 2019, at 60, Figure 54. 31M. Bolinger and J. Seel, Utility-Scale Solar 2015, An Empirical Analysis of Project Cost, Performance, and Pricing Trends in the United States, Berkeley Lab, August 2016, at 16.

8 of 20
to the 5- to 20-MW range; economies of scale become less prevalent as projects increase above
20 MW.32
The same is generally true for project design and engineering. For example, the Berkeley Lab
found that within the sample of competitive solar PPAs, “the executed PPA price is the same
regardless of the ultimate project configuration, suggesting that the choice of tracking versus
fixed-tilt or [crystalline silicon] versus thin-film is (at least in these cases) not a critical
determinant of PPA pricing.”33 Accordingly, we do not adjust the competitive PPAs in the Berkeley
Lab sample for size or technology.
Overall, the Berkeley Lab sample of competitive PPAs are not a perfect market-based proxy for
the QFs in the sample because, like the solar and wind QF samples, they are based on a diverse
set of different wind and solar projects and PPA terms. The competitive benchmarks should not
be considered direct substitutes for QF rates, rather these market-based benchmarks should be
viewed as indicators of likely competitive contract rates and as such provide a meaningful
estimate of the extent to which the sample of solar and wind QF contracts compare to market
trends for solar and wind energy over the same period.
2. Contract term sensitivity
The term of the contracts in the Berkeley Lab sample of levelized competitive PPAs has various
term lengths, with 20 years being quite common.34 Contracts in the QF sample range from five
(only one) to 25 years, with many having a 15-year term. To compare the two samples, we
performed a sensitivity to estimate the impact of a shorter PPA term on the competitive PPA
prices. The evidence varies regarding the contract term length required to finance solar and wind
facilities. This analysis is agnostic on the issue, and we performed this sensitivity for comparison
purposes between the QF and Berkeley Lab samples only.
We estimated the impact of reducing the term of a competitive PPA price from 20 to 15 years
under two approaches. The first approach assumes that the project’s costs are recovered ratably
over the term of the competitive PPA and revenues remain constant in real terms during the life
of the project. Under this scenario, a 15-year and 20-year competitive PPA price would be the
32 U.S. Department of Energy, Office of Energy Efficiency & Renewable Energy, 2018 Wind Technologies Market Report, August 2019, at 51-52 and Figure 47. 33 M. Bolinger and J. Seel., Utility-Scale Solar 2015, An Empirical Analysis of Project Cost, Performance, and Pricing Trends in the United States, August 2016, at 33, note 46. 34 For solar, see e.g., M. Bolinger and J. Steel, Utility-Scale Solar, Empirical Trends in Project Technology, Cost, Performance, and PPA pricing in the United States – 2018 Edition, Berkeley Lab, September 2018, at note 39 stating that the average term is 22.5 years and the sample range is 3-34 years. For wind, competitive PPA contract terms range from 5 to 35 years, with 20 being the most common at 56% of the sample. See U.S. Department of Energy Office of Energy Efficiency & Renewable Energy, 2018 Wind Technologies Market Report, August 2019, at note 64.

9 of 20
same regardless of term. If merchant energy revenues were forecast to rise at a rate above
inflation during and after the initial PPA term, we would then expect to see a shortening in PPA
term to result in a lower competitive PPA rate as project owners seek to realize these higher
revenues following the expiration of the initial PPA. This scenario has been referenced in various
industry articles as a means of explaining low observed competitive PPA rates.35 The second
approach is to simply assume that the present value of all project costs is collected during a 15-
year period and not 20 years. Under this scenario the 15-year competitive PPA rate would be
9.7% higher than the 20-year competitive PPA rate at a weighted average cost of capital of 12%.
Accordingly, we present two competitive PPA benchmarks: one that assumes a 15-year
competitive PPA price is equivalent to a 20-year competitive PPA price and a sensitivity that
increases the Berkeley Lab PPA prices by 9.7% to account for the fact that 15-year competitive
PPA prices may be higher than 20-year competitive PPA prices.
C. Levelized Cost of Energy
The levelized cost of energy of a given project is the present value of that project’s costs, levelized
on an annual basis.36 Although a given project’s LCOE does not generally equal a competitive PPA
price for that project, the Berkeley Lab found that for both solar37 and wind,38 a project’s LCOE
closely tracks its competitive PPA price. As such, after accounting for applicable incentives that
reduce a project’s costs, a project’s LCOE can be used as a “first order approximation” of that
project’s competitive PPA price.39 We used the relationship between competitive PPAs and LCOEs
to estimate the extent to which wind and solar QFs’ contract prices aligned with market trends,
notably the steep decline in the installed costs of solar and wind observed during the 2009-2019
period.
We used the National Renewable Energy Laboratory’s (“NREL”) Cost of Renewable Energy
Spreadsheet Tool (“CREST”) model to estimate how the LCOE of generic solar and wind projects
changed over the 2009 to 2018 period in the states included in the sample. The state-level solar
and wind LCOE estimates produced accounted for differences in state-level tax rates and solar
and wind capacity factors. The LCOEs also included the federal investment and production tax
35See e.g., E. Merchant, Is the Utility-Scale Solar Industry in a Finance Bubble?, Greentech Media, January 23, 2019, and C. Roselund, BENF: Betting on residual value is putting solar projects at risk, PV Magazine, November 28, 2016. 36 A generation project’s LCOE depends on several assumptions, such as installation costs, capacity costs, taxes, project performance, and assumed project life. 37 M. Bolinger and J. Steel, Berkeley Labs, Utility-Scale Solar, Empirical Trends in Project Technology, Cost, Performance, and PPA prices in the United States – 2018 edition, at 41. Specifically, “Levelized PPA prices track the LCOE of utility-scale PV reasonably well.” 38 U.S. Department of Energy, Office ore Energy Efficiency & Renewable Energy, 2018 Wind Technologies Market Report, at 69. Specifically, “PPA price trends reflect the levelized cost of wind energy”. 39 U.S. Department of Energy, Office ore Energy Efficiency & Renewable Energy, 2018 Wind Technologies Market Report, at 69.

10 of 20
credits and assumed that installation costs, which were based on NREL estimates, only varied by
year and not across states. We made this simplifying assumption because the focus of our LCOE
analysis was to track the trend in solar and wind LCOEs over the sample period rather than
differences in LCOEs across states. We assumed a 20-year project life and 60/40 debt/equity ratio
with cost of debt and equity of 8% and 12%, respectively for the generic solar and wind projects.40
IV. Results
The results of our analysis of the solar and wind QFs are provided below. Unless otherwise
indicated, all dollar figures are presented in 2018 constant dollars.41
A. Solar
Figure 1 below shows levelized QF contract rates by year of execution for the 629 solar QF
contracts in the sample. Pursuant to PURPA regulations, these QF contract rates are based on
the purchasing utility’s avoided cost. It is not surprising that the avoided cost rates would diverge
significantly from the competitive PPA benchmarks we estimate because avoided cost rates are
not designed to track the cost to provide solar (or wind) energy. Rather, the avoided cost
benchmarks are designed to reflect the utility’s administratively determined avoided cost at a
specific time based on the methodology used by the state PUC. As noted, the methods states use
to determine a utility’s avoided cost often do not reflect current market conditions and can vary
significantly.
Figure 1: Solar QF sample by contract vintage
40 Capital costs and debt to equity ratio are based on those used by Lazard in its Lazard’s Levelized Cost of Energy Analysis – Version 13.0, November 2019, at 2. 41 Dollar figures were converted to constant 2018 dollars using the Producer Price Index.

11 of 20
1. Solar QF comparison with competitive PPA benchmarks
Table 2 compares the solar QF avoided cost rates with two benchmark competitive PPA rates we
developed from the Berkeley Lab sample described in Section III.A. The first benchmark is the
annual MW-weighted average levelized competitive PPA rate of solar PPAs from the Berkeley Lab
sample (column 3 in Table 2 - “MW-wtd. avg. competitive PPA benchmark”). Although, in 2013,
the competitive benchmark solar PPA rate and the sample average QF rate were roughly
comparable, at $68.49/MWh and $69.02/MWh, respectively, the QF rates did not decline over
time as rapidly as the competitive solar PPA prices.
The fourth column of Table 2 (“MW-wtd. avg. competitive PPA benchmark”) compares the MW-
weighted average QF contract rates to our competitive PPA benchmark for contracts executed
through a market-based process in the same year. Specifically, we subtracted the applicable
annual competitive PPA solar benchmark from each QF in the sample, and the fourth column of
Table 2 presents the MW-weighted average of this difference by QF contract execution year.
Over the 2013-2019 period, this difference ranged between $0.53/MWh and $20.08/MWh. The
fifth column of Table 2 (“QF rate less PPA rate X total MWh”) multiplies the $/MWh differences
from the fourth column by the estimated annual MWh associated with each solar QF contract
and aggregates that figure by contract execution year.42 Analyzing all the QF contract vintages
(i.e., QF contracts signed between 2013 and 2019) results in an estimated overpayment of $116.8
million per year on a levelized basis, or $10.79/MWh on average.
As described in Section III.B.2, we performed a sensitivity on the competitive PPA benchmark
prices to account for the potential contract term difference between the Berkeley Lab solar
competitive PPAs and the QF contracts. This adjustment, shown in columns 6 through 8 of
Table 2, increased the competitive PPA rates by 9.7% (“PPA15”) and reduced the estimated
MW-weighted average differential between the QF and competitive PPA rates over the 2013-
2019 period from $10.79/MWh to $6.27/MWh. After accounting for the MWh associated with
each QF contract, the term sensitivity reduced the estimated overpayments from $116.8 million
to $67.9 million.
42 Estimates were based on QF nameplate capacity and average solar capacity factors by state from the Berkeley Lab, available at https://emp.lbl.gov/pv-capacity-factors.

12 of 20
Table 2: Solar QF avoided cost rates versus competitive PPA benchmarks (2018 $) Competitive benchmark PPA Term sensitivity (PPA15)
Year MW-wtd. avg.
QF rate
MW-wtd. avg. competitive
PPA benchmark
MW-wtd. avg. QF rate
less PPA rate
QF rate less PPA rate
X total MWh
Term-adjusted
benchmark PPA15
MW-wtd. avg.
QF rate less PPA15 rate
QF rate less PPA15 rate
X total MWh
($/MWh) ($/MWh) ($/MWh) ($000) ($/MWh) ($/MWh) ($000)
2013 $69.02 $68.49 $0.53 $1,645 $75.13 ($6.11) -$6,993
2014 $62.29 $55.82 $6.47 $15,432 $61.24 $1.05 $979
2015 $62.37 $47.38 $14.99 $39,939 $51.97 $10.39 $27,170
2016 $59.49 $39.40 $20.08 $19,114 $43.23 $16.26 $15,481
2017 $50.33 $42.69 $7.65 $9,074 $46.83 $3.50 $3,487
2018 $41.74 $22.52 $19.22 $12,941 $24.70 $17.04 $11,474
2019 $39.38 $22.52 $16.86 $18,671 $24.70 $14.68 $16,254
Compound average annual growth rate
-8.9% -16.9%
-16.5%
Aggregate annual difference across vintage and MWh per year $116.8 million
or $10.79/MWh $67.9 million
or $6.27/MWh Note: All $/MWh figures are presented on levelized annual basis.
The estimates in Table 2 are only presented on an annual basis because it is not entirely clear if
and when each QF project came online. However, once a QF comes online, the differences
between the QF rate and the competitive PPA benchmarks would persist for the term of the QF
contract. Accounting for the term of each solar QF contract results in a total overpayment
estimate of $1.87 billion if the competitive PPA benchmark price is used, and $1.05 billion if the
term sensitivity benchmark PPA15 is used. However, we caution that some of the contracts in
the sample may not go into execution or may terminate prior to their initial contract term, so
actual overpayments could be lower.
Beyond exceeding our competitive solar PPA benchmark on an absolute level, the trend in the
solar QF contract rates did not follow general market trends for solar energy. For example, the
trend in avoided cost rates observed in the QF sample – as measured by the change in the MW-
weighted average annual QF contract price – declined at an average annual rate of 8.9% over the
2013 to 2019 period. This rate of decline was much slower than the competitive solar PPA prices
– also measured as the change MW-weighted annual average – which declined at a rate of 16.9%
over the same period. Figure 2 presents calculations in Table 2 graphically.

13 of 20
Figure 2: Solar QFs and competitive PPA benchmarks
It is important to note that the analysis in Table 2 compares the solar QF contract rates to
competitive PPAs for solar energy. This analysis does not compare the QF contract rates to the
purchasing utility’s actual avoided cost, which is likely to be much lower (e.g., energy purchased
from an ISO/RTO or a liquid trading hub). As such, the overpayments we estimate in Table 2 are
likely to be lower than any utility estimates of the extent to which that utility’s QF contracts
exceed its actual avoided costs. The same is true for the wind QF contract analysis in Table 3
below.
2. Solar levelized cost of energy trends
Given the relationship between a solar project’s LCOE and the competitive solar PPA rate noted
in Section III.C above, we also estimated how the avoided cost rates in QF contracts compared to
the LCOE of a generic solar project. The LCOE estimates we calculated are a rough approximation
of each QF project’s LCOE because we do not have sufficient information to estimate each QF’s
LCOE.
However, it is informative to compare the trend of the sample QF contract rates with the LCOE
of a generic unit of the same type. We used NREL’s CREST model and solar installation benchmark
cost data between 2010 and 2018 to calculate the LCOE of a generic fixed-tilt utility-scale solar
system in each state that a solar QF in the sample was located. Figure 3 plots the MW-weighted
average of these state-level solar LCOEs for purposes of comparison with the MW-weighted
average solar QF contract price each year. For this comparison, we assume that the 2009 MW-
weighted average QF contract rate changes throughout the sample at the same year-over-year
change as the generic photovoltaic LCOEs estimated in CREST (green line in Figure 3).43 Our solar
43 We calculated the generic solar PV project trend by computing MW-weighted average of the generic project’s LCOE each year, using the MW of QFs executed in each state that year as weights.
$0
$20
$40
$60
$80
$100
$120
$140
$160
$180
2013 2014 2015 2016 2017 2018 2019
20
18
leve
lized
$/M
Wh
execution year
Lev. QFs Lev PPA Lev. PPA15

14 of 20
LCOE estimates indicate that the solar LCOE in the states in the sample declined by 73.1% over
the 2009-2018 period, which was significantly higher than the 45.5% decline observed in the MW-
weighted average QF solar contract rate over the same period. Our LCOE estimates are roughly
in line with Lazard’s November 2019 LCOE estimates for solar PV, which Lazard estimates
declined by 89% over the 2009-2019 period, or 20% per year on average (gray line in Figure 3).44
Figure 3: MW-wtd. avg. solar QF and generic solar PV LCOE trend comparisons
Additionally, NREL found that, from 2010 to 2018, the LCOE of utility-scale PV declined by
between 80% and 82%.45 As shown in Figure 3, the trends in the sample solar QF contracts have
not followed well-documented trends in the decline of solar PV installation costs.
B. Wind
Figure 4 below plots the 79 wind QF contracts in the sample, which, pursuant to PURPA
regulations, are based on the purchasing utility’s administratively determined avoided cost. The
average QF wind avoided cost contract rates, presented here in levelized 2018 $/MWh, declined
over the sample period (2009-2018) at a compound average annual rate of 12.4% per year.
44 Lazard, Lazard’s Levelized Cost of Energy Analysis – Version 13.0, November 2019, at 8. 45 R. Fu, D. Feldman, and R. Margolis, U.S. Solar Photovoltaic System Cost Benchmark: Q1 2018, National Renewable Energy Laboratory, November 2018, at 37.
$0
$10
$20
$30
$40
$50
$60
$70
$80
$90
2009 2010 2011 2012 2013 2014 2015 2016 2017 2018
20
18
leve
lized
$/M
Wh
execution year
Wtd. Avg. Lev. QF LCOE Trend Lazard CAGR

15 of 20
Figure 4: Wind QF sample by contract vintage
Like the solar analysis described above, we estimated competitive benchmark wind PPAs from
the Berkeley Lab wind PPA sample and compared them with the wind QF rates in the sample to
determine the extent to which the avoided cost rates reflected the market trends observed
during the sample period.
1. Wind QF comparison with PPA benchmarks
Table 3 compares the annual competitive benchmark PPA price and the PPA term length
sensitivity PPA15 for the 79 wind QF contracts in the sample. The figures in Table 3 were
developed using the same methodology employed to analyze the solar QFs in Table 2. As shown
in the fourth column of Table 3, wind QF contract rates exceeded the competitive wind
benchmark PPA by between $10.18/MWh and $40.45/MWh over the 2009-2018 period. The
average difference for all wind QF contracts executed between 2009 and 2018 yields a weighted-
average difference of $21.19/MWh, or $99.4 million per year on a levelized annual basis. Under
the term length sensitivity, which adjusts the competitive wind PPA benchmark upward by 9.7%
(PPA15), the total dollar difference across the contract vintages falls to $82.9 million per year on
a levelized basis, or $17.66/MWh.
$0
$10
$20
$30
$40
$50
$60
$70
$80
$90
$100
2009 2010 2011 2012 2013 2014 2015 2016 2017 2018
20
18
leve
lized
$/M
Wh
execution year

16 of 20
Table 3: Wind QF avoided cost rates versus competitive PPA benchmarks (2018 $) competitive benchmark PPA Term sensitivity (PPA15)
Year MW-wtd. avg.
QF rate
MW-wtd. avg.
competitive PPA
benchmark
MW-Wtd. Avg.
QF rate less PPA rate
QF rate less PPA rate
X total MWh
Term-adjusted
benchmark PPA15
MW-Wtd. Avg.
QF rate less PPA15 rate
QF rate less PPA15 rate
X total MWh
($/MWh) ($/MWh) ($/MWh) ($000) ($/MWh) ($/MWh) ($000)
2009 $95.63 $70.00 $25.63 20,124 $76.79 $18.84 14,824
2010 $86.24 $62.34 $23.91 11,369 $68.38 $17.86 8,494
2011 $64.22 $45.07 $19.15 4,036 $49.44 $14.78 3,123
2012 $78.93 $38.49 $40.45 16,718 $42.22 $36.71 15,172
2013 $62.88 $27.96 $34.92 8,635 $30.67 $32.21 7,958
2014 $47.97 $25.00 $22.97 9,052 $27.43 $20.54 8,067
2015 $29.44 $32.30
2016 $49.23 $26.48 $22.75 8,794 $29.05 $20.18 7,758
2017 $31.55 $19.00 $12.55 15,875 $20.84 $10.71 13,526
2018 $29.18 $19.00 $10.18 4,829 $20.84 $8.33 3,946
Compound average annual growth rate
-12.4% -13.5% Aggregate difference across contract vintages
$99.4 million
or $21.19/MWh $82.9 million or
$17.66/MWh Note: All $/MWh figures are presented on levelized annual basis.
Accounting for the term of the wind QF contracts yields an overpayment estimate of $1.99 billion
when using the competitive PPA benchmark price, and $1.65 billion if the adjusted competitive
PPA15 benchmark is used. The QF contract rates and competitive PPA benchmarks shown in
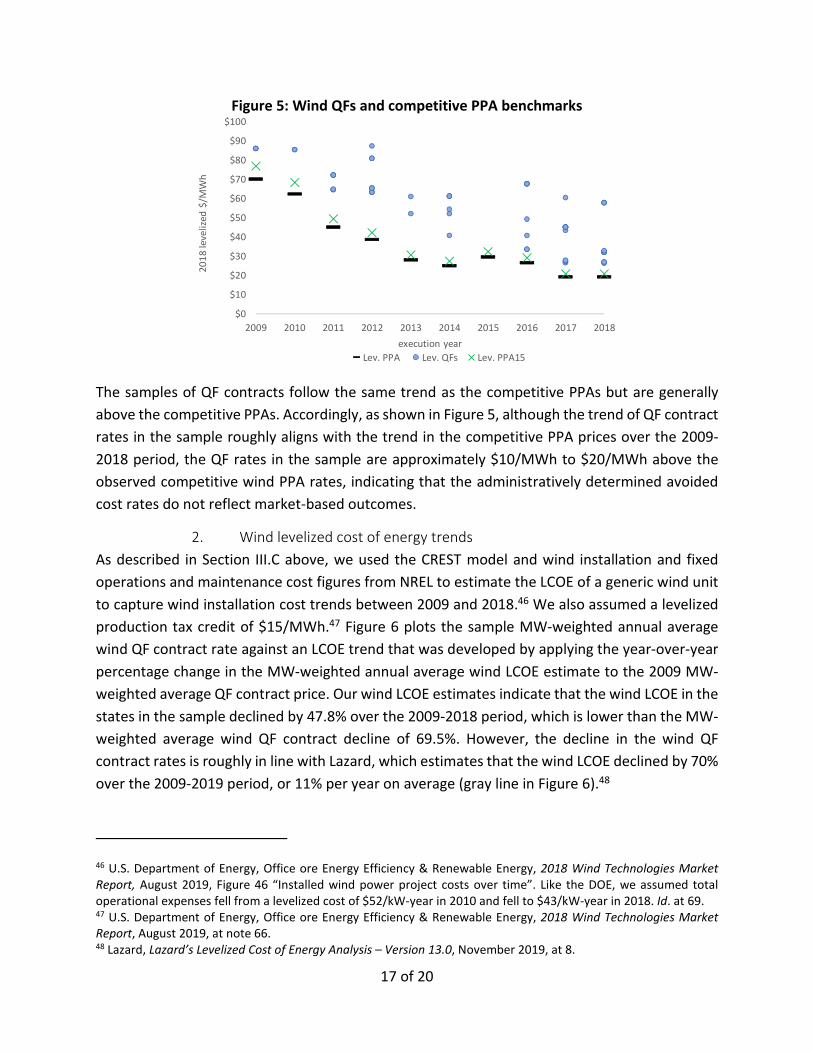
Table 3 are plotted in Figure 5 below.
17 of 20
Figure 5: Wind QFs and competitive PPA benchmarks
The samples of QF contracts follow the same trend as the competitive PPAs but are generally
above the competitive PPAs. Accordingly, as shown in Figure 5, although the trend of QF contract
rates in the sample roughly aligns with the trend in the competitive PPA prices over the 2009-
2018 period, the QF rates in the sample are approximately $10/MWh to $20/MWh above the
observed competitive wind PPA rates, indicating that the administratively determined avoided
cost rates do not reflect market-based outcomes.
2. Wind levelized cost of energy trends
As described in Section III.C above, we used the CREST model and wind installation and fixed
operations and maintenance cost figures from NREL to estimate the LCOE of a generic wind unit
to capture wind installation cost trends between 2009 and 2018.46 We also assumed a levelized
production tax credit of $15/MWh.47 Figure 6 plots the sample MW-weighted annual average
wind QF contract rate against an LCOE trend that was developed by applying the year-over-year
percentage change in the MW-weighted annual average wind LCOE estimate to the 2009 MW-
weighted average QF contract price. Our wind LCOE estimates indicate that the wind LCOE in the
states in the sample declined by 47.8% over the 2009-2018 period, which is lower than the MW-
weighted average wind QF contract decline of 69.5%. However, the decline in the wind QF
contract rates is roughly in line with Lazard, which estimates that the wind LCOE declined by 70%
over the 2009-2019 period, or 11% per year on average (gray line in Figure 6).48
46 U.S. Department of Energy, Office ore Energy Efficiency & Renewable Energy, 2018 Wind Technologies Market Report, August 2019, Figure 46 “Installed wind power project costs over time”. Like the DOE, we assumed total operational expenses fell from a levelized cost of $52/kW-year in 2010 and fell to $43/kW-year in 2018. Id. at 69. 47 U.S. Department of Energy, Office ore Energy Efficiency & Renewable Energy, 2018 Wind Technologies Market Report, August 2019, at note 66. 48 Lazard, Lazard’s Levelized Cost of Energy Analysis – Version 13.0, November 2019, at 8.
$0
$10
$20
$30
$40
$50
$60
$70
$80
$90
$100
2009 2010 2011 2012 2013 2014 2015 2016 2017 2018
20
18
leve
lized
$/M
Wh
execution year
Lev. PPA Lev. QFs Lev. PPA15

18 of 20
Figure 6: MW-wtd. avg. wind QF and LCOE trend comparisons
Our wind LCOE analysis finds that the sample of wind QFs generally tracked with the LCOE trends
we estimated for wind in the states where the QF contracts were located. However, Figure 6
estimates trends and not levels. The analysis in Table 3 and Figure 5 demonstrates that the
sample wind QF contract rates exceeded the competitive wind PPA rates throughout the sample
period.
V. Using markets to calculate avoided costs
The market for competitive solar and wind generation is highly robust and competitive, which
means that market prices are readily available to establish avoided cost rates for QF energy and
capacity contracts. Such market-based avoided cost rates are preferable to administratively
determined rates because, as shown above, administratively determined rates can become
divorced from market conditions and result in customer overpayment.
Setting QF contract rates administratively without regard to current market conditions can also
result in inefficient investment over time because such rates encourage developers to locate in
jurisdictions with the highest avoided cost rates as opposed to areas where solar and wind energy
would be most effectively deployed, and therefore valuable to the utility and its customers.
Administratively determined avoided cost rates for QFs that are uniform across a utility’s
footprint also fail to account for the locational value of energy. Market-based prices based on
locational marginal price (“LMP”) or a liquid hub adjusted for delivery send better price signals
to QF investors about where and when to build. Conversely, failing to provide the proper price
signal with avoided cost energy (or capacity) rates gives QF developers the incentive to invest
where it is cheapest to build an interconnect, with no guarantee that such locations are those
that need additional generation the most.
As noted in a whitepaper by the National Association of Utility Regulatory Commissioners
(“NARUC”), a utility-run RFP provides a transparent means to determine a utility’s market-based
$0
$20
$40
$60
$80
$100
$120
2009 2010 2011 2012 2013 2014 2015 2016 2017 2018
20
18
leve
lized
$/M
Wh
execution year
Wtd. Avg. Lev. QF LCOE trend Lazard CAGR

19 of 20
avoided cost for energy and capacity as compared to administratively determined avoided cost
rates.49 For example, the Public Service Company of Colorado ran an all-source RFP in 2017 as
part of its electric resource planning process and received a significant number of bids from
renewable developers. Table 4 summarizes the competitive bids that developers submitted in
this RFP.
Table 4: Public Service Company of Colorado 2016 All Source solicitation responses
Technology type # of bids Bid MW
# of
projects
Project
MW
Median
bid price
($/MWh)
Solar 152 29,710 75 13,435 $29.50
Solar with battery storage 87 16,725 59 10,813 $36.00
Wind 96 42,278 42 17,380 $18.10
Wind and solar 5 2,612 4 2,612 $19.90
Wind with battery storage 11 5,700 8 5,097 $21.00
Wind, solar and battery storage 7 4,048 7 4,048 $36.60 Source: Public Service Company of Colorado, 2016 Electric Resource Plan, 2017 All Source Solicitation 30-day report (Public Version), December 28, 2017, Attachment A.
The median RFP solar bid of $29.50/MWh is almost half of the MW-weighted average solar QF
contract price of $59.49/MWh in 2016, without adjusting for inflation. Similarly, the MW-
weighted average wind QF contract price in 2016 was $49.23/MWh, over twice the median RFP
bid of $18.10/MWh.
49 T. Kavulla and J. Murphy, Aligning PURPA with the Modern Energy Landscape A Proposal to FERC, National Association of Utility Regulatory Commissioners, October 2018.

20 of 20
VI. Conclusions
We found that the avoided cost rates in the sample of solar and wind QF contracts we reviewed
generally exceeded rates that are realized in competitive markets for solar and wind energy. We
also found that trends in solar QF contracts did not reflect underlying cost trends because solar
installation costs declined far faster than the administratively determined QF rates. We estimate
that utilities and, in the end, customers overpaid in the approximate range of $150.7 million and
$216.2 million per year under the QF solar and wind contracts. Accounting for the full term of
the solar and wind QF contracts raises the total overpayment estimate to between $2.7 billion
and $3.9 billion, respectively.