rates vs cost per function point an updated cost analysis · · 2016-09-062016-09-06 · rates vs...
TRANSCRIPT

https://itconfidence2016.wordpress.com
Rates vs Cost per Function Point
4°International Conference on
IT Data collection, Analysis and Benchmarking
Los Angeles, CA (USA) – September 7, 2016
Rafael de la Fuente,Founder and CEO of LEDAmc
Dácil Castelo, Productivity & Estimations Area Director
Raúl Fernández, R&D&i Manager
[Insert here a picture]
An updated cost analysis

2 IT Confidence 2016 – September 7, 2016 https://itconfidence2016.wordpress.com
[Main title] Goals of the presentation
G1. Show the main conclusions derived from the Cost per Function Point vs Rates studies carried out by LEDAmc over the last three years, based on our experience and our customers’ software development projects information.
G2. Introduce quality performance vs productivity indicators in two real scenarios.

3 IT Confidence 2016 – September 7, 2016 https://itconfidence2016.wordpress.com
LEDAmc has been implementing Productivity and Quality Control Offices and Estimation Models for large companies since 2008 in Spain, Portugal and Colombia.
These companies have large costs on software development. Our repository gathers information from more than 18.000 software development projects (mainly adaptive maintenance projects), which allows us to have wide visibility over the relationship between development productivity and unit cost.
Our findings in terms of Rates vs. Cost per Function Point have been presented at several conferences in the past. We would like to share updated results with you as they evolve with the addition of new data and scenarios.
Background

4 IT Confidence 2016 – September 7, 2016 https://itconfidence2016.wordpress.com
Background Conferences
5 IT Confidence 2016 – September 7, 2016 https://itconfidence2016.wordpress.com
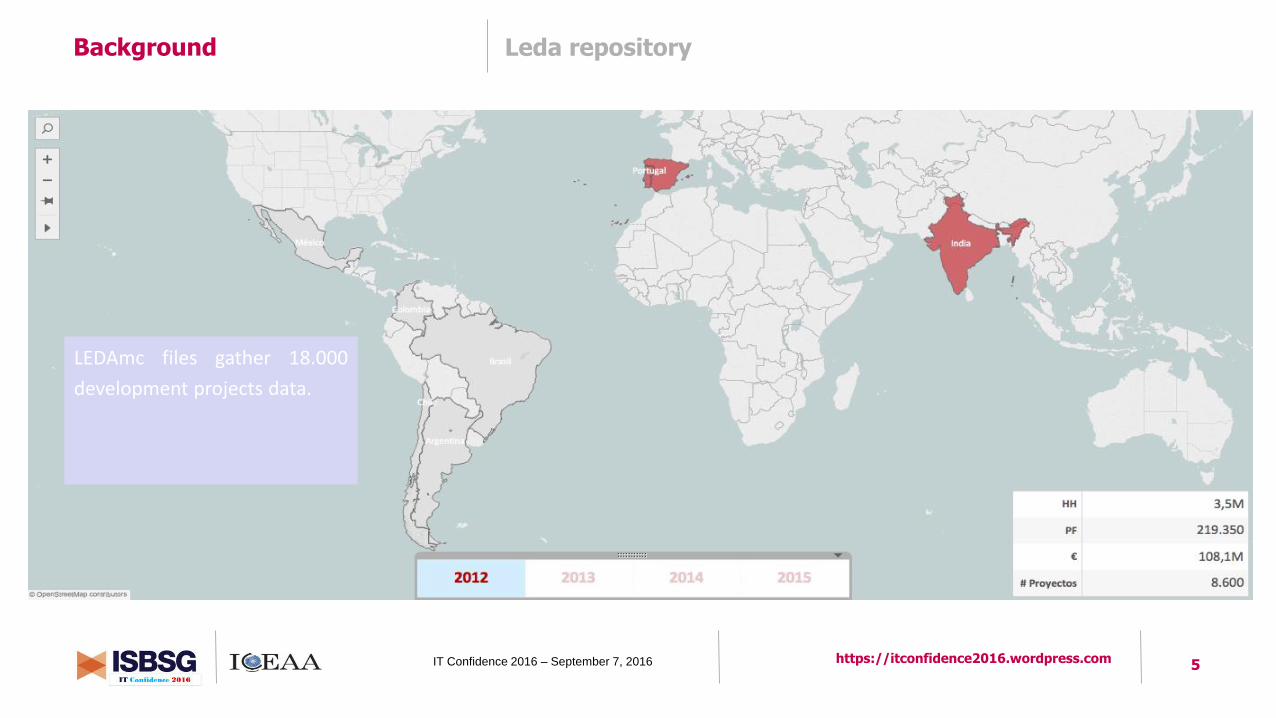
Background Leda repository
LEDAmc files gather 18.000
development projects data.

6 IT Confidence 2016 – September 7, 2016 https://itconfidence2016.wordpress.com
Background Leda repository
LEDAmc files gather 18.000
development projects data.

7 IT Confidence 2016 – September 7, 2016 https://itconfidence2016.wordpress.com
Background Leda repository

8 IT Confidence 2016 – September 7, 2016 https://itconfidence2016.wordpress.com
Background Leda repository
LEDAmc files gather 18.000
development projects data.

9 IT Confidence 2016 – September 7, 2016 https://itconfidence2016.wordpress.com
Rates vs cost per FP 2012 conclusions
Rate CUSTOMER-PROVIDER PAIR
Provider rates performance is very similar…

10 IT Confidence 2016 – September 7, 2016 https://itconfidence2016.wordpress.com
Rates vs cost per FP 2012 conclusions
Provider rates performance is very similar…
Rate FP cost CUSTOMER-PROVIDER PAIR
Pressure over rates creates a higher cost per FP

11 IT Confidence 2016 – September 7, 2016 https://itconfidence2016.wordpress.com
Rates vs cost per FP 2012 conclusions
FP cost
FP cost coming from the same provider has
significant variations for different customers
CUSTOMER-PROVIDER PAIR

12 IT Confidence 2016 – September 7, 2016 https://itconfidence2016.wordpress.com
Rates vs cost per FP 2012 conclusions
One-provider customers’ FP cost Multi-provider customers’ FP cost
Customers with only one provider have the higest FP cost
CUSTOMER-PROVIDER PAIR

13 IT Confidence 2016 – September 7, 2016 https://itconfidence2016.wordpress.com
Rates vs cost per FP 2014 conclusions
In our 2012 study we highlighted important mismatching as far
as FP cost is concerned (all providers and customers included)
CUSTOMER-PROVIDER PAIR

14 IT Confidence 2016 – September 7, 2016 https://itconfidence2016.wordpress.com
Rates vs cost per FP 2014 conclusions
In 2014, customers having implemented Estimation &
Productivity Control Models beneffited from a lowered FP cost
CUSTOMER-PROVIDER PAIR

15 IT Confidence 2016 – September 7, 2016 https://itconfidence2016.wordpress.com
Rates vs cost per FP 2014 conclusions
Customers adopting Estimation & Productivity Control Models tend to homogeneise
FP cost among their providers. They have information and they use it to balance to
reduce costs: the reference is the best provider
Customer
CUSTOMER-PROVIDER PAIR
16 IT Confidence 2016 – September 7, 2016 https://itconfidence2016.wordpress.com
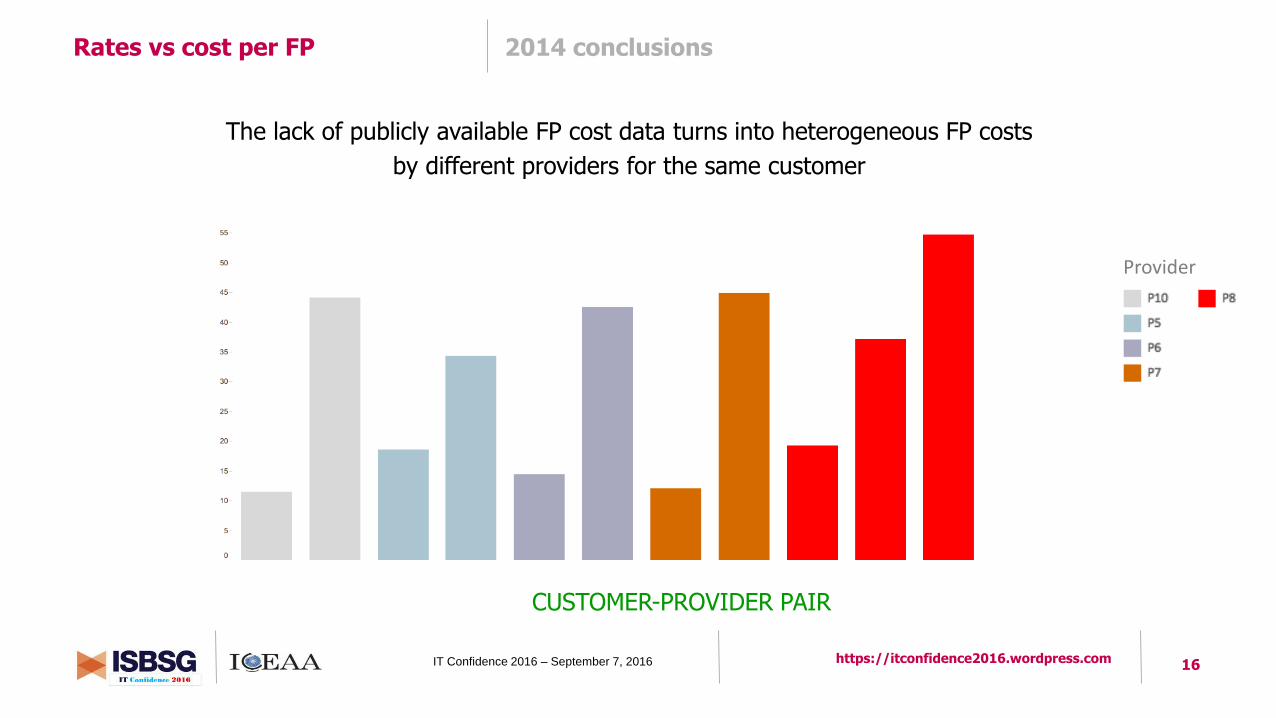
Rates vs cost per FP 2014 conclusions
The lack of publicly available FP cost data turns into heterogeneous FP costs
by different providers for the same customer
Provider
CUSTOMER-PROVIDER PAIR

17 IT Confidence 2016 – September 7, 2016 https://itconfidence2016.wordpress.com
During last year, LEDAmc has continued the activity of Productivity management
for several customers.
For all of them:
• Productivity increases
• Cost per FP decreases
• Control the real rates and their standardization
But… what happens with quality?
Rates vs cost per FP … during 2015

18 IT Confidence 2016 – September 7, 2016 https://itconfidence2016.wordpress.com
It is usually stated that:
• Quality and Productivity are traditional enemies.
• If one goes up, the other goes down.
• You cannot focus on both at the same time.
• Some (most of the) years they focus on cost reduction, and some other (fewer) years they focus on quality improvement.
Is this true?
Productivity and quality Introduction

19 IT Confidence 2016 – September 7, 2016 https://itconfidence2016.wordpress.com
We will introduce two case studies involving two customers with a different
behavior:
1. Customer getting constant productivity
2. Customer getting a significant productivity increase
How much quality did they get?
Productivity and quality Introduction

20 IT Confidence 2016 – September 7, 2016 https://itconfidence2016.wordpress.com
Customer introducing a Productivity & Quality Management Model over 4 years.
The evolution of the productivity index is refers to the first year.
Productivity and quality Case 1: constant productivity
Main Achievements: 2012: Stabilization period. Specialized provider. 2013: Development providers diversification. The effort of quality assurance is increased. 2014: Provider’s delocalization. 2015: Development process stabilization.

21 IT Confidence 2016 – September 7, 2016 https://itconfidence2016.wordpress.com
What happended with the end-to-end PF Cost?
Productivity and quality Case 1: constant productivity
The FP cost increased in 2013 and
subsequently decreased up to 5%
compared to the first reference.

22 IT Confidence 2016 – September 7, 2016 https://itconfidence2016.wordpress.com
And what happended with quality?
Productivity and quality Case 1: constant productivity
If we check just the evolution index of the number of errors in production, there is an increase of the number of errors in PRO in 2013 and an appreciable decrease afterwards.

23 IT Confidence 2016 – September 7, 2016 https://itconfidence2016.wordpress.com
If we normalize the errors in production by the software really produced…
Productivity and quality Case 1: constant productivity
Software quality in production improved in 2013 and remained constant. It is necessary to normalize the number of errors by the size of the software really produced in order to have a reliable index of quality.
PRO Error Density Indicator
24 IT Confidence 2016 – September 7, 2016 https://itconfidence2016.wordpress.com
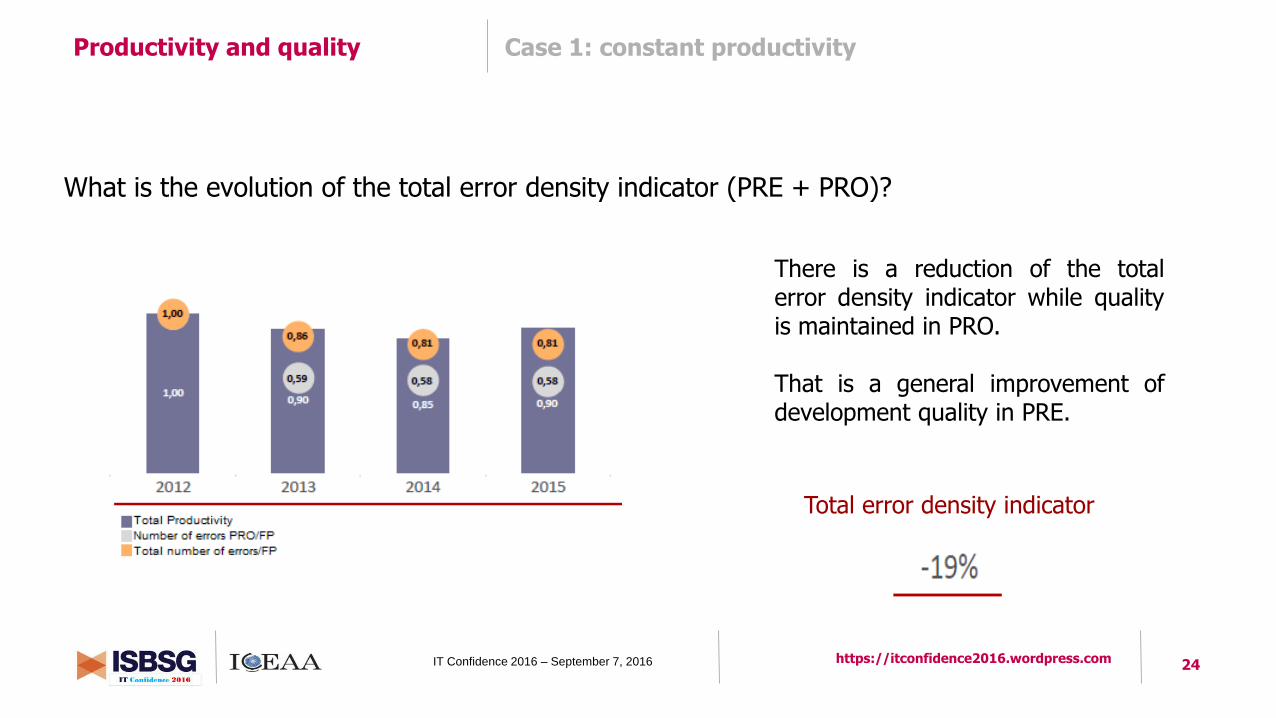
What is the evolution of the total error density indicator (PRE + PRO)?
Productivity and quality Case 1: constant productivity
There is a reduction of the total error density indicator while quality is maintained in PRO. That is a general improvement of development quality in PRE.
Total error density indicator

25 IT Confidence 2016 – September 7, 2016 https://itconfidence2016.wordpress.com
What are the economic consequences of this error total density indicator decrease?
Productivity and quality Case 1: constant productivity
The cost of solving an error in PRO
among our customers is between 1,5 and
3 times greater than the cost of solving it
in PRE, which means a 27% reduction of
bad quality cost per FP.
Bad quality cost

26 IT Confidence 2016 – September 7, 2016 https://itconfidence2016.wordpress.com
What are the economic consequences of this error total density indicator decrease?
Productivity and quality Case 1: constant productivity
According to Gartner, this cost
could increase up to 10 times
(image costs, loss of profit, etc.),
which involves up to 33% cost
savings for bad quality per FP.

27 IT Confidence 2016 – September 7, 2016 https://itconfidence2016.wordpress.com
Despite the 10% of productivity loss, in 2015 it was possible to achieve:
>> 42 % decrease of issues per FP.
>> 5 % decrease of the FP cost.
>> 19 % decrease of the total density of errors per FP, increasing the
efficiency during the testing process.
>> Up to a 33 % decrease of the bad quality per FP.
Productivity and quality Case 1: constant productivity

28 IT Confidence 2016 – September 7, 2016 https://itconfidence2016.wordpress.com
Actually, if productivity is constant, maybe the customer is only focusing on quality.
What happens if the customer focuses too much on productivity?
Productivity and quality Case 2: constant productivity

29 IT Confidence 2016 – September 7, 2016 https://itconfidence2016.wordpress.com
Customer implementing a Productivity Management Model over 4 years.
The evolution of productivity index refers to the first year.
Productivity and quality Case 2: constant productivity
Main achievements: 2012: low productivity and very expensive unit costs. 2013: Development diversification. Providers competition. Productivity management. 2014: The hiring model changed and agreements on the service level were introduced. Addition of new providers. Quality management begins. 2015: Addition of new providers in the competition.

30 IT Confidence 2016 – September 7, 2016 https://itconfidence2016.wordpress.com
As far as cost is concered, there is an improvement on the end-to-end development process efficiency.
Productivity and quality Case 2: constant productivity
If we consider the total costs of the
development process, such a
remarkable productivity increase
translates into a positive global
balance, while total FP cost decreases
by 45 % compared to the first control
year.

31 IT Confidence 2016 – September 7, 2016 https://itconfidence2016.wordpress.com
How has quality evolved?
Productivity and quality Case 2: constant productivity
Control begins in 2014 with the introduction of a joint quality and productivity management model. If we only assess the evolution of the indicator of number of errors in production, it decreases in PRO during 2015 compared to the same period during the previous year.

32 IT Confidence 2016 – September 7, 2016 https://itconfidence2016.wordpress.com
How has quality evolved?
Productivity and quality Case 2: constant productivity
Control begins in 2014 with the introduction of a joint quality and productivity management model. If we only assess the evolution of the indicator of number of errors in production, it decreases in PRO during 2015 compared to the same period during the previous year.

33 IT Confidence 2016 – September 7, 2016 https://itconfidence2016.wordpress.com
How has quality evolved?
Productivity and quality Case 2: constant productivity
If we normalize errors in production compared to the software really produced, software quality released in production improved in 2015. It is necessary to normalize the number of errors compared to the size of the software really produced in order to have a reliable index of quality.
PRO Error Density Indicator

34 IT Confidence 2016 – September 7, 2016 https://itconfidence2016.wordpress.com
How has total error density indicator evolved (PRE+PRO)?
Productivity and quality Case 2: constant productivity
If we consider the total amount of errors in PRE and
PRO (together) per FP, total error density indicator
has increased.
Since density of errors in PRO has decreased,
development quality delivered in PRE has decreased
(greater error density in PRE).
Therefore, the efficiency of the testing process
increases.
Total Error Density Indicator

35 IT Confidence 2016 – September 7, 2016 https://itconfidence2016.wordpress.com
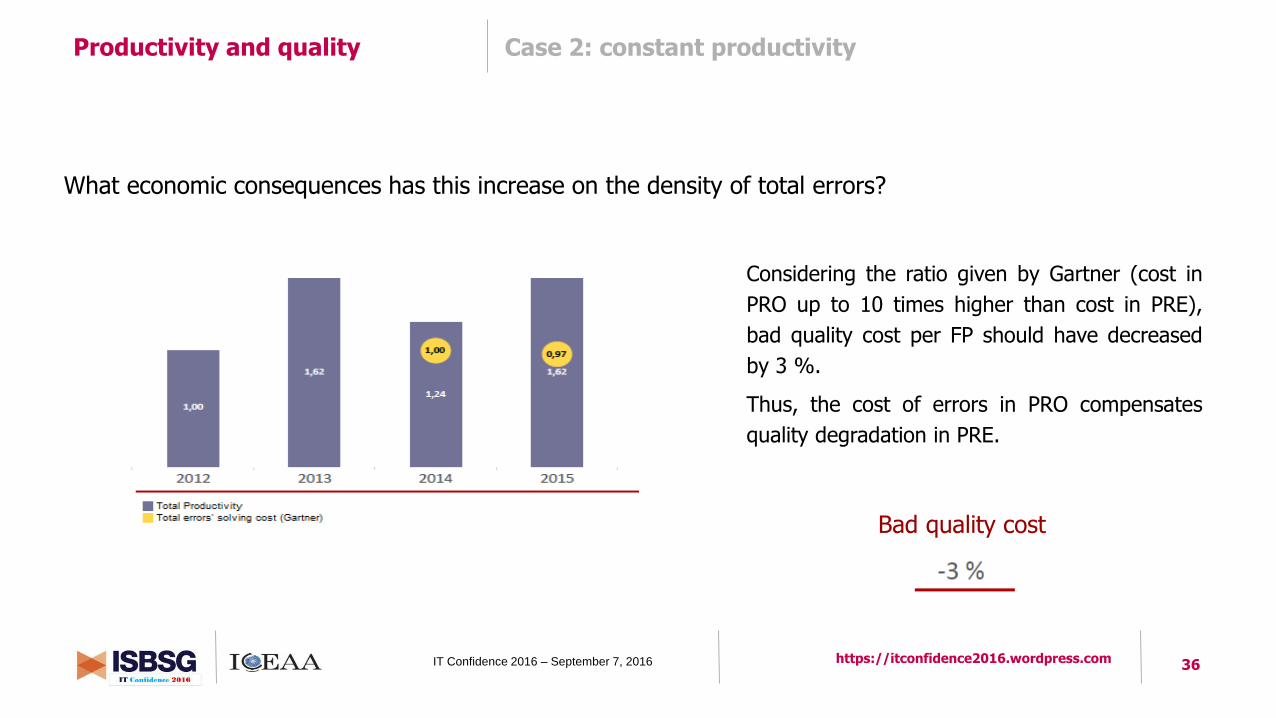
What economic consequences has this increase on the density of total errors?
Productivity and quality Case 2: constant productivity
If we consider that solving an error found in PRO is 3 times
greater than when found in PRE, bad quality cost stays
practically constant compared to the previous year.
Quality improvement in PRO does not compensate bad
quality in PRE in terms of costs and, in this scenario, it
involves a slight increase of bad quality total cost overall.
Bad quality cost
36 IT Confidence 2016 – September 7, 2016 https://itconfidence2016.wordpress.com
What economic consequences has this increase on the density of total errors?
Productivity and quality Case 2: constant productivity
Considering the ratio given by Gartner (cost in
PRO up to 10 times higher than cost in PRE),
bad quality cost per FP should have decreased
by 3 %.
Thus, the cost of errors in PRO compensates
quality degradation in PRE.
Bad quality cost

37 IT Confidence 2016 – September 7, 2016 https://itconfidence2016.wordpress.com
Besides the significant 62 % increase in productivity, some other achievements
can be mentioned:
>> A 20 % decrease of the number of issues in PRO per FP.
>> A 45 % decrease of the end-to-end FP cost.
>> Testing process efficiency increase (PRE).
>> Per-FP bad quality cost control.
Productivity and quality Case 2: constant productivity
38 IT Confidence 2016 – September 7, 2016 https://itconfidence2016.wordpress.com
>>> Customers having productivity models keep on saving
>>> Joint productivity and quality management is required (end-to-end vision)
>>> Global development costs can be reduced by improving quality
A balance between development costs, quality assurance costs and bad
quality costs must be found through efficient IT Government
Conclusions