an area-based model of species richness dynamics of...
TRANSCRIPT

Ecological Modelling, 58 ( 1991 ) 249-271 249 Elsevier Science Publishers B.V,, Amsterdam
An area-based model of species richness dynamics of forest islands
Jianguo Wu and John L. Vankat
Department of Botany, Miami UniversiO', OxJbrd, OH 45056, U.S.A.
(Accepted 13 May 1991)
ABSTRACT
Wu, J. and Vankat, J.L., 1991. An area-based model of species richness dynamics of forest islands. Ecol. Modelling, 58: 249-271.
Landscape fragmentation results in forest islands surrounded by a matrix of agricultural and urban lands. Species richness of forest islands may be composed of edge species and inte- rior species, at least above the minimum size necessary for the interior species. The species richness dynamics of these forest islands can be predicted by using mathematical modelling. Our area-based model describes the temporal dynamics of species richness of forest islands and depicts relationships between species richness and the edge, interior, and total area of forest islands. The mathematical model consists of a group of differential equations, and we also present results of a STELLA simulation model on woody species of deciduous forest islands. Simulations show that changes in species richness occur only when the area of forest islands is smaller than some threshold level which is different for the edge and interior species groups, that edge and interior species respond differently to the changes in island area, and that time delays embedded in community level responses may be important to understanding species richness dynamics of forest islands. The STELLA model is capable of simulating the dynamics of edge, interior, and total species richness with a variety of additional scenarios involving the change in area of forest islands.
INTRODUCTION
Human alteration of forested landscapes has resulted in the isolation of forest fragments. These forest patches or islands are subject to a new en- vironment in a changed landscape context. The dynamics of species richness in forest islands has been a major concern of recent scientific research. Modelling the dynamics of forest islands has been attempted from different approaches (Rudis and Ek, 1981; Weinstein and Shugart, 1983; Baker, 1989). Recent studies have explored the potential application of the theory of island biogeography (Munroe, 1953; MacArthur and Wilson, 1967; Wu, 1989) to the dynamics of forest islands surrounded by non-forested landscapes (e.g.,
0304-3800/91/$03.50 © 1991 - Elsevier Science Publishers B.V.
250 J w u AND J.L. VANKAT
Burgess and Sharpe, 1981; Harris, 1984; Peterken and Game, 1984; Dzwonko and Loster, 1988).
For forest islands, the species-area relationship, S = cA: (where S is the number of species in an area A and c and z are constants), has been found relevant in some cases but not in others. For instance, Peterken and Game (1984), in the study of isolated woodlands in Central Lincolnshire, England, found that area alone best accounted for the total variance and, therefore, concluded that area was presumably functioning as a surrogate for all habi- tat factors combined. Dzwonko and Loster (1988) investigated 66 small woodlands isolated in the agricultural landscape of the Wierzbanowka Valley of Poland and showed that area was the most important predictor of species richness for numerous species groups (e.g., all species, trees, shrubs, herbaceous plants). Similar studies include Usher (1979) and Scanlan (1981) for vegetation, as well as more abundant studies on avifauna (e.g., Galli et al., 1976; Whitcomb, 1977; Whitcomb et al., 1981). In contrast, Levenson (1981) found in a study of isolated woodlots in southeastern Wisconsin that the richness of woody species was largely a function of disturbance rather than island area. Levenson (1981) also found that a minimum area of 2.3 ha is required for a forest island to have a mesic interior environment in which shade-tolerant interior tree species survive (also see Ranney et al., 1981). For avifauna, a minimum area of about 0.8 ha is reported elsewhere (cf. Leven- son, 1981). Of course, maximum species richness occurs when island size is large enough to accommodate both edge and interior species.
Based on previous empirical studies, we develop a mathematical model to depict the dynamics of species richness in response to changes in island area. Through STELLA simulation (Richmond et a1.,1987), our model generates temporal changes in species richness using static spatial data on the relation- ship between species richness and area.
MODEL FORMULATION
At least two types of habitat can be recognized in a forest island of suffi- cient size for its environment to differentiate: interior habitat near the center and edge habitat along the island border. Species in such a forest island, therefore, would include interior species, edge species, and species not restricted to either habitat. Because thethi rd group of species usually occurs in both edge and interior habitats, we assume that the trends in total species richness dynamics are representatively reflected by the combination of edge and interior species richness. For the purpose of pattern analysis rather than numerical point prediction of species richness, therefore, the total richness (R,) is expressed as the summation of interior species richness (Ri) and edge species richness (Re), i.e.,
AN AREA-BASED MODEL OF SPECIES RICHNESS DYNAMICS 251
R,= Ri + Re (1)
The rate of change in total species richness with respect to time is then
dRt dR, dR,, - + ( 2 )
dt dt dt
Area change is a fundamental aspect in forest island dynamics. The rate of change in species richness through time can be related to the rate of its change with respect to area. Specifically, the former is the product of the lat- ter and the first derivative of area with respect to time. Thus we have
dRi dRi dAi - ( 3 )
dt dA~ dt
o r
dRi dRi dA1 - ( 3 ')
dt dA, dt
and
dR,, dR~ dAe - - = - - - ( 4 ) dt dA,, dt
o r
dR,, dR,, dA1 dt dA, dt
(4')
where A,, Ai and Ae are the total, interior and edge area of a forest island, respectively. We assume the rate of change in richness with respect to area can be expressed as a function of area, namely
dR~ = f(A~) (5) dA~
or
dR~ = F~(At) (5')
dAi
and
dR,, = fi(A~) (6)
dAe
o r
252 J. WU A N D J.L. V A N K A T
dR,, = F~(A,) (6')
dA,
Although the exact mathematical forms off(Ai) , f,(A,,), F~(A,), and F,~(A,) are likely to be complicated and difficult to determine, a reasonable graphical representation of such functions may be obtained from empirical quantitative or qualitative studies.
The total area of a forest island, A,, is the sum of interior area, At, and edge area, A,,, i.e.,
A t = A i + A e (7)
So, the rate of change in the total area is simply the sum of the first derivatives of interior and edge area with respect to time:
d A t d A i dA,, - + - - ( 8 )
dt dt dt
Let the rate of change in the partial area with respect to the total area be a function of the total area, i.e.,
dAi = g~(A,) (9)
dA,
and
dAe = g,,(A,) (10) dAt
The rate of change in the total area can be estimated by examining the history of the forest island under question or may be simply assigned dif- ferent functions for simulation purposes. In reality, it may be determined by social, economic, and other factors in a rather complex manner. For the sake of simplicity, let it be a function of time:
dAt = h(t) (11) dt
Through a simple mathematical manipulation, we can link the temporal rate of change in partial area to that of the total area, that is
dAi dAi dA, - - - ( 1 2 )
dt dA, dt
and
AN AREA-BASED MODEL OF SPECIES RICHNESS DYNAMICS
dA,, dA,, dA1
dt dA, dt
253
(13)
Substituting equations 9, 10, and I I into equations 12 and 13 yields
dAi - = g~(Ar)h(t) (14) dt
and
dA,,
dt - g,,(A,)h(t) (15)
By referring to equations 3 -6 ' and equations 14 and 15, the following equa- tions which describe the temporal dynamics of interior and edge species richness can be derived:
dR - - ~ = f ( A 3 g~(A,) h(t) (16) dt
o r
dR, = Fi(A,) h(t) dt
(16')
and
dR,, = f ,(A,,) g,,(A,) h(t) dt
(17)
o r
dR,, = Fe(A,) h(t) dt
(17')
Thus, the change in species richness (AR = R 2 - R~) for a time period (At = t2 - t~), is obtained simply by integrating the above differential equations:
S'I ARi = f ( A i ) gi(A,) h( t ) dt l
(18)
o r
Fi(AI) h( t ) dt (for interior species) (18')
and

254 J wl.J A N D J.L. V A N K A T
If AR,, = f,(A,,) g,,(A,) h(t) dt (19) !
o r
AR,~ = 'i F,,(A,) h(t) dt (for edge species) (19') I
Because changes in species richness may not follow changes in area im- mediately, a time delay is likely to be involved in such a dynamic system. Therefore, equations 16 and 17 may be modified as
dRi - - = f ( A ~ ( t - T))g~(A,(t- T))h( t - T) (20) dt
o r
dRi = F~(d,(t- T ) )h ( t - T)) (20') dt
and
dR,, =f,(A,,(t- T))ge(A,(t- T ) )h ( t - T) (21)
dt
o r
dR,~ = F,,(At(t- T ) )h ( t - T) (21 ')
dt
where T denotes the delay time. Accordingly, the change in interior and edge species richness over a period of time can be expressed in the following integral forms, respectively:
I t2
ARi = f (A~(t- T)) gi(At(t- T)) h ( t - T)dt (22) t 1
o r
R=II and
Fi(A,(t- T)) h ( t - T)dt
f,(A,,(t- T)) g,,(A,(t- T)) h ( t - T)dt
(22')
(23)
AN AREA-BASED MODEL OF SPECIES RICHNESS DYNAMICS 2 5 5
o r
S'7 ARe = F, , (A, ( t - T)) h ( t - T ) d t I
(23't
Biologically, zero time delay in the model may imply that the pace of area change is slow enough for the community under consideration to reach a new steady state following an area change or that the species richness of a com- munity immediately adjusts to area changes. Non-zero time delay, on the other hand, recognizes that the community requires time to respond to area change.
The above equations can be used to simulate temporal dynamics of species richness by using static spatial data, i.e. to obtain time series from spatial series. For example, one can determine the actual slopes of the edge and inte- rior functions from field analysis (Levenson, 1981), and estimate the rates of change in edge and interior species richness with respect to the total or par- tial (edge and interior) area. However, it is important to understand the following factors. First, species-area curves are presumably (at least should be in principle) derived under steady state conditions. If the islands (oceanic, landbridge, or habitat islands) under consideration are not at steady state, a species-area curve obtained from them may not be representative because it may only be an arbitrary sample of a transient phenomenon. If we estimate the rate of change in richness with respect to area based on the species-area relationship, the model described by equations 18, 18', 19 and 19', therefore, represents steady state species richness. However, when time delay is involved (Eqns. 22, 22', 23, and 23'), the species richness predicted by the model will no longer necessarily correspond to the species-area relationship numerically.
Second, in accordance with the model, the steady state species richness is only dependent on the forest island area. In reality, it may also be affected by human perturbations, habitat diversity, succession, degree of landscape heterogeneity, etc. Therefore, our model applies only to forest islands with similar landscape context and disturbance history. In addition, the model assumes that seeds or propagules of all species are always available.
A S I M U L A T I O N E X A M P L E WITH STELLA
The simulation model
To illustrate the application and to explore behavioral patterns of the model, a simulation study with STELLA is conducted. STELLA was developed in the conceptual framework and methodology known as System
256 J WL1ANDJ.L. VANKAT
(a)
(b)
(c)
(d)
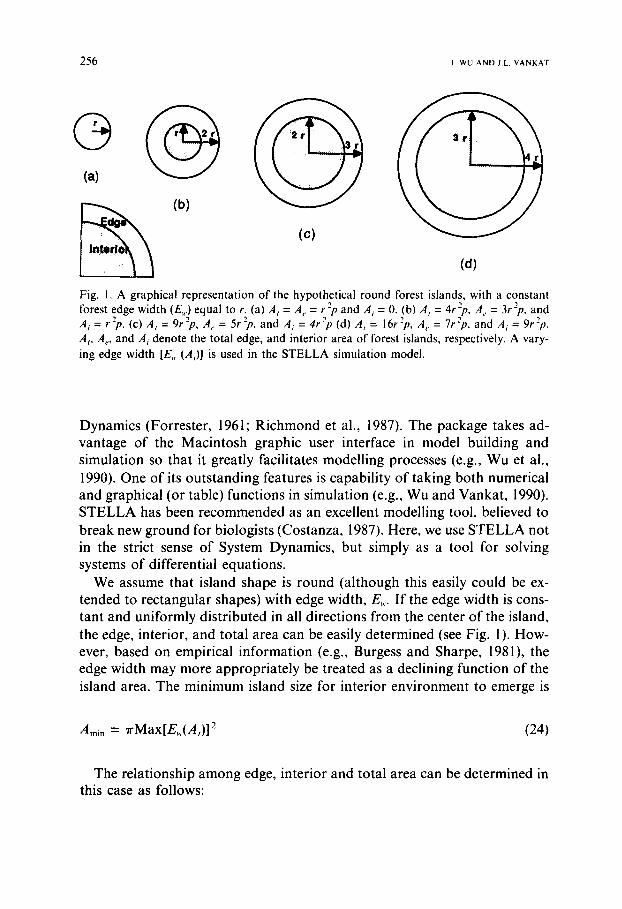
Fig. 1. A graphical representation of the hypothetical round forest islands, with a constant forest edge width (E,) equal to r. (a) A, = A,, = r :p and A i = 0. (b) A, = 4r2p. A,, = 3r'-p. and A i = r2p. (c) A t = 9rZp, A,. = 5r2p, and A, = 4 r ~ (d) A, = 16r2p, A,, = 7r2p, and A i = 9r2p. A t, A,,, and A~ denote the total edge, and interior area of forest islands, respectively. A vary- ing edge width [E,, (A,)] is used in the STELLA simulation model.
Dynamics (Forrester, 1961; Richmond et al., 1987). The package takes ad- vantage of the Macintosh graphic user interface in model building and simulation so that it greatly facilitates modelling processes (e.g., Wu et al., 1990). One of its outstanding features is capability of taking both numerical and graphical (or table) functions in simulation (e.g., Wu and Vankat, 1990). STELLA has been recommended as an excellent modelling tool, believed to break new ground for biologists (Costanza, 1987). Here, we use STELLA not in the strict sense of System Dynamics, but simply as a tool for solving systems of differential equations.
We assume that island shape is round (although this easily could be ex- tended to rectangular shapes) with edge width, E , . If the edge width is cons- tant and uniformly distributed in all directions from the center of the island, the edge, interior, and total area can be easily determined (see Fig. 1). How- ever, based on empirical information (e.g., Burgess and Sharpe, 1981), the edge width may more appropriately be treated as a declining function of the island area. The minimum island size for interior environment to emerge is
A m i n = 7 r M a x [ E , . ( A , ) ] 2 (24)
The relationship among edge, interior and total area can be determined in this case as follows:
AN AREA-BASED MODEL OF SPECIES RICHNESS DYNAMICS
2E..(A,) ~ - ~rE.,(A,) 2
when At < ,4rain
when At > -4rain
257
(25)
Ai = I 0 A t - 2E.,(A,) ~ + ~rE..(A,) 2
w h e n At -< Amin
when A t > Ami n
(26)
The rates of change in edge and interior area relative to total area can be obtained by differentiating equations 25 and 26, which are not necessary in this example because equations 22' and 23' are adopted.
Rt
Input_Func
Ai
At
Ew_Graph
Amin Ae Ew
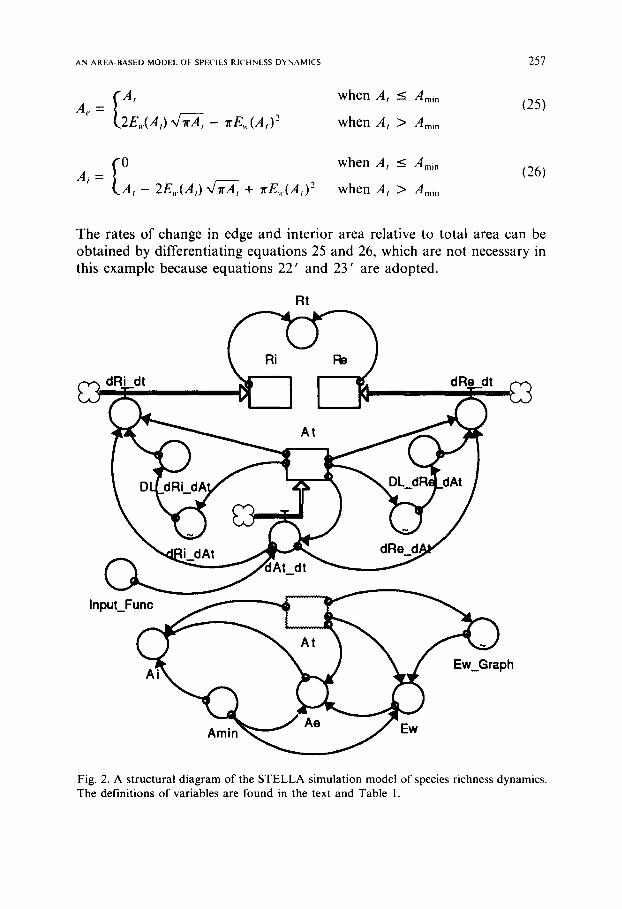
Fig. 2. A structural diagram of the STELLA simulation model of species richness dynamics. The definitions of variables are found in the text and Table I.
258 J WU A N D J . L V A N K A T
We assume the group of species to be modeled is composed of woody trees in forest islands, for example, in the eastern United States, so that we can base many estimations of parameters and relationships on empirical studies (e.g., Levenson, 1981; Burgess and Sharpe, 1981). Nevertheless, the numerical values of parameters in this simulation study are basically hypothetical and the emphasis here is on examination of the behavioral pat- terns of species richness relative to the change in forest island area. This sim- ple model includes three state variables (interior species richness, edge species richness, and island area), three rate variables associated with them, and several auxiliary variables which are necessary to make the model mathematically complete and workable. The relationships among the variables are shown graphically in the structural diagram (Fig. 2) and mathematically in the program listing (Table 1).
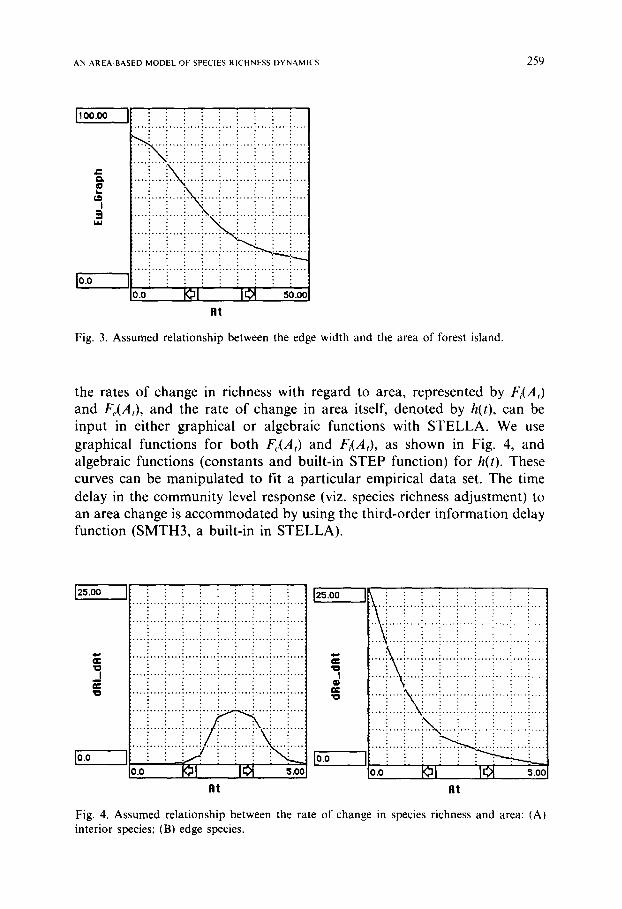
The minimum island area, Ami n, is assumed 2.3 ha (cf. Levenson, 1981) and Max[E,,(A,)] can therefore be calculated from equation 24. Edge width when island area is larger than the minimum size, i.e. E,(A, > Amin), is given by a graphical function (Fig. 3). Mathematical relationships between
TABLE 1
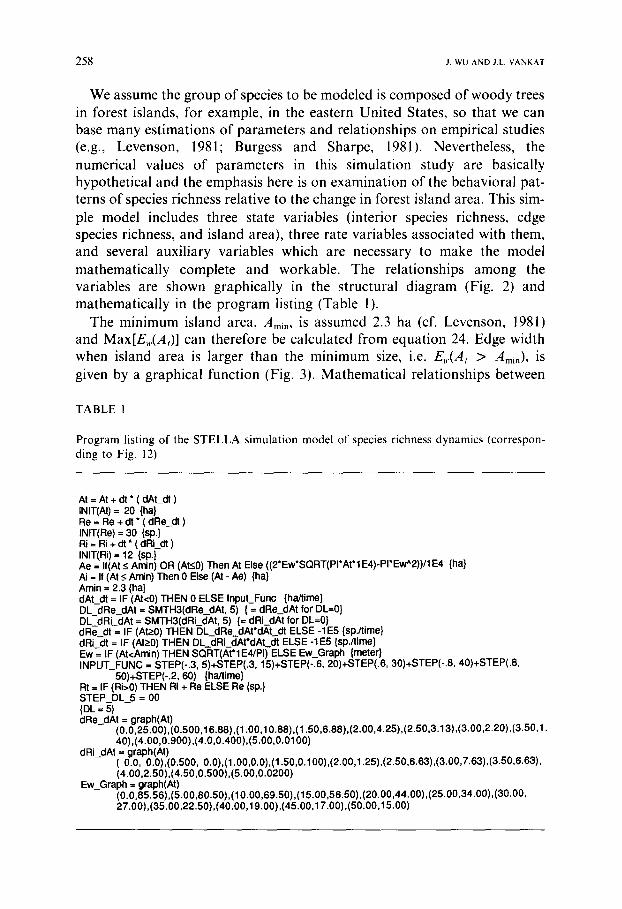
Program listing of the STELLA simulation model of species richness dynamics (correspon- ding to Fig. 12)
At = At + dt* ( dALdt ) INIT(At) = 20 {ha} R e = R e + d t * ( d R e d t ) INIT(Re) = 30 {sp.} Ri = Ri + dt * ( dRi_dt ) INIT(Ri) = 12 {sp.} Ae = If(At -< Amin) OR (A~0) Then At Else ((2*Ew*SQRT(PI*At*IE4)-PI*Ew^2))/1E4 {ha) Ai = If (At <_ Amin) Then 0 Else (At - Ae) {ha} Amin = 2.3 {ha} dAt_dt = IF (At<0) THEN 0 ELSE InpuLFun¢ {ha/time} DL dRe dAt = SMTH3(dRe_dAt, 5) { = dRe_dAt for DL=0} DL dRi dAt = SMTH3(dRi_dAt, 5) {= dRi_dAt for DL=0} d R e d t = IF (At>0) THEN DL dRe dAt*dAt_dt ELSE -1E5 {sp./time} d R i d t = IF (At;~0) THEN DL dRi dAt*dAt_dt ELSE -1E5 {sp./time} Ew = IF (At<Amin) THEN SQRT(At*IE4/PI) ELSE Ew Graph {meter} INPUT_FUNC = STEP(-.3, 5)+STEP(.3, 15)+STEP(-.6, 20)+STEP(.6, 30)+STEP(-.8, 40)+STEP(.8,
50)+STEP(-.2, 60) {ha/time} Rt = IF (Ri>0) THEN Ri + Re ELSE Re {sp.} STEP DL 5 = 0 0 {DL = 5} dRe_dAt = graph(At)
(0.0,25.00) ,(0.500,16.66) ,(1.00,10.68) ,(1.50,6.88),(2.00,4.25),(2.50,3.13),(3.00,2.20), (3.50,1. 40),(4.00,0.900),(4.0,0.400),(5.00,0.0100)
dRi_dAt = graph(At) ( 0.0, 0.0),(0.500, 0.0),(1.00,0.0),(1.50,0.100),(2.00,1.25),(2.50,6.63),(3.00,7.63),(3.50,6.63), (4.00,2.50),(4.50,0.500),(5.00,0.0200)
Ew_Graph = graph(At) (0.0,85.56),(5.00,80.50) ,(10.00,69.50),(15.00,56.50),(20.00,44.00),(25.00,34.00),(30.00, 27.00),(35.00,22.50),(40.00,19.00),(45.00,17.00),(50.00,15.00)
A N A R E A - B A S E D M O D E L O F S P E C I E S R I C H N E S S D Y N A M I C S 259
I,oo.oo
/ -
e~
I L~J
o.o
i i i i i i i i i .... i'"'i i '" 'i""i'"'i i i '"i .... .... .... ....
i!iii! iii!ii !iiii!i Io.o ~1 I~ ~o.ool
n t
Fig. 3. Assumed relationship between the edge width and the area of forest island.
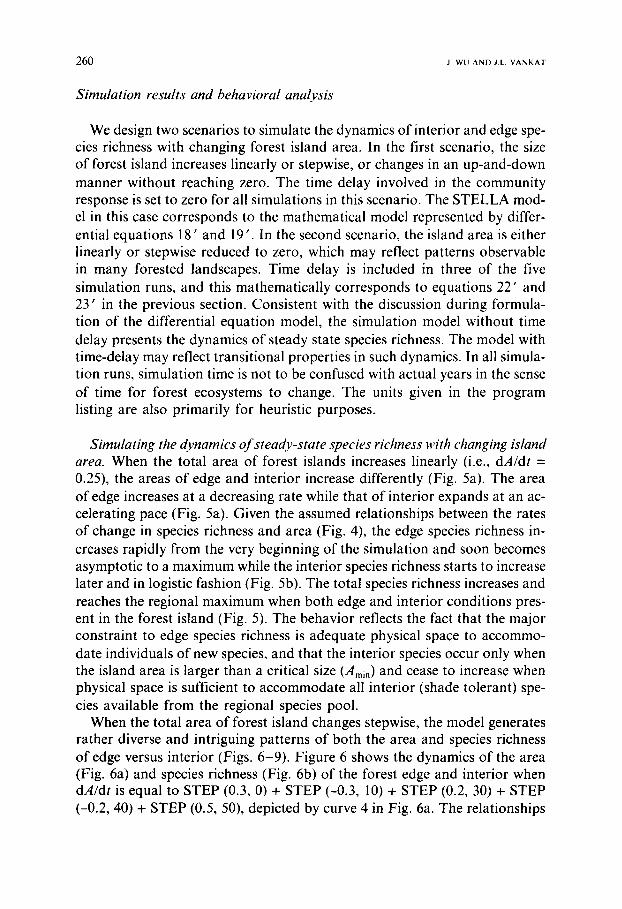
the rates of change in richness with regard to area, represented by Fi(A,) and F,.(A,), and the rate of change in area itself, denoted by h(t), can be input in either graphical or algebraic functions with STELLA. We use graphical functions for both F,,(A,) and Fi(A,), as shown in Fig. 4, and algebraic functions (constants and built-in STEP function) for h(t). These curves can be manipulated to fit a particular empirical data set. The time delay in the community level response (viz. species richness adjustment) to an area change is accommodated by using the third-order information delay function (SMTH3, a built-in in STELLA).
2 5 . 0 0
I
. . . . : : : ; : : : : : . . . . . . . . . . . . . . . . . . . . . . . . . . . . . . . . . . . .
: : : : : : : : : :
~ ~ ~ . . . . . . . . . . . . . . . . . . . . . . . .
A t
12~.oo
[o.o
ii~iiii iiiiiiill iiii iiiiiiill iiii ili i i , iiii~iiiiiiiiiiiiiiiiiiiiiiiiiiiiiiill ~i!
,liiiiiiiiiiiill IIII iiii iiiiiiiiiiiiiiiiii Io.o I~1 '1~ 5.ool
f i t
Fig. 4. Assumed relationship between the rate of change in species richness and area: (A) interior species; (B) edge species.
260 J WU A N D J.L. V A N K A T
Simulation results and behavioral analysis
We design two scenarios to simulate the dynamics of interior and edge spe- cies richness with changing forest island area. In the first scenario, the size of forest island increases linearly or stepwise, or changes in an up-and-down manner without reaching zero. The time delay involved in the community response is set to zero for all simulations in this scenario. The STELLA mod- el in this case corresponds to the mathematical model represented by differ- ential equations 18' and 19'. In the second scenario, the island area is either linearly or stepwise reduced to zero, which may reflect patterns observable in many forested landscapes. Time delay is included in three of the five simulation runs, and this mathematically corresponds to equations 22' and 23' in the previous section. Consistent with the discussion during formula- tion of the differential equation model, the simulation model without time delay presents the dynamics of steady state species richness. The model with time-delay may reflect transitional properties in such dynamics. In all simula- tion runs, simulation time is not to be confused with actual years in the sense of time for forest ecosystems to change. The units given in the program listing are also primarily for heuristic purposes.
Simulat&g the dynamics of steady-state species richness with changing island area. When the total area of forest islands increases linearly (i.e., dA/dt = 0.25), the areas of edge and interior increase differently (Fig. 5a). The area of edge increases at a decreasing rate while that of interior expands at an ac- celerating pace (Fig. 5a). Given the assumed relationships between the rates of change in species richness and area (Fig. 4), the edge species richness in- creases rapidly from the very beginning of the simulation and soon becomes asymptotic to a maximum while the interior species richness starts to increase later and in logistic fashion (Fig. 5b). The total species richness increases and reaches the regional maximum when both edge and interior conditions pres- ent in the forest island (Fig. 5). The behavior reflects the fact that the major constraint to edge species richness is adequate physical space to accommo- date individuals of new species, and that the interior species occur only when the island area is larger than a critical size (Amin) and cease to increase when physical space is sufficient to accommodate all interior (shade tolerant) spe- cies available from the regional species pool.
When the total area of forest island changes stepwise, the model generates rather diverse and intriguing patterns of both the area and species richness of edge versus interior (Figs. 6-9). Figure 6 shows the dynamics of the area (Fig. 6a) and species richness (Fig. 6b) of the forest edge and interior when dA/dt is equal to STEP (0.3, 0) + STEP (-0.3, 10) + STEP (0.2, 30) + STEP (-0.2, 40) + STEP (0.5, 50), depicted by curve 4 in Fig. 6a. The relationships

AN AREA-BASED M O D E L O F SPECIES R I C H N E S S D Y N A M I C S 261
(A) 3 Ae 4 dAt_dt 1 At 2 Ai
~) 20.00 4 1.00
|} ,~oo 4 0.500
| } 10.00 4 0.0
} 5.00 -0.500
i} o o -1.00 0.0 20.00 40.00 60.00 80.00
Time
(B) 2 Ri 3 Re 4 A t I Rt
i} 50.00 4 20.00
,~ .oo
it ~ - ° ° 10.00
} 12.50 5.00
i} o.o 0.0 0.0 20.00 40.00 60.00 80.00
Time
Fig. 5. Simulated temporal dynamics of forest islands with constant dA/dt equal to 0.25: (A) the edge, interior, and the total area; (B) the edge, interior, and total species richness (R,,, R,, and Rt).

2 6 2 J. WU AND J.L. VANKAT
20.00
1.00
15.00
0.500
10.00
0.0
5.00
-0.600
(A) 2 AI 3 Ae 4 dAt_dt
0.0
-1,00 0.0
50.00
20.00
. . . J
_ _ _ • -
20 .00 4 o . o o - " ' - 6o;o6 " ' - " 8 o . o o
Time
1 Rt
i} 4
it it iJ
O3) 2R i 3 Re 4 A t
37.50
15.00
25.00
10.00
12.50
5.00
0.0
! At
tJ It 4
!t
A
0.0 0.0 20.00 40.00 60.00 0.00
Time
Fig. 6. Simulated temporal dynamics of forest islands with changing dA/d t equal to STEP (0.3, 0) + STEP (-0.3, 10) + STEP (0.2, 30) + STEP (-0.2, 40) + STEP (0.5, 50): (A) the area of edge, interior, and the total island; (B) the edge, interior, and total species richness.

AN AREA-BASED MODEL OF SPECIES RICHNESS DYNAMICS 2 6 3
S°l I 40
30
r~ 20
0 2 4 6 8 10 12 14 16 18 20
Forest Island Area (At)
Fig. 7. Dynamics of species richness with increasing total area of forest islands, which is generated by the simulation run shown in Fig. 6.
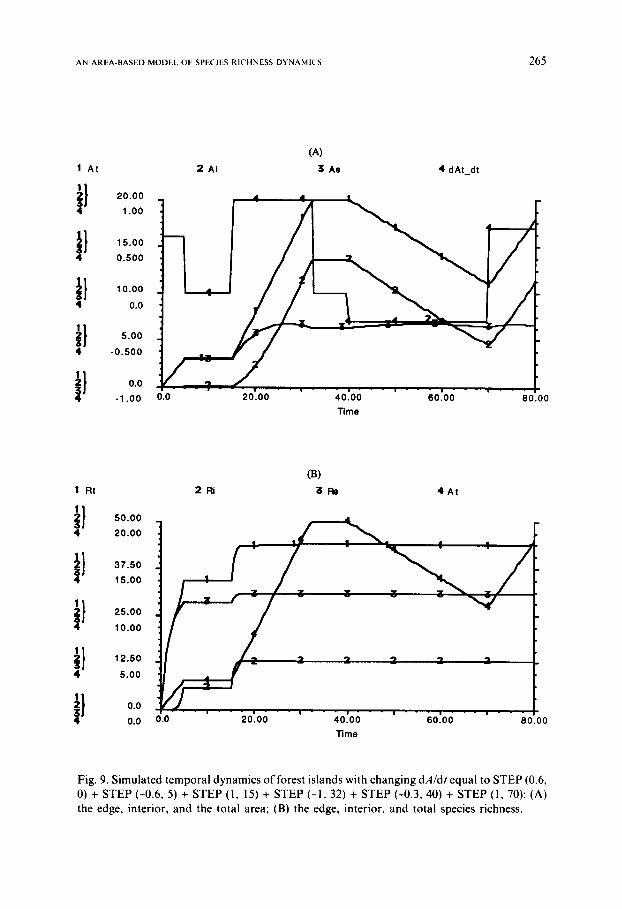
between the total, edge, and interior species richness and the total area of forest island generated by the simulation is presented in Fig. 7, which resem- ble the temporal dynamics shown in Fig. 5. Figures 8 and 9 are the results from two simulations in which the area of forest island changes rather drastically [dA/dt = STEP (0.6, 0) + STEP (-0.6, 5) + STEP (1, 15) + STEP (-1, 32) + STEP ( -0.6, 40) + STEP (1, 70) for Fig. 8 and dA/dt = STEP (0.6, 0) + STEP (-0.6, 5) + STEP (1, 15) + STEP (-1, 32) + STEP (-0.3, 40) + STEP (1, 70) for Fig. 9]. F rom Figs. 8a and 9a, it is apparent that the change of forest interior is more sensitive to that of the total area than is the forest edge. The total species richness changes corresponding to the changes in both the edge and interior species when the area is smaller than some threshold level, and remains constant above the threshold (Figs. 8b and 9b).
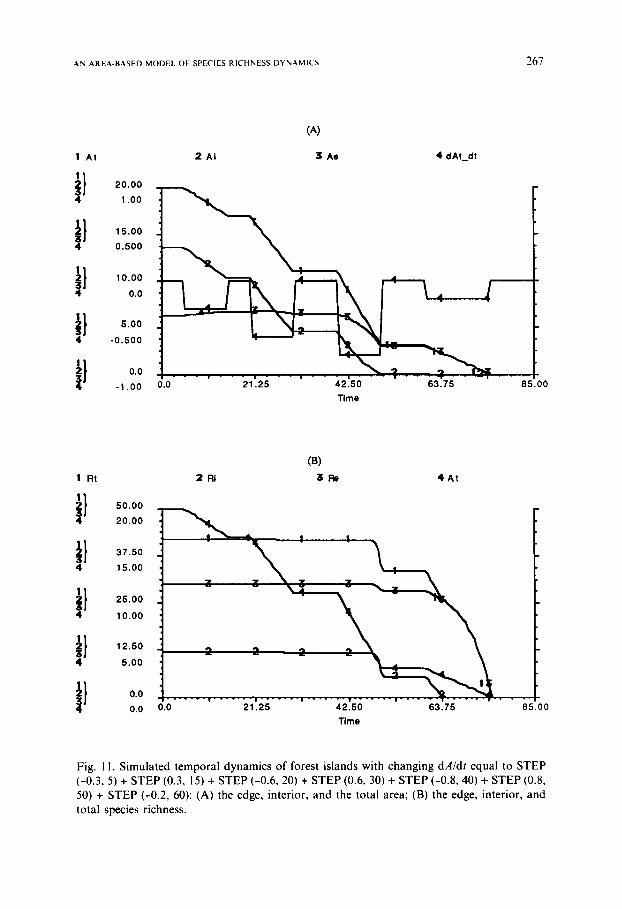
Simulating species richness dynamics in reducing forest islands with con- sideration of time delay. When the area of forest island decreases linearly (dA/dt = -0.25), a more realistic situation in most landscapes today, and when the time delay in the model is set to zero (Fig. 10a), species richness remains unchanged at first and then drops rapidly once the forest island is smaller than a threshold level (Fig. 10b). With a step function for the rate of change in area IdA~dr = STEP (-0.3, 5) + STEP (0.3, 15) + STEP (-0.6, 20) + STEP (0.6, 30) + STEP (-0.8, 40) + STEP (0.8, 50) + STEP (-0.2, 60)], the species richness again responds to the area change only when the thresh- old is reached (Fig. 11). In both simulation runs, the edge species seem less

264 J w u A N D J.L. V A N K A T
I A t
ii t} 4
tt 4
!t ii
(A) 2 Ai 3 Ae 4 dAt_dt
20.00 1.00 [
15.00 0.500
10.00
0.0
5.00
- 0 . 6 0 0 " -
0.0 -1.00 0.0 20.00 40.00 60.00 80,00
Time
1 Rt
ii ~o.oo 4 20.00
tt =,.o , , . o o
it ,~.oo 10.00
!I ,.o , . o o
It o.o 0.0
03) 2 RI 3 Re 4A t
I ! - " - ! !
0.0 20.00 40.00 60.00 80.00 Time
Fig. 8. Simulated temporal dynamics of forest islands with changing dA/dt equal to STEP (0.6, 0) + STEP (-0.6, 5) + STEP (1, 15) + STEP (-1, 32) + STEP (-0.6, 40) + STEP (1, 70): (A) the edge, interior, and the total area; (B) the edge, interior, and total species richness.
A N A R E A - B A S E D M O D E L O F S P E C I E S R I C H N E S S D Y N A M I C S 265
/ 0.0 20.00 idoo ' 6o~oo ' 8 o . o o
Time
2 A i
i
o ~
- v
- i -
(A)
3 Ae 4 dAt_dt 1 At
i} ooo 1.00
!} ,~.oo 0.500
I} ,ooo 4 0.0
i} ~oo 4 - 0 . 5 0 0
i} o o -1.0O
I Rt 2 Ri
i} ~ooo 4 20.00
15.00 I ' 7
I} ; ' - 25.00
4 10.00
.oo
i} o.o . . . . . . o.o o'.o ' 2o ' .oo -
O3)
3Re 4 A t
"it "/ :2 qt qt
. . . . . . . i - _ _ | - . _
' ~.o~oo ' 5 o . o o 5 o . o o
Time
Fig. 9. Simulated temporal dynamics of forest islands with changing dA/dt equal to STEP (0.6, 0) + STEP (-0.6, 5) + STEP (1, 15) + STEP (-1, 32) + STEP (-0.3, 40) + STEP (1, 70): (A) the edge, interior, and the total area; (B) the edge, interior, and total species richness.

266 J WU A N D J,L V A N K A T
I At
i) !) i} 4
!)
20.00
1.00
15.00
0.500
10.00
0.0
5.00
-0.500
0.0
-1.00
(A) 2 Ai 3 Ae 4 dAt_dt
0.0 21.25 42.50 63.75 85.00 Time
! Rt
i} 4
15.00
i } 25.00
4 10.00
!} 1~,o ~.oo
~) °.° 0.0
O3) 2 Ri 3 Re 4 A t
50.00
20.00
0.0
I 1 ! !
21.25 42.50 63.75 85.00
Time
Fig. 10. Simulated temporal dynamics of forest islands with constant dA/d! equal to -0.25: (A) the edge, interior, and total area; (B) the edge, interior, and total species richness.
A N A R E A - B A S E D M O D E L O F S P E C I E S R I C H N E S S D Y N A M I C S 267
I A t
i } 20.0O 4 1.00
i } 15.00 4 0.500
i } 10.00 4 0.0
!} -0.500
o o -1.00
(A)
2 Ai 3 Ae 4 dAt_dt
0.0 21.25 42.50 63.75 Time
85.00
I Rt
i } 5O.0O 4 20.00
} 37.50 4 15.00
} 25.00
4 10.00
} 12.50
4 5.00
(B) 2 RI 3 RB 4 A t
2 2 2
i } - . . , - . . , - . . , 0.0 0.0 0.0 21.25
1
\, v
- i - - - = - - -
42.50 63.75 Time
" " 85.00
Fig. 11. Simulated temporal dynamics of forest islands with changing dA/dt equal to STEP (-0.3, 5) + STEP (0.3, 15) + STEP (-0.6, 20) + STEP (0.6, 30) + STEP (-0.8, 40) + STEP (0.8, 50) + STEP (-0.2, 60): (A) the edge, interior, and the total area; (B) the edge, interior, and total species richness.
2 Ri I Rt
i l ooo 4 20.00
, .oo
it , .oo 10.00
} 12.50
5.00
I} o o
0.0
31:~
; !
\ , |
3 :] 2
- - - = - - - . - - - i . . . . i 0.0 21.25 42~5()
Time
! |
T I
63.75 85.00
4 A t
268 j w u a n D J i V A N K A T
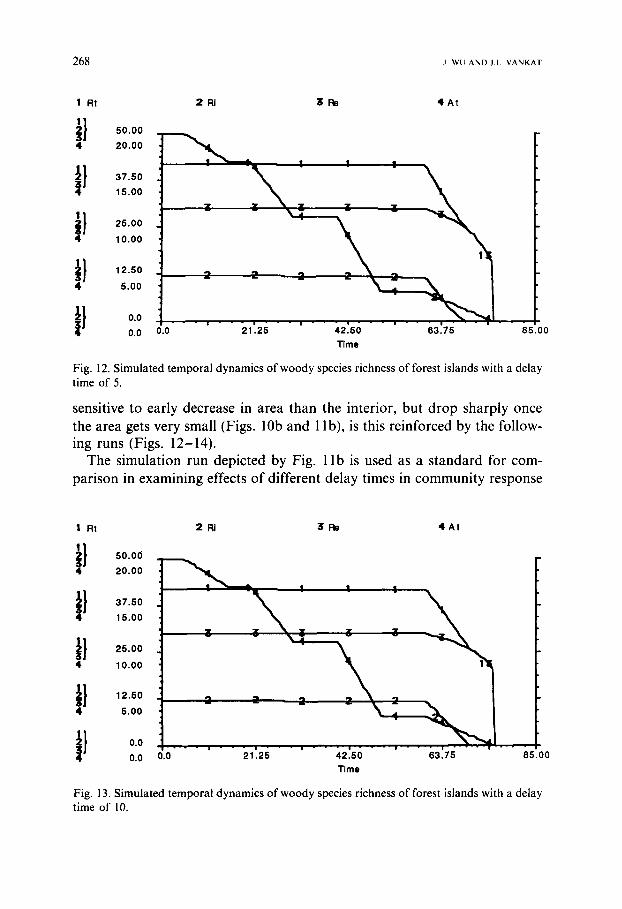
Fig. 12. Simulated temporal dynamics of woody species richness of forest islands with a delay time of 5.
sensitive to early decrease in area than the interior, but drop sharply once the area gets very small (Figs. 10b and 1 lb), is this reinforced by the follow- ing runs (Figs. 12-14).
The simulation run depicted by Fig. l i b is used as a standard for com- parison in examining effects of different delay times in community response
! Rt
i } 50.00 4 20.00
tt 15.00
t} ,~.oo 4 lO.OO
} 12.50 5.00
i} o o
0.0
2 RI 3 Fb 4 A t
!
. . . | -
0.0
" I I I
v
21.25 42.50 63.75 85.00 Time
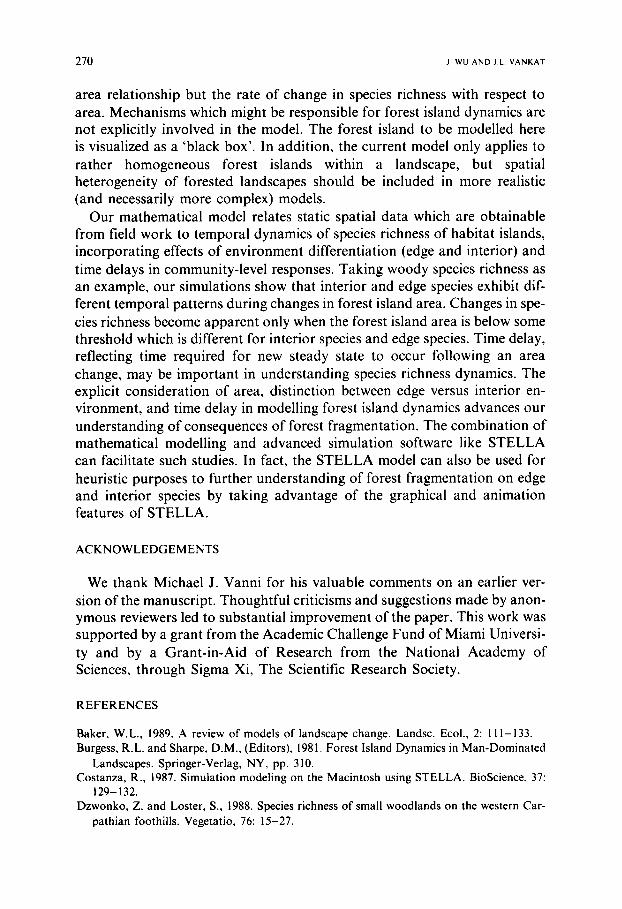
Fig. 13. Simulated temporal dynamics of woody species richness of forest islands with a delay time of 10.

A N A R E A - B A S E D M O D E L O F S P E C I E S R I C H N E S S D Y N A M I C S 269
I Rt
i) i} 4
It 4
!}
i}
2 Ri 3 Ro 4 A t
50.00 20.00
37.50 15.00
25.00
10.00
12.50
5.00
0.0 0.0
V-'x.. ! ...... : I I I
x , 3 :] 2 2 ~ . 2
- - - i - - - w - - - n - - - | - - - • - - - u - - - , - -
0.0 21.25 42.50 63.75 85.00 Time
Fig. 14. Simulated temporal dynamics of woody species richness of forest islands with a delay time of 20.
on the dynamic patterns of species richness. The same step function for the rate of change in area and different delay times are used for these simulations (Fig. 1 la). With a delay time of 5, the patterns of species richness dynamics show differences when the island area becomes small (starting from about 50 in simulation time, cf. Figs. 1 lb and 12). When the delay time increases (10 for Fig. 13 and 20 for Fig. 14), the decrease in species richness, especially in- terior species richness, slows relative to the non-delay standard run and the ultimate loss of species occurs more abruptly (Fig. 11). The species richness for an island size at a given time is larger than its steady state value; therefore, the species richness of a forest island or a nature reserve may be reduced if the area is not at a steady state. Omission or underest imation of effects of time delays may be one of the important factors in controversy in biogeographical studies regarding, especially, species-area relationship.
DISCUSSION AND CONCLUSIONS
The term 'steady state' used in this paper does not imply equilibrium nor a state at which the system remains unchanged infinitely. It is best unders tood as a relative term which has a defined time scale and applies to specific species groups. Al though data on the rate of change in species richness can be derived from species-area curves of varying form, the validity of our model does not necessarily depend on the classical species-area rela- tionship. This is because the input required by the model is not the species-
2 7 0 J WU AND J.L. V A N K A T
area relationship but the rate of change in species richness with respect to area. Mechanisms which might be responsible for forest island dynamics are not explicitly involved in the model. The forest island to be modelled here is visualized as a 'black box'. In addition, the current model only applies to rather homogeneous forest islands within a landscape, but spatial heterogeneity of forested landscapes should be included in more realistic (and necessarily more complex) models.
Our mathematical model relates static spatial data which are obtainable from field work to temporal dynamics of species richness of habitat islands, incorporating effects of environment differentiation (edge and interior) and time delays in community-level responses. Taking woody species richness as an example, our simulations show that interior and edge species exhibit dif- ferent temporal patterns during changes in forest island area. Changes in spe- cies richness become apparent only when the forest island area is below some threshold which is different for interior species and edge species. Time delay, reflecting time required for new steady state to occur following an area change, may be important in understanding species richness dynamics. The explicit consideration of area, distinction between edge versus interior en- vironment, and time delay in modelling forest island dynamics advances our understanding of consequences of forest fragmentation. The combination of mathematical modelling and advanced simulation software like STELLA can facilitate such studies. In fact, the STELLA model can also be used for heuristic purposes to further understanding of forest fragmentation on edge and interior species by taking advantage of the graphical and animation features of STELLA.
ACKNOWLEDGEMENTS
We thank Michael J. Vanni for his valuable comments on an earlier ver- sion of the manuscript. Thoughtful criticisms and suggestions made by anon- ymous reviewers led to substantial improvement of the paper. This work was supported by a grant from the Academic Challenge Fund of Miami Universi- ty and by a Grant-in-Aid of Research from the National Academy of Sciences, through Sigma Xi, The Scientific Research Society.
REFERENCES
Baker, W.L., 1989. A review of models of landscape change. Landsc. Ecol., 2:111-133. Burgess, R.L. and Sharpe, D.M., (Editors), 1981. Forest Island Dynamics in Man-Dominated
Landscapes. Springer-Verlag, NY, pp. 310. Costanza, R., 1987. Simulation modeling on the Macintosh using STELLA. BioScience, 37:
129-132. Dzwonko, Z. and Loster, S., 1988. Species richness of small woodlands on the western Car-
pathian foothills. Vegetatio, 76: 15-27.

AN AREA-BASED MODEL OF SPECIES RICH N E SS D Y N A M I C S 271
Forrester, J.W., 1961. Industrial Dynamics. MIT Press, Cambridge, MA, pp. 464. Galli, A.E., Leck, C.F. and Forman, R.T.T., 1976. Avian distribution patterns in forest
islands of different sizes in central New Jersey. Auk, 93: 356-364. Harris, L.D., 1984. The Fragmented Forest. University of Chicago Press, Chicago, IL, pp.
211. Levenson, J.B., 1981. Woodlots as biogeographic islands in southeastern Wisconsin. In: R.L.
Burgess and D.M. Sharpe (Editors), Forest Island Dynamics in Man-Dominated Land- scapes. Springer-Verlag, New York, NY, pp. 13-40.
MacArthur, R.H. and Wilson, E.O., 1967. The Theory of Island Biogeography. Princeton University Press, Princeton, N J, pp. 203.
Munroe, E.G., 1953. The size of island faunas. In: Proc. 7th Pacific Science Congress of the Pacific Science Association. Vol. N. Zoology. Whitcome and Tombs, Aukland, New Zealand, pp. 52-52.
Peterken, G.F. and Game, M., 1984. Historical factors affecting the number and distribution of vascular plant species in the woodlands of Central Lincolnshire. J. Ecol., 72: 155-182.
Ranney, J.W., Bruner, M.C. and Levenson, J.B., 1981. The importance of edge in the struc- ture and dynamics of forest islands. In: R.L. Burgess and D.M. Sharpe (Editors), Forest Island Dynamics in Man-Dominated Landscapes. Springer-Verlag, New York, NY, pp. 67-96.
Richmond, B., Pererson, S. and Vescuso, P., 1987. An Academic User's Guide to STELLA. High Performance Systems, Inc., Lyme, NH, pp. 392.
Rudis, V.A. and Ek, A.R., 1981. Optimization of forest island spatial patterns: methodology for analysis of landscape pattern. In: R.L. Burgess and D.M. Sharpe (Editors), Forest Island Dynamics in Man-Dominated Landscapes. Springer-Verlag, New York, NY, pp. 241-256.
Scanlan, M.J., 1981. Biogeography of forest plants in the prairie-forest ecotone of western Minnesota. In: R.L. Burgess and D.M. Sharpe (Editors), Forest Island Dynamics in Man- Dominated Landscapes. Springer-Verlag, New York, NY, pp. 97-124.
Usher, M.B., 1979. Changes in the species-area relations of higher plants on nature reserves. J. Appl. Ecol., 16: 213-215.
Weinstein, D.A. and Shugart, H.H., 1983. Ecological modeling of landscape dynamics. In: H.A. Mooney and M. Godron (Editors), Disturbance and Ecosystems: Components of Response. Springer-Verlag, New York, NY, pp. 29-45.
Whitcomb, R.F., 1977. Island biogeography and 'habitat islands' of eastern forest. Am. Birds, 31: 3-5.
Whitcomb, R.F., Robbins, C.S., Lynch, J.F., Whitcomb, B.L., Klimkiewicz, M.K. and Bystrak, D., 1981. Effects of forest fragmentation on avifauna of the eastern deciduous forest. In: R.L. Burgess and D.M. Sharpe (Editors), Forest Island Dynamics in Man Dominated Landscapes. Springer-Verlag, New York, NY, pp. 125-205.
Wu, J., 1989. The theory of island biogeography: Models and applications. J. Ecol. (CHN) 8(6): 34-39.
Wu, J., Barlas, Y. and Vankat, J.L., 1990. Modelling Patchy Ecological Systems Using the System Dynamics Approach. In: D.F. Andersen, G.P. Richardson and J.D. Sterman (Editors), System Dynamics, Vol. 111. Proc. 1990 Int. Syst. Dyn. Conf., The System Dynamics Society, pp. 1355-1369.
Wu, J. and Vankat, J.L., 1990. System Dynamics modelling of the theory of island biogeography. In: Proc. 5th Intern. Congr. Ecol., Yokohama, Japan, Aug. 23-30, 1990, pp. 413.