ami data management and analysis - stanford university · ami data management and analysis aaron...
TRANSCRIPT

Restricted © Siemens AG 2013 All rights reserved. usa.siemens.com/infrastructure-cities
AMI Data Management and Analysis
Aaron DeYonker – VP of Products – eMeter, A Siemens Company
2013 May 21

2013-May-21
Restricted © Siemens AG 2013 All rights reserved.
Page 2 A. DeYonker / eMeter
Lecture Overview
Bio Aaron DeYonker brings more than 15 years of IT product development experience to eMeter, a Siemens business. Aaron manages the entire product portfolio and global roadmap for the leading Smart Grid software platform, geared towards more efficient use of our natural resources. As the VP of Products, he leads R&D teams across the world on eMeter’s overall product strategy, design, engineering and usability to deliver a best-of-class enterprise platform and application suite for managing and using meter data. He serves as the primary representative for the eMeter product line, interacting with press, analysts, standards bodies, regulatory entities and user groups on a regular basis. He speaks at leading industry conferences. Aaron is proud to have achieved lead ‘Visionary’ status in Gartner Magic Quadrant 2 years in a row for eMeter’s enterprise software platform. Prior to eMeter, Aaron led product and program management teams for companies such as Microsoft and WebTV in domains ranging from telecommunications to consumer electronics. He is a graduate of the Honors Program in the College of Literature, Sciences and Arts at the University of Michigan, Ann Arbor Abstract Investments in broader and more precise measurement of consumption by electric, gas, and water utilities in recent years have set the wheel turning on the largest industry transformation since its inception at the turn of the last century. Aging infrastructure, increased global demand, distributed generation sources, and environmental legacy… the driving factors may vary but remain comprehensively global in the need for better measurement at the consumption end-point. After a decade-long focus on network build out and smart meter (read: “sensor”) installation, the data has finally started flowing. This lecture will address the state of the industry as it relates to Advanced Metering Infrastructure as it heads into Wave 2 of its immense transformation. What practical and theoretical challenges do utilities face as they struggle to make sense of new data sets? What opportunities arise for service providers? How will innovation and faster R&D cycles lead to unprecedented business transformation within the organizations? How will the geo-political landscape help/hinder momentum? This lecture serves as a broad and critical assessment of the state of AMI.

2013-May-21
Restricted © Siemens AG 2013 All rights reserved.
Page 3 A. DeYonker / eMeter
All you need to know about Aaron
• Product Manager at core • 12 Years in Consumer Internet/Electronics/Entertainment Technology and
Gaming • 4 years in Mission Critical Enterprise Software for Electric/Gas/Water Utilities
• (?!!!) • Certified “Engineer Whisperer” • Strong promoter of Agile Software Development

2013-May-21
Restricted © Siemens AG 2013 All rights reserved.
Page 4 A. DeYonker / eMeter
Today
I provide: • Brief context setting of Siemens and Smart Grid • Overview of eMeter and AMI (Advanced Metering Infrastructure) • Observations on the industry • Operational insight into what’s happening with AMI data You walk away with: • Better sense of the business of the Utility • What’s actually happening operationally with utilities • Some key gaps that need some mindshare from smart people • A sense of the challenges facing the “Vision of the Smart Grid”

2013-May-21
Restricted © Siemens AG 2013 All rights reserved.
Page 5 A. DeYonker / eMeter
Siemens Sectors and Divisions
Energy
Divisions
Fossil Power Generation
Wind Power
Solar & Hydro
Oil & Gas
Energy Service
Power Transmission
Healthcare
Divisions
Imaging & Therapy Systems
Clinical Products
Diagnostics
Customer Solutions
Industry
Divisions
Industry Automation
Drive Technologies
Customer Services
Infrastructures & Cities
Divisions
Rail Systems
Mobility and Logistics
Low and Medium Voltage
Smart Grid
Building Technologies

2013-May-21
Restricted © Siemens AG 2013 All rights reserved.
Page 6 A. DeYonker / eMeter
The Problems
Challenges in changing energy systems
Renewable and distributed generation
Limited generation and grid capacity
Aging and/or weak infrastructure
Cost and emissions of energy supply
Revenue losses, e.g. non-technical losses

2013-May-21
Restricted © Siemens AG 2013 All rights reserved.
Page 7 A. DeYonker / eMeter
The Solutions
Smart Grid Solutions
Balancing generation & demand,
new business models
Load management & peak avoidance
Reliability through automatic outage pre-vention and restoration
Efficient generation, transmission, distri-
bution & consumption
Full transparency on distribution level and automated loss
prevention

2013-May-21
Restricted © Siemens AG 2013 All rights reserved.
Page 8 A. DeYonker / eMeter
What is AMI?
Advanced Metering Infrastructure components: • Smart Meters • Communication Networks • Data Processing and Delivery What does it mean?

2013-May-21
Restricted © Siemens AG 2013 All rights reserved.
Page 9 A. DeYonker / eMeter
What is AMI?
Advanced Metering Infrastructure components: • Smart Meters • Communication Networks • Data Processing and Delivery What does it mean? We finally measure end-point consumption at a frequency that gets us closer to a true ‘sensor’ network for distribution of energy/water

2013-May-21
Restricted © Siemens AG 2013 All rights reserved.
Page 10 A. DeYonker / eMeter
What is eMeter?

2013-May-21
Restricted © Siemens AG 2013 All rights reserved.
Page 11 A. DeYonker / eMeter
What is eMeter?

2013-May-21
Restricted © Siemens AG 2013 All rights reserved.
Page 12 A. DeYonker / eMeter
What is eMeter?

2013-May-21
Restricted © Siemens AG 2013 All rights reserved.
Page 13 A. DeYonker / eMeter
What is eMeter?
eMeter supplies a data integration platform (EnergyIP®) for electric, gas and water utilities to collect and process consumption data from AMI systems. • The EnergyIP repository is the “Source of Truth” for revenue-grade
consumption data within the utility. • The platform also manages complex relationships between consumption data
and accounts/devices/services/ The platform makes revenue-grade data available to: • All enterprise and operational systems within the utility • Consumers • Authorized service providers outside the utility. eMeter also creates applications built on top of the platform to solve business problems not addressed by legacy enterprise systems.

2013-May-21
Restricted © Siemens AG 2013 All rights reserved.
Page 14 A. DeYonker / eMeter
AMI/Enterprise Integration Landscape
Electric Vehicles
Wind
Residential Metering
Appliance
Sub Metering
Outage Management
Demand Response
Customer Information Systems
Workforce Management
Data Warehouse

2013-May-21
Restricted © Siemens AG 2013 All rights reserved.
Page 15 A. DeYonker / eMeter
Application Example: Consumer Presentment

2013-May-21
Restricted © Siemens AG 2013 All rights reserved.
Page 16 A. DeYonker / eMeter
Today’s Practical Business Value
Consumer Data Access
Interval Billing
Outage Event Management
Register Billing
Remote Connect Disconnect
Automated Market Settlements
Customer Service Tools
Network Loss Management
Prepayment Support
Analytics

2013-May-21
Restricted © Siemens AG 2013 All rights reserved.
Page 17 A. DeYonker / eMeter
Warning: Obligatory Marketing Slides Approaching

2013-May-21
Restricted © Siemens AG 2013 All rights reserved.
Page 18 A. DeYonker / eMeter
eMeter – Proven Worldwide

2013-May-21
Restricted © Siemens AG 2013 All rights reserved.
Page 19 A. DeYonker / eMeter
Partnering for Success
Managed Services
Enterprise Applications AMI Providers SI’s & Resellers

2013-May-21
Restricted © Siemens AG 2013 All rights reserved.
Page 20 A. DeYonker / eMeter
Industry Recognition
Gartner December, 2012 Magic Quadrant for Meter Data Management Products
2011 Pike Pulse Report: Meter Data Management

2013-May-21
Restricted © Siemens AG 2013 All rights reserved.
Page 21 A. DeYonker / eMeter
No more marketing slides!

2013-May-21
Restricted © Siemens AG 2013 All rights reserved.
Page 22 A. DeYonker / eMeter
Key challenges in the ‘Utility’ Industry
“Typical” Smart Grid talking points… • Carbon emissions • Aging Infrastructure • Peak load reduction imperatives • Data Privacy • Etc… Less talked about…* • Increasing occurrence of abnormal weather events • Decrease in customer satisfaction • Aging work force • Lack of sophisticated IT staff
• Over dependence on integrators = Spaghetti architecture • Asset management – where are the Transformers?!
• Firewalls between the Grid and Back-office teams • Death grip on customer data • Odd market forces
• Regulatory uncertainty • Energy price volatility • Developing world electrification
• Lack of competence for Usability/User Experience *Source = Aaron’s head
2013-May-21
Restricted © Siemens AG 2013 All rights reserved.
Page 23 A. DeYonker / eMeter
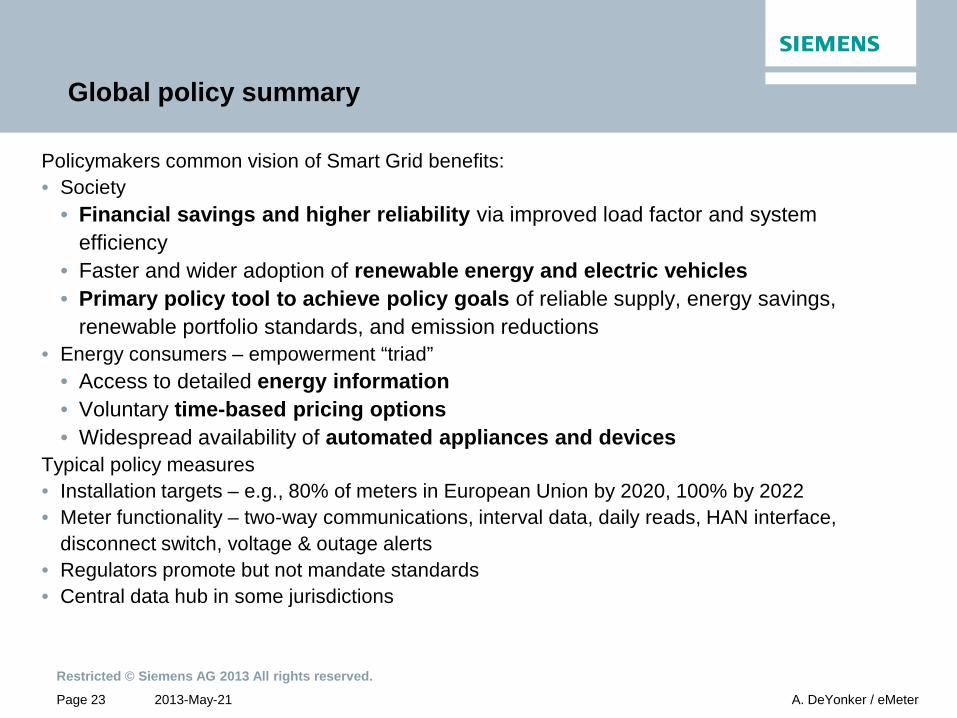
Global policy summary
Policymakers common vision of Smart Grid benefits: • Society
• Financial savings and higher reliability via improved load factor and system efficiency
• Faster and wider adoption of renewable energy and electric vehicles • Primary policy tool to achieve policy goals of reliable supply, energy savings,
renewable portfolio standards, and emission reductions • Energy consumers – empowerment “triad”
• Access to detailed energy information • Voluntary time-based pricing options • Widespread availability of automated appliances and devices
Typical policy measures • Installation targets – e.g., 80% of meters in European Union by 2020, 100% by 2022 • Meter functionality – two-way communications, interval data, daily reads, HAN interface,
disconnect switch, voltage & outage alerts • Regulators promote but not mandate standards • Central data hub in some jurisdictions

2013-May-21
Restricted © Siemens AG 2013 All rights reserved.
Page 24 A. DeYonker / eMeter
Biggest industry speed bumps
• Deregulation/Re-regulation/Re-deregulation 1990’s/early 2000’s • Financial Crisis 2008 • U.S. Stimulus program 2009-2010 • Pending: Drilling technology

2013-May-21
Restricted © Siemens AG 2013 All rights reserved.
Page 25 A. DeYonker / eMeter
Data is (always) at core of Smart Grid Value Proposition
Operational IT & Automation
Additional Applications
Optimizing the Distribution & Consumption of Energy & Water.
Transmission
Energy Mgt. System
Distribution Mgt.
System (DMS) Smart Meters Grid-specific
Communication
(Secondary Equipment)
EnergyIP
Horizontal IT
Utility End Consumer

2013-May-21
Restricted © Siemens AG 2013 All rights reserved.
Page 26 A. DeYonker / eMeter
Today’s Solutions Pattern
IP WAN
Network Devices
FAN
Meter
NIC
Head-End Software
EnergyIP
Adapter
Meter/Device Operations
Adapter Adapter
App MDM
I/F I/F I/F I/F I/F
App App
Proprietary and from common supplier
Built by eMeter to
meet supplier I/F
Generally standards-based IP network including cellular carriers
Proprietary Field Area Network mostly RF mesh and PLC
Data Concentrators that will often include data transformations, polling and application logic
Network Interface Card that often has intelligence, data
transformation and application logic. Sometimes integrated with
Meter circuits
Complex, state-full, software with polling, network management, database, transformation and
application logic
• Provision and activate devices • Receive meter reads, alarms and
events • Request meter reads, status and
other data • Request control operations • Update configurations • Update Firmware
Meter supplier generally
sells & ships Meter/NIC together

2013-May-21
Restricted © Siemens AG 2013 All rights reserved.
Page 27 A. DeYonker / eMeter
Performance Mandates
Meter reading: • Volumes!
• 50 million meters, 30 minute intervals, 1 day of data = 2.4 billion intervals • Cleansing!
• Processing through VEE, framing, etc. in 6-8 hours, which equates to 300-400 million records per hour, or about 100k intervals/second
• 2 percent estimation, or 1 million meter days, 48 million intervals, processed during that same 6-8 hours. Estimations are historical based on 30 days of interval data
Billing: • Calculating billing determinants for 10% of the population (a double day – would otherwise be 5%), or 5 million meters • Summing daily usage for each meter, running about 650 requests/second Environment: • 4 apps servers, each with 80 cores, although so far we’ve only been using a little more than half • We are using 2 database server nodes, 16 cores on each Message Payload: • 10k for a Tibco message with 1 day of 30 minute interval data. A lot of it is the XML tag names if someone wants to
know why it’s so big.

2013-May-21
Restricted © Siemens AG 2013 All rights reserved.
Page 28 A. DeYonker / eMeter
Utilities have a data growth problem
28
Transactions
Per Year
Monthly Meter Reads
Daily Meter Reads
15 Minute Meter Reads
35B
365M
12M
Data for a Sample Utility
Data Multipliers
* No of copies of production db
* No of channels in use
* No of applications using the data – example Analytics, Settlements

2013-May-21
Restricted © Siemens AG 2013 All rights reserved.
Page 29 A. DeYonker / eMeter
Breaking Silos
Grid Operations IT
Common Object Model
Real Time Near Real Time - Persistent
MDM
Smart Grid Application Platform
Consumer Data Portal
Demand Response
Planning and Simulation
Other… (incl 3rd Party)
SCADA
Smart Grid Application Platform
Outage Mgmt
Workforce Mgmt
Network Analysis
Other…
System State/
Topology
Meter Events/Load
Profiles

2013-May-21
Restricted © Siemens AG 2013 All rights reserved.
Page 30 A. DeYonker / eMeter
Mindshare Timeline
2005 2010 2015 2020 2025
Network/Meter Roll-out
Billing
Analytics/OT Integration
True Transformation
*Source: Aaron’s Head

2013-May-21
Restricted © Siemens AG 2013 All rights reserved.
Page 31 A. DeYonker / eMeter
Analysts Challenges
Unrelated Spreadsheets
Data Ownership & Silos Legacy Databases
Transaction-Based Schemas
Underpowered Environments
Production Data Lockout
2013-May-21
Restricted © Siemens AG 2013 All rights reserved.
Page 32 A. DeYonker / eMeter
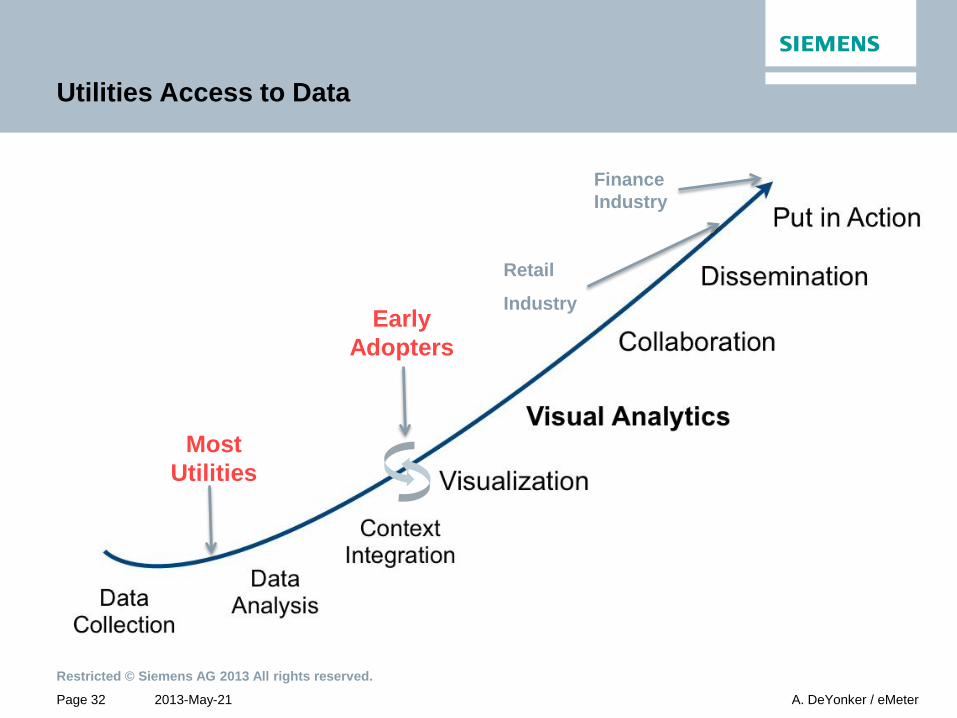
Utilities Access to Data
Most Utilities
Finance Industry
Retail
Industry Early
Adopters

2013-May-21
Restricted © Siemens AG 2013 All rights reserved.
Page 33 A. DeYonker / eMeter

2013-May-21
Restricted © Siemens AG 2013 All rights reserved.
Page 34 A. DeYonker / eMeter
Establishing Trust
1. Reliable Measurement and Collection 2. Ease of Access for Business Users 3. Efficient Feedback Loops

2013-May-21
Restricted © Siemens AG 2013 All rights reserved.
Page 35 A. DeYonker / eMeter
We all agree on use cases…
How can we deeply understand so many individual consumers?
Where am I losing Revenue to theft & network loss?
Who am I lending to, and how much?
How can I reduce peak loads profitably?
Is my AMI system performing as promised?
What investments make the biggest SAIDI/SAIFI impacts?

2013-May-21
Restricted © Siemens AG 2013 All rights reserved.
Page 36 A. DeYonker / eMeter
We don’t agree on everything…
• Which team owns the data? IT or OT? • What is the end-to-end system architecture and data governance policy? • How many copies of the data exist?
• Is there a massive omniscient enterprise data warehouse? • If multiple copies, how often is it sync’d across systems? (Billing, Customer
Service, Outage, DRMS) • Who has access to the data? • What skills do I need to hire to analyze data? • When do I use powerful ad-hoc reporting tools versus an Analytics application
(that solves a particular business problem)? • What can be done in the cloud? • How do I integrate analytics output into day-to-day operations? • When can I have automated decision making on output?

2013-May-21
Restricted © Siemens AG 2013 All rights reserved.
Page 37 A. DeYonker / eMeter Slide 37 Copyright © 2013 eMeter Corp. All rights reserved.
Can we better understand our consumers?

2013-May-21
Restricted © Siemens AG 2013 All rights reserved.
Page 38 A. DeYonker / eMeter
Consumer Analytics
Methods: • Baselining: Understanding patterns in consumer behavior • Profiling: Modeling consumer demographics, psychographics, and behaviors • Segmentation: Grouping customers for ‘what if’ and predictive analytics Benefits: • Understand new program impacts on consumers & utility • Identify lost revenue from theft or billing problems • Market to best customers for new programs • Adjust to customers changing behavior

2013-May-21
Restricted © Siemens AG 2013 All rights reserved.
Page 39 A. DeYonker / eMeter
Baselining Individuals

2013-May-21
Restricted © Siemens AG 2013 All rights reserved.
Page 40 A. DeYonker / eMeter
Baselining Individuals (cont.)

2013-May-21
Restricted © Siemens AG 2013 All rights reserved.
Page 41 A. DeYonker / eMeter
Baselining Individuals (cont.)

2013-May-21
Restricted © Siemens AG 2013 All rights reserved.
Page 42 A. DeYonker / eMeter
Baselining Individuals (cont.)

2013-May-21
Restricted © Siemens AG 2013 All rights reserved.
Page 43 A. DeYonker / eMeter
Profiling Load Patterns

2013-May-21
Restricted © Siemens AG 2013 All rights reserved.
Page 44 A. DeYonker / eMeter
Profiling Load Patterns (cont.)

2013-May-21
Restricted © Siemens AG 2013 All rights reserved.
Page 45 A. DeYonker / eMeter
Profiling Load Patterns (cont.)

2013-May-21
Restricted © Siemens AG 2013 All rights reserved.
Page 46 A. DeYonker / eMeter
Is this the Grid of the Future?
eMeter Corporate Logo To ensure the integrity of the eMeter brand it is necessary to understand how to use the logos.
Minimum Clear Area A minimum clear area has been created around each logo. This area should always be kept free of any graphic elements and/or messages. The gray lines in these illustrations show how the minimum clear area is calculated. In all cases, an area equal to the cap height of eMeter “r” must remain clear on all sides of the logo. The gray bars in these illustrations indicate the visual height, width, vertical center and horizontal center of the logo. (see the next slide)
Slide 46 Copyright © 2013 eMeter Corp. All rights reserved.
Who stole $6 Billion Last Year?

2013-May-21
Restricted © Siemens AG 2013 All rights reserved.
Page 47 A. DeYonker / eMeter
Energy Diversion

2013-May-21
Restricted © Siemens AG 2013 All rights reserved.
Page 48 A. DeYonker / eMeter
Energy Diversion Dashboard

2013-May-21
Restricted © Siemens AG 2013 All rights reserved.
Page 49 A. DeYonker / eMeter
Network Loss

2013-May-21
Restricted © Siemens AG 2013 All rights reserved.
Page 50 A. DeYonker / eMeter
Is this the Grid of the Future?
eMeter Corporate Logo To ensure the integrity of the eMeter brand it is necessary to understand how to use the logos.
Minimum Clear Area A minimum clear area has been created around each logo. This area should always be kept free of any graphic elements and/or messages. The gray lines in these illustrations show how the minimum clear area is calculated. In all cases, an area equal to the cap height of eMeter “r” must remain clear on all sides of the logo. The gray bars in these illustrations indicate the visual height, width, vertical center and horizontal center of the logo. (see the next slide)
Slide 50 Copyright © 2013 eMeter Corp. All rights reserved.
$360 Million Stolen Each Year in US Can we prevent transformer failure?

2013-May-21
Restricted © Siemens AG 2013 All rights reserved.
Page 51 A. DeYonker / eMeter
Applications for Grid Operations
3Φ
SDP ID Meter ID
Substation Transformer
1Φ 1
20/2
40V
12 kV Circuit
Segment
Low Voltage Distribution Transformer
Low Voltage Secondary Drops
Substation Bus
1Φ B
-C
Recloser (N.C.)
Un-metered
Service, e.g. street lighting
Virtual
Meter
Circuit Section
Virtual
Meter
Virtual
Meter
Virtual
Meter
Virtual
Meter
IDR Meters
Primary
Customers
Substation
Meter
Sectionalizing
Switch (N.O.)

2013-May-21
Restricted © Siemens AG 2013 All rights reserved.
Page 52 A. DeYonker / eMeter
Outage Details by Distribution Node

2013-May-21
Restricted © Siemens AG 2013 All rights reserved.
Page 53 A. DeYonker / eMeter
Service Point Metering
2013-May-21
Restricted © Siemens AG 2013 All rights reserved.
Page 54 A. DeYonker / eMeter
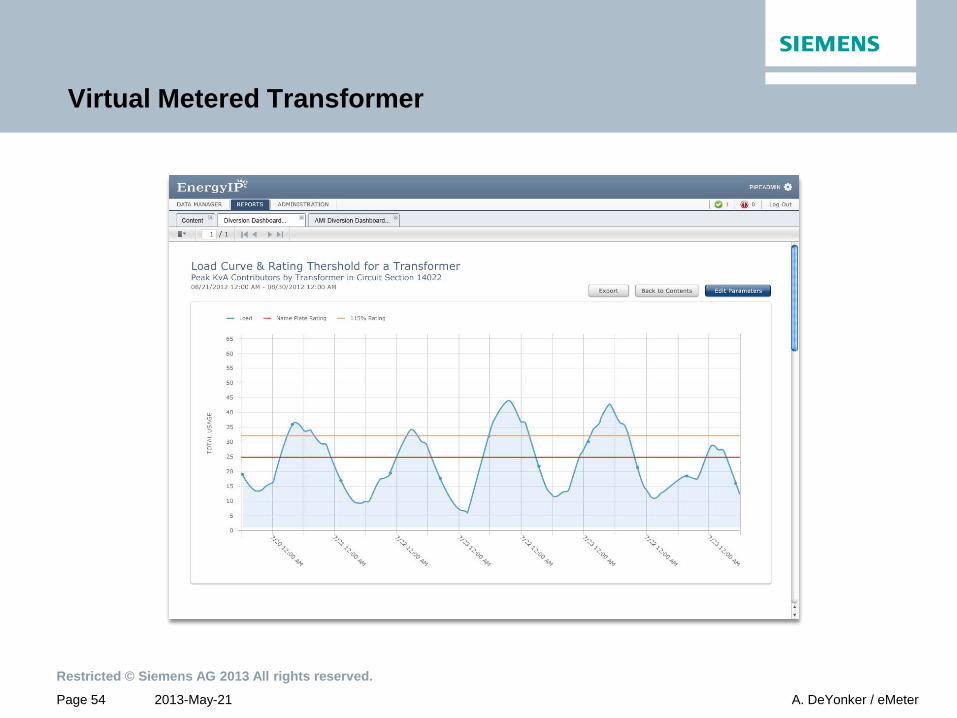
Virtual Metered Transformer
2013-May-21
Restricted © Siemens AG 2013 All rights reserved.
Page 55 A. DeYonker / eMeter
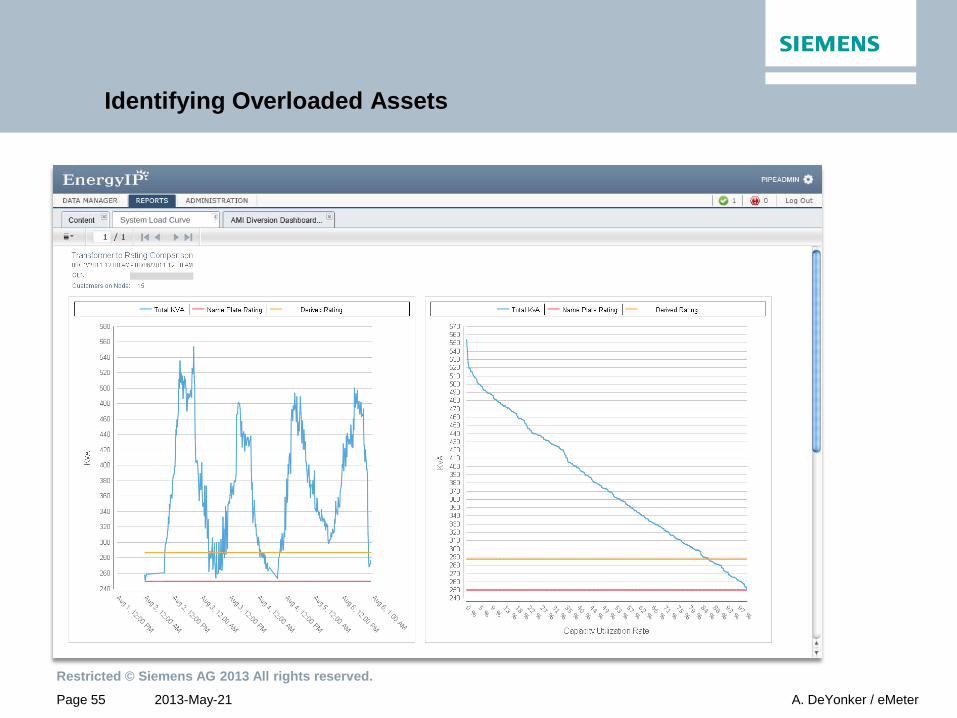
Identifying Overloaded Assets
System Load Curve

2013-May-21
Restricted © Siemens AG 2013 All rights reserved.
Page 56 A. DeYonker / eMeter
Understanding Grid Impacts

2013-May-21
Restricted © Siemens AG 2013 All rights reserved.
Page 57 A. DeYonker / eMeter
Transformer Overload Tracking

2013-May-21
Restricted © Siemens AG 2013 All rights reserved.
Page 58 A. DeYonker / eMeter http://earthdaytolucalake.wordpress.com/
15% of infrastructure is used 1% of time. What can we do about it?

2013-May-21
Restricted © Siemens AG 2013 All rights reserved.
Page 59 A. DeYonker / eMeter
Applications for Grid Operations
Update load summaries daily in minutes Make actual, accurate data available to: • Asset utilization and maintenance models • Validate and improve system load models • Improve forecasting and planning
Test: Aggregate one day’s 15 minute interval data by distribution transformer for 1.6m meters and 393k low voltage transformers.
Result: Over 200m records processed computing actual kVA demand and generating over 20m output records in under 120 seconds.

2013-May-21
Restricted © Siemens AG 2013 All rights reserved.
Page 60 A. DeYonker / eMeter
System Load
Slide 60 Copyright © 2013 eMeter Corp. All i ht d

2013-May-21
Restricted © Siemens AG 2013 All rights reserved.
Page 61 A. DeYonker / eMeter
Applications for Grid Operations System and Asset Loading Analysis – Circuit Section
System Load Curve

2013-May-21
Restricted © Siemens AG 2013 All rights reserved.
Page 62 A. DeYonker / eMeter
Applications for Grid Operations System and Asset Loading Analysis
System Load Curve

2013-May-21
Restricted © Siemens AG 2013 All rights reserved.
Page 63 A. DeYonker / eMeter
Individual Peak Loads
Slide 63
2013-May-21
Restricted © Siemens AG 2013 All rights reserved.
Page 64 A. DeYonker / eMeter
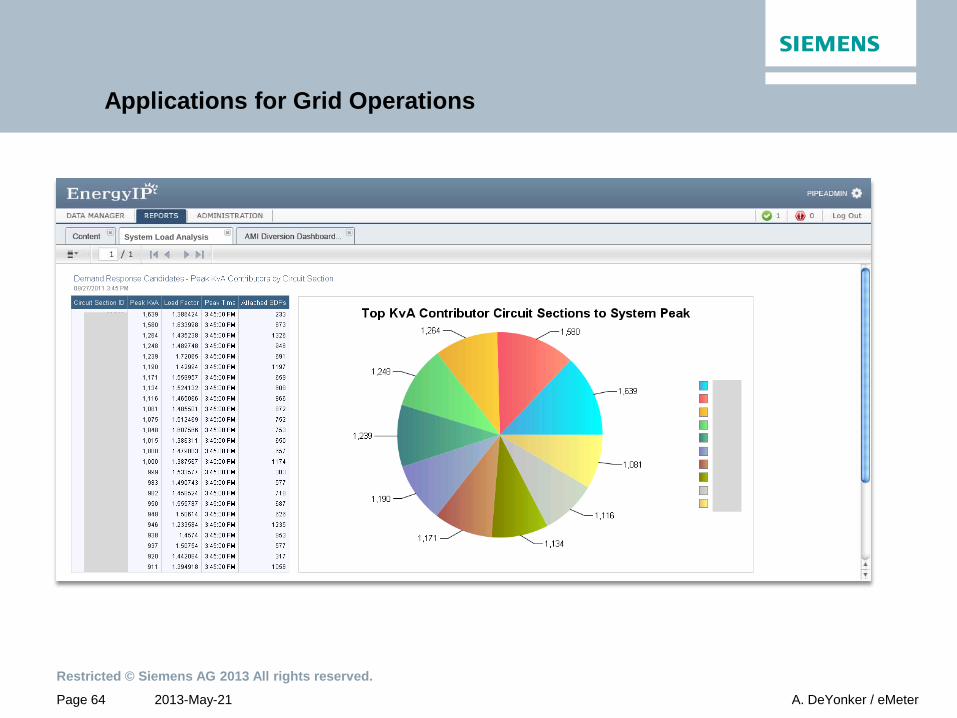
Applications for Grid Operations
System Load Analysis

2013-May-21
Restricted © Siemens AG 2013 All rights reserved.
Page 65 A. DeYonker / eMeter
Targeted Demand Response

2013-May-21
Restricted © Siemens AG 2013 All rights reserved.
Page 66 A. DeYonker / eMeter
Time of Use Analysis
Slide 66 Copyright © 2013 eMeter Corp. All i ht d

2013-May-21
Restricted © Siemens AG 2013 All rights reserved.
Page 67 A. DeYonker / eMeter
Outage
Slide 67 Copyright © 2013 eMeter Corp. All i ht d
Outage Why have outages increased 150% over the last 5 years?

2013-May-21
Restricted © Siemens AG 2013 All rights reserved.
Page 68 A. DeYonker / eMeter
Outage Event Correlation

2013-May-21
Restricted © Siemens AG 2013 All rights reserved.
Page 69 A. DeYonker / eMeter
Outage and Momentary Analysis
69 Copyright © 2012 eMeter, A Siemens Business. All rights reserved.
Event Reporting

2013-May-21
Restricted © Siemens AG 2013 All rights reserved.
Page 70 A. DeYonker / eMeter
Is my AMI Network performing like it should?

2013-May-21
Restricted © Siemens AG 2013 All rights reserved.
Page 71 A. DeYonker / eMeter
AMI Performance & SLA Tracking

2013-May-21
Restricted © Siemens AG 2013 All rights reserved.
Page 72 A. DeYonker / eMeter
Applications for AMI Operations Metering and Diagnostic Errors
Event Analyzer
Open
SR
Meter Exceptions
Reports
Supervisor Review
(opt)
Send to WMS
Outcome from WMS
Record Outcome
Close SR
Core
EnergyIP™
Workflow
Engine
AMI Operations
Analyst
Field Metering
Operations Meter failure indicators, communication failures, handled with automated action initiations.
Patterns and correlations with key meter type, age, service history, locations, etc.

2013-May-21
Restricted © Siemens AG 2013 All rights reserved.
Page 73 A. DeYonker / eMeter
Applications for AMI Operations Device Event Trending
Event Reporting

2013-May-21
Restricted © Siemens AG 2013 All rights reserved.
Page 74 A. DeYonker / eMeter
The Possibilities Are Endless…
Grid Loss Identification
Pricing Analysis
Customer Profiling & Segmentation
Load Modeling & Forecasting
Demand Response Evaluation
Distribution Planning