american charitable bequest demographics · american charitable bequest demographics (1992-2012)...
TRANSCRIPT

American Charitable Bequest Demographics
(1992-2012)
Russell N. James III, J.D., Ph.D.
Professor, Texas Tech University
Director of Graduate Studies in Charitable Financial Planning
CH Foundation Chair in Personal Financial Planning
www.EncourageGenerosity.com

Copyright © 2013 Russell N. James III All rights reserved.
ISBN: 978-1491214046 ISBN-13: 149121404X
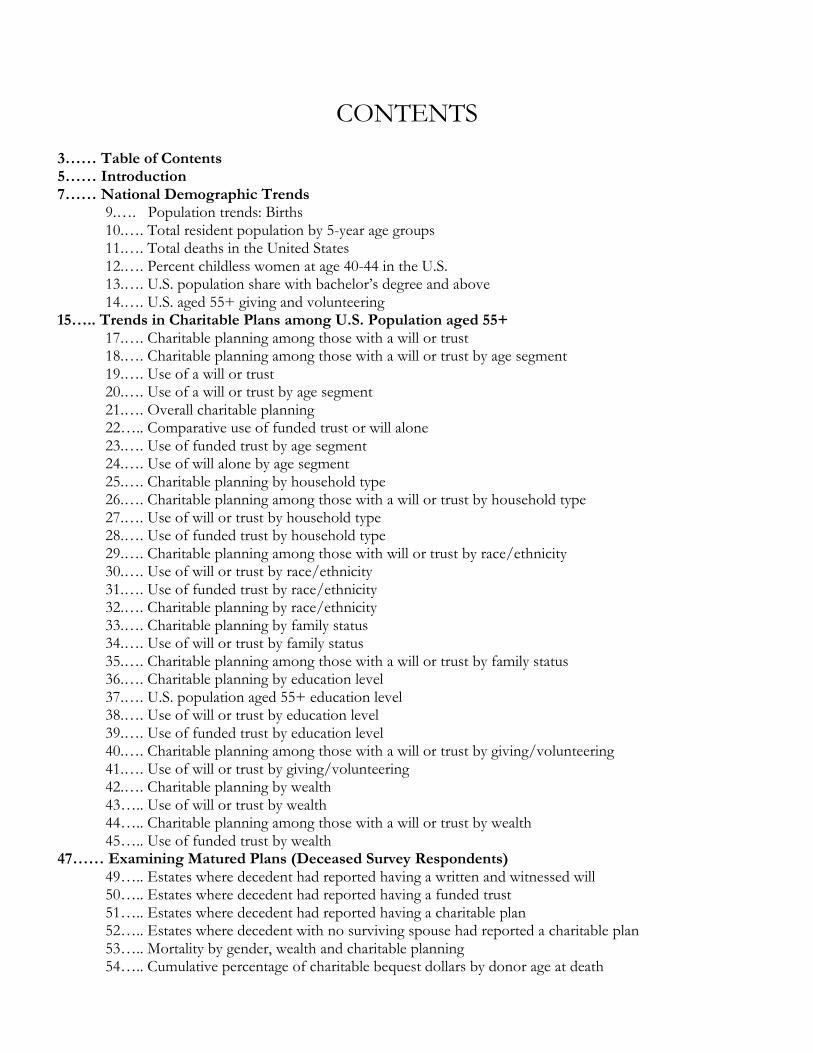
CONTENTS
3…… Table of Contents 5…… Introduction 7…… National Demographic Trends
9.…. Population trends: Births 10.…. Total resident population by 5-year age groups 11.…. Total deaths in the United States 12.…. Percent childless women at age 40-44 in the U.S. 13.…. U.S. population share with bachelor’s degree and above 14.…. U.S. aged 55+ giving and volunteering
15….. Trends in Charitable Plans among U.S. Population aged 55+ 17.…. Charitable planning among those with a will or trust 18.…. Charitable planning among those with a will or trust by age segment 19.…. Use of a will or trust 20.…. Use of a will or trust by age segment 21.…. Overall charitable planning 22….. Comparative use of funded trust or will alone 23.…. Use of funded trust by age segment 24.…. Use of will alone by age segment 25.…. Charitable planning by household type 26.…. Charitable planning among those with a will or trust by household type 27.…. Use of will or trust by household type 28.…. Use of funded trust by household type 29.…. Charitable planning among those with will or trust by race/ethnicity 30.…. Use of will or trust by race/ethnicity 31.…. Use of funded trust by race/ethnicity 32.…. Charitable planning by race/ethnicity 33.…. Charitable planning by family status 34.…. Use of will or trust by family status 35.…. Charitable planning among those with a will or trust by family status 36.…. Charitable planning by education level 37.…. U.S. population aged 55+ education level 38.…. Use of will or trust by education level 39.…. Use of funded trust by education level 40.…. Charitable planning among those with a will or trust by giving/volunteering 41.…. Use of will or trust by giving/volunteering 42.…. Charitable planning by wealth 43….. Use of will or trust by wealth 44….. Charitable planning among those with a will or trust by wealth 45….. Use of funded trust by wealth
47…… Examining Matured Plans (Deceased Survey Respondents) 49….. Estates where decedent had reported having a written and witnessed will 50….. Estates where decedent had reported having a funded trust 51….. Estates where decedent had reported having a charitable plan 52….. Estates where decedent with no surviving spouse had reported a charitable plan 53….. Mortality by gender, wealth and charitable planning 54….. Cumulative percentage of charitable bequest dollars by donor age at death
Dr. Russell James
4
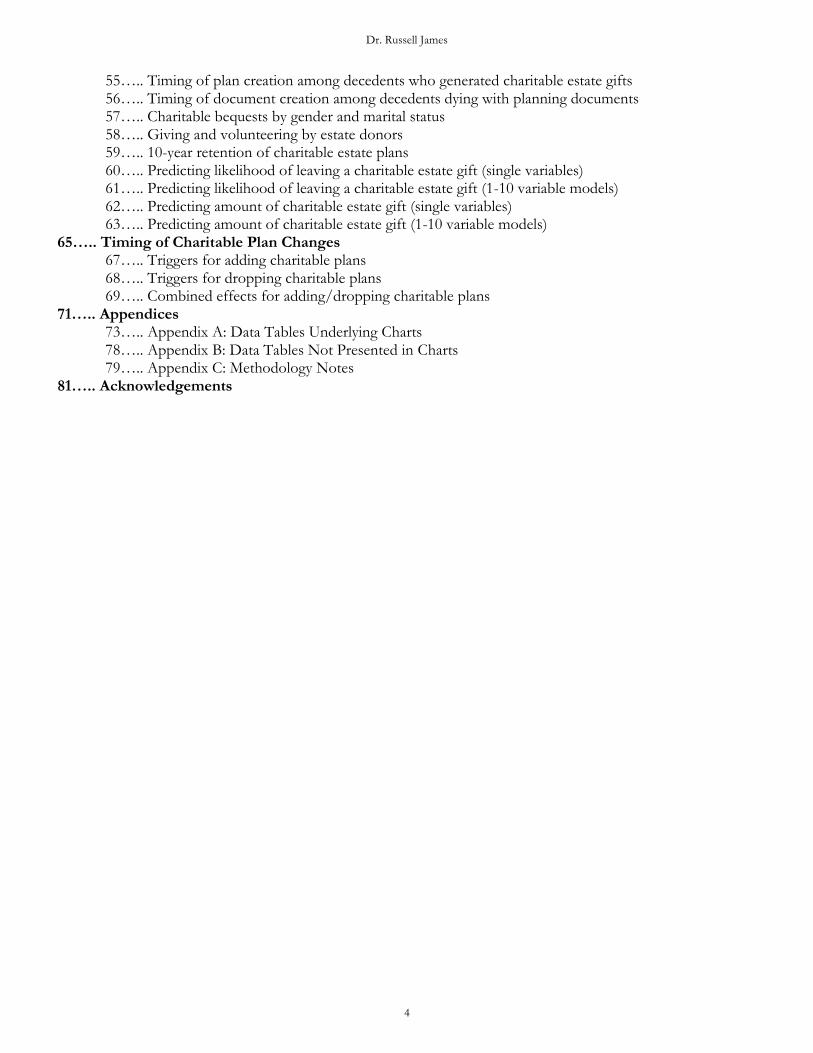
55….. Timing of plan creation among decedents who generated charitable estate gifts 56….. Timing of document creation among decedents dying with planning documents 57….. Charitable bequests by gender and marital status 58….. Giving and volunteering by estate donors 59….. 10-year retention of charitable estate plans 60….. Predicting likelihood of leaving a charitable estate gift (single variables) 61….. Predicting likelihood of leaving a charitable estate gift (1-10 variable models) 62….. Predicting amount of charitable estate gift (single variables) 63….. Predicting amount of charitable estate gift (1-10 variable models)
65….. Timing of Charitable Plan Changes 67….. Triggers for adding charitable plans 68….. Triggers for dropping charitable plans 69….. Combined effects for adding/dropping charitable plans
71….. Appendices 73….. Appendix A: Data Tables Underlying Charts 78….. Appendix B: Data Tables Not Presented in Charts 79….. Appendix C: Methodology Notes
81….. Acknowledgements
American Charitable Bequest Demographics
5
Introduction
This presentation of data related to charitable estate planning in the United States is intended to add to information from existing cross-sectional surveys in several ways. Although several early charts come from U.S. Census data, the primary source of information comes from the Health and Retirement Study (HRS) which is sponsored by the National Institute on Aging (grant number NIA U01AG009740) and administered by the University of Michigan. This data source differs from other cross-sectional surveys in important ways.
1. It is large. More than 26,000 individuals respond to the survey, which is administered every two years.
2. It is longitudinal. Not only are we able to observe trends over the last 20 years, but because the same individuals are surveyed every two years, we can track when changes are made and examine what triggers may have been associated with these changes
3. It is not a charitable survey. Surveys entirely focused on charitable behavior generate “non-response bias”. People who don’t give are much more likely to simply avoid taking the survey. Thus, the results often exclude a large segment of the population. In contrast, the HRS is an extensive half-day survey on a variety of health and financial topics including only three questions directly related to charitable giving and volunteering. Further the sophisticated weighting scheme used corrects for non-response bias related to the survey in general.
4. It is nationally representative. The HRS surveys are initially conducted in person, based on stratified probability sampling of household locations. Thus, the results are not limited to people who willingly return mail surveys or take phone call surveys. Respondents are paid for their time. The HRS uses a sophisticated weighting scheme to address both the sampling scheme and non-response bias to produce truly nationally representative data.
5. It tracks respondents’ post-mortem distributions. Over 10,000 survey respondents have died during the 20-year timespan of the HRS and its predecessor surveys. Post-mortem information is gathered from close relatives or caretakers to ascertain the ultimate distribution of all assets in the estate. This allows for the first time a connection of lifetime survey responses and post-death distributions. Because of the relatively rare occurrence of charitable planning, this was the first survey year in which a sufficient number of deceased respondents had accumulated to allow for more reliable analysis of post-mortem charitable transfers.

Dr. Russell James
6

American Charitable Bequest Demographics
7

Dr. Russell James
8
American Charitable Bequest Demographics
9
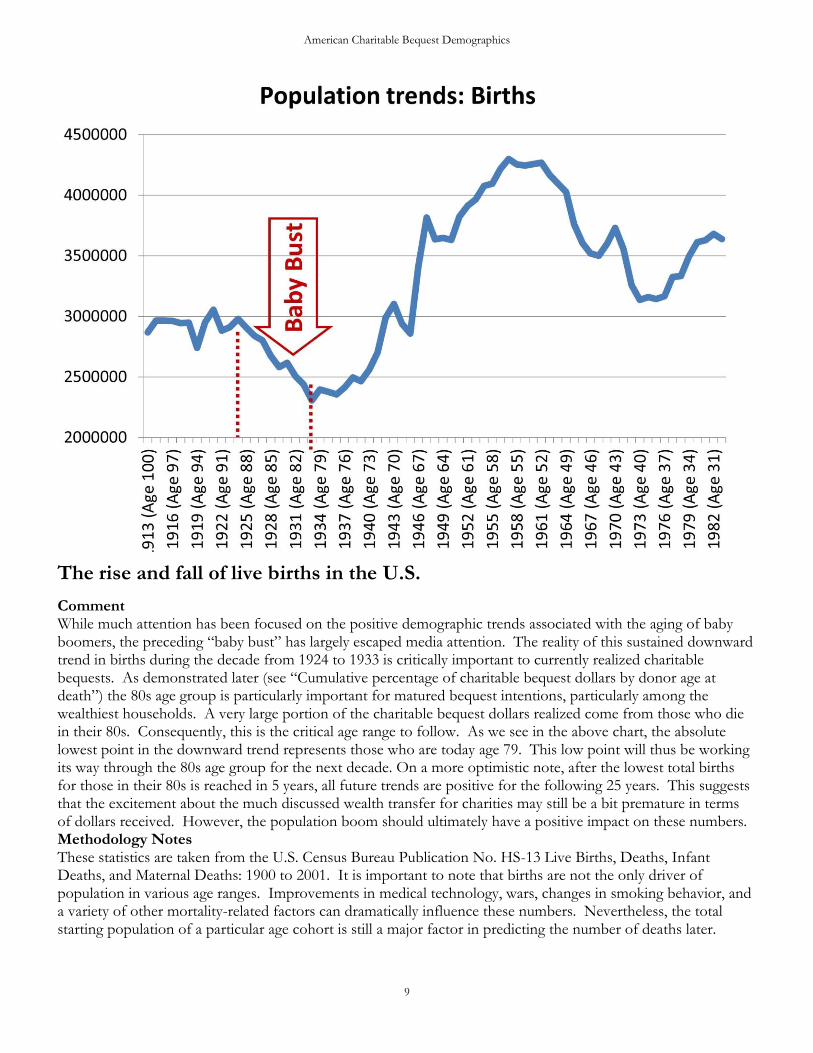
The rise and fall of live births in the U.S.
Comment While much attention has been focused on the positive demographic trends associated with the aging of baby boomers, the preceding “baby bust” has largely escaped media attention. The reality of this sustained downward trend in births during the decade from 1924 to 1933 is critically important to currently realized charitable bequests. As demonstrated later (see “Cumulative percentage of charitable bequest dollars by donor age at death”) the 80s age group is particularly important for matured bequest intentions, particularly among the wealthiest households. A very large portion of the charitable bequest dollars realized come from those who die in their 80s. Consequently, this is the critical age range to follow. As we see in the above chart, the absolute lowest point in the downward trend represents those who are today age 79. This low point will thus be working its way through the 80s age group for the next decade. On a more optimistic note, after the lowest total births for those in their 80s is reached in 5 years, all future trends are positive for the following 25 years. This suggests that the excitement about the much discussed wealth transfer for charities may still be a bit premature in terms of dollars received. However, the population boom should ultimately have a positive impact on these numbers. Methodology Notes These statistics are taken from the U.S. Census Bureau Publication No. HS-13 Live Births, Deaths, Infant Deaths, and Maternal Deaths: 1900 to 2001. It is important to note that births are not the only driver of population in various age ranges. Improvements in medical technology, wars, changes in smoking behavior, and a variety of other mortality-related factors can dramatically influence these numbers. Nevertheless, the total starting population of a particular age cohort is still a major factor in predicting the number of deaths later.
Dr. Russell James
10
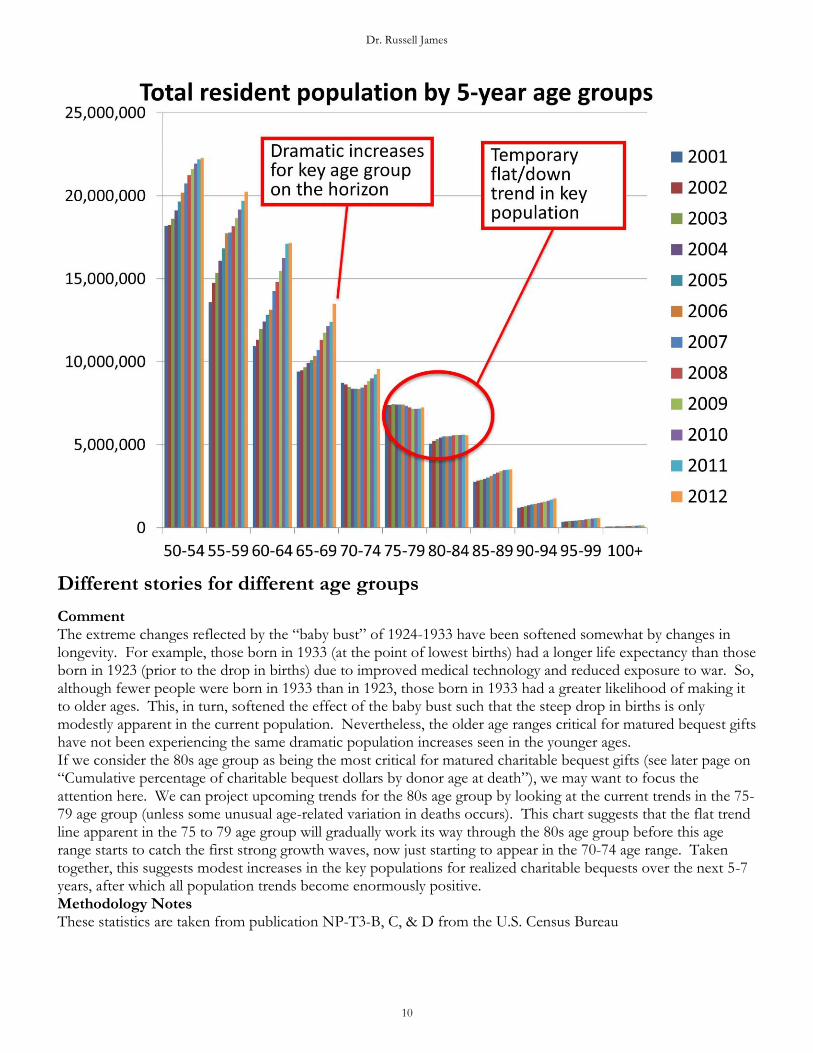
Different stories for different age groups
Comment The extreme changes reflected by the “baby bust” of 1924-1933 have been softened somewhat by changes in longevity. For example, those born in 1933 (at the point of lowest births) had a longer life expectancy than those born in 1923 (prior to the drop in births) due to improved medical technology and reduced exposure to war. So, although fewer people were born in 1933 than in 1923, those born in 1933 had a greater likelihood of making it to older ages. This, in turn, softened the effect of the baby bust such that the steep drop in births is only modestly apparent in the current population. Nevertheless, the older age ranges critical for matured bequest gifts have not been experiencing the same dramatic population increases seen in the younger ages. If we consider the 80s age group as being the most critical for matured charitable bequest gifts (see later page on “Cumulative percentage of charitable bequest dollars by donor age at death”), we may want to focus the attention here. We can project upcoming trends for the 80s age group by looking at the current trends in the 75-79 age group (unless some unusual age-related variation in deaths occurs). This chart suggests that the flat trend line apparent in the 75 to 79 age group will gradually work its way through the 80s age group before this age range starts to catch the first strong growth waves, now just starting to appear in the 70-74 age range. Taken together, this suggests modest increases in the key populations for realized charitable bequests over the next 5-7 years, after which all population trends become enormously positive. Methodology Notes These statistics are taken from publication NP-T3-B, C, & D from the U.S. Census Bureau
American Charitable Bequest Demographics
11
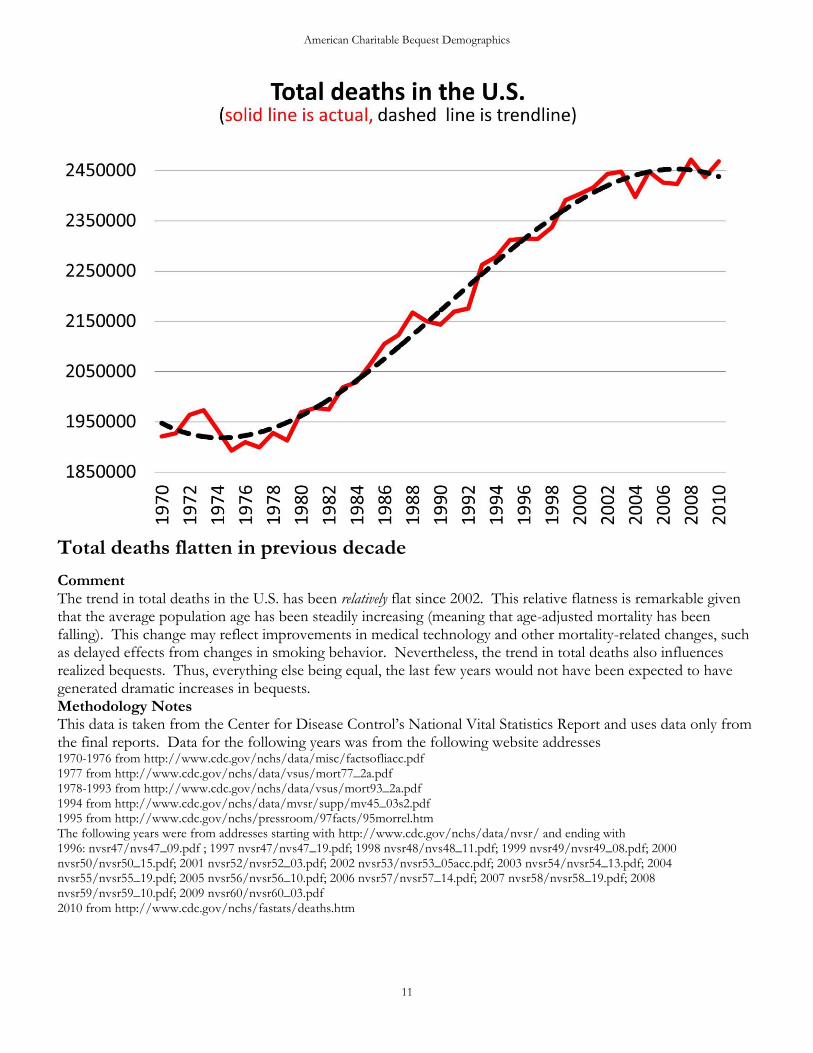
Total deaths flatten in previous decade
Comment The trend in total deaths in the U.S. has been relatively flat since 2002. This relative flatness is remarkable given that the average population age has been steadily increasing (meaning that age-adjusted mortality has been falling). This change may reflect improvements in medical technology and other mortality-related changes, such as delayed effects from changes in smoking behavior. Nevertheless, the trend in total deaths also influences realized bequests. Thus, everything else being equal, the last few years would not have been expected to have generated dramatic increases in bequests. Methodology Notes This data is taken from the Center for Disease Control’s National Vital Statistics Report and uses data only from the final reports. Data for the following years was from the following website addresses 1970-1976 from http://www.cdc.gov/nchs/data/misc/factsofliacc.pdf 1977 from http://www.cdc.gov/nchs/data/vsus/mort77_2a.pdf 1978-1993 from http://www.cdc.gov/nchs/data/vsus/mort93_2a.pdf 1994 from http://www.cdc.gov/nchs/data/mvsr/supp/mv45_03s2.pdf 1995 from http://www.cdc.gov/nchs/pressroom/97facts/95morrel.htm The following years were from addresses starting with http://www.cdc.gov/nchs/data/nvsr/ and ending with 1996: nvsr47/nvs47_09.pdf ; 1997 nvsr47/nvs47_19.pdf; 1998 nvsr48/nvs48_11.pdf; 1999 nvsr49/nvsr49_08.pdf; 2000 nvsr50/nvsr50_15.pdf; 2001 nvsr52/nvsr52_03.pdf; 2002 nvsr53/nvsr53_05acc.pdf; 2003 nvsr54/nvsr54_13.pdf; 2004 nvsr55/nvsr55_19.pdf; 2005 nvsr56/nvsr56_10.pdf; 2006 nvsr57/nvsr57_14.pdf; 2007 nvsr58/nvsr58_19.pdf; 2008 nvsr59/nvsr59_10.pdf; 2009 nvsr60/nvsr60_03.pdf 2010 from http://www.cdc.gov/nchs/fastats/deaths.htm
Dr. Russell James
12
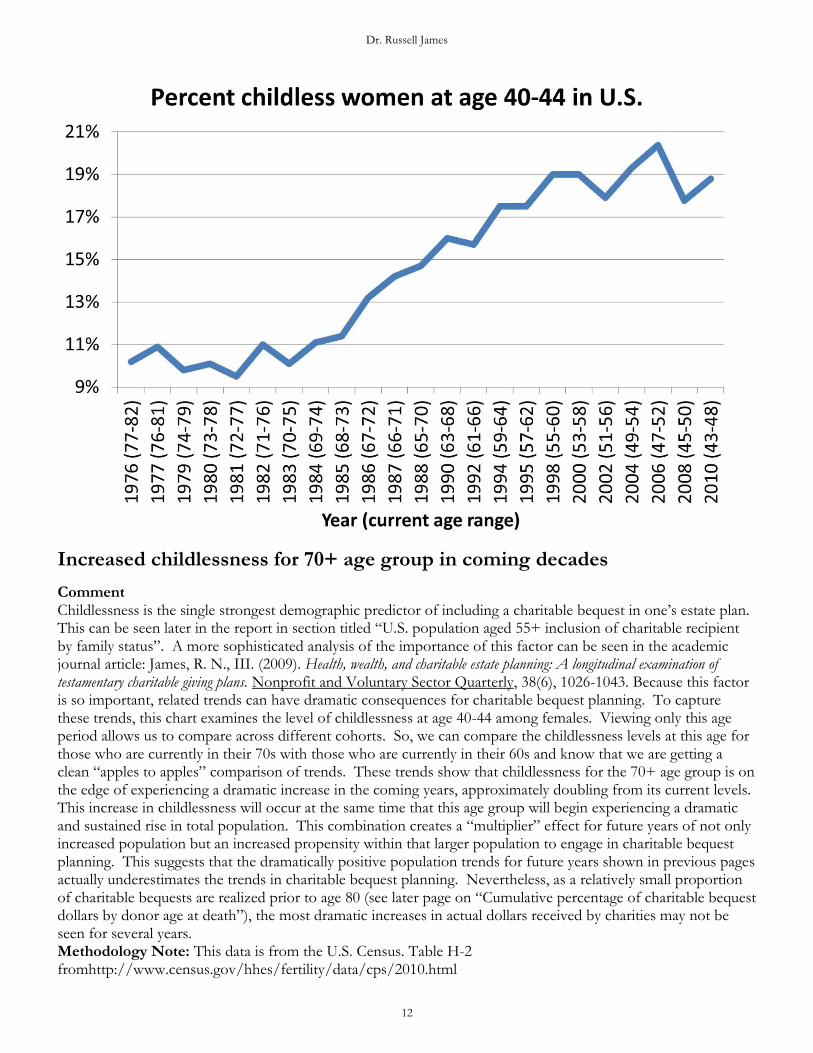
Increased childlessness for 70+ age group in coming decades
Comment Childlessness is the single strongest demographic predictor of including a charitable bequest in one’s estate plan. This can be seen later in the report in section titled “U.S. population aged 55+ inclusion of charitable recipient by family status”. A more sophisticated analysis of the importance of this factor can be seen in the academic journal article: James, R. N., III. (2009). Health, wealth, and charitable estate planning: A longitudinal examination of testamentary charitable giving plans. Nonprofit and Voluntary Sector Quarterly, 38(6), 1026-1043. Because this factor is so important, related trends can have dramatic consequences for charitable bequest planning. To capture these trends, this chart examines the level of childlessness at age 40-44 among females. Viewing only this age period allows us to compare across different cohorts. So, we can compare the childlessness levels at this age for those who are currently in their 70s with those who are currently in their 60s and know that we are getting a clean “apples to apples” comparison of trends. These trends show that childlessness for the 70+ age group is on the edge of experiencing a dramatic increase in the coming years, approximately doubling from its current levels. This increase in childlessness will occur at the same time that this age group will begin experiencing a dramatic and sustained rise in total population. This combination creates a “multiplier” effect for future years of not only increased population but an increased propensity within that larger population to engage in charitable bequest planning. This suggests that the dramatically positive population trends for future years shown in previous pages actually underestimates the trends in charitable bequest planning. Nevertheless, as a relatively small proportion of charitable bequests are realized prior to age 80 (see later page on “Cumulative percentage of charitable bequest dollars by donor age at death”), the most dramatic increases in actual dollars received by charities may not be seen for several years. Methodology Note: This data is from the U.S. Census. Table H-2 fromhttp://www.census.gov/hhes/fertility/data/cps/2010.html

American Charitable Bequest Demographics
13
Increasing education levels for older adults will continue
Comment Higher levels of education are associated with higher levels of charitable bequest giving (see section titled “U.S. population aged 55+ inclusion of charitable recipient by education level”). This is true even after controlling for differences in wealth and income (see James, R. N., III. (2009). Health, wealth, and charitable estate planning: A longitudinal examination of testamentary charitable giving plans. Nonprofit and Voluntary Sector Quarterly, 38(6), 1026-1043) and may be especially important for gifts to educational institutions (see James, R. N., III. (2008). Distinctive characteristics of educational donors. International Journal of Educational Advancement, 8(1), 3-12). Consequently, this trend in education levels may serve as a “multiplier” for coming years of charitable bequest planning, meaning that not only will older age populations increase (see previous sections), but these larger populations will have an increasing propensity to engage in charitable estate planning. The continuing growth in education at older ages is demonstrated in both of the above trend lines. The steep growth in education levels in the 55+ age population since 1970 shows that the older segments of that population will be seeing strong growth for many years to come. (So, for example, a person aged 80 in 2012 would have first entered the 55+ population in 1987, meaning that the future trend in education levels for those above 80 can be approximated by viewing the trends in the education levels of the 55+ population from 1987 forward.) Methodology Notes This information is taken from the U.S. Census, Table A-1 Years of School Completed by People 25 Years and Over, by Age and Sex: Selected, downloaded from http://www.census.gov/hhes/socdemo/education/data/cps/historical/index.html
Dr. Russell James
14
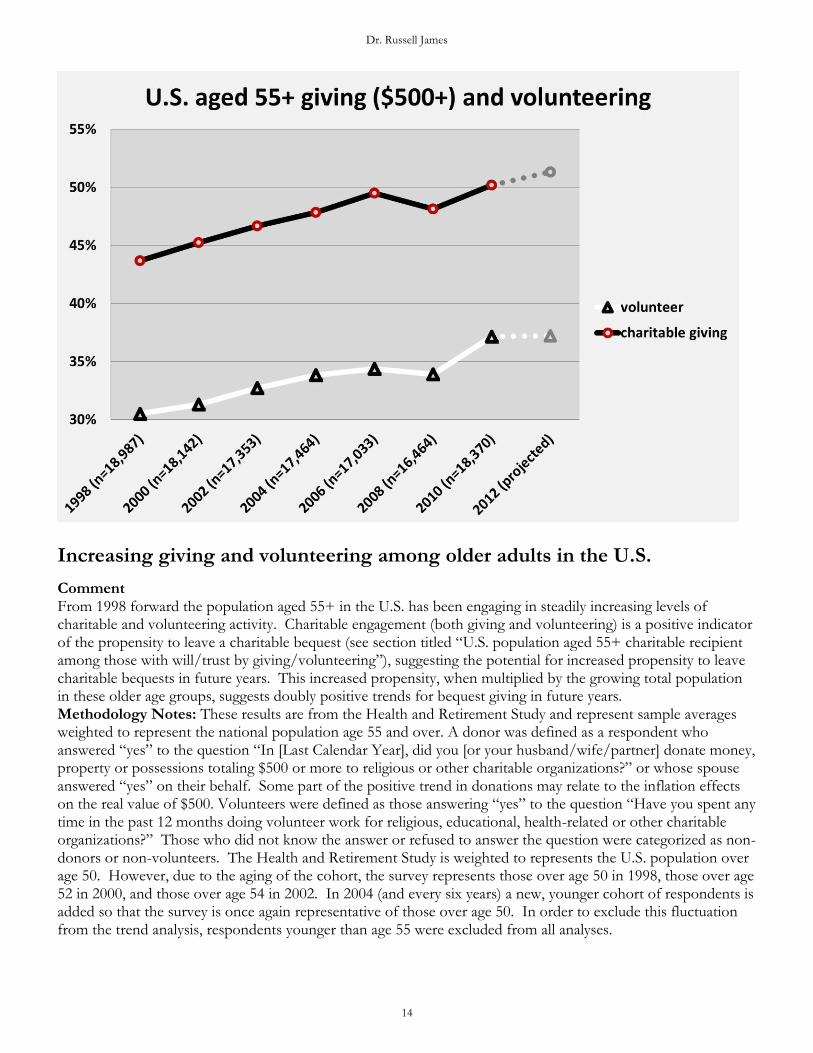
Increasing giving and volunteering among older adults in the U.S.
Comment From 1998 forward the population aged 55+ in the U.S. has been engaging in steadily increasing levels of charitable and volunteering activity. Charitable engagement (both giving and volunteering) is a positive indicator of the propensity to leave a charitable bequest (see section titled “U.S. population aged 55+ charitable recipient among those with will/trust by giving/volunteering”), suggesting the potential for increased propensity to leave charitable bequests in future years. This increased propensity, when multiplied by the growing total population in these older age groups, suggests doubly positive trends for bequest giving in future years. Methodology Notes: These results are from the Health and Retirement Study and represent sample averages weighted to represent the national population age 55 and over. A donor was defined as a respondent who answered “yes” to the question “In [Last Calendar Year], did you [or your husband/wife/partner] donate money, property or possessions totaling $500 or more to religious or other charitable organizations?” or whose spouse answered “yes” on their behalf. Some part of the positive trend in donations may relate to the inflation effects on the real value of $500. Volunteers were defined as those answering “yes” to the question “Have you spent any time in the past 12 months doing volunteer work for religious, educational, health-related or other charitable organizations?” Those who did not know the answer or refused to answer the question were categorized as non-donors or non-volunteers. The Health and Retirement Study is weighted to represents the U.S. population over age 50. However, due to the aging of the cohort, the survey represents those over age 50 in 1998, those over age 52 in 2000, and those over age 54 in 2002. In 2004 (and every six years) a new, younger cohort of respondents is added so that the survey is once again representative of those over age 50. In order to exclude this fluctuation from the trend analysis, respondents younger than age 55 were excluded from all analyses.
American Charitable Bequest Demographics
15

Dr. Russell James
16
American Charitable Bequest Demographics
17
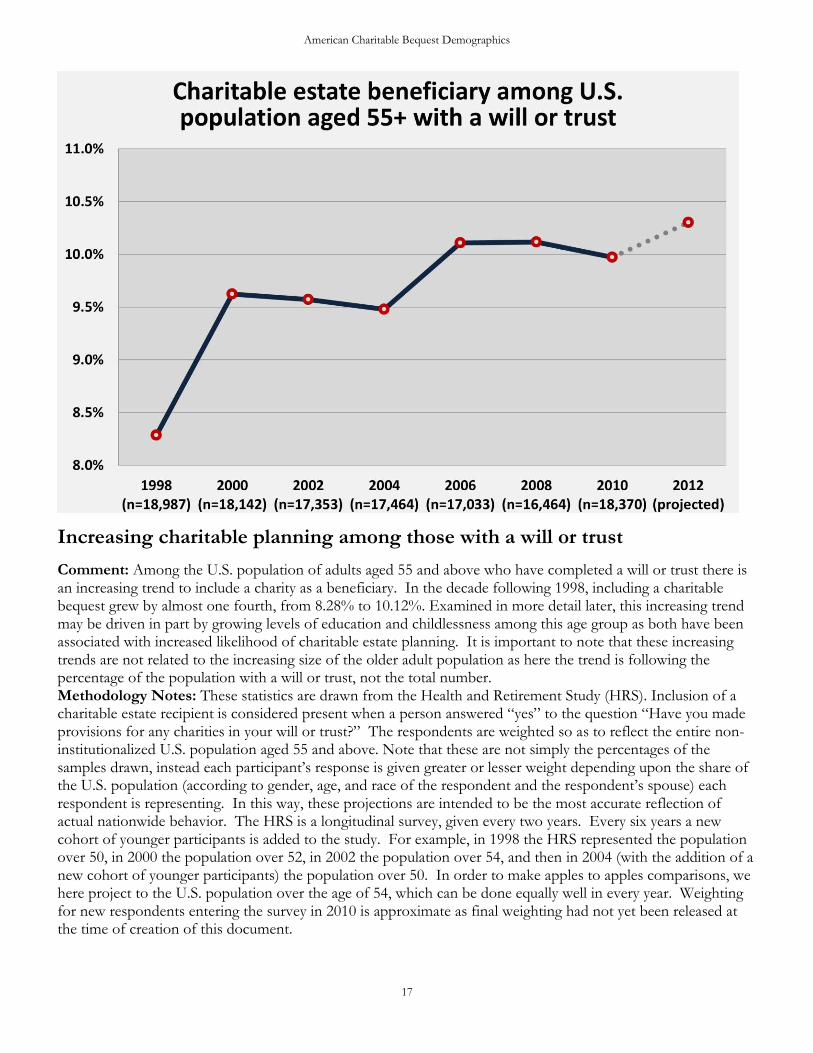
Increasing charitable planning among those with a will or trust
Comment: Among the U.S. population of adults aged 55 and above who have completed a will or trust there is an increasing trend to include a charity as a beneficiary. In the decade following 1998, including a charitable bequest grew by almost one fourth, from 8.28% to 10.12%. Examined in more detail later, this increasing trend may be driven in part by growing levels of education and childlessness among this age group as both have been associated with increased likelihood of charitable estate planning. It is important to note that these increasing trends are not related to the increasing size of the older adult population as here the trend is following the percentage of the population with a will or trust, not the total number. Methodology Notes: These statistics are drawn from the Health and Retirement Study (HRS). Inclusion of a charitable estate recipient is considered present when a person answered “yes” to the question “Have you made provisions for any charities in your will or trust?” The respondents are weighted so as to reflect the entire non-institutionalized U.S. population aged 55 and above. Note that these are not simply the percentages of the samples drawn, instead each participant’s response is given greater or lesser weight depending upon the share of the U.S. population (according to gender, age, and race of the respondent and the respondent’s spouse) each respondent is representing. In this way, these projections are intended to be the most accurate reflection of actual nationwide behavior. The HRS is a longitudinal survey, given every two years. Every six years a new cohort of younger participants is added to the study. For example, in 1998 the HRS represented the population over 50, in 2000 the population over 52, in 2002 the population over 54, and then in 2004 (with the addition of a new cohort of younger participants) the population over 50. In order to make apples to apples comparisons, we here project to the U.S. population over the age of 54, which can be done equally well in every year. Weighting for new respondents entering the survey in 2010 is approximate as final weighting had not yet been released at the time of creation of this document.

Dr. Russell James
18
Increasing charitable planning among those aged 55-64 with plans
Comment Further exploring the trend in charitable planning among those with a will or trust, this chart separately graphs three age segments, going back as far as 1993. The generally positive trend in charitable planning among the 55+ group appears to be most strongly driven by the youngest demographic, aged 55 to 64. In comparison, the 75 and older group is relatively flat over this period. To the extent that this trend in the youngest age groups continues, we might expect to see similar positive trends eventually develop in the older age categories as this younger generation gradually moves its way into the older ages. Methodology Notes Supplementing the HRS statistics from the previous analysis of those 55 and over, this chart includes data from the 1993 and 1995 Asset and Health Dynamics among the Oldest Old Survey (AHEAD) and 1996 early HRS. These surveys were precursors to the modern HRS, and covered only certain segments of the 55 and over population. So, for example, the 65-74 age group has no observations prior to 1998. The pre-1998 age 55-64 observation is from data gathered in the early HRS in 1996. The pre-1998 age 75+ observations are from data gathered in the 1993 and 1995 AHEAD surveys. The total number of observations used to project the age 75+ numbers were 4,650 (1993); 4,722 (1995); 5,355 (1998); 5,357 (2000); 5,290 (2002); 5,289 (2004); 5,409 (2006); 5,549(2008); and 5,536 (2010). The total number of observations used to project the age 65-74 numbers were 5,756 (1998); 5,785 (2000); 5,951 (2002); 6,177 (2004); 6,311 (2006); 6,028 (2008); and 5,484 (2010). The total number of observations used to project the age 55-64 numbers were 7,770 (1996); 7,394 (1998); 6,490 (2000); 5,924 (2002); 5,419 (2004); 4,762 (2006); 4,703 (2008); and 6,546 (2010). As before, the results reflect weighting of the sample to project to the national non-institutionalized population and are not simply the raw sample percentages.
American Charitable Bequest Demographics
19
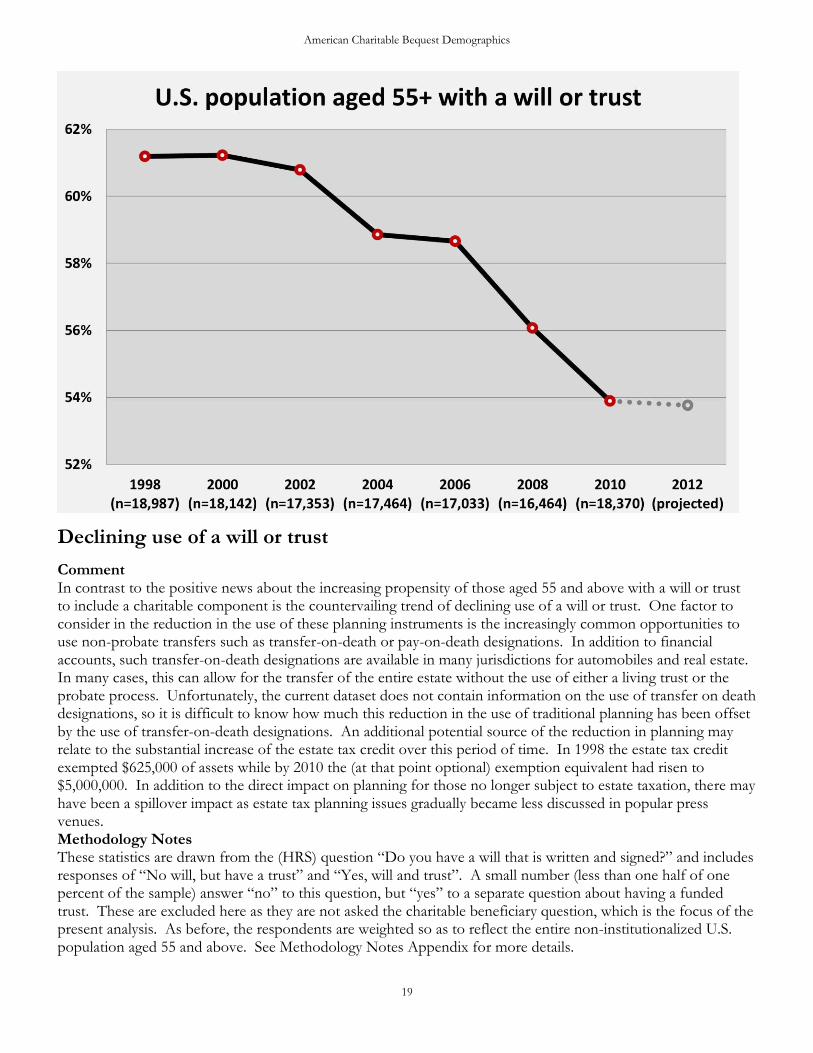
Declining use of a will or trust
Comment In contrast to the positive news about the increasing propensity of those aged 55 and above with a will or trust to include a charitable component is the countervailing trend of declining use of a will or trust. One factor to consider in the reduction in the use of these planning instruments is the increasingly common opportunities to use non-probate transfers such as transfer-on-death or pay-on-death designations. In addition to financial accounts, such transfer-on-death designations are available in many jurisdictions for automobiles and real estate. In many cases, this can allow for the transfer of the entire estate without the use of either a living trust or the probate process. Unfortunately, the current dataset does not contain information on the use of transfer on death designations, so it is difficult to know how much this reduction in the use of traditional planning has been offset by the use of transfer-on-death designations. An additional potential source of the reduction in planning may relate to the substantial increase of the estate tax credit over this period of time. In 1998 the estate tax credit exempted $625,000 of assets while by 2010 the (at that point optional) exemption equivalent had risen to $5,000,000. In addition to the direct impact on planning for those no longer subject to estate taxation, there may have been a spillover impact as estate tax planning issues gradually became less discussed in popular press venues. Methodology Notes These statistics are drawn from the (HRS) question “Do you have a will that is written and signed?” and includes responses of “No will, but have a trust” and “Yes, will and trust”. A small number (less than one half of one percent of the sample) answer “no” to this question, but “yes” to a separate question about having a funded trust. These are excluded here as they are not asked the charitable beneficiary question, which is the focus of the present analysis. As before, the respondents are weighted so as to reflect the entire non-institutionalized U.S. population aged 55 and above. See Methodology Notes Appendix for more details.
Dr. Russell James
20
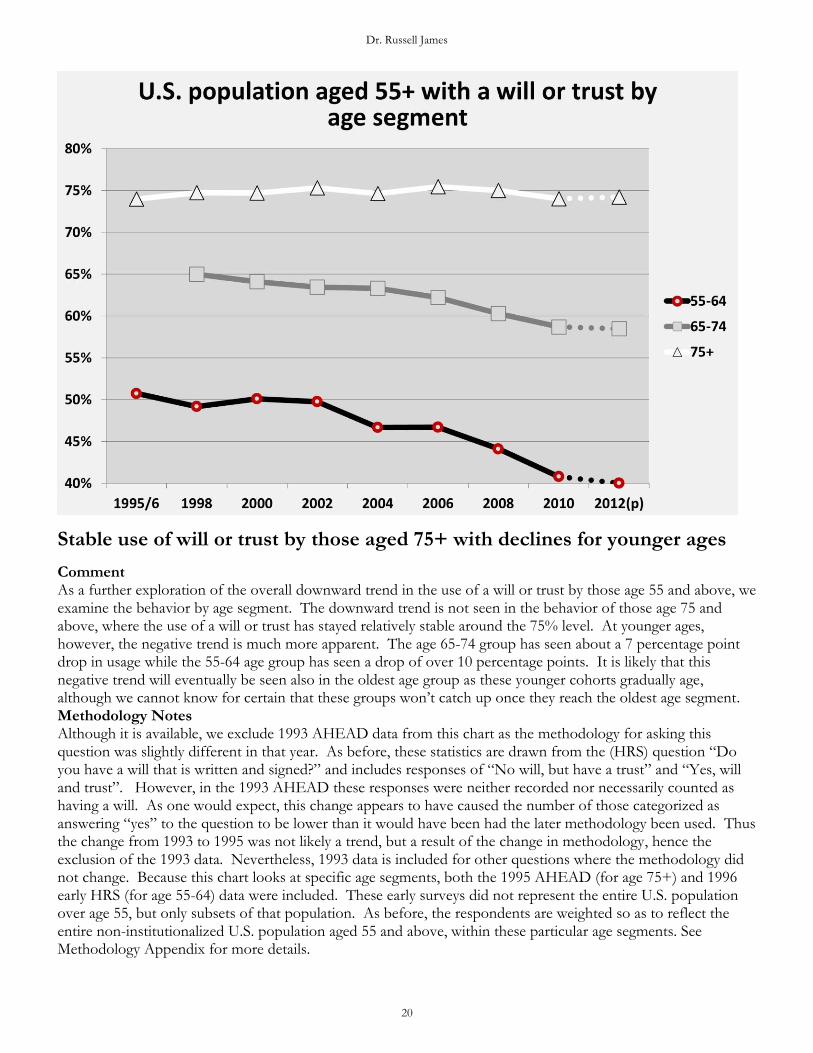
Stable use of will or trust by those aged 75+ with declines for younger ages
Comment As a further exploration of the overall downward trend in the use of a will or trust by those age 55 and above, we examine the behavior by age segment. The downward trend is not seen in the behavior of those age 75 and above, where the use of a will or trust has stayed relatively stable around the 75% level. At younger ages, however, the negative trend is much more apparent. The age 65-74 group has seen about a 7 percentage point drop in usage while the 55-64 age group has seen a drop of over 10 percentage points. It is likely that this negative trend will eventually be seen also in the oldest age group as these younger cohorts gradually age, although we cannot know for certain that these groups won’t catch up once they reach the oldest age segment. Methodology Notes Although it is available, we exclude 1993 AHEAD data from this chart as the methodology for asking this question was slightly different in that year. As before, these statistics are drawn from the (HRS) question “Do you have a will that is written and signed?” and includes responses of “No will, but have a trust” and “Yes, will and trust”. However, in the 1993 AHEAD these responses were neither recorded nor necessarily counted as having a will. As one would expect, this change appears to have caused the number of those categorized as answering “yes” to the question to be lower than it would have been had the later methodology been used. Thus the change from 1993 to 1995 was not likely a trend, but a result of the change in methodology, hence the exclusion of the 1993 data. Nevertheless, 1993 data is included for other questions where the methodology did not change. Because this chart looks at specific age segments, both the 1995 AHEAD (for age 75+) and 1996 early HRS (for age 55-64) data were included. These early surveys did not represent the entire U.S. population over age 55, but only subsets of that population. As before, the respondents are weighted so as to reflect the entire non-institutionalized U.S. population aged 55 and above, within these particular age segments. See Methodology Appendix for more details.

American Charitable Bequest Demographics
21
Offsetting trends result in stable overall charitable planning
Comment As shown in previous charts, a smaller proportion of the 55+ age group in the U.S. reports having a will or funded trust. This negative trend is offset by the positive trend that a greater percentage of those with wills or funded trusts are including a charitable provision in their plans. The net effect of these two trends is the relatively flat trend seen above in overall charitable planning in the population. To the extent that the shift away from wills and funded trusts could be partially explained by increased use of transfer-on-death type non-probate transfers titling, it is also possible that some of this titling could include charitable beneficiaries. The current dataset has no information on such non-probate transfers titling, thus any changes in the use of such transfer mechanisms are speculative. Methodology Notes: These statistics are drawn from the Health and Retirement Study (HRS). Inclusion of a charitable estate recipient is considered present when a person answered “yes” to the question “Have you made provisions for any charities in your will or trust?” The respondents are weighted so as to reflect the entire non-institutionalized U.S. population aged 55 and above. Note that these are not simply the percentages of the samples drawn, instead each participant’s response is given greater or lesser weight depending upon the share of the U.S. population (according to gender, age, and race of the respondent and the respondent’s spouse) each respondent is representing. In this way, these projections are intended to be the most accurate reflection of actual nationwide behavior. The HRS is a longitudinal survey, given every two years. Every six years a new cohort of younger participants is added to the study. For example, in 1998 the HRS represented the population over 50, in 2000 the population over 52, in 2002 the population over 54, and then in 2004 (with the addition of a new cohort of younger participants) the population over 50. In order to make apples to apples comparisons, we here project to the U.S. population over the age of 54, which can be done equally well in every year. Weighting for new respondents entering the survey in 2010 is approximate as final weighting had not yet been released at the time of creation of this document.
Dr. Russell James
22
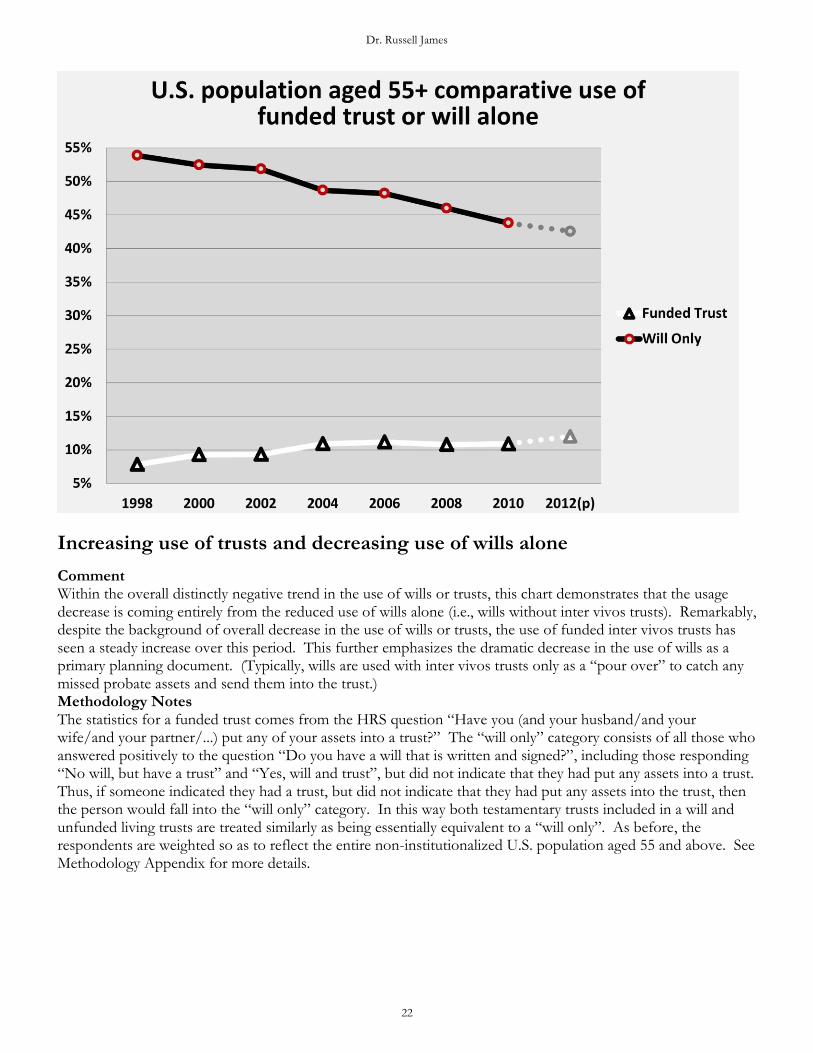
Increasing use of trusts and decreasing use of wills alone
Comment Within the overall distinctly negative trend in the use of wills or trusts, this chart demonstrates that the usage decrease is coming entirely from the reduced use of wills alone (i.e., wills without inter vivos trusts). Remarkably, despite the background of overall decrease in the use of wills or trusts, the use of funded inter vivos trusts has seen a steady increase over this period. This further emphasizes the dramatic decrease in the use of wills as a primary planning document. (Typically, wills are used with inter vivos trusts only as a “pour over” to catch any missed probate assets and send them into the trust.) Methodology Notes The statistics for a funded trust comes from the HRS question “Have you (and your husband/and your wife/and your partner/...) put any of your assets into a trust?” The “will only” category consists of all those who answered positively to the question “Do you have a will that is written and signed?”, including those responding “No will, but have a trust” and “Yes, will and trust”, but did not indicate that they had put any assets into a trust. Thus, if someone indicated they had a trust, but did not indicate that they had put any assets into the trust, then the person would fall into the “will only” category. In this way both testamentary trusts included in a will and unfunded living trusts are treated similarly as being essentially equivalent to a “will only”. As before, the respondents are weighted so as to reflect the entire non-institutionalized U.S. population aged 55 and above. See Methodology Appendix for more details.
American Charitable Bequest Demographics
23
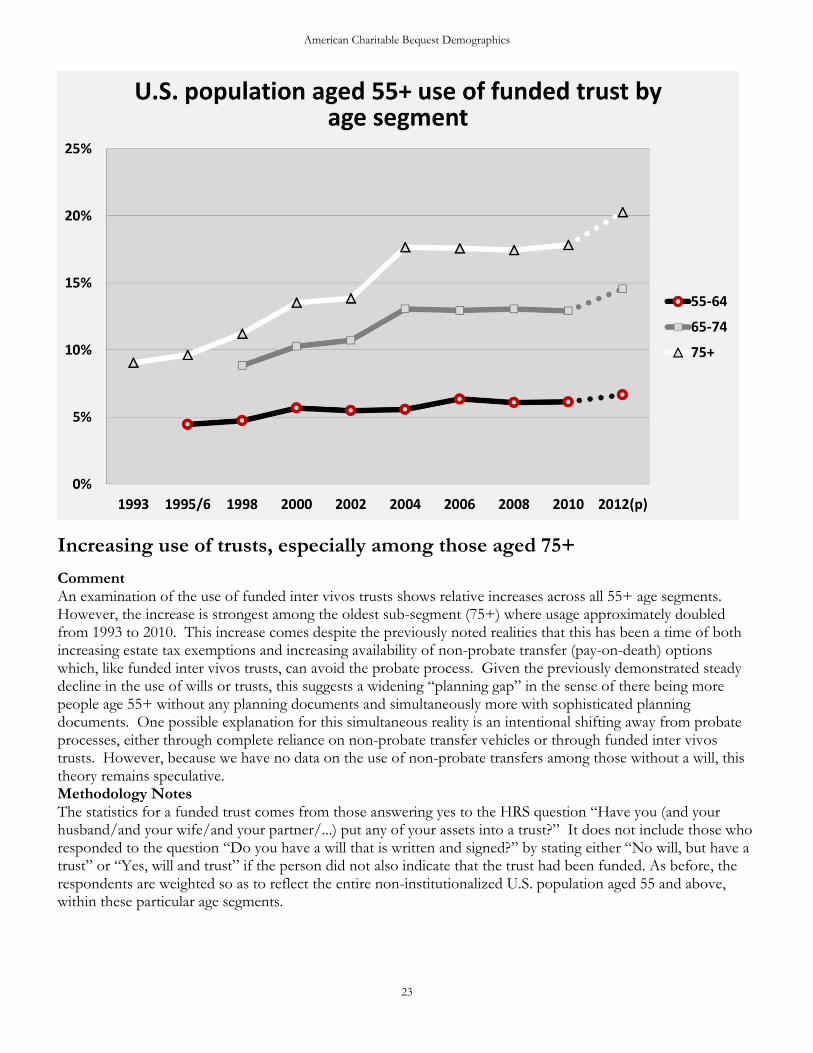
Increasing use of trusts, especially among those aged 75+
Comment An examination of the use of funded inter vivos trusts shows relative increases across all 55+ age segments. However, the increase is strongest among the oldest sub-segment (75+) where usage approximately doubled from 1993 to 2010. This increase comes despite the previously noted realities that this has been a time of both increasing estate tax exemptions and increasing availability of non-probate transfer (pay-on-death) options which, like funded inter vivos trusts, can avoid the probate process. Given the previously demonstrated steady decline in the use of wills or trusts, this suggests a widening “planning gap” in the sense of there being more people age 55+ without any planning documents and simultaneously more with sophisticated planning documents. One possible explanation for this simultaneous reality is an intentional shifting away from probate processes, either through complete reliance on non-probate transfer vehicles or through funded inter vivos trusts. However, because we have no data on the use of non-probate transfers among those without a will, this theory remains speculative. Methodology Notes The statistics for a funded trust comes from those answering yes to the HRS question “Have you (and your husband/and your wife/and your partner/...) put any of your assets into a trust?” It does not include those who responded to the question “Do you have a will that is written and signed?” by stating either “No will, but have a trust” or “Yes, will and trust” if the person did not also indicate that the trust had been funded. As before, the respondents are weighted so as to reflect the entire non-institutionalized U.S. population aged 55 and above, within these particular age segments.
Dr. Russell James
24
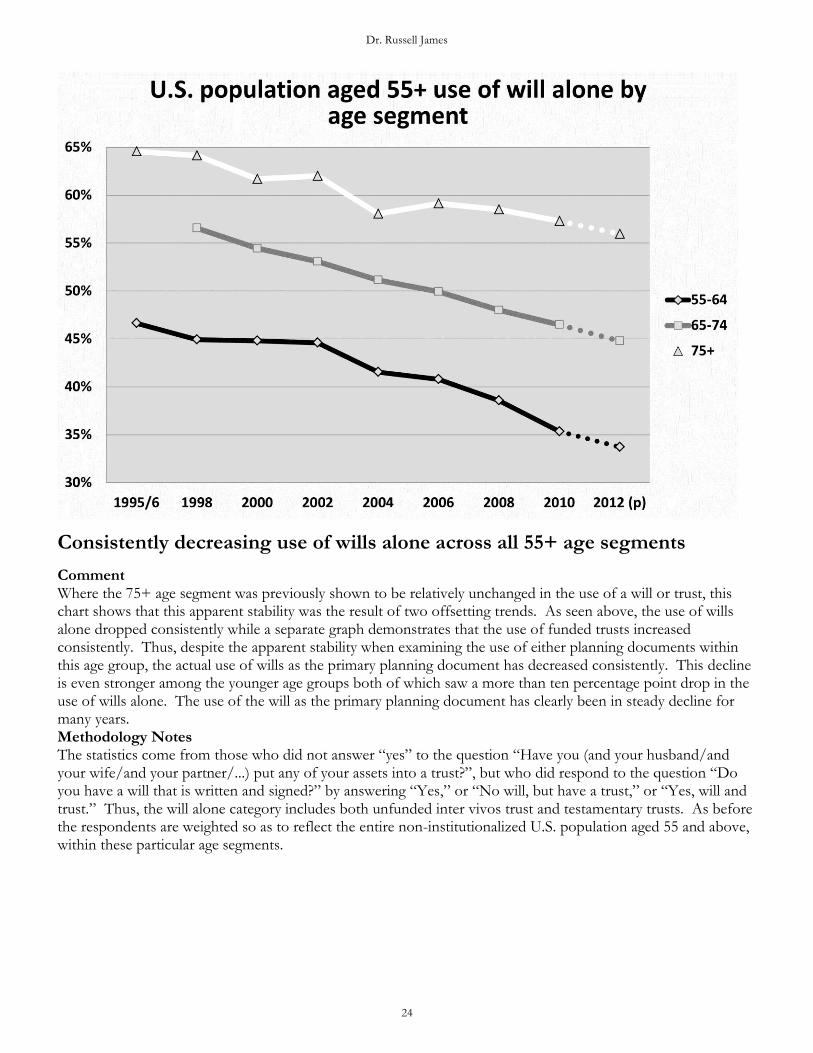
Consistently decreasing use of wills alone across all 55+ age segments
Comment Where the 75+ age segment was previously shown to be relatively unchanged in the use of a will or trust, this chart shows that this apparent stability was the result of two offsetting trends. As seen above, the use of wills alone dropped consistently while a separate graph demonstrates that the use of funded trusts increased consistently. Thus, despite the apparent stability when examining the use of either planning documents within this age group, the actual use of wills as the primary planning document has decreased consistently. This decline is even stronger among the younger age groups both of which saw a more than ten percentage point drop in the use of wills alone. The use of the will as the primary planning document has clearly been in steady decline for many years. Methodology Notes The statistics come from those who did not answer “yes” to the question “Have you (and your husband/and your wife/and your partner/...) put any of your assets into a trust?”, but who did respond to the question “Do you have a will that is written and signed?” by answering “Yes,” or “No will, but have a trust,” or “Yes, will and trust.” Thus, the will alone category includes both unfunded inter vivos trust and testamentary trusts. As before the respondents are weighted so as to reflect the entire non-institutionalized U.S. population aged 55 and above, within these particular age segments.
American Charitable Bequest Demographics
25
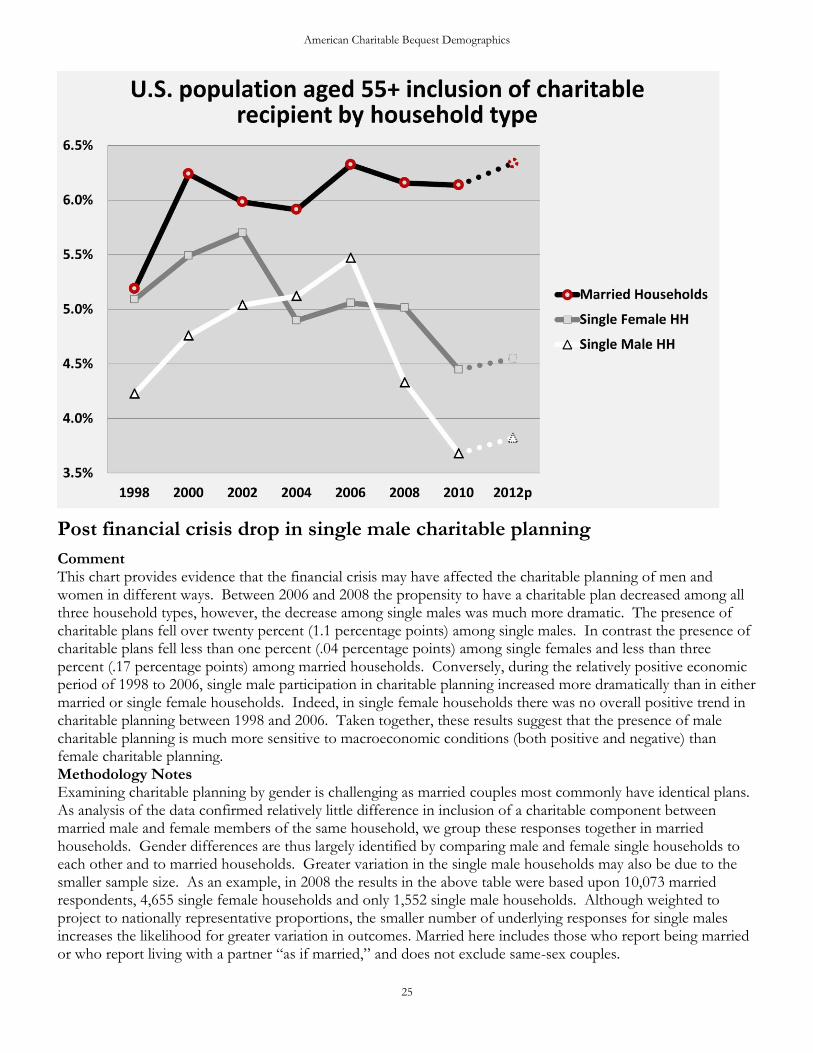
Post financial crisis drop in single male charitable planning
Comment This chart provides evidence that the financial crisis may have affected the charitable planning of men and women in different ways. Between 2006 and 2008 the propensity to have a charitable plan decreased among all three household types, however, the decrease among single males was much more dramatic. The presence of charitable plans fell over twenty percent (1.1 percentage points) among single males. In contrast the presence of charitable plans fell less than one percent (.04 percentage points) among single females and less than three percent (.17 percentage points) among married households. Conversely, during the relatively positive economic period of 1998 to 2006, single male participation in charitable planning increased more dramatically than in either married or single female households. Indeed, in single female households there was no overall positive trend in charitable planning between 1998 and 2006. Taken together, these results suggest that the presence of male charitable planning is much more sensitive to macroeconomic conditions (both positive and negative) than female charitable planning. Methodology Notes Examining charitable planning by gender is challenging as married couples most commonly have identical plans. As analysis of the data confirmed relatively little difference in inclusion of a charitable component between married male and female members of the same household, we group these responses together in married households. Gender differences are thus largely identified by comparing male and female single households to each other and to married households. Greater variation in the single male households may also be due to the smaller sample size. As an example, in 2008 the results in the above table were based upon 10,073 married respondents, 4,655 single female households and only 1,552 single male households. Although weighted to project to nationally representative proportions, the smaller number of underlying responses for single males increases the likelihood for greater variation in outcomes. Married here includes those who report being married or who report living with a partner “as if married,” and does not exclude same-sex couples.
Dr. Russell James
26
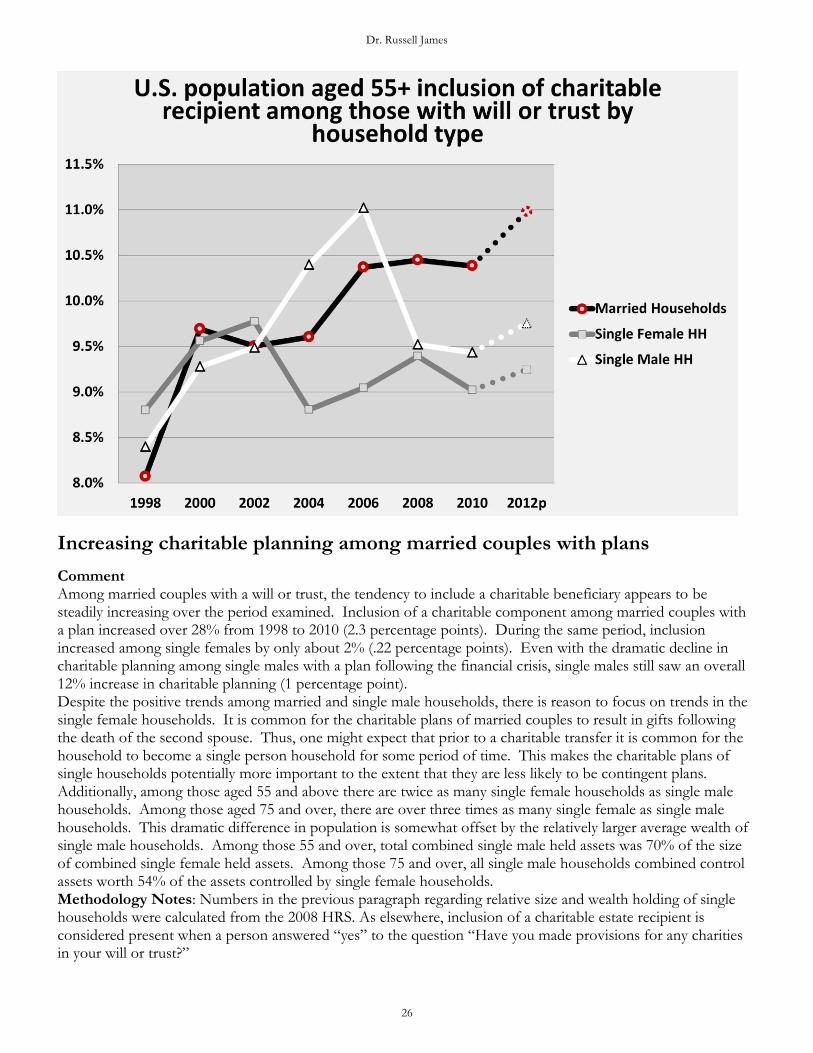
Increasing charitable planning among married couples with plans
Comment Among married couples with a will or trust, the tendency to include a charitable beneficiary appears to be steadily increasing over the period examined. Inclusion of a charitable component among married couples with a plan increased over 28% from 1998 to 2010 (2.3 percentage points). During the same period, inclusion increased among single females by only about 2% (.22 percentage points). Even with the dramatic decline in charitable planning among single males with a plan following the financial crisis, single males still saw an overall 12% increase in charitable planning (1 percentage point). Despite the positive trends among married and single male households, there is reason to focus on trends in the single female households. It is common for the charitable plans of married couples to result in gifts following the death of the second spouse. Thus, one might expect that prior to a charitable transfer it is common for the household to become a single person household for some period of time. This makes the charitable plans of single households potentially more important to the extent that they are less likely to be contingent plans. Additionally, among those aged 55 and above there are twice as many single female households as single male households. Among those aged 75 and over, there are over three times as many single female as single male households. This dramatic difference in population is somewhat offset by the relatively larger average wealth of single male households. Among those 55 and over, total combined single male held assets was 70% of the size of combined single female held assets. Among those 75 and over, all single male households combined control assets worth 54% of the assets controlled by single female households. Methodology Notes: Numbers in the previous paragraph regarding relative size and wealth holding of single households were calculated from the 2008 HRS. As elsewhere, inclusion of a charitable estate recipient is considered present when a person answered “yes” to the question “Have you made provisions for any charities in your will or trust?”
American Charitable Bequest Demographics
27
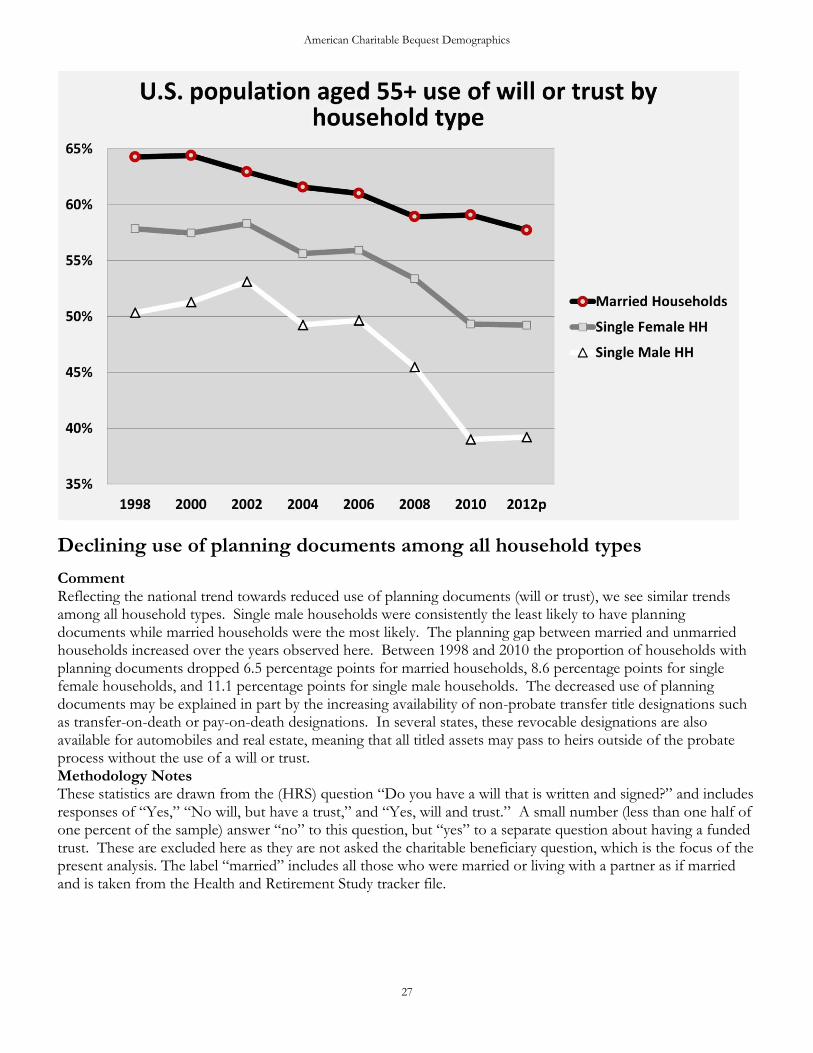
Declining use of planning documents among all household types
Comment Reflecting the national trend towards reduced use of planning documents (will or trust), we see similar trends among all household types. Single male households were consistently the least likely to have planning documents while married households were the most likely. The planning gap between married and unmarried households increased over the years observed here. Between 1998 and 2010 the proportion of households with planning documents dropped 6.5 percentage points for married households, 8.6 percentage points for single female households, and 11.1 percentage points for single male households. The decreased use of planning documents may be explained in part by the increasing availability of non-probate transfer title designations such as transfer-on-death or pay-on-death designations. In several states, these revocable designations are also available for automobiles and real estate, meaning that all titled assets may pass to heirs outside of the probate process without the use of a will or trust. Methodology Notes These statistics are drawn from the (HRS) question “Do you have a will that is written and signed?” and includes responses of “Yes,” “No will, but have a trust,” and “Yes, will and trust.” A small number (less than one half of one percent of the sample) answer “no” to this question, but “yes” to a separate question about having a funded trust. These are excluded here as they are not asked the charitable beneficiary question, which is the focus of the present analysis. The label “married” includes all those who were married or living with a partner as if married and is taken from the Health and Retirement Study tracker file.
Dr. Russell James
28
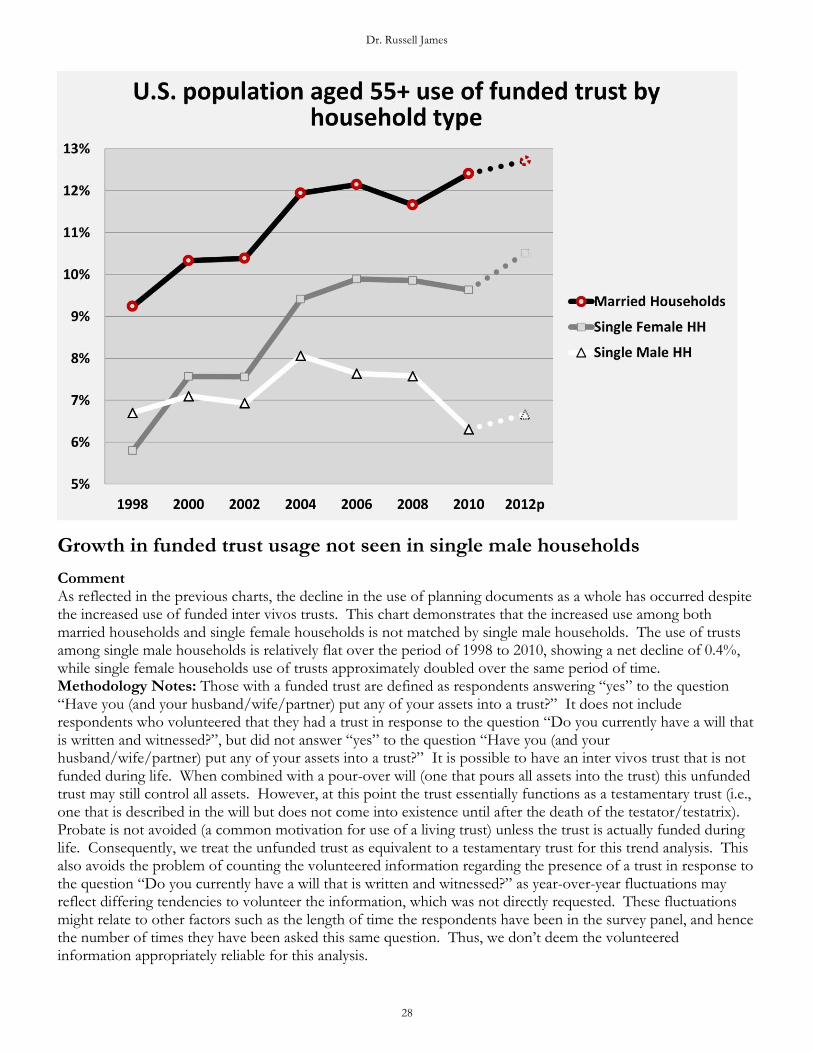
Growth in funded trust usage not seen in single male households
Comment As reflected in the previous charts, the decline in the use of planning documents as a whole has occurred despite the increased use of funded inter vivos trusts. This chart demonstrates that the increased use among both married households and single female households is not matched by single male households. The use of trusts among single male households is relatively flat over the period of 1998 to 2010, showing a net decline of 0.4%, while single female households use of trusts approximately doubled over the same period of time. Methodology Notes: Those with a funded trust are defined as respondents answering “yes” to the question “Have you (and your husband/wife/partner) put any of your assets into a trust?” It does not include respondents who volunteered that they had a trust in response to the question “Do you currently have a will that is written and witnessed?”, but did not answer “yes” to the question “Have you (and your husband/wife/partner) put any of your assets into a trust?” It is possible to have an inter vivos trust that is not funded during life. When combined with a pour-over will (one that pours all assets into the trust) this unfunded trust may still control all assets. However, at this point the trust essentially functions as a testamentary trust (i.e., one that is described in the will but does not come into existence until after the death of the testator/testatrix). Probate is not avoided (a common motivation for use of a living trust) unless the trust is actually funded during life. Consequently, we treat the unfunded trust as equivalent to a testamentary trust for this trend analysis. This also avoids the problem of counting the volunteered information regarding the presence of a trust in response to the question “Do you currently have a will that is written and witnessed?” as year-over-year fluctuations may reflect differing tendencies to volunteer the information, which was not directly requested. These fluctuations might relate to other factors such as the length of time the respondents have been in the survey panel, and hence the number of times they have been asked this same question. Thus, we don’t deem the volunteered information appropriately reliable for this analysis.

American Charitable Bequest Demographics
29
Only modest charitable planning differences among racial/ethnic groups with planning documents
Comment Among those with a will or trust, non-Hispanic white individuals are only slightly more likely to include a charitable recipient. This similarity in behavior is especially notable given the wealth differences between these groups. During these years non-Hispanic white individuals with a will or trust held, on average, more than twice as many assets as those in the other categories. All three groups showed increases in charitable participation between 1998 and 2010. Methodology Notes As the minority samples are relatively smaller, we can expect (and we observe) relatively more fluctuation in the rates from minorities from year to year. The lines for Hispanic and non-Hispanic black households intersect at two points and lines for non-Hispanic black and non-Hispanic white very nearly intersect in 2002. Thus, we would have relatively lower confidence of clear racial/ethnic differences for this behavior. White or black are a race categories and Hispanic is an ethnicity category meaning that the categories are not mutually exclusive. Thus, we separate the categories as Hispanic, non-Hispanic white, and non-Hispanic black. A Hispanic individual is one who responds “Yes” to the question “Do you consider yourself Hispanic or Latino?” and is taken from the Health and Retirement Study Tracker File. For 2006 and later surveys when respondents could identify with multiple racial categories, their race was the one with which the respondent indicated that they considered themselves primarily affiliated. However, the race category was used only when the respondent did not consider himself or herself to be Hispanic or Latino. As before all variables are weighted to reflect national populations using the respondent-level weight variable provided with the Health and Retirement Study.
Dr. Russell James
30
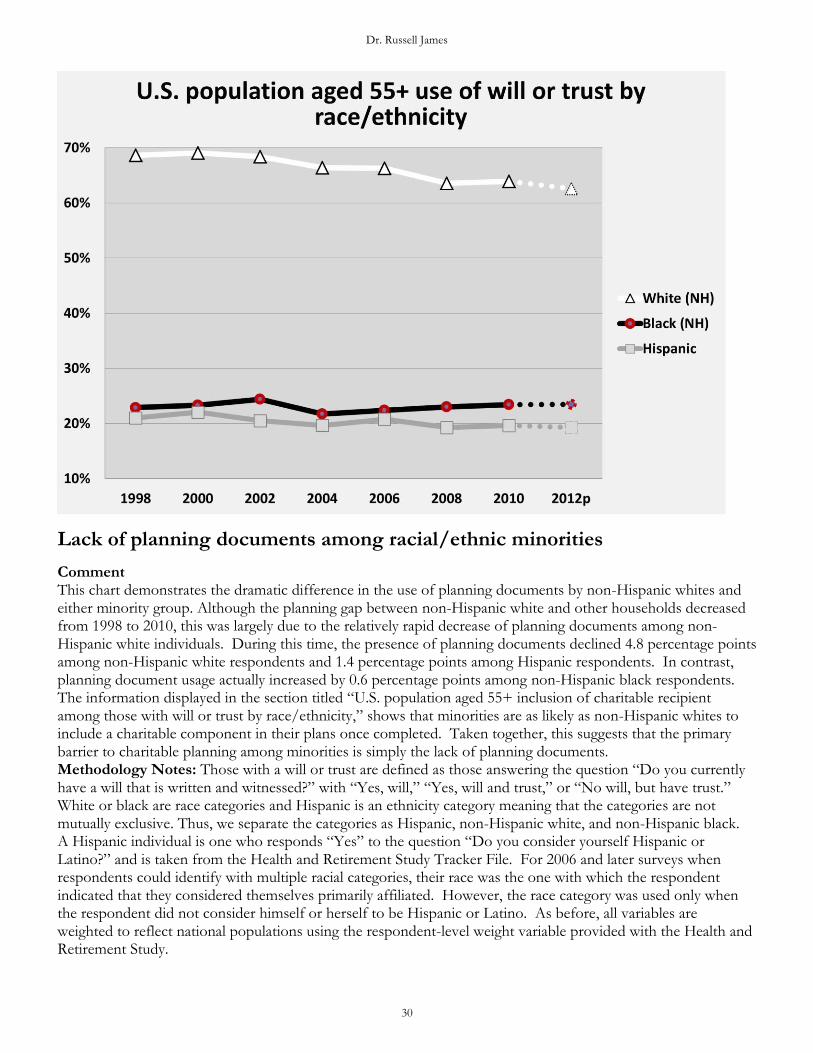
Lack of planning documents among racial/ethnic minorities
Comment This chart demonstrates the dramatic difference in the use of planning documents by non-Hispanic whites and either minority group. Although the planning gap between non-Hispanic white and other households decreased from 1998 to 2010, this was largely due to the relatively rapid decrease of planning documents among non-Hispanic white individuals. During this time, the presence of planning documents declined 4.8 percentage points among non-Hispanic white respondents and 1.4 percentage points among Hispanic respondents. In contrast, planning document usage actually increased by 0.6 percentage points among non-Hispanic black respondents. The information displayed in the section titled “U.S. population aged 55+ inclusion of charitable recipient among those with will or trust by race/ethnicity,” shows that minorities are as likely as non-Hispanic whites to include a charitable component in their plans once completed. Taken together, this suggests that the primary barrier to charitable planning among minorities is simply the lack of planning documents. Methodology Notes: Those with a will or trust are defined as those answering the question “Do you currently have a will that is written and witnessed?” with “Yes, will,” “Yes, will and trust,” or “No will, but have trust.” White or black are race categories and Hispanic is an ethnicity category meaning that the categories are not mutually exclusive. Thus, we separate the categories as Hispanic, non-Hispanic white, and non-Hispanic black. A Hispanic individual is one who responds “Yes” to the question “Do you consider yourself Hispanic or Latino?” and is taken from the Health and Retirement Study Tracker File. For 2006 and later surveys when respondents could identify with multiple racial categories, their race was the one with which the respondent indicated that they considered themselves primarily affiliated. However, the race category was used only when the respondent did not consider himself or herself to be Hispanic or Latino. As before, all variables are weighted to reflect national populations using the respondent-level weight variable provided with the Health and Retirement Study.
American Charitable Bequest Demographics
31
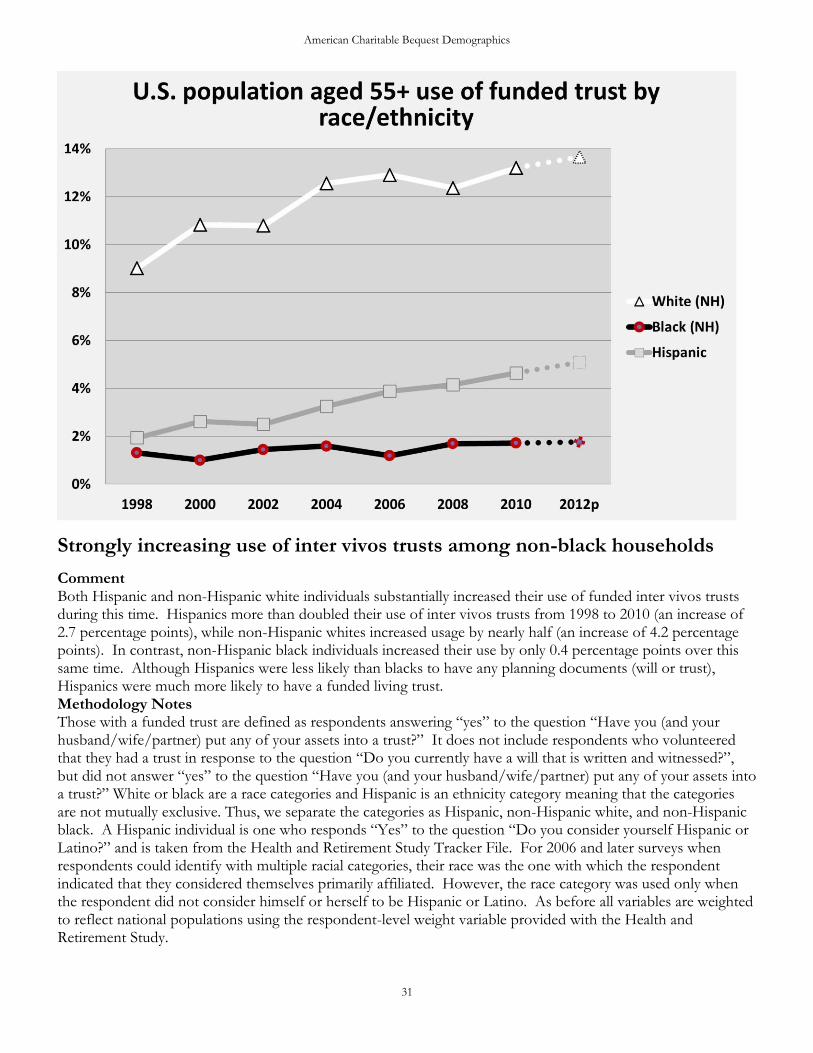
Strongly increasing use of inter vivos trusts among non-black households
Comment Both Hispanic and non-Hispanic white individuals substantially increased their use of funded inter vivos trusts during this time. Hispanics more than doubled their use of inter vivos trusts from 1998 to 2010 (an increase of 2.7 percentage points), while non-Hispanic whites increased usage by nearly half (an increase of 4.2 percentage points). In contrast, non-Hispanic black individuals increased their use by only 0.4 percentage points over this same time. Although Hispanics were less likely than blacks to have any planning documents (will or trust), Hispanics were much more likely to have a funded living trust. Methodology Notes Those with a funded trust are defined as respondents answering “yes” to the question “Have you (and your husband/wife/partner) put any of your assets into a trust?” It does not include respondents who volunteered that they had a trust in response to the question “Do you currently have a will that is written and witnessed?”, but did not answer “yes” to the question “Have you (and your husband/wife/partner) put any of your assets into a trust?” White or black are a race categories and Hispanic is an ethnicity category meaning that the categories are not mutually exclusive. Thus, we separate the categories as Hispanic, non-Hispanic white, and non-Hispanic black. A Hispanic individual is one who responds “Yes” to the question “Do you consider yourself Hispanic or Latino?” and is taken from the Health and Retirement Study Tracker File. For 2006 and later surveys when respondents could identify with multiple racial categories, their race was the one with which the respondent indicated that they considered themselves primarily affiliated. However, the race category was used only when the respondent did not consider himself or herself to be Hispanic or Latino. As before all variables are weighted to reflect national populations using the respondent-level weight variable provided with the Health and Retirement Study.
Dr. Russell James
32
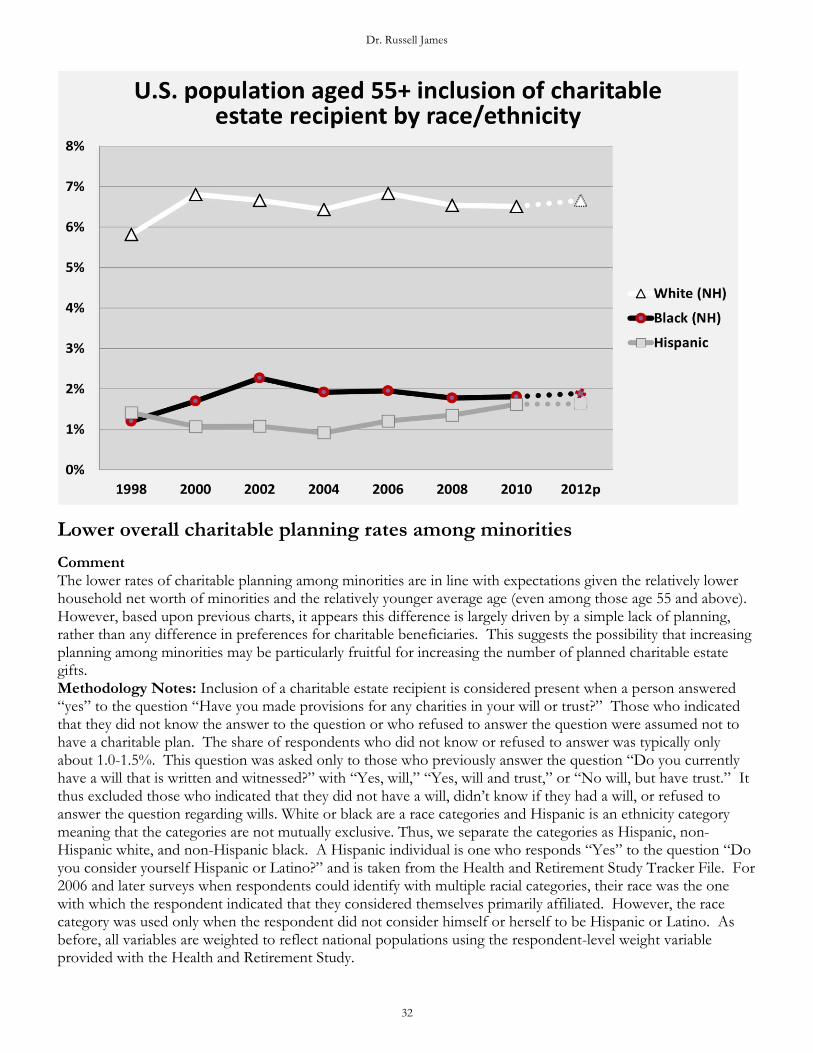
Lower overall charitable planning rates among minorities
Comment The lower rates of charitable planning among minorities are in line with expectations given the relatively lower household net worth of minorities and the relatively younger average age (even among those age 55 and above). However, based upon previous charts, it appears this difference is largely driven by a simple lack of planning, rather than any difference in preferences for charitable beneficiaries. This suggests the possibility that increasing planning among minorities may be particularly fruitful for increasing the number of planned charitable estate gifts. Methodology Notes: Inclusion of a charitable estate recipient is considered present when a person answered “yes” to the question “Have you made provisions for any charities in your will or trust?” Those who indicated that they did not know the answer to the question or who refused to answer the question were assumed not to have a charitable plan. The share of respondents who did not know or refused to answer was typically only about 1.0-1.5%. This question was asked only to those who previously answer the question “Do you currently have a will that is written and witnessed?” with “Yes, will,” “Yes, will and trust,” or “No will, but have trust.” It thus excluded those who indicated that they did not have a will, didn’t know if they had a will, or refused to answer the question regarding wills. White or black are a race categories and Hispanic is an ethnicity category meaning that the categories are not mutually exclusive. Thus, we separate the categories as Hispanic, non-Hispanic white, and non-Hispanic black. A Hispanic individual is one who responds “Yes” to the question “Do you consider yourself Hispanic or Latino?” and is taken from the Health and Retirement Study Tracker File. For 2006 and later surveys when respondents could identify with multiple racial categories, their race was the one with which the respondent indicated that they considered themselves primarily affiliated. However, the race category was used only when the respondent did not consider himself or herself to be Hispanic or Latino. As before, all variables are weighted to reflect national populations using the respondent-level weight variable provided with the Health and Retirement Study.

American Charitable Bequest Demographics
33
Consistently greater charitable planning by those without children
Comment The consistently greater tendency for those without children to leave a charitable bequest is demonstrated in the above chart. The overall trend for charitable planning was flat for those with grandchildren, positive for those with children only, and relatively flat, but with wider fluctuations, for those without offspring. The fluctuations seen in the childless group were larger, but this likely relates to the smaller size of this group which typically makes up a small proportion of the sample (e.g. in 2010 13,859 respondents had grandchildren, 2,558 respondents had children but no grandchildren, and only 1,151 respondents had no offspring). Childlessness is, in fact, the strongest single demographic predictor of the propensity to engage in charitable planning. A more detailed statistical analysis of this relationship can be found in the academic journal article: James, R. N., III. (2009). Health, wealth, and charitable estate planning: A longitudinal examination of testamentary charitable giving plans. Nonprofit and Voluntary Sector Quarterly, 38(6), 1026-1043. Methodology Notes: In a few cases respondents answered the question regarding how many grandchildren they had with the answer “don’t know”. The assumption was made that in these cases the respondent had grandchildren, but was uncertain as to the number. Thus, these respondents were excluded from calculations regarding the number of grandchildren, but included for calculations comparing those with grandchildren to those without. Similarly, the very small number not answering the question were placed into the majority category of having grandchildren, but excluded from calculations regarding the number of grandchildren. Thus, those without grandchildren were those who affirmatively stated they had none and are compared against all others. The total number of these special cases varied from year to year, but was typically less than 2% of the sample. As before all data come from the Health and Retirement Study and are weighted to reflect national averages. The weighting here may be less reliable as the weighting is not specifically designed to be used with separate offspring categories, but simply reflects the respondent-level weighting to project to a national population based upon age, gender, race/ethnicity, and marital status.
Dr. Russell James
34
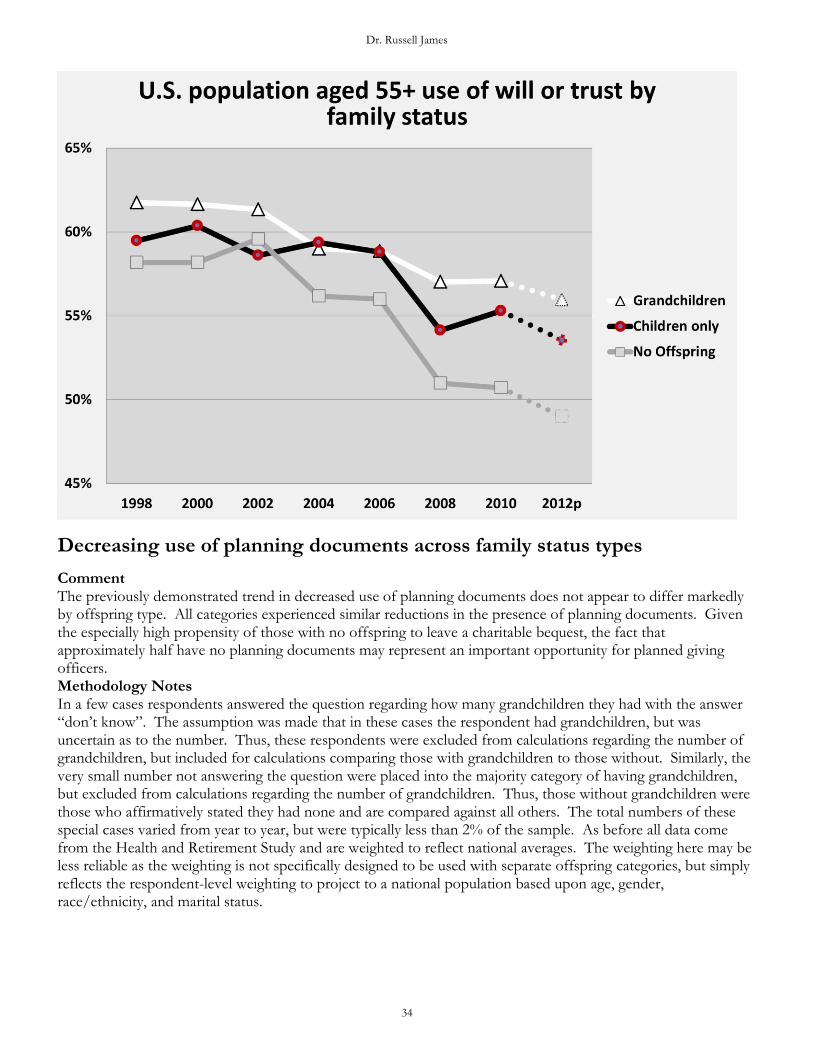
Decreasing use of planning documents across family status types
Comment The previously demonstrated trend in decreased use of planning documents does not appear to differ markedly by offspring type. All categories experienced similar reductions in the presence of planning documents. Given the especially high propensity of those with no offspring to leave a charitable bequest, the fact that approximately half have no planning documents may represent an important opportunity for planned giving officers. Methodology Notes In a few cases respondents answered the question regarding how many grandchildren they had with the answer “don’t know”. The assumption was made that in these cases the respondent had grandchildren, but was uncertain as to the number. Thus, these respondents were excluded from calculations regarding the number of grandchildren, but included for calculations comparing those with grandchildren to those without. Similarly, the very small number not answering the question were placed into the majority category of having grandchildren, but excluded from calculations regarding the number of grandchildren. Thus, those without grandchildren were those who affirmatively stated they had none and are compared against all others. The total numbers of these special cases varied from year to year, but were typically less than 2% of the sample. As before all data come from the Health and Retirement Study and are weighted to reflect national averages. The weighting here may be less reliable as the weighting is not specifically designed to be used with separate offspring categories, but simply reflects the respondent-level weighting to project to a national population based upon age, gender, race/ethnicity, and marital status.
American Charitable Bequest Demographics
35
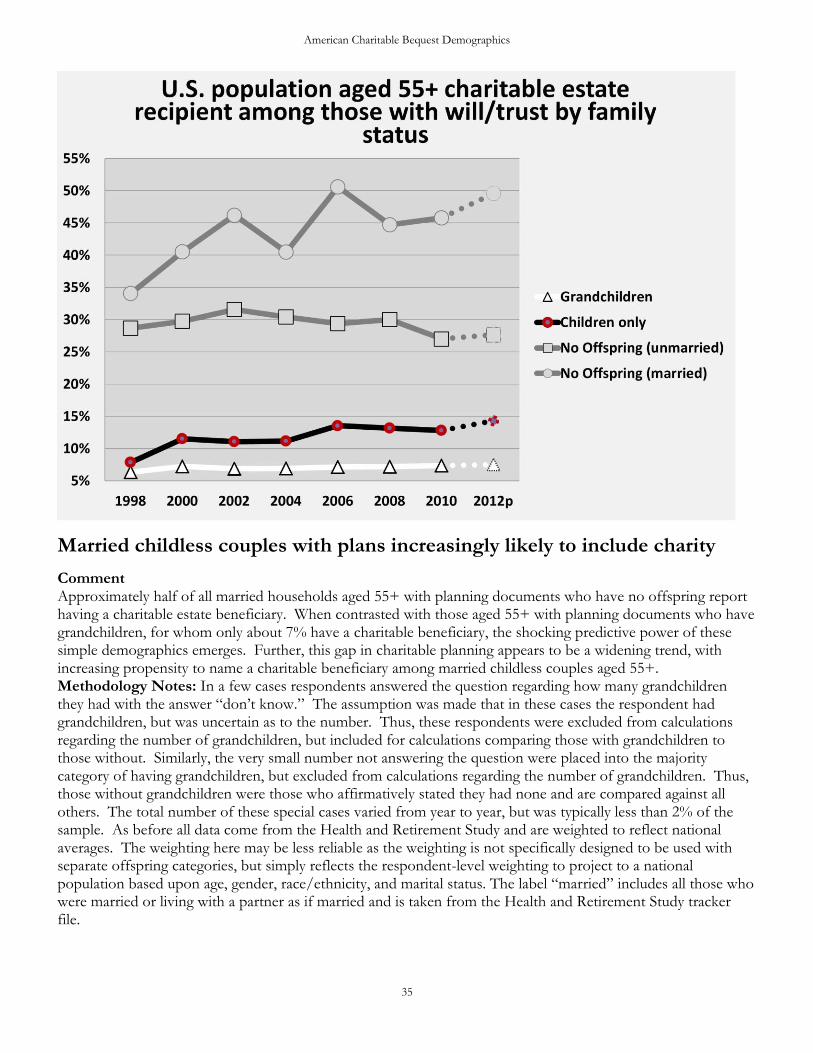
Married childless couples with plans increasingly likely to include charity
Comment Approximately half of all married households aged 55+ with planning documents who have no offspring report having a charitable estate beneficiary. When contrasted with those aged 55+ with planning documents who have grandchildren, for whom only about 7% have a charitable beneficiary, the shocking predictive power of these simple demographics emerges. Further, this gap in charitable planning appears to be a widening trend, with increasing propensity to name a charitable beneficiary among married childless couples aged 55+. Methodology Notes: In a few cases respondents answered the question regarding how many grandchildren they had with the answer “don’t know.” The assumption was made that in these cases the respondent had grandchildren, but was uncertain as to the number. Thus, these respondents were excluded from calculations regarding the number of grandchildren, but included for calculations comparing those with grandchildren to those without. Similarly, the very small number not answering the question were placed into the majority category of having grandchildren, but excluded from calculations regarding the number of grandchildren. Thus, those without grandchildren were those who affirmatively stated they had none and are compared against all others. The total number of these special cases varied from year to year, but was typically less than 2% of the sample. As before all data come from the Health and Retirement Study and are weighted to reflect national averages. The weighting here may be less reliable as the weighting is not specifically designed to be used with separate offspring categories, but simply reflects the respondent-level weighting to project to a national population based upon age, gender, race/ethnicity, and marital status. The label “married” includes all those who were married or living with a partner as if married and is taken from the Health and Retirement Study tracker file.
Dr. Russell James
36
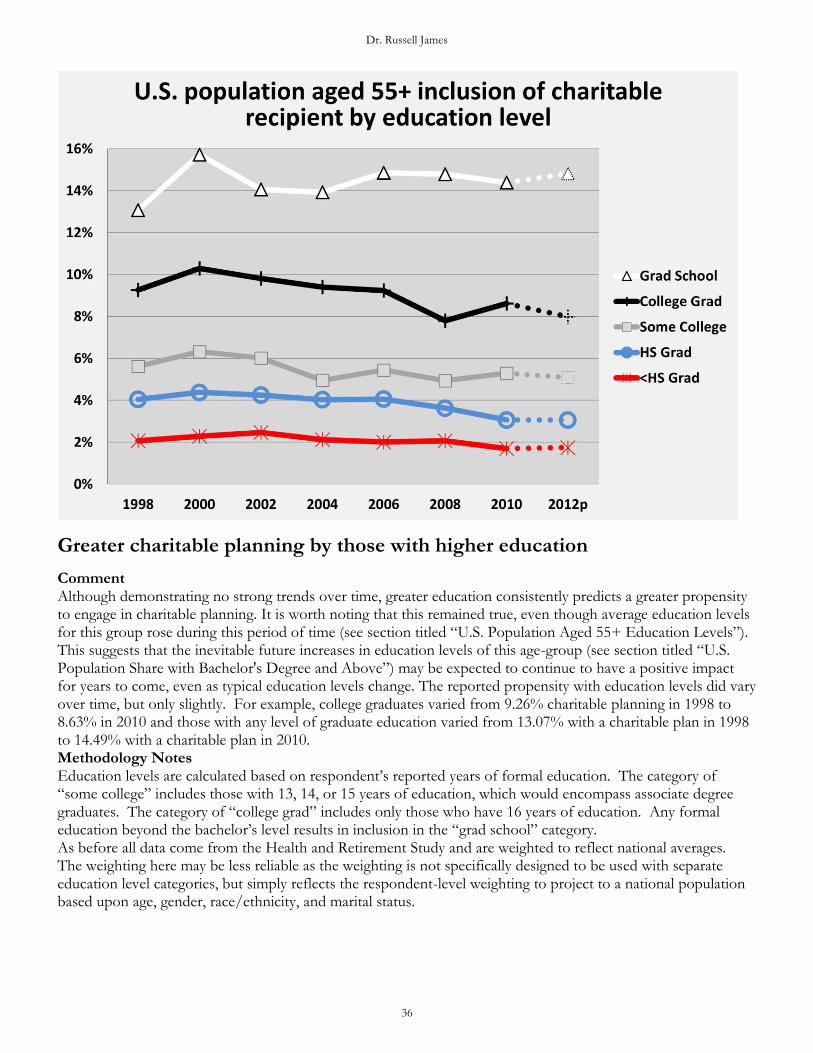
Greater charitable planning by those with higher education
Comment Although demonstrating no strong trends over time, greater education consistently predicts a greater propensity to engage in charitable planning. It is worth noting that this remained true, even though average education levels for this group rose during this period of time (see section titled “U.S. Population Aged 55+ Education Levels”). This suggests that the inevitable future increases in education levels of this age-group (see section titled “U.S. Population Share with Bachelor's Degree and Above”) may be expected to continue to have a positive impact for years to come, even as typical education levels change. The reported propensity with education levels did vary over time, but only slightly. For example, college graduates varied from 9.26% charitable planning in 1998 to 8.63% in 2010 and those with any level of graduate education varied from 13.07% with a charitable plan in 1998 to 14.49% with a charitable plan in 2010. Methodology Notes Education levels are calculated based on respondent’s reported years of formal education. The category of “some college” includes those with 13, 14, or 15 years of education, which would encompass associate degree graduates. The category of “college grad” includes only those who have 16 years of education. Any formal education beyond the bachelor’s level results in inclusion in the “grad school” category. As before all data come from the Health and Retirement Study and are weighted to reflect national averages. The weighting here may be less reliable as the weighting is not specifically designed to be used with separate education level categories, but simply reflects the respondent-level weighting to project to a national population based upon age, gender, race/ethnicity, and marital status.
American Charitable Bequest Demographics
37
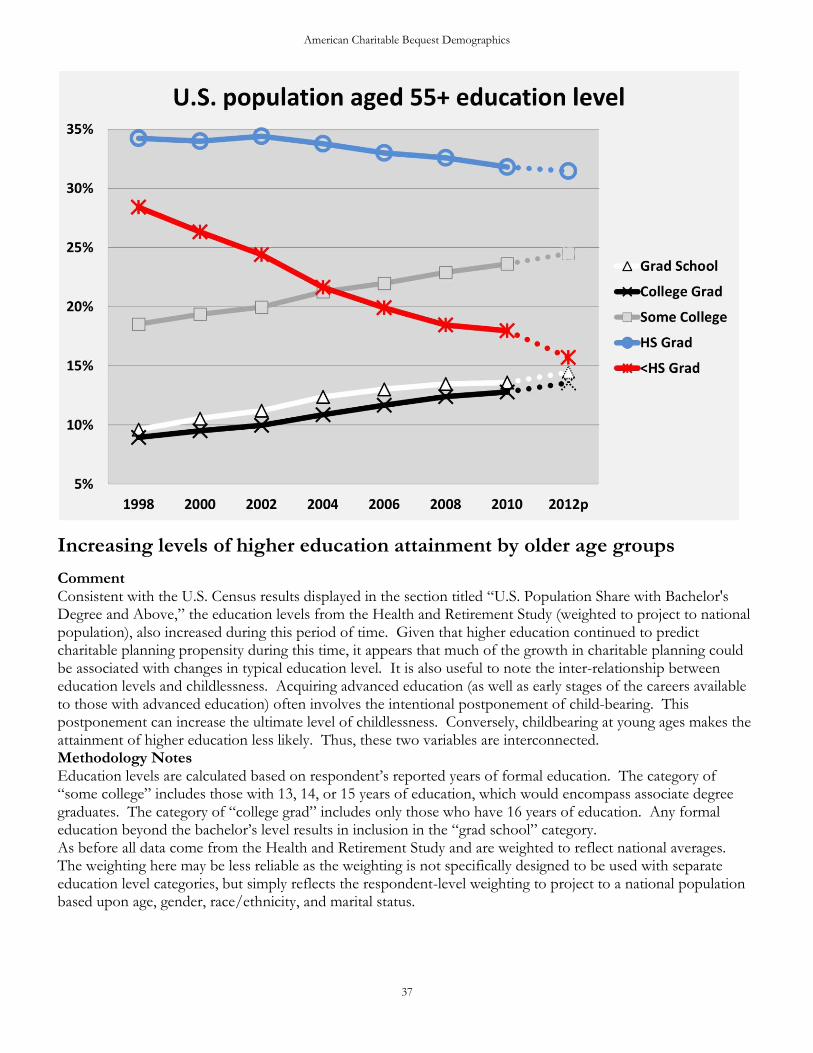
Increasing levels of higher education attainment by older age groups
Comment Consistent with the U.S. Census results displayed in the section titled “U.S. Population Share with Bachelor's Degree and Above,” the education levels from the Health and Retirement Study (weighted to project to national population), also increased during this period of time. Given that higher education continued to predict charitable planning propensity during this time, it appears that much of the growth in charitable planning could be associated with changes in typical education level. It is also useful to note the inter-relationship between education levels and childlessness. Acquiring advanced education (as well as early stages of the careers available to those with advanced education) often involves the intentional postponement of child-bearing. This postponement can increase the ultimate level of childlessness. Conversely, childbearing at young ages makes the attainment of higher education less likely. Thus, these two variables are interconnected. Methodology Notes Education levels are calculated based on respondent’s reported years of formal education. The category of “some college” includes those with 13, 14, or 15 years of education, which would encompass associate degree graduates. The category of “college grad” includes only those who have 16 years of education. Any formal education beyond the bachelor’s level results in inclusion in the “grad school” category. As before all data come from the Health and Retirement Study and are weighted to reflect national averages. The weighting here may be less reliable as the weighting is not specifically designed to be used with separate education level categories, but simply reflects the respondent-level weighting to project to a national population based upon age, gender, race/ethnicity, and marital status.

Dr. Russell James
38
Decreasing use of planning documents across all educational levels
Comment Across the period of time examined, higher levels of education were consistently associated with greater likelihood of having planning documents. This makes sense given both the complexity of the planning process and the association of greater wealth with those with higher levels of education. However, any notion that the general trend in the reduced use of planning documents over time might be a limited to the less educated is dispelled by this chart. All education levels showed similarly negative trends in the use of planning documents. The reduced use of planning documents by the most highly educated gives additional support to the idea that part of this trend could be driven by the growing using of non-probate transfers (e.g., transfer-on-death title designations), rather than by an increased preference for using intestate succession. Methodology Notes Education levels are calculated based on respondent’s reported years of formal education. The category of “some college” includes those with 13, 14, or 15 years of education, which would encompass associate degree graduates. The category of “college grad” includes only those who have 16 years of education. Any formal education beyond the bachelor’s level results in inclusion in the “grad school” category. As before all data come from the Health and Retirement Study and are weighted to reflect national averages. The weighting here may be less reliable as the weighting is not specifically designed to be used with separate education level categories, but simply reflects the respondent-level weighting to project to a national population based upon age, gender, race/ethnicity, and marital status.
American Charitable Bequest Demographics
39
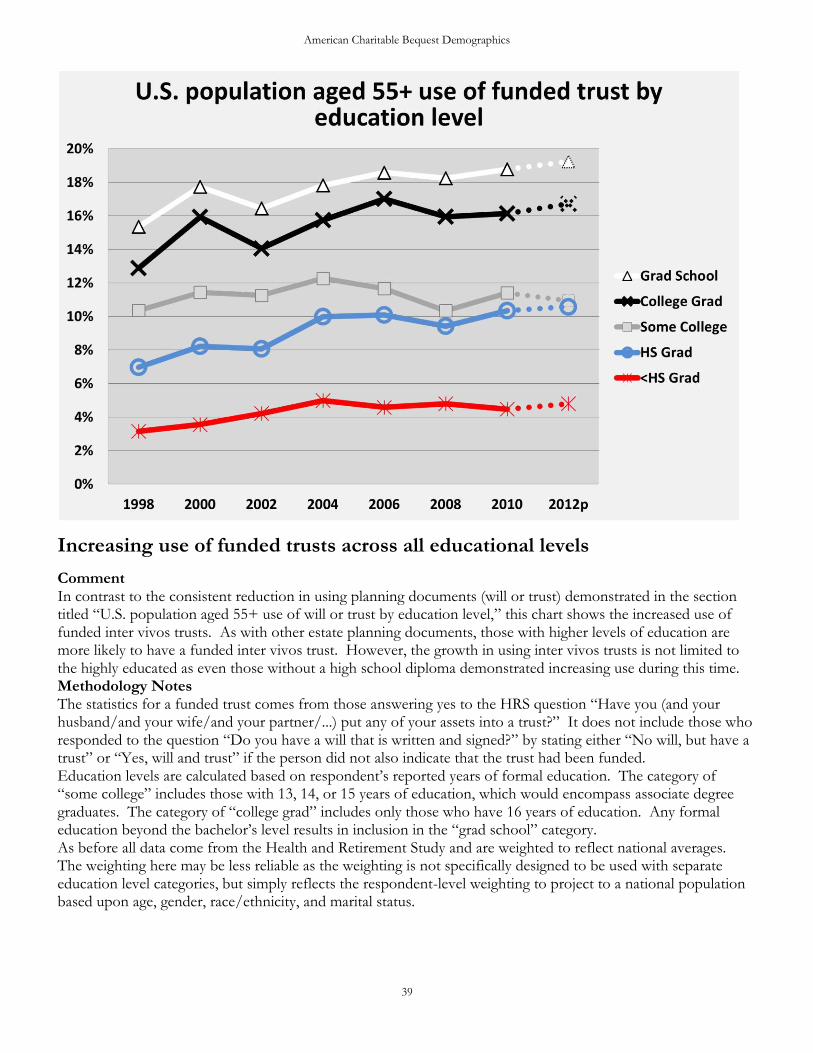
Increasing use of funded trusts across all educational levels
Comment In contrast to the consistent reduction in using planning documents (will or trust) demonstrated in the section titled “U.S. population aged 55+ use of will or trust by education level,” this chart shows the increased use of funded inter vivos trusts. As with other estate planning documents, those with higher levels of education are more likely to have a funded inter vivos trust. However, the growth in using inter vivos trusts is not limited to the highly educated as even those without a high school diploma demonstrated increasing use during this time. Methodology Notes The statistics for a funded trust comes from those answering yes to the HRS question “Have you (and your husband/and your wife/and your partner/...) put any of your assets into a trust?” It does not include those who responded to the question “Do you have a will that is written and signed?” by stating either “No will, but have a trust” or “Yes, will and trust” if the person did not also indicate that the trust had been funded. Education levels are calculated based on respondent’s reported years of formal education. The category of “some college” includes those with 13, 14, or 15 years of education, which would encompass associate degree graduates. The category of “college grad” includes only those who have 16 years of education. Any formal education beyond the bachelor’s level results in inclusion in the “grad school” category. As before all data come from the Health and Retirement Study and are weighted to reflect national averages. The weighting here may be less reliable as the weighting is not specifically designed to be used with separate education level categories, but simply reflects the respondent-level weighting to project to a national population based upon age, gender, race/ethnicity, and marital status.
Dr. Russell James
40
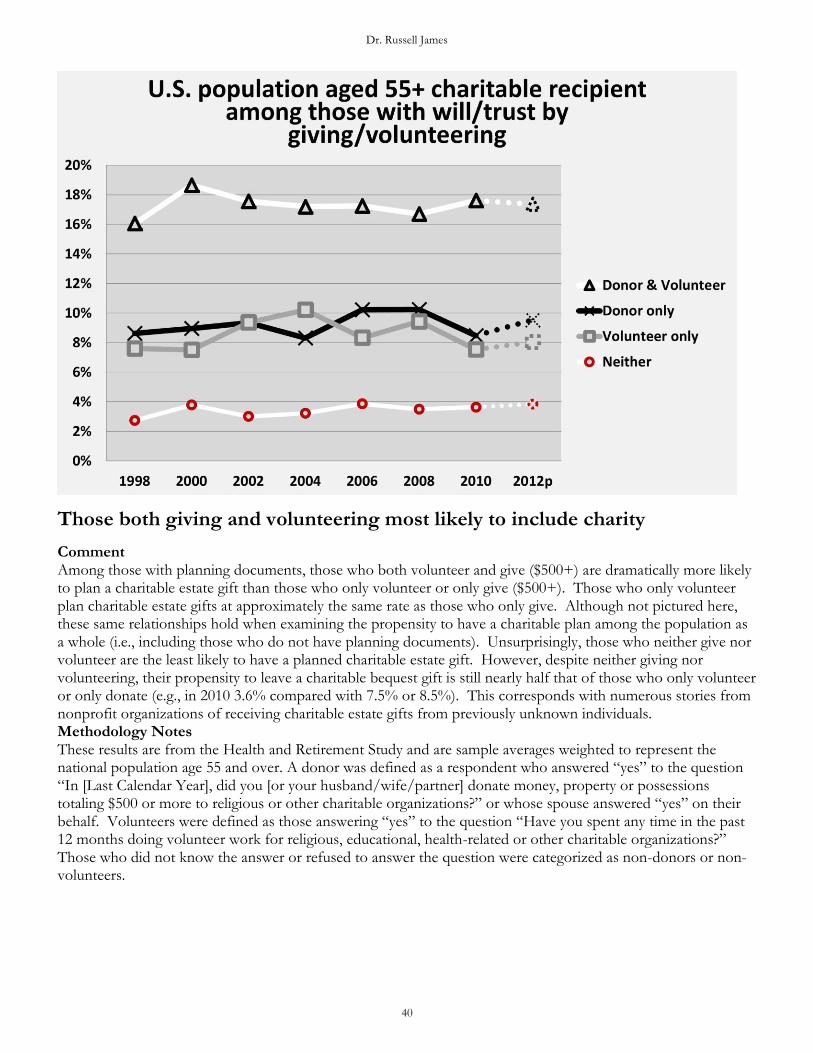
Those both giving and volunteering most likely to include charity
Comment Among those with planning documents, those who both volunteer and give ($500+) are dramatically more likely to plan a charitable estate gift than those who only volunteer or only give ($500+). Those who only volunteer plan charitable estate gifts at approximately the same rate as those who only give. Although not pictured here, these same relationships hold when examining the propensity to have a charitable plan among the population as a whole (i.e., including those who do not have planning documents). Unsurprisingly, those who neither give nor volunteer are the least likely to have a planned charitable estate gift. However, despite neither giving nor volunteering, their propensity to leave a charitable bequest gift is still nearly half that of those who only volunteer or only donate (e.g., in 2010 3.6% compared with 7.5% or 8.5%). This corresponds with numerous stories from nonprofit organizations of receiving charitable estate gifts from previously unknown individuals. Methodology Notes These results are from the Health and Retirement Study and are sample averages weighted to represent the national population age 55 and over. A donor was defined as a respondent who answered “yes” to the question “In [Last Calendar Year], did you [or your husband/wife/partner] donate money, property or possessions totaling $500 or more to religious or other charitable organizations?” or whose spouse answered “yes” on their behalf. Volunteers were defined as those answering “yes” to the question “Have you spent any time in the past 12 months doing volunteer work for religious, educational, health-related or other charitable organizations?” Those who did not know the answer or refused to answer the question were categorized as non-donors or non-volunteers.

American Charitable Bequest Demographics
41
Decreasing use of wills or trusts among volunteers, donors, and others
Comment Of critical importance to nonprofit organizations, the national trend towards decreased use of planning documents appears to be affecting both donors and volunteers. As these are the people who make up the bulk of charitable bequest donors, such a trend may not be positive for nonprofit organizations. However, it is possible to name charities in a non-probate transfer title designation. But, it is unknown how common this is, or whether it would ameliorate the negative trends seen here. Also notable is that although non-donor volunteers with planning documents are just as likely to include a charity as non-volunteer donors, they are much less likely to have planning documents. Methodology Notes A donor was defined as a respondent who answered “yes” to the question “In [Last Calendar Year], did you [or your husband/wife/partner] donate money, property or possessions totaling $500 or more to religious or other charitable organizations?” or whose spouse answered “yes” on their behalf. Volunteers were defined as those answering “yes” to the question “Have you spent any time in the past 12 months doing volunteer work for religious, educational, health-related or other charitable organizations?” Those who did not know the answer or refused to answer the question were categorized as non-donors or non-volunteers. Those with a will or trust are defined as those answering the question, “Do you currently have a will that is written and witnessed?” with “Yes, will,” “Yes, will and trust,” or “No will, but have trust,” or who answered “Yes” to the question “Have you (and your husband/wife/partner) put any of your assets into a trust?”

Dr. Russell James
42
Clear wealth stratification in charitable planning frequency
Comment The IRS statistics of income information on taxable estates demonstrates that among the wealthy (defined as those with taxable estates), those with more wealth are more likely to engage in charitable planning. This chart adds to that knowledge by showing that this relationship exists across the wealth spectrum, not just at the high end seen in estate tax data. Except for a generally growing trend toward charitable planning among the wealthiest, there do not appear to be any consistent trends over time within the wealth quintiles. Methodology Notes Wealth quintile cutoff points were calculated using the respondent weights from HRS data in each year. (Thus, more or less than 20% of the sample will fall into each quintile segment as the quintiles were based upon projected national population quintiles and not simply the sample quintiles.) For 1998-2008 the wealth variable used was the imputed net wealth calculated by RAND and listed as the “H_ATOTA” variable. For 2010, the new younger cohort added to the survey had not yet had this variable calculated at the time of this analysis and so this younger group is excluded from the above chart for the 2010 survey year. As such, the standard respondent weights were used for this 2010 analysis rather than the estimated weights. Inclusion of a charitable estate recipient is considered present when a person answered “yes” to the question “Have you made provisions for any charities in your will or trust?” Those who indicated that they did not know the answer to the question or who refused to answer the question were assumed not to have a charitable plan. The share of respondents who did not know or refused to answer was typically only about 1.0-1.5%. This question was asked only to those who previously answer the question, “Do you currently have a will that is written and witnessed?” with “Yes, will,” “Yes, will and trust,” or “No will, but have trust.” It thus excluded those who indicated that they did not have a will, didn’t know if they had a will, or refused to answer the question regarding wills.
American Charitable Bequest Demographics
43
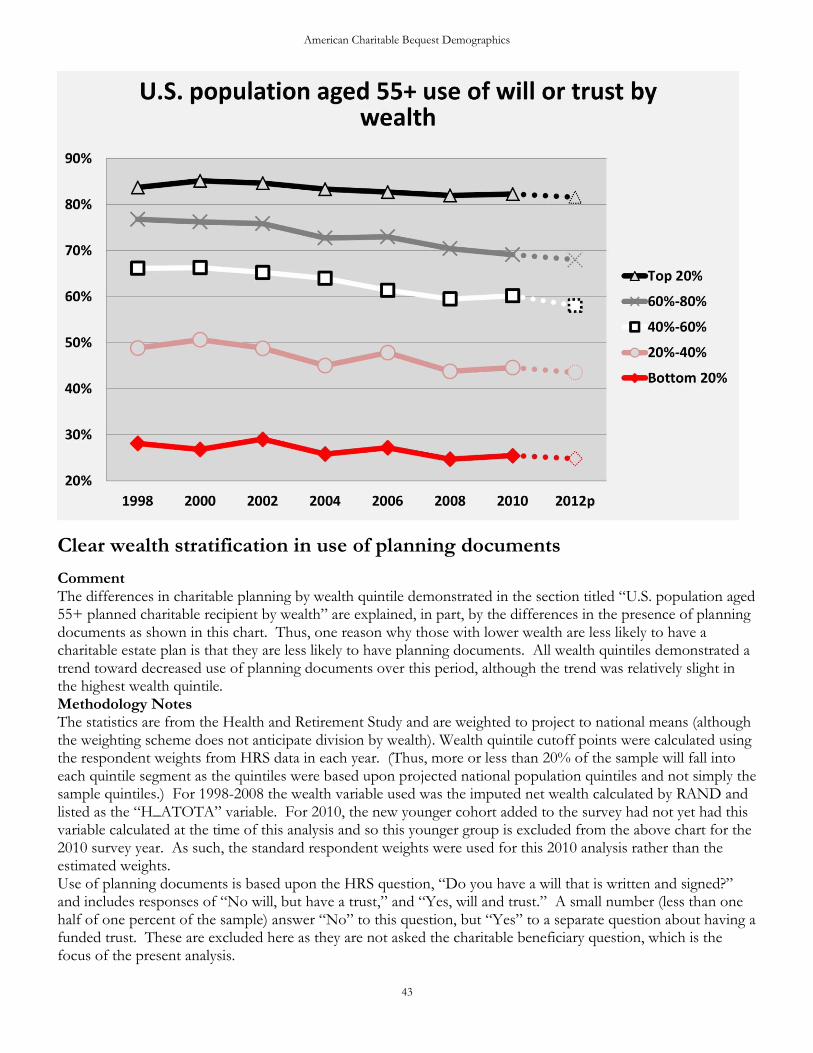
Clear wealth stratification in use of planning documents
Comment The differences in charitable planning by wealth quintile demonstrated in the section titled “U.S. population aged 55+ planned charitable recipient by wealth” are explained, in part, by the differences in the presence of planning documents as shown in this chart. Thus, one reason why those with lower wealth are less likely to have a charitable estate plan is that they are less likely to have planning documents. All wealth quintiles demonstrated a trend toward decreased use of planning documents over this period, although the trend was relatively slight in the highest wealth quintile. Methodology Notes The statistics are from the Health and Retirement Study and are weighted to project to national means (although the weighting scheme does not anticipate division by wealth). Wealth quintile cutoff points were calculated using the respondent weights from HRS data in each year. (Thus, more or less than 20% of the sample will fall into each quintile segment as the quintiles were based upon projected national population quintiles and not simply the sample quintiles.) For 1998-2008 the wealth variable used was the imputed net wealth calculated by RAND and listed as the “H_ATOTA” variable. For 2010, the new younger cohort added to the survey had not yet had this variable calculated at the time of this analysis and so this younger group is excluded from the above chart for the 2010 survey year. As such, the standard respondent weights were used for this 2010 analysis rather than the estimated weights. Use of planning documents is based upon the HRS question, “Do you have a will that is written and signed?” and includes responses of “No will, but have a trust,” and “Yes, will and trust.” A small number (less than one half of one percent of the sample) answer “No” to this question, but “Yes” to a separate question about having a funded trust. These are excluded here as they are not asked the charitable beneficiary question, which is the focus of the present analysis.
Dr. Russell James
44
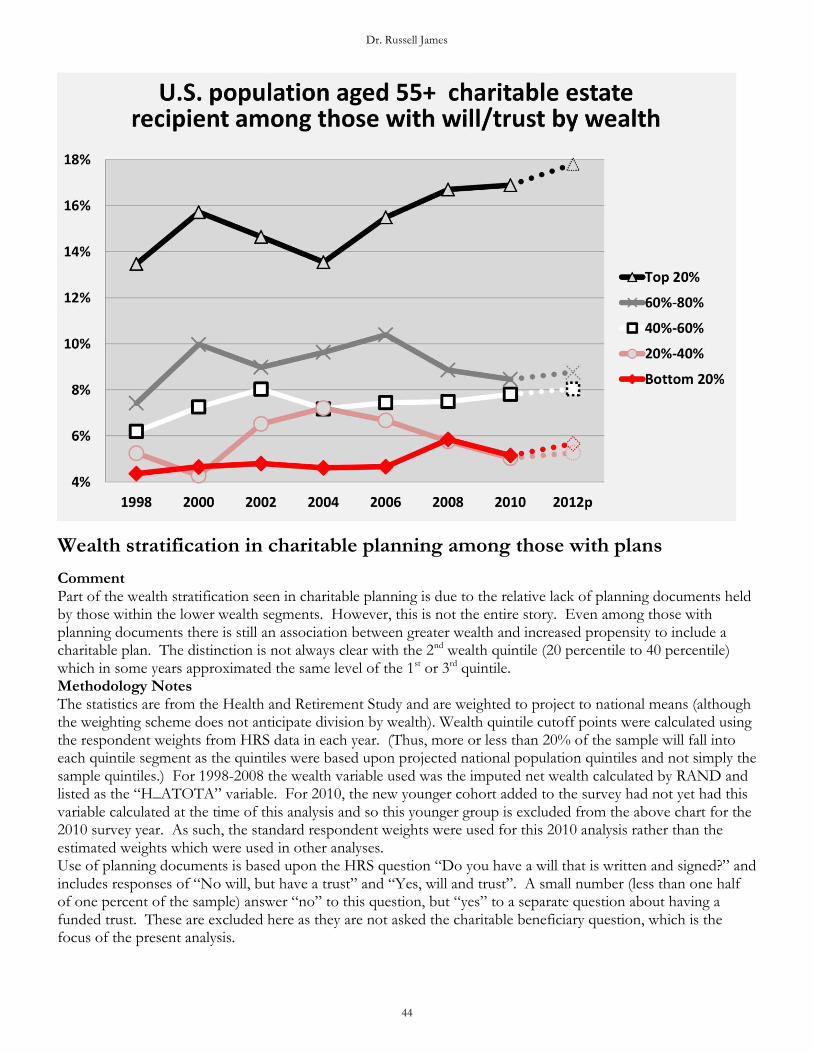
Wealth stratification in charitable planning among those with plans
Comment Part of the wealth stratification seen in charitable planning is due to the relative lack of planning documents held by those within the lower wealth segments. However, this is not the entire story. Even among those with planning documents there is still an association between greater wealth and increased propensity to include a charitable plan. The distinction is not always clear with the 2nd wealth quintile (20 percentile to 40 percentile) which in some years approximated the same level of the 1st or 3rd quintile. Methodology Notes The statistics are from the Health and Retirement Study and are weighted to project to national means (although the weighting scheme does not anticipate division by wealth). Wealth quintile cutoff points were calculated using the respondent weights from HRS data in each year. (Thus, more or less than 20% of the sample will fall into each quintile segment as the quintiles were based upon projected national population quintiles and not simply the sample quintiles.) For 1998-2008 the wealth variable used was the imputed net wealth calculated by RAND and listed as the “H_ATOTA” variable. For 2010, the new younger cohort added to the survey had not yet had this variable calculated at the time of this analysis and so this younger group is excluded from the above chart for the 2010 survey year. As such, the standard respondent weights were used for this 2010 analysis rather than the estimated weights which were used in other analyses. Use of planning documents is based upon the HRS question “Do you have a will that is written and signed?” and includes responses of “No will, but have a trust” and “Yes, will and trust”. A small number (less than one half of one percent of the sample) answer “no” to this question, but “yes” to a separate question about having a funded trust. These are excluded here as they are not asked the charitable beneficiary question, which is the focus of the present analysis.
American Charitable Bequest Demographics
45
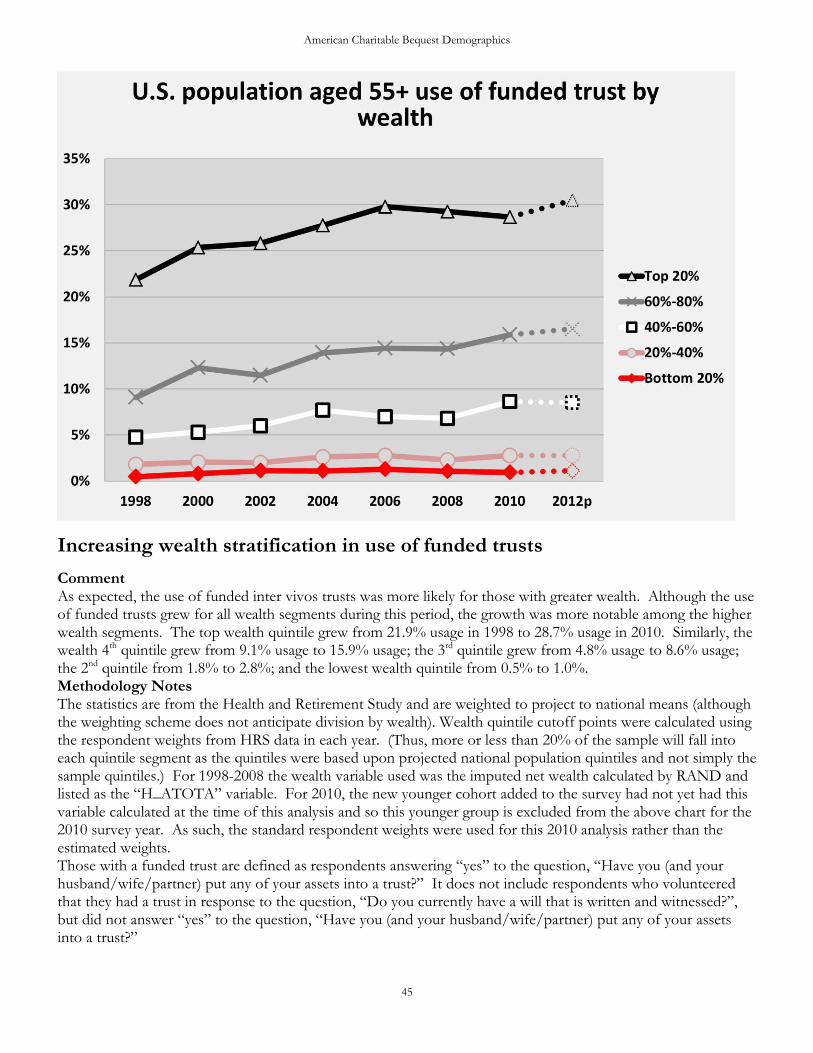
Increasing wealth stratification in use of funded trusts
Comment As expected, the use of funded inter vivos trusts was more likely for those with greater wealth. Although the use of funded trusts grew for all wealth segments during this period, the growth was more notable among the higher wealth segments. The top wealth quintile grew from 21.9% usage in 1998 to 28.7% usage in 2010. Similarly, the wealth 4th quintile grew from 9.1% usage to 15.9% usage; the 3rd quintile grew from 4.8% usage to 8.6% usage; the 2nd quintile from 1.8% to 2.8%; and the lowest wealth quintile from 0.5% to 1.0%. Methodology Notes The statistics are from the Health and Retirement Study and are weighted to project to national means (although the weighting scheme does not anticipate division by wealth). Wealth quintile cutoff points were calculated using the respondent weights from HRS data in each year. (Thus, more or less than 20% of the sample will fall into each quintile segment as the quintiles were based upon projected national population quintiles and not simply the sample quintiles.) For 1998-2008 the wealth variable used was the imputed net wealth calculated by RAND and listed as the “H_ATOTA” variable. For 2010, the new younger cohort added to the survey had not yet had this variable calculated at the time of this analysis and so this younger group is excluded from the above chart for the 2010 survey year. As such, the standard respondent weights were used for this 2010 analysis rather than the estimated weights. Those with a funded trust are defined as respondents answering “yes” to the question, “Have you (and your husband/wife/partner) put any of your assets into a trust?” It does not include respondents who volunteered that they had a trust in response to the question, “Do you currently have a will that is written and witnessed?”, but did not answer “yes” to the question, “Have you (and your husband/wife/partner) put any of your assets into a trust?”

Dr. Russell James
46
American Charitable Bequest Demographics
47

Dr. Russell James
48
American Charitable Bequest Demographics
49
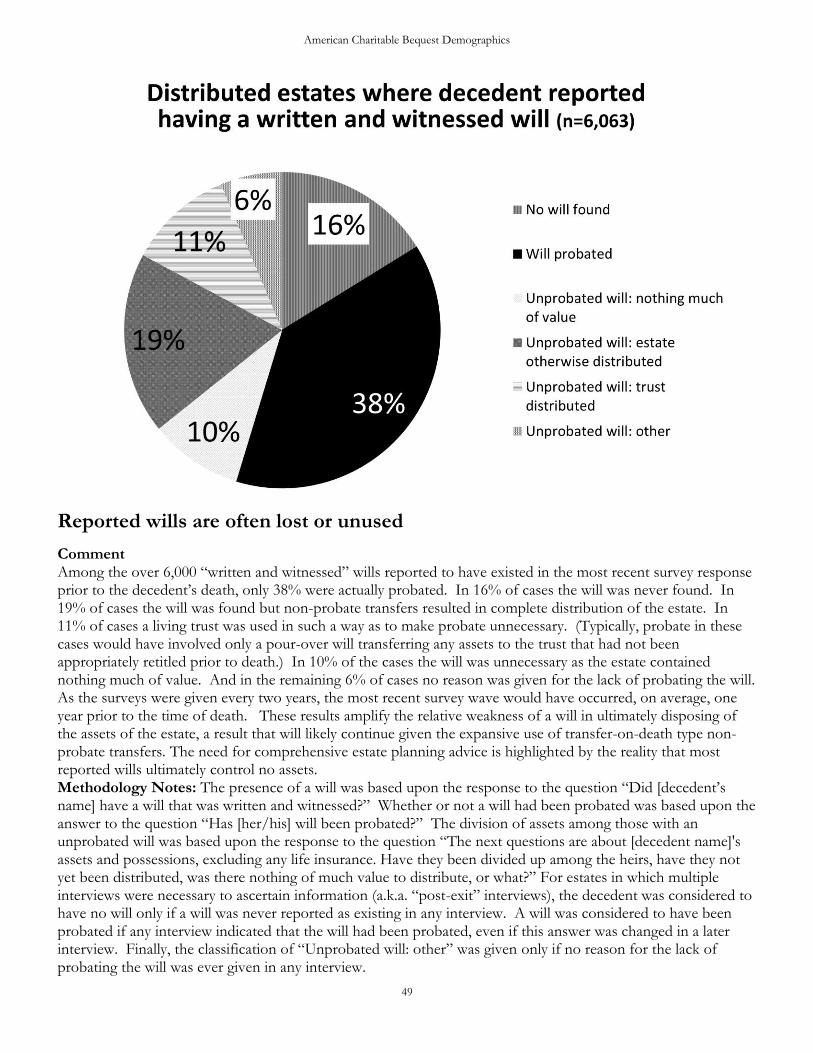
Reported wills are often lost or unused
Comment Among the over 6,000 “written and witnessed” wills reported to have existed in the most recent survey response prior to the decedent’s death, only 38% were actually probated. In 16% of cases the will was never found. In 19% of cases the will was found but non-probate transfers resulted in complete distribution of the estate. In 11% of cases a living trust was used in such a way as to make probate unnecessary. (Typically, probate in these cases would have involved only a pour-over will transferring any assets to the trust that had not been appropriately retitled prior to death.) In 10% of the cases the will was unnecessary as the estate contained nothing much of value. And in the remaining 6% of cases no reason was given for the lack of probating the will. As the surveys were given every two years, the most recent survey wave would have occurred, on average, one year prior to the time of death. These results amplify the relative weakness of a will in ultimately disposing of the assets of the estate, a result that will likely continue given the expansive use of transfer-on-death type non-probate transfers. The need for comprehensive estate planning advice is highlighted by the reality that most reported wills ultimately control no assets. Methodology Notes: The presence of a will was based upon the response to the question “Did [decedent’s name] have a will that was written and witnessed?” Whether or not a will had been probated was based upon the answer to the question “Has [her/his] will been probated?” The division of assets among those with an unprobated will was based upon the response to the question “The next questions are about [decedent name]'s assets and possessions, excluding any life insurance. Have they been divided up among the heirs, have they not yet been distributed, was there nothing of much value to distribute, or what?” For estates in which multiple interviews were necessary to ascertain information (a.k.a. “post-exit” interviews), the decedent was considered to have no will only if a will was never reported as existing in any interview. A will was considered to have been probated if any interview indicated that the will had been probated, even if this answer was changed in a later interview. Finally, the classification of “Unprobated will: other” was given only if no reason for the lack of probating the will was ever given in any interview.
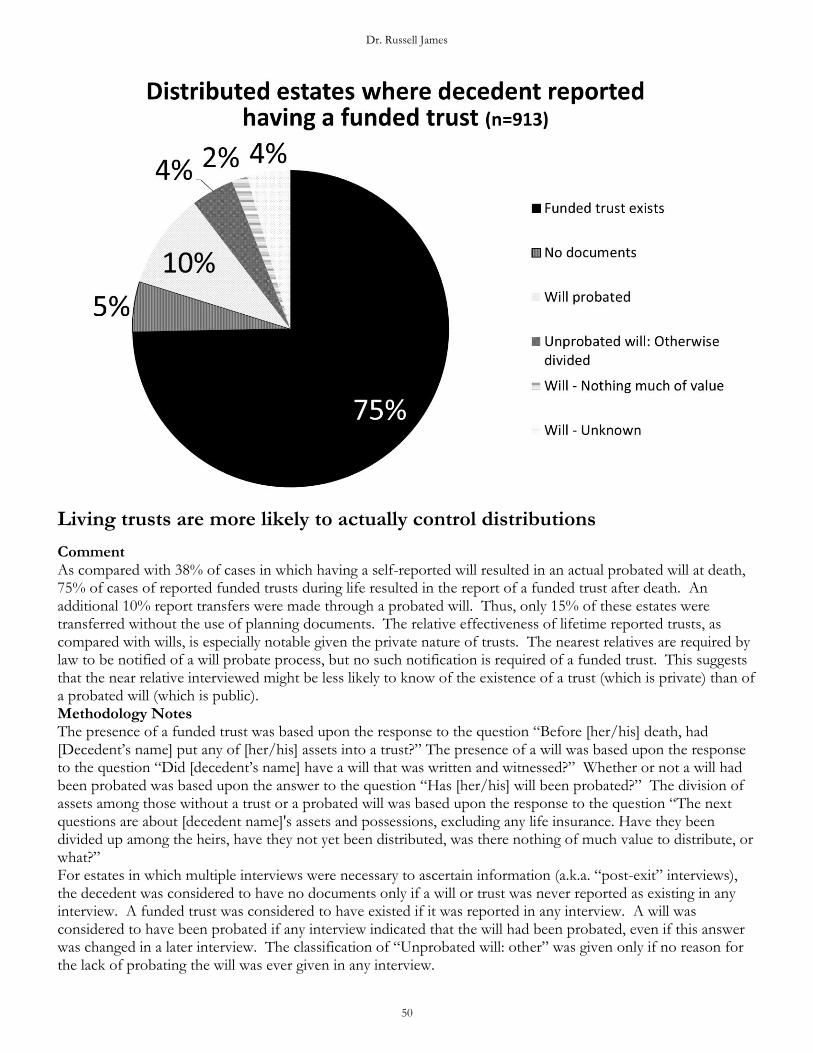
Dr. Russell James
50
Living trusts are more likely to actually control distributions
Comment As compared with 38% of cases in which having a self-reported will resulted in an actual probated will at death, 75% of cases of reported funded trusts during life resulted in the report of a funded trust after death. An additional 10% report transfers were made through a probated will. Thus, only 15% of these estates were transferred without the use of planning documents. The relative effectiveness of lifetime reported trusts, as compared with wills, is especially notable given the private nature of trusts. The nearest relatives are required by law to be notified of a will probate process, but no such notification is required of a funded trust. This suggests that the near relative interviewed might be less likely to know of the existence of a trust (which is private) than of a probated will (which is public). Methodology Notes The presence of a funded trust was based upon the response to the question “Before [her/his] death, had [Decedent’s name] put any of [her/his] assets into a trust?” The presence of a will was based upon the response to the question “Did [decedent’s name] have a will that was written and witnessed?” Whether or not a will had been probated was based upon the answer to the question “Has [her/his] will been probated?” The division of assets among those without a trust or a probated will was based upon the response to the question “The next questions are about [decedent name]'s assets and possessions, excluding any life insurance. Have they been divided up among the heirs, have they not yet been distributed, was there nothing of much value to distribute, or what?” For estates in which multiple interviews were necessary to ascertain information (a.k.a. “post-exit” interviews), the decedent was considered to have no documents only if a will or trust was never reported as existing in any interview. A funded trust was considered to have existed if it was reported in any interview. A will was considered to have been probated if any interview indicated that the will had been probated, even if this answer was changed in a later interview. The classification of “Unprobated will: other” was given only if no reason for the lack of probating the will was ever given in any interview.
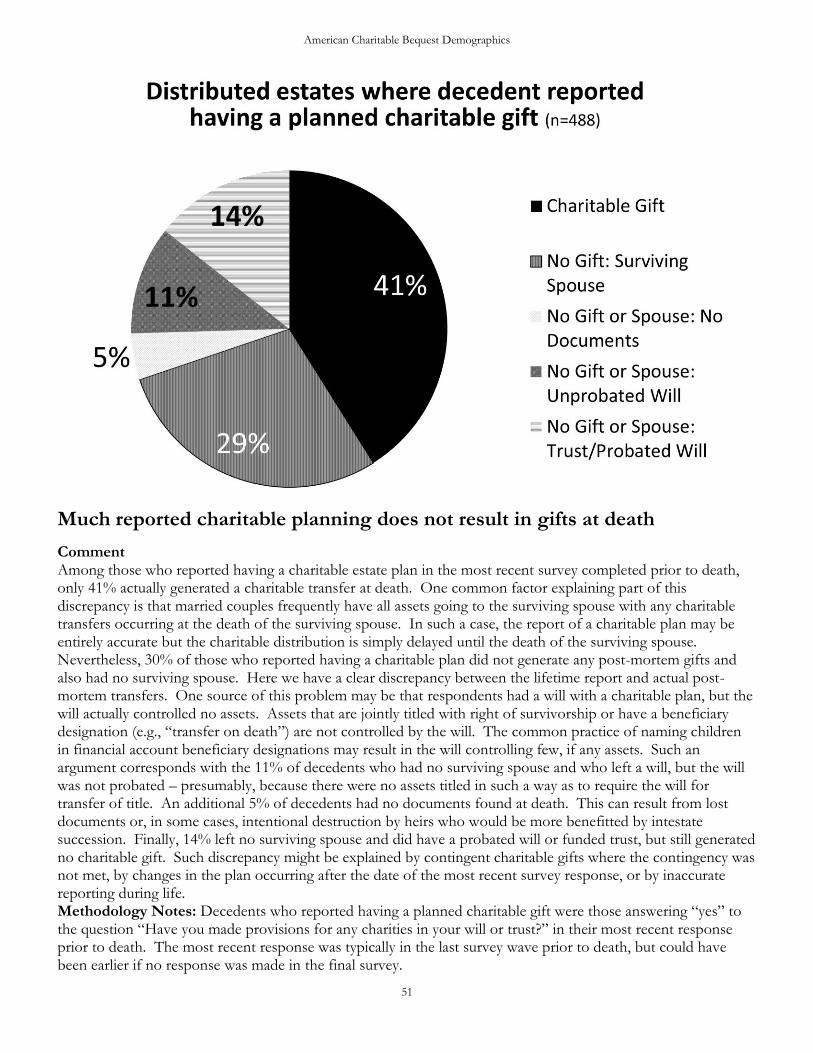
American Charitable Bequest Demographics
51
Much reported charitable planning does not result in gifts at death
Comment Among those who reported having a charitable estate plan in the most recent survey completed prior to death, only 41% actually generated a charitable transfer at death. One common factor explaining part of this discrepancy is that married couples frequently have all assets going to the surviving spouse with any charitable transfers occurring at the death of the surviving spouse. In such a case, the report of a charitable plan may be entirely accurate but the charitable distribution is simply delayed until the death of the surviving spouse. Nevertheless, 30% of those who reported having a charitable plan did not generate any post-mortem gifts and also had no surviving spouse. Here we have a clear discrepancy between the lifetime report and actual post-mortem transfers. One source of this problem may be that respondents had a will with a charitable plan, but the will actually controlled no assets. Assets that are jointly titled with right of survivorship or have a beneficiary designation (e.g., “transfer on death”) are not controlled by the will. The common practice of naming children in financial account beneficiary designations may result in the will controlling few, if any assets. Such an argument corresponds with the 11% of decedents who had no surviving spouse and who left a will, but the will was not probated – presumably, because there were no assets titled in such a way as to require the will for transfer of title. An additional 5% of decedents had no documents found at death. This can result from lost documents or, in some cases, intentional destruction by heirs who would be more benefitted by intestate succession. Finally, 14% left no surviving spouse and did have a probated will or funded trust, but still generated no charitable gift. Such discrepancy might be explained by contingent charitable gifts where the contingency was not met, by changes in the plan occurring after the date of the most recent survey response, or by inaccurate reporting during life. Methodology Notes: Decedents who reported having a planned charitable gift were those answering “yes” to the question “Have you made provisions for any charities in your will or trust?” in their most recent response prior to death. The most recent response was typically in the last survey wave prior to death, but could have been earlier if no response was made in the final survey.

Dr. Russell James
52
Increased likelihood of gift fulfillment with reported trust v. will
Comment These charts examine only those who reported a charitable estate plan in the most recent survey response prior to death and who died with no surviving spouse. In this scenario we would normally expect for the charity to receive an estate gift after the death of the respondent. But, even in this scenario a substantial share of estates do not generate any charitable transfers. Those indicating a planned charitable gift who reported having a funded trust during life were more likely to actually generate charitable transfers after death. This could be due to several factors. First, the problem of assets titled in such a way as to pass outside the planning documents is usually less of a problem with funded trusts as the funding operation requires retitling, bringing this issue to the forefront. Second, the problem of lost documents may be less of an issue with trusts. Trust documents are required for lifetime transfers of assets and thus are actually used in the regular conduct of financial affairs. Wills, in contrast, have no function prior to death and may not be revisited regularly. Nefarious document destruction may be less of an issue with trusts because, with assets actually titled in the name of a trust, destroying a trust document does not cleanly result in transfer of the assets to the closest heirs by intestate succession as it would with destruction of a will document. Finally, trusts are more commonly used by those with larger estates, which are less likely to exhaust before paying charitable beneficiaries. (For an analysis finding that wealth differences are not solely responsible for this difference in document effectiveness see: James, R. N., III. (2009). Wills, trusts, and charitable estate planning: A panel study of document effectiveness. Financial Counseling & Planning, 20(1), 3-14.) Methodology Notes These graphs consider only fully distributed estates. (Including estates that were not fully distributed might disadvantage wills as probate often takes longer than trust administration, and might lead to a mistaken conclusion where an ultimately charitable estate simply had not yet paid its charitable beneficiaries.)

American Charitable Bequest Demographics
53
Both wealth and bequest donor status associated with older age at death
Comment This chart shows the linear trend line relating estate size with median age at death. Larger estates and those containing a charitable bequest are both associated with older age of death. [Estate size is measured in deciles where the 10th decile represents those with estates in the top 10% of all estates in the sample.] As demonstrated above, these appear to be separate factors. Both of these factors push the realization of estate bequest gifts dollars to a much older decedent age than might otherwise be expected. Additionally, as more than half of all charitable bequest dollars were generated by female decedents (see other chart), this gender imbalance further pushes estate bequest gift dollars to older decedent ages. Methodology Notes This sample looks at all deaths occurring in the AHEAD since 1993 and HRS since 1996. Because the AHEAD sample was much older, these numbers should not be taken as representative of the over 55 typical age at death, as the sample was overweighted in the older ages for deaths occurring prior to the 1998 HRS wave when the survey began to be representative of entire 55+ population. The estate size deciles were based upon the total number of estates from deceased survey respondents, and do not necessarily reflect national estate size decile divisions. The lines represent the simple linear trend lines from the median age at death within each estate decile for all estates or only those estates including a charitable bequest gift. The underlying data points are not plotted here to avoid cluttering the graph, and also, given the relatively small sample within some charitable bequest estate deciles, the individual decile medians vary widely. Note that the deciles used were based upon the total number of estates from all respondents and were not recalculated separately for the charitable bequest estates or for each gender. As a result either fewer or more than ten percent of all charitable bequest observations may be found in each wealth decile for a particular gender or donor group.
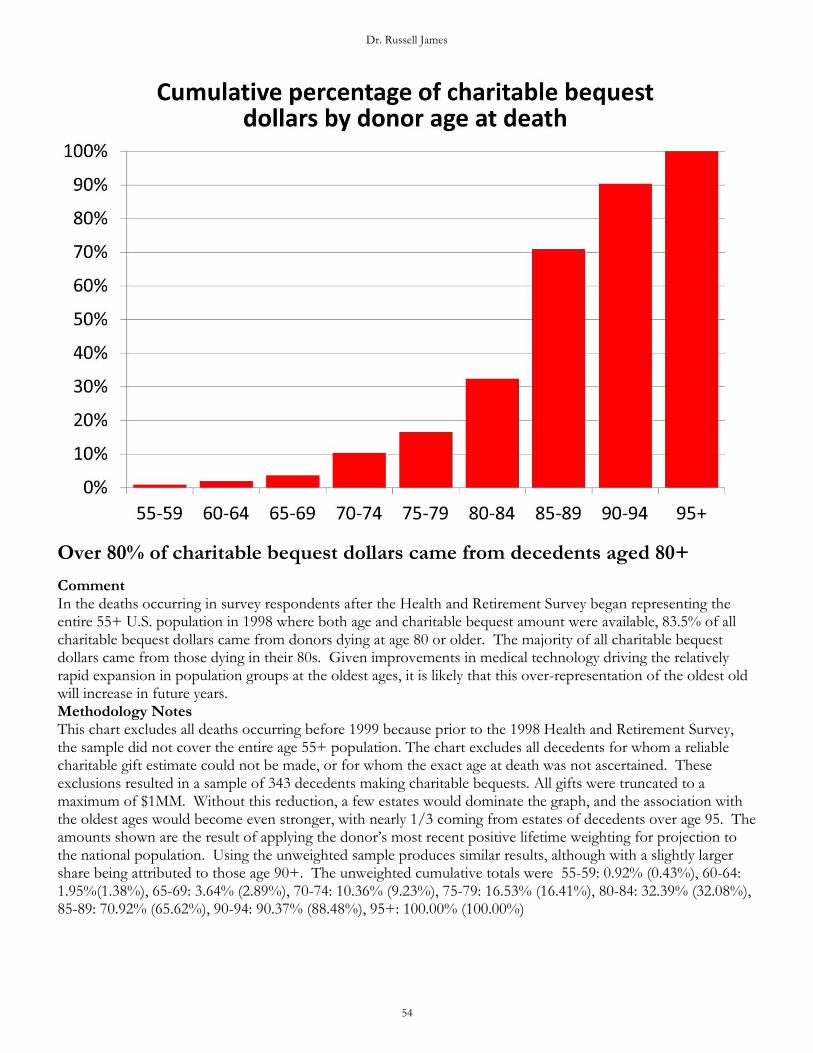
Dr. Russell James
54
Over 80% of charitable bequest dollars came from decedents aged 80+
Comment In the deaths occurring in survey respondents after the Health and Retirement Survey began representing the entire 55+ U.S. population in 1998 where both age and charitable bequest amount were available, 83.5% of all charitable bequest dollars came from donors dying at age 80 or older. The majority of all charitable bequest dollars came from those dying in their 80s. Given improvements in medical technology driving the relatively rapid expansion in population groups at the oldest ages, it is likely that this over-representation of the oldest old will increase in future years. Methodology Notes This chart excludes all deaths occurring before 1999 because prior to the 1998 Health and Retirement Survey, the sample did not cover the entire age 55+ population. The chart excludes all decedents for whom a reliable charitable gift estimate could not be made, or for whom the exact age at death was not ascertained. These exclusions resulted in a sample of 343 decedents making charitable bequests. All gifts were truncated to a maximum of $1MM. Without this reduction, a few estates would dominate the graph, and the association with the oldest ages would become even stronger, with nearly 1/3 coming from estates of decedents over age 95. The amounts shown are the result of applying the donor’s most recent positive lifetime weighting for projection to the national population. Using the unweighted sample produces similar results, although with a slightly larger share being attributed to those age 90+. The unweighted cumulative totals were 55-59: 0.92% (0.43%), 60-64: 1.95%(1.38%), 65-69: 3.64% (2.89%), 70-74: 10.36% (9.23%), 75-79: 16.53% (16.41%), 80-84: 32.39% (32.08%), 85-89: 70.92% (65.62%), 90-94: 90.37% (88.48%), 95+: 100.00% (100.00%)
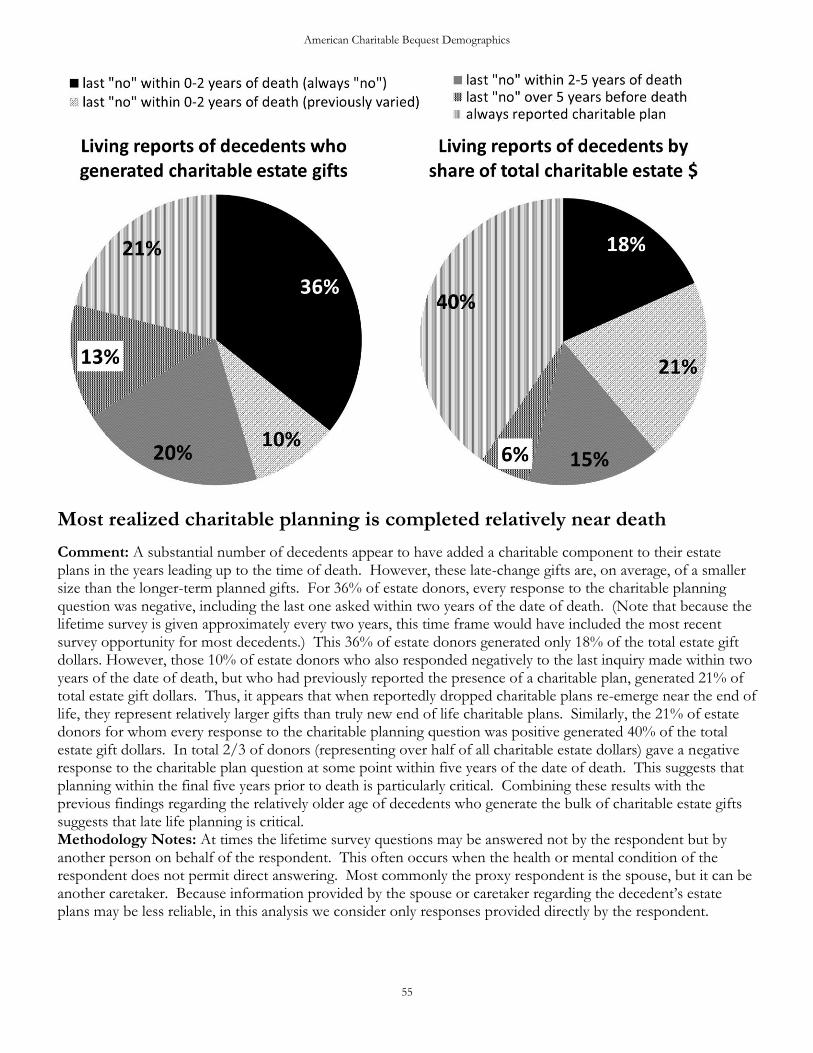
American Charitable Bequest Demographics
55
Most realized charitable planning is completed relatively near death
Comment: A substantial number of decedents appear to have added a charitable component to their estate plans in the years leading up to the time of death. However, these late-change gifts are, on average, of a smaller size than the longer-term planned gifts. For 36% of estate donors, every response to the charitable planning question was negative, including the last one asked within two years of the date of death. (Note that because the lifetime survey is given approximately every two years, this time frame would have included the most recent survey opportunity for most decedents.) This 36% of estate donors generated only 18% of the total estate gift dollars. However, those 10% of estate donors who also responded negatively to the last inquiry made within two years of the date of death, but who had previously reported the presence of a charitable plan, generated 21% of total estate gift dollars. Thus, it appears that when reportedly dropped charitable plans re-emerge near the end of life, they represent relatively larger gifts than truly new end of life charitable plans. Similarly, the 21% of estate donors for whom every response to the charitable planning question was positive generated 40% of the total estate gift dollars. In total 2/3 of donors (representing over half of all charitable estate dollars) gave a negative response to the charitable plan question at some point within five years of the date of death. This suggests that planning within the final five years prior to death is particularly critical. Combining these results with the previous findings regarding the relatively older age of decedents who generate the bulk of charitable estate gifts suggests that late life planning is critical. Methodology Notes: At times the lifetime survey questions may be answered not by the respondent but by another person on behalf of the respondent. This often occurs when the health or mental condition of the respondent does not permit direct answering. Most commonly the proxy respondent is the spouse, but it can be another caretaker. Because information provided by the spouse or caretaker regarding the decedent’s estate plans may be less reliable, in this analysis we consider only responses provided directly by the respondent.
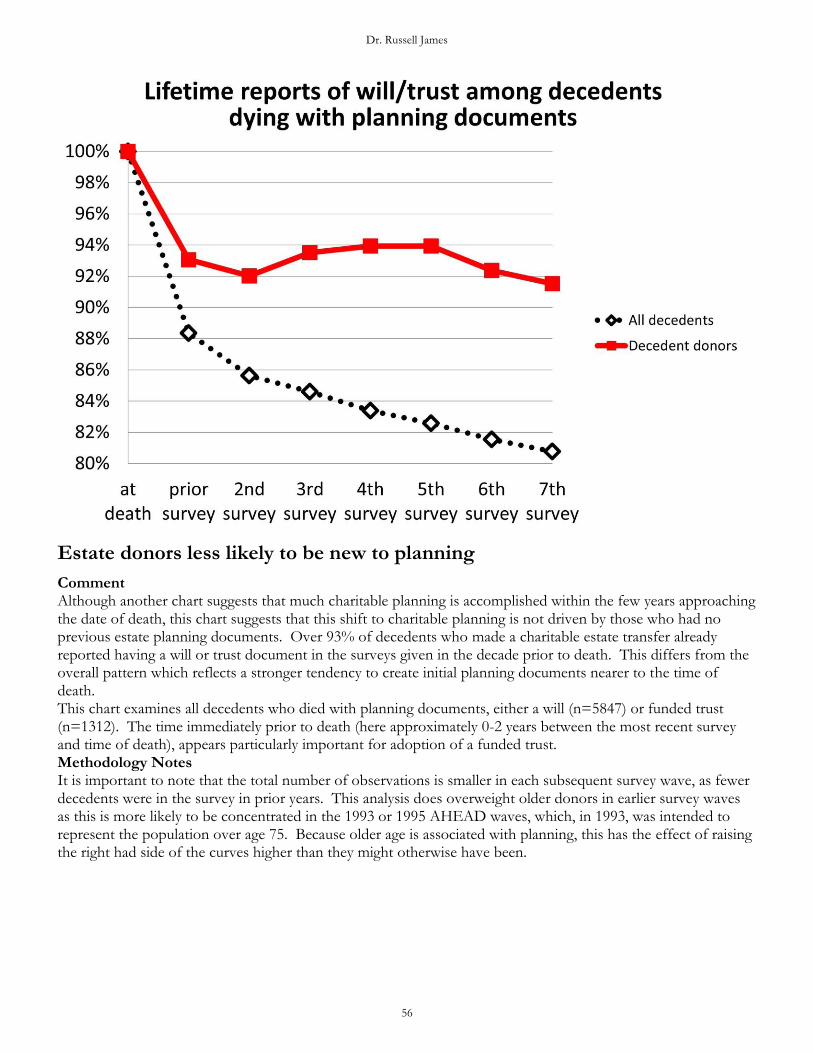
Dr. Russell James
56
Estate donors less likely to be new to planning
Comment Although another chart suggests that much charitable planning is accomplished within the few years approaching the date of death, this chart suggests that this shift to charitable planning is not driven by those who had no previous estate planning documents. Over 93% of decedents who made a charitable estate transfer already reported having a will or trust document in the surveys given in the decade prior to death. This differs from the overall pattern which reflects a stronger tendency to create initial planning documents nearer to the time of death. This chart examines all decedents who died with planning documents, either a will (n=5847) or funded trust (n=1312). The time immediately prior to death (here approximately 0-2 years between the most recent survey and time of death), appears particularly important for adoption of a funded trust. Methodology Notes It is important to note that the total number of observations is smaller in each subsequent survey wave, as fewer decedents were in the survey in prior years. This analysis does overweight older donors in earlier survey waves as this is more likely to be concentrated in the 1993 or 1995 AHEAD waves, which, in 1993, was intended to represent the population over age 75. Because older age is associated with planning, this has the effect of raising the right had side of the curves higher than they might otherwise have been.

American Charitable Bequest Demographics
57
Charitable bequests by gender and marital status
Unmarried have less wealth but generate more charitable bequests
Comment Respondents dying with a surviving spouse represented 58% of the total estate wealth transferred, but only 29% of charitable bequests dollars transferred. Married male decedents controlled the largest amount of total estate wealth (40%), but left only 19% of all charitable bequest dollars. Married female decedents controlled 18% of total estate wealth, but left only 10% of all charitable bequest dollars. This corresponds with the common practice of leaving all assets to the surviving spouse. Two-thirds of all bequests by number and 71% by dollar amount came from those with no surviving spouse. Unmarried females generated almost half of all charitable bequests by number. But, largely due to the lower estate sizes of unmarried females, these bequests represented only 36% of total bequest dollar transferred to charity. In contrast to married male decedents, unmarried male decedents generated charitable bequests more than double their share of total estate wealth. Among those with no surviving spouse, women were more likely than men to leave a charitable bequest (6.7% v. 5.2%), but men left larger gifts ($113,389 v. $41,504). Methodology Notes These statistics are based upon all respondents dying during the HRS or AHEAD surveys captured in the exit or post-exit interviews. As before, charitable bequest gift amounts were artificially capped at $1MM. One large gift of $62MM+ in the unmarried male category would have otherwise dominated the analysis.
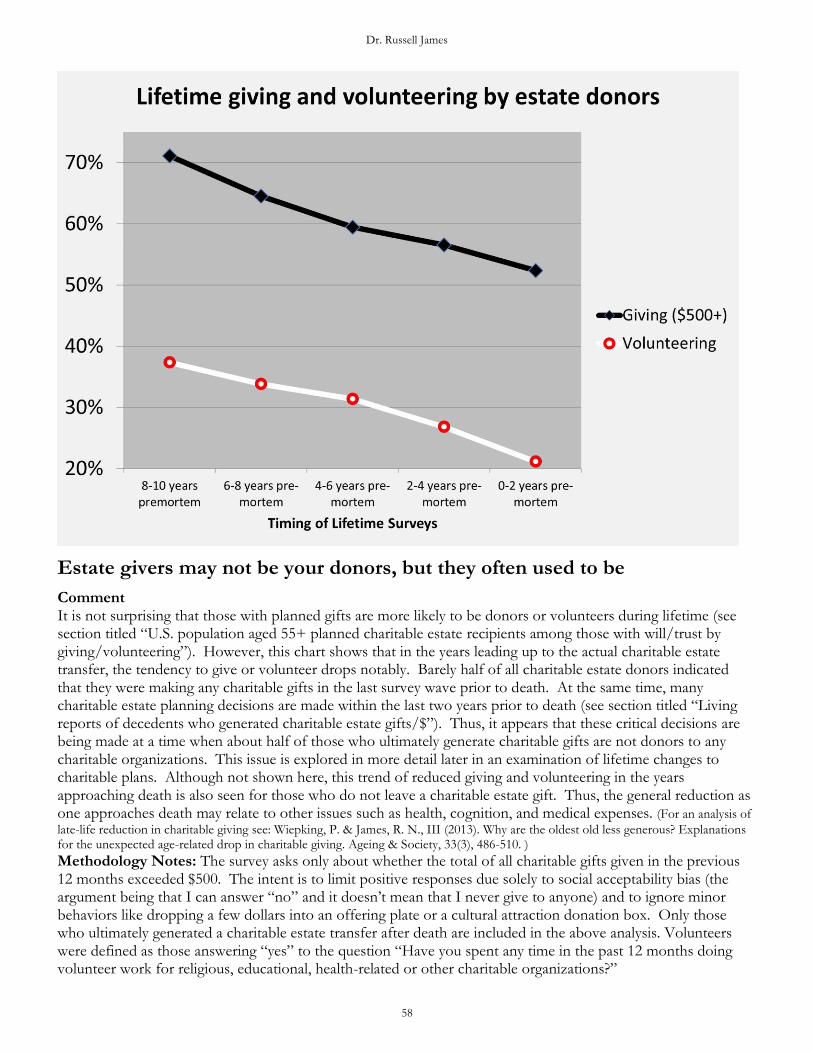
Dr. Russell James
58
Estate givers may not be your donors, but they often used to be
Comment It is not surprising that those with planned gifts are more likely to be donors or volunteers during lifetime (see section titled “U.S. population aged 55+ planned charitable estate recipients among those with will/trust by giving/volunteering”). However, this chart shows that in the years leading up to the actual charitable estate transfer, the tendency to give or volunteer drops notably. Barely half of all charitable estate donors indicated that they were making any charitable gifts in the last survey wave prior to death. At the same time, many charitable estate planning decisions are made within the last two years prior to death (see section titled “Living reports of decedents who generated charitable estate gifts/$”). Thus, it appears that these critical decisions are being made at a time when about half of those who ultimately generate charitable gifts are not donors to any charitable organizations. This issue is explored in more detail later in an examination of lifetime changes to charitable plans. Although not shown here, this trend of reduced giving and volunteering in the years approaching death is also seen for those who do not leave a charitable estate gift. Thus, the general reduction as one approaches death may relate to other issues such as health, cognition, and medical expenses. (For an analysis of
late-life reduction in charitable giving see: Wiepking, P. & James, R. N., III (2013). Why are the oldest old less generous? Explanations for the unexpected age-related drop in charitable giving. Ageing & Society, 33(3), 486-510. )
Methodology Notes: The survey asks only about whether the total of all charitable gifts given in the previous 12 months exceeded $500. The intent is to limit positive responses due solely to social acceptability bias (the argument being that I can answer “no” and it doesn’t mean that I never give to anyone) and to ignore minor behaviors like dropping a few dollars into an offering plate or a cultural attraction donation box. Only those who ultimately generated a charitable estate transfer after death are included in the above analysis. Volunteers were defined as those answering “yes” to the question “Have you spent any time in the past 12 months doing volunteer work for religious, educational, health-related or other charitable organizations?”
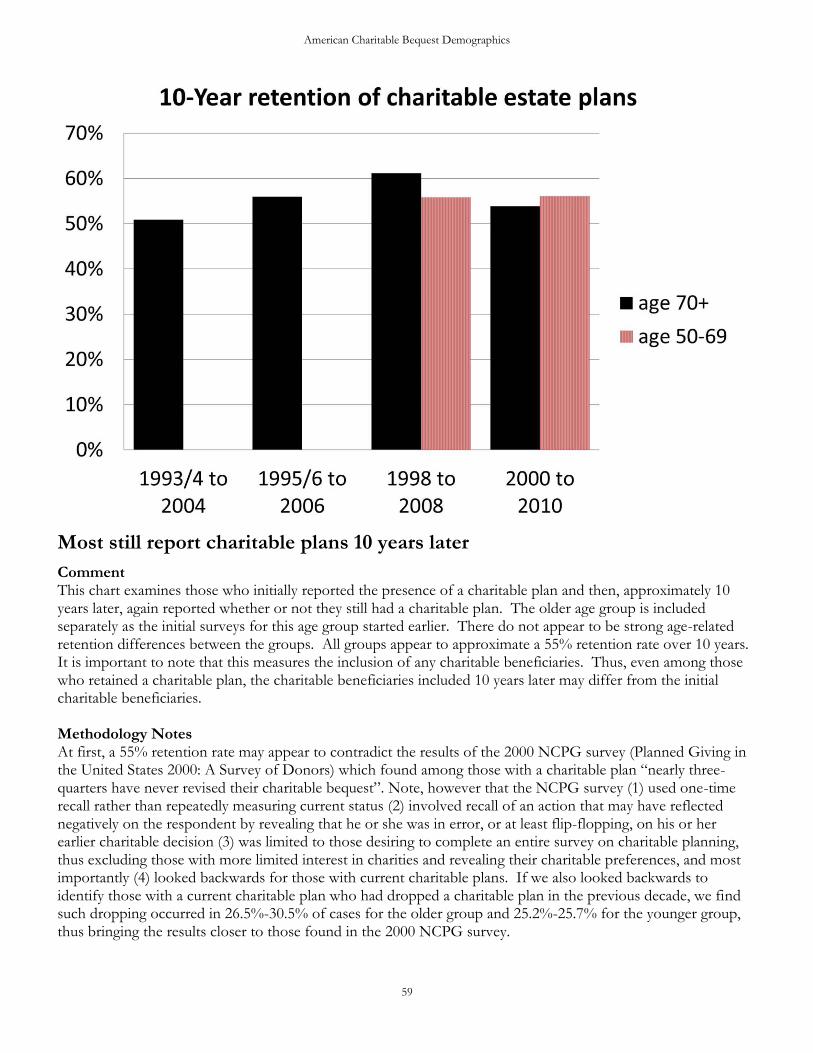
American Charitable Bequest Demographics
59
Most still report charitable plans 10 years later
Comment This chart examines those who initially reported the presence of a charitable plan and then, approximately 10 years later, again reported whether or not they still had a charitable plan. The older age group is included separately as the initial surveys for this age group started earlier. There do not appear to be strong age-related retention differences between the groups. All groups appear to approximate a 55% retention rate over 10 years. It is important to note that this measures the inclusion of any charitable beneficiaries. Thus, even among those who retained a charitable plan, the charitable beneficiaries included 10 years later may differ from the initial charitable beneficiaries.
Methodology Notes At first, a 55% retention rate may appear to contradict the results of the 2000 NCPG survey (Planned Giving in the United States 2000: A Survey of Donors) which found among those with a charitable plan “nearly three-quarters have never revised their charitable bequest”. Note, however that the NCPG survey (1) used one-time recall rather than repeatedly measuring current status (2) involved recall of an action that may have reflected negatively on the respondent by revealing that he or she was in error, or at least flip-flopping, on his or her earlier charitable decision (3) was limited to those desiring to complete an entire survey on charitable planning, thus excluding those with more limited interest in charities and revealing their charitable preferences, and most importantly (4) looked backwards for those with current charitable plans. If we also looked backwards to identify those with a current charitable plan who had dropped a charitable plan in the previous decade, we find such dropping occurred in 26.5%-30.5% of cases for the older group and 25.2%-25.7% for the younger group, thus bringing the results closer to those found in the 2000 NCPG survey.

Dr. Russell James
60
Looking backwards among those who have a current charitable plan may be required for a cross-sectional survey, but it answers a question different than the one answered here. The backward looking question is similar to trying to estimate the likelihood that a new marriage will end in divorce by examining the number of married people who have previously been divorced. The two questions are different. For example, if every marriage ended in divorce and no divorced person ever remarried, then the percentage of married people who had previously been divorced would be 0% and the likelihood that a new marriage would end in divorce would be 100%. A similar effect is at work here. In order for a person with a current charitable plan to report that he or she had dropped a charitable plan in the past requires an initial addition, then a drop, then another addition or retention of a charitable beneficiary. This backwards looking question simply a different than estimating the likelihood that a new charitable plan will stay in place until maturation of the gift.
Note also, that estate planning changes are most common with changes in family structure (such as birth of a new grandchild or widowhood) or with new mortality reminders (such as diagnosis with serious illness). Both of these may be more likely during the older ages surveyed here as compared with the relatively stability of younger age groups such as those in their 40s. Thus, comparable surveys that include these younger respondents may show more stability in retention of plans over the same period of time, due to age differences.
There is, of course, a risk that these changes over time reflect “errors” in the respondents recall of his or her estate plans. In other words, the document may not have changed, but only the response to the question changed. One concern is that these type of errors may especially common among the oldest population groups due to increased risk of cognitive impairment. However, the above results show similar retention rates for the younger group (50-69) and the older group (70+) suggesting that age-related cognitive impairment is not driving these results. Further, recall errors seem less likely in this longitudinal setting where the respondents are consistently asked this same question survey wave after survey wave, as compared with a one-time cross-sectional survey where the question, and hence the recall task, is novel.
The averages in the chart are based upon only those who responded to both the charitable planning question initially and 10-years later. It thus excludes any who were not surveyed, responded with “don’t know”, or refused to respond to either the initial or ending question. Thus, inclusion in the analysis requires an affirmative response to both the initial and ending question. (If, however, the ending question response was that respondent had no estate planning documents – no will or trust – then this is taken as a negative response to the question as to whether or not those documents named a charitable beneficiary.) The 1993 AHEAD survey was taken in calendar years 1993 and 1994 with a slight majority of surveys being gathered in 1994. The 1995 AHEAD survey was taken in calendar years 1995 and 1996 with a slight majority of survey being gathered in 1995. The later surveys were taken in the calendar year noted. Thus, the first two bars represent slightly longer time periods, on average, than the second two. The results with no age restrictions were 185 (1993/4-2004) retention of 51.3% and initial age mean 77.14 range 38-98; 151 (1995/6-2006) retention of 53.0% and initial age mean 78.70 range 40-96; 599 (1998-2008) retention of 57.1% and initial age mean 69.29 range 43-99; 601 (2000-2010) retention of 55.4% and initial age mean 69.7 range 37-101

American Charitable Bequest Demographics
61
Comment This chart lists the relative importance of statistically significant variables in predicting the presence of an actual charitable estate transfer after death. This analysis examines each variable by itself, i.e., assuming that nothing else is known about the person. Because of this, these percentages cannot be combined. For example, once you know the average giving level and highest giving level, the lowest giving level isn’t that important anymore. The top 10 factors included lifetime giving, presence of trust, childlessness, presence of will, and wealth. Methodology Notes: The 32 items above are statistically significant (p<.05) predictors of post-mortem charitable transfers ranked by relative R2 value using individual linear probability models with no other regressors. Race variables were also significant, due in part to association with wealth. The following variables were not statistically significant: High school education v. all other levels, linear trend in charitable giving amounts reported, whether or not the death was expected, the number of days between the start of the last illness and death, whether or not the cause of death was cancer, the linear trend in the number of volunteer hours reported, whether or not the person was ever diagnosed with cancer.
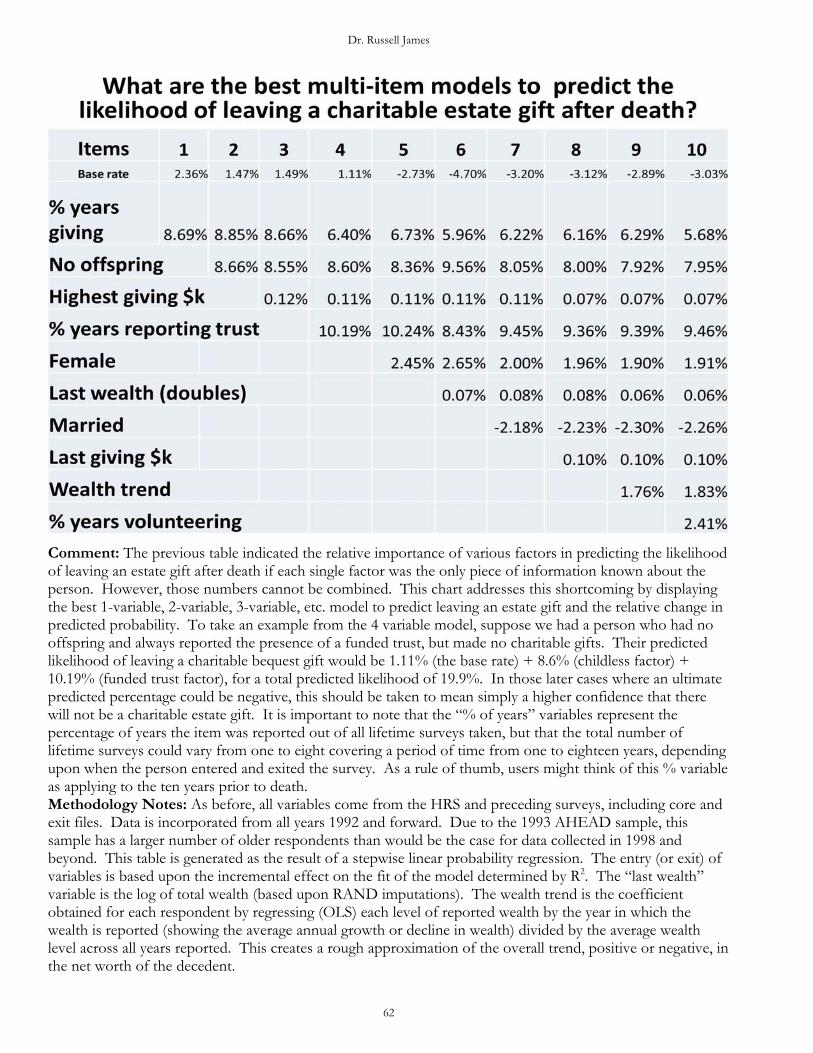
Dr. Russell James
62
Comment: The previous table indicated the relative importance of various factors in predicting the likelihood of leaving an estate gift after death if each single factor was the only piece of information known about the person. However, those numbers cannot be combined. This chart addresses this shortcoming by displaying the best 1-variable, 2-variable, 3-variable, etc. model to predict leaving an estate gift and the relative change in predicted probability. To take an example from the 4 variable model, suppose we had a person who had no offspring and always reported the presence of a funded trust, but made no charitable gifts. Their predicted likelihood of leaving a charitable bequest gift would be 1.11% (the base rate) + 8.6% (childless factor) + 10.19% (funded trust factor), for a total predicted likelihood of 19.9%. In those later cases where an ultimate predicted percentage could be negative, this should be taken to mean simply a higher confidence that there will not be a charitable estate gift. It is important to note that the “% of years” variables represent the percentage of years the item was reported out of all lifetime surveys taken, but that the total number of lifetime surveys could vary from one to eight covering a period of time from one to eighteen years, depending upon when the person entered and exited the survey. As a rule of thumb, users might think of this % variable as applying to the ten years prior to death. Methodology Notes: As before, all variables come from the HRS and preceding surveys, including core and exit files. Data is incorporated from all years 1992 and forward. Due to the 1993 AHEAD sample, this sample has a larger number of older respondents than would be the case for data collected in 1998 and beyond. This table is generated as the result of a stepwise linear probability regression. The entry (or exit) of variables is based upon the incremental effect on the fit of the model determined by R2. The “last wealth” variable is the log of total wealth (based upon RAND imputations). The wealth trend is the coefficient obtained for each respondent by regressing (OLS) each level of reported wealth by the year in which the wealth is reported (showing the average annual growth or decline in wealth) divided by the average wealth level across all years reported. This creates a rough approximation of the overall trend, positive or negative, in the net worth of the decedent.
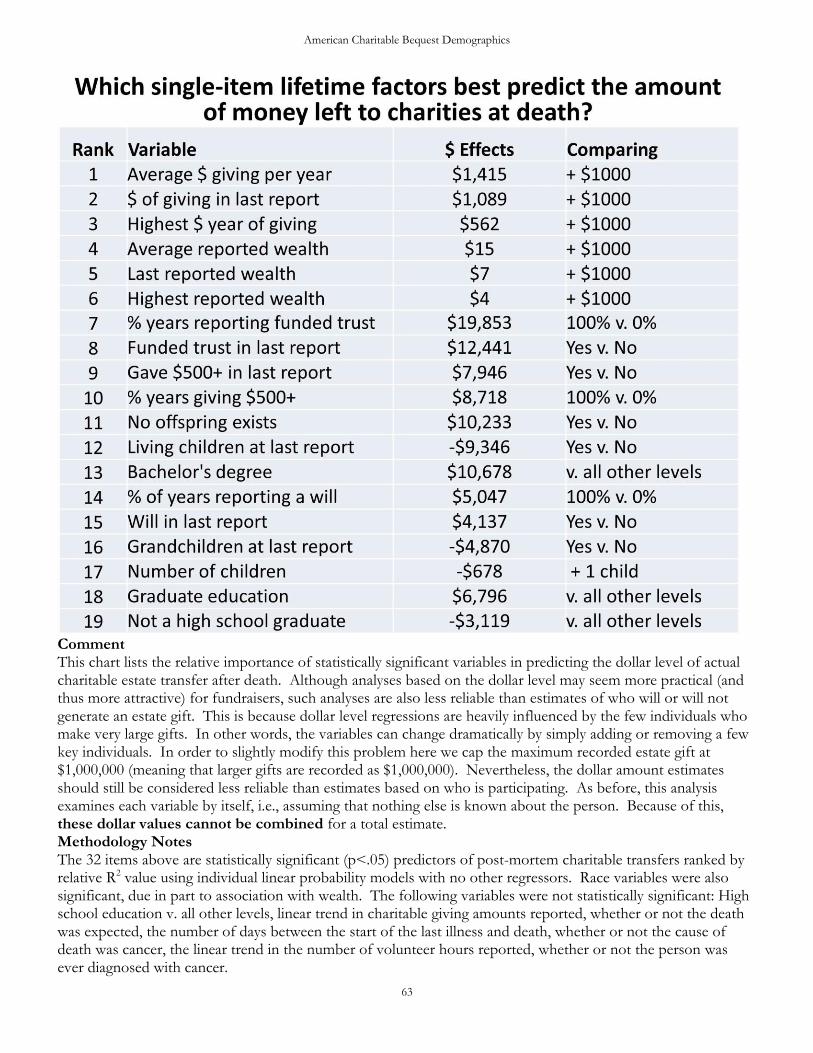
American Charitable Bequest Demographics
63
Comment This chart lists the relative importance of statistically significant variables in predicting the dollar level of actual charitable estate transfer after death. Although analyses based on the dollar level may seem more practical (and thus more attractive) for fundraisers, such analyses are also less reliable than estimates of who will or will not generate an estate gift. This is because dollar level regressions are heavily influenced by the few individuals who make very large gifts. In other words, the variables can change dramatically by simply adding or removing a few key individuals. In order to slightly modify this problem here we cap the maximum recorded estate gift at $1,000,000 (meaning that larger gifts are recorded as $1,000,000). Nevertheless, the dollar amount estimates should still be considered less reliable than estimates based on who is participating. As before, this analysis examines each variable by itself, i.e., assuming that nothing else is known about the person. Because of this, these dollar values cannot be combined for a total estimate. Methodology Notes The 32 items above are statistically significant (p<.05) predictors of post-mortem charitable transfers ranked by relative R2 value using individual linear probability models with no other regressors. Race variables were also significant, due in part to association with wealth. The following variables were not statistically significant: High school education v. all other levels, linear trend in charitable giving amounts reported, whether or not the death was expected, the number of days between the start of the last illness and death, whether or not the cause of death was cancer, the linear trend in the number of volunteer hours reported, whether or not the person was ever diagnosed with cancer.
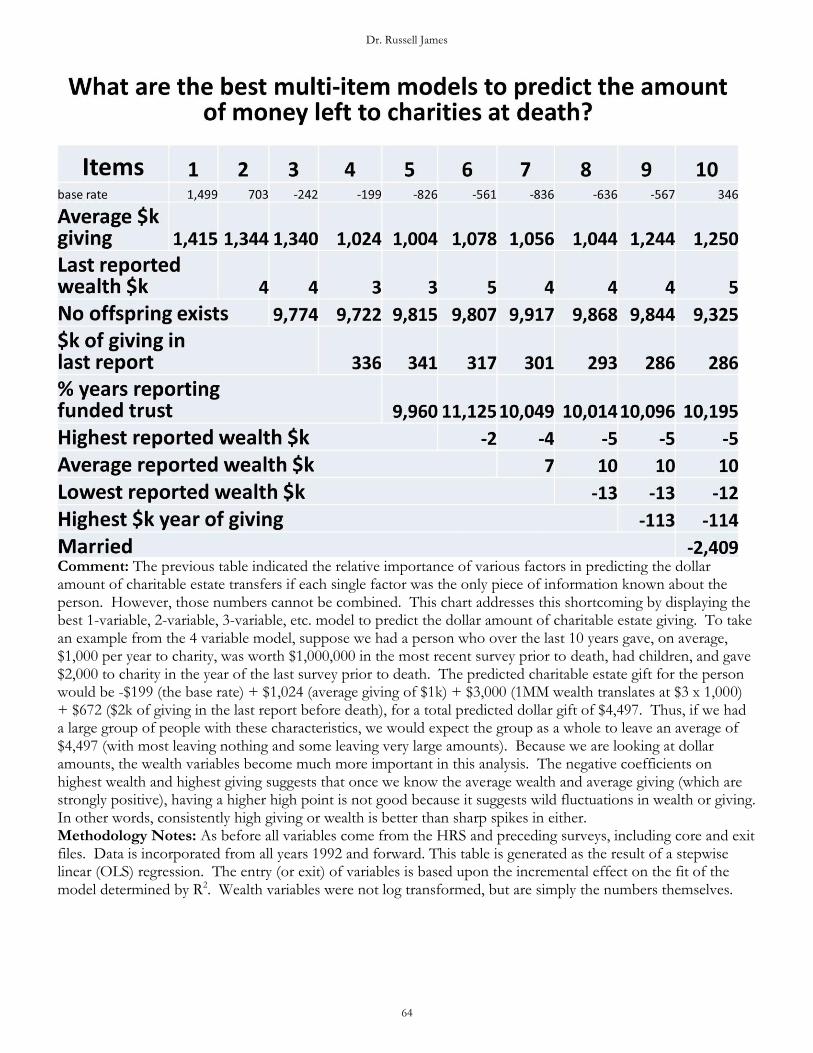
Dr. Russell James
64
Comment: The previous table indicated the relative importance of various factors in predicting the dollar amount of charitable estate transfers if each single factor was the only piece of information known about the person. However, those numbers cannot be combined. This chart addresses this shortcoming by displaying the best 1-variable, 2-variable, 3-variable, etc. model to predict the dollar amount of charitable estate giving. To take an example from the 4 variable model, suppose we had a person who over the last 10 years gave, on average, $1,000 per year to charity, was worth $1,000,000 in the most recent survey prior to death, had children, and gave $2,000 to charity in the year of the last survey prior to death. The predicted charitable estate gift for the person would be -$199 (the base rate) + $1,024 (average giving of $1k) + $3,000 (1MM wealth translates at $3 x 1,000) + $672 ($2k of giving in the last report before death), for a total predicted dollar gift of $4,497. Thus, if we had a large group of people with these characteristics, we would expect the group as a whole to leave an average of $4,497 (with most leaving nothing and some leaving very large amounts). Because we are looking at dollar amounts, the wealth variables become much more important in this analysis. The negative coefficients on highest wealth and highest giving suggests that once we know the average wealth and average giving (which are strongly positive), having a higher high point is not good because it suggests wild fluctuations in wealth or giving. In other words, consistently high giving or wealth is better than sharp spikes in either. Methodology Notes: As before all variables come from the HRS and preceding surveys, including core and exit files. Data is incorporated from all years 1992 and forward. This table is generated as the result of a stepwise linear (OLS) regression. The entry (or exit) of variables is based upon the incremental effect on the fit of the model determined by R2. Wealth variables were not log transformed, but are simply the numbers themselves.
American Charitable Bequest Demographics
65

Dr. Russell James
66
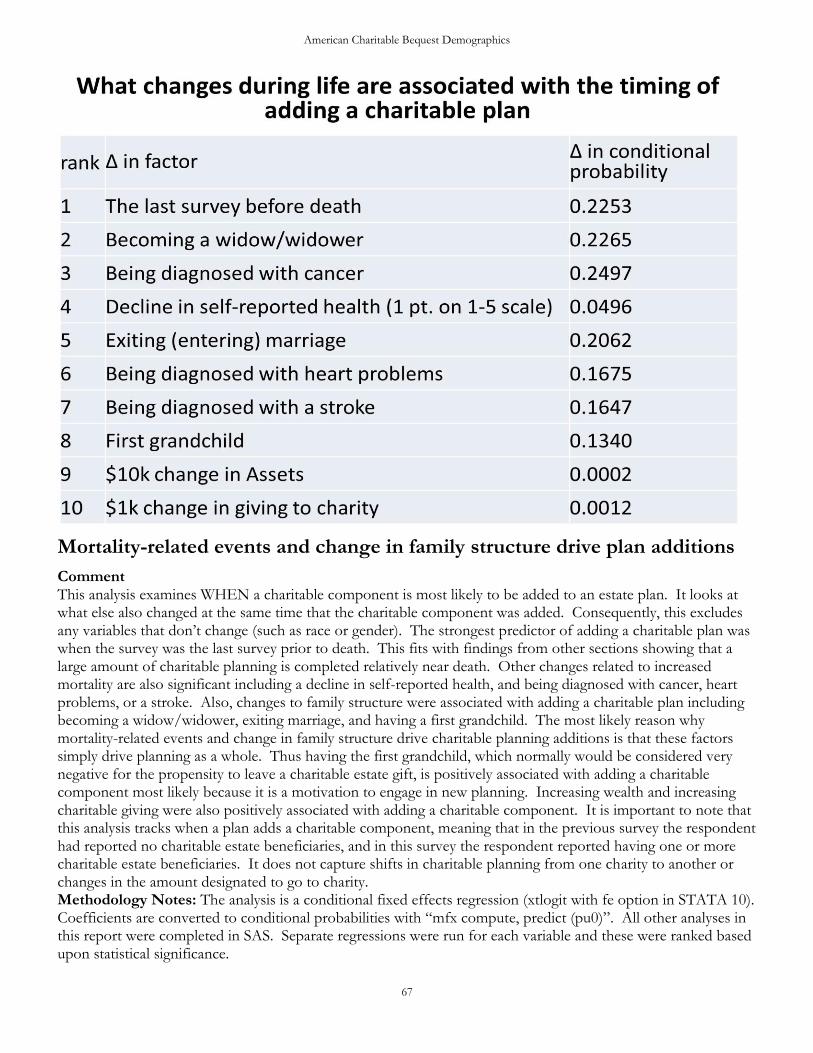
American Charitable Bequest Demographics
67
Mortality-related events and change in family structure drive plan additions
Comment This analysis examines WHEN a charitable component is most likely to be added to an estate plan. It looks at what else also changed at the same time that the charitable component was added. Consequently, this excludes any variables that don’t change (such as race or gender). The strongest predictor of adding a charitable plan was when the survey was the last survey prior to death. This fits with findings from other sections showing that a large amount of charitable planning is completed relatively near death. Other changes related to increased mortality are also significant including a decline in self-reported health, and being diagnosed with cancer, heart problems, or a stroke. Also, changes to family structure were associated with adding a charitable plan including becoming a widow/widower, exiting marriage, and having a first grandchild. The most likely reason why mortality-related events and change in family structure drive charitable planning additions is that these factors simply drive planning as a whole. Thus having the first grandchild, which normally would be considered very negative for the propensity to leave a charitable estate gift, is positively associated with adding a charitable component most likely because it is a motivation to engage in new planning. Increasing wealth and increasing charitable giving were also positively associated with adding a charitable component. It is important to note that this analysis tracks when a plan adds a charitable component, meaning that in the previous survey the respondent had reported no charitable estate beneficiaries, and in this survey the respondent reported having one or more charitable estate beneficiaries. It does not capture shifts in charitable planning from one charity to another or changes in the amount designated to go to charity. Methodology Notes: The analysis is a conditional fixed effects regression (xtlogit with fe option in STATA 10). Coefficients are converted to conditional probabilities with “mfx compute, predict (pu0)”. All other analyses in this report were completed in SAS. Separate regressions were run for each variable and these were ranked based upon statistical significance.

Dr. Russell James
68
Mortality-related events and change in family structure drive plan deletions
Comment: Many of the same factors that predicted an increased likelihood of adding a charitable component also predict an increased likelihood of dropping a charitable component. Again, the common issue is that these factors trigger planning. These times of planning are when all changes are made (both additions and deletions). It is important to note that we are tracking here those who completely remove all charitable components to their plan (i.e., in the previous survey they had reported having a charitable component and in the current survey report that they do not have any charitable beneficiaries). This analysis does not capture charitable deletions that represent switching from one charity to the next. Once again, mortality related events trigger planning, including the dropping of all charitable beneficiaries. These important mortality related events include decline in self-reported health, the survey being the last one prior to death, and being diagnosed with cancer, heart problems, or a stroke. Changes in family structure were also important, including becoming a widow/widower, exiting marriage, and having a first child or grandchild. Other statistically significant factors included stopping volunteering and stopping giving. This may reflect individual who simply reject charitable causes altogether and cease all forms of support. Conversely, starting giving or volunteering would reduce the likelihood that a preexisting charitable plan would have been dropped. The final significant variable was exiting homeownership, i.e., switching from owning to renting or living with a family member. It is possible that this may also be a mortality related variable to the extent that leaving homeownership was associated with projecting permanent residence in a nursing home or other medically assisted rental arrangement. Methodology Notes: The analysis is a conditional fixed effects regression (xtlogit with fe option in STATA 10). Coefficients are converted to conditional probabilities with “mfx compute, predict (pu0)”. All other analyses in this report were completed in SAS. Separate regressions were run for each variable and these were ranked based upon statistical significance. The drop variable was 1 in any survey wave in which the respondent reported having no charitable plan following a survey wave in which the respondent reported having had a charitable plan, and was otherwise 0.
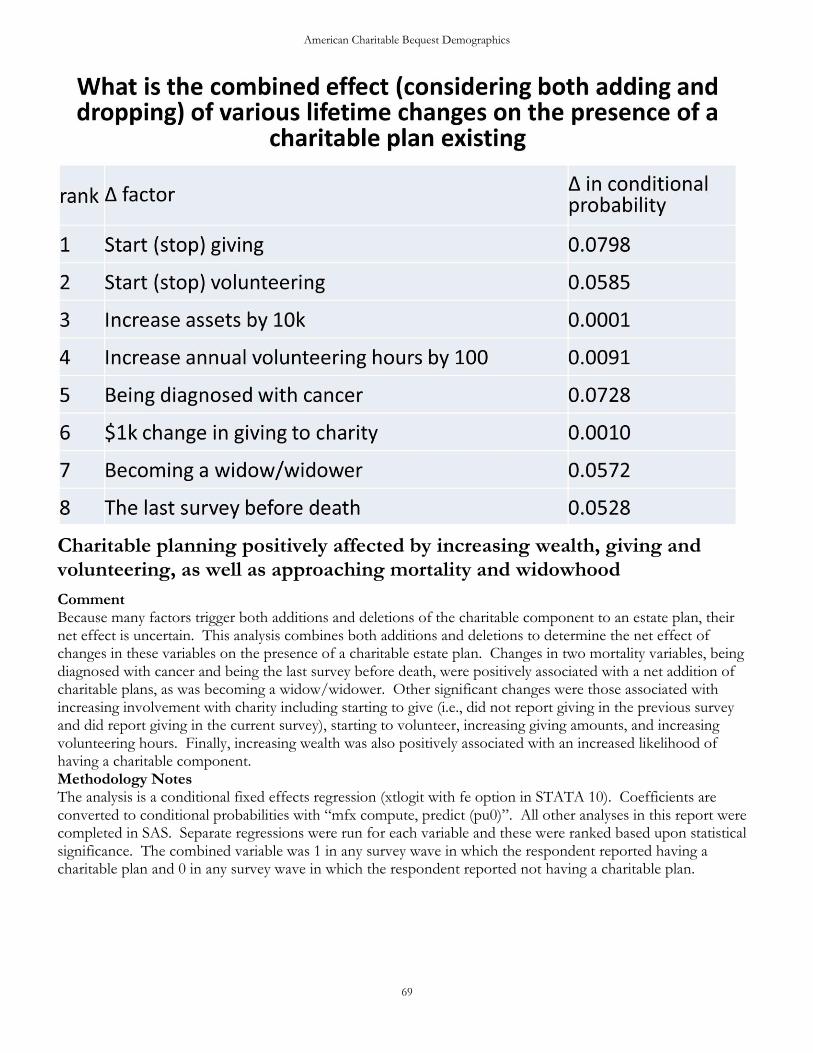
American Charitable Bequest Demographics
69
Charitable planning positively affected by increasing wealth, giving and volunteering, as well as approaching mortality and widowhood
Comment Because many factors trigger both additions and deletions of the charitable component to an estate plan, their net effect is uncertain. This analysis combines both additions and deletions to determine the net effect of changes in these variables on the presence of a charitable estate plan. Changes in two mortality variables, being diagnosed with cancer and being the last survey before death, were positively associated with a net addition of charitable plans, as was becoming a widow/widower. Other significant changes were those associated with increasing involvement with charity including starting to give (i.e., did not report giving in the previous survey and did report giving in the current survey), starting to volunteer, increasing giving amounts, and increasing volunteering hours. Finally, increasing wealth was also positively associated with an increased likelihood of having a charitable component. Methodology Notes The analysis is a conditional fixed effects regression (xtlogit with fe option in STATA 10). Coefficients are converted to conditional probabilities with “mfx compute, predict (pu0)”. All other analyses in this report were completed in SAS. Separate regressions were run for each variable and these were ranked based upon statistical significance. The combined variable was 1 in any survey wave in which the respondent reported having a charitable plan and 0 in any survey wave in which the respondent reported not having a charitable plan.

Dr. Russell James
70

American Charitable Bequest Demographics
71

Dr. Russell James
72
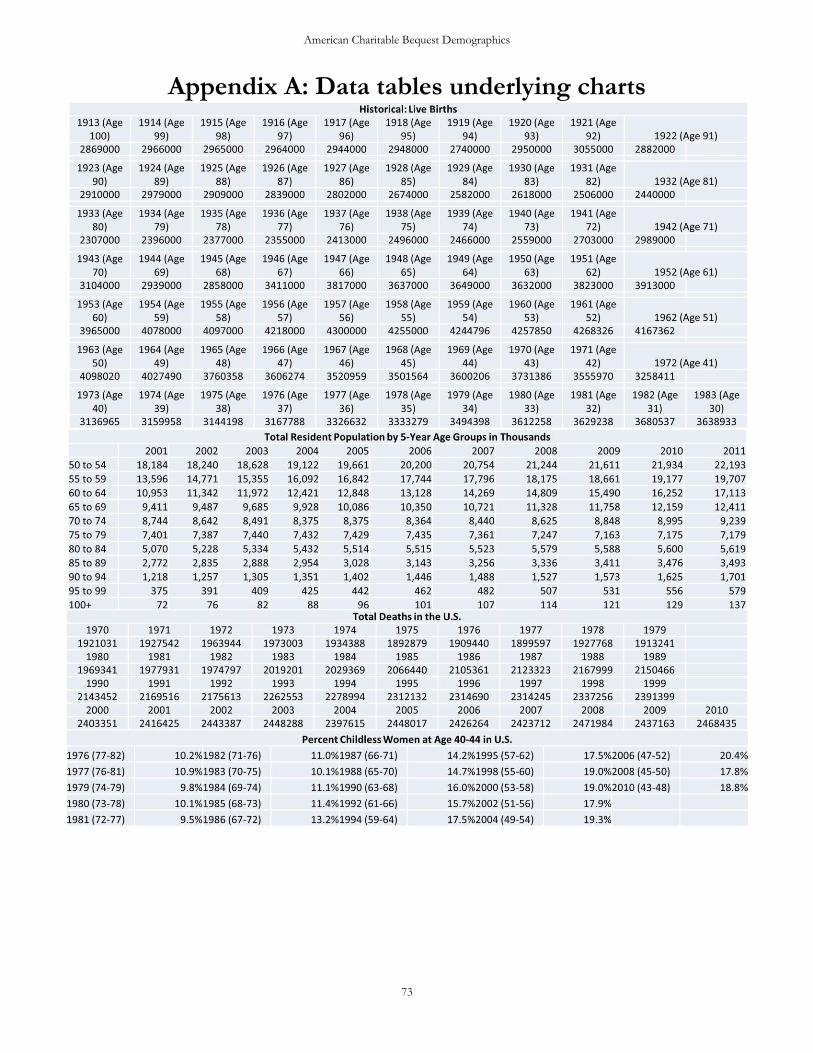
American Charitable Bequest Demographics
73
Appendix A: Data tables underlying charts

Dr. Russell James
74

American Charitable Bequest Demographics
75
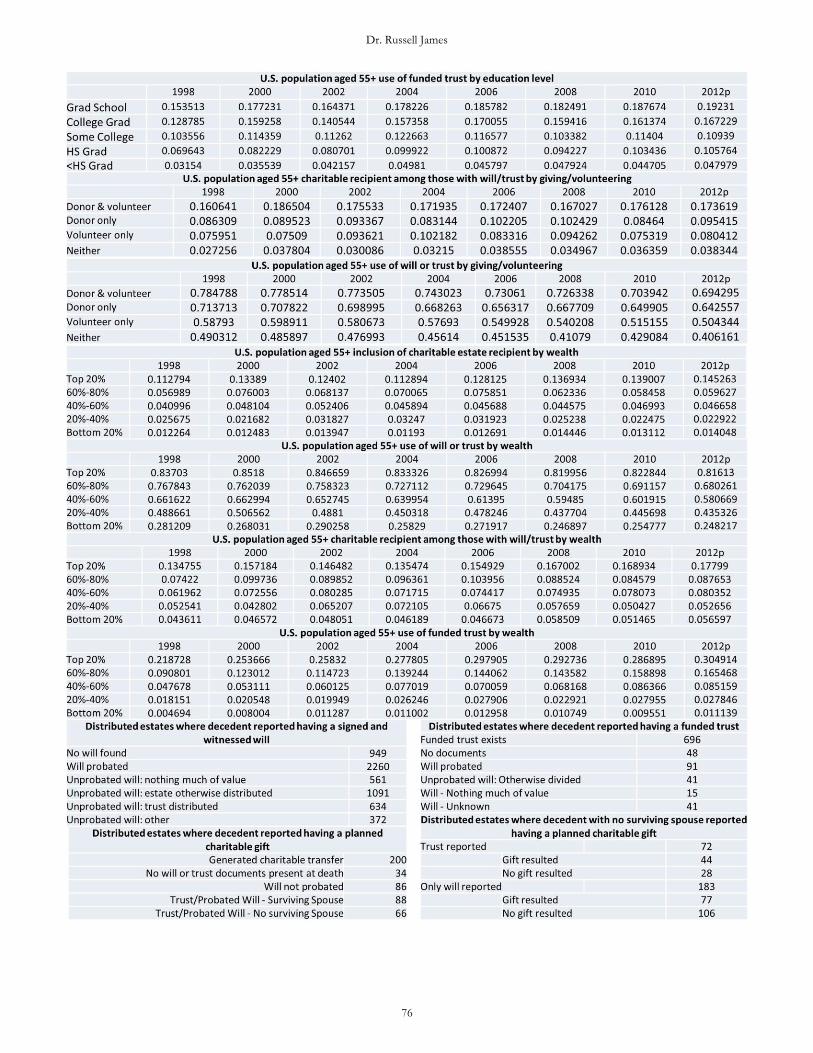
Dr. Russell James
76
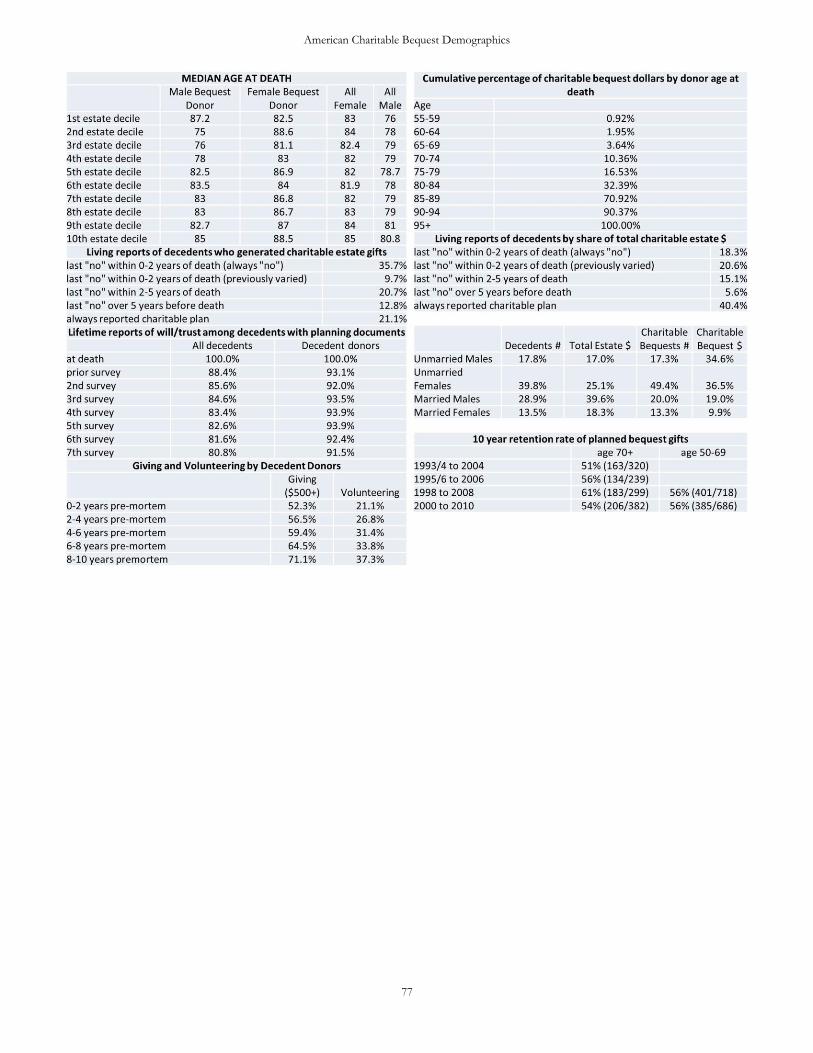
American Charitable Bequest Demographics
77
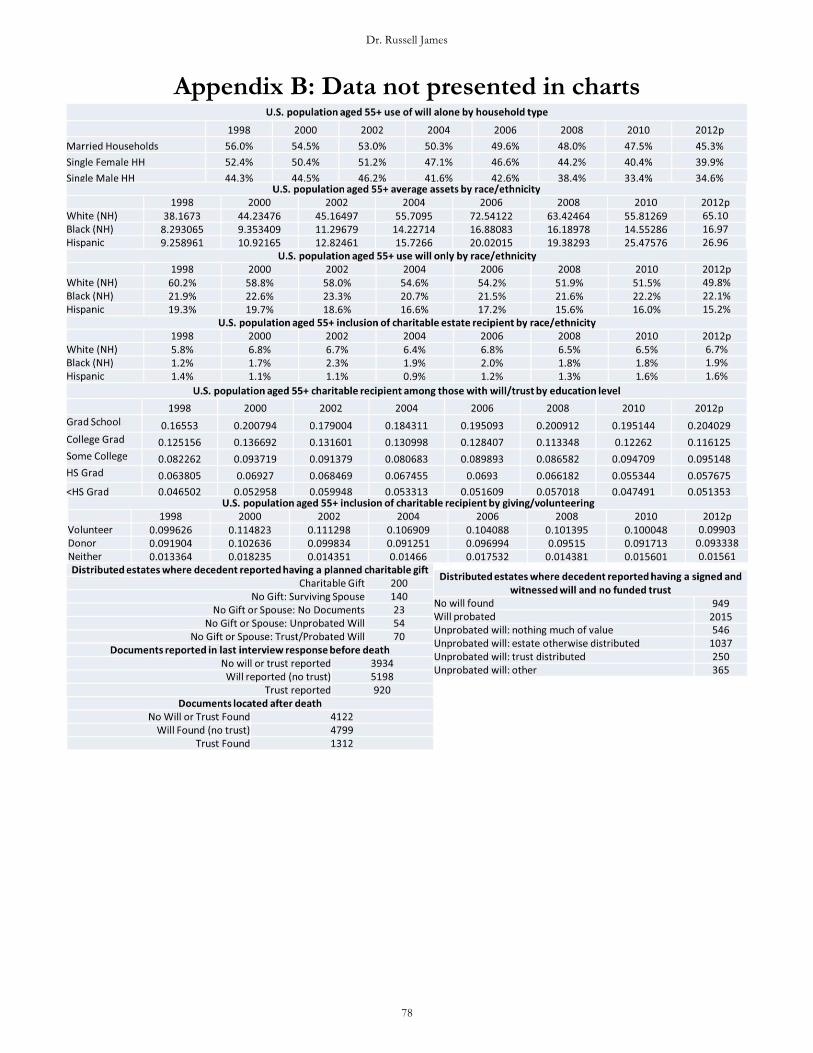
Dr. Russell James
78
Appendix B: Data not presented in charts
American Charitable Bequest Demographics
79
Appendix C: Methodology notes
Health and Retirement Study
Risk of 6th year bias As people age, die, or drop out of the study, the ongoing sample from the HRS risks becoming less representative of the U.S. over 50 population. In order to manage this problem a new cohort of respondents are added into the study every six years. The HRS managers work diligently to instill in respondents the social importance of their full participation for scientific research and social benefit. Despite this there is still voluntary drop out between waves. It is possible that those with a lower sense of social responsibility are more likely to drop out after having initially experienced the effort required to complete such a comprehensive survey. As such, the waves following a group’s inclusion of the survey may suffer from a selection bias as a result of the higher probability of drop out among these less pro-social respondents after the initial survey. To the extent that this pro-social characteristic also influences charitable planning, we would see a mechanism for relatively lower self-reported charitable planning behavior in the sixth year’s when new cohorts are initially added to the survey. In the HRS, these survey waves are in 1998, 2004, and 2010. A perusal of the trends in charitable planning propensity provides evidence that this may be occurring. Self-reported charitable planning appears to be relatively lower in these 6th year surveys. Concern about this bias may be alleviated by comparing similar survey years. Thus, one could look at trends using 1998, 2004, and 2010 as comparable data points. Additionally, one could look at 2000, 2002, 2006, and 2008 as comparable trend data points. Projections Projected numbers are based upon a combination of ordinary least squares regressions. Typical projections are based upon a combination of two ordinary least squares regressions. The first projection results from using all years of data where the variable of interest is the outcome variable and the year is the independent variable. The second projected results from using only the previous four observations (2004-2010). These two projections are averaged together resulting in an overweighting of the trend from the most recent four observations. 2010 Weighting Final weights for the final 2010 survey were not available at the time of this analysis. Returning respondents were part of the early 2010 HRS survey and final weights were available for these respondents. However, for the newly entered cohort, no weights were available. Consequently, we constructed approximate weights to apply to the non-early 2010 HRS survey data in order to incorporate this new data. The process used was to calculate the average weight given to all respondents in a single age, gender, and race (white/non-white) category in the 2004 survey, which was the last survey year in which a new cohort was entered (allowing the survey to represent the U.S. population over age 50). This weight was then applied to all new respondents without a weight in each particular age, gender, race (white/non-white) category. The total weights in 2010 then exceeded the total weights in 2004. All weights in 2010 were then reduced by a fixed percentage to allow the total weights in 2010 to match the total weights in 2004. This resulted in an unreasonably high projected population for Hispanic individuals, which were oversampled in 2010. Weights for new Hispanic respondents were then reduced by a fixed percentage in order to project to a total population in line with previous trends as reflected by HRS final weights in previous years. Additionally the weights on Hispanic married individual and Hispanic females in the sample were increased, with an offsetting decrease in Hispanic single individuals and Hispanic males to bring the weighted estimates of marriage and gender in line with the levels and trends from 2008. These weights are an approximation and will be updated with the final 2010 HRS weights when those become available.
Dr. Russell James
80
Post-Exit Information In some cases the initial interview with surviving friends or relatives did not provide complete answers to all questions. At times this could relate to the time needed for completing estate administration. In these cases, new interviews were conducted during subsequent survey years (i.e., every two years) to ascertain the missing information. In some cases a single decedent may have an exit interview and several post-exit interviews. In some cases the information provided in a later interview differed from that provided in an earlier interview and vice-versa. In the analysis presented here the following were counted as existing if they were reported to exist in any exit or post-exit survey and otherwise were assumed to be missing: presence of a charitable bequest, a will, a funded trust, a probated will, a marriage at the time of death, a transfer to a charity, spouse, offspring, sibling, relative or friend, a report that the estate had “nothing much of value”, or that the estate had been fully divided among the heirs. For the following variables, this report used the largest amount reported in any exit or post-exit interview: number of children, size of charitable gift, and percentage of estate being transferred to charity. For the following variables, this report uses the first non-missing observation, i.e., the report made closest following the time of death: age at death, date of death, whether the death was expected or not, and the number of days between commencement of the final illness and death. For the following variable this report uses the most recent non-missing observation: Size of estate, an affirmative report that no estate documents could be found, and an affirmative report that the estate had not yet been distributed. Charitable Gift Size When the interviewee indicated that the decedent’s plans included provisions for a charity, in less than 1% of cases, the interviewee did not know or refused to divulge how much money went to charity. In these cases we attribute the gift as being the median estate percentage given by all other decedents in the survey where the actual positive amount was reported (i.e., 5% of the estate). This is a more conservative estimate than either the average of percentages of 19.8%, or the overall average (total gifts from donor estates/total size of all donor estates) of 35.8%. However, this 5% is reduced or eliminated if the interviewee identified transfers to other recipients in excess of 95% of the estimated size of the estate. Estate size Where the estate value was reported as within a range of values, we use the midpoint of the range as the estate value. Where the estate value was not revealed we use the most recently available household wealth estimate from surveys conducted during life. For unmarried decedents this wealth estimate is the estimated estate size. For married decedents one half of this wealth estimate is the estimated estate size. Age at death In a very small number of cases (<1%) the date of death was not reported. In these cases we assume death took place in the year prior to the first exit interview year. SAS Coding Two SAS programs were written to generate these results. The first looks at the lifetime data reports over the years. The second examines post-death transfers (from the HRS Exit files) and connects them with lifetime reports generated in the first program. The text of the two programs is available at: http://www.encouragegenerosity.com/coding.pdf
American Charitable Bequest Demographics
81
Acknowledgements
Many people assisted in motivating, shaping, editing, and reviewing this first edition of American Charitable Bequest Demographics. The initial impetus for beginning the project as well as much helpful commentary throughout the process came from Jackie Franey of BNY Mellon Wealth Management. In fact, many helpful comments and thoughts came from a number of thoughtful folks including,
Dr. Christopher Baker, Research Fellow, Asia-Pacific Centre for Social Investment and Philanthropy, Swinburne University of Technology, Australia
Phyllis Freedman, President of SmartGiving, www.smart-giving.com
Barlow T. Mann, Chief Operating Officer, and Brad Champlin, partner, at the Sharpe Group, www.Sharpenet.com
Richard Radcliffe, Radcliffe Consulting, radcliffeconsulting.org
Michael J. Rosen, CFRE, President of ML Innovations, www.mlinnovations.com, and author of Donor-Centered Planned Gift Marketing (buy it!)
Dr. Claire Routley, Consultant at Legacy Fundraising
Gregory Warner, Founder of MarketSmart, imarketsmart.com
Peter Witherell, American Cancer Society
The number of errors in this document has been greatly diminished from the comments of these, and others, who have been so generous with their time. The remaining errors are entirely mine.